Embed Size (px)
Citation preview

The 9th Workshop on GHG Inventory in Asia (WGIA 9)
July 13-15, 2011 Phnom Penh, Cambodia
GHG Inventory in Myanmar: INC Report
Prof. Dr. Khin Lay SweGHG Inventory Team LeaderINC Project, Myanmar

Role of Agriculture sector
• 43% of GDP (including crops (35%), livestock & fisheries (7%) and forestry (1%))
• 61% of Labor Force
• 44% of Export Earnings (crops (17%), livestock & fisheries (20%) and forestry (7%))
• Export: US$ 6.8 billion*
• Import: US$ 4.5 billion*
• Main Exports: Agriculture, livestock and forestry products, natural gas
• Main Imports: Machinery, transportation and construction materials, industrial raw materials, consumer goods
Country Profile:
*Ministry of Commerce, Myanmar (2008-09)

Total Greenhouse Gas Emissions from Energy Sector 2000 (Gg)
Emission sources CO2 CH4 N2O Total CO2 e
Fuel Combustion
- Fossil fuel combustion
-Traditional biomass fuel
combustion*
7,658.65
(27,475.3)
0.46
(7.36)
0.28
(0.98)
7755.11
(28297.82)
Fugitive emissions from
coal mining
- 0.53 - 11.13
Fugitive emissions from
oil and gas systems
- 4.63 - 97.23
Total 7,658.65 5.62 0.28 7,863.47
*Not included in national GHG inventory calculations.

Proportions of CO2-equivalent Emissions from Energy Sector

GHG Emissions from Industrial Processes and Product Use, 2000 (Gg)

Sr. No. Crop Name 2009-2010 Percentage
1. Paddy 8067 47.5
2. Sesamum 1634 9.6
3. Green gram 1077 6.3
4. Black gram 1023 6.0
5. Sunflower 883 5.2
6. Groundnut 866 5.1
7. Pigeon pea 616
8. Other Pulses 706
9. Wheat & Maize 466
10. Rubber 463
11. Cotton 359
12. Sorghum 224
13. Sugercane 160
14. Oil Palm 112
15. Coffee 24
16. Vegetables 270
17. Others 19
Total Crop Area 16969
Sown Area of Major Crops (,000 ha)
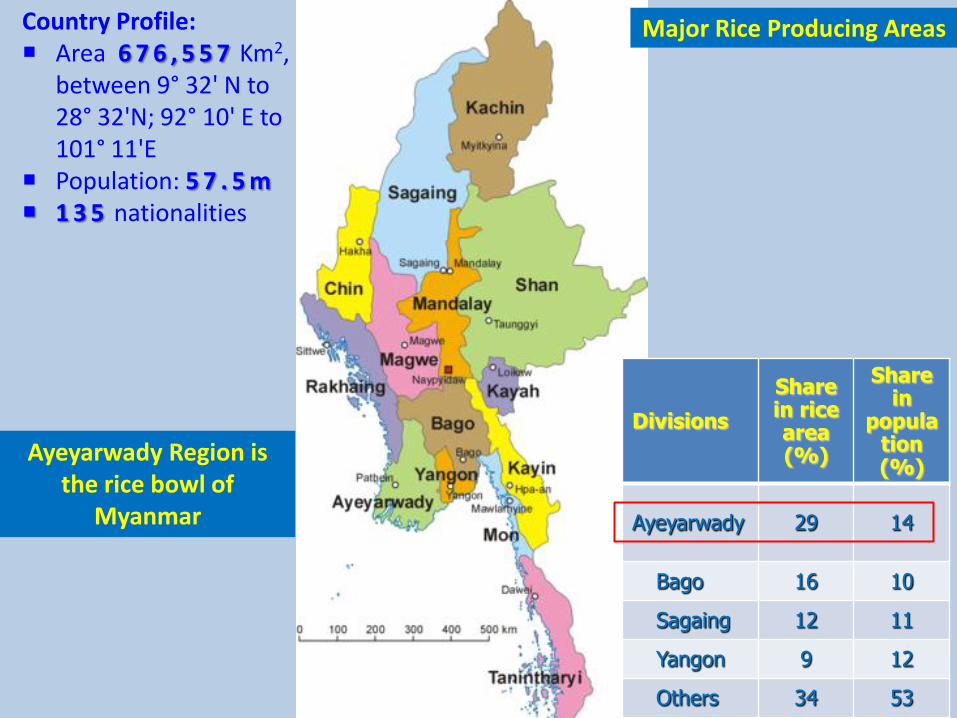
Country Profile: Area 6 7 6 , 5 5 7 Km2,
between 9° 32' N to 28° 32'N; 92° 10' E to 101° 11'E
Population: 5 7 . 5 m 1 3 5 nationalities
7
Major Rice Producing Areas
Divisions
Share in rice area (%)
Share in
population (%)
Ayeyarwady 29 14
Bago 16 10
Sagaing 12 11
Yangon 9 12
Others 34 53
Ayeyarwady Region is the rice bowl of
Myanmar

• The sharp increase in rice area after 1993 attributed to the additional rice area for summer rice.
• The increase summer rice area, coupled with the yield increase, resulted in a significant increase in rice production after 1993
“Lowland Rice-based Ecosystems in Nyaungdon Township of Ayeyarwaddy” Garcia, et.al. 2010, ASEAN Round Table Meeting, Myanmar

Rice Ecosystems in Myanmar
Sr. Type %
1 Irrigated 30
2 Favorable Rain-fed Area 38
3 Drought Prone Area 12
4 Deepwater, submerged and salt affected Rice
17
5 Upland rice 3
Terrace upland rice fields inNorthern Shan State
Irrigated rice fields inNorthern Shan State

Transplanting in Flooded Areas
Lowland Areas

Construction of New Reservoirs and Dams
11
Lifting water from rivers:322 river-pump stations established
to area of 0.47 m ac
Irrigation Facilities installed in the last 2 decades: 228 Large and Small Rural Dams

Promoting Ecosystem Based-Adaptation
A Total of 7974 tube wells: Shallow / Deep tube wells - for > 100,000 acres, after 2007-08
Treadle-pump/ Tripod pump
Supplementary Water for Rice Production, Central Myanmar

Paddy Harvest Time in Central Myanmar

Livestock Population Census (in millions)
Kind of Animal 2000-01
Cattle 10.98
Buffalo 2.44
Sheep & Goat 1.80
Pigs 3.97
Chickens 47.75

GHG Emissions / Removals from LULUCF Sector in 2000
Activity CO2 emissions
(Gg)
CO2 removals
(Gg)
Net CO2 emissions/
removals (Gg)
Natural forests - 129 838.59 (-) 129 838.59
Forest plantations 1 863.21 11 750.04 (-) 9 886.833
Home garden trees - 470.07 (-) 470.07
Roadside trees - 162.49 (-) 162.49
Shifting cultivation 1 200.67 - (+) 1 200.674
Deforestation 37 340.97 - (+) 37 340.974
TOTAL 40 404.73 142 221.2 (-) 101 816.5

GHG Emissions and Removals in Myanmar for the Year 2000
Source / Sink
CO2 Removal
CO2 Emission
CO CH4 N2O NoxCO2 Equ.
Total
CO2 Equ.NetEmission
Energy Sector 7658.65 5.62 0.28 7863.47 7863.47
Industry Sector 248.59 463.29 463.29
Agriculture Sector 0.81 963.76 8.4 0.022 22844.57 22844.57
Forestry Sector142221.2
33656.51 2215.37 144.85 4.26 34.08 40404.73 -101816.5
Waste Sector 134.57 2825.97 2825.97
TOTAL 142221.2 41563.75 2216.18 1248.77 12.94 34.10 74402.03 -67819.2
Source: INC Report, 2010

Myanmar National GHG Inventory of Agriculture Sector in 2000
SourcesCH4(Gg)
N20(Gg)
Nox(Gg)
CO(Gg)
CO2 (Gg)Equavalent
Rice Cultivation 507.26 10652.46
Agricultural soils 8.2 2542.0
Agricultural residueburning
0.0238 0.0006 0.81 0.022 1.6058
Livestock sector 456.50 9648.5
(a) Enteric fermentation 404.43 8493.03
(b) Manure management 52.07 0.2 1155.47
TOTAL 22844.57

Energy, 10.6
Industrial processes and product use, 0.6
Agriculture, 30.7LULUCF, 54.3
Waste, 3.8Share of emission by sector (%)
GHG Emissions and Removals in Myanmar for the Year 2000

-150000
-100000
-50000
0
50000
100000
150000En
ergy
Ind
ust
rial
pro
cess
es a
nd
pro
du
ct u
se
Agr
icu
ltu
re
LULU
CF
Was
te
Net
Rem
ova
l
Emis
sio
n /
Re
mo
val (
Gg)
Sectors
Emission (Gg)
Removal(Gg)
GHG Emissions and Removals in Myanmar for the Year 2000

“Myanmar do not have the carbon debt tothe world, and we are still one of thelowest emitters in capita terms. But we dohave a shared responsibility for the world.”

Limitations and Constraints
Lack of Institutional arrangements for data collection, analyzing, verifying and updating data
Research, assessment and verification for certain activity data , and country-specific emission factors remains incomplete
Lack of financial and technical support for developing CS Efs
There is an inadequate GHGI technical experts in the ministries and agencies
Difficult to engage full time committed and dedicated team members

Lessons Learned, Problems & Challenges
For preparing SNC: The activities or plans for the next GHG inventory has not setting up
Setting up an institutional framework, an organization system, and capable technical expertise
To develop a permanent system for National GHGI preparation; A National GHG Inventory Office needs to be established to coordinate the GHG inventory
In the system, various Government agencies, policy makers and scientists, researchers should be involved
It needs a project: “Capacity Building for National GHGI” to strengthen the capacity and help to improve the GHGI
Future Inventory

Proposed Action Plans for SNC
• Formulate and support to establish a strong GHG Inventory institutional mechanism
• Formulate effective, efficient and proactive overall development policy and institutional mechanism of mitigation and adaptation to the impacts of CC on agriculture and food security
• Strengthen national research and extension programs in the context of CC
• Improve the regional information sharing networks, dissemination and analysis on CC
• Technical and financial assistances on above action plans

24


![GHG presentation 2 [Autosaved]](https://img.pdfslide.tips/doc/110x75/58ef3baf1a28abaa358b4687/ghg-presentation-2-autosaved.jpg)