Embed Size (px)
Citation preview
Sede Amministrativa: Università degli Studi di Padova
Dipartimento di Scienze dell’Antichità
SCUOLA DI DOTTORATO DI RICERCA IN STUDIO E
CONSERVAZIONE DEI BENI ARCHEOLOGICI E ARCHITETTONICI
INDIRIZZO: Scienze e Tecnologie Per i Beni Archeologici e Architettonici
CICLO XXIV
GLASS IN NORTHERN ADRIATIC AREA FROM
ROMAN TO MEDIEVAL PERIOD: A
GEOCHEMICAL APPROACH FOR PROVENANCE
AND PRODUCTION TECHNOLOGIES
Direttore della Scuola: Ch.mo Prof. Giovanni Leonardi
Supervisore: Ch.mo Prof. Gianmario Molin
Dottoranda: Filomena Gallo
ABSTRACT
English
Glass is one of the oldest materials produced and extensively used by man, thanks to its
unique mechanical and chemical-physical properties. For these reasons it has a great
importance in both archaeological and artistic fields. So far, notwithstanding the
essential lines of development of glass production are known, there are still some
particular ‘critical moments’ in the history of glass production. In this context the
present work investigated the evolution of glass technology in a particular geographical
area, the northern Adriatic Italy, which, for its peculiar position, had a central role in
trades and acted as a commercial hub between the Mediterranean and the Padan and
Transalpine area. The sample set, including a total of 178 glasses, covers a large
chronological period (6th century BC-15th century AD) and comes from some of the
most important sites in the period and in the area considered, such as Aquileia, Adria
and Rocca di Asolo. Few samples coming from Tuscan sites (San Genesio, Pieve di
Pava and Pieve di Coneo), similar in age and types to Aquileia glasses, were also
analyzed, in order to have a comparison among eastern and western Italy. The analytical
approach involved textural, mineralogical, chemical and isotopic (Sr, Nd, O) analyses
and the results proved the complementarity of these techniques, suggesting that the
preferred approach in investigation of ancient glasses should be the combined use of
these methods. A substantial continuity in the use of the type of raw materials
(siliceous-calcareous sand in addition to natron) from Pre-Roman period until early
Middle Ages was testified, whereas a complete change in the use of flux is evident in
High/Late Medieval glasses. The extraordinary consistency of natron glass here
analyzed and the principal compositional groups widespread in Mediterranean sites
tends to support the model of the localized production, organized in a small number of
primary workshops which supplied raw glass to a great number of secondary
workshops, where the glass was re-melted and shaped into objects. For what concerns
the provenance of raw materials, the combination of isotopic and chemical data,
together with archaeological evidence and literature data on both raw materials and
glass from primary furnaces, suggests that the vast majority of Roman and Late
Roman/early Medieval glasses analyzed in this study were likely produced in
workshops located on the Syro-Palestinian and Egyptian coasts, although the use of
primary sources located in western Mediterranean cannot be definitely excluded.
Italiano
Grazie alle sue peculiari caratteristiche meccaniche e chimico-fisiche, il vetro è uno dei
materiali più antichi utilizzati dall’uomo e, per questa ragione, riveste una grande
importanza sia in campo artistico che archeologico. Ad oggi, nonostante le principali
linee di sviluppo della produzione vetraria siano state tracciate, permangono dei
particolari ‘momenti problematici’ nella storia del vetro, connessi all’introduzione di
nuove materie prime e/o nuove tecnologie di produzione. In questo contesto si inserisce
il presente lavoro di ricerca, che ha indagato l’evoluzione della produzione vetraria in
una specifica area, quella dell’Italia nord-adriatica la quale, grazie alla sua peculiare
posizione geografica, ha svolto in passato un ruolo cruciale nei commerci, fungendo da
connettore tra il Mediterraneo orientale e l’area padana e transalpina. La campionatura,
oggetto di studio, proviene pertanto da alcuni dei più interessanti siti nord-adriatici
(Aquileia, Adria, Rocca di Asolo); inoltre anche un piccolo gruppo di campioni
provenienti da siti toscani (San Genesio, Pieve di Pava e Pieve di Coneo),
cronologicamente e tipologicamente confrontabili con i reperti aquileiesi, è stato
analizzato, al fine di rilevare eventuali analogie/differenze tra il versante adriatico e
quello tirrenico. La cronologia dei campioni è molto ampia (VI a.C. -XV secolo d.C.),
ma una particolare attenzione è stata rivolta ai reperti di periodo Romano e Tardo
Antico. L’approccio analitico ha previsto analisi di tipo tessiturale, mineralogico,
chimico e isotopico (Sr, Nd, O). I risultati hanno dimostrato la complementarietà di
queste tecniche, indicando che il loro uso combinato costituisce l’approccio ideale per
lo studio del vetro antico. Per quanto concerne la tipologia di materie prime impiegate
nella produzione vetraria, è emersa una sostanziale continuità dal periodo Pre-Romano
fino all’Altomedievo, caratterizzata dall’uso di sabbie siliceo-calcaree in aggiunta a
natron, mentre per i vetri Bassomedievali si assiste ad un radicale cambiamento di
fondente (ceneri sodiche). La sorprendente omogeneità chimica tra il vetro al natron
analizzato nel presente studio e i principali gruppi composizionali riportati in letteratura
supporta l’ipotesi che, almeno in epoca Romana e Tardo Antica, il vetro venisse
prodotto in poche officine primarie, successivamente commercializzato in forma di pani
di vetro grezzo e lavorato in officine secondarie sparse in tutto il Mediterraneo. A tale
proposito,
l’uso combinato dei dati chimici ed isotopici, supportati da dati di letteratura e da
evidenze archeologiche, suggerisce che l’origine della maggior parte di tale vetro sia da
collocarsi nel Mediterraneo orientale, in particolare sulle coste Siro-Palestinesi ed
Egiziane, sebbene non possa totalmente escludersi anche l’uso di sorgenti di materie
prime collocate nel Mediterraneo occidentale.
INDEX
CHAPTER 1. INTRODUCTION 1
1.1 Research topic and aims 1
1.2 Raw materials of the northeastern Italian glasses from Pre-Roman period until the Late
Middle Ages
4
CHAPTER 2. ARCHAEOLOGICAL CONTEXTS AND MATERIALS 13
2.1 Adria 14
2.2 Aquileia 16
2.3 Rocca di Asolo 20
2.4 Tuscan sites
22
CHAPTER 3. EXPERIMENTAL METHODS 25
3.1 Optical Microscopy (OM) 26
3.2 Scanning Electron Microscopy with Energy Dispersive System (SED-EDS) 26
3.3 X Ray Powder Diffraction (XRPD) 26
3.4 X Ray Fluorescence (XRF) 27
3.5 Electron Probe Mycroanalysis (EPMA) 27
3.6 Laser Ablation Inductively Coupled Plasma Mass Spectrometry (LA-ICP-MS) 29
3.7 Multi Collector Inductively Coupled Plasma Mass Spectrometry (MC-ICP-MS) 30
3.8 High Temperature Laser Fluorination
32
CHAPTER 4. RAW MATERIALS IN GLASS PRODUCTION: THE TEXTURAL,
CHEMICAL AND MINERALOGICAL STUDY 35
4.1 Pre-Roman and Roman glass from Adria 35
4.1.1 Textural characterization 35
4.1.1.1 Residual and newly formed phases 35
4.1.1.2 Opacifying agents 42
4.1.2 Chemical characterization 47
4.1.2.1 Transparent glass 47
4.1.2.2 Opaque glass 68
4.2 Late Roman glass from Aquileia 71
4.2.1 Bulk chemistry 71
4.3 Late Roman/early Medial glasses from Tuscany: a comparison
with Aquileia glasses 83
4.3.1 Bulk chemistry 83
4.4 Early and High/Late Medieval glass from Rocca di Asolo 87
4.4.1 Bulk chemistry 88
4.4.2 Colouring and decolouring agents 94
4.5 Conclusions 98
CHAPTER 5. THE PROVENANCE OF RAW MATERIALS IN GLASS: THE
ISOTOPIC APPROACH 101
5.1 Features and principles of the technique 101
5.1.1 Strontium and neodymium 102
5.1.2 Oxygen isotopes 106
5.2 Materials 107
5.3 Results and discussion 107
5.3.1 Strontium and neodymium isotopes 107
5.3.2 Oxygen isotopes 116
5.4 Conclusions
120
CONCLUDING REMARKS
123
REFERENCES
127
APPENDIX A
147
APPENDIX B
165
APPENDIX C
173
APPENDIX D
179
APPENDIX E
199
1. Introduction
1
CHAPTER 1
INTRODUCTION
1.1 Research topic and aims
Glass, defined as the product of the fusion of inorganic materials which have cooled to a
solid condition without crystallising, is one of the oldest materials produced and
extensively used by man, thanks to its unique mechanical and chemical-physical
properties. For these reasons it has a great importance in both archaeological and artistic
fields. Chrono-typological studies on glass have a long tradition (Isings, 1957), whereas
archaeometric studies have been developed since the 1970s, giving important
contributions to the knowledge in this sector. So far, notwithstanding the essential lines
of development of glass production are known, there are still some particular „critical
moments‟ in the history of glass production. For some reasons, generally associated to
political and economic instabilities, during these moments new raw materials and/or
new production technologies became predominant in glass production, determining
changes in glass types.
In this context the present work investigated the evolution of glass technology in a
particular geographical area, the northern Adriatic Italy, which, for its peculiar position,
had a central role in trades and acted as a commercial hub between the Mediterranean and the
Padan and Transalpine area. A total of 178 glass objects were analyzed, already
characterized from the archaeological point of view: 68 from the Archaeological
Museum of Adria (RO, Italy), 62 from the excavation of Casa delle bestie Ferite in
Aquileia (UD, Italy) and 33 from Rocca di Asolo (TV, Italy). Furthermore 15 glasses
from three archaeological sites in Tuscany (San Genesio, Pieve di Pava and Pieve di
Coneo), chronologically and typologically comparable with Aquileia samples, were
selected in order to have a comparison between the eastern and the western part of the
Italian peninsula. The sample set covers a large chronological period, from the 6th
century BC until the 15th century AD, with particular attention to the Roman and Late
Roman/early Medieval productions. This large sample set allowed to investigate some
1. Introduction
2
of the „critical moments‟ in glass history, which are listed and briefly described in the
following:
- Technological transition between the Iron Age glass and the Hellenistic-Roman
production: during Iron Age radical changes occurred in glass production, in
particular in the use of fluxing agents. It is well known that in the Late Bronze
Age glass was produced using plant ashes as the batch fluxing component
(Angelini et al., 2002), while the Final Bronze Age was characterized by the
appearance in Europe of the so-called „mixed alkali glasses‟ (Angelini et al.,
2004). From the 7th century BC onwards, glass composition changed radically
and the so-called „natron based‟ glass became widespread in eastern and western
regions. Actually, the data are numerically scarce with respect to the complexity
of glass production, and therefore the production technologies and types of raw
materials used during the Iron Age are not at present clearly identified.
- Provenance of raw materials and production models in large-scale Roman
production: the current literature on Roman glass production is dominated by
two competing models, centralized and dispersed production. The former
establishes that glass was produced in a small number of primary glass-making
installations, the location of which is still up for intense debate. Raw glass was
broken up and traded throughout the Mediterranean as chunks and then re-
melted and shaped into vessels and other objects in secondary workshops (Foy
et al., 2000). In opposition, the dispersed production model hypothesizes that
glass was made on a small scale in a large number of regional workshops
(Wedepohl et al., 2003) (for further details on Roman production models see
section 1.1). In the North Adriatic area Roman kilns have not yet been found, so
there are no evidences of local production. However, on the basis of the large
number of glass samples found in urban excavations of both Adria and Aquileia,
some authors have inferred the presence of glass industries (Zecchin, 1956;
Calvi, 1968; Fogolari and Scarfì, 1970; De Min, 1987, Toniolo, 2007. See
chapter 2).
- Technological transition between Late Antiquity and early Middle Ages: during
Late Roman period a change in glass colour and a general decline in the range of
vessel types and quality is apparent (Foster and Jackson, 2009), suggesting
1. Introduction
3
changes in the raw materials used for glass-making. At least two new glass
compositions, introduced in the 4th century AD, have been identified and
continued to be produced until the late 8th century, probably in a limited number
of primary production centers, mainly located in Egypt and Levant. In any case,
the identification of raw materials, primary workshops and trades during Late
Roman and early Medieval glass is still debated.
- Technological transition between early Middle Ages and high/late Middle Ages:
in the early Medieval period (6th-10th century AD) a series of events caused a
radical change in the glass manufacture and natron was substituted by plant ash.
In the West, wood ash had become the main flux agent, whereas in the Middle
East and southern Europe the alkali source is generally believed to be ash from
marsh plants. In northern Adriatic area the soda ash glass is generally attributed
to Venetian production (Verità et al., 2002). Indeed this city played a
fundamental role in glass production during Middle Ages, but a systematic and
exhaustive study on trades between the Venetian area and inland is still lacking.
Generally speaking, the main aim of this project was to expand the current knowledge
on the evolution of glass production and to identify possible commercial and
technological exchanges between different cultures. In particular, in order to shed more
light on the questions related to the previously described „critical moments‟, the
following aspects have been extensively developed:
- Characterisation of raw materials and production technologies employed in Pre-
Roman, Roman, Late Roman/early Medieval and Late Medieval glasses from
northern Adriatic area;
- Study of the provenance of raw materials;
- Comparison between analyzed samples and known glass types founded in the
Mediterranean basin;
- Identification of possible relationships among chemical composition, type,
chronology and production technique of an object.
The glass samples were carefully characterized by means of a combined approach,
chemical and isotopic. Indeed, as demonstrated by previous studies, the determination
1. Introduction
4
of the chemical composition and especially analyses of trace elements (Freestone et al.,
2002), are useful tools to indentify compositional groups, while stable and radiogenic
isotopes, specifically those of oxygen, strontium and neodymium, are promising
indicators for provenance determination of primary glass, even after its transformation
or recycling in secondary workshops (Degryse and Schneider, 2008).
For a clearer comprehension of the results reported and discussed in chapters 4 and 5, a
detailed overview on glass production from Pre-Roman period to Medieval time (raw
materials, production technologies and production models) is given in the following
section.
1.2 Raw materials of the northeastern Italian glasses from Pre-Roman
period until the Late Middle Ages
Roman period saw a prodigious use of glass in domestic, industrial and funerary
contexts. Glass was used primarily for the production of vessels, although mosaic tiles
and window panes were also produced. Roman glass production developed from
Hellenistic technical traditions, initially concentrating on the production of intensely
coloured cast glass vessels (Fleming, 1999). The production technique was time-
consuming –the products were vessels with thick walls which required to be finished–
and for this reason glass was an expensive and high status material. However, during
the 1st century AD the introduction of glassblowing revolutionized glass production,
allowing glass workers to produce vessels with considerably thinner walls and so
decreasing the amount of glass needed for each vessel. Glassblowing was also
considerably quicker than other techniques, and vessels required considerably less
finishing, representing a further saving in time, raw material and equipment. As
consequence of these factors, the cost of production was reduced and glass moved from
a luxury material to a material commonly available (Fleming, 1999). A large variety of
production techniques were employed in Roman glassworking, some of these, strictly
related to the analyzed materials, are briefly described below.
- Core-forming: this technique dates from about the middle of the 2nd
millennium BC and is one of the oldest techniques to form hollow-ware glass
before the invention of blowing. The core was modeled with the desired shape in
clay or vegetable material, covered by a layer of calcite and placed on the end of
1. Introduction
5
a metal rod. The glass was heated and, when molten, poured onto the core.
During this, the metal rod was slowly rotated in order to distribute the glass
evenly. The core, covered with glass, was rolled on a stone or metal slab and
finally decorated with glass trails of different colour (Sternini, 1995; Ferrari et
al., 1998).
- Casting: the modeling was achieved by pouring the crushed glass into a mold.
The mold had hollowed interior walls in order to create the negative form. By
heating the mold, the glass melted into the form. This was probably the first
technique used for glassforming; from the earliest times, molds were used for
making clay and metal objects, and the procedure was later adopted for shaping
glass (Sternini, 1995; Ferrari et al., 1998). In fact, forms produced show clear
inspiration from the Roman bronze and silver industries, and in the case of
carinated bowls and dishes, from the ceramic industry (Allen, 1998). Cast vessel
forms became more limited during the late 1st century AD, but continued in
production into the second or third decade of the 2nd century AD (Grose, 1991).
- Sagging glass on former molds: this technique was used for making
monochrome and coloured striped bowls. Monochrome bowls were made by
placing a flat circular blank in a upside-down form, suspended by two supports.
In the furnace the two supports were taken away and the blank sagged on the
concave form. The coloured bowls were formed by fusing coloured strips into a
flat circular blank. Afterwards a glass stripe was put all around the blank to form
the edge (Sternini, 1995; Ferrari et al., 1998).
- Ribbing: there are three hypothesis about this technique. The first is the lost-
wax process, already used for making metal objects; the process consists of
filling the open space inside the mold with powdered glass after melting wax. In
the second hypothesis a still soft glass disk was punched with a tool in the form
of a star; afterwards the bowl was formed by sagging the glass former molds.
The third hypothesis explains the forming of this vase with the use of the pottery
wheel: on a upside-down bowl a hot glass disk was sagged; then it was ribbed
by using a suitable tool while turning the wheel. At the end the vase was
polished, especially on the rim (Sternini, 1995; Ferrari et al., 1998).
1. Introduction
6
- Reticella glass: this glass is a particular kind of sagging glass on former molds.
The reticella items are made of colourless or blue strips of glass that are
decorated with thin filaments, usually white or yellow, which form a spiral
pattern. To achieve the strips a hot glass body was rolled over two narrow glass
rods, which had been laid out on a marble slab, until the rods penetrated the
glass. A pontil was then applied and the body was stretched to make a thread,
while quickly twisting the other end to form the spiral pattern. The strips were
then placed on a flat surface, parallel to one another, in order to obtain a blank
which was heated and sagged over a form, or they were placed in a mold in
parallel fashion and fused (Sternini, 1995; Ferrari et al., 1998).
- Blowing: this technique revolutionized glass production around the middle of
the 1st century AD, rendering the production of glass containers a fast and
economical process, and as a consequence promoting their spread amongst the
less well-off. During the blowing process, molten glass, gathered on the end of
an iron tube (the blow pipe), was inflated to form a bubble which, after being
rolled on a flat surface and shaped with appropriate tools, was then inflated
further and manipulated to create the final form. The vessel was then detached
from the blow pipe to finish the neck and rim by tooling. In order to do this, a
pontil (an iron rod about one meter long) was attached to the base with a blob of
glass (Sternini, 1995; Ferrari et al., 1998).
- Mold-blowing: this method came after the invention of free-blowing during the
first part of the second quarter of the 1st century AD (Lightfoot, 1987; Price,
1991). A glob of molten glass was placed on the end of the blowpipe which was
then inflated into a wooden or metal carved mold. In this way, the shape and the
texture of the bubble of glass was determined by the design on the interior of the
mold rather than the skill of the glassworker (Cummings, 2002).
The raw materials for making glass in ancient times were naturally occurring rocks and
minerals: a mixture of silica, alkali and lime with, in some cases, transition metal
oxides. Transition metal ions, such as those of manganese (Mn2+), iron (Fe2+/Fe3+),
cobalt (Co2+), and copper (Cu2+/Cu+), acted as colouring agents in ancient glass.
However, the final colour of a glass is the result of a complex interplay of parameters
1. Introduction
7
such as how the glass batch is prepared, the heating cycle of the furnace, the fuels used,
the gaseous atmosphere of the furnace, and the chemical environment of the colouring
agents (Pollard and Heron, 1995).
It has been established that the earliest glass production known dates back to the second
half of the 3rd millennium BC in Mesopotamia (present day Iraq and Syria). In the
following centuries, glass production spread and reached the Eastern Mediterranean
region and the European coastline, as attested by the intense trade between Aegean
communities and Western provinces in the first centuries of the Bronze Age (Grose,
1989; Oppenheim et al., 1989; Stern and Schlick Nolte, 1994). In their studies, Sayre
and Smith (1961) and Turner (1956) discussed the chemical composition of early glass
from Eastern regions (Egypt, Mycenaean Greece, Mesopotamia), mainly dated between
1500 and 800 BC. The glass of this period is characterized by high levels of Na2O and
high, often correlated, MgO and K2O levels, resulting from the use of plant ashes as the
batch fluxing component. Glass of this composition was widespread in the Bronze Age,
and also present in western Mediterranean regions, in Italy (Santopadre and Verita` ,
2000; Angelini et al., 2002), central Germany (Hartmann et al., 1997) and France
(Gratuze and Billaud, 2003). The Final Bronze Age (12th to 10th centuries BC) was
characterized by the appearance in Europe of the so-called “mixed alkali glasses”
(Henderson, 1988, 1993; Guilaine et al., 1990; Hartmann et al., 1997; Angelini et al.,
2004, 2006;), but, from the 7th century BC onwards, glass composition changed
radically, and the so-called “natron-based” glass became widespread in eastern and
western regions. Therefore, the typical Roman glass is natron glass, the predominant
type of ancient glass in the Mediterranean and Europe until the 9th century AD (Sayre
and Smith, 1961). Natron glass is a silica-soda-lime glass, essentially made with natron
as flux and siliceous–calcareous sand as network former. The major source of lime, an
essential component of the glass since it reduces its solubility in water, would have been
calcium carbonate, which either was added deliberately to the glass batch as a separate
component or accidentally as particles of shell or limestone in the sand used as the
source of silica (Freestone, 2006). The term natron is used to define an evaporitic
deposit, often polyphase, rich in sodium carbonates; natron deposits usually contain also
significant amounts of chlorides and/or sulphates. This kind of deposits is available
from Egypt and possibly from other locations, such as at-Tarabiya in the Eastern Delta,
1. Introduction
8
al-Kab in Upper Egypt and Bi‟r Natrun on the route to Darfur in Sudan. Potential
alternative sources outside of Egypt include the salt lakes near al-Jabbul in northern
Syria, Lake Van in Armenia and Lake Pikrolimni near ancient Chalastra in Macedonia
(Shortland, 2004; Shortland et al., 2006). The Egyptian deposits, known mainly today
from the Wadi Natrun, about 100km NW of Cairo, but also from al-Barnuj in the
Western Delta, comprise predominantly one or more of the minerals trona
(Na3(CO3)(HCO3)∙2H2O), thenardite (Na2SO4), burkeite (Na6(CO3)(SO4)2) and halite
(NaCl) (Freestone, 2006). Although the source of natron was the same throughout the
Roman period, the source of sand, which mostly provides the SiO2 content of glass, is
more debatable. The only bibliographic indications about the sand sources employed
during Roman time are from Pliny the Elder (I AD). In Book XXXVI of his Naturalis
Historia, the only surviving written account about Roman glassmaking, he writes that
besides Levantine sands, from the mouth of Belus river (Israel), sands from the coast of
Italy, particularly from deposits near the mouth of the Volturno river between Cumae
and Liternum, and from the Gallic and Spanish provinces were used.
“In this district, it is supposed, rises the river Belus, which, after a course of five miles,
empties itself into the sea near the colony of Ptolemais…The shore upon which this
sand is gathered is not more than half a mile in extent; and yet, for many ages, this was
the only spot that afforded the material for making glass…Sidon was formerly famous
for its glass-houses, for it was this place that first invented mirrors. Such was the
ancient method for making glass: but, at the present day, there is found a very white
sand for the purpose, at the mouth of the river Volturnus, in Italy. It spreads over an
extent of six miles, upon the sea-shore that lies between Cuma and Liternum…Indeed,
at the present day, theoughout the Gallic and Spanish provinces even, we find sand
subjected to a similar process” (Nat. Hist. XXXVI Chap. 65-66; Eichholz, 1962)
Previous studies carried out on Belus sand (Turner 1956; Brill 1999; Vallotto and Verità
2000) have proved that it may be considered suitable for glass production. The sand
from the Bay of Haifa is the palest on the Israeli coast (Emery and Neev, 1960),
indicating a relatively iron oxide content, which is desirable in the production of weakly
coloured glass. In addition, the Belus sand contains about 15% of calcium carbonate,
1. Introduction
9
mainly as fragments of beach shells (Vallotto and Verità 2000), which, when mixed
with alkali, would produce a soda-lime-silica glass with 8-9% CaO, which is around the
level required to produce a stable glass (Freestone, 2006, 2008). It is unlikely that the
beach in the vicinity of the Belus was the only source of glassmaking sand. The
presence of primary glassmaking installations further down the Levantine coast, at
Apollonia-Arsuf (Tal et al., 2004) and Bet Eli‟ezer, Hadera (Gorin Rosen, 2000)
suggest that other sands in the eastern Mediterranean region were suitable for this
purpose (Freestone, 2006). Studies performed on the Volturno river sand established
that it is not suitable for glassmaking, due to its mineral contents, which can introduce
high percentages of Al2O3, CaO and Fe2O3 in the final glass (Turner 1956; Vallotto and
Verità 2000). Otherwise, more recent studies (Silvestri et al., 2006) have demonstrated
that the Volturno river sand can become suitable for glassmaking after a specific
treatment. In particular, the combination of crushing, grinding in wooden mortar and
washing resulted in an overall „improvement‟ in the chemical composition of the sand
by progressive Al2O3, Fe2O3 and CaO decrease, mainly due to carbonate, augite and
feldspar loss, and a relative SiO2 increase, mainly contained in quartz. An
experimentally melted glass prepared from sand treated in this way, was chemically
very similar to typical Roman glass (Silvestri et al., 2006). As concern France and
Spain, no direct archaeological evidences have been found to support the hypothesis of
a primary glass production in these regions. In a recent work, Brems et al. (submitted a)
have evaluated the suitability for making glass of 178 sands, coming from Spain, France
and Italy. The results indicate that good glassmaking sands are rather rare and occur in
the Basilicata and Puglia regions (Southern Italy) and Tuscany (Western Italy). After
the addition of an extra source of lime also sands from the Huelva province (SW Spain),
the Murcia region (SE Spain) and from the Provence (SE France) would produce
glasses with a typical Roman composition (Brems et al., submitted a). Notwithstanding
the various potential sand sources, a limited number of compositional groups were
identified in Mediterranean and European area during the first millennium AD. An
extraordinary homogeneous type of Roman glass, defined as „typical Roman glass‟
(Sayre and Smith, 1961) is diffused until the end of the 3rd century AD, but afterwards
some important changes occurred from the 4th century onwards (Fiori and Vandini,
2004). Freestone et al. (2000, 2002) and Foy et al. (2003) have identified at least two
1. Introduction
10
glass compositions, dubbed Levantine I and HIMT, which were introduced in the 4th
century AD and continued in production until the late 1st millennium AD. The reasons
of this transition are not yet clear, but they were probably connected to political and
economic changes that took place in this period (Fiori and Vandini, 2004). The main
differences of the HIMT glasses with respect to the earlier Roman glass are represented
by higher levels of iron, manganese, titanium, magnesium and by lower contents of
lime. On the other hand, Levantine glass shows lower soda, higher lime and often has
low levels of iron and relatively high alumina.
In the early Medieval period a series of events, comprising lack of sufficient supplies,
climatic change and/or political instability (Shortland et al., 2006) caused a radical
change in glass manufacture both in the Islamic world and in the West (Newton and
Davison 1996; Henderson 2002). In both areas, natron, the source of alkali used from
the middle of the first millennium BC, was replaced by plant ash. In the West, following
a period of transition of about 200 years between ca. 800 and 1000 AD, tree ash had
become the main source of alkali for the manufacture of the massive quantities of glass
needed for the windows of cathedrals in Northern Europe. The ash of inland plants
contains potash, which began to replace soda as the regular source of alkali. The monk
Theophilus in his Schedula de diversis artibus, written in about 1100 AD, strongly
recommended the use of beechwood ash and quartz sand to produce glass. So the glass-
makers probably moved into areas where beech forests grew, thus ensuring both a
plentiful supply of fuel for their furnaces and alkali for their glass. Newton (1985) has
related the glass-making centres in Europe to the distribution of beechwood pollen in
1000 AD and such centres are found in Northern Europe (Germany, France, England),
since beech is scarce south of the Alps. On the other hand, in the Middle East and
Southern Europe, the alkali source is generally believed to be ash from marsh plants
such Salicornia spp. of the family of Chenopodiacae plants, which grows on
Mediterranean and Atlantic coasts (Henderson 2002; Tite et al. 2006).
As concern the organization of the glassmaking industry in ancient time, the small range
of compositional variations of Roman glass, led to hypothesize that raw glass was
already traded as „ingots‟ or chunks from late Bronze age to early Medieval times (Foy
et al., 2000). „Primary‟ workshops produced raw glass and were distinct from
„secondary‟ workshops that shaped glass into specific objects. A single primary
1. Introduction
11
workshop could then supply many secondary workshops over a large geographical area
(Nenna et al., 1997, 2000). Archaeological excavations revealed that large quantities of
4th-8th century AD natron glass were made in a limited number of „primary‟ glass
production centers mainly in Egypt and the Levant (Freestone et al., 2000; Gorin-
Rosen, 2000; Picon and Vichy, 2003; Tal et al., 2004; Nenna et al., 2005). Blocks of
raw glass were produced in a single firing, as testified by the 8 tonnes glass slab at Beth
She'arim in Israel, probably dated to the early 9th century AD (Freestone and Gorin-
Rosen 1999) and the excavations of 17 tank furnaces of similar capacity at Bet Eli'ezer,
Hadera, Israel, probably dated to the 7th to 8th centuries AD (Gorin-Rosen, 2000).
Three similar furnaces of 6th to 7th century AD have been excavated at Apollonia-
Arsuf, Israel (Tal et al. 2004) and four 10th to 11th century AD furnaces at Tyre,
Lebanon, one of which has an estimated capacity in excess of 30 tonnes (Aldsworth et
al. 2002). Further evidence to support the „centralized‟ production model is the
discovery of wrecked merchant ships, (2nd-3rd centuries AD), containing raw glass, as
slabs and glass chunks (Foy and Jézégou 1998; Gratuze and Moretti 2001), clearly
indicating that the trade of raw glass was a widespread practice during Roman time. In
opposition to this model is the idea that glass was made on a small scale at a large
number of local or regional workshops („dispersed‟ model), where raw materials were
locally available (Wedepohl et al., 2003). Both models have been projected to earlier
periods, although the archaeological and scientific evidence for either is difficult to
interpret (Baxter et al. 2005). Some authors have suggested that early Roman primary
production may have taken place elsewhere in the Hellenistic and early Roman world
(Leslie et al., 2006; Degryse and Schneider, 2008), as small-scale glassmaking has been
reported from Roman York (Jackson et al., 2003) and fourth century AD Hambach,
Germany (Wedepohl et al., 2003).
Models on the organization of glass production in Medieval period still lack. In
particular, in Italy, the transition of the glass industry from Roman to Medieval periods
has not been completely understood (Silvestri et al., 2005; Silvestri and Marcante,
2011). Studies performed on glass findings coming from Venice, one of the most
centres of glass manufacture in Western Europe in this period, identified a gradual
change of glass composition from natron-based Roman production towards the ash-
based glass (Verità et al., 2002). During early Middle Ages, only secondary workshops
1. Introduction
12
were active and objects were made by resoftening raw glass and cullet. Therefore, the
transition from natron to soda ash glass would have occurred in Venice initially by
simple resoftening of raw glass produced elsewhere, but already in the 12th-13th
century AD soda ash glass was certainly produced in Venice using raw materials (flux)
imported from the Levant (Verità et al., 2002; Verità and Zecchin, 2009).
2. Archaeological contexts and materials
13
CHAPTER 2
ARCHAEOLOGICAL CONTEXTS AND MATERIALS
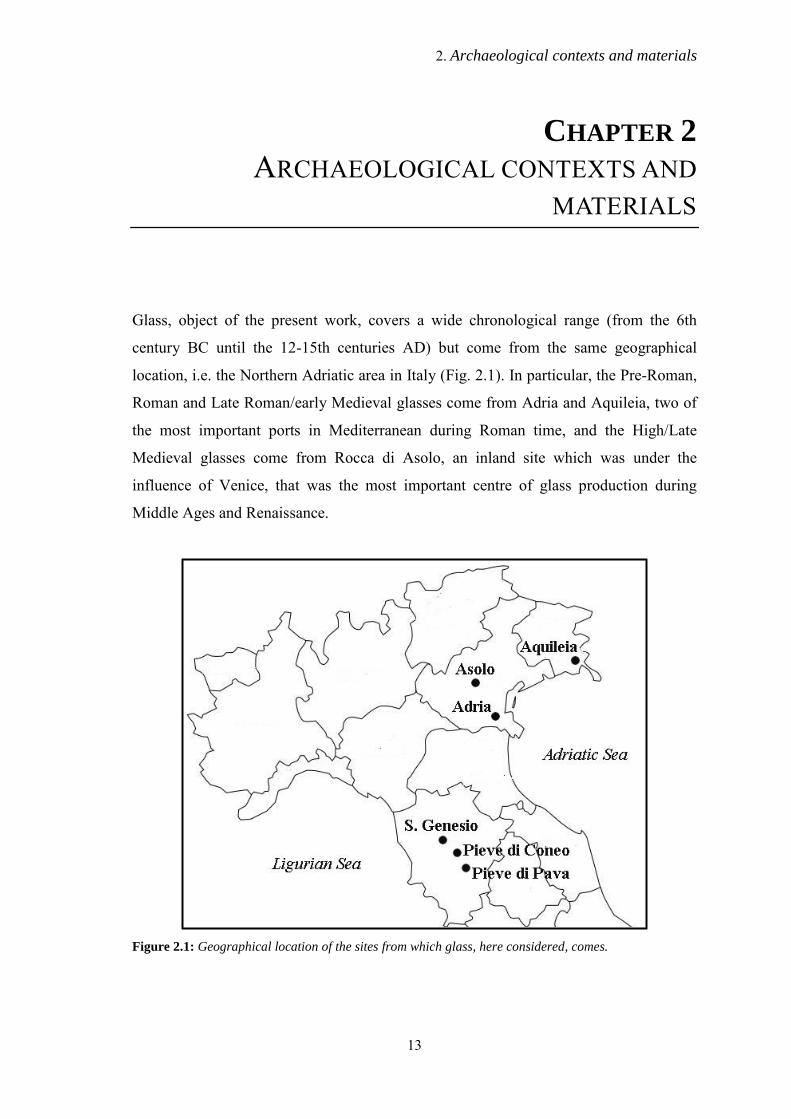
Glass, object of the present work, covers a wide chronological range (from the 6th
century BC until the 12-15th centuries AD) but come from the same geographical
location, i.e. the Northern Adriatic area in Italy (Fig. 2.1). In particular, the Pre-Roman,
Roman and Late Roman/early Medieval glasses come from Adria and Aquileia, two of
the most important ports in Mediterranean during Roman time, and the High/Late
Medieval glasses come from Rocca di Asolo, an inland site which was under the
influence of Venice, that was the most important centre of glass production during
Middle Ages and Renaissance.
Figure 2.1: Geographical location of the sites from which glass, here considered, comes.
2. Archaeological contexts and materials
14
Some Late Roman glasses, coming from the Tuscan sites of Pieve di Pava, Pieve di
Coneo and San Genesio (Fig. 2.1), were also analyzed, in order to have a comparison
between the Eastern and the Western part of the Italian peninsula.
The following sections briefly describe the archaeological and historical context of the
sites from which the glass fragments come, as far as the period of interest and the
analyzed samples.
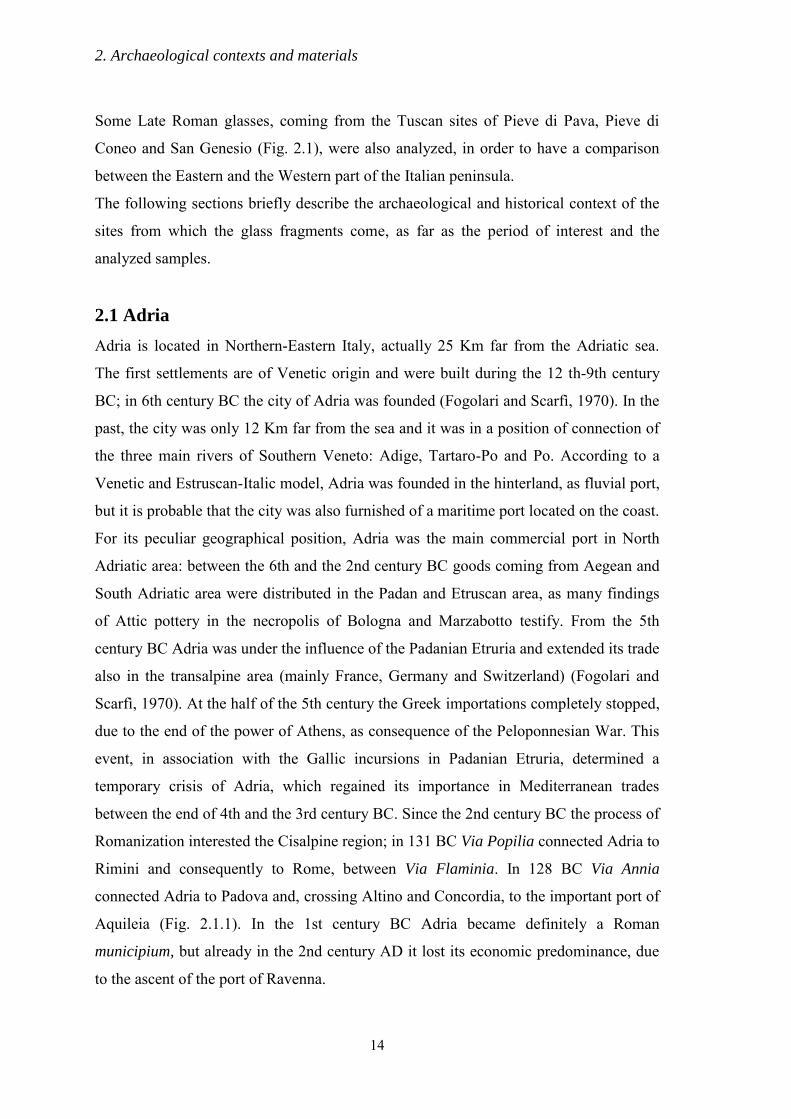
2.1 Adria
Adria is located in Northern-Eastern Italy, actually 25 Km far from the Adriatic sea.
The first settlements are of Venetic origin and were built during the 12 th-9th century
BC; in 6th century BC the city of Adria was founded (Fogolari and Scarfì, 1970). In the
past, the city was only 12 Km far from the sea and it was in a position of connection of
the three main rivers of Southern Veneto: Adige, Tartaro-Po and Po. According to a
Venetic and Estruscan-Italic model, Adria was founded in the hinterland, as fluvial port,
but it is probable that the city was also furnished of a maritime port located on the coast.
For its peculiar geographical position, Adria was the main commercial port in North
Adriatic area: between the 6th and the 2nd century BC goods coming from Aegean and
South Adriatic area were distributed in the Padan and Etruscan area, as many findings
of Attic pottery in the necropolis of Bologna and Marzabotto testify. From the 5th
century BC Adria was under the influence of the Padanian Etruria and extended its trade
also in the transalpine area (mainly France, Germany and Switzerland) (Fogolari and
Scarfì, 1970). At the half of the 5th century the Greek importations completely stopped,
due to the end of the power of Athens, as consequence of the Peloponnesian War. This
event, in association with the Gallic incursions in Padanian Etruria, determined a
temporary crisis of Adria, which regained its importance in Mediterranean trades
between the end of 4th and the 3rd century BC. Since the 2nd century BC the process of
Romanization interested the Cisalpine region; in 131 BC Via Popilia connected Adria to
Rimini and consequently to Rome, between Via Flaminia. In 128 BC Via Annia
connected Adria to Padova and, crossing Altino and Concordia, to the important port of
Aquileia (Fig. 2.1.1). In the 1st century BC Adria became definitely a Roman
municipium, but already in the 2nd century AD it lost its economic predominance, due
to the ascent of the port of Ravenna.
2. Archaeological contexts and materials
15
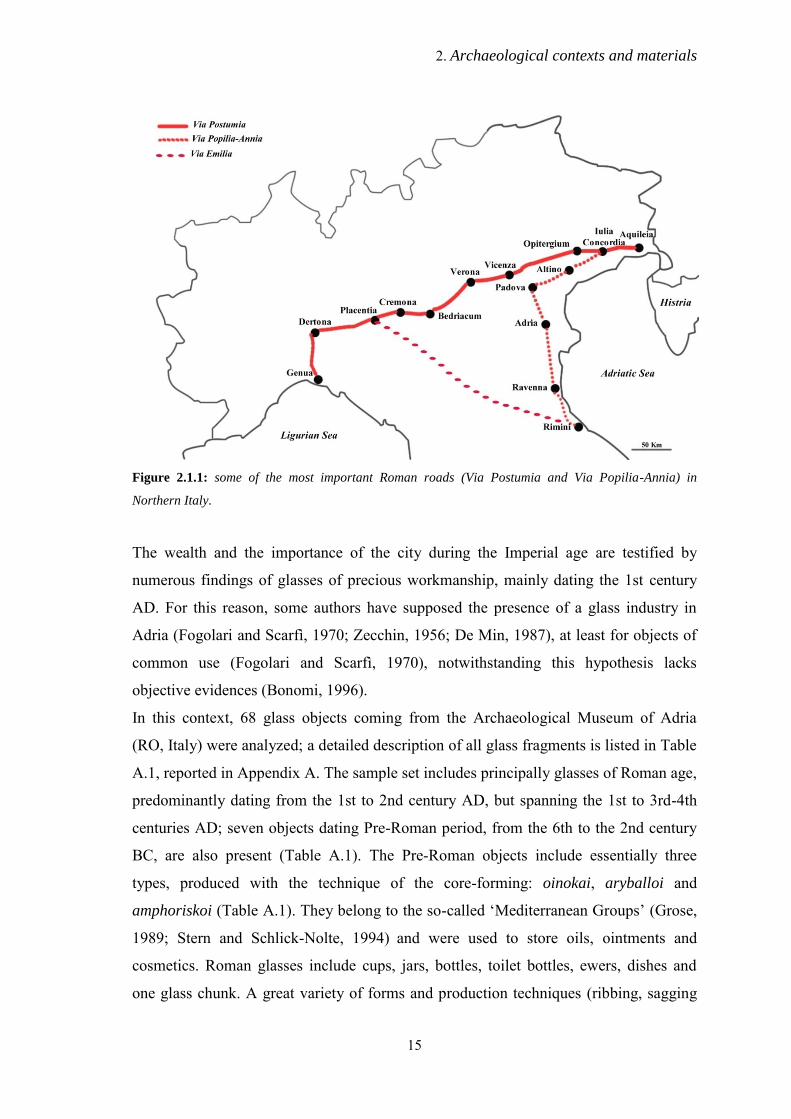
Figure 2.1.1: some of the most important Roman roads (Via Postumia and Via Popilia-Annia) in
Northern Italy.
The wealth and the importance of the city during the Imperial age are testified by
numerous findings of glasses of precious workmanship, mainly dating the 1st century
AD. For this reason, some authors have supposed the presence of a glass industry in
Adria (Fogolari and Scarfì, 1970; Zecchin, 1956; De Min, 1987), at least for objects of
common use (Fogolari and Scarfì, 1970), notwithstanding this hypothesis lacks
objective evidences (Bonomi, 1996).
In this context, 68 glass objects coming from the Archaeological Museum of Adria
(RO, Italy) were analyzed; a detailed description of all glass fragments is listed in Table
A.1, reported in Appendix A. The sample set includes principally glasses of Roman age,
predominantly dating from the 1st to 2nd century AD, but spanning the 1st to 3rd-4th
centuries AD; seven objects dating Pre-Roman period, from the 6th to the 2nd century
BC, are also present (Table A.1). The Pre-Roman objects include essentially three
types, produced with the technique of the core-forming: oinokai, aryballoi and
amphoriskoi (Table A.1). They belong to the so-called ‘Mediterranean Groups’ (Grose,
1989; Stern and Schlick-Nolte, 1994) and were used to store oils, ointments and
cosmetics. Roman glasses include cups, jars, bottles, toilet bottles, ewers, dishes and
one glass chunk. A great variety of forms and production techniques (ribbing, sagging
2. Archaeological contexts and materials
16
glass on former molds, reticella glass technique) is also testified (Table A.1). All Pre-
Roman artefacts and the vast majority of Roman objects (53 samples) are intentionally
coloured (or decoloured): 26 of them are completely transparent (blue, colourless,
green, purple, black), 4 completely opaque (3 white or lattimo glass and 1 blue) and 23
have a transparent body (blue, purple, colourless, green, light blue or amber) with
opaque decorations (white, light blue, yellow and/or wisteria). The remaining is
naturally coloured glass (15 samples), typically light blue or light green in colour.
2.2 Aquileia
Aquileia was founded as a colony by the Romans in 180/181 BC, in an alluvial plain in
Northern Eastern Italy, along the Natisone river, once navigable, as testified by the
presence of the port. The colony was in a strategic position: it served as a frontier
fortress at the North-East corner of transpadane Italy and act as a buttress to check the
advance of warlike people, such as Carni and Histri tribes. The colony was established
with Latin rights by the triumvirate of Publius Cornelius Scipio Nasica, Caius
Flaminius, and Lucius Manlius Acidinus. They led 3000 pedites (infantry), probably
from central Italy, who, with their families, formed the bulk of the settlers and were
soon supplemented by native Veneti. It is likely that Aquileia had been a center of
Venetia even before the coming of the Romans (Chiabà, 2009). In 148 BC Aquileia was
connected with Genoa by means of the Via Postumia, which passed through Cremona,
Bedriacum and Altino; in 132 BC the construction of the Via Popilia, from Rimini to
Aquileia, through Ravenna, Adria and Altino, improved the communications still
further and in 131 BC the Via Annia connected Aquileia to Padova (Fig. 2.1.1)
(Bertacchi, 2003). Aquileia was also connected with the central Italy by the Via Emilia
(from Piacenza to Rimini, Fig. 2.1.1). The original Latin colony became a municipium
in 90 BC and colony of Roman rights in the Augustan period. Notwithstanding the
crisis of the 3rd century, Aquileia maintained its importance and, after the Diocletian’s
reform, it assumed political and administrative functions complementary to those of
Mediolanum. The city became the residence of the provincial governors and an imperial
palace was constructed, in which the emperors frequently resided after the time of
Diocletian. During the 4th century Aquileia reinforced its role of connection between
the Mediterranean and the Balkan area, as testify the Edictum de Pretiis (301 AD),
2. Archaeological contexts and materials
17
which reports the maritime exchanges between Aquileia, Alexandria of Egypt and the
Levant (Marano, 2009; Sotinel, 2001). At the end of the 4th century, Ausonius
enumerated Aquileia as the ninth among the great cities of the world, placing Rome,
Mediolanum, Constantinople, Carthage, Antioch, Alexandria, Trier, and Capua before
it. However, in 452 AD the city was besieged and destroyed by Attila and Huns; the fall
of Aquileia was the first of Attila's incursions into Roman territory, followed by cities
like Mediolanum and Ticinum. The Roman inhabitants, together with those of smaller
towns in the neighborhood, fled to the lagoons, and so founded the cities of Venice and
nearby Grado. The process of decadence, triggered by the fall of Attila, continued
during the 5th century, under the domination of the Ostrogoths. In this period, the cities
of the inner Venetia, such as Verona, assumed more importance while Aquileia was
gradually marginalized. The short Byzantine domination (555-568 AD) tried to
reorganize the ancient province of Venetia et Histria, but it was interrupted by the
invasion of the Lombards in 568 AD. Aquileia was once more destroyed (590 AD) and
the patriarch Paolo fled to the island town of Grado, which was under the protection of
the Byzantines. The flight of the patriarch represents the final act of the ancient history
of Aquileia; the city continues its existence during the Lombard period, but deprived of
the political and economical importance that it had had in Roman and Late Roman
Period (Marano, 2009).
As previously said, the peculiar geographical position, the fluvial port connected with
the sea and the road network attributed to Aquileia a central role in trades during
Roman and Late Roman period. This city acted as a commercial hub between the
Mediterranean area and the Padan and Transalpine area. A huge quantity of goods
circulated in the port and in the market: mainly wine and oil, but also livestock, wood,
iron, fruit, leather, clothing, wheat, pottery, glass (Zaccaria et al., 2009). For this reason,
in the 1st century BC the Greek geographer Strabo underlined the role of emporium
assumed from Aquileia (Strabo 5,1,8) and in the 3rd century the historian Herodian
defined the city emporium of Italy (Herodian 8, 2).
As concern the glass, a large collection of objects of different age, type and colour is
preserved in the Archaeological Museum (Mandruzzato and Marcante, 2005, 2007). In
the past years, C. Calvi (1968) has supposed the presence of a glass production in
Aquileia, based on the finding of glass debris with the typical Roman composition and
2. Archaeological contexts and materials
18
on the presence of silica source (saldame) in the close Histria. To support the above
hypothesis, C. Calvi also mentioned the inscription Sentia Secundia facit Aquileia vitra
on two bottles founded at Linz in the early 19th century.
At the present, other authors tend to hypothesize the presence of secondary workshops
in Aquileia rather than of a centre of primary production (Buora et al., 2009).
Notwithstanding the findings of furnaces are actually missing, the presence of glass
slags, chunks and debris (drops, filaments) is testified both in the urban area and
suburbs (Buora et al., 2009), but never studied from the archaeological point of view.
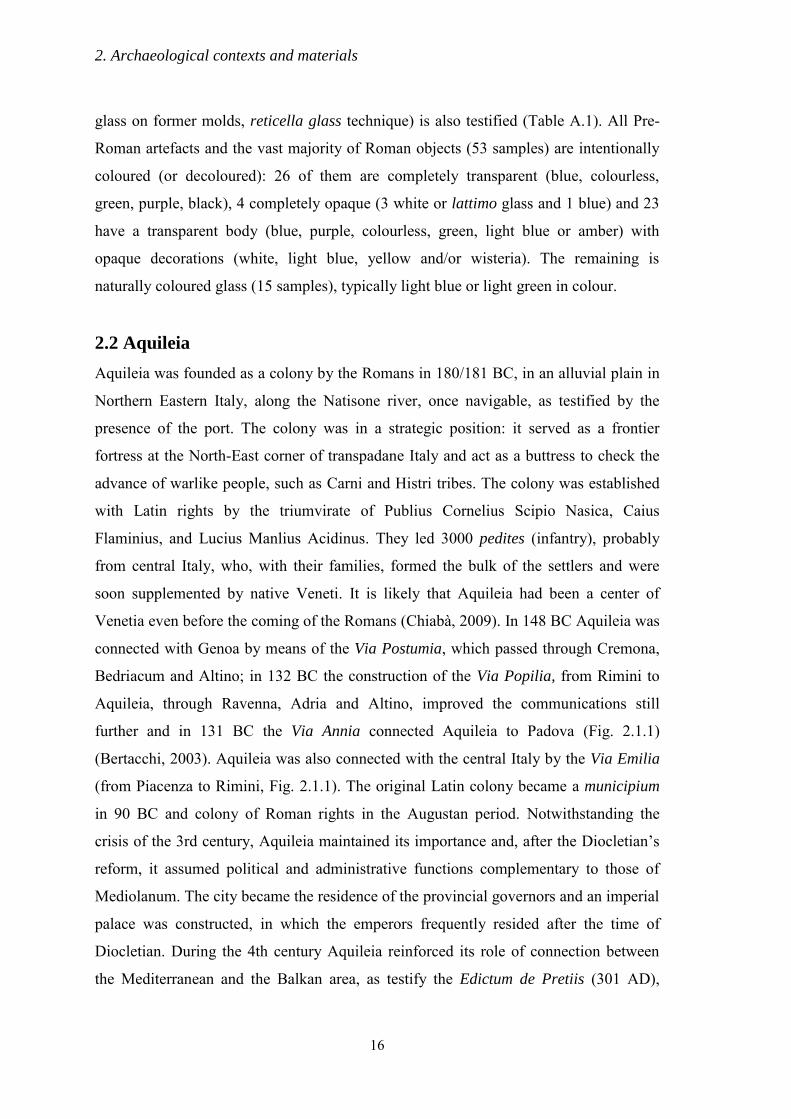
The sample set of Aquileia glasses analyzed in this work comes from the roman domus,
called Casa delle Bestie Ferite. The University of Padova started the archaeological
excavation of this building in 2007. The house is situated in the North of the city, in a
residential area, and occupied a surface area of about 800 m2 (Fig. 2.2.1).
Figure 2.2.1: (a) location of Casa delle Bestie Ferite (grey circle) in the north side of the archaeological
site of Aquileia; (b) Plan of Casa delle Bestie Ferite.
The reconstruction of the site history is difficult, due to the divestiments in Late
Antiquity, which determined, in the 7th century AD, the removal of building materials
and the partial destruction of the floors. A first phase of the domus is well documented
in the 1st century AD by remains of mosaic floors with geometric decorations;
a) b)
2. Archaeological contexts and materials
19
subsequently the life of the building continued for four centuries. During the middle
Imperial age the domus was subjected to a first restoration and in Late Antiquity (4th
century AD) it was completely restructured (Bonetto and Salvadori, in press).
So far, the excavation has involved mainly the Late Antiquity phases, yielding 688 glass
fragments. The findings dating between the 3rd and the 5th century AD, well
corresponds to the material preserved in the Archaeological Museum of Aquileia for
types, colour and production techniques (mainly mold blowing). The principal types are
beakers/cups (Isings 106, 109, 96, 116, 117), bottles (Isings 104, 132, 126) and plates
(Isings 118) (Isings, 1957). Otherwise, the findings dating post 5th century do not have
a correspondence with the material of the Museum. They were produced by free
blowing and the most represented type is the footless beaker (Isings 111) (Gallo et al.,
2011).
In the present study a total of 62 glass objects, coming from this excavation, were
selected and analyzed; the features of each sample (type, age, colour and production
technique) are listed in Table A.2, Appendix A. The artefacts date all Late Roman/early
Medieval period, from the late 3rd to the 8th century AD; in particular, two
chronological groups can be distinguished: the first includes objects spanning from the
late 3rd to the 5th century AD, the second from the 5th to the 8th (Table A.2).
The different chronological pattern with respect to the early Roman glasses from Adria
determines differences in the aesthetic characteristics of the glass. While Adria glasses
were generally intensely coloured, the typical colour of Aquileia samples is yellowish-
green, sometimes colourless or light blue (Table A.2).
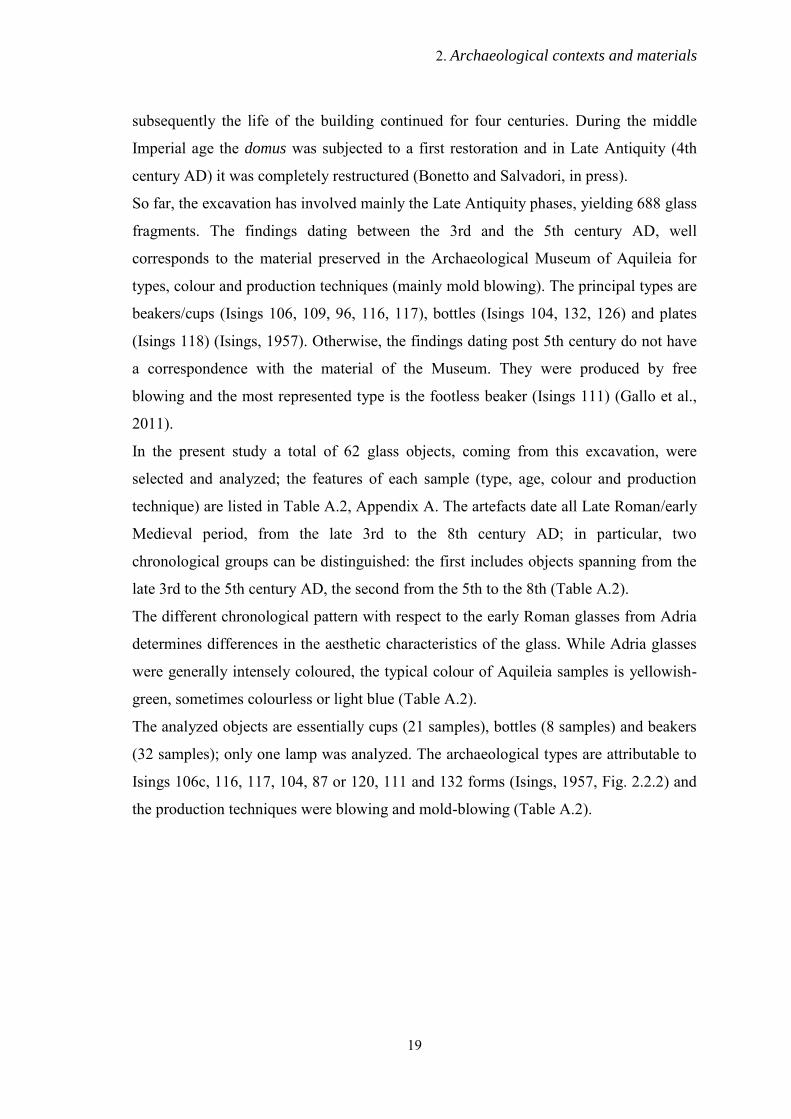
The analyzed objects are essentially cups (21 samples), bottles (8 samples) and beakers
(32 samples); only one lamp was analyzed. The archaeological types are attributable to
Isings 106c, 116, 117, 104, 87 or 120, 111 and 132 forms (Isings, 1957, Fig. 2.2.2) and
the production techniques were blowing and mold-blowing (Table A.2).
2. Archaeological contexts and materials
20
Figure 2.2.2: the archaeological types of Aquileia sample. 1) Isings 106c; 2) Isings 111; 3) Isings 104
var a; 4) Isings 104var b; 5) Isings 117; 6) Isings 116; 7) Isings 132; 8 )Isings 87 or 120 (courtesy of A.
Marcante).
2.3 Rocca di Asolo
The Rocca di Asolo is a fort on the summit of Montericco, in Northeastern Italy,
dominating the town of Asolo, an ancient settlement of the Veneti (ca. 9th century BC)
and later a Roman municipium. Archaeological excavations have revealed several
phases in the Montericco site. The first evidence of occupation dates to about the 6th
century AD and was connected with the presence of a small church. Later (7th-10th
centuries AD) the church was transformed into a monument, but already at the end of
the 10th century it had decayed and was replaced by a burial area. Subsequently (10th-
12th centuries) a settlement arose in the area, destroyed at the end of the 12th century
when the military fortification (Rocca) was built. The Rocca di Asolo passed through
various hands - including the Bishopric of Treviso, the Carraresi family from near
Padova, and the Republic of Venice - until its decay, at the end of the 16th century
(Bonetto, 1993; Rosada, 1989).
2. Archaeological contexts and materials
21
About 7000 glass fragments have been found in this site. There are few finds - only
about 100, including window panes - dating to the early Middle Ages; otherwise,
high/late Middle Ages finds are more abundant and comprise various kinds of objects
(beakers, bottles, lamps) (Rigoni, 1986).
In the present study thirty-three samples were analyzed: 12 fragments of window panes,
eight dating to the Early Middle Ages (7th-10th centuries AD) and four to the Late
Middle Ages (15th century AD), and 21 fragments of objects dating to the High/Late
Middle Ages (12th-15th centuries). For five samples decorated with blue rims, both the
colourless body and the blue decoration were analysed separately, for a total of 38
samples. The age and features of the samples are listed in Table A.4, in Appendix A.
The glass window panes are pale blue, greenish, yellowish and pale brown in colour;
four are fragments of pieces with regular shape: one circular (ruo) and three triangular
(crosetta) (Table A.4). Two production techniques were identified: crown process (2
samples) and cylinder process (10 samples) (Table A.4). In these processes, a molten
glass bubble was blown and then rolled on a smooth surface to obtain a disc-shaped
crown or cylinder. In the former case, the crown was removed and cut; in the latter, the
cylinder was cut lengthwise to obtain a flat sheet. The glass produced with these
techniques is thinner than that produced by casting and has two smooth sides (Arletti et
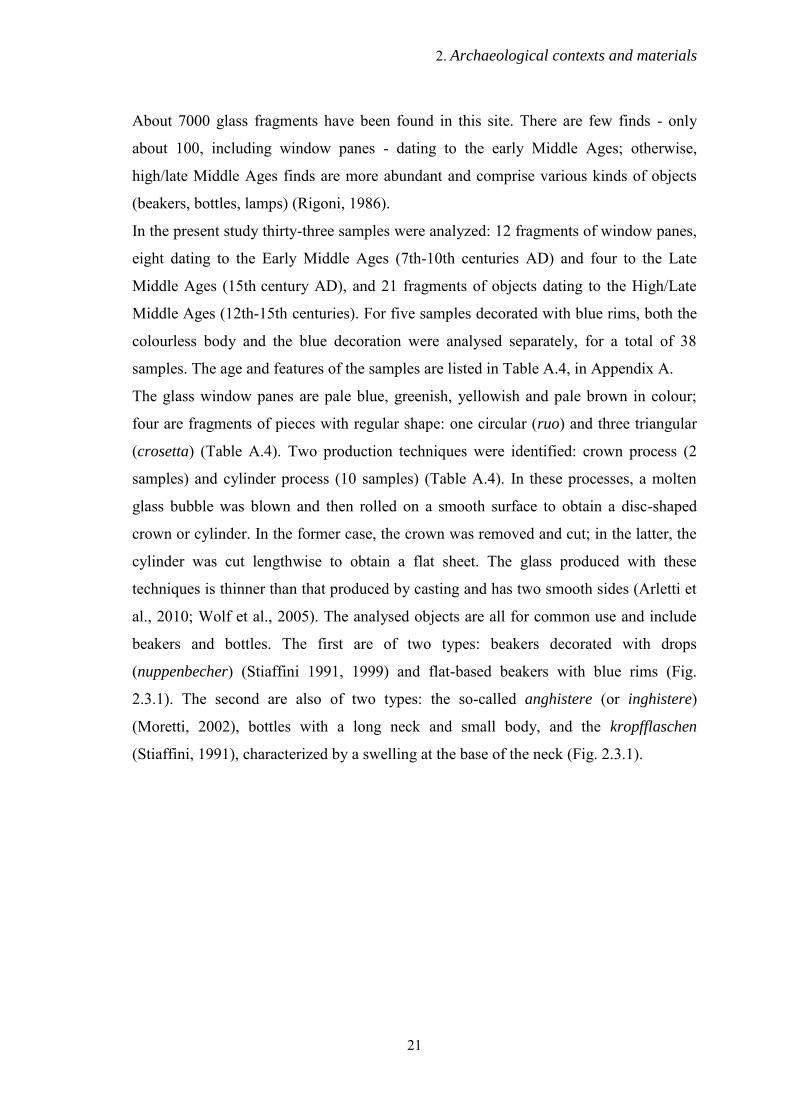
al., 2010; Wolf et al., 2005). The analysed objects are all for common use and include
beakers and bottles. The first are of two types: beakers decorated with drops
(nuppenbecher) (Stiaffini 1991, 1999) and flat-based beakers with blue rims (Fig.
2.3.1). The second are also of two types: the so-called anghistere (or inghistere)
(Moretti, 2002), bottles with a long neck and small body, and the kropfflaschen
(Stiaffini, 1991), characterized by a swelling at the base of the neck (Fig. 2.3.1).
2. Archaeological contexts and materials
22
Figure 2.3.1: Sketches of analyzed archaeological types (nuppenbecher, flat-based beaker with blue rim,
kropfflasche and anghistera). References are also given (courtesy of A. Marcante).
2.4 Tuscan sites
San Genesio
The archaeological site of San Genesio, excavated from 2001 onwards, is located in the
municipality of San Miniato (PI). The first finds attesting human occupation of the site
are dated to the middle of the 6th century BC; the first remains of housing structures,
instead, are dated to the 3rd century BC (Ciampoltrini. 2008). At the start of the 1st
2. Archaeological contexts and materials
23
century BC, the settlement was made of simple houses in wood and unfired clay. The
economical crisis of the 2nd-3rd century affected also San Genesio and the surrounding
area, of which the population decreased. The increase of coins, glass and ceramic finds,
instead, is an indication of expansion during the 4th and the first half of the 5th century
(Cagno et al., 2011). From the end of the 5th century, part of the area was used as a
large necropolis; it is also possible that the area was fortified in the first half of the 6th
century (Cantini 2010). In the second half of the 6th century the settlement is a well-
structured village and between the end of the 6th and the beginning of the 7th century, a
first small church was constructed. During the mid-11th and the second half of the 12th
century the village increased in size, but, in the same period, the inhabitants of the
adjacent town of San Miniato started a long series of hostilities against the village. San
Genesio survived many attacks but eventually lost the war: in 1248 the San Miniatese
plundered and destroyed the village (Cagno et al., 2011).
Pieve di Coneo
The church of Ss. Ippolito and Cassiano, located in the municipality of Coneo, Valdelsa
(SI), was excavated during two campaigns, in 2007 and 2009. So far, the majority of
excavation data are unpublished.
The first phase of the site dates to Roman Republic and is characterized from the
presence of dolia defossa, big containers for foodstuff. For this reason it was supposed
that the site was a farm. The second phase is characterized by the presence of burials,
dating to Late Antiquity (6th-7th century AD). Finally the third phase show the
presence of the first structure of the church, which arose in the area likely during early
Middle Ages.
Pieve di Pava
The church of S. Pietro in Pava, located close San Giovanni d’Asso (SI), was excavated
from 2004 onwards, but at the present the majority of the data are unpublished. The site
is a long frequented context, the chronology lays between the Etruscan Period and the
Middle Ages. During the excavations conducted in 2004 and 2005 were discovered a
church (dated from 6th to 12th centuries AD), a necropolis (dated from 10th to 13th
2. Archaeological contexts and materials
24
centuries AD) and a brick-kiln (probably previous the 8th century). These chronological
articulations results from carbon-14 dating (Campana et al., 2006).
A total of fifteen glass findings coming from San Genesio, Pieve di Pava and Pieve di
Coneo were analyzed in the present work. The samples are typologically and
chronologically similar to those of Aquileia. In particular, the majority of them (14
samples) are beakers type Isings 111 (5th-8th century AD), but one beaker type Isings
106c (late 3rd-5th century AD) is also included in the sample set. The features of each
sample (type, age, colour and production technique) are listed in Table A.3, Appendix
A.
25
CHAPTER 3
EXPERIMENTAL METHODS
In the present work a broad range of analytical techniques was employed, in order to
investigate the type and the provenance of raw materials employed in the production of
the 178 glass objects. For clarity, Table B.1 (Appendix B) reports all the analytical
techniques used to characterize each sample. After the sample selection, the first step of
the study was to evaluate the homogeneity and the texture of the glass by means of
optical and electron microscopes (OM and SEM). In case of residual, newly formed and
opacifying phases, a chemical semi-quantitative analysis was performed to determine
their composition. Furthermore, X Ray Powder Diffraction (XRPD) was employed to
identify the crystalline phase of four white glasses. The second step of the work
consisted of the bulk chemistry analysis. In the case of decorated objects, both the
transparent and the opaque glass were analyzed and considered as separated samples
(Table B.1, Appendix B). Major, minor and trace elements of transparent samples with
a sufficient weight (≥700 mg ) were determined by X-Ray Fluorescence; S, Cl, Sb and
Sn were checked by Electron Microprobe (EPMA) (Table B.1, Appendix B). On the
other hand, the chemical composition of transparent glasses with a weight not sufficient
to carry out XRF analysis and of glassy matrix in opaque glasses was determined by
EPMA (Table B.1, Appendix B). Laser Ablation Inductively Couple Plasma Mass
Spectrometry (LA-ICP-MS) was used to analyze trace elements of almost all Adria
transparent glasses. Since samples AD-BB-1lb, AD-I-2, AD-I-3, AD-AM-1 have been
completely crushed, it was not possible to perform LA-ICP-MS analysis: their traces are
therefore obtained by means XRF or EPMA (Table B.1, Appendix B). Finally, Sr, Nd
and O isotopic analysis were performed on a selection of Roman and Late Roman
samples from Adria and Aquileia (Table B.1, Appendix B). They were opportunely
chosen in order to represent the different colour and compositional groups recognized in
glass assemblages.
3. Experimental methods
26
A more detailed description of the experimental methods and analytical conditions
employed for the textural, mineralogical, chemical and isotopic characterization of the
samples is reported in the following.
3.1 Optical Microscopy (OM)
Optical microscopy, both stereoscopic and in reflected light, was carried out on whole
fragments and polished sections, for a preliminary evaluation of the homogeneity,
texture and state of conservation of the findings. In order to obtain polished sections, the
glass artefacts were cut perpendicularly to their surfaces with a diamond saw, embedded
in epoxy resin blocks, and then polished with a series of diamond pastes from 6 to 1
μm. The microscopes used are a Nikon Eclipse ME600 and a Zeiss Stemi 2000 C, of the
Geoscience Department at the University of Padova.
3.2 Scanning Electron Microscopy with Energy Dispersive System
(SEM-EDS)
SEM analysis, carried out at the CNR-ICIS of Padova, was performed for high-
resolution morphologic inspection of glass and semi-quantitative chemical analysis of
the residual, newly formed and opacifying phases present into the glass. The instrument
used is a FEI Quanta 200 FEG ESEM, equipped with a field emission gun for optimal
spatial resolution; it was used in high vacuum mode (HV). For chemical semi-
quantitative analysis an EDAX Genesys energy-dispersive X-ray spectrometer was
used, with accelerating voltage of 25 keV.
3.3 X Ray Powder Diffraction (XRPD)
X-ray diffraction analyses, carried out at the Department of Geosciences (University of
Padova), were performed on a selection of four white opaque samples to identify
crystalline phases dispersed in the glass matrix. Due to the small quantity of material
available, the whole fragments were mounted on a goniometric head and the
experiments were carried out with a Philips X’Pert PRO diffractometer, with para-
foucusing geometry Bragg-Brentano. The instrument is provided with a ceramic tube
LFF, with copper anode and graphite crystal monochromator. The analyses were
performed in the range 10°-80° 2θ, with a step-time of 60s. To identify the phases, the
3. Experimental methods
27
database provided by X-Pert Panalytical software was employed. The obtained spectra
are reported in Appendix C.
3.4 X Ray Fluorescence (XRF)
The bulk chemistry of 105 transparent samples (Table B.1, Appendix B) was
determined by X Ray Fluorescence at Geoscience Department of the University of
Padova. The instrument is a Philips PW 2400, equipped with a Rh tube having a rated
capacity of 3 kW (60 kV/ 125 mA max.). Three primary collimators (150, 300 and 700
μm spacing) and four analytical crystals (TlAp100, LiF200, Ge111 and PE002) were
selected. The spectrometers was interfaced to a personal computer with SuperQ
software from Philips which allowed determination of Si, Ti, Al, Fe, Mn, Mg, Ca, Na,
K e P (major and minor elements, expressed as percentage concentrations of element
oxides) and Sc, V, Cr, Co, Ni, Cu, Zn, Ga, Rb, Sr, Y, Zr, Nb, Ba, La, Ce, Nd, Pb, Th e
U (trace elements, expressed as parts per million, ppm).
About 70 geological standards were used for calibration. The samples were first cleaned
from possible alteration patina and then crushed into an agate mortar. The resulting
powders were put in an oven at 110°C for 12 h and the loss on ignition (LOI) was
determined. The powders were then mixed with Li2B4O7 in a 1:10 ratio and beads were
prepared. Precision is better than 0.6% for major and minor elements, and about 3% for
trace elements. The XRF accuracy was checked by reference standards (Govindaraju,
1994) and was within 0.5 wt% for Si, lower than 3% for other major and minor
elements, and lower than 5% for traces. The lowest detection limits of XRF were within
0.01 wt% for Al2O3, MgO and Na2O, within 0.2 wt% for SiO2, within 0.005 wt% for
TiO2, Fe2O3, MnO, CaO, K2O and P2O5 and within a range between 1 and 10 ppm for
trace elements. The XRF analyses allowed determination of all the chemical
components that characterize archaeological glass, excluding Cl, S, Sn and Sb, which
were checked by EPMA.
3.5 Electron Probe Microanalysis (EPMA)
A total of 99 bulk glass compositions were determined by EPMA: 76 are relative to
transparent samples and 23 to glassy matrices of opaque glasses (Table B.1, Appendix
B). EPMA measures were checked against a homogeneous soda–lime glass, analyzed
3. Experimental methods
28
previously by XRF and the results fitted perfectly: the differences fall into the
experimental error of EPMA. The electron microprobe used for quantitative analysis of
major and minor elements was a CAMECA SX50 of the IGG-CNR of Padova,
equipped with four wavelength-dispersive spectrometers (WDS). Analyzed elements
were: Na, Mg, Al, Si, P, S, Cl, K, Ca, Ti, Mn, Fe, Sb, Co, Ni, Cu, Zn, Sn and Pb. The
followed standards were employed: synthetic pure oxides for Mg, Al, Fe, Sn, a
synthetic MnTi oxide for Mn and Ti, albite for Na, diopside for Si and Ca, apatite for P,
sphalerite for Zn and S, vanadinite for Cl, orthoclase for K, Sb2S3 for Sb, PbS for Pb,
and pure elements for Co, Ni, Cu.
For the transparent glasses, ten analytical points were made along a line crossing the
thickness of the polished sections of each sample, and means and standard deviations
were calculated. The standard deviations range between 0.02 and 0.80 for major
elements and from 0.01 to 0.45 form minor and trace elements, thus proving the
homogeneity of the glass fragments. For Na, K, Si and Al the operating conditions were
20 kV and 2nA sample current, with beam defocused at not less than 10 μm and an
acquisition time of 10 s for peak and background, in order to minimize the loss of alkali
elements and better evaluate Si contents. For the other elements the operating
conditions were 20 kV and 30 nA sample current; the acquisition time was 10 s peak
and 10 s background for Ca, 10 s peak and 5 s background for Mg, P, Ti, Mn and Fe, 40
s peak and 20 s background for S, Cl, Co, Cu, Zn, Sn and Pb. X-ray counts were
converted to oxide weight percentages with the PAP (CAMECA) correction program.
The detailed analytical conditions used and the precision, accuracy and detection limits
of EPMA are given in Silvestri and Marcante (2011), as the present samples were
subjected to the same analytical protocol. It is stressed here that the precision and
accuracy of data were calculated by comparisons with measures on the international
reference standard, Corning glass B, in the same analytical conditions as the Adria
glass. The precision of EPMA data was generally between 0.5% and 10% for major and
minor elements, respectively. Accuracy was better than 1% for SiO2, Na2O and FeO,
better than 5% for CaO, K2O, P2O5 and Sb2O3, and not worse than 12% for other major
and minor elements, except TiO2 (Silvestri and Marcante, 2011) .
The glassy matrix of opaque glass was analyzed using a different analytical protocol, in
order to minimize the chemical contribution of the inclusions and obtain a bulk
3. Experimental methods
29
composition as clean as possible. In a first step, Na, Mg, Al, Si, P, K, Ca, Mn and Fe
were measured on about eight analytical points, randomly made. Since the inclusions
are essentially constituted of lead and calcium antimonate (See section 4.1.1), Sb was
also measured, as check of the analysis. For Na, K, Si and Al, operating conditions were
20 kV and 2 nA sample current and acquisition time of 10 s for peak and background, in
order to minimize the loss of alkali. For Fe, Mn, P, Ca, Sb, Mg operating conditions
were 20 kV and 30 nA sample current and acquisition time of 10 s for peak and 5 s for
the background. The beam was focused at around 1 μm and standard deviations range
between 0.01 and 1.50. X-ray counts were converted to oxide weight percentages with
the PAP (CAMECA) correction program. In the second step, back-scattered electrons
images were acquired for each sample and Sb, Pb, S, Cl, Ti, Cu, Co, Ni, Zn were
measured on about eight analytical points, avoiding the inclusions. The operating
conditions were 20 nA and 20 kV; the beam was focused at around 1 μm and the
acquisition time was 10 s for peak and background for S, Cl, Sb and Pb, 20 s peak and
10 s background for the other elements. Standard deviations range between 0.01 and
0.99. Finally, to match the analyses acquired during the two steps, Sb data were used as
‘control element’: only first step analyses with Sb contents comparable with those of the
second step were chosen, since considered representative of the only glass matrix,
without the contribution of the opacifiers.
3.6 Laser Ablation Inductively Coupled Plasma Mass Spectrometry
(LA-ICP-MS)
LA-ICP-MS, carried out at the IGG-CNR of Pavia, was employed as complementary
technique to XRF and EPMA for measuring trace elements concentrations of 62
transparent samples from Adria (Table B.1, Appendix B). The probe was composed of
an Elan DRC-e mass spectrometer coupled with a Qswitched Nd:YAG laser source
(Quantel Brilliant), the fundamental emission of which (1064 nm) was converted to 266
nm by two harmonic generators. Helium was used as carrier gas, mixed with Ar
downstream of the ablation cell. Each sample was analyzed in spot mode; routine
analyses consisted in acquiring 1 min background and 1 min ablated sample: spot
diameter was typically in the range of 50 μm and penetration rate was about 1 μm/s.
NIST SRM 610 glass was used as external standard and Ca44 as internal standard, the
3. Experimental methods
30
concentration of which was also compared with that already measured by EPMA.
Precision and accuracy, both better than 10% for concentrations at ppm level, were
assessed by repeated analyses of the BCR-2g standard. Detection limits varied as a
function of background counts and the sensitivity of the various masses: they were
typically in the range 1-3 ppm for Ti, Cr and Fe, 100-500 ppb for Sc, V, Zn and Mn, 10-
100 ppb for Rb, Sr, Zr, Cs, Gd, Sn, Sb, Ba, Hf and Pb, and 1-10 ppb for Y, Nb, Sm, Eu,
Tb, Dy, Er, Yb, Th, U, La, Ce, and Nd. The precision and accuracy of data were
calculated by comparisons with measures on the international reference standard,
Corning glass B, in the same analytical conditions of the Adria glass (Silvestri and
Marcante, 2011); for most trace elements, precision was about 2% and accuracy highly
variable, but usually within 5-20%. In any case, the same accuracy range was also
reported for LA-ICP-MS measurements, carried out on the same standard by Vicenzi et
al. (2002). Some minor or trace elements were determined by both EMPA (Ti, Mn, Fe,
Sb, Co, Cu, Zn, Sn, Pb) or XRF (Ti, Mn, Fe, Co, Cu, Zn, Ni, Rb, Sr, Ba, Zr, Nd, La, Ce,
Th, U, V, Ga, Y, Nb, Cr, Pb) and LA-ICP-MS. When the considered elements are
present in concentrations above the EPMA detection limits, EPMA and LA-ICP-MS
data show good accuracy. However measures on some elements (e.g. Mn, Ti, Sb, Cu,
Pb), are affected by low accuracy, likely due to a systematic error. On the other hand, a
generally good precision and accuracy appear when comparing XRF and LA-ICP-MS
data, except for Rare Earth Elements (REE). Taking into account the lower detection
limits and the high precision of LA-ICP-MS for trace elements, its data were therefore
chosen and reported in the present study (see Table D.2, Appendix D)..
3.7 Multi Collector Inductively Coupled Plasma Mass Spectrometry
(MC-ICP-MS)
Thirty-eight samples, 20 Roman glasses from Adria and 18 Late Roman glasses from
Aquileia, were selected to perform Sr and Nd isotope analysis (Table B.1, Appendix B).
The analyses were performed in collaboration with the Prof. Patrick Degryse (Earth
Science Department of the University of Leuven, Belgium); the lab work was
conducted at Ghent University (Belgium).
Dissolution of glass was accomplished by hotplate digestion in Savillex screw-top
beakers. Prior to analysis, glass samples were carefully cleaned of any alteration
3. Experimental methods
31
products, in order to avoid contamination of results, and then finely crushed in an agata
mortar. About 100 mg of the resulting powder were put into the Savillex screw-top
beakers and a 3:1 mixture of 22 M HF and 14 M HNO3 was added, followed by heating
at 110°C for 24 h. The sample digests were subsequently evaporated and dissolved in a
mixture 3:1 of 12 M HCl and 14 M HNO3 (aqua regia). Again, the samples were heated
for 24 h at 110 °C and subsequently evaporated to dryness; 2 ml of 7 M HNO3 was
added to the residue and heated on the hotplate for about 30 minutes. The
concentrations of Sr and Nd were doubled-checked using a quadrupole-based Perking-
Elmer SCIEX Elan 5000 ICP-MS instrument. An internal standard (In) was used to
correct for the signal fluctuation, and the calibration was performed with an external
standard containing known amounts of the element analyzed. For the isolation of Sr and
Nd sequential extraction methods (Pin et al., 1994; Pin and Zalduegui, 1997; De
Muynck et al., 2009) were followed and slightly modified.
The Sr fraction of the sample digests was isolated from the sample matrix via an
extraction chromatographic separation using a Sr-selective resin (Sr specTM); 0.1 ml of
sample, dissolved in 7M HNO3, were loaded onto the resin. Then, the resin was rinsed
first with 5 ml of 7 M HNO3 and then with 500 μl of 0.05 M HNO3 solution to remove
matrix elements, while Sr is retained by the resin. The purified Sr fraction was
subsequently stripped off the resin by rinsing with 5 ml of 0.05 M HNO3.
The isolation of Nd involved a 2-step chromatographic separation. The sample, taken up
in 1 ml of 2M HNO3, was loaded into Micro-BioSpin columns (BioRad) filled with
TRUSpec resin (Eichrom), and was washed with 4 ml of 2M HNO3. The Micro-
BioSpin column was then coupled with an Eichrom column filled with LnSpec resin
(Eichrom), and was rinsed with 7 ml of 0.05M HNO3 in order to elute the LREE
fraction from the TRUSpec resin into the LnSpec resin. The LnSpec resin was then
washed with 5 ml of 0.25M HCl, and the Nd fraction was stripped off using 9 ml of
0.25M HCl.
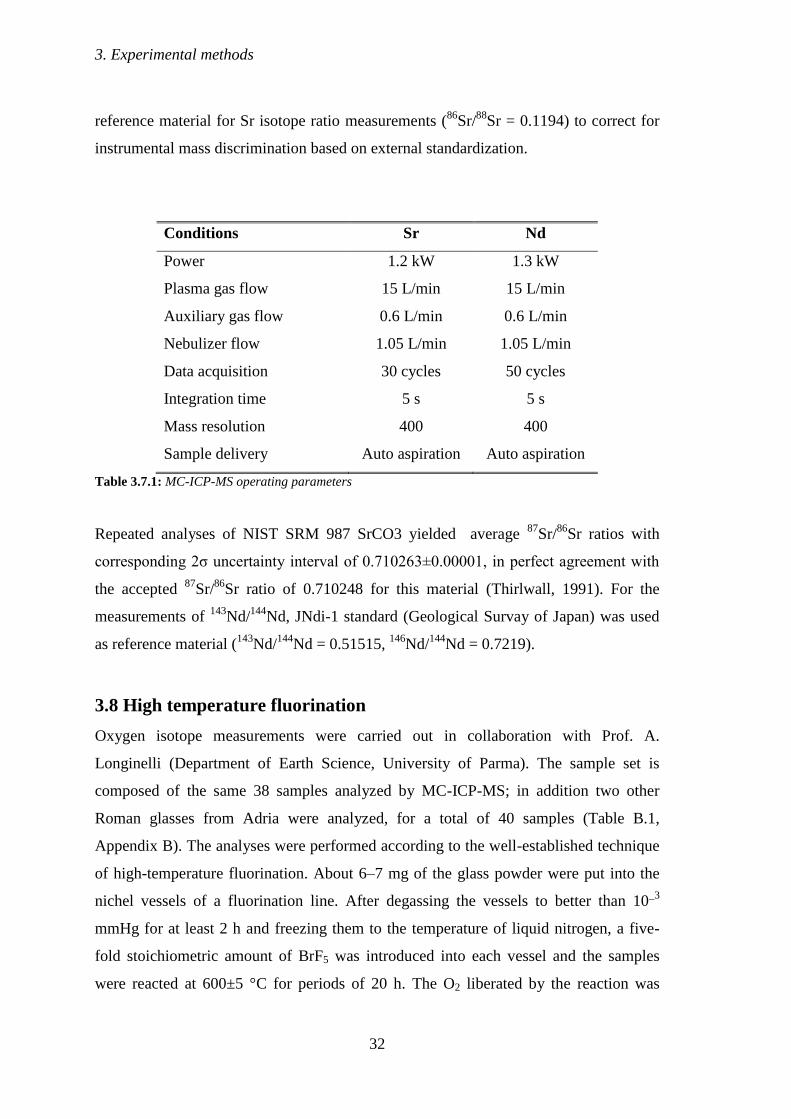
All measurements were carried out using a Thermo Scientific Neptune multi collector
inductively coupled plasma mass spectroscopy (MC-ICP-MS), equipped with a micro-
flow PFA-50 Teflon nebuliser, and running in static multicollection mode. The
operating parameters are given in Table 3.7.1. NIST SRM 987 standard was used as
3. Experimental methods
32
reference material for Sr isotope ratio measurements (86
Sr/88
Sr = 0.1194) to correct for
instrumental mass discrimination based on external standardization.
Conditions Sr Nd
Power 1.2 kW 1.3 kW
Plasma gas flow 15 L/min 15 L/min
Auxiliary gas flow 0.6 L/min 0.6 L/min
Nebulizer flow 1.05 L/min 1.05 L/min
Data acquisition 30 cycles 50 cycles
Integration time 5 s 5 s
Mass resolution 400 400
Sample delivery Auto aspiration Auto aspiration
Table 3.7.1: MC-ICP-MS operating parameters
Repeated analyses of NIST SRM 987 SrCO3 yielded average 87
Sr/86
Sr ratios with
corresponding 2σ uncertainty interval of 0.710263±0.00001, in perfect agreement with
the accepted 87
Sr/86
Sr ratio of 0.710248 for this material (Thirlwall, 1991). For the
measurements of 143
Nd/144
Nd, JNdi-1 standard (Geological Survay of Japan) was used
as reference material (143
Nd/144
Nd = 0.51515, 146
Nd/144
Nd = 0.7219).
3.8 High temperature fluorination
Oxygen isotope measurements were carried out in collaboration with Prof. A.
Longinelli (Department of Earth Science, University of Parma). The sample set is
composed of the same 38 samples analyzed by MC-ICP-MS; in addition two other
Roman glasses from Adria were analyzed, for a total of 40 samples (Table B.1,
Appendix B). The analyses were performed according to the well-established technique
of high-temperature fluorination. About 6–7 mg of the glass powder were put into the
nichel vessels of a fluorination line. After degassing the vessels to better than 10_3
mmHg for at least 2 h and freezing them to the temperature of liquid nitrogen, a five-
fold stoichiometric amount of BrF5 was introduced into each vessel and the samples
were reacted at 600±5 °C for periods of 20 h. The O2 liberated by the reaction was
3. Experimental methods
33
converted to CO2 by cycling over hot graphite in the presence of a platinum catalyst and
the CO2 was measured in a Finnigan Delta S mass spectrometer versus a laboratory
standard CO2 prepared from very pure Carrara marble, the isotopic compositions of
which, calibrated periodically versus NBS- 19 and NBS-201, are +2.45‰ (δ
13C versus
VPDB) and -2.45‰ (δ 18O versus VPDB). For these calibrations, NBS-19 isotopic
values were taken as +1.95‰ (δ13C) and -2.20‰ (δ
18O) and NBS-20 values as -1.06‰
(δ13C) and -4.14‰ (δ
18O). The reported δ 18O values of glass samples are the mean of
two consistent measurements of each sample; the standard deviation ranges between 0
and 0.2. Isotopic results are reported in the usual delta terminology versus the VSMOW
isotopic standard, delta being defined as follows:
δ = [(Rsample - Rstandard)/Rstandard] x 1000
where R is the ratio between the heavy and the light isotope.
1 NBS 20 standard material is no more available from a very long time. In the laboratory where the
analyses were performed there are reasonable amounts of NBS 19 and NBS 20 inherited from various
research centers where the Prof. A. Longinelli has worked through time. However, NBS 20 is now
consumed, raising the serious problem of finding a reliable reference material to calibrate the laboratory
standard. The existing LSVEC is isotopically too far from the Carrara laboratory standard, both oxygen
and carbon, and is consequently unreliable for calibration purposes
4. Raw materials in glass production: the textural, chemical and mineralogical study
CHAPTER 4
RAW MATERIALS IN GLASS PRODUCTION: THE TEXTURAL, CHEMICAL AND MINERALOGICAL STUDY
4.1 Pre-Roman and Roman Glass from Adria
The textural, chemical and mineralogical and characterization of the 68 glass findings
coming from Adria are reported in the following. As detailed in section 2.1, the sample
set is mostly composed of Roman glass (1st-3nd century AD), although Pre-Roman
objects (oinokai, aryballoi and amphoriskoi) are also present. All Pre- Roman artefacts
and the majority of Roman objects are intentionally coloured; some of them are
completely transparent, some completely opaque and some have a transparent body
with opaque decorations. As concerns the last type, the transparent body and the glassy
matrix of the decorations were analyzed separately, for a total of 89 bulk chemical
analyses (Table B, Appendix B).
4.1.1 Textural characterization
OM and SEM analyses on polished sections revealed that all Roman transparent glasses
are homogeneous, nor newly formed neither residual phases were recognized. On the
other hand the seven Pre-Roman samples, all core-formed, show numerous inclusions in
the transparent blue body, discussed in the following sections.
4.1.1.1 Residual and newly formed phases
On the basis of the microtextural examinations, the inclusions observed in core-formed
glasses can be distinct into residual and newly formed phases. The formers have not a
regular geometrical shape, usually appear like drops dispersed into the glassy matrix or
crystal partially dissolved, with rounded edges (Fig. 4.1.1); the latters have instead
euhedral habit, with well-formed faces (Fig. 4.1.2). Residual phases have been
recognized in all the seven core-formed glasses, while newly formed crystals have been
observed in four of them (AD-NF-1; AD-NF-2; AD-NF-6; AD-NF-7). Semiquantitative
35
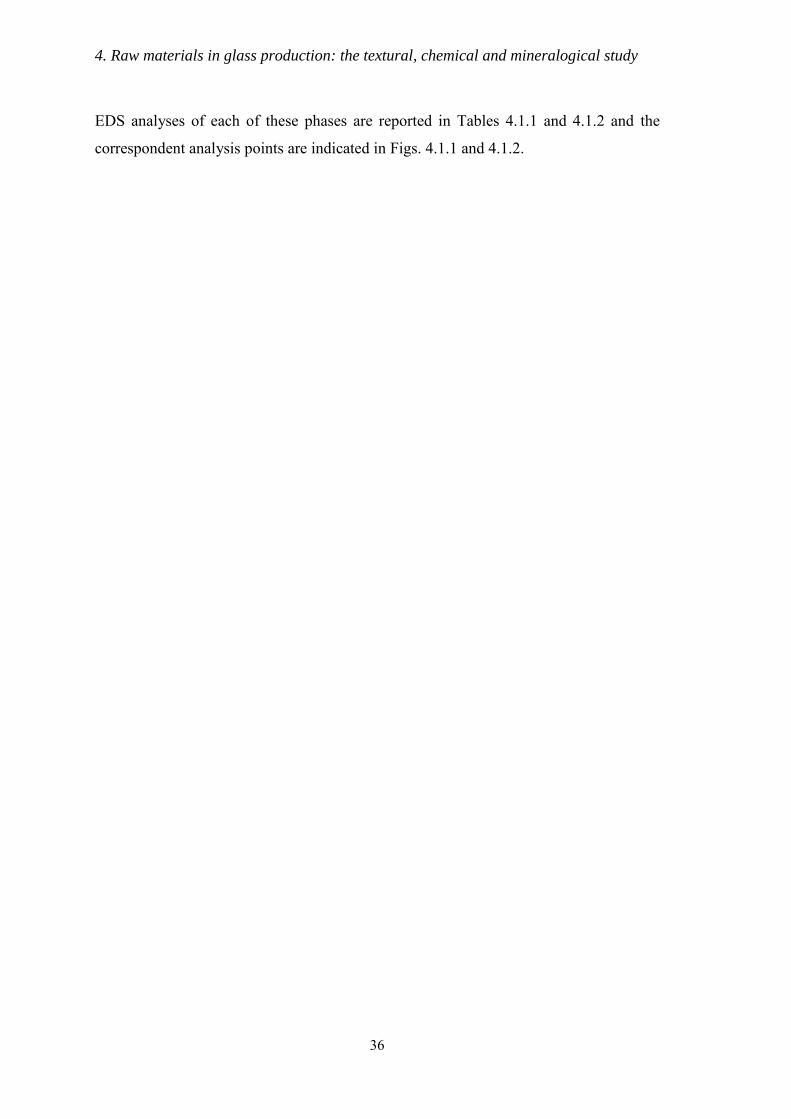
4. Raw materials in glass production: the textural, chemical and mineralogical study
36
EDS analyses of each of these phases are reported in Tables 4.1.1 and 4.1.2 and the
correspondent analysis points are indicated in Figs. 4.1.1 and 4.1.2.
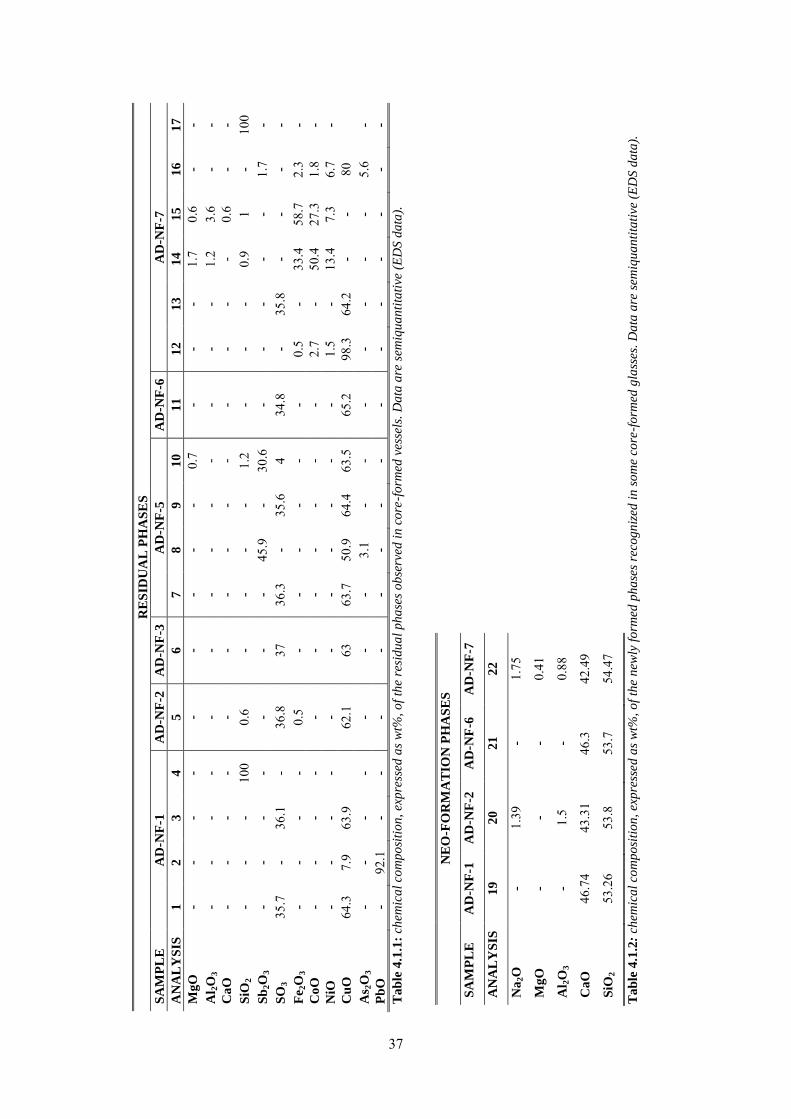
RE
SID
UA
L P
HA
SE
S
SA
MP
LE
A
D-N
F-1
A
D-N
F-2
A
D-N
F-3
A
D-N
F-5
A
D-N
F-6
A
D-N
F-7
AN
AL
YS
IS
1
2
3
4
5
6
7
8
9
10
11
12
13
14
15
16
17
Mg
O
- -
- -
- -
- -
- 0.
7 -
- -
1.7
0.6
- -
Al 2
O3
- -
- -
- -
- -
- -
- -
- 1.
2 3.
6 -
-
Ca
O
- -
- -
- -
- -
- -
- -
- -
0.6
- -
SiO
2
- -
- 10
0 0.
6 -
- -
- 1.
2 -
- -
0.9
1 -
100
Sb
2O
3
- -
- -
- -
- 45
.9
- 30
.6
- -
- -
- 1.
7 -
SO
3
35.7
-
36.1
-
36.8
37
36
.3
- 35
.6
4 34
.8
- 35
.8
- -
- -
Fe 2
O3
- -
- -
0.5
- -
- -
- -
0.5
- 33
.4
58.7
2.
3 -
Co
O
- -
- -
- -
- -
- -
- 2.
7 -
50.4
27
.3
1.8
-
NiO
-
- -
- -
- -
- -
- -
1.5
- 13
.4
7.3
6.7
-
Cu
O
64.3
7.
9 63
.9
62
.1
63
63.7
50
.9
64.4
63
.5
65.2
98
.3
64.2
-
- 80
As 2
O3
- -
- -
- -
- 3.
1 -
- -
- -
- -
5.6
-
Pb
O
- 92
.1
- -
- -
- -
- -
- -
- -
- -
-
Ta
ble
4.1
.1: c
hem
ica
l co
mp
osi
tio
n,
exp
ress
ed a
s w
t%,
of
the
resi
du
al
ph
ase
s o
bse
rved
in
co
re-f
orm
ed v
esse
ls.
Da
ta a
re s
emiq
ua
nti
tati
ve (
ED
S d
ata
).
N
EO
-FO
RM
AT
ION
PH
AS
ES
SA
MP
LE
A
D-N
F-1
A
D-N
F-2
A
D-N
F-6
A
D-N
F-7
AN
AL
YS
IS
19
20
21
22
Na
2O
-
1.39
-
1.75
Mg
O
- -
- 0.
41
Al 2
O3
- 1.
5 -
0.88
Ca
O
46.7
4 43
.31
46.3
42
.49
SiO
2
53.2
6 53
.8
53.7
54
.47
Ta
ble
4.1
.2:
chem
ica
l co
mp
osi
tio
n,
exp
ress
ed
as
wt%
, o
f th
e n
ewly
fo
rmed
ph
ase
s re
cog
niz
ed i
n s
om
e co
re-f
orm
ed g
lass
es.
Da
ta a
re s
emiq
ua
nti
tati
ve (
ED
S d
ata
).
37
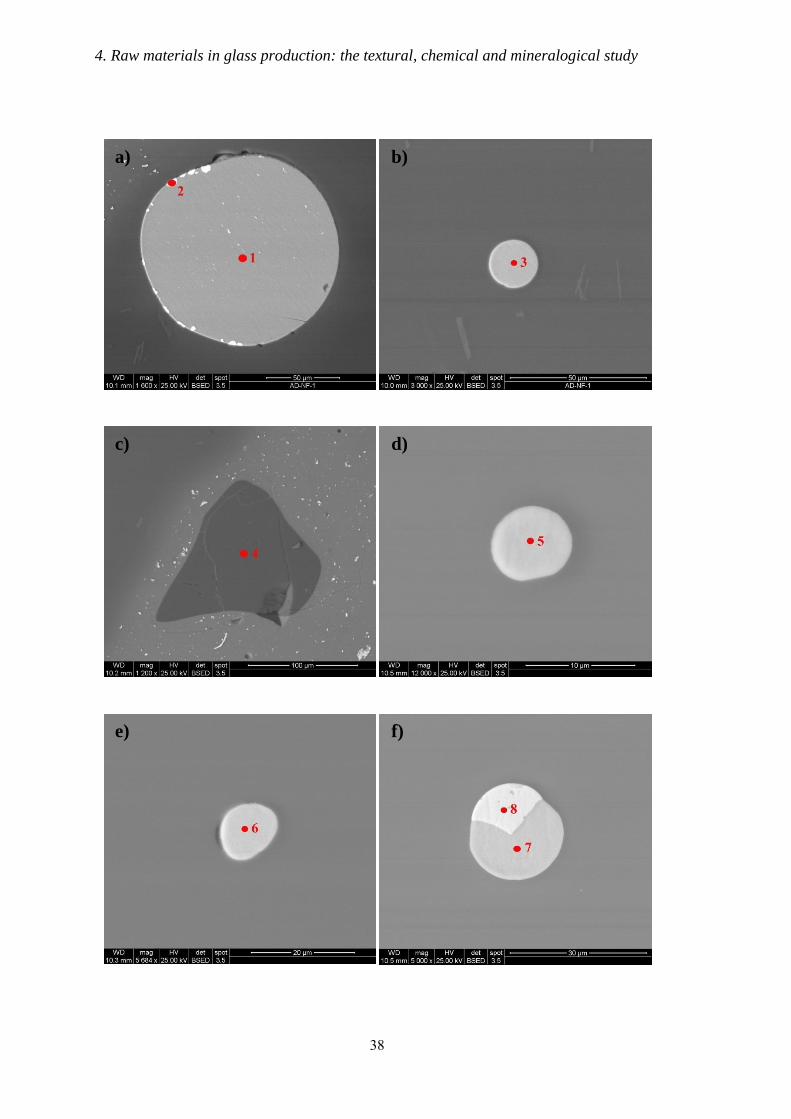
4. Raw materials in glass production: the textural, chemical and mineralogical study
38
a) b)
c) d)
e) f)
4. Raw materials in glass production: the textural, chemical and mineralogical study
39
17
g) h)
i) l)
m) n)
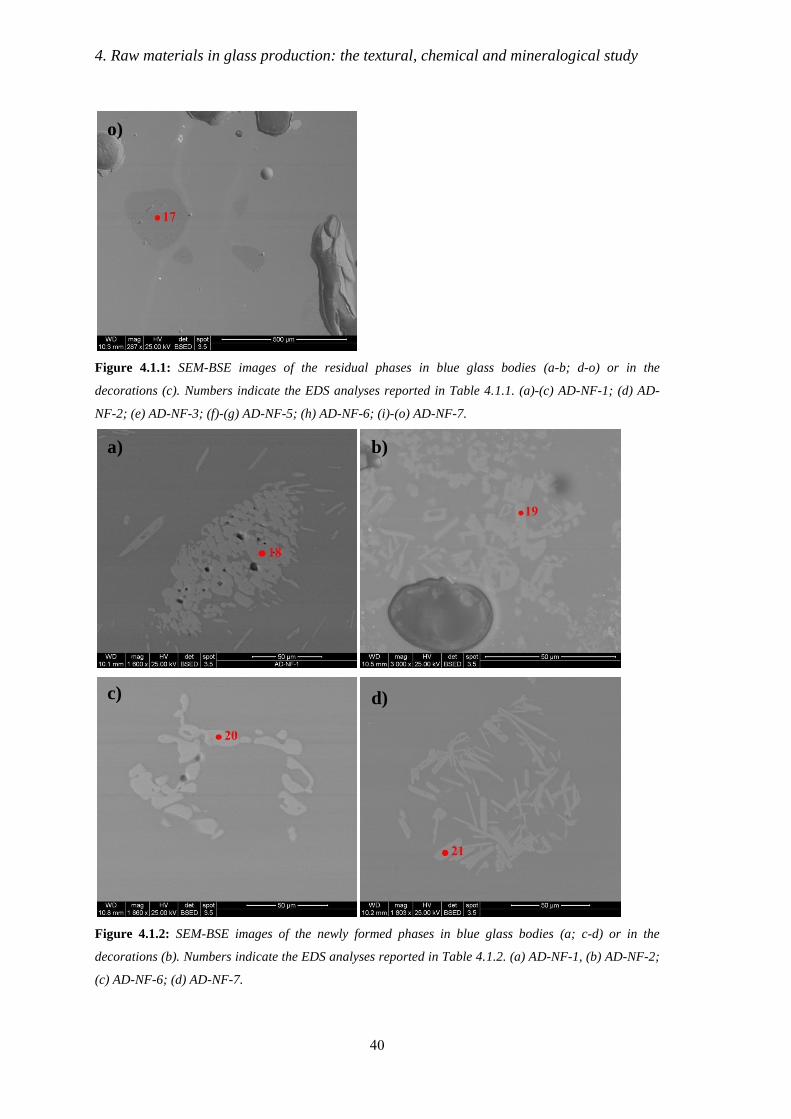
4. Raw materials in glass production: the textural, chemical and mineralogical study
40
Figure 4.1.1: SEM-BSE images of the residual phases in blue glass bodies (a-b; d-o) or in the
decorations (c). Numbers indicate the EDS analyses reported in Table 4.1.1. (a)-(c) AD-NF-1; (d) AD-
NF-2; (e) AD-NF-3; (f)-(g) AD-NF-5; (h) AD-NF-6; (i)-(o) AD-NF-7.
Figure 4.1.2: SEM-BSE images of the newly formed phases in blue glass bodies (a; c-d) or in the
decorations (b). Numbers indicate the EDS analyses reported in Table 4.1.2. (a) AD-NF-1, (b) AD-NF-2;
(c) AD-NF-6; (d) AD-NF-7.
o)
a) b)
c) d)
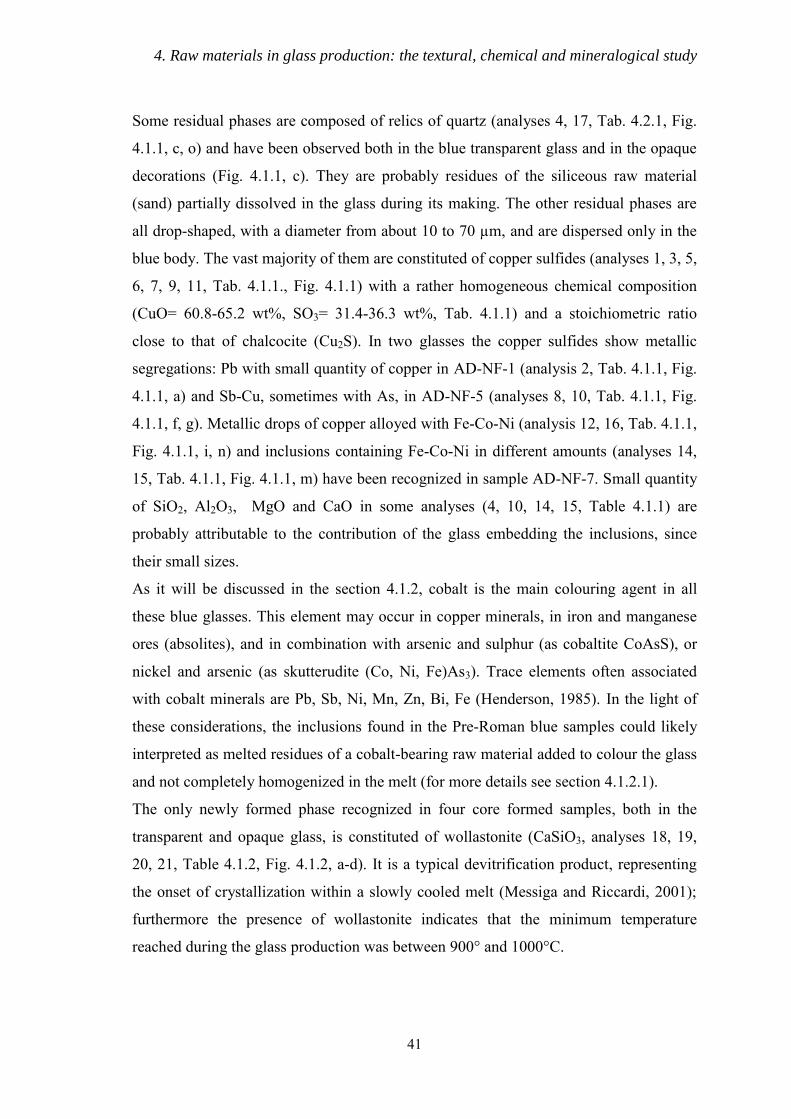
4. Raw materials in glass production: the textural, chemical and mineralogical study
41
Some residual phases are composed of relics of quartz (analyses 4, 17, Tab. 4.2.1, Fig.
4.1.1, c, o) and have been observed both in the blue transparent glass and in the opaque
decorations (Fig. 4.1.1, c). They are probably residues of the siliceous raw material
(sand) partially dissolved in the glass during its making. The other residual phases are
all drop-shaped, with a diameter from about 10 to 70 µm, and are dispersed only in the
blue body. The vast majority of them are constituted of copper sulfides (analyses 1, 3, 5,
6, 7, 9, 11, Tab. 4.1.1., Fig. 4.1.1) with a rather homogeneous chemical composition
(CuO= 60.8-65.2 wt%, SO3= 31.4-36.3 wt%, Tab. 4.1.1) and a stoichiometric ratio
close to that of chalcocite (Cu2S). In two glasses the copper sulfides show metallic
segregations: Pb with small quantity of copper in AD-NF-1 (analysis 2, Tab. 4.1.1, Fig.
4.1.1, a) and Sb-Cu, sometimes with As, in AD-NF-5 (analyses 8, 10, Tab. 4.1.1, Fig.
4.1.1, f, g). Metallic drops of copper alloyed with Fe-Co-Ni (analysis 12, 16, Tab. 4.1.1,
Fig. 4.1.1, i, n) and inclusions containing Fe-Co-Ni in different amounts (analyses 14,
15, Tab. 4.1.1, Fig. 4.1.1, m) have been recognized in sample AD-NF-7. Small quantity
of SiO2, Al2O3, MgO and CaO in some analyses (4, 10, 14, 15, Table 4.1.1) are
probably attributable to the contribution of the glass embedding the inclusions, since
their small sizes.
As it will be discussed in the section 4.1.2, cobalt is the main colouring agent in all
these blue glasses. This element may occur in copper minerals, in iron and manganese
ores (absolites), and in combination with arsenic and sulphur (as cobaltite CoAsS), or
nickel and arsenic (as skutterudite (Co, Ni, Fe)As3). Trace elements often associated
with cobalt minerals are Pb, Sb, Ni, Mn, Zn, Bi, Fe (Henderson, 1985). In the light of
these considerations, the inclusions found in the Pre-Roman blue samples could likely
interpreted as melted residues of a cobalt-bearing raw material added to colour the glass
and not completely homogenized in the melt (for more details see section 4.1.2.1).
The only newly formed phase recognized in four core formed samples, both in the
transparent and opaque glass, is constituted of wollastonite (CaSiO3, analyses 18, 19,
20, 21, Table 4.1.2, Fig. 4.1.2, a-d). It is a typical devitrification product, representing
the onset of crystallization within a slowly cooled melt (Messiga and Riccardi, 2001);
furthermore the presence of wollastonite indicates that the minimum temperature
reached during the glass production was between 900° and 1000°C.
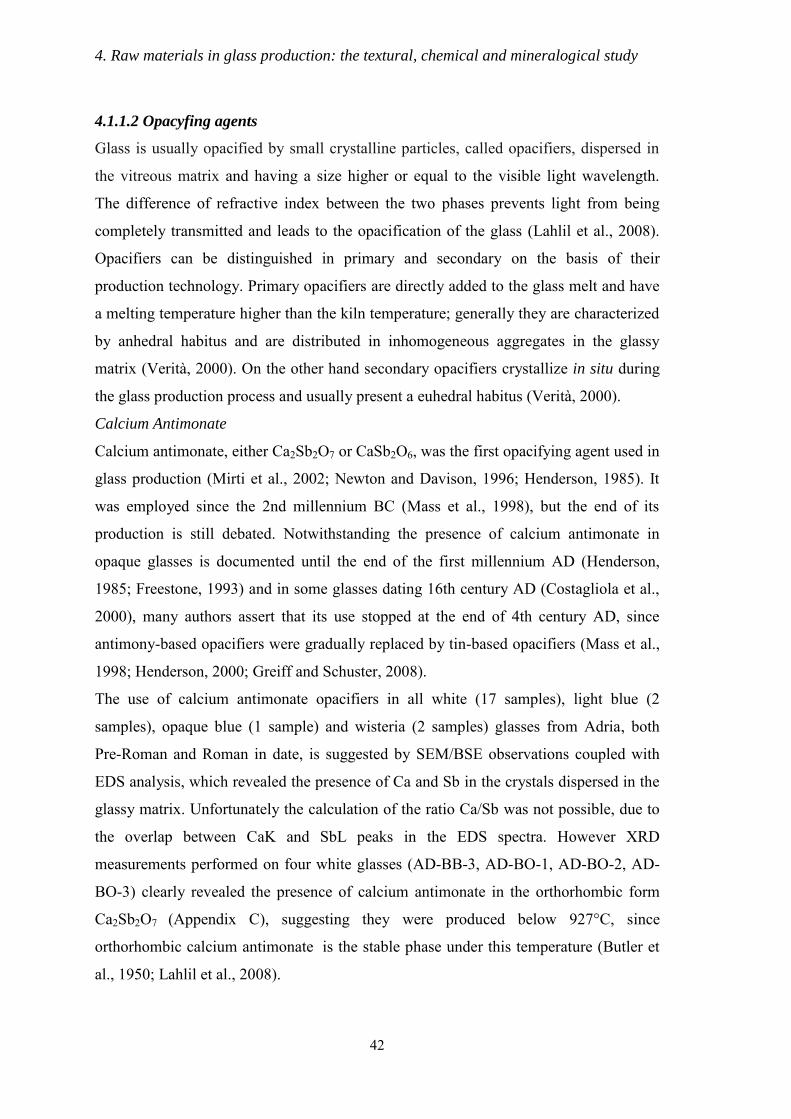
4. Raw materials in glass production: the textural, chemical and mineralogical study
42
4.1.1.2 Opacyfing agents
Glass is usually opacified by small crystalline particles, called opacifiers, dispersed in
the vitreous matrix and having a size higher or equal to the visible light wavelength.
The difference of refractive index between the two phases prevents light from being
completely transmitted and leads to the opacification of the glass (Lahlil et al., 2008).
Opacifiers can be distinguished in primary and secondary on the basis of their
production technology. Primary opacifiers are directly added to the glass melt and have
a melting temperature higher than the kiln temperature; generally they are characterized
by anhedral habitus and are distributed in inhomogeneous aggregates in the glassy
matrix (Verità, 2000). On the other hand secondary opacifiers crystallize in situ during
the glass production process and usually present a euhedral habitus (Verità, 2000).
Calcium Antimonate
Calcium antimonate, either Ca2Sb2O7 or CaSb2O6, was the first opacifying agent used in
glass production (Mirti et al., 2002; Newton and Davison, 1996; Henderson, 1985). It
was employed since the 2nd millennium BC (Mass et al., 1998), but the end of its
production is still debated. Notwithstanding the presence of calcium antimonate in
opaque glasses is documented until the end of the first millennium AD (Henderson,
1985; Freestone, 1993) and in some glasses dating 16th century AD (Costagliola et al.,
2000), many authors assert that its use stopped at the end of 4th century AD, since
antimony-based opacifiers were gradually replaced by tin-based opacifiers (Mass et al.,
1998; Henderson, 2000; Greiff and Schuster, 2008).
The use of calcium antimonate opacifiers in all white (17 samples), light blue (2
samples), opaque blue (1 sample) and wisteria (2 samples) glasses from Adria, both
Pre-Roman and Roman in date, is suggested by SEM/BSE observations coupled with
EDS analysis, which revealed the presence of Ca and Sb in the crystals dispersed in the
glassy matrix. Unfortunately the calculation of the ratio Ca/Sb was not possible, due to
the overlap between CaK and SbL peaks in the EDS spectra. However XRD
measurements performed on four white glasses (AD-BB-3, AD-BO-1, AD-BO-2, AD-
BO-3) clearly revealed the presence of calcium antimonate in the orthorhombic form
Ca2Sb2O7 (Appendix C), suggesting they were produced below 927°C, since
orthorhombic calcium antimonate is the stable phase under this temperature (Butler et
al., 1950; Lahlil et al., 2008).
4. Raw materials in glass production: the textural, chemical and mineralogical study
43
As shown in Figg. 4.1.3, a, b, the microstructure of white and wisteria glasses (AD-BO-
2, AD-P-1) is characterized by a homogeneous distribution of small geometrical crystals
(size 1-5 μm,), randomly dispersed in a vitreous matrix, with several aggregates of
various size (from 5 to 50 μm). On the contrary, opacifiers in light blue and opaque blue
glass show different microtextures: they are partially dissolved into the glassy matrix
and lower in number than in white and wisteria glasses (Fig. 4.1.3, c), suggesting a
different production technology.
Figure 4.1.3: SEM-BSE images of calcium antimonate opacifiers (lighter grey) embedded in a glassy
matrix (darker grey). (a)-(b) white and wisteria glass (AD-BO-2, AD-P-1); (c) light blue glass (AD-NF-
1).
As reported in many studies (Bimson, 1983; Lahlil et al., 2006; Lahlil et al., 2008;
Lahlil et al., 2010 a, b), the euhedral shape of calcium antimonate in white/wisteria
glass suggests that it is a secondary opacifier, precipitated in situ from antimony and
calcium raw materials separately introduced into the batch. The light blue/blue glass
was likely obtained by adding an opaque white glass, previously produced, to a
transparent light blue/blue glass, as already observed by Tonietto, (2010) for paleo-
Christian glass mosaics.
Lead and Lead-Tin Antimonate
Lead antimonate (Pb2Sb2O7) was the main yellow opacifying colourant in ancient
glasses and glazes from the 15th BC to the 4th century AD (Brill, 1988; Mass et al.,
1998). The natural Pb2Sb2O7 is the mineral bindheimite, also known as Naples yellow
(Mass et al., 1998). For synthetic lead antimonate different raw materials have been
hypothesized; Mass et al. (2002) suggested that both lead and antimony originate from
the same raw material, such as antimonal litharge from the cupellation of antimonal
a) b) c)
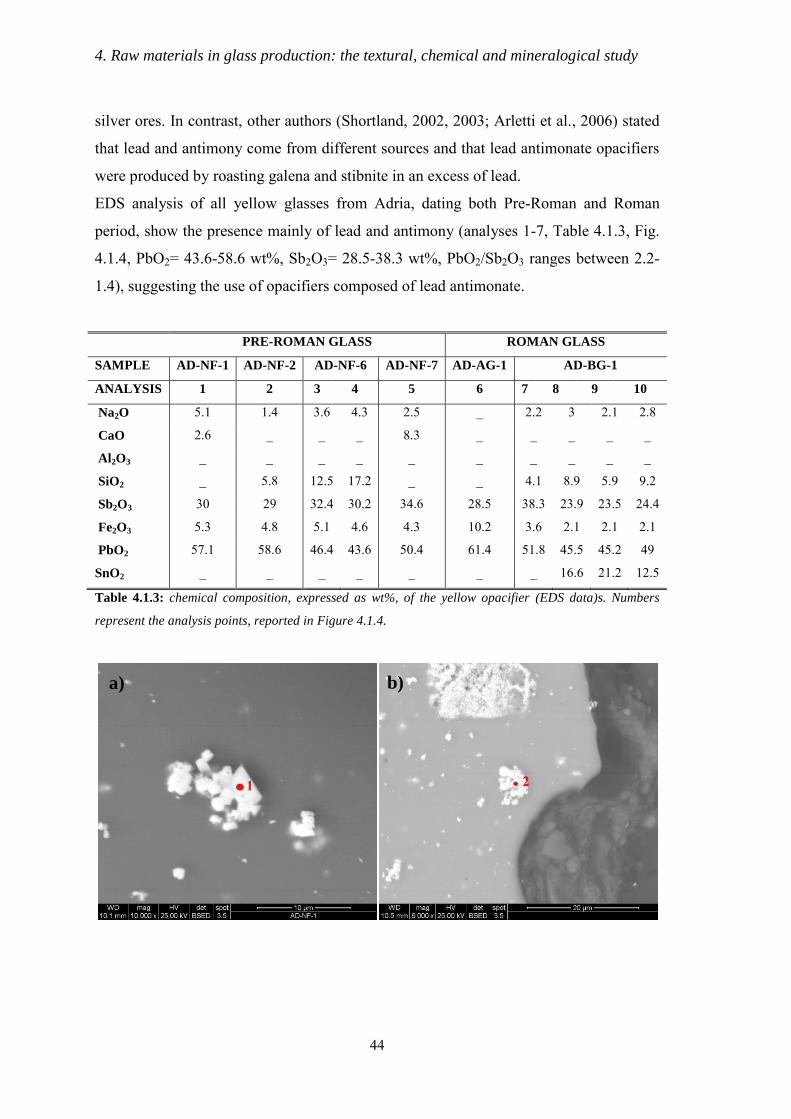
4. Raw materials in glass production: the textural, chemical and mineralogical study
44
silver ores. In contrast, other authors (Shortland, 2002, 2003; Arletti et al., 2006) stated
that lead and antimony come from different sources and that lead antimonate opacifiers
were produced by roasting galena and stibnite in an excess of lead.
EDS analysis of all yellow glasses from Adria, dating both Pre-Roman and Roman
period, show the presence mainly of lead and antimony (analyses 1-7, Table 4.1.3, Fig.
4.1.4, PbO2= 43.6-58.6 wt%, Sb2O3= 28.5-38.3 wt%, PbO2/Sb2O3 ranges between 2.2-
1.4), suggesting the use of opacifiers composed of lead antimonate.
PRE-ROMAN GLASS ROMAN GLASS
SAMPLE AD-NF-1 AD-NF-2 AD-NF-6 AD-NF-7 AD-AG-1 AD-BG-1
ANALYSIS 1 2 3 4 5 6 7 8 9 10
Na2O 5.1 1.4 3.6 4.3 2.5 _ 2.2 3 2.1 2.8
CaO 2.6 _ _ _ 8.3 _ _ _ _ _
Al2O3 _ _ _ _ _ _ _ _ _ _
SiO2 _ 5.8 12.5 17.2 _ _ 4.1 8.9 5.9 9.2
Sb2O3 30 29 32.4 30.2 34.6 28.5 38.3 23.9 23.5 24.4
Fe2O3 5.3 4.8 5.1 4.6 4.3 10.2 3.6 2.1 2.1 2.1
PbO2 57.1 58.6 46.4 43.6 50.4 61.4 51.8 45.5 45.2 49
SnO2 _ _ _ _ _ _ _ 16.6 21.2 12.5
Table 4.1.3: chemical composition, expressed as wt%, of the yellow opacifier (EDS data)s. Numbers
represent the analysis points, reported in Figure 4.1.4.
a) b)
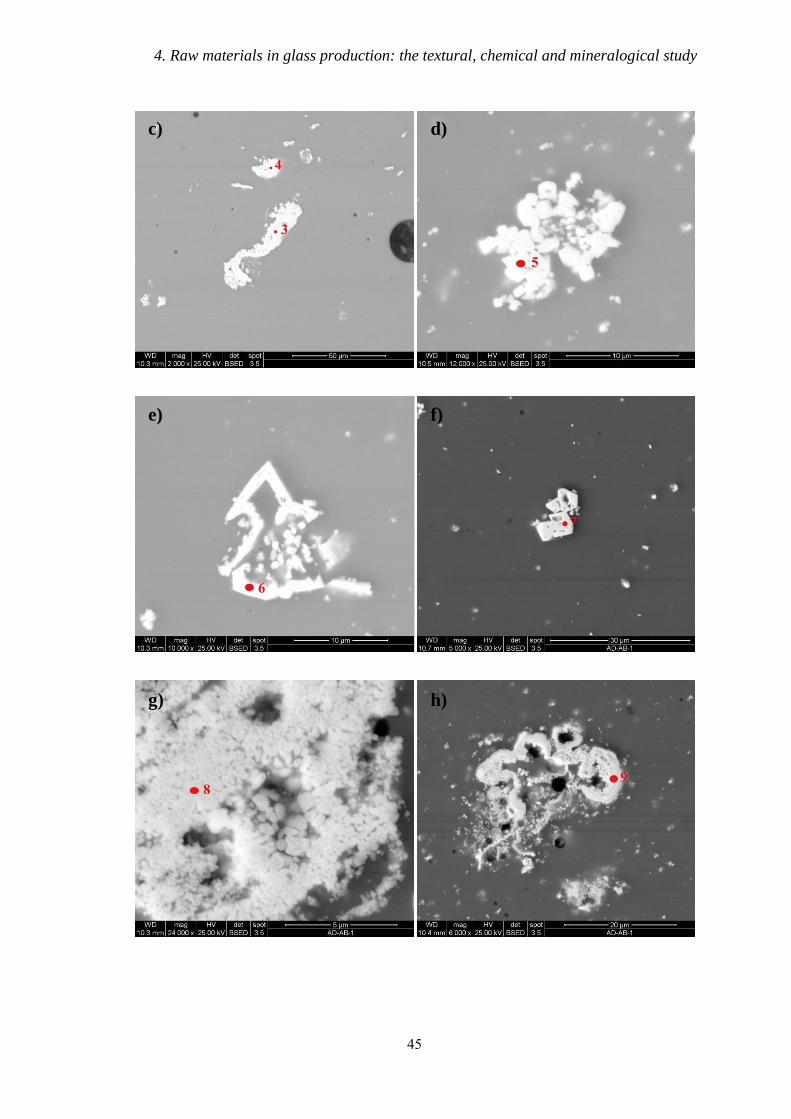
4. Raw materials in glass production: the textural, chemical and mineralogical study
45
c) d)
e) f)
g) h)
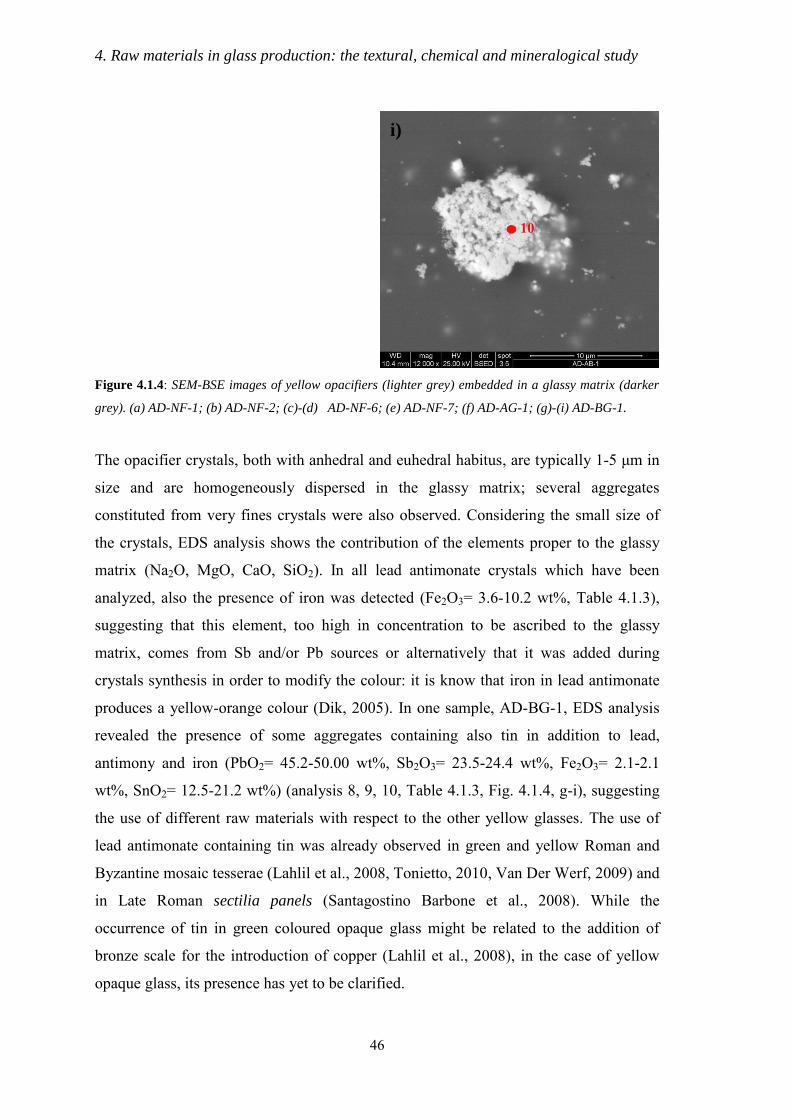
4. Raw materials in glass production: the textural, chemical and mineralogical study
46
Figure 4.1.4: SEM-BSE images of yellow opacifiers (lighter grey) embedded in a glassy matrix (darker
grey). (a) AD-NF-1; (b) AD-NF-2; (c)-(d) AD-NF-6; (e) AD-NF-7; (f) AD-AG-1; (g)-(i) AD-BG-1.
The opacifier crystals, both with anhedral and euhedral habitus, are typically 1-5 μm in
size and are homogeneously dispersed in the glassy matrix; several aggregates
constituted from very fines crystals were also observed. Considering the small size of
the crystals, EDS analysis shows the contribution of the elements proper to the glassy
matrix (Na2O, MgO, CaO, SiO2). In all lead antimonate crystals which have been
analyzed, also the presence of iron was detected (Fe2O3= 3.6-10.2 wt%, Table 4.1.3),
suggesting that this element, too high in concentration to be ascribed to the glassy
matrix, comes from Sb and/or Pb sources or alternatively that it was added during
crystals synthesis in order to modify the colour: it is know that iron in lead antimonate
produces a yellow-orange colour (Dik, 2005). In one sample, AD-BG-1, EDS analysis
revealed the presence of some aggregates containing also tin in addition to lead,
antimony and iron (PbO2= 45.2-50.00 wt%, Sb2O3= 23.5-24.4 wt%, Fe2O3= 2.1-2.1
wt%, SnO2= 12.5-21.2 wt%) (analysis 8, 9, 10, Table 4.1.3, Fig. 4.1.4, g-i), suggesting
the use of different raw materials with respect to the other yellow glasses. The use of
lead antimonate containing tin was already observed in green and yellow Roman and
Byzantine mosaic tesserae (Lahlil et al., 2008, Tonietto, 2010, Van Der Werf, 2009) and
in Late Roman sectilia panels (Santagostino Barbone et al., 2008). While the
occurrence of tin in green coloured opaque glass might be related to the addition of
bronze scale for the introduction of copper (Lahlil et al., 2008), in the case of yellow
opaque glass, its presence has yet to be clarified.
i)
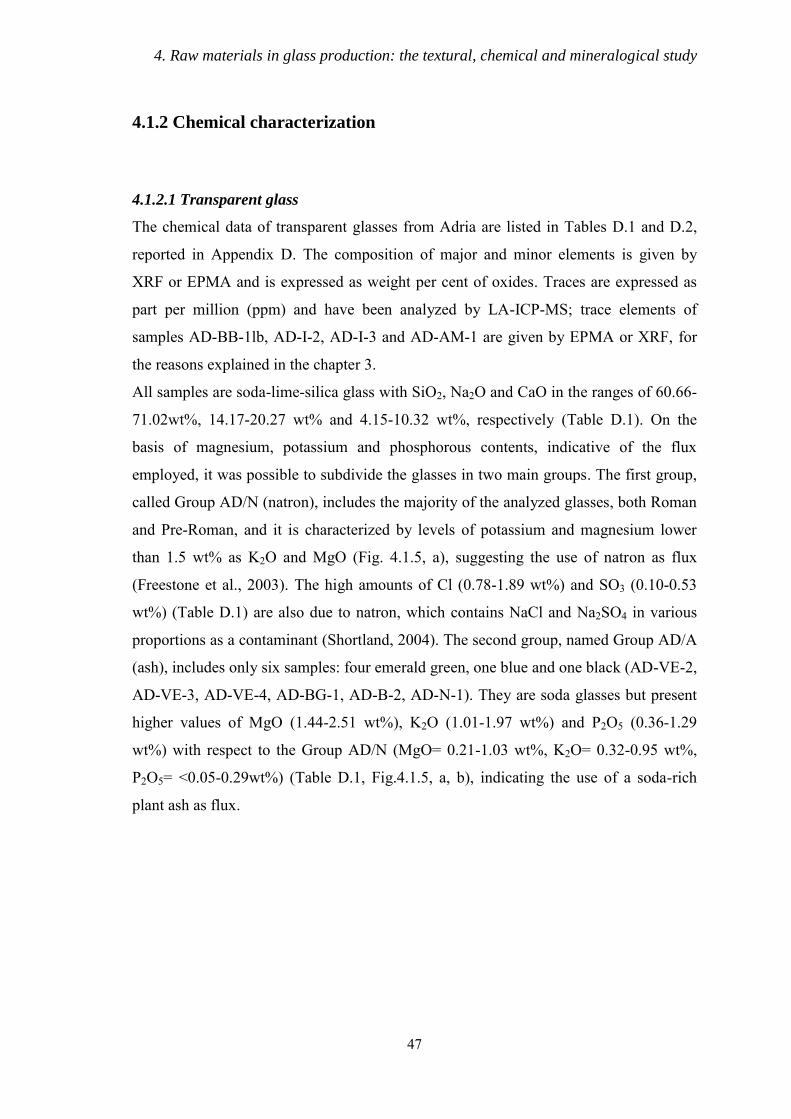
4. Raw materials in glass production: the textural, chemical and mineralogical study
47
4.1.2 Chemical characterization
4.1.2.1 Transparent glass
The chemical data of transparent glasses from Adria are listed in Tables D.1 and D.2,
reported in Appendix D. The composition of major and minor elements is given by
XRF or EPMA and is expressed as weight per cent of oxides. Traces are expressed as
part per million (ppm) and have been analyzed by LA-ICP-MS; trace elements of
samples AD-BB-1lb, AD-I-2, AD-I-3 and AD-AM-1 are given by EPMA or XRF, for
the reasons explained in the chapter 3.
All samples are soda-lime-silica glass with SiO2, Na2O and CaO in the ranges of 60.66-
71.02wt%, 14.17-20.27 wt% and 4.15-10.32 wt%, respectively (Table D.1). On the
basis of magnesium, potassium and phosphorous contents, indicative of the flux
employed, it was possible to subdivide the glasses in two main groups. The first group,
called Group AD/N (natron), includes the majority of the analyzed glasses, both Roman
and Pre-Roman, and it is characterized by levels of potassium and magnesium lower
than 1.5 wt% as K2O and MgO (Fig. 4.1.5, a), suggesting the use of natron as flux
(Freestone et al., 2003). The high amounts of Cl (0.78-1.89 wt%) and SO3 (0.10-0.53
wt%) (Table D.1) are also due to natron, which contains NaCl and Na2SO4 in various
proportions as a contaminant (Shortland, 2004). The second group, named Group AD/A
(ash), includes only six samples: four emerald green, one blue and one black (AD-VE-2,
AD-VE-3, AD-VE-4, AD-BG-1, AD-B-2, AD-N-1). They are soda glasses but present
higher values of MgO (1.44-2.51 wt%), K2O (1.01-1.97 wt%) and P2O5 (0.36-1.29
wt%) with respect to the Group AD/N (MgO= 0.21-1.03 wt%, K2O= 0.32-0.95 wt%,
P2O5= <0.05-0.29wt%) (Table D.1, Fig.4.1.5, a, b), indicating the use of a soda-rich
plant ash as flux.
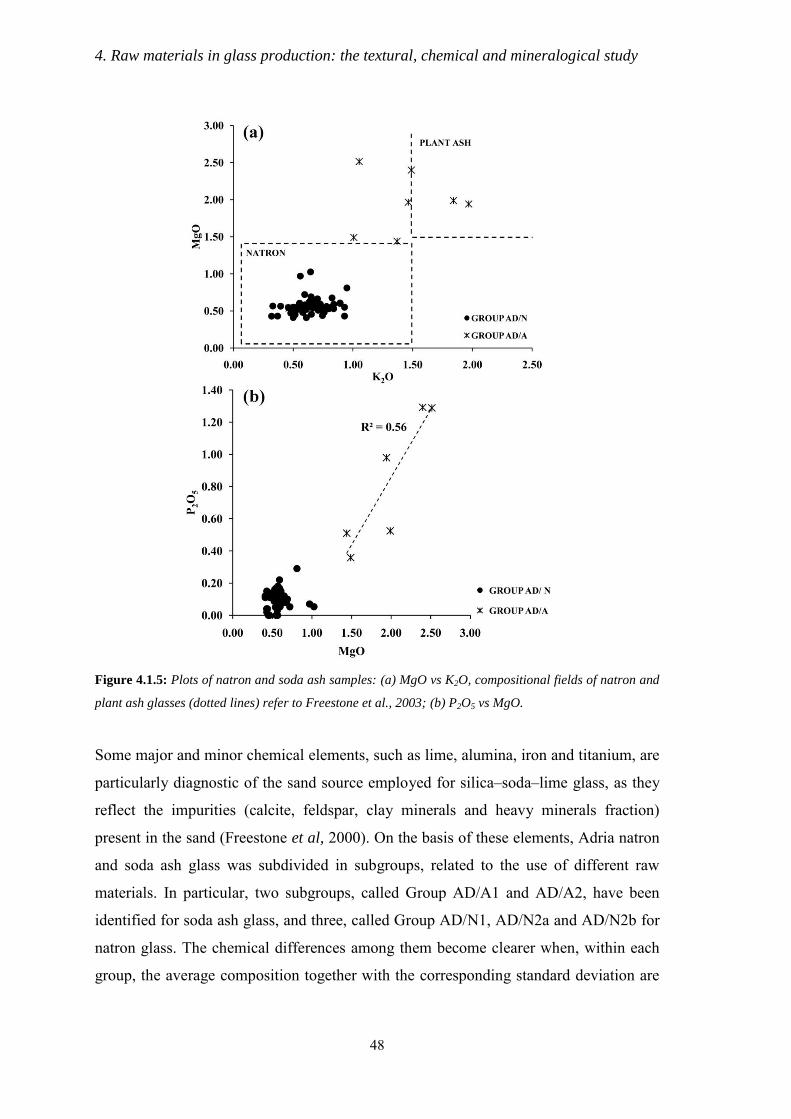
4. Raw materials in glass production: the textural, chemical and mineralogical study
48
Figure 4.1.5: Plots of natron and soda ash samples: (a) MgO vs K2O, compositional fields of natron and
plant ash glasses (dotted lines) refer to Freestone et al., 2003; (b) P2O5 vs MgO.
Some major and minor chemical elements, such as lime, alumina, iron and titanium, are
particularly diagnostic of the sand source employed for silica–soda–lime glass, as they
reflect the impurities (calcite, feldspar, clay minerals and heavy minerals fraction)
present in the sand (Freestone et al, 2000). On the basis of these elements, Adria natron
and soda ash glass was subdivided in subgroups, related to the use of different raw
materials. In particular, two subgroups, called Group AD/A1 and AD/A2, have been
identified for soda ash glass, and three, called Group AD/N1, AD/N2a and AD/N2b for
natron glass. The chemical differences among them become clearer when, within each
group, the average composition together with the corresponding standard deviation are
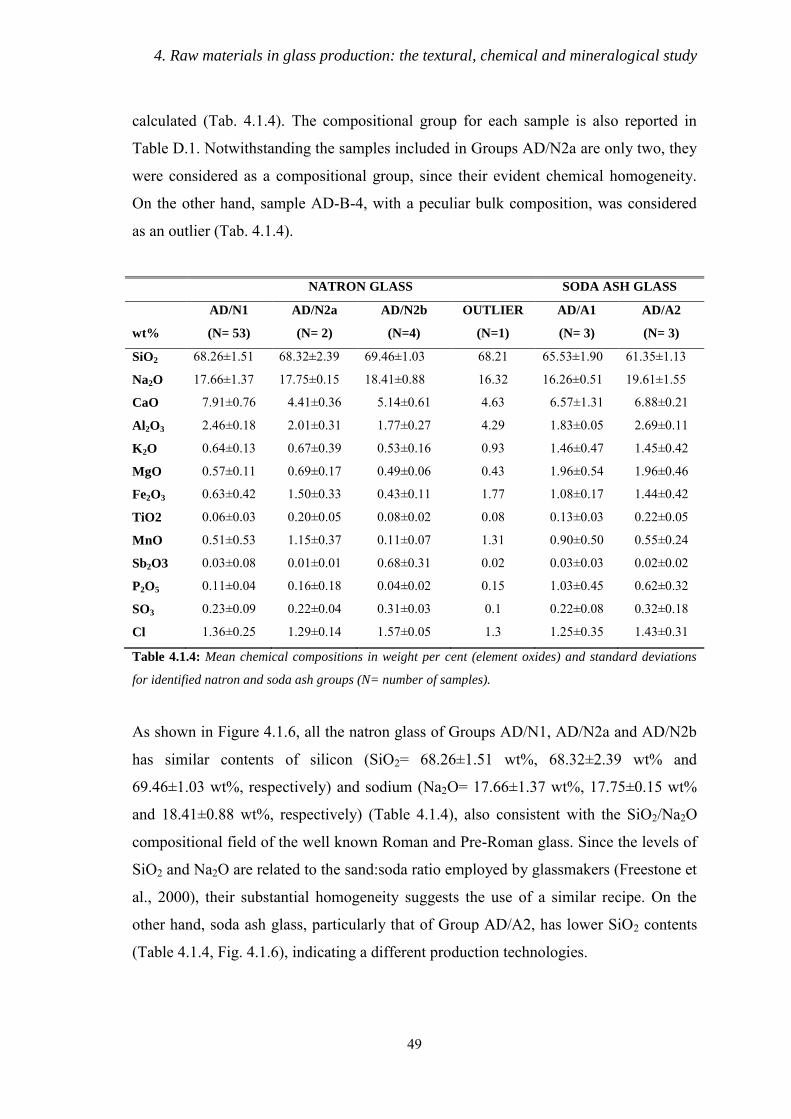
4. Raw materials in glass production: the textural, chemical and mineralogical study
49
calculated (Tab. 4.1.4). The compositional group for each sample is also reported in
Table D.1. Notwithstanding the samples included in Groups AD/N2a are only two, they
were considered as a compositional group, since their evident chemical homogeneity.
On the other hand, sample AD-B-4, with a peculiar bulk composition, was considered
as an outlier (Tab. 4.1.4).
NATRON GLASS SODA ASH GLASS
AD/N1 AD/N2a AD/N2b OUTLIER AD/A1 AD/A2
wt% (N= 53) (N= 2) (N=4) (N=1) (N= 3) (N= 3)
SiO2 68.26±1.51 68.32±2.39 69.46±1.03 68.21 65.53±1.90 61.35±1.13
Na2O 17.66±1.37 17.75±0.15 18.41±0.88 16.32 16.26±0.51 19.61±1.55
CaO 7.91±0.76 4.41±0.36 5.14±0.61 4.63 6.57±1.31 6.88±0.21
Al2O3 2.46±0.18 2.01±0.31 1.77±0.27 4.29 1.83±0.05 2.69±0.11
K2O 0.64±0.13 0.67±0.39 0.53±0.16 0.93 1.46±0.47 1.45±0.42
MgO 0.57±0.11 0.69±0.17 0.49±0.06 0.43 1.96±0.54 1.96±0.46
Fe2O3 0.63±0.42 1.50±0.33 0.43±0.11 1.77 1.08±0.17 1.44±0.42
TiO2 0.06±0.03 0.20±0.05 0.08±0.02 0.08 0.13±0.03 0.22±0.05
MnO 0.51±0.53 1.15±0.37 0.11±0.07 1.31 0.90±0.50 0.55±0.24
Sb2O3 0.03±0.08 0.01±0.01 0.68±0.31 0.02 0.03±0.03 0.02±0.02
P2O5 0.11±0.04 0.16±0.18 0.04±0.02 0.15 1.03±0.45 0.62±0.32
SO3 0.23±0.09 0.22±0.04 0.31±0.03 0.1 0.22±0.08 0.32±0.18
Cl 1.36±0.25 1.29±0.14 1.57±0.05 1.3 1.25±0.35 1.43±0.31
Table 4.1.4: Mean chemical compositions in weight per cent (element oxides) and standard deviations
for identified natron and soda ash groups (N= number of samples).
As shown in Figure 4.1.6, all the natron glass of Groups AD/N1, AD/N2a and AD/N2b
has similar contents of silicon (SiO2= 68.26±1.51 wt%, 68.32±2.39 wt% and
69.46±1.03 wt%, respectively) and sodium (Na2O= 17.66±1.37 wt%, 17.75±0.15 wt%
and 18.41±0.88 wt%, respectively) (Table 4.1.4), also consistent with the SiO2/Na2O
compositional field of the well known Roman and Pre-Roman glass. Since the levels of
SiO2 and Na2O are related to the sand:soda ratio employed by glassmakers (Freestone et
al., 2000), their substantial homogeneity suggests the use of a similar recipe. On the
other hand, soda ash glass, particularly that of Group AD/A2, has lower SiO2 contents
(Table 4.1.4, Fig. 4.1.6), indicating a different production technologies.
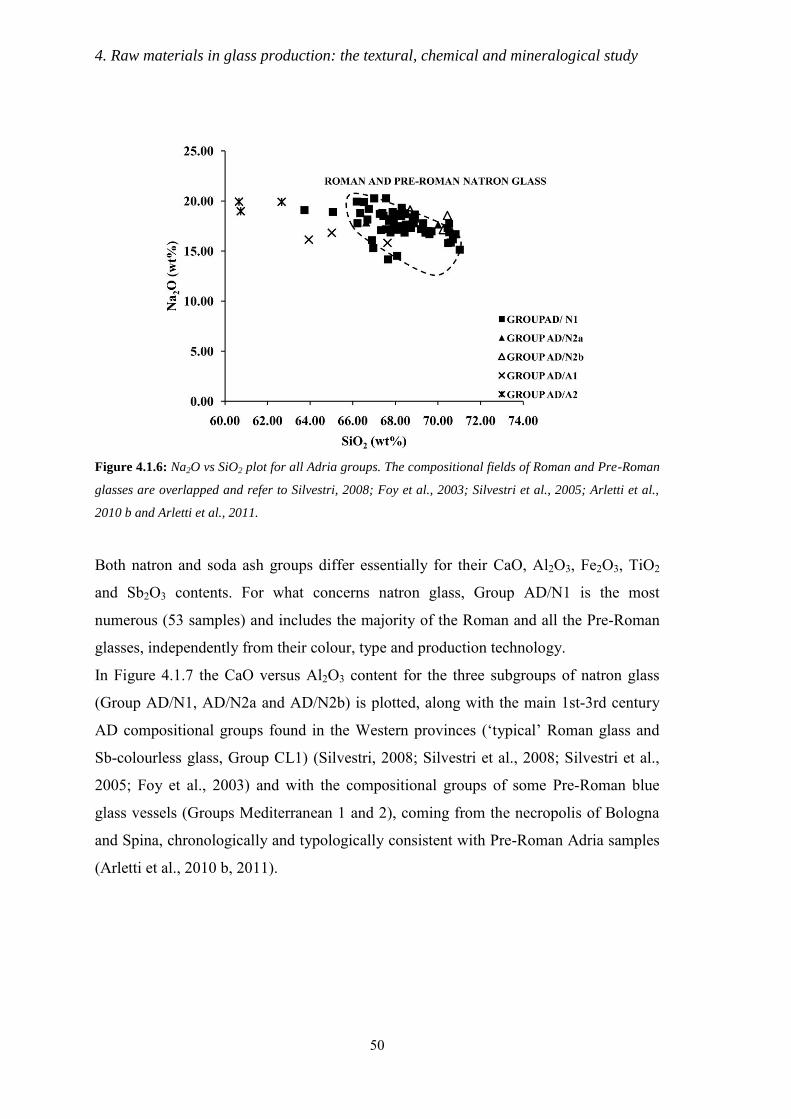
4. Raw materials in glass production: the textural, chemical and mineralogical study
50
Figure 4.1.6: Na2O vs SiO2 plot for all Adria groups. The compositional fields of Roman and Pre-Roman
glasses are overlapped and refer to Silvestri, 2008; Foy et al., 2003; Silvestri et al., 2005; Arletti et al.,
2010 b and Arletti et al., 2011.
Both natron and soda ash groups differ essentially for their CaO, Al2O3, Fe2O3, TiO2
and Sb2O3 contents. For what concerns natron glass, Group AD/N1 is the most
numerous (53 samples) and includes the majority of the Roman and all the Pre-Roman
glasses, independently from their colour, type and production technology.
In Figure 4.1.7 the CaO versus Al2O3 content for the three subgroups of natron glass
(Group AD/N1, AD/N2a and AD/N2b) is plotted, along with the main 1st-3rd century
AD compositional groups found in the Western provinces („typical‟ Roman glass and
Sb-colourless glass, Group CL1) (Silvestri, 2008; Silvestri et al., 2008; Silvestri et al.,
2005; Foy et al., 2003) and with the compositional groups of some Pre-Roman blue
glass vessels (Groups Mediterranean 1 and 2), coming from the necropolis of Bologna
and Spina, chronologically and typologically consistent with Pre-Roman Adria samples
(Arletti et al., 2010 b, 2011).
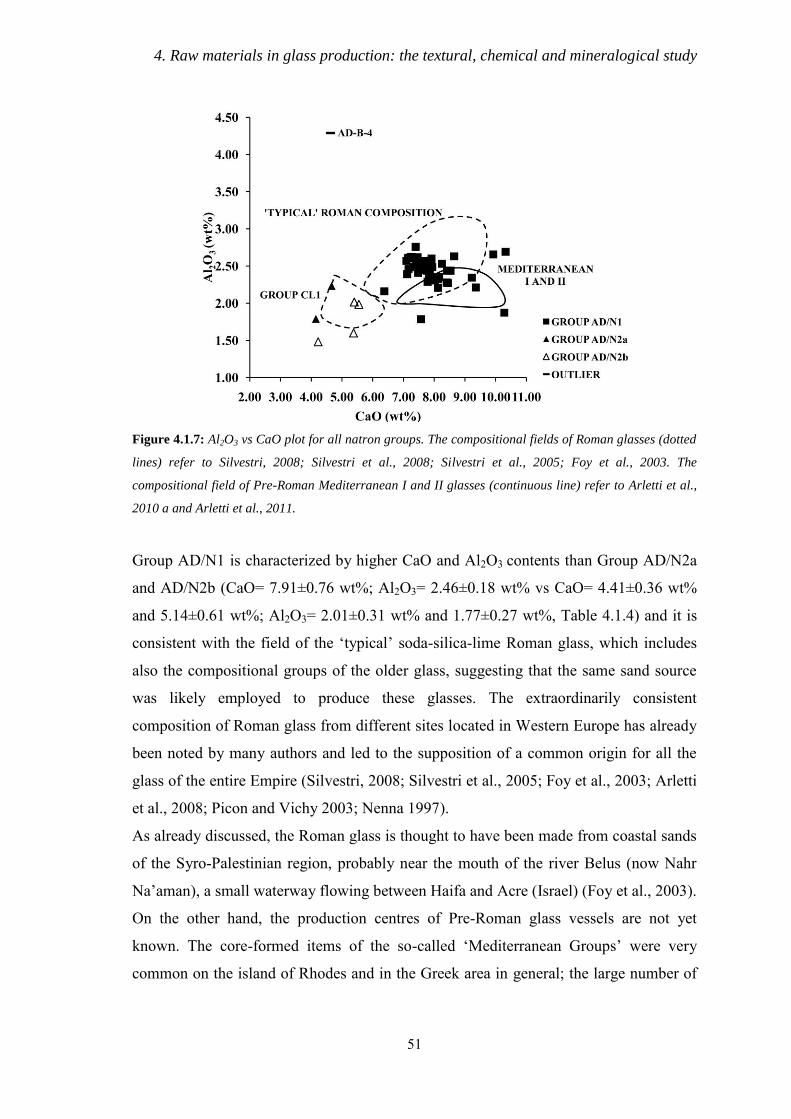
4. Raw materials in glass production: the textural, chemical and mineralogical study
51
Figure 4.1.7: Al2O3 vs CaO plot for all natron groups. The compositional fields of Roman glasses (dotted
lines) refer to Silvestri, 2008; Silvestri et al., 2008; Silvestri et al., 2005; Foy et al., 2003. The
compositional field of Pre-Roman Mediterranean I and II glasses (continuous line) refer to Arletti et al.,
2010 a and Arletti et al., 2011.
Group AD/N1 is characterized by higher CaO and Al2O3 contents than Group AD/N2a
and AD/N2b (CaO= 7.91±0.76 wt%; Al2O3= 2.46±0.18 wt% vs CaO= 4.41±0.36 wt%
and 5.14±0.61 wt%; Al2O3= 2.01±0.31 wt% and 1.77±0.27 wt%, Table 4.1.4) and it is
consistent with the field of the „typical‟ soda-silica-lime Roman glass, which includes
also the compositional groups of the older glass, suggesting that the same sand source
was likely employed to produce these glasses. The extraordinarily consistent
composition of Roman glass from different sites located in Western Europe has already
been noted by many authors and led to the supposition of a common origin for all the
glass of the entire Empire (Silvestri, 2008; Silvestri et al., 2005; Foy et al., 2003; Arletti
et al., 2008; Picon and Vichy 2003; Nenna 1997).
As already discussed, the Roman glass is thought to have been made from coastal sands
of the Syro-Palestinian region, probably near the mouth of the river Belus (now Nahr
Na‟aman), a small waterway flowing between Haifa and Acre (Israel) (Foy et al., 2003).
On the other hand, the production centres of Pre-Roman glass vessels are not yet
known. The core-formed items of the so-called „Mediterranean Groups‟ were very
common on the island of Rhodes and in the Greek area in general; the large number of
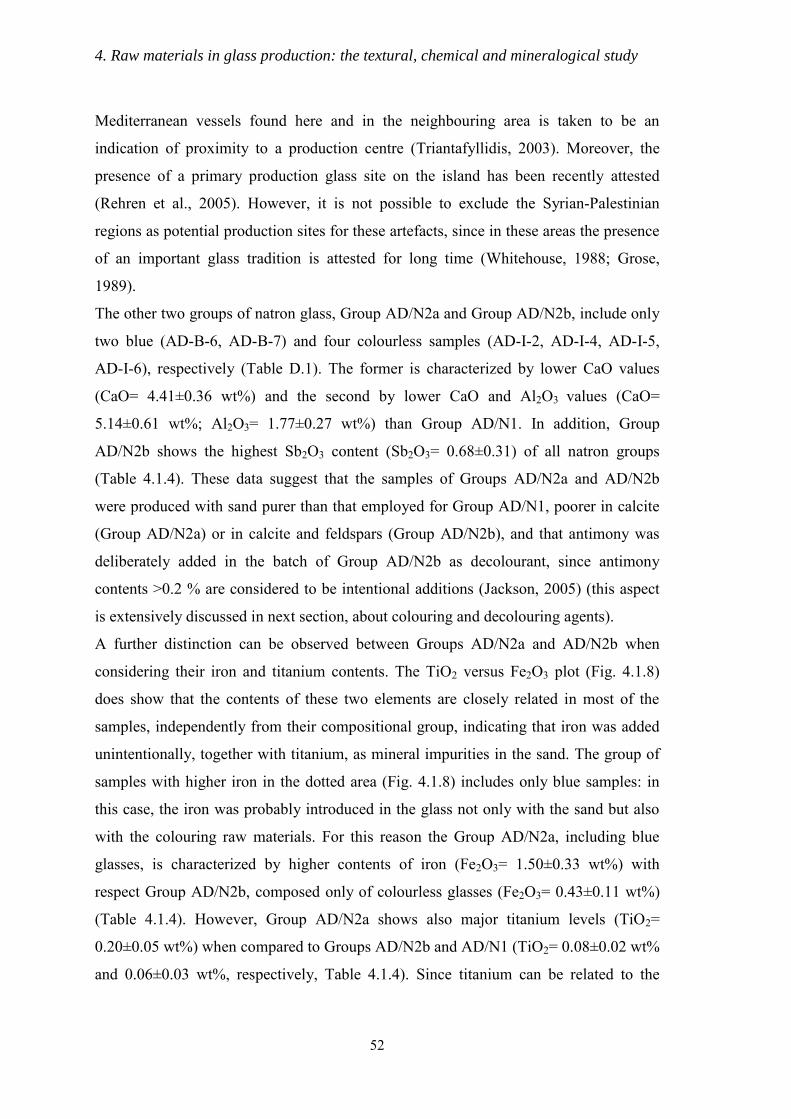
4. Raw materials in glass production: the textural, chemical and mineralogical study
52
Mediterranean vessels found here and in the neighbouring area is taken to be an
indication of proximity to a production centre (Triantafyllidis, 2003). Moreover, the
presence of a primary production glass site on the island has been recently attested
(Rehren et al., 2005). However, it is not possible to exclude the Syrian-Palestinian
regions as potential production sites for these artefacts, since in these areas the presence
of an important glass tradition is attested for long time (Whitehouse, 1988; Grose,
1989).
The other two groups of natron glass, Group AD/N2a and Group AD/N2b, include only
two blue (AD-B-6, AD-B-7) and four colourless samples (AD-I-2, AD-I-4, AD-I-5,
AD-I-6), respectively (Table D.1). The former is characterized by lower CaO values
(CaO= 4.41±0.36 wt%) and the second by lower CaO and Al2O3 values (CaO=
5.14±0.61 wt%; Al2O3= 1.77±0.27 wt%) than Group AD/N1. In addition, Group
AD/N2b shows the highest Sb2O3 content (Sb2O3= 0.68±0.31) of all natron groups
(Table 4.1.4). These data suggest that the samples of Groups AD/N2a and AD/N2b
were produced with sand purer than that employed for Group AD/N1, poorer in calcite
(Group AD/N2a) or in calcite and feldspars (Group AD/N2b), and that antimony was
deliberately added in the batch of Group AD/N2b as decolourant, since antimony
contents >0.2 % are considered to be intentional additions (Jackson, 2005) (this aspect
is extensively discussed in next section, about colouring and decolouring agents).
A further distinction can be observed between Groups AD/N2a and AD/N2b when
considering their iron and titanium contents. The TiO2 versus Fe2O3 plot (Fig. 4.1.8)
does show that the contents of these two elements are closely related in most of the
samples, independently from their compositional group, indicating that iron was added
unintentionally, together with titanium, as mineral impurities in the sand. The group of
samples with higher iron in the dotted area (Fig. 4.1.8) includes only blue samples: in
this case, the iron was probably introduced in the glass not only with the sand but also
with the colouring raw materials. For this reason the Group AD/N2a, including blue
glasses, is characterized by higher contents of iron (Fe2O3= 1.50±0.33 wt%) with
respect Group AD/N2b, composed only of colourless glasses (Fe2O3= 0.43±0.11 wt%)
(Table 4.1.4). However, Group AD/N2a shows also major titanium levels (TiO2=
0.20±0.05 wt%) when compared to Groups AD/N2b and AD/N1 (TiO2= 0.08±0.02 wt%
and 0.06±0.03 wt%, respectively, Table 4.1.4). Since titanium can be related to the
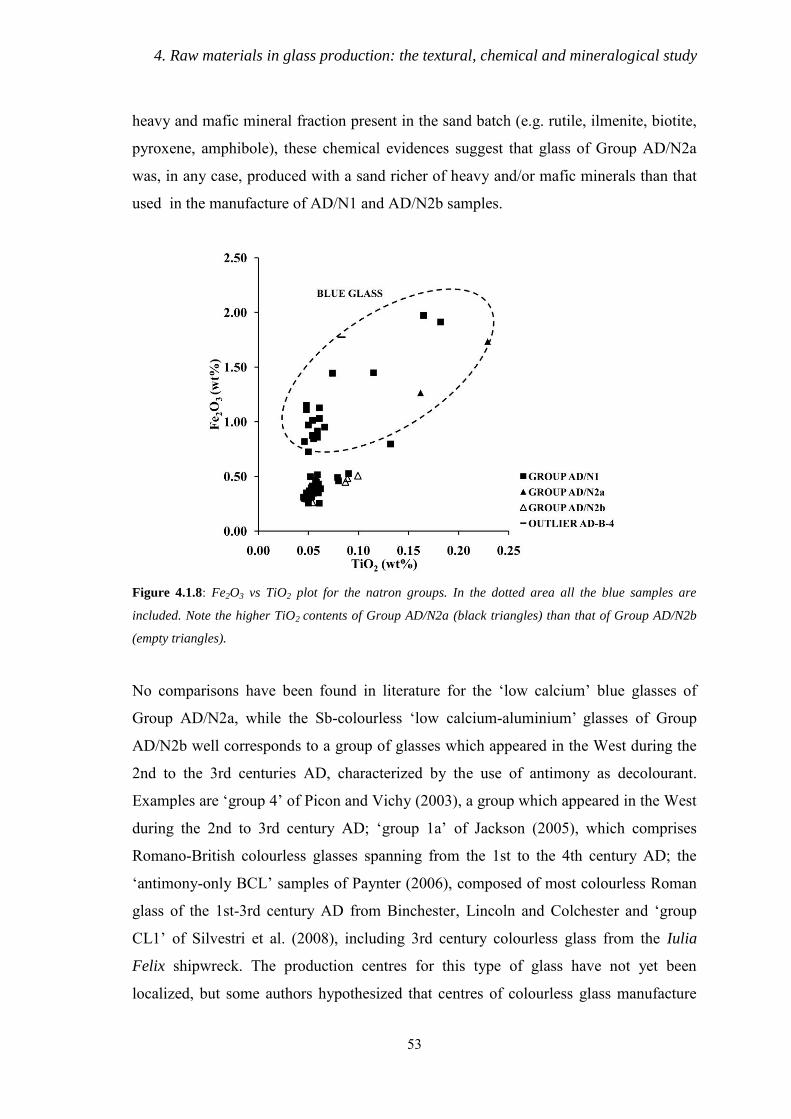
4. Raw materials in glass production: the textural, chemical and mineralogical study
53
heavy and mafic mineral fraction present in the sand batch (e.g. rutile, ilmenite, biotite,
pyroxene, amphibole), these chemical evidences suggest that glass of Group AD/N2a
was, in any case, produced with a sand richer of heavy and/or mafic minerals than that
used in the manufacture of AD/N1 and AD/N2b samples.
Figure 4.1.8: Fe2O3 vs TiO2 plot for the natron groups. In the dotted area all the blue samples are
included. Note the higher TiO2 contents of Group AD/N2a (black triangles) than that of Group AD/N2b
(empty triangles).
No comparisons have been found in literature for the „low calcium‟ blue glasses of
Group AD/N2a, while the Sb-colourless „low calcium-aluminium‟ glasses of Group
AD/N2b well corresponds to a group of glasses which appeared in the West during the
2nd to the 3rd centuries AD, characterized by the use of antimony as decolourant.
Examples are „group 4‟ of Picon and Vichy (2003), a group which appeared in the West
during the 2nd to 3rd century AD; „group 1a‟ of Jackson (2005), which comprises
Romano-British colourless glasses spanning from the 1st to the 4th century AD; the
„antimony-only BCL‟ samples of Paynter (2006), composed of most colourless Roman
glass of the 1st-3rd century AD from Binchester, Lincoln and Colchester and „group
CL1‟ of Silvestri et al. (2008), including 3rd century colourless glass from the Iulia
Felix shipwreck. The production centres for this type of glass have not yet been
localized, but some authors hypothesized that centres of colourless glass manufacture
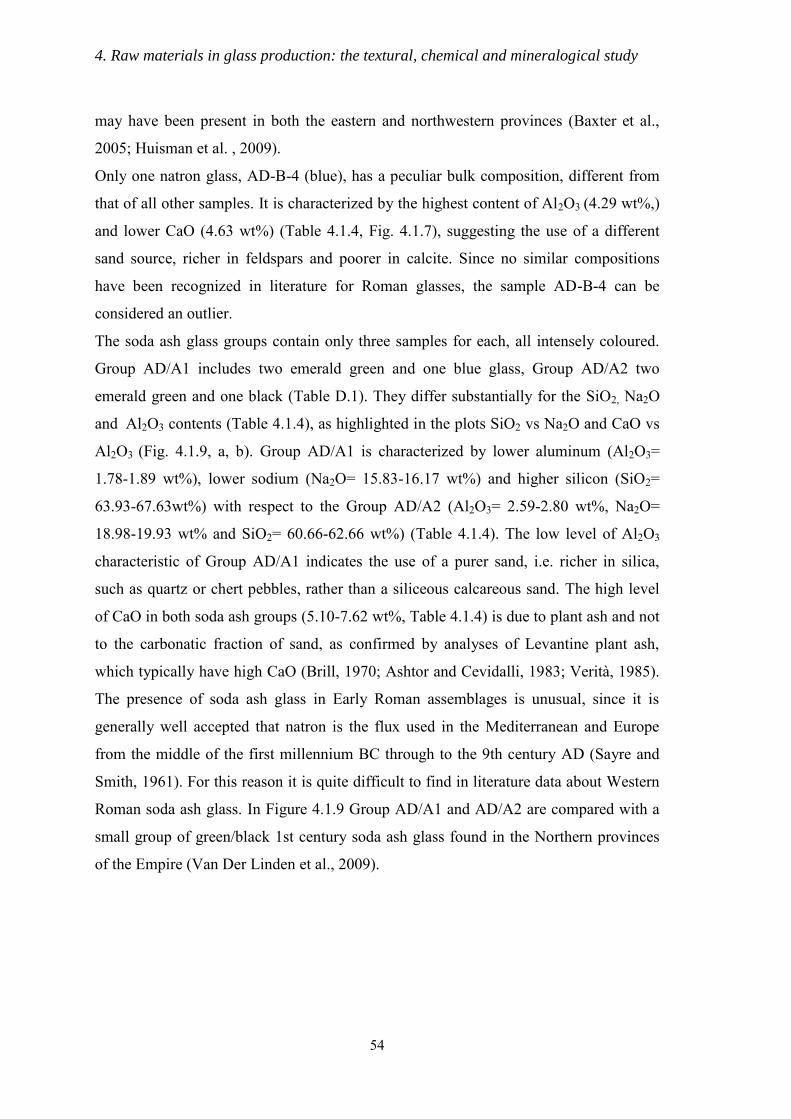
4. Raw materials in glass production: the textural, chemical and mineralogical study
54
may have been present in both the eastern and northwestern provinces (Baxter et al.,
2005; Huisman et al. , 2009).
Only one natron glass, AD-B-4 (blue), has a peculiar bulk composition, different from
that of all other samples. It is characterized by the highest content of Al2O3 (4.29 wt%,)
and lower CaO (4.63 wt%) (Table 4.1.4, Fig. 4.1.7), suggesting the use of a different
sand source, richer in feldspars and poorer in calcite. Since no similar compositions
have been recognized in literature for Roman glasses, the sample AD-B-4 can be
considered an outlier.
The soda ash glass groups contain only three samples for each, all intensely coloured.
Group AD/A1 includes two emerald green and one blue glass, Group AD/A2 two
emerald green and one black (Table D.1). They differ substantially for the SiO2, Na2O
and Al2O3 contents (Table 4.1.4), as highlighted in the plots SiO2 vs Na2O and CaO vs
Al2O3 (Fig. 4.1.9, a, b). Group AD/A1 is characterized by lower aluminum (Al2O3=
1.78-1.89 wt%), lower sodium (Na2O= 15.83-16.17 wt%) and higher silicon (SiO2=
63.93-67.63wt%) with respect to the Group AD/A2 (Al2O3= 2.59-2.80 wt%, Na2O=
18.98-19.93 wt% and SiO2= 60.66-62.66 wt%) (Table 4.1.4). The low level of Al2O3
characteristic of Group AD/A1 indicates the use of a purer sand, i.e. richer in silica,
such as quartz or chert pebbles, rather than a siliceous calcareous sand. The high level
of CaO in both soda ash groups (5.10-7.62 wt%, Table 4.1.4) is due to plant ash and not
to the carbonatic fraction of sand, as confirmed by analyses of Levantine plant ash,
which typically have high CaO (Brill, 1970; Ashtor and Cevidalli, 1983; Verità, 1985).
The presence of soda ash glass in Early Roman assemblages is unusual, since it is
generally well accepted that natron is the flux used in the Mediterranean and Europe
from the middle of the first millennium BC through to the 9th century AD (Sayre and
Smith, 1961). For this reason it is quite difficult to find in literature data about Western
Roman soda ash glass. In Figure 4.1.9 Group AD/A1 and AD/A2 are compared with a
small group of green/black 1st century soda ash glass found in the Northern provinces
of the Empire (Van Der Linden et al., 2009).
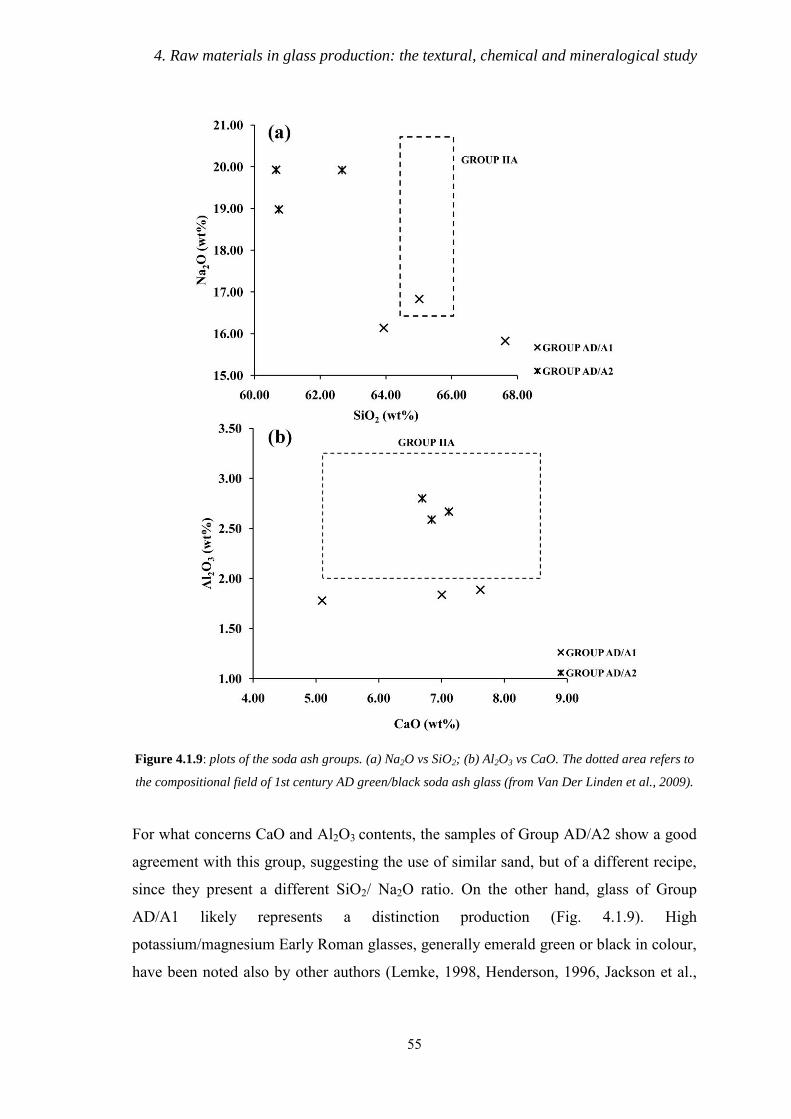
4. Raw materials in glass production: the textural, chemical and mineralogical study
55
Figure 4.1.9: plots of the soda ash groups. (a) Na2O vs SiO2; (b) Al2O3 vs CaO. The dotted area refers to
the compositional field of 1st century AD green/black soda ash glass (from Van Der Linden et al., 2009).
For what concerns CaO and Al2O3 contents, the samples of Group AD/A2 show a good
agreement with this group, suggesting the use of similar sand, but of a different recipe,
since they present a different SiO2/ Na2O ratio. On the other hand, glass of Group
AD/A1 likely represents a distinction production (Fig. 4.1.9). High
potassium/magnesium Early Roman glasses, generally emerald green or black in colour,
have been noted also by other authors (Lemke, 1998, Henderson, 1996, Jackson et al.,
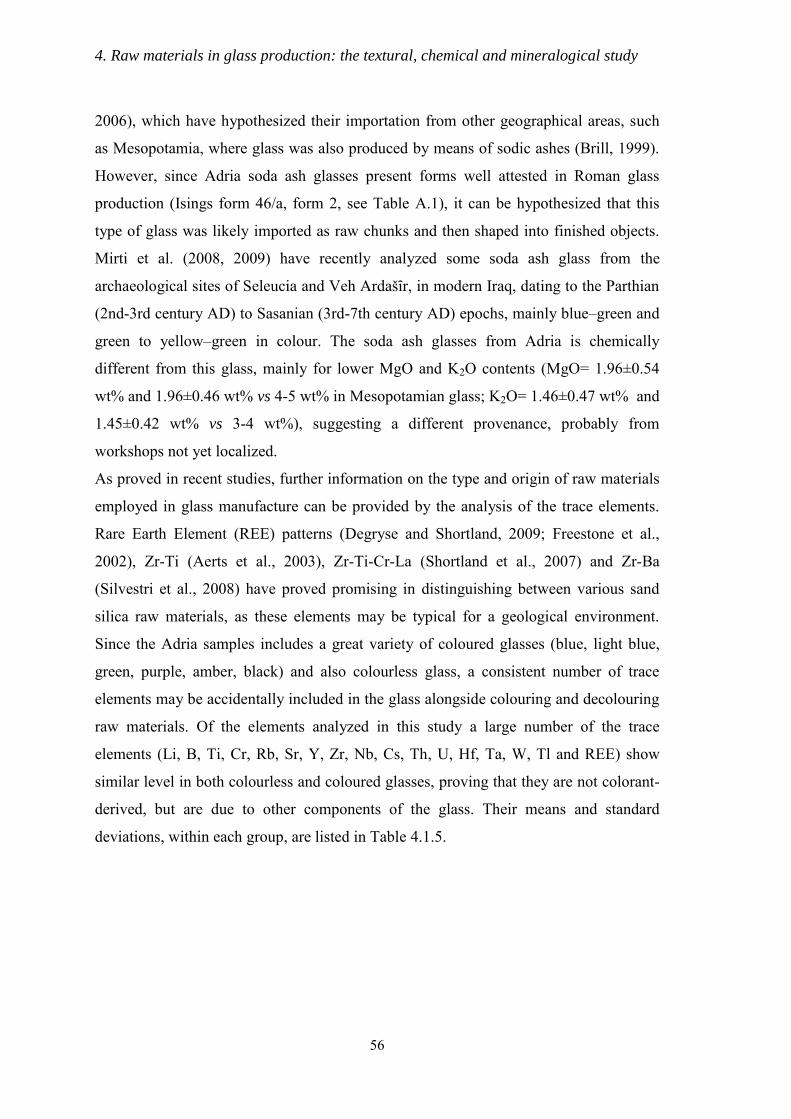
4. Raw materials in glass production: the textural, chemical and mineralogical study
56
2006), which have hypothesized their importation from other geographical areas, such
as Mesopotamia, where glass was also produced by means of sodic ashes (Brill, 1999).
However, since Adria soda ash glasses present forms well attested in Roman glass
production (Isings form 46/a, form 2, see Table A.1), it can be hypothesized that this
type of glass was likely imported as raw chunks and then shaped into finished objects.
Mirti et al. (2008, 2009) have recently analyzed some soda ash glass from the
archaeological sites of Seleucia and Veh Ardašȋr, in modern Iraq, dating to the Parthian
(2nd-3rd century AD) to Sasanian (3rd-7th century AD) epochs, mainly blue–green and
green to yellow–green in colour. The soda ash glasses from Adria is chemically
different from this glass, mainly for lower MgO and K2O contents (MgO= 1.96±0.54
wt% and 1.96±0.46 wt% vs 4-5 wt% in Mesopotamian glass; K2O= 1.46±0.47 wt% and
1.45±0.42 wt% vs 3-4 wt%), suggesting a different provenance, probably from
workshops not yet localized.
As proved in recent studies, further information on the type and origin of raw materials
employed in glass manufacture can be provided by the analysis of the trace elements.
Rare Earth Element (REE) patterns (Degryse and Shortland, 2009; Freestone et al.,
2002), Zr-Ti (Aerts et al., 2003), Zr-Ti-Cr-La (Shortland et al., 2007) and Zr-Ba
(Silvestri et al., 2008) have proved promising in distinguishing between various sand
silica raw materials, as these elements may be typical for a geological environment.
Since the Adria samples includes a great variety of coloured glasses (blue, light blue,
green, purple, amber, black) and also colourless glass, a consistent number of trace
elements may be accidentally included in the glass alongside colouring and decolouring
raw materials. Of the elements analyzed in this study a large number of the trace
elements (Li, B, Ti, Cr, Rb, Sr, Y, Zr, Nb, Cs, Th, U, Hf, Ta, W, Tl and REE) show
similar level in both colourless and coloured glasses, proving that they are not colorant-
derived, but are due to other components of the glass. Their means and standard
deviations, within each group, are listed in Table 4.1.5.
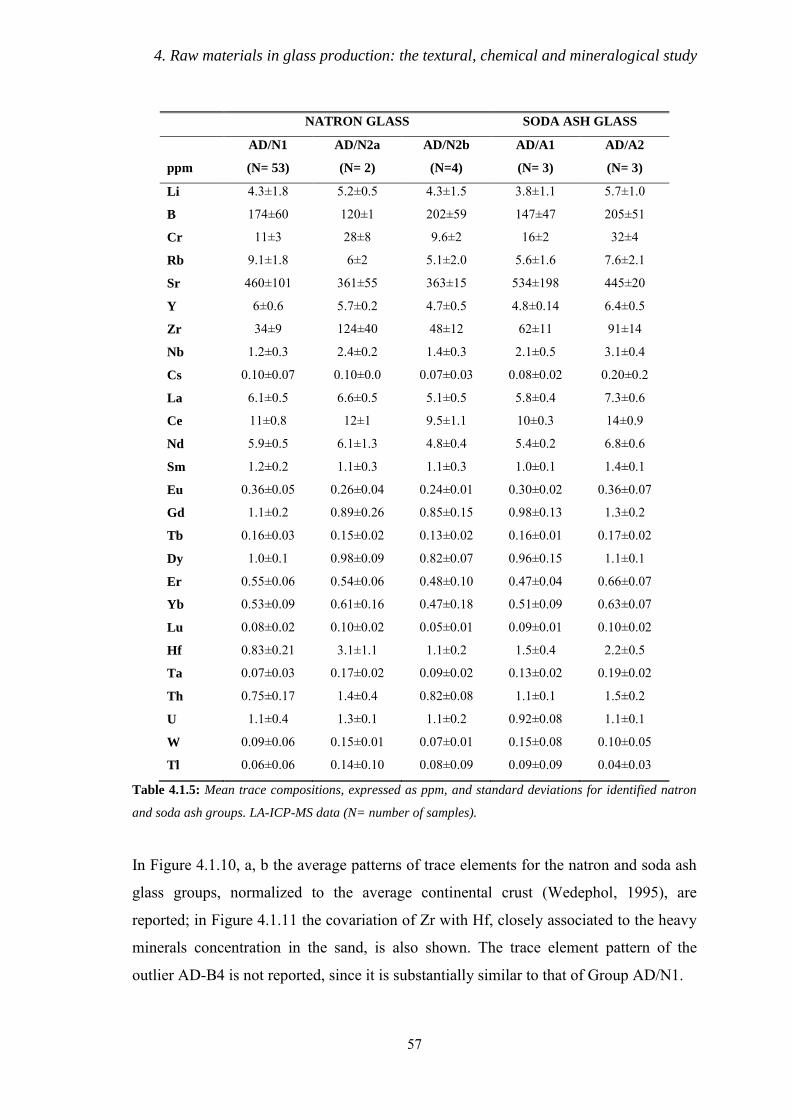
4. Raw materials in glass production: the textural, chemical and mineralogical study
57
NATRON GLASS SODA ASH GLASS
AD/N1 AD/N2a AD/N2b AD/A1 AD/A2
ppm (N= 53) (N= 2) (N=4) (N= 3) (N= 3)
Li 4.3±1.8 5.2±0.5 4.3±1.5 3.8±1.1 5.7±1.0
B 174±60 120±1 202±59 147±47 205±51
Cr 11±3 28±8 9.6±2 16±2 32±4
Rb 9.1±1.8 6±2 5.1±2.0 5.6±1.6 7.6±2.1
Sr 460±101 361±55 363±15 534±198 445±20
Y 6±0.6 5.7±0.2 4.7±0.5 4.8±0.14 6.4±0.5
Zr 34±9 124±40 48±12 62±11 91±14
Nb 1.2±0.3 2.4±0.2 1.4±0.3 2.1±0.5 3.1±0.4
Cs 0.10±0.07 0.10±0.0 0.07±0.03 0.08±0.02 0.20±0.2
La 6.1±0.5 6.6±0.5 5.1±0.5 5.8±0.4 7.3±0.6
Ce 11±0.8 12±1 9.5±1.1 10±0.3 14±0.9
Nd 5.9±0.5 6.1±1.3 4.8±0.4 5.4±0.2 6.8±0.6
Sm 1.2±0.2 1.1±0.3 1.1±0.3 1.0±0.1 1.4±0.1
Eu 0.36±0.05 0.26±0.04 0.24±0.01 0.30±0.02 0.36±0.07
Gd 1.1±0.2 0.89±0.26 0.85±0.15 0.98±0.13 1.3±0.2
Tb 0.16±0.03 0.15±0.02 0.13±0.02 0.16±0.01 0.17±0.02
Dy 1.0±0.1 0.98±0.09 0.82±0.07 0.96±0.15 1.1±0.1
Er 0.55±0.06 0.54±0.06 0.48±0.10 0.47±0.04 0.66±0.07
Yb 0.53±0.09 0.61±0.16 0.47±0.18 0.51±0.09 0.63±0.07
Lu 0.08±0.02 0.10±0.02 0.05±0.01 0.09±0.01 0.10±0.02
Hf 0.83±0.21 3.1±1.1 1.1±0.2 1.5±0.4 2.2±0.5
Ta 0.07±0.03 0.17±0.02 0.09±0.02 0.13±0.02 0.19±0.02
Th 0.75±0.17 1.4±0.4 0.82±0.08 1.1±0.1 1.5±0.2
U 1.1±0.4 1.3±0.1 1.1±0.2 0.92±0.08 1.1±0.1
W 0.09±0.06 0.15±0.01 0.07±0.01 0.15±0.08 0.10±0.05
Tl 0.06±0.06 0.14±0.10 0.08±0.09 0.09±0.09 0.04±0.03
Table 4.1.5: Mean trace compositions, expressed as ppm, and standard deviations for identified natron
and soda ash groups. LA-ICP-MS data (N= number of samples).
In Figure 4.1.10, a, b the average patterns of trace elements for the natron and soda ash
glass groups, normalized to the average continental crust (Wedephol, 1995), are
reported; in Figure 4.1.11 the covariation of Zr with Hf, closely associated to the heavy
minerals concentration in the sand, is also shown. The trace element pattern of the
outlier AD-B4 is not reported, since it is substantially similar to that of Group AD/N1.
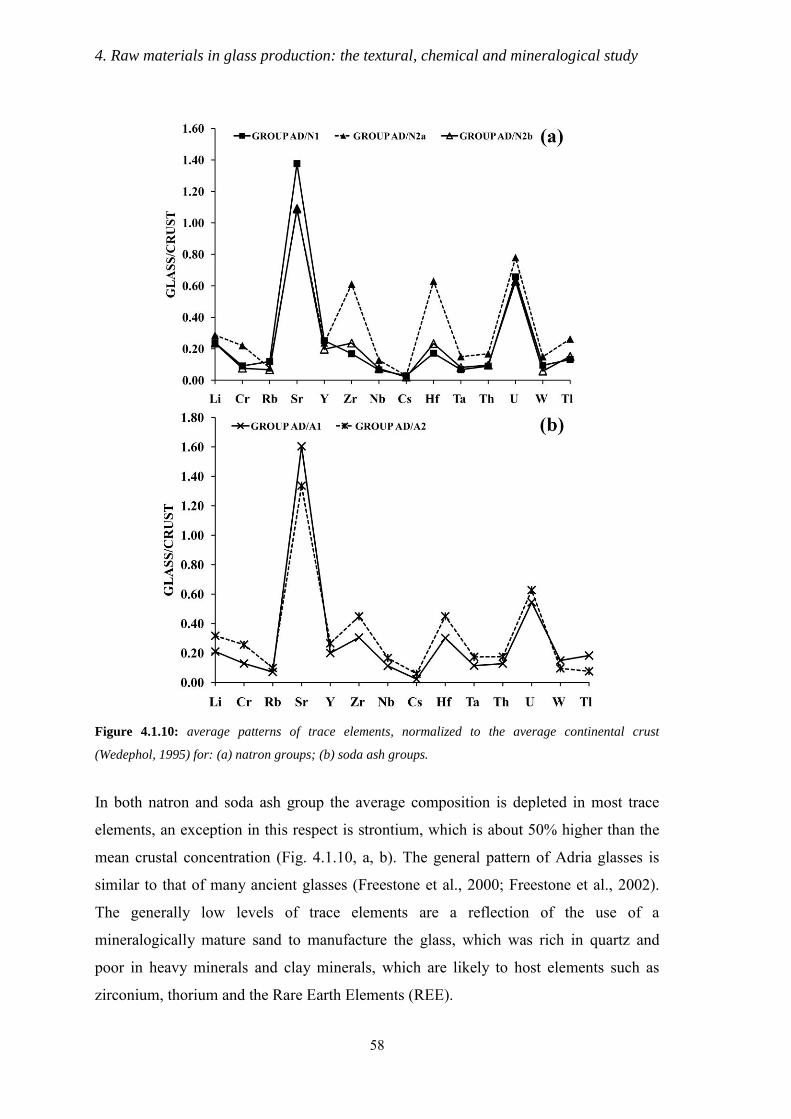
4. Raw materials in glass production: the textural, chemical and mineralogical study
58
Figure 4.1.10: average patterns of trace elements, normalized to the average continental crust
(Wedephol, 1995) for: (a) natron groups; (b) soda ash groups.
In both natron and soda ash group the average composition is depleted in most trace
elements, an exception in this respect is strontium, which is about 50% higher than the
mean crustal concentration (Fig. 4.1.10, a, b). The general pattern of Adria glasses is
similar to that of many ancient glasses (Freestone et al., 2000; Freestone et al., 2002).
The generally low levels of trace elements are a reflection of the use of a
mineralogically mature sand to manufacture the glass, which was rich in quartz and
poor in heavy minerals and clay minerals, which are likely to host elements such as
zirconium, thorium and the Rare Earth Elements (REE).
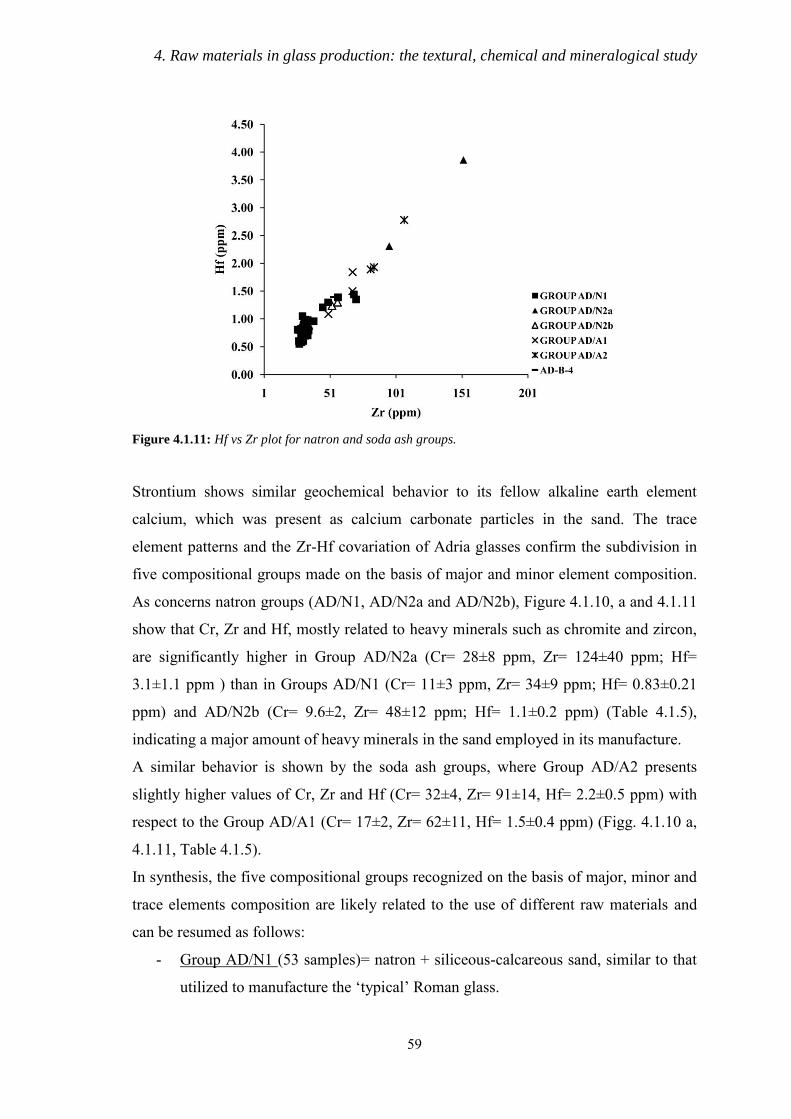
4. Raw materials in glass production: the textural, chemical and mineralogical study
59
Figure 4.1.11: Hf vs Zr plot for natron and soda ash groups.
Strontium shows similar geochemical behavior to its fellow alkaline earth element
calcium, which was present as calcium carbonate particles in the sand. The trace
element patterns and the Zr-Hf covariation of Adria glasses confirm the subdivision in
five compositional groups made on the basis of major and minor element composition.
As concerns natron groups (AD/N1, AD/N2a and AD/N2b), Figure 4.1.10, a and 4.1.11
show that Cr, Zr and Hf, mostly related to heavy minerals such as chromite and zircon,
are significantly higher in Group AD/N2a (Cr= 28±8 ppm, Zr= 124±40 ppm; Hf=
3.1±1.1 ppm ) than in Groups AD/N1 (Cr= 11±3 ppm, Zr= 34±9 ppm; Hf= 0.83±0.21
ppm) and AD/N2b (Cr= 9.6±2, Zr= 48±12 ppm; Hf= 1.1±0.2 ppm) (Table 4.1.5),
indicating a major amount of heavy minerals in the sand employed in its manufacture.
A similar behavior is shown by the soda ash groups, where Group AD/A2 presents
slightly higher values of Cr, Zr and Hf (Cr= 32±4, Zr= 91±14, Hf= 2.2±0.5 ppm) with
respect to the Group AD/A1 (Cr= 17±2, Zr= 62±11, Hf= 1.5±0.4 ppm) (Figg. 4.1.10 a,
4.1.11, Table 4.1.5).
In synthesis, the five compositional groups recognized on the basis of major, minor and
trace elements composition are likely related to the use of different raw materials and
can be resumed as follows:
- Group AD/N1 (53 samples)= natron + siliceous-calcareous sand, similar to that
utilized to manufacture the „typical‟ Roman glass.
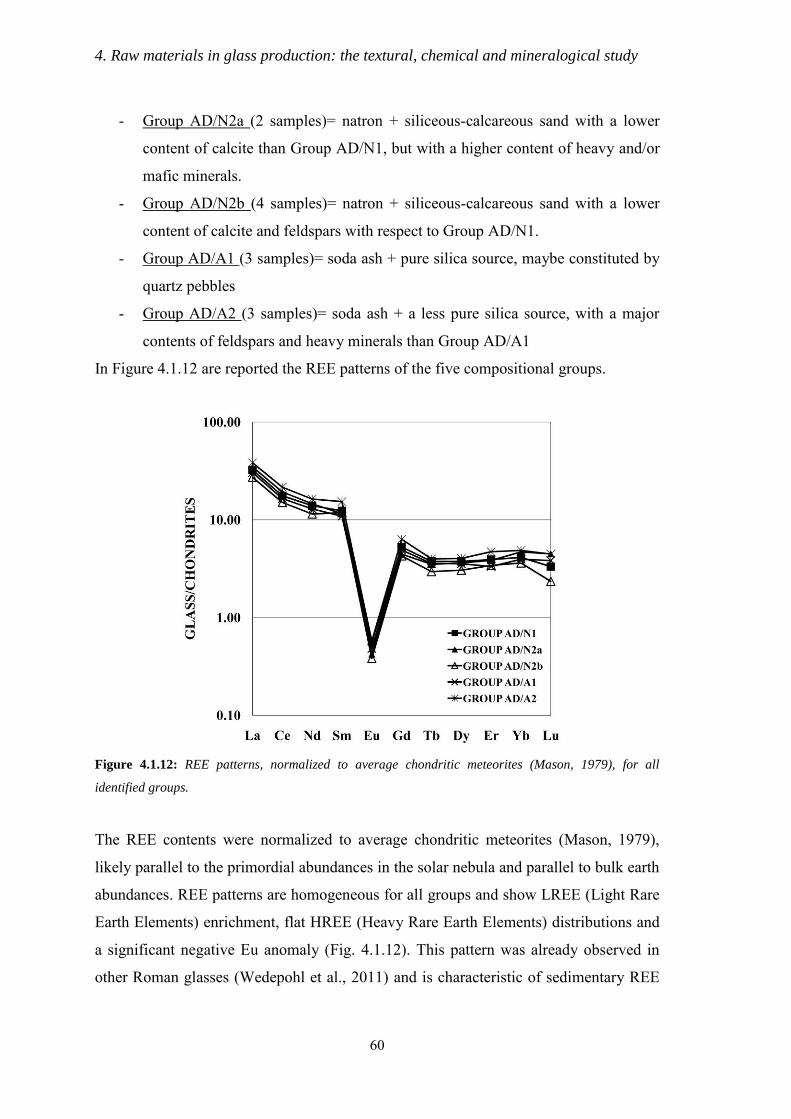
4. Raw materials in glass production: the textural, chemical and mineralogical study
60
- Group AD/N2a (2 samples)= natron + siliceous-calcareous sand with a lower
content of calcite than Group AD/N1, but with a higher content of heavy and/or
mafic minerals.
- Group AD/N2b (4 samples)= natron + siliceous-calcareous sand with a lower
content of calcite and feldspars with respect to Group AD/N1.
- Group AD/A1 (3 samples)= soda ash + pure silica source, maybe constituted by
quartz pebbles
- Group AD/A2 (3 samples)= soda ash + a less pure silica source, with a major
contents of feldspars and heavy minerals than Group AD/A1
In Figure 4.1.12 are reported the REE patterns of the five compositional groups.
Figure 4.1.12: REE patterns, normalized to average chondritic meteorites (Mason, 1979), for all
identified groups.
The REE contents were normalized to average chondritic meteorites (Mason, 1979),
likely parallel to the primordial abundances in the solar nebula and parallel to bulk earth
abundances. REE patterns are homogeneous for all groups and show LREE (Light Rare
Earth Elements) enrichment, flat HREE (Heavy Rare Earth Elements) distributions and
a significant negative Eu anomaly (Fig. 4.1.12). This pattern was already observed in
other Roman glasses (Wedepohl et al., 2011) and is characteristic of sedimentary REE
4. Raw materials in glass production: the textural, chemical and mineralogical study
61
(Degryse and Shortland, 2009). In a sediment, the bulk of the REE resides in the silt and
clay fraction (Cullers et al., 1979); heavy minerals, which may be concentrated during
sedimentary sorting due to their high density and resistance to weathering, can contain
significant abundances of REE (e.g. monazite and zircon) and when their patterns differ
significantly from the average source rock composition , an effect on the sedimentary
REE pattern may occur (McLennan, 1989). However, it has been shown by McLennan
(1989) that, though sand may be prone to effects of heavy minerals, substantial
enrichments in these minerals do not result in significant changes in the sedimentary
REE patterns of silt, clay or shales. The homogeneity in REE abundances and patterns
of the analyzed glass can be explained in this way: no anomalous values due to heavy
minerals influencing the REE patterns are discernable, so the REE patterns likely reflect
the pattern of the clay fraction of the sand raw material.
Colouring agents and recycling indicators in natron glasses (Group AD/N1, AD/N2a,
AD/N2b)
Adria natron glasses show a great variety of colours, which can be resumed in six:
green/light blue, blue, purple, amber, and colourless. The vast majority of these
coloured glasses belong to Group AD/N1, with a „typical‟ Roman composition, while
only two blue and all the Sb-colourless glasses are included in Groups AD/N2a and
AD/N2b, respectively. The light blue/green is the most common colour in Roman glass.
Iron was probably the main colouring element and was introduced into the glass as an
impurity. Adria light blue/green glasses are in total 17 and their iron content varies from
0.31 to 0.80 wt% (Table D.1). Iron can produce many different colours, from green or
blue, when Fe(II) ions are present, to brownish-yellow with Fe(III) ions. The common
blue–green glass is produced by a mixture of ferrous [Fe(II)] and ferric [Fe(III)] ions in
the melt (Pollard and Heron 1995); the different oxidation state of iron must be ascribed
either to the furnace atmosphere or to different amounts of manganese deliberately used by
glass-makers as a decolouring agent. In fact, manganese added to the batch causes
oxidation of iron from Fe2+ to Fe3+: the greenish colour of the glass changes to a yellow
tinge, which is compensated by the purple colour due to Mn3+ ions, according to the
following equation:
Fe2++ Mn3+↔Fe
3++Mn2+
4. Raw materials in glass production: the textural, chemical and mineralogical study
62
Since MnO contents higher than 0.5 wt% are considered to be intentional additions
(Jackson, 2005), it can be asserted that this decolouring agent was deliberately added in
nine light blue-green glasses, with MnO varying from 0.59 to 0.90 wt% (Table D.1).
The trace elements that usually give information about the extent of recycling, such as
Co, Zn, Sn, Cu, Pb (Freestone et al., 2002) are generally low in light blue/green glasses:
only in four sample (AD-A-5, AD-A-6, AD-A-7, AD-A-8, AD-A-10) Cu and Pb are in
the range 100-1000 ppm (Table D.2), suggesting the recycling of earlier glass and blue
glass frit or cullet added during melting.
Amber glasses are 9 and form a very homogeneous group, which shows the lowest
contents of iron and manganese of all analyzed samples (Fe2O3= 0.26-0.37 wt%; MnO=
0.02-0.04 wt%, Table D.1); also trace elements levels are very low. For this reason,
these glasses can be considered representative of the base glass composition with no
additives. In absence of discernable colouring agents, the main chromophores are likely
Fe2+ and a (Fe3 +, S-) complex, which formed when the glass was melted under strongly
reducing conditions, produced by altering the furnace atmosphere and/or by the
presence of carbon in the batch (Jackson et al., 2006; Green and Hart, 1987; Schreurs
and Brill, 1984). In the absence of the ferri-sulfide complex the glass is bluish aqua, but
with increasing concentrations of the complex the colour changes from blue to green
and finally to amber (Schreurs and Brill, 1984).
As concerns the eight colourless samples, their decolouring agents are manganese
and/or antimony (Table D.1), the principal decolourisers used in ancient time.
Antimony and manganese decolourise the glass by oxidizing iron, although the
relationship between iron, manganese and antimony in glass is complex. In general, the
amount of decolouriser used is related to the amount of iron and, as antimony is a
stronger decolouriser than manganese, smaller quantity renders the glass colourless
(Silvestri et al., 2008). For this reason, as already said, it is generally accepted that
manganese contents >0.5 % are indicative of intentional additions (Jackson, 2005)
while the limit for the antimony is 0.2 % (Jackson, 2005; Sayre, 1963). Adria colourless
glasses fall in two compositional groups: four of them (AD-I-1, AD-I-3, AD-R-1t, AD-
R-2), dating mostly 1st century AD, belong to Group AD/N1, with a typical Roman
composition, and the other four (AD-I-2, AD-I-4, AD-I-5, AD-I-6), dating 2nd -3rd
century AD, belong to Group AD/N2b, with lower contents of calcium and aluminium.
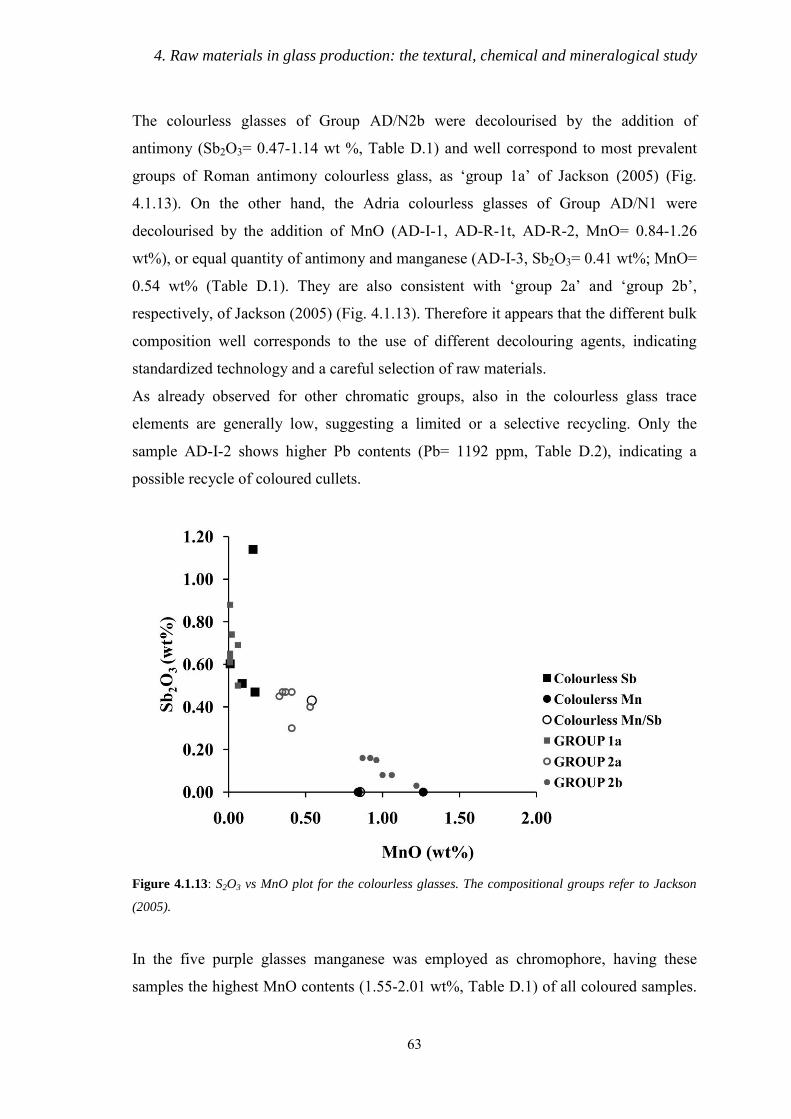
4. Raw materials in glass production: the textural, chemical and mineralogical study
63
The colourless glasses of Group AD/N2b were decolourised by the addition of
antimony (Sb2O3= 0.47-1.14 wt %, Table D.1) and well correspond to most prevalent
groups of Roman antimony colourless glass, as „group 1a‟ of Jackson (2005) (Fig.
4.1.13). On the other hand, the Adria colourless glasses of Group AD/N1 were
decolourised by the addition of MnO (AD-I-1, AD-R-1t, AD-R-2, MnO= 0.84-1.26
wt%), or equal quantity of antimony and manganese (AD-I-3, Sb2O3= 0.41 wt%; MnO=
0.54 wt% (Table D.1). They are also consistent with „group 2a‟ and „group 2b‟,
respectively, of Jackson (2005) (Fig. 4.1.13). Therefore it appears that the different bulk
composition well corresponds to the use of different decolouring agents, indicating
standardized technology and a careful selection of raw materials.
As already observed for other chromatic groups, also in the colourless glass trace
elements are generally low, suggesting a limited or a selective recycling. Only the
sample AD-I-2 shows higher Pb contents (Pb= 1192 ppm, Table D.2), indicating a
possible recycle of coloured cullets.
Figure 4.1.13: S2O3 vs MnO plot for the colourless glasses. The compositional groups refer to Jackson
(2005).
In the five purple glasses manganese was employed as chromophore, having these
samples the highest MnO contents (1.55-2.01 wt%, Table D.1) of all coloured samples.
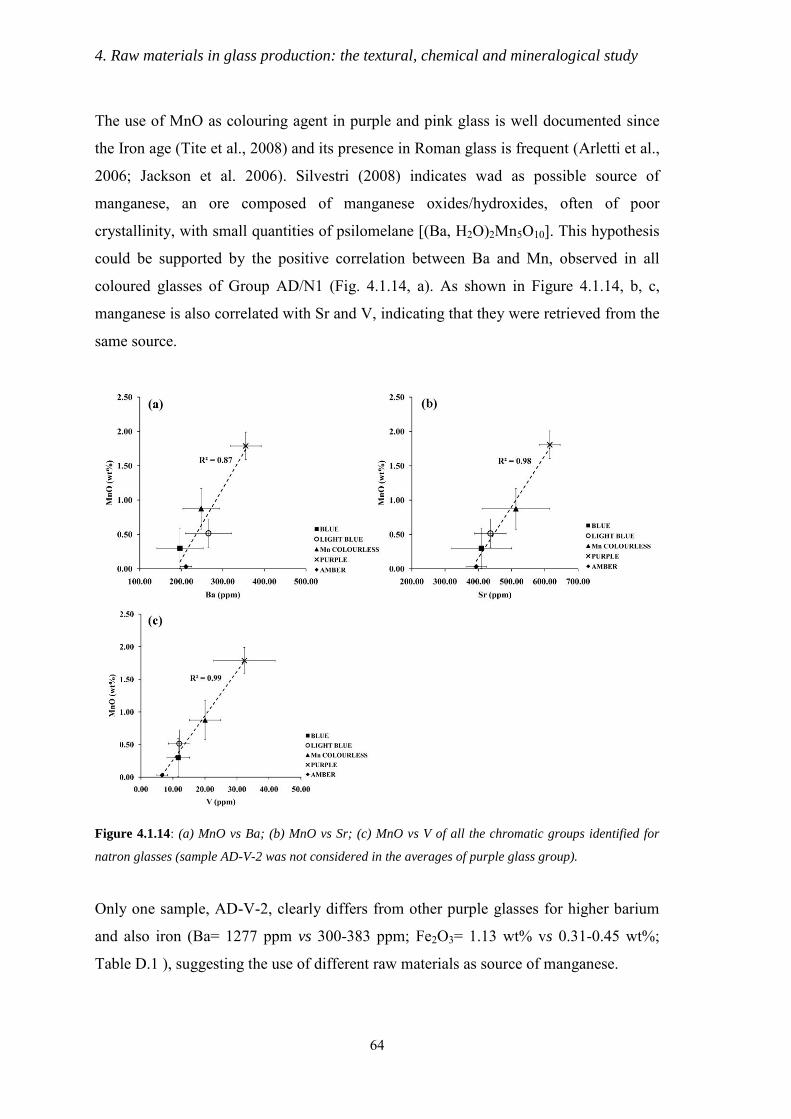
4. Raw materials in glass production: the textural, chemical and mineralogical study
64
The use of MnO as colouring agent in purple and pink glass is well documented since
the Iron age (Tite et al., 2008) and its presence in Roman glass is frequent (Arletti et al.,
2006; Jackson et al. 2006). Silvestri (2008) indicates wad as possible source of
manganese, an ore composed of manganese oxides/hydroxides, often of poor
crystallinity, with small quantities of psilomelane [(Ba, H2O)2Mn5O10]. This hypothesis
could be supported by the positive correlation between Ba and Mn, observed in all
coloured glasses of Group AD/N1 (Fig. 4.1.14, a). As shown in Figure 4.1.14, b, c,
manganese is also correlated with Sr and V, indicating that they were retrieved from the
same source.
Figure 4.1.14: (a) MnO vs Ba; (b) MnO vs Sr; (c) MnO vs V of all the chromatic groups identified for
natron glasses (sample AD-V-2 was not considered in the averages of purple glass group).
Only one sample, AD-V-2, clearly differs from other purple glasses for higher barium
and also iron (Ba= 1277 ppm vs 300-383 ppm; Fe2O3= 1.13 wt% vs 0.31-0.45 wt%;
Table D.1 ), suggesting the use of different raw materials as source of manganese.
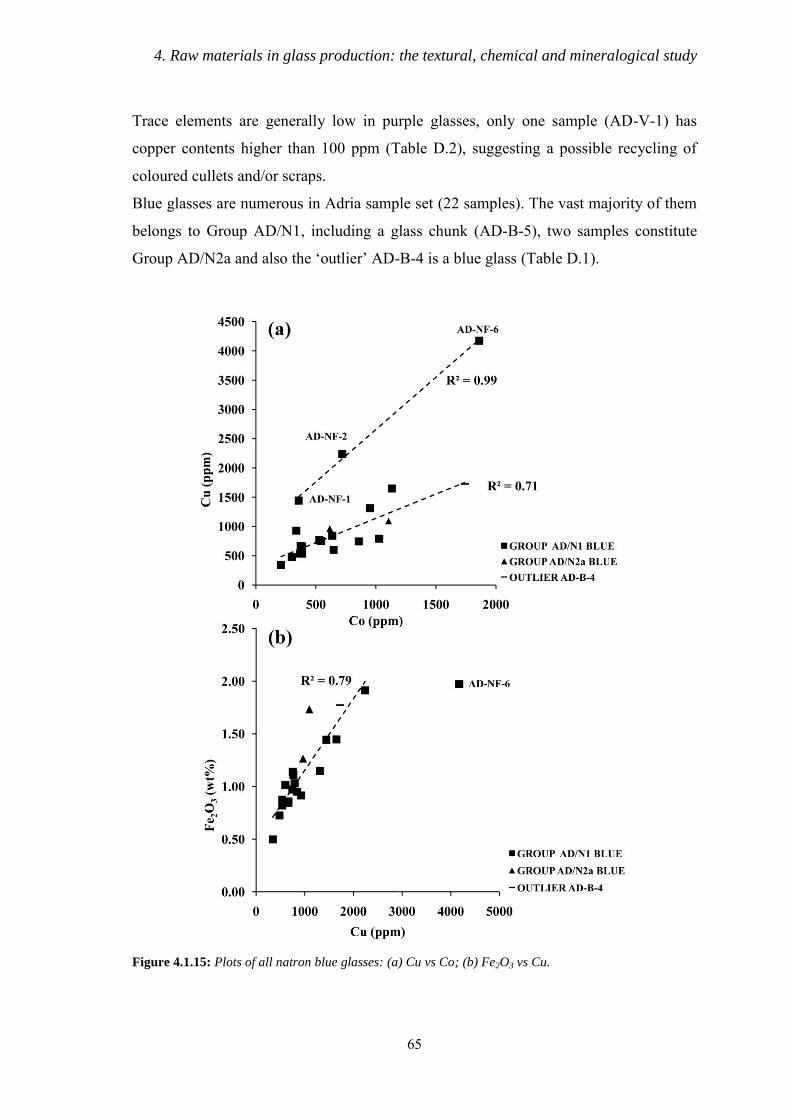
4. Raw materials in glass production: the textural, chemical and mineralogical study
65
Trace elements are generally low in purple glasses, only one sample (AD-V-1) has
copper contents higher than 100 ppm (Table D.2), suggesting a possible recycling of
coloured cullets and/or scraps.
Blue glasses are numerous in Adria sample set (22 samples). The vast majority of them
belongs to Group AD/N1, including a glass chunk (AD-B-5), two samples constitute
Group AD/N2a and also the „outlier‟ AD-B-4 is a blue glass (Table D.1).
Figure 4.1.15: Plots of all natron blue glasses: (a) Cu vs Co; (b) Fe2O3 vs Cu.
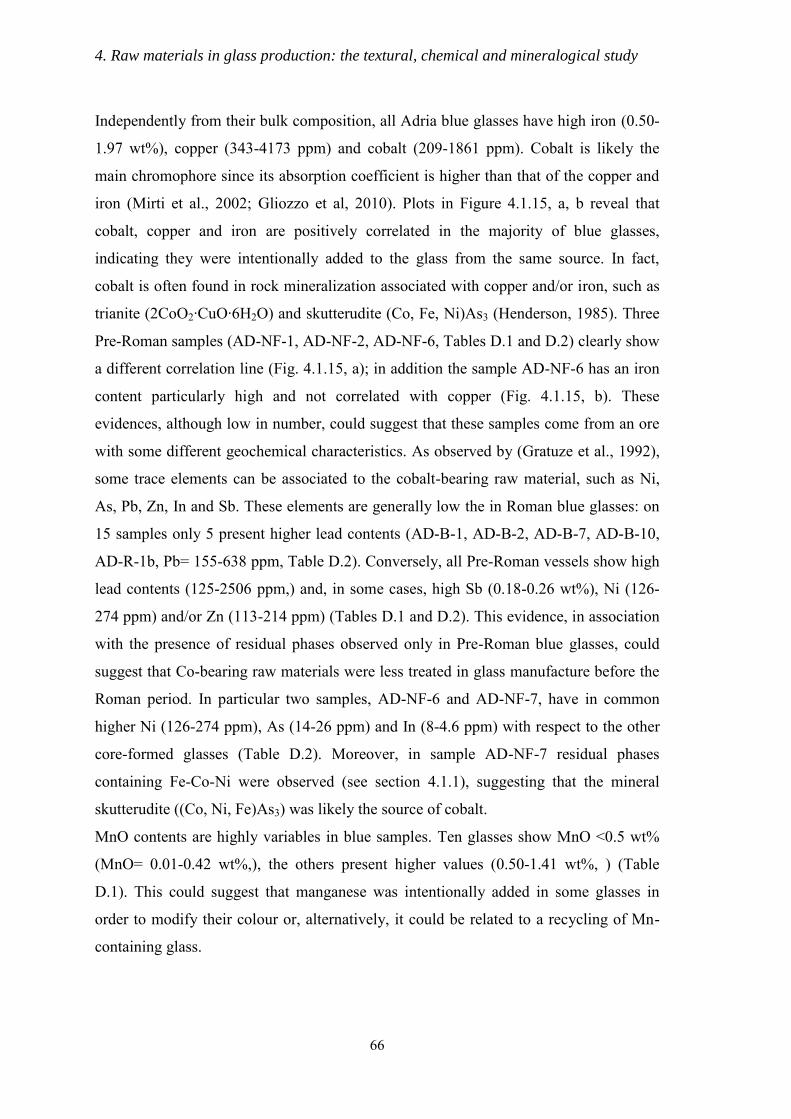
4. Raw materials in glass production: the textural, chemical and mineralogical study
66
Independently from their bulk composition, all Adria blue glasses have high iron (0.50-
1.97 wt%), copper (343-4173 ppm) and cobalt (209-1861 ppm). Cobalt is likely the
main chromophore since its absorption coefficient is higher than that of the copper and
iron (Mirti et al., 2002; Gliozzo et al, 2010). Plots in Figure 4.1.15, a, b reveal that
cobalt, copper and iron are positively correlated in the majority of blue glasses,
indicating they were intentionally added to the glass from the same source. In fact,
cobalt is often found in rock mineralization associated with copper and/or iron, such as
trianite (2CoO2∙CuO∙6H2O) and skutterudite (Co, Fe, Ni)As3 (Henderson, 1985). Three
Pre-Roman samples (AD-NF-1, AD-NF-2, AD-NF-6, Tables D.1 and D.2) clearly show
a different correlation line (Fig. 4.1.15, a); in addition the sample AD-NF-6 has an iron
content particularly high and not correlated with copper (Fig. 4.1.15, b). These
evidences, although low in number, could suggest that these samples come from an ore
with some different geochemical characteristics. As observed by (Gratuze et al., 1992),
some trace elements can be associated to the cobalt-bearing raw material, such as Ni,
As, Pb, Zn, In and Sb. These elements are generally low the in Roman blue glasses: on
15 samples only 5 present higher lead contents (AD-B-1, AD-B-2, AD-B-7, AD-B-10,
AD-R-1b, Pb= 155-638 ppm, Table D.2). Conversely, all Pre-Roman vessels show high
lead contents (125-2506 ppm,) and, in some cases, high Sb (0.18-0.26 wt%), Ni (126-
274 ppm) and/or Zn (113-214 ppm) (Tables D.1 and D.2). This evidence, in association
with the presence of residual phases observed only in Pre-Roman blue glasses, could
suggest that Co-bearing raw materials were less treated in glass manufacture before the
Roman period. In particular two samples, AD-NF-6 and AD-NF-7, have in common
higher Ni (126-274 ppm), As (14-26 ppm) and In (8-4.6 ppm) with respect to the other
core-formed glasses (Table D.2). Moreover, in sample AD-NF-7 residual phases
containing Fe-Co-Ni were observed (see section 4.1.1), suggesting that the mineral
skutterudite ((Co, Ni, Fe)As3) was likely the source of cobalt.
MnO contents are highly variables in blue samples. Ten glasses show MnO <0.5 wt%
(MnO= 0.01-0.42 wt%,), the others present higher values (0.50-1.41 wt%, ) (Table
D.1). This could suggest that manganese was intentionally added in some glasses in
order to modify their colour or, alternatively, it could be related to a recycling of Mn-
containing glass.
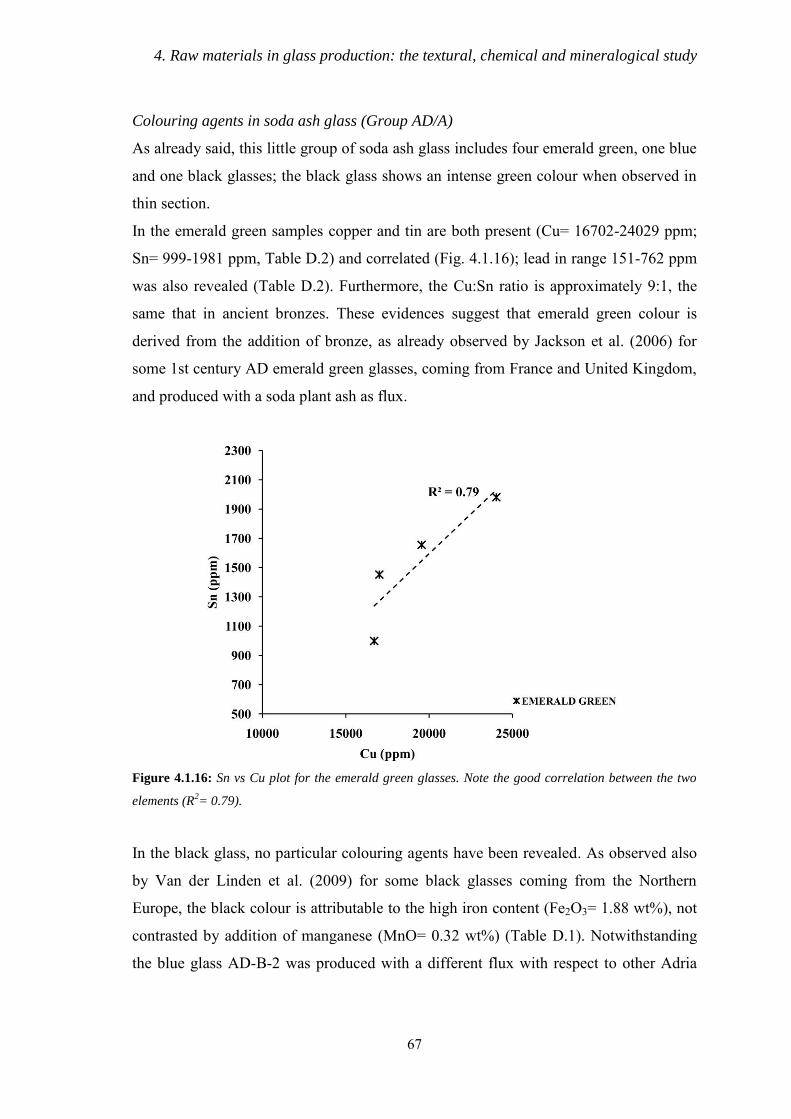
4. Raw materials in glass production: the textural, chemical and mineralogical study
67
Colouring agents in soda ash glass (Group AD/A)
As already said, this little group of soda ash glass includes four emerald green, one blue
and one black glasses; the black glass shows an intense green colour when observed in
thin section.
In the emerald green samples copper and tin are both present (Cu= 16702-24029 ppm;
Sn= 999-1981 ppm, Table D.2) and correlated (Fig. 4.1.16); lead in range 151-762 ppm
was also revealed (Table D.2). Furthermore, the Cu:Sn ratio is approximately 9:1, the
same that in ancient bronzes. These evidences suggest that emerald green colour is
derived from the addition of bronze, as already observed by Jackson et al. (2006) for
some 1st century AD emerald green glasses, coming from France and United Kingdom,
and produced with a soda plant ash as flux.
Figure 4.1.16: Sn vs Cu plot for the emerald green glasses. Note the good correlation between the two
elements (R2= 0.79).
In the black glass, no particular colouring agents have been revealed. As observed also
by Van der Linden et al. (2009) for some black glasses coming from the Northern
Europe, the black colour is attributable to the high iron content (Fe2O3= 1.88 wt%), not
contrasted by addition of manganese (MnO= 0.32 wt%) (Table D.1). Notwithstanding
the blue glass AD-B-2 was produced with a different flux with respect to other Adria
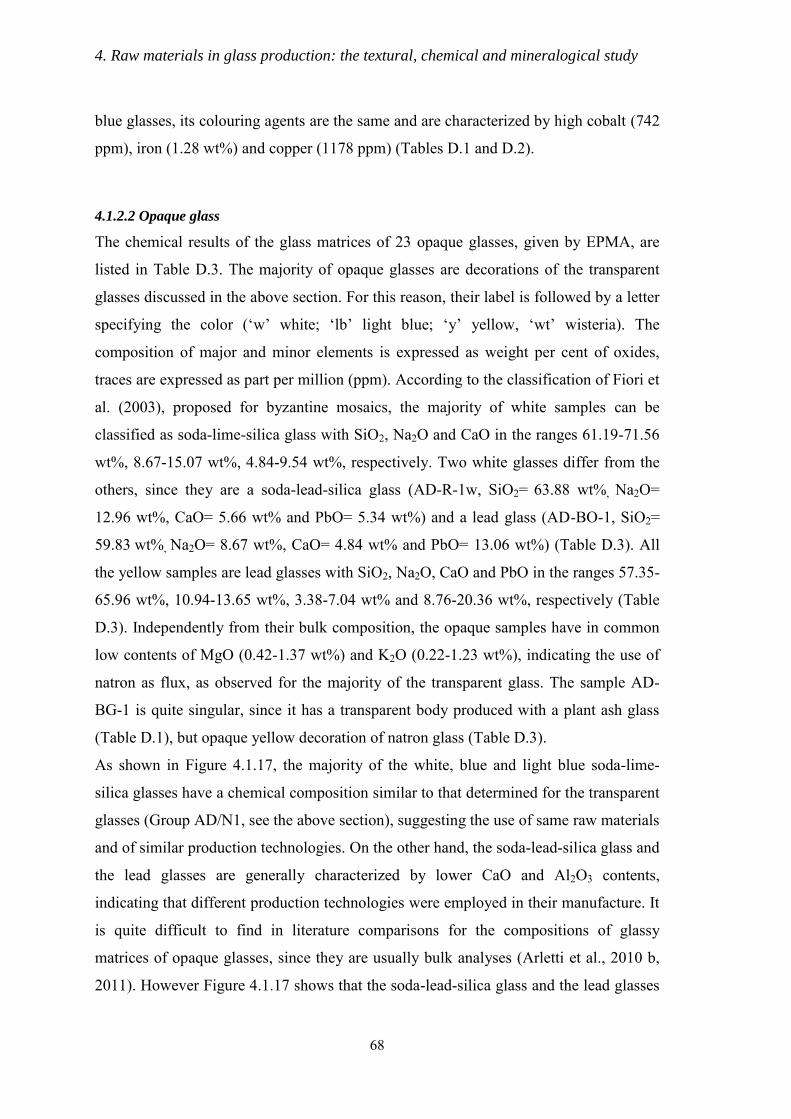
4. Raw materials in glass production: the textural, chemical and mineralogical study
68
blue glasses, its colouring agents are the same and are characterized by high cobalt (742
ppm), iron (1.28 wt%) and copper (1178 ppm) (Tables D.1 and D.2).
4.1.2.2 Opaque glass
The chemical results of the glass matrices of 23 opaque glasses, given by EPMA, are
listed in Table D.3. The majority of opaque glasses are decorations of the transparent
glasses discussed in the above section. For this reason, their label is followed by a letter
specifying the color („w‟ white; „lb‟ light blue; „y‟ yellow, „wt‟ wisteria). The
composition of major and minor elements is expressed as weight per cent of oxides,
traces are expressed as part per million (ppm). According to the classification of Fiori et
al. (2003), proposed for byzantine mosaics, the majority of white samples can be
classified as soda-lime-silica glass with SiO2, Na2O and CaO in the ranges 61.19-71.56
wt%, 8.67-15.07 wt%, 4.84-9.54 wt%, respectively. Two white glasses differ from the
others, since they are a soda-lead-silica glass (AD-R-1w, SiO2= 63.88 wt%, Na2O=
12.96 wt%, CaO= 5.66 wt% and PbO= 5.34 wt%) and a lead glass (AD-BO-1, SiO2=
59.83 wt%, Na2O= 8.67 wt%, CaO= 4.84 wt% and PbO= 13.06 wt%) (Table D.3). All
the yellow samples are lead glasses with SiO2, Na2O, CaO and PbO in the ranges 57.35-
65.96 wt%, 10.94-13.65 wt%, 3.38-7.04 wt% and 8.76-20.36 wt%, respectively (Table
D.3). Independently from their bulk composition, the opaque samples have in common
low contents of MgO (0.42-1.37 wt%) and K2O (0.22-1.23 wt%), indicating the use of
natron as flux, as observed for the majority of the transparent glass. The sample AD-
BG-1 is quite singular, since it has a transparent body produced with a plant ash glass
(Table D.1), but opaque yellow decoration of natron glass (Table D.3).
As shown in Figure 4.1.17, the majority of the white, blue and light blue soda-lime-
silica glasses have a chemical composition similar to that determined for the transparent
glasses (Group AD/N1, see the above section), suggesting the use of same raw materials
and of similar production technologies. On the other hand, the soda-lead-silica glass and
the lead glasses are generally characterized by lower CaO and Al2O3 contents,
indicating that different production technologies were employed in their manufacture. It
is quite difficult to find in literature comparisons for the compositions of glassy
matrices of opaque glasses, since they are usually bulk analyses (Arletti et al., 2010 b,
2011). However Figure 4.1.17 shows that the soda-lead-silica glass and the lead glasses
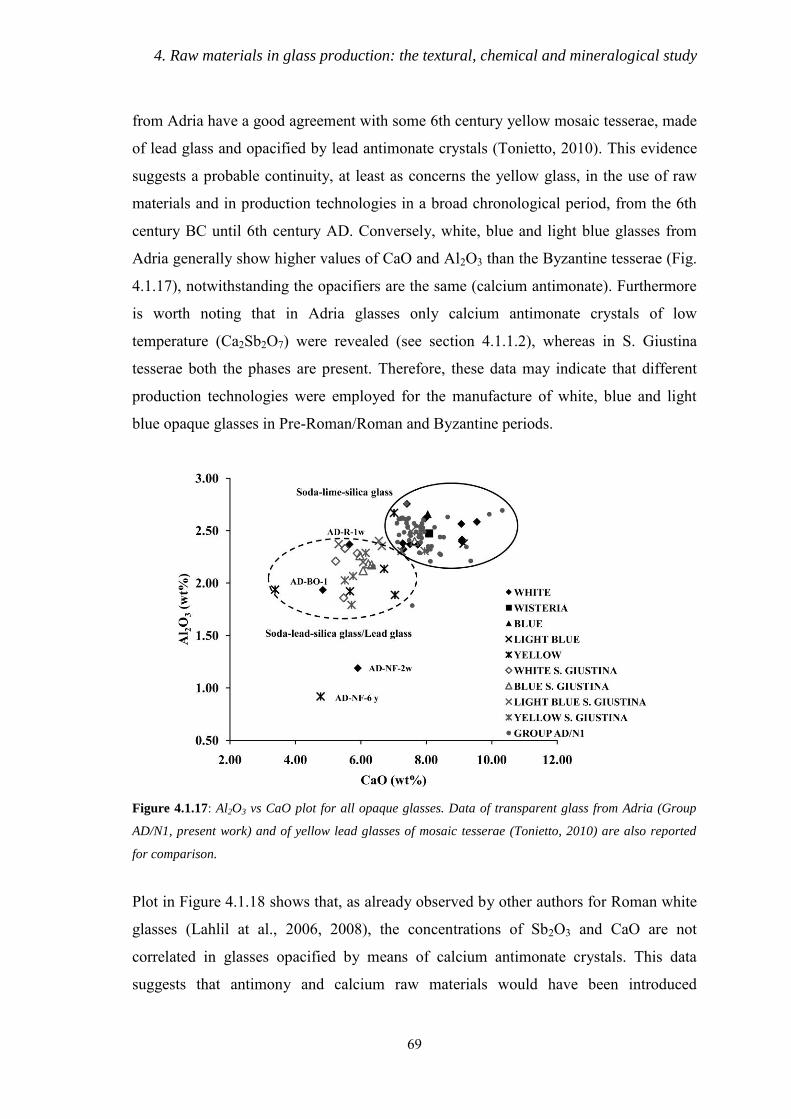
4. Raw materials in glass production: the textural, chemical and mineralogical study
69
from Adria have a good agreement with some 6th century yellow mosaic tesserae, made
of lead glass and opacified by lead antimonate crystals (Tonietto, 2010). This evidence
suggests a probable continuity, at least as concerns the yellow glass, in the use of raw
materials and in production technologies in a broad chronological period, from the 6th
century BC until 6th century AD. Conversely, white, blue and light blue glasses from
Adria generally show higher values of CaO and Al2O3 than the Byzantine tesserae (Fig.
4.1.17), notwithstanding the opacifiers are the same (calcium antimonate). Furthermore
is worth noting that in Adria glasses only calcium antimonate crystals of low
temperature (Ca2Sb2O7) were revealed (see section 4.1.1.2), whereas in S. Giustina
tesserae both the phases are present. Therefore, these data may indicate that different
production technologies were employed for the manufacture of white, blue and light
blue opaque glasses in Pre-Roman/Roman and Byzantine periods.
Figure 4.1.17: Al2O3 vs CaO plot for all opaque glasses. Data of transparent glass from Adria (Group
AD/N1, present work) and of yellow lead glasses of mosaic tesserae (Tonietto, 2010) are also reported
for comparison.
Plot in Figure 4.1.18 shows that, as already observed by other authors for Roman white
glasses (Lahlil at al., 2006, 2008), the concentrations of Sb2O3 and CaO are not
correlated in glasses opacified by means of calcium antimonate crystals. This data
suggests that antimony and calcium raw materials would have been introduced
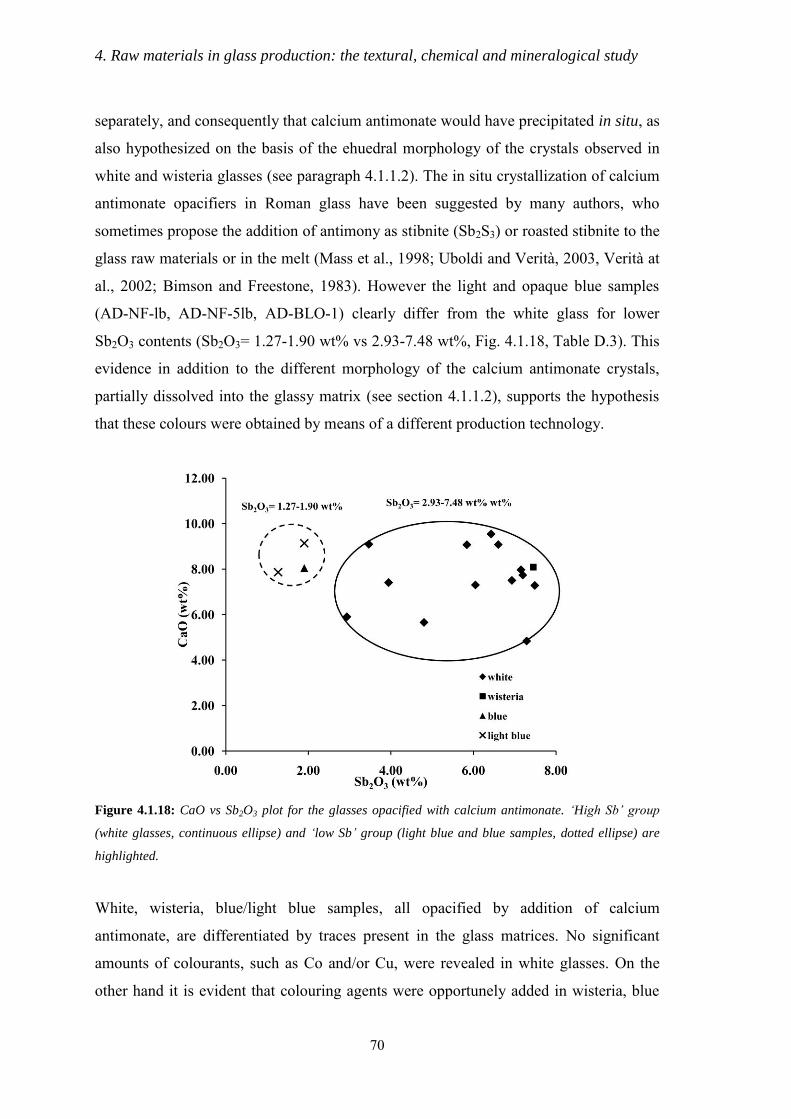
4. Raw materials in glass production: the textural, chemical and mineralogical study
70
separately, and consequently that calcium antimonate would have precipitated in situ, as
also hypothesized on the basis of the ehuedral morphology of the crystals observed in
white and wisteria glasses (see paragraph 4.1.1.2). The in situ crystallization of calcium
antimonate opacifiers in Roman glass have been suggested by many authors, who
sometimes propose the addition of antimony as stibnite (Sb2S3) or roasted stibnite to the
glass raw materials or in the melt (Mass et al., 1998; Uboldi and Verità, 2003, Verità at
al., 2002; Bimson and Freestone, 1983). However the light and opaque blue samples
(AD-NF-lb, AD-NF-5lb, AD-BLO-1) clearly differ from the white glass for lower
Sb2O3 contents (Sb2O3= 1.27-1.90 wt% vs 2.93-7.48 wt%, Fig. 4.1.18, Table D.3). This
evidence in addition to the different morphology of the calcium antimonate crystals,
partially dissolved into the glassy matrix (see section 4.1.1.2), supports the hypothesis
that these colours were obtained by means of a different production technology.
Figure 4.1.18: CaO vs Sb2O3 plot for the glasses opacified with calcium antimonate. „High Sb‟ group
(white glasses, continuous ellipse) and „low Sb‟ group (light blue and blue samples, dotted ellipse) are
highlighted.
White, wisteria, blue/light blue samples, all opacified by addition of calcium
antimonate, are differentiated by traces present in the glass matrices. No significant
amounts of colourants, such as Co and/or Cu, were revealed in white glasses. On the
other hand it is evident that colouring agents were opportunely added in wisteria, blue
4. Raw materials in glass production: the textural, chemical and mineralogical study
71
and light blue glass matrices, in order to obtain the desired hue; wisteria and blue
glasses show intentional additions of both cobalt (518-896 ppm) and copper (789-2192
ppm) and light blue glasses only of copper (1292-2233 ppm). Intentional additions of
MnO have been revealed in six white glasses (AD-BB-1w, AD-R-1w, AD-R-2w, AD-
VB-1w, AD-AB-4w, AD-BO-1, Table D.3).
Yellow glasses were coloured and opacified by the addition of lead antimonate and,
only in one sample (AD-BG-1), by both lead antimonate and lead-tin antimonate
crystals (see section 4.1.1.2). No differences were observed between Pre-Roman and
Roman yellow opaque glasses. All yellow glass matrices contain variable amount of
lead (PbO= 8.76-20.36 wt%) and generally lower amounts of antimony (Sb2O3= 0.65-
1.51 wt% ) than white glass matrices (Table D.3); the sample AD-BG-1, with lead-tin
antimonate opacifiers, show also Sn in the glass matrix (Sn= 1784 ppm). No other trace
elements were observed in yellow glasses. Lahlil et al. (2008) had suggested that yellow
Roman glass, conversely to white glass, were opacified by the addition to the melt of
natural or previously synthesized crystals, but this model has yet to be confirmed.
4.2 Late Roman Glass from Aquileia
As previously said (chapter 2), the sample set of Aquileia glasses includes various types
of objects (Table A.2, Appendix A), largely attested in the site. In order to verify
possible relationship between the type of object and the production technique and/or the
chronology, a group of object (Isings 106c, 116, 117) with similar chronology (late 3rd-
5th century AD) and production technique (mold-blowing) has been compared on one
hand with a group of objects (Isings 104, Isings 87 or 120, Isings 132) of similar dating
but different production technique (blowing) and on the other with objects (Isings 111)
dissimilar for both chronology (5th-8th century AD) and production technique
(blowing) (Table A.2, Appendix A). Chemical data and their discussion are reported in
the following section.
4.2.1 Bulk chemistry
The bulk chemistry of Aquileia glass was obtained by means of XRF and chemical data
are listed in Tables D.4 and D.5; Cl, S, Sb and Sn were checked by EPMA. The
composition of major and minor elements is expressed as weight per cent of oxides;
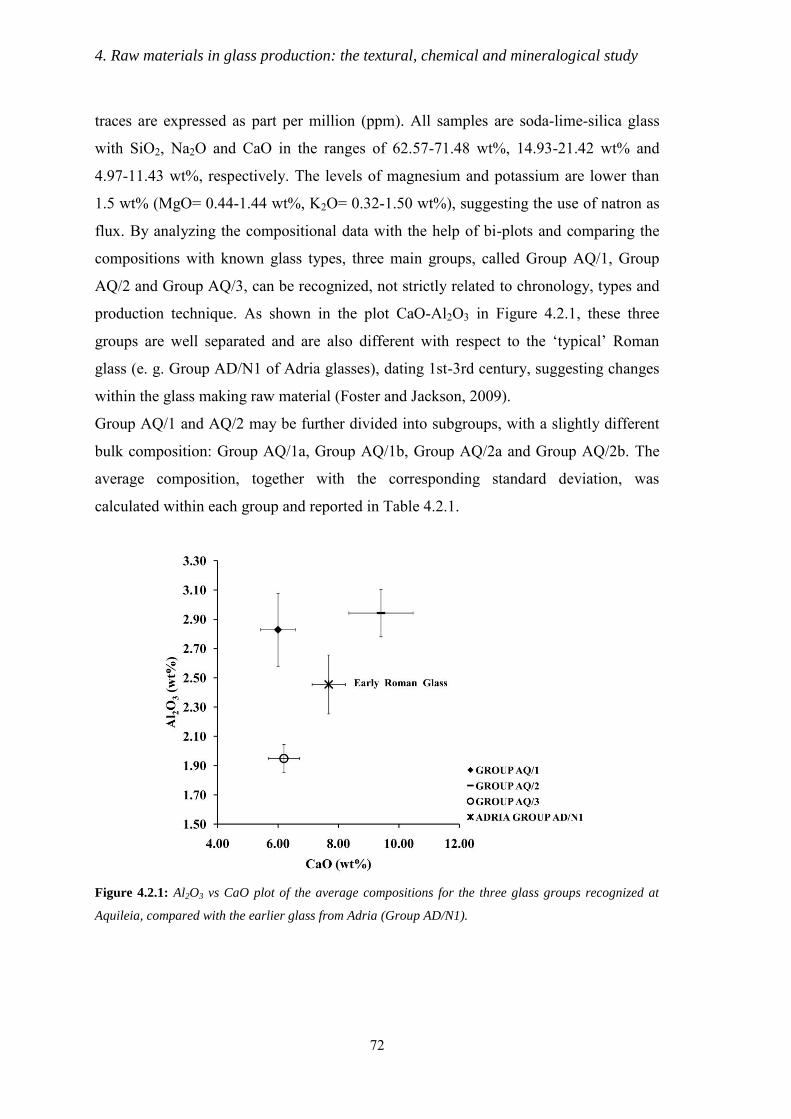
4. Raw materials in glass production: the textural, chemical and mineralogical study
72
traces are expressed as part per million (ppm). All samples are soda-lime-silica glass
with SiO2, Na2O and CaO in the ranges of 62.57-71.48 wt%, 14.93-21.42 wt% and
4.97-11.43 wt%, respectively. The levels of magnesium and potassium are lower than
1.5 wt% (MgO= 0.44-1.44 wt%, K2O= 0.32-1.50 wt%), suggesting the use of natron as
flux. By analyzing the compositional data with the help of bi-plots and comparing the
compositions with known glass types, three main groups, called Group AQ/1, Group
AQ/2 and Group AQ/3, can be recognized, not strictly related to chronology, types and
production technique. As shown in the plot CaO-Al2O3 in Figure 4.2.1, these three
groups are well separated and are also different with respect to the „typical‟ Roman
glass (e. g. Group AD/N1 of Adria glasses), dating 1st-3rd century, suggesting changes
within the glass making raw material (Foster and Jackson, 2009).
Group AQ/1 and AQ/2 may be further divided into subgroups, with a slightly different
bulk composition: Group AQ/1a, Group AQ/1b, Group AQ/2a and Group AQ/2b. The
average composition, together with the corresponding standard deviation, was
calculated within each group and reported in Table 4.2.1.
Figure 4.2.1: Al2O3 vs CaO plot of the average compositions for the three glass groups recognized at
Aquileia, compared with the earlier glass from Adria (Group AD/N1).
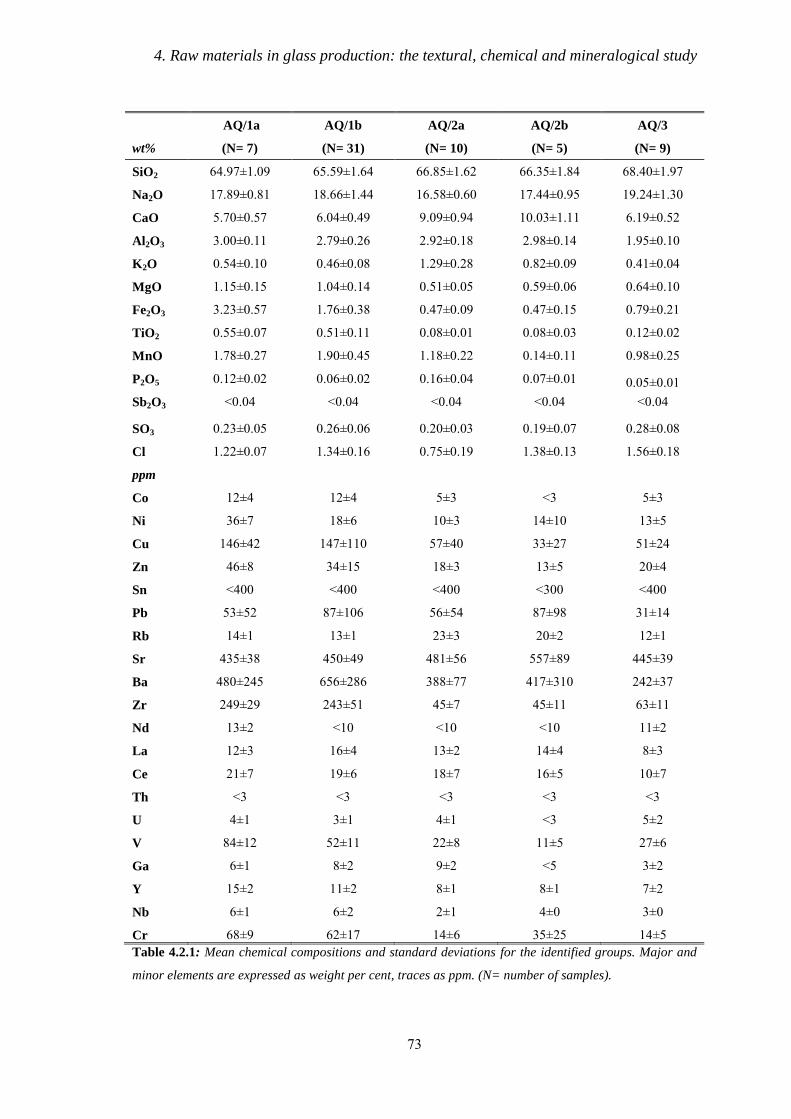
4. Raw materials in glass production: the textural, chemical and mineralogical study
73
AQ/1a AQ/1b AQ/2a AQ/2b AQ/3
wt% (N= 7) (N= 31) (N= 10) (N= 5) (N= 9)
SiO2 64.97±1.09 65.59±1.64 66.85±1.62 66.35±1.84 68.40±1.97
Na2O 17.89±0.81 18.66±1.44 16.58±0.60 17.44±0.95 19.24±1.30
CaO 5.70±0.57 6.04±0.49 9.09±0.94 10.03±1.11 6.19±0.52
Al2O3 3.00±0.11 2.79±0.26 2.92±0.18 2.98±0.14 1.95±0.10
K2O 0.54±0.10 0.46±0.08 1.29±0.28 0.82±0.09 0.41±0.04
MgO 1.15±0.15 1.04±0.14 0.51±0.05 0.59±0.06 0.64±0.10
Fe2O3 3.23±0.57 1.76±0.38 0.47±0.09 0.47±0.15 0.79±0.21
TiO2 0.55±0.07 0.51±0.11 0.08±0.01 0.08±0.03 0.12±0.02
MnO 1.78±0.27 1.90±0.45 1.18±0.22 0.14±0.11 0.98±0.25
P2O5 0.12±0.02 0.06±0.02 0.16±0.04 0.07±0.01 0.05±0.01 Sb2O3 <0.04 <0.04 <0.04 <0.04 <0.04
SO3 0.23±0.05 0.26±0.06 0.20±0.03 0.19±0.07 0.28±0.08
Cl 1.22±0.07 1.34±0.16 0.75±0.19 1.38±0.13 1.56±0.18
ppm
Co 12±4 12±4 5±3 <3 5±3
Ni 36±7 18±6 10±3 14±10 13±5
Cu 146±42 147±110 57±40 33±27 51±24
Zn 46±8 34±15 18±3 13±5 20±4
Sn <400 <400 <400 <300 <400
Pb 53±52 87±106 56±54 87±98 31±14
Rb 14±1 13±1 23±3 20±2 12±1
Sr 435±38 450±49 481±56 557±89 445±39
Ba 480±245 656±286 388±77 417±310 242±37
Zr 249±29 243±51 45±7 45±11 63±11
Nd 13±2 <10 <10 <10 11±2
La 12±3 16±4 13±2 14±4 8±3
Ce 21±7 19±6 18±7 16±5 10±7
Th <3 <3 <3 <3 <3
U 4±1 3±1 4±1 <3 5±2
V 84±12 52±11 22±8 11±5 27±6
Ga 6±1 8±2 9±2 <5 3±2
Y 15±2 11±2 8±1 8±1 7±2
Nb 6±1 6±2 2±1 4±0 3±0
Cr 68±9 62±17 14±6 35±25 14±5 Table 4.2.1: Mean chemical compositions and standard deviations for the identified groups. Major and
minor elements are expressed as weight per cent, traces as ppm. (N= number of samples).
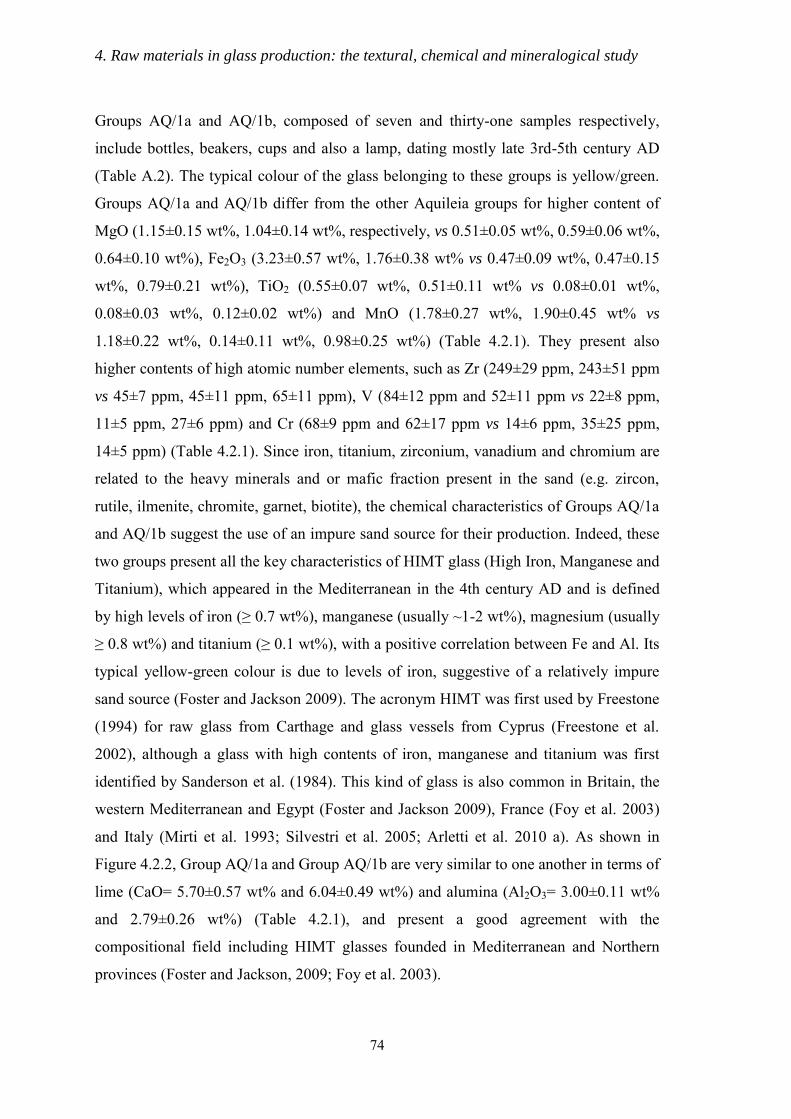
4. Raw materials in glass production: the textural, chemical and mineralogical study
74
Groups AQ/1a and AQ/1b, composed of seven and thirty-one samples respectively,
include bottles, beakers, cups and also a lamp, dating mostly late 3rd-5th century AD
(Table A.2). The typical colour of the glass belonging to these groups is yellow/green.
Groups AQ/1a and AQ/1b differ from the other Aquileia groups for higher content of
MgO (1.15±0.15 wt%, 1.04±0.14 wt%, respectively, vs 0.51±0.05 wt%, 0.59±0.06 wt%,
0.64±0.10 wt%), Fe2O3 (3.23±0.57 wt%, 1.76±0.38 wt% vs 0.47±0.09 wt%, 0.47±0.15
wt%, 0.79±0.21 wt%), TiO2 (0.55±0.07 wt%, 0.51±0.11 wt% vs 0.08±0.01 wt%,
0.08±0.03 wt%, 0.12±0.02 wt%) and MnO (1.78±0.27 wt%, 1.90±0.45 wt% vs
1.18±0.22 wt%, 0.14±0.11 wt%, 0.98±0.25 wt%) (Table 4.2.1). They present also
higher contents of high atomic number elements, such as Zr (249±29 ppm, 243±51 ppm
vs 45±7 ppm, 45±11 ppm, 65±11 ppm), V (84±12 ppm and 52±11 ppm vs 22±8 ppm,
11±5 ppm, 27±6 ppm) and Cr (68±9 ppm and 62±17 ppm vs 14±6 ppm, 35±25 ppm,
14±5 ppm) (Table 4.2.1). Since iron, titanium, zirconium, vanadium and chromium are
related to the heavy minerals and or mafic fraction present in the sand (e.g. zircon,
rutile, ilmenite, chromite, garnet, biotite), the chemical characteristics of Groups AQ/1a
and AQ/1b suggest the use of an impure sand source for their production. Indeed, these
two groups present all the key characteristics of HIMT glass (High Iron, Manganese and
Titanium), which appeared in the Mediterranean in the 4th century AD and is defined
by high levels of iron (≥ 0.7 wt%), manganese (usually ~1-2 wt%), magnesium (usually
≥ 0.8 wt%) and titanium (≥ 0.1 wt%), with a positive correlation between Fe and Al. Its
typical yellow-green colour is due to levels of iron, suggestive of a relatively impure
sand source (Foster and Jackson 2009). The acronym HIMT was first used by Freestone
(1994) for raw glass from Carthage and glass vessels from Cyprus (Freestone et al.
2002), although a glass with high contents of iron, manganese and titanium was first
identified by Sanderson et al. (1984). This kind of glass is also common in Britain, the
western Mediterranean and Egypt (Foster and Jackson 2009), France (Foy et al. 2003)
and Italy (Mirti et al. 1993; Silvestri et al. 2005; Arletti et al. 2010 a). As shown in
Figure 4.2.2, Group AQ/1a and Group AQ/1b are very similar to one another in terms of
lime (CaO= 5.70±0.57 wt% and 6.04±0.49 wt%) and alumina (Al2O3= 3.00±0.11 wt%
and 2.79±0.26 wt%) (Table 4.2.1), and present a good agreement with the
compositional field including HIMT glasses founded in Mediterranean and Northern
provinces (Foster and Jackson, 2009; Foy et al. 2003).
4. Raw materials in glass production: the textural, chemical and mineralogical study
75
Figure 4.2.2: CaO vs Al2O3 plot. Aquileia HIMT glasses (GroupAQ/1a and AQ/1b, represented by
rombs) are compared with reference data for other HIMT glasses (in grey; data from Foster and
Jackson, 2009; Foy et al. 2003).
On the other hand, Figure 4.2.3, a shows that Group AQ/1a differs from Group AQ/1b
for higher iron (Fe2O3= 3.23±0.57 wt%, vs 1.76±0.38 wt%), with a most positive
correlation between iron and titanium, higher vanadium (V= 84±12 ppm vs 52±11 ppm)
and slightly higher nickel (Ni= 36±7 ppm vs 18±6 ppm) (Table 4.2.1, Fig. 4.2.3, b, c).
These evidences, in particular the different Fe/Ti ratio between Groups AQ/1a and
AQ/2a glasses (Fig. 4.2.3, a), are independently from the types and indicate that the
glass of the two groups was produced with sands coming from ores with different
geochemical characteristics, suggestive of a different provenance. The division of the
HIMT glasses into two groups, was also demonstrated by Foy et al. (2003), termed
„Group 1‟ and „Group 2‟, and by Foster and Jackson (2009), called „HIMT 1‟ and
„HIMT 2‟. However, there is a difference among the reference groups and the Aquileia
ones. The Fe2O3-TiO2 plot (Fig. 4.2.3, a) indicates that the „weaker‟ (Group 2 and
HIMT 2) and the „stronger‟ HIMT groups (Group 1 and HIMT 1) identified by Foy et
al. (2003) and Foster and Jackson (2009) well corresponds each other. Group AQ/1b
from Aquileia is similar to the „stronger‟ literature groups (Group 1 and HIMT 1), but,
as already said, it represents the „weaker‟ term of the Aquileia assemblage (Fig. 4.2.3, a,
b, c, Table 4.2.1).
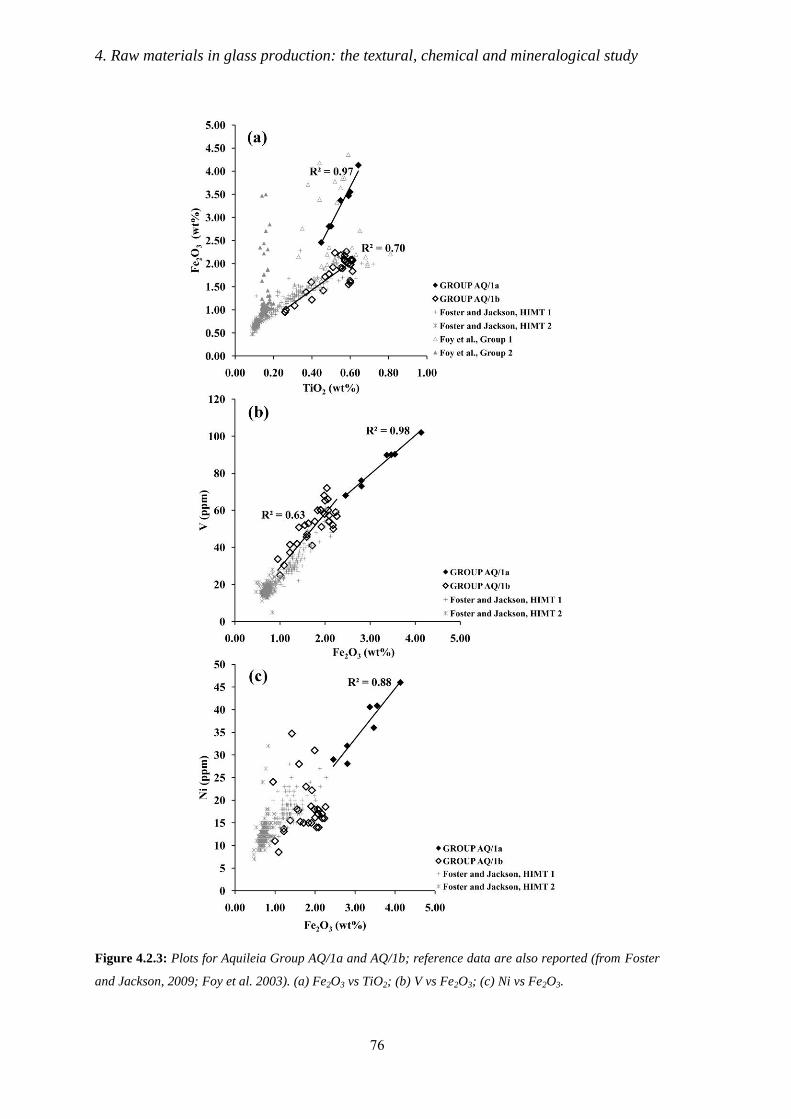
4. Raw materials in glass production: the textural, chemical and mineralogical study
76
Figure 4.2.3: Plots for Aquileia Group AQ/1a and AQ/1b; reference data are also reported (from Foster
and Jackson, 2009; Foy et al. 2003). (a) Fe2O3 vs TiO2; (b) V vs Fe2O3; (c) Ni vs Fe2O3.
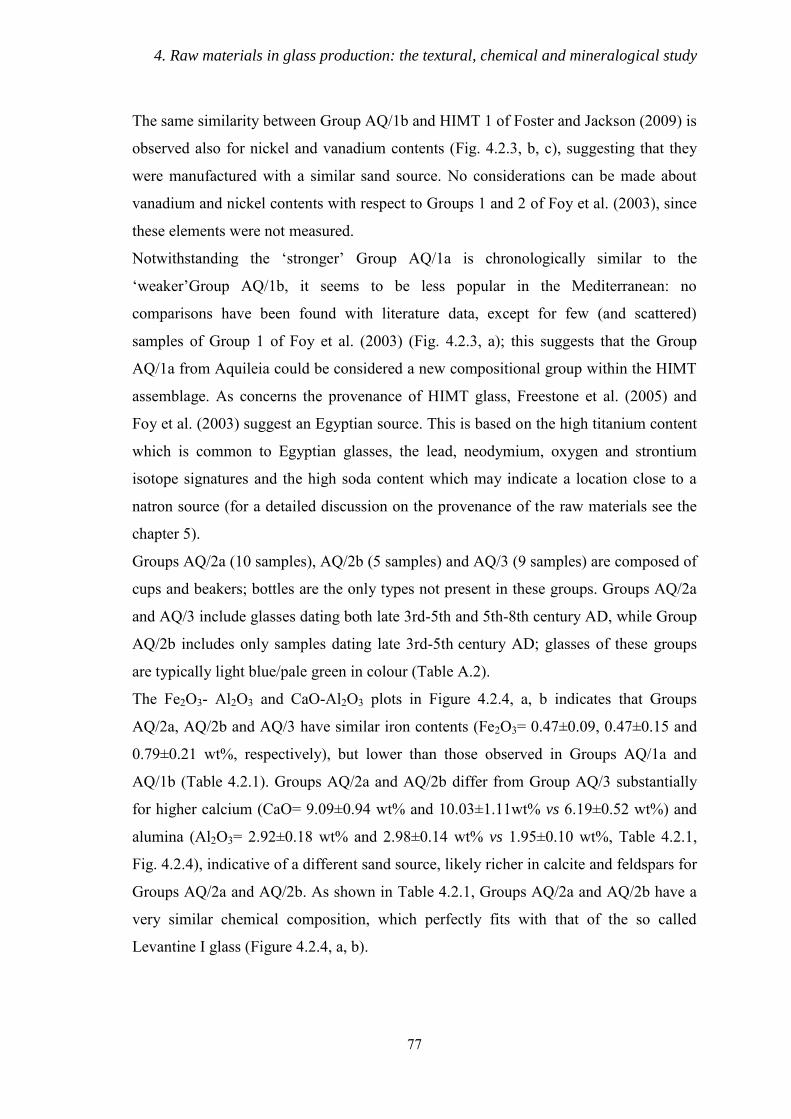
4. Raw materials in glass production: the textural, chemical and mineralogical study
77
The same similarity between Group AQ/1b and HIMT 1 of Foster and Jackson (2009) is
observed also for nickel and vanadium contents (Fig. 4.2.3, b, c), suggesting that they
were manufactured with a similar sand source. No considerations can be made about
vanadium and nickel contents with respect to Groups 1 and 2 of Foy et al. (2003), since
these elements were not measured.
Notwithstanding the „stronger‟ Group AQ/1a is chronologically similar to the
„weaker‟Group AQ/1b, it seems to be less popular in the Mediterranean: no
comparisons have been found with literature data, except for few (and scattered)
samples of Group 1 of Foy et al. (2003) (Fig. 4.2.3, a); this suggests that the Group
AQ/1a from Aquileia could be considered a new compositional group within the HIMT
assemblage. As concerns the provenance of HIMT glass, Freestone et al. (2005) and
Foy et al. (2003) suggest an Egyptian source. This is based on the high titanium content
which is common to Egyptian glasses, the lead, neodymium, oxygen and strontium
isotope signatures and the high soda content which may indicate a location close to a
natron source (for a detailed discussion on the provenance of the raw materials see the
chapter 5).
Groups AQ/2a (10 samples), AQ/2b (5 samples) and AQ/3 (9 samples) are composed of
cups and beakers; bottles are the only types not present in these groups. Groups AQ/2a
and AQ/3 include glasses dating both late 3rd-5th and 5th-8th century AD, while Group
AQ/2b includes only samples dating late 3rd-5th century AD; glasses of these groups
are typically light blue/pale green in colour (Table A.2).
The Fe2O3- Al2O3 and CaO-Al2O3 plots in Figure 4.2.4, a, b indicates that Groups
AQ/2a, AQ/2b and AQ/3 have similar iron contents (Fe2O3= 0.47±0.09, 0.47±0.15 and
0.79±0.21 wt%, respectively), but lower than those observed in Groups AQ/1a and
AQ/1b (Table 4.2.1). Groups AQ/2a and AQ/2b differ from Group AQ/3 substantially
for higher calcium (CaO= 9.09±0.94 wt% and 10.03±1.11wt% vs 6.19±0.52 wt%) and
alumina (Al2O3= 2.92±0.18 wt% and 2.98±0.14 wt% vs 1.95±0.10 wt%, Table 4.2.1,
Fig. 4.2.4), indicative of a different sand source, likely richer in calcite and feldspars for
Groups AQ/2a and AQ/2b. As shown in Table 4.2.1, Groups AQ/2a and AQ/2b have a
very similar chemical composition, which perfectly fits with that of the so called
Levantine I glass (Figure 4.2.4, a, b).
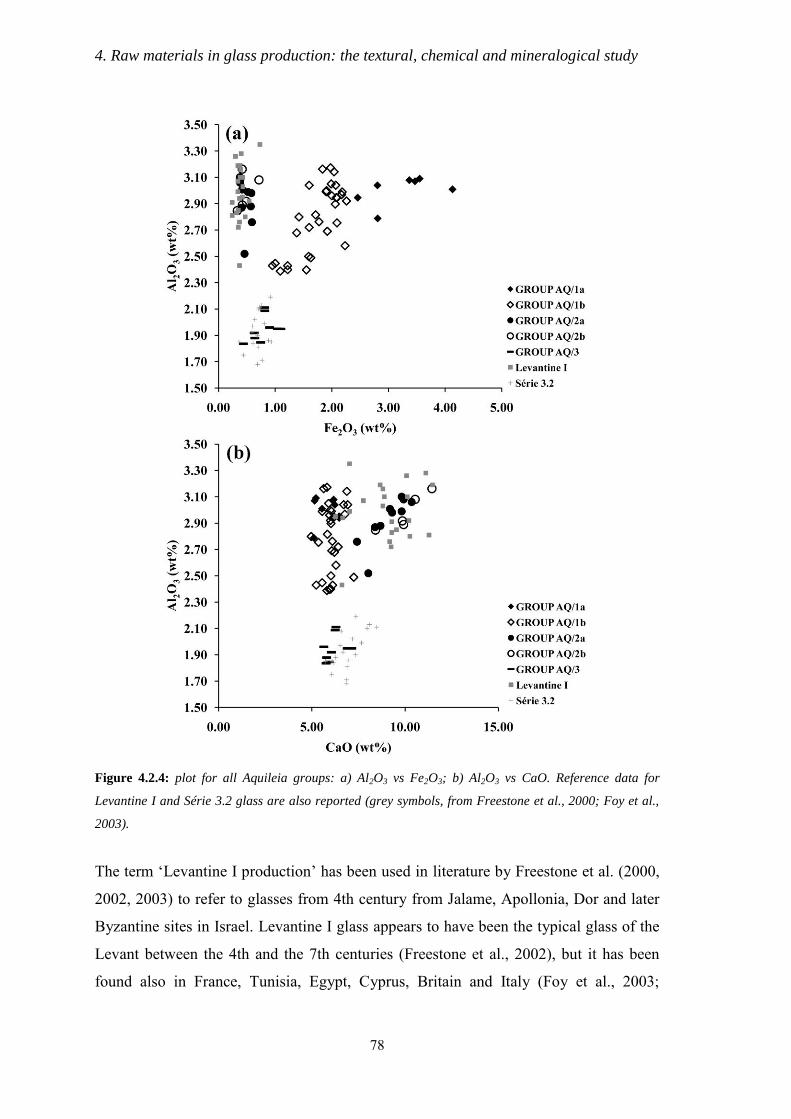
4. Raw materials in glass production: the textural, chemical and mineralogical study
78
Figure 4.2.4: plot for all Aquileia groups: a) Al2O3 vs Fe2O3; b) Al2O3 vs CaO. Reference data for
Levantine I and Série 3.2 glass are also reported (grey symbols, from Freestone et al., 2000; Foy et al.,
2003).
The term „Levantine I production‟ has been used in literature by Freestone et al. (2000,
2002, 2003) to refer to glasses from 4th century from Jalame, Apollonia, Dor and later
Byzantine sites in Israel. Levantine I glass appears to have been the typical glass of the
Levant between the 4th and the 7th centuries (Freestone et al., 2002), but it has been
found also in France, Tunisia, Egypt, Cyprus, Britain and Italy (Foy et al., 2003;
4. Raw materials in glass production: the textural, chemical and mineralogical study
79
Freestone et al., 2002; Silvestri et al., 2005). This glass is characterized by lower levels
of iron oxide (~0.4 %) and soda (~15 %) and higher levels of lime (~ 8.5 %) (Foster and
Jackson, 2009). The production location of Levantine I glasses, from the 4th century
and beyond, is thought to be somewhere in Palestine, using the sands of the Levantine
coasts (Freestone, 2003).
The two Aquileia groups with a Levantine I composition, Group AQ/2a and AQ/2b, are
distinguished essentially on the basis of the MnO content: Group AQ/2a contains
appreciable levels of MnO (1.18±0.22 wt%), whereas Group AQ/2b contains only trace
amounts (0.14±0.11 wt%) (Table 4.2.1, Fig. 4.2.5).
Figure 4.2.5: MnO vs Fe2O3 plot for Groups 2a and 2b, with a Levantine I composition. Note they are
distinguished for different MnO contents, higher in Group 2a (full circles) with respect Group 2b (empty
circle).
Brill, who also observed two groups of similar samples in Jalame glasses (Brill, 1988),
stated that levels of MnO <0.4 % are natural impurities; those samples with higher
concentrations indicate deliberate addition, presumably to affect the colour.
For what concerns the low calcium-low alumina glass belonging to Group AQ/3, Figure
4.2.4, a, b shows it is consistent with glasses of the small Série 3.2 of Foy et al. (2003).
This series, dating 5th-6th century AD, is included in the Group 3 of Foy et al (2003),
with the Série 3.1 and 3.3 (corresponding to Levantine I and Levantine II groups of
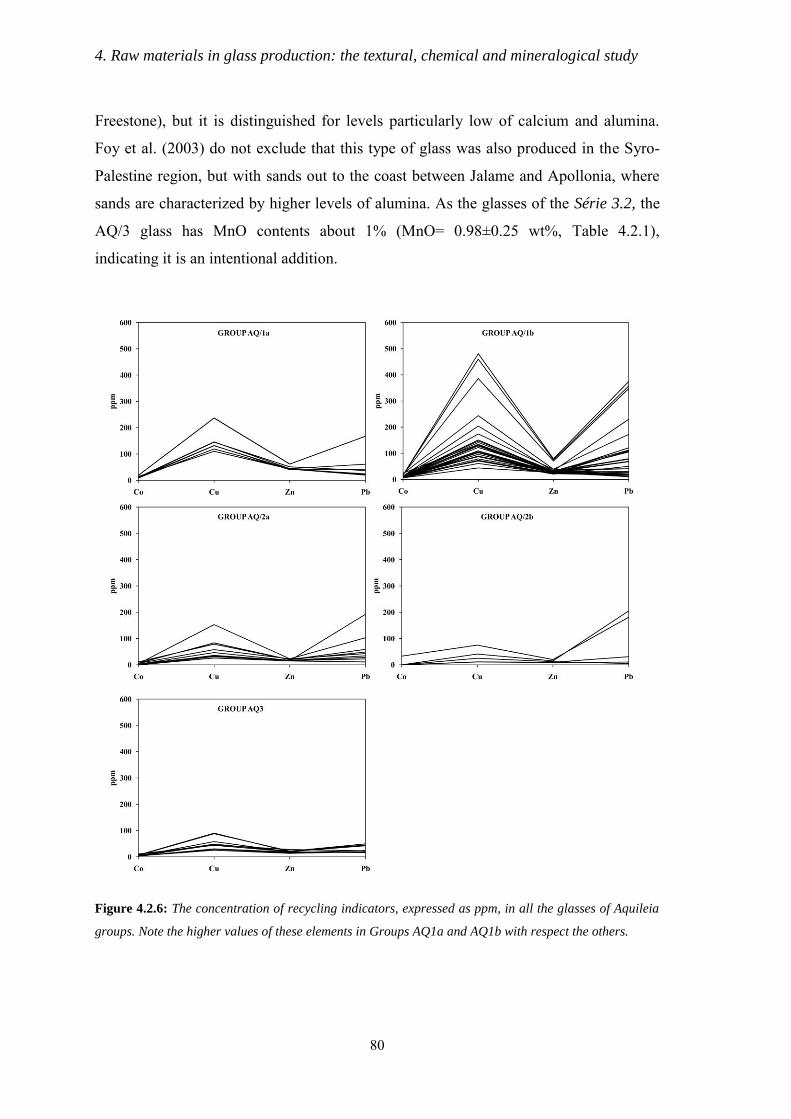
4. Raw materials in glass production: the textural, chemical and mineralogical study
80
Freestone), but it is distinguished for levels particularly low of calcium and alumina.
Foy et al. (2003) do not exclude that this type of glass was also produced in the Syro-
Palestine region, but with sands out to the coast between Jalame and Apollonia, where
sands are characterized by higher levels of alumina. As the glasses of the Série 3.2, the
AQ/3 glass has MnO contents about 1% (MnO= 0.98±0.25 wt%, Table 4.2.1),
indicating it is an intentional addition.
Figure 4.2.6: The concentration of recycling indicators, expressed as ppm, in all the glasses of Aquileia
groups. Note the higher values of these elements in Groups AQ1a and AQ1b with respect the others.
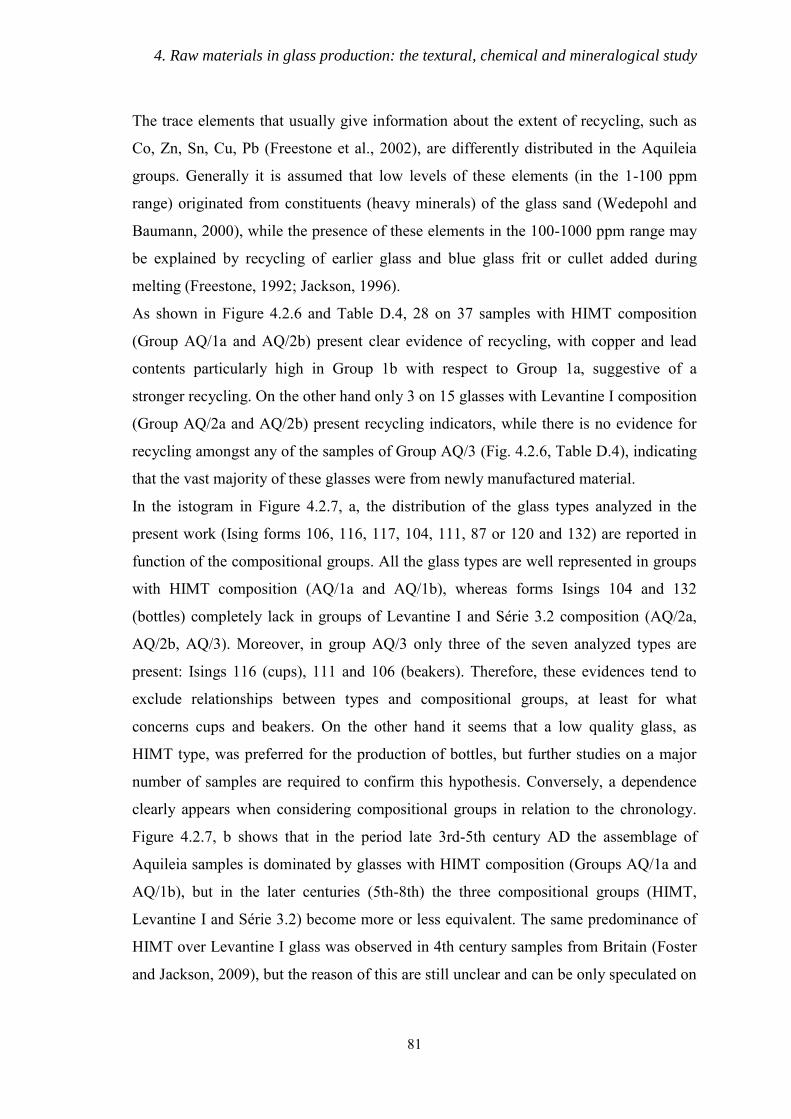
4. Raw materials in glass production: the textural, chemical and mineralogical study
81
The trace elements that usually give information about the extent of recycling, such as
Co, Zn, Sn, Cu, Pb (Freestone et al., 2002), are differently distributed in the Aquileia
groups. Generally it is assumed that low levels of these elements (in the 1-100 ppm
range) originated from constituents (heavy minerals) of the glass sand (Wedepohl and
Baumann, 2000), while the presence of these elements in the 100-1000 ppm range may
be explained by recycling of earlier glass and blue glass frit or cullet added during
melting (Freestone, 1992; Jackson, 1996).
As shown in Figure 4.2.6 and Table D.4, 28 on 37 samples with HIMT composition
(Group AQ/1a and AQ/2b) present clear evidence of recycling, with copper and lead
contents particularly high in Group 1b with respect to Group 1a, suggestive of a
stronger recycling. On the other hand only 3 on 15 glasses with Levantine I composition
(Group AQ/2a and AQ/2b) present recycling indicators, while there is no evidence for
recycling amongst any of the samples of Group AQ/3 (Fig. 4.2.6, Table D.4), indicating
that the vast majority of these glasses were from newly manufactured material.
In the istogram in Figure 4.2.7, a, the distribution of the glass types analyzed in the
present work (Ising forms 106, 116, 117, 104, 111, 87 or 120 and 132) are reported in
function of the compositional groups. All the glass types are well represented in groups
with HIMT composition (AQ/1a and AQ/1b), whereas forms Isings 104 and 132
(bottles) completely lack in groups of Levantine I and Série 3.2 composition (AQ/2a,
AQ/2b, AQ/3). Moreover, in group AQ/3 only three of the seven analyzed types are
present: Isings 116 (cups), 111 and 106 (beakers). Therefore, these evidences tend to
exclude relationships between types and compositional groups, at least for what
concerns cups and beakers. On the other hand it seems that a low quality glass, as
HIMT type, was preferred for the production of bottles, but further studies on a major
number of samples are required to confirm this hypothesis. Conversely, a dependence
clearly appears when considering compositional groups in relation to the chronology.
Figure 4.2.7, b shows that in the period late 3rd-5th century AD the assemblage of
Aquileia samples is dominated by glasses with HIMT composition (Groups AQ/1a and
AQ/1b), but in the later centuries (5th-8th) the three compositional groups (HIMT,
Levantine I and Série 3.2) become more or less equivalent. The same predominance of
HIMT over Levantine I glass was observed in 4th century samples from Britain (Foster
and Jackson, 2009), but the reason of this are still unclear and can be only speculated on
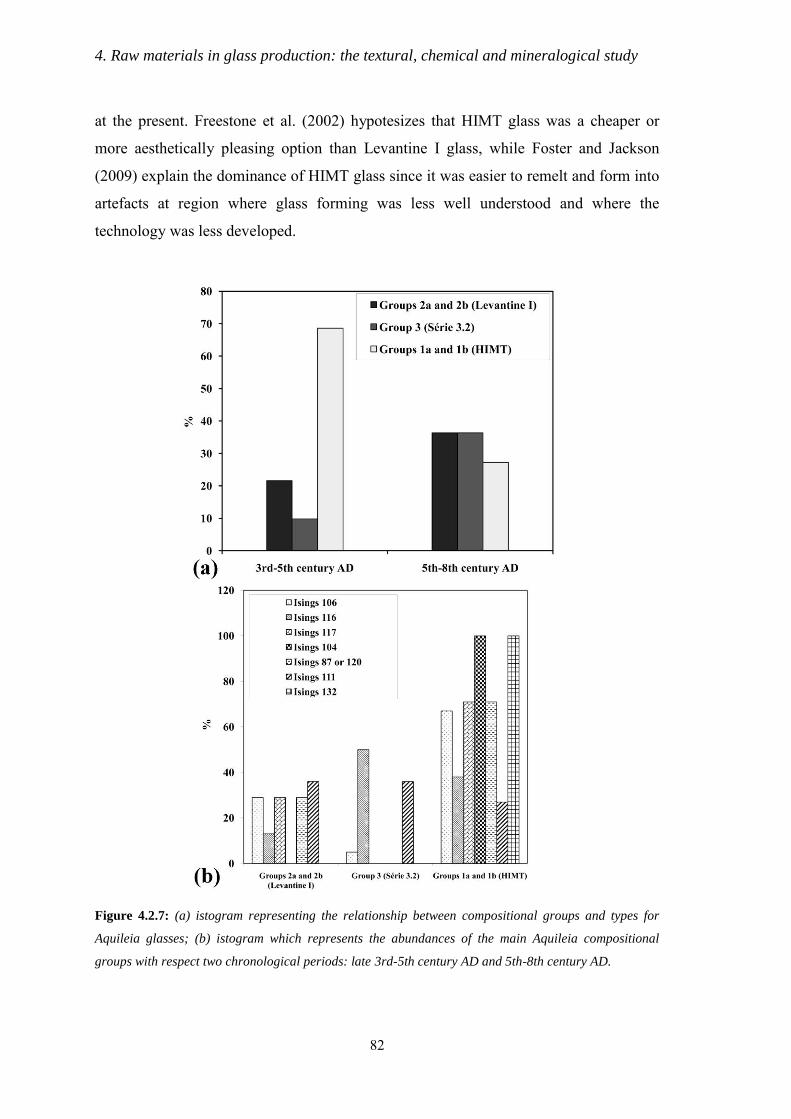
4. Raw materials in glass production: the textural, chemical and mineralogical study
82
at the present. Freestone et al. (2002) hypotesizes that HIMT glass was a cheaper or
more aesthetically pleasing option than Levantine I glass, while Foster and Jackson
(2009) explain the dominance of HIMT glass since it was easier to remelt and form into
artefacts at region where glass forming was less well understood and where the
technology was less developed.
Figure 4.2.7: (a) istogram representing the relationship between compositional groups and types for
Aquileia glasses; (b) istogram which represents the abundances of the main Aquileia compositional
groups with respect two chronological periods: late 3rd-5th century AD and 5th-8th century AD.
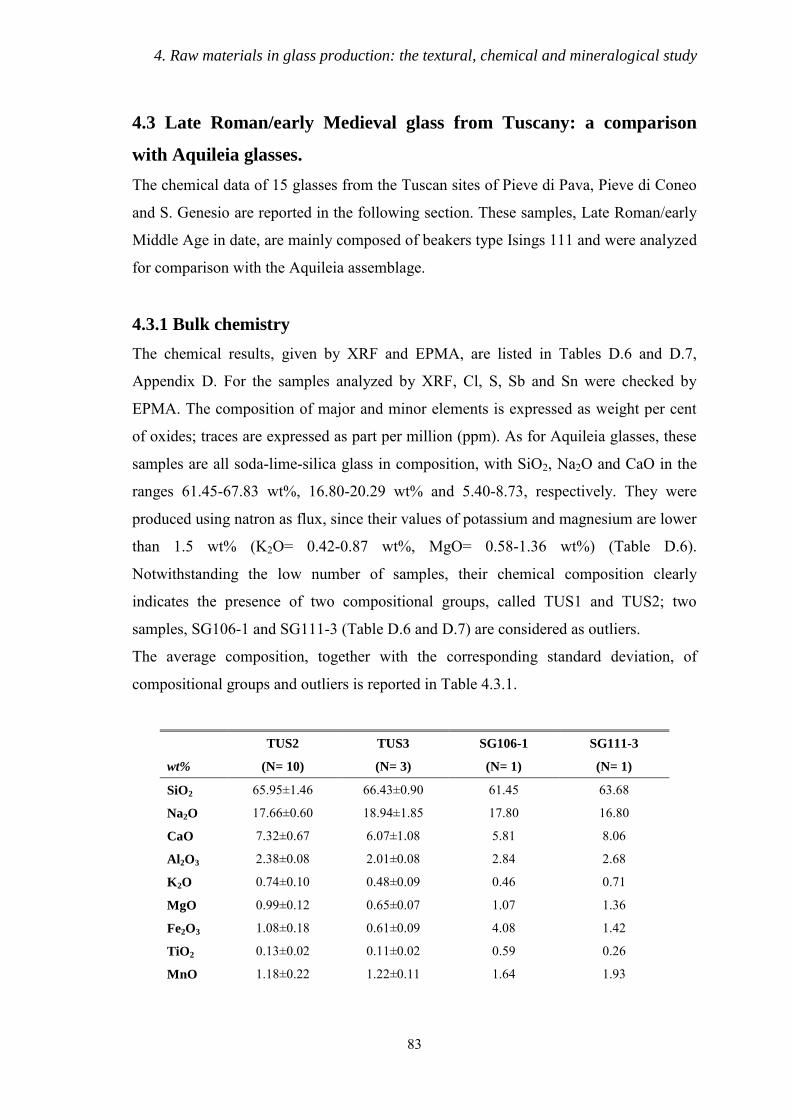
4. Raw materials in glass production: the textural, chemical and mineralogical study
83
4.3 Late Roman/early Medieval glass from Tuscany: a comparison
with Aquileia glasses.
The chemical data of 15 glasses from the Tuscan sites of Pieve di Pava, Pieve di Coneo
and S. Genesio are reported in the following section. These samples, Late Roman/early
Middle Age in date, are mainly composed of beakers type Isings 111 and were analyzed
for comparison with the Aquileia assemblage.
4.3.1 Bulk chemistry
The chemical results, given by XRF and EPMA, are listed in Tables D.6 and D.7,
Appendix D. For the samples analyzed by XRF, Cl, S, Sb and Sn were checked by
EPMA. The composition of major and minor elements is expressed as weight per cent
of oxides; traces are expressed as part per million (ppm). As for Aquileia glasses, these
samples are all soda-lime-silica glass in composition, with SiO2, Na2O and CaO in the
ranges 61.45-67.83 wt%, 16.80-20.29 wt% and 5.40-8.73, respectively. They were
produced using natron as flux, since their values of potassium and magnesium are lower
than 1.5 wt% (K2O= 0.42-0.87 wt%, MgO= 0.58-1.36 wt%) (Table D.6).
Notwithstanding the low number of samples, their chemical composition clearly
indicates the presence of two compositional groups, called TUS1 and TUS2; two
samples, SG106-1 and SG111-3 (Table D.6 and D.7) are considered as outliers.
The average composition, together with the corresponding standard deviation, of
compositional groups and outliers is reported in Table 4.3.1.
TUS2 TUS3 SG106-1 SG111-3
wt% (N= 10) (N= 3) (N= 1) (N= 1)
SiO2 65.95±1.46 66.43±0.90 61.45 63.68
Na2O 17.66±0.60 18.94±1.85 17.80 16.80
CaO 7.32±0.67 6.07±1.08 5.81 8.06
Al2O3 2.38±0.08 2.01±0.08 2.84 2.68
K2O 0.74±0.10 0.48±0.09 0.46 0.71
MgO 0.99±0.12 0.65±0.07 1.07 1.36
Fe2O3 1.08±0.18 0.61±0.09 4.08 1.42
TiO2 0.13±0.02 0.11±0.02 0.59 0.26
MnO 1.18±0.22 1.22±0.11 1.64 1.93
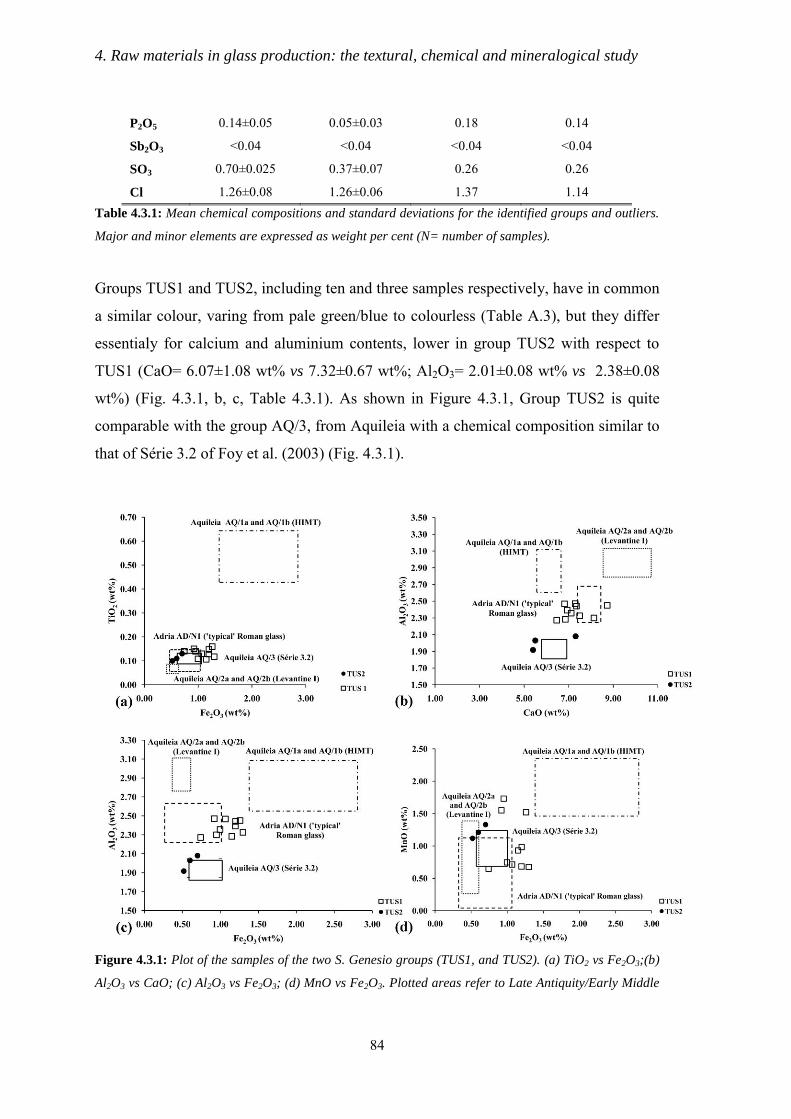
4. Raw materials in glass production: the textural, chemical and mineralogical study
84
P2O5 0.14±0.05 0.05±0.03 0.18 0.14
Sb2O3 <0.04 <0.04 <0.04 <0.04
SO3 0.70±0.025 0.37±0.07 0.26 0.26
Cl 1.26±0.08 1.26±0.06 1.37 1.14 Table 4.3.1: Mean chemical compositions and standard deviations for the identified groups and outliers.
Major and minor elements are expressed as weight per cent (N= number of samples).
Groups TUS1 and TUS2, including ten and three samples respectively, have in common
a similar colour, varing from pale green/blue to colourless (Table A.3), but they differ
essentialy for calcium and aluminium contents, lower in group TUS2 with respect to
TUS1 (CaO= 6.07±1.08 wt% vs 7.32±0.67 wt%; Al2O3= 2.01±0.08 wt% vs 2.38±0.08
wt%) (Fig. 4.3.1, b, c, Table 4.3.1). As shown in Figure 4.3.1, Group TUS2 is quite
comparable with the group AQ/3, from Aquileia with a chemical composition similar to
that of Série 3.2 of Foy et al. (2003) (Fig. 4.3.1).
Figure 4.3.1: Plot of the samples of the two S. Genesio groups (TUS1, and TUS2). (a) TiO2 vs Fe2O3;(b)
Al2O3 vs CaO; (c) Al2O3 vs Fe2O3; (d) MnO vs Fe2O3. Plotted areas refer to Late Antiquity/Early Middle
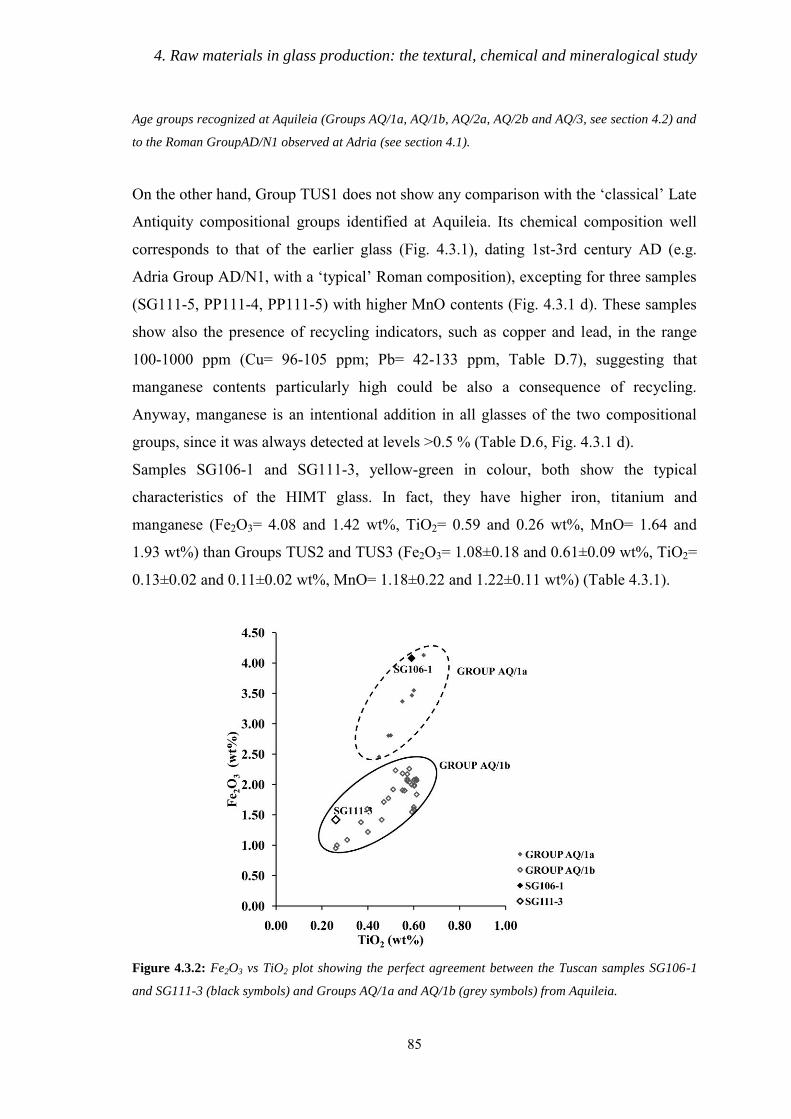
4. Raw materials in glass production: the textural, chemical and mineralogical study
85
Age groups recognized at Aquileia (Groups AQ/1a, AQ/1b, AQ/2a, AQ/2b and AQ/3, see section 4.2) and
to the Roman GroupAD/N1 observed at Adria (see section 4.1).
On the other hand, Group TUS1 does not show any comparison with the „classical‟ Late
Antiquity compositional groups identified at Aquileia. Its chemical composition well
corresponds to that of the earlier glass (Fig. 4.3.1), dating 1st-3rd century AD (e.g.
Adria Group AD/N1, with a „typical‟ Roman composition), excepting for three samples
(SG111-5, PP111-4, PP111-5) with higher MnO contents (Fig. 4.3.1 d). These samples
show also the presence of recycling indicators, such as copper and lead, in the range
100-1000 ppm (Cu= 96-105 ppm; Pb= 42-133 ppm, Table D.7), suggesting that
manganese contents particularly high could be also a consequence of recycling.
Anyway, manganese is an intentional addition in all glasses of the two compositional
groups, since it was always detected at levels >0.5 % (Table D.6, Fig. 4.3.1 d).
Samples SG106-1 and SG111-3, yellow-green in colour, both show the typical
characteristics of the HIMT glass. In fact, they have higher iron, titanium and
manganese (Fe2O3= 4.08 and 1.42 wt%, TiO2= 0.59 and 0.26 wt%, MnO= 1.64 and
1.93 wt%) than Groups TUS2 and TUS3 (Fe2O3= 1.08±0.18 and 0.61±0.09 wt%, TiO2=
0.13±0.02 and 0.11±0.02 wt%, MnO= 1.18±0.22 and 1.22±0.11 wt%) (Table 4.3.1).
Figure 4.3.2: Fe2O3 vs TiO2 plot showing the perfect agreement between the Tuscan samples SG106-1
and SG111-3 (black symbols) and Groups AQ/1a and AQ/1b (grey symbols) from Aquileia.
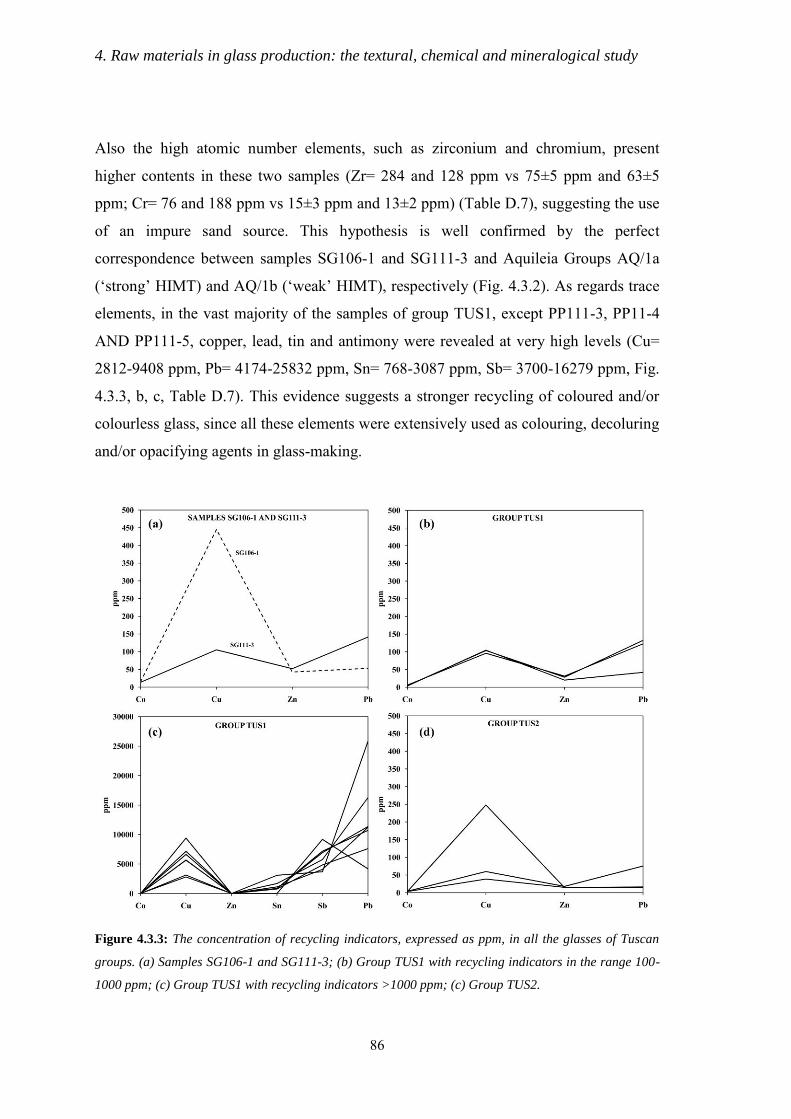
4. Raw materials in glass production: the textural, chemical and mineralogical study
86
Also the high atomic number elements, such as zirconium and chromium, present
higher contents in these two samples (Zr= 284 and 128 ppm vs 75±5 ppm and 63±5
ppm; Cr= 76 and 188 ppm vs 15±3 ppm and 13±2 ppm) (Table D.7), suggesting the use
of an impure sand source. This hypothesis is well confirmed by the perfect
correspondence between samples SG106-1 and SG111-3 and Aquileia Groups AQ/1a
(„strong‟ HIMT) and AQ/1b („weak‟ HIMT), respectively (Fig. 4.3.2). As regards trace
elements, in the vast majority of the samples of group TUS1, except PP111-3, PP11-4
AND PP111-5, copper, lead, tin and antimony were revealed at very high levels (Cu=
2812-9408 ppm, Pb= 4174-25832 ppm, Sn= 768-3087 ppm, Sb= 3700-16279 ppm, Fig.
4.3.3, b, c, Table D.7). This evidence suggests a stronger recycling of coloured and/or
colourless glass, since all these elements were extensively used as colouring, decoluring
and/or opacifying agents in glass-making.
Figure 4.3.3: The concentration of recycling indicators, expressed as ppm, in all the glasses of Tuscan
groups. (a) Samples SG106-1 and SG111-3; (b) Group TUS1 with recycling indicators in the range 100-
1000 ppm; (c) Group TUS1 with recycling indicators >1000 ppm; (c) Group TUS2.
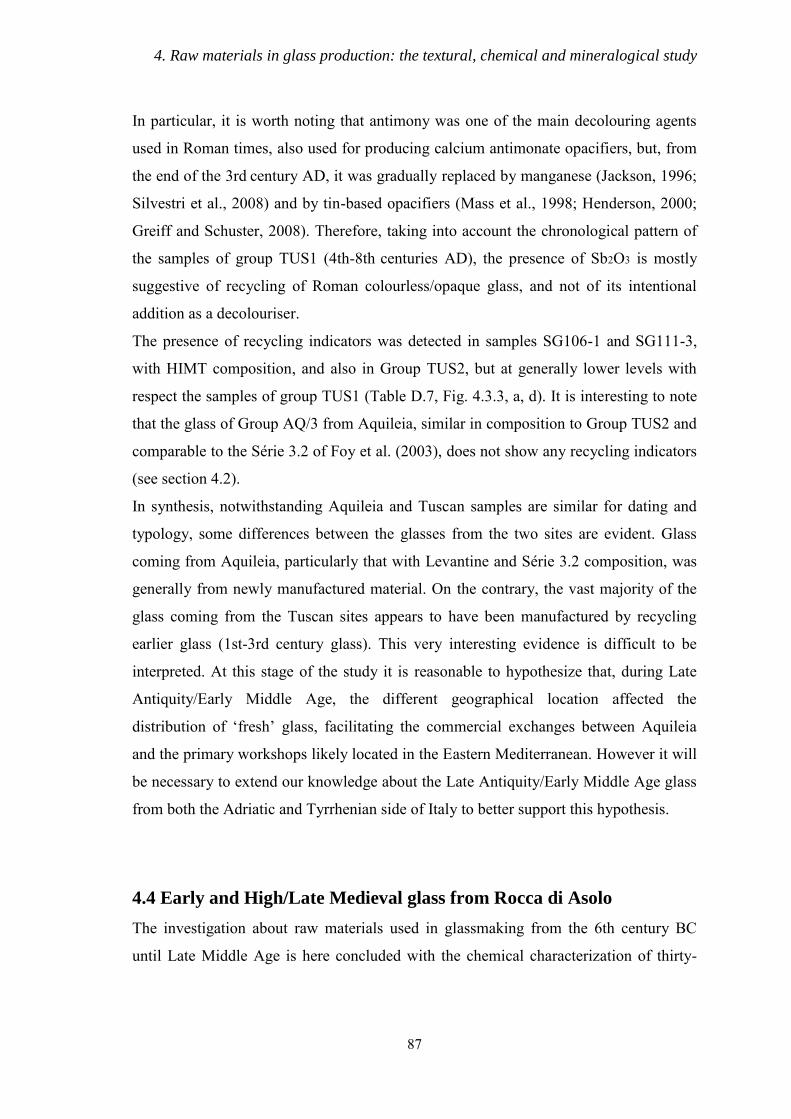
4. Raw materials in glass production: the textural, chemical and mineralogical study
87
In particular, it is worth noting that antimony was one of the main decolouring agents
used in Roman times, also used for producing calcium antimonate opacifiers, but, from
the end of the 3rd century AD, it was gradually replaced by manganese (Jackson, 1996;
Silvestri et al., 2008) and by tin-based opacifiers (Mass et al., 1998; Henderson, 2000;
Greiff and Schuster, 2008). Therefore, taking into account the chronological pattern of
the samples of group TUS1 (4th-8th centuries AD), the presence of Sb2O3 is mostly
suggestive of recycling of Roman colourless/opaque glass, and not of its intentional
addition as a decolouriser.
The presence of recycling indicators was detected in samples SG106-1 and SG111-3,
with HIMT composition, and also in Group TUS2, but at generally lower levels with
respect the samples of group TUS1 (Table D.7, Fig. 4.3.3, a, d). It is interesting to note
that the glass of Group AQ/3 from Aquileia, similar in composition to Group TUS2 and
comparable to the Série 3.2 of Foy et al. (2003), does not show any recycling indicators
(see section 4.2).
In synthesis, notwithstanding Aquileia and Tuscan samples are similar for dating and
typology, some differences between the glasses from the two sites are evident. Glass
coming from Aquileia, particularly that with Levantine and Série 3.2 composition, was
generally from newly manufactured material. On the contrary, the vast majority of the
glass coming from the Tuscan sites appears to have been manufactured by recycling
earlier glass (1st-3rd century glass). This very interesting evidence is difficult to be
interpreted. At this stage of the study it is reasonable to hypothesize that, during Late
Antiquity/Early Middle Age, the different geographical location affected the
distribution of „fresh‟ glass, facilitating the commercial exchanges between Aquileia
and the primary workshops likely located in the Eastern Mediterranean. However it will
be necessary to extend our knowledge about the Late Antiquity/Early Middle Age glass
from both the Adriatic and Tyrrhenian side of Italy to better support this hypothesis.
4.4 Early and High/Late Medieval glass from Rocca di Asolo
The investigation about raw materials used in glassmaking from the 6th century BC
until Late Middle Age is here concluded with the chemical characterization of thirty-
4. Raw materials in glass production: the textural, chemical and mineralogical study
88
three samples coming from Rocca di Asolo and dating from the early Middle Age to
High/Late Middle Age.
The Asolo sample set is both composed of window panes (7th-10th century AD and
15th century AD) and objects (beakers and bottles), all 12th-15th century AD in age.
4.4.1 Bulk chemistry
The chemical data are listed in Table D.8 (Appendix D): major and minor elements are
expressed as weight per cent of oxides and traces in parts per million (ppm). For the
beakers decorated with blue rims, sample labels include the letters „t‟ to indicate the
colourless body and „b‟ for the blue glass. All samples are soda-lime-silica glass with
SiO2, Na2O and CaO in the ranges of 61.8-70.9 wt%, 9.6-19.1 wt% and 3.7-12.8 wt%,
respectively. Early Medieval samples have lower potassium and magnesium contents
(K2O=0.56-0.89 wt%, MgO=0.64-1.44 wt%) than the others (K2O=2.09-2.88 wt%,
MgO=1.79-4.49 wt%) (Table D.8). This suggests that the High and Late Medieval
samples, including four window panes and 21 objects (beakers and bottles) were
produced with soda-rich plant ash as a network modifier, whereas the Early Medieval
ones, comprising eight window panes, were produced with natron as flux.
Natron glass
Some interesting observations may be made about the Asolo natron glass, in spite of
their low number. As shown in the plots in Figure 4.4.1, they fall into two groups with
differing chemical characteristics, called for convenience groups N/1 and N/2. Group
N/1 contains only two pale blue panes; group N/2 contains six panes, yellowish-green in
colour. With respect to group N/2, group N/1 has higher SiO2 contents (69.46±0.77
wt% vs 65.59±1.16 wt%, Table 4.4.1) and lower MgO and MnO (MgO= 0.79±0.21
wt% vs 1.31±0.08 wt%, MnO= 0.90±0.45 wt% vs 1.87±0.21 wt%, Table 4.4.1; Fig.
4.4.1, a, b, d). Both groups are consistent with some of the major compositional groups
of natron glasses identified in the first millennium AD in the Western Mediterranean
(Table 4.4.1). Group N/1 of Asolo glasses is both similar to “Group 3” of Foy et al.
(2003) and “Group A2/1” of Silvestri et al. (2005) (Table 4.4.1; Fig. 4.4.1), including
Roman and Early Medieval glasses found in the West. This group is thought to be the
„typical‟ Roman glass, produced with coastal sands of the Syro-Palestinian region,
probably near the mouth of the river Belus (Foy et al., 2003). However, unlike reference
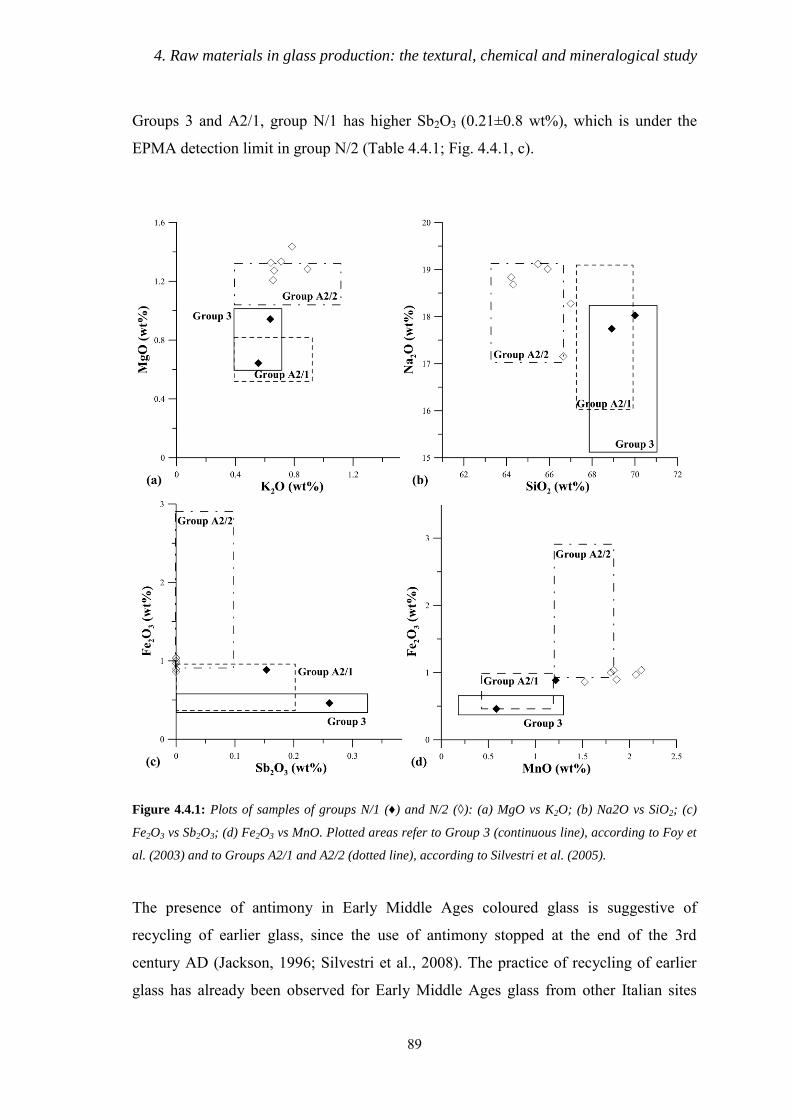
4. Raw materials in glass production: the textural, chemical and mineralogical study
89
Groups 3 and A2/1, group N/1 has higher Sb2O3 (0.21±0.8 wt%), which is under the
EPMA detection limit in group N/2 (Table 4.4.1; Fig. 4.4.1, c).
Figure 4.4.1: Plots of samples of groups N/1 (♦) and N/2 (◊): (a) MgO vs K2O; (b) Na2O vs SiO2; (c)
Fe2O3 vs Sb2O3; (d) Fe2O3 vs MnO. Plotted areas refer to Group 3 (continuous line), according to Foy et
al. (2003) and to Groups A2/1 and A2/2 (dotted line), according to Silvestri et al. (2005).
The presence of antimony in Early Middle Ages coloured glass is suggestive of
recycling of earlier glass, since the use of antimony stopped at the end of the 3rd
century AD (Jackson, 1996; Silvestri et al., 2008). The practice of recycling of earlier
glass has already been observed for Early Middle Ages glass from other Italian sites
4. Raw materials in glass production: the textural, chemical and mineralogical study
90
(Mirti et al., 2000; Verità et al., 2002). Following Silvestri (2008), a recycling index
(RI) was calculated, with a value of about 24%, indicating that the group N/1 samples
were probably produced by recycling about 24% of colourless antimony glass in the
batch.
On the other hand, Group N/2, shows a good match with “Group A2/2” of Silvestri et
al. (2005) (Fig. 4.4.1, a, b, c, d; Table 4.4.1), composed of HIMT glass from North-East
Italy and dated to the 5th-8th centuries AD. In fact this group presents all the typical
characteristics of HIMT glass, that are high contents of Fe2O3 (0.97±0.07 wt%), MnO
(1.87±0.21 wt%) and MgO (1.31±0.08 wt%), together with positive correlations
between Fe2O3 and Al2O3 (R2= 0.89).
Genarally speaking the composition of Asolo natron glasses shows many analogies with
the Late Antiquity Tuscan samples. The predominant compositional groups are
represented by HIMT and by 1st-3rd century recycled glass – no other groups of those
attested at Aquileia and in the Mediterranean until the end of the 1st millennium AD,
such as Levantine I and Série 3.2, were recognized in Asolo.
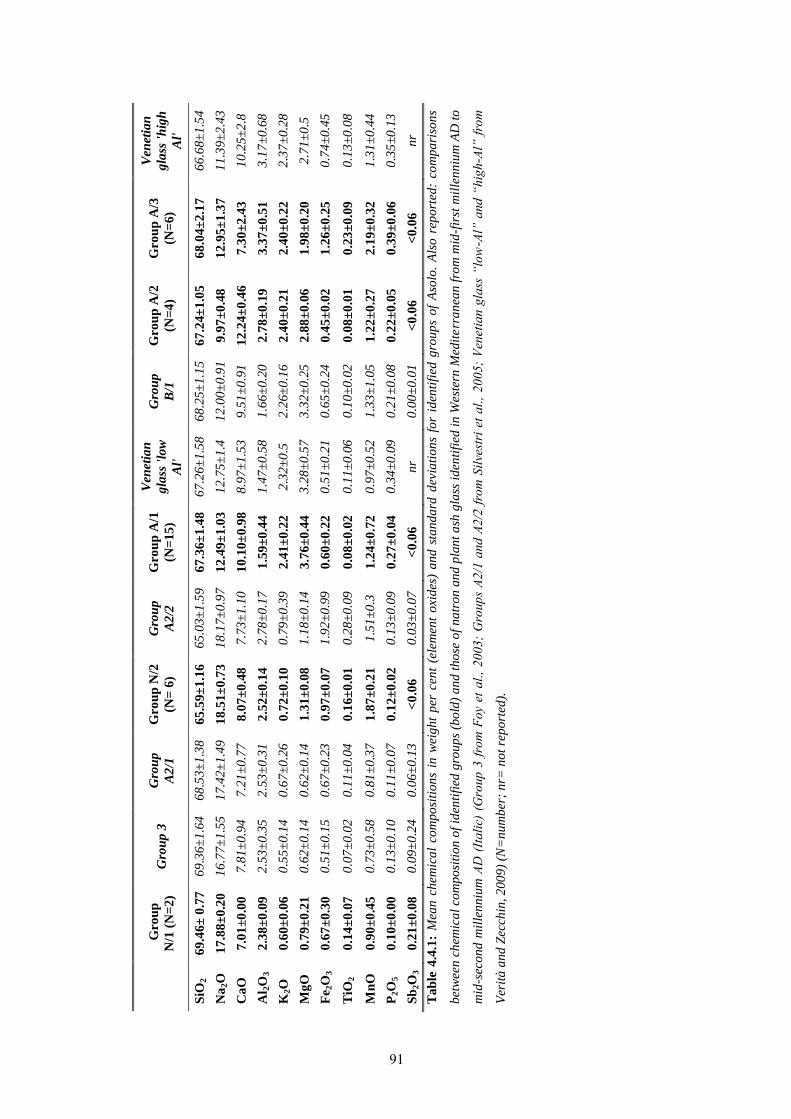
Gro
up
N/1
(N
=2
) G
rou
p 3
G
rou
p
A2
/1
Gro
up
N/2
(N=
6)
Gro
up
A2
/2
Gro
up
A/1
(N=
15
)
Ven
etia
n
gla
ss '
low
Al'
Gro
up
B/1
Gro
up
A/2
(N=
4)
Gro
up
A/3
(N=
6)
Ven
etia
n
gla
ss '
hig
h
Al'
SiO
2
69
.46±
0.7
7
69
.36±
1.6
4
68
.53±
1.3
8
65
.59±
1.1
6
65
.03±
1.5
9
67
.36±
1.4
8
67
.26±
1.5
8
68
.25±
1.1
5
67
.24±
1.0
5
68
.04±
2.1
7
66
.68±
1.5
4
Na
2O
1
7.8
8±
0.2
0
16
.77±
1.5
5
17
.42±
1.4
9
18
.51±
0.7
3
18
.17±
0.9
7
12
.49±
1.0
3
12
.75±
1.4
1
2.0
0±
0.9
1
9.9
7±
0.4
8
12
.95±
1.3
7
11
.39±
2.4
3
Ca
O
7.0
1±
0.0
0
7.8
1±
0.9
4
7.2
1±
0.7
7
8.0
7±
0.4
8
7.7
3±
1.1
0
10
.10±
0.9
8
8.9
7±
1.5
3
9.5
1±
0.9
1
12
.24±
0.4
6
7.3
0±
2.4
3
10
.25±
2.8
Al 2
O3
2.3
8±
0.0
9
2.5
3±
0.3
5
2.5
3±
0.3
1
2.5
2±
0.1
4
2.7
8±
0.1
7
1.5
9±
0.4
4
1.4
7±
0.5
8
1.6
6±
0.2
0
2.7
8±
0.1
9
3.3
7±
0.5
1
3.1
7±
0.6
8
K2O
0
.60
±0
.06
0
.55
±0
.14
0
.67
±0
.26
0
.72
±0
.10
0
.79
±0
.39
2
.41
±0
.22
2
.32
±0
.5
2.2
6±
0.1
6
2.4
0±
0.2
1
2.4
0±
0.2
2
2.3
7±
0.2
8
Mg
O
0.7
9±
0.2
1
0.6
2±
0.1
4
0.6
2±
0.1
4
1.3
1±
0.0
8
1.1
8±
0.1
4
3.7
6±
0.4
4
3.2
8±
0.5
7
3.3
2±
0.2
5
2.8
8±
0.0
6
1.9
8±
0.2
0
2.7
1±
0.5
Fe 2
O3
0.6
7±
0.3
0
0.5
1±
0.1
5
0.6
7±
0.2
3
0.9
7±
0.0
7
1.9
2±
0.9
9
0.6
0±
0.2
2
0.5
1±
0.2
1
0.6
5±
0.2
4
0.4
5±
0.0
2
1.2
6±
0.2
5
0.7
4±
0.4
5
TiO
2
0.1
4±
0.0
7
0.0
7±
0.0
2
0.1
1±
0.0
4
0.1
6±
0.0
1
0.2
8±
0.0
9
0.0
8±
0.0
2
0.1
1±
0.0
6
0.1
0±
0.0
2
0.0
8±
0.0
1
0.2
3±
0.0
9
0.1
3±
0.0
8
Mn
O
0.9
0±
0.4
5
0.7
3±
0.5
8
0.8
1±
0.3
7
1.8
7±
0.2
1
1.5
1±
0.3
1
.24
±0
.72
0
.97
±0
.52
1
.33
±1
.05
1
.22
±0
.27
2
.19
±0
.32
1
.31
±0
.44
P2O
5
0.1
0±
0.0
0
0.1
3±
0.1
0
0.1
1±
0.0
7
0.1
2±
0.0
2
0.1
3±
0.0
9
0.2
7±
0.0
4
0.3
4±
0.0
9
0.2
1±
0.0
8
0.2
2±
0.0
5
0.3
9±
0.0
6
0.3
5±
0.1
3
Sb
2O
3
0.2
1±
0.0
8
0.0
9±
0.2
4
0.0
6±
0.1
3
<0
.06
0.0
3±
0.0
7
<0
.06
nr
0.0
0±
0.0
1
<0
.06
<0
.06
nr
Ta
ble
4.4
.1:
Mea
n c
hem
ica
l co
mp
osi
tio
ns
in w
eig
ht
per
cen
t (e
lem
ent
oxi
des
) a
nd
sta
nd
ard
dev
iati
on
s fo
r id
enti
fied
gro
up
s o
f A
solo
. A
lso
rep
ort
ed:
com
pa
riso
ns
bet
wee
n c
hem
ica
l co
mp
osi
tio
n o
f id
enti
fied
gro
up
s (b
old
) a
nd
th
ose
of
na
tro
n a
nd
pla
nt
ash
gla
ss i
den
tifi
ed i
n W
est
ern
Med
ite
rra
nea
n f
rom
mid
-fir
st m
ille
nn
ium
AD
to
mid
-sec
on
d m
ille
nn
ium
AD
(It
ali
c) (
Gro
up
3 f
rom
Fo
y et
al.
, 2
003
; G
rou
ps
A2
/1 a
nd
A2/2
fro
m S
ilve
stri
et
al.
, 2
00
5;
Ven
etia
n g
lass
“lo
w-A
l” a
nd
“h
igh
-Al”
fro
m
Ver
ità
an
d Z
ecch
in, 2
00
9)
(N=
nu
mb
er;
nr=
no
t re
po
rted
).
91
4. Raw materials in glass production: the textural, chemical and mineralogical study
92
Soda ash glass
Ash glass from Asolo was obtained with ash from coastal plants, which introduces high
levels of Na2O (9.58-14.29 wt %, Table D.8) and low levels of K2O (2.09-2.88 wt%,
Table D.8) when compared with wood ash (Na2O= 0.89±0.99 wt%, K2O= 13±5 wt %)
(Wedepohl et al., 2011). The high level of CaO (3.70-12.83 wt%, Table D.8) is also due
to plant ash and not to the carbonatic fraction of sand, as confirmed by analyses of
Levantine plant ash, which typically have high CaO (Brill, 1970; Ashtor and Cevidalli,
1983; Verità, 1985). During the Middle Ages, coastal plant ash was reported to have
been imported into Italy from the Eastern Mediterranean (Levantine ash) (Verità and
Zecchin, 2009) or from near Alicante in Spain (Frank, 1982). Because of the different
nature of the soil and of the plants used, these two types of ash produce different glass
compositions: Spanish ash yields glass with a Na2O/K2O ratio of about 2, and
Levantine ash glass in which the Na2O/K2O ratio is about 5 (Cagno et al., 2008, 2010).
In the Asolo ash glass samples, the Na2O/K2O ratio varies from 4.2 to 6.7, suggesting
that Levantine ash was used in their production. These data may support the hypothesis
of Venetian provenance: from the end of the 14th century Asolo was under the
influence of Venice, the most important Italian glass manufacturer and the main
importer of Levantine ash in this period. In Venice, the use of Levantine ash had
become mandatory by the early 14th century, because the government was determined
to ensure the high quality of Venetian glassware (Jacobi, 1993).
On the basis of their chemical characteristics, the Asolo soda ash glass is subdivided
into three groups: group A/1, composed of 15 samples, A/2 (4 samples) and A/3 (6
samples). A first distinction can be made between group A/1 and groups A/2 and A/3 in
view of their Al2O3 contents: group A/1 has lower Al2O3 (1.59±0.44 wt%) with respect
to groups A/2 and A/3 (2.91±0.33 and 3.35±0.57 wt%, respectively) (Table 4.4.1). As
already observed by other authors (Cagno et al., 2008, 2010; Verità and Zecchin, 2009),
this evidence suggests the use of different silica sources to produce Asolo soda ash
glass: a purer silica source, such as siliceous pebbles, for the samples of group A/1, and
sands richer in feldspars for those of groups A/2 and A/3. The separation into three
groups is well illustrated in Fig. 4.4.2: groups A/2 and A/3, as already mentioned, have
higher Al2O3 contents with respect to group A/1, whereas the distinction between
groups A/2 and A/3 is given by the Fe2O3 contents, higher in group A/3 (1.26±0.25 vs

4. Raw materials in glass production: the textural, chemical and mineralogical study
93
0.45±0.02 wt% in group A/2, Table 4.4.1). In addition, group A/3 has lower MgO and
higher TiO2 (Fig. 4.4.2) and MnO (Table 4.4.1) than the other groups. These data,
particularly the higher contents of Fe2O3 and TiO2, may indicate the presence of greater
amounts of heavy minerals in the sand used to produce the samples of group A/3.
Figure 4.4.2: Plots of samples of A/1 (squares), A/2 (circles) and A/3 (triangles) groups: (a) Al2O3 vs
Fe2O3, plotted areas refer to “High-Al” and “Low-Al‟ groups according to Verità and Zecchin (2009);
(b) TiO2 vs Fe2O3. Each symbol has characteristic indicating type of sample: full symbol, bottle; empty
symbol, beakers; halved symbol, window panes; star, blue rims.
4. Raw materials in glass production: the textural, chemical and mineralogical study
94
As shown in Figure 4.4.2, group A/1 is mainly composed of window panes and beakers
(both nuppenbecher and flat base glasses) and groups A/2 and A/3 comprise the vast
majority of the bottles. This evidence is suggestive of a relationship between raw
materials and type: a purer sand source, probably originally siliceous pebbles, was
employed to produce the more precious products, such as window panes and beakers,
and a lower-quality sand was used to produce bottles. The same subdivision into “low-
Al” and “high-Al” glasses, recognised in the Asolo soda ash samples, has been
observed in some Venetian glass, dating to the 11th-14th centuries (Verità and Zecchin,
2009) (Fig. 4.4.2, a), suggesting the possible provenance of Asolo findings from
Venice. In particular, groups A/2 and A/3 show a good match with the chemical
composition of “high-Al” Venetian glass, and group A/1 has composition similar to the
“low-Al” group (Table 4.4.1). Group A/1 is also similar to group B/1 of Silvestri et al.
(2005), including Medieval glass from Grado (province of Gorizia, NE Italy) and
Vicenza (Table 4.4.1), with composition comparable to the “Islamic” glass found in
Israel and Syria and dated to the 9th-10th centuries AD (Henderson, 2002). It is worth
noting that the history of Venetian glass-making is closely related to the Levantine
(Byzantine and Islamic) tradition, for the importation of both raw glass and raw
materials, such as soda ash (Verità and Zecchin, 2009). In this context, the
compositional homogeneity between 9th-10th century Islamic glass and 11th-14th
Venetian glass is suggestive not only of a relation between Islamic and Venetian glass-
making, but also of a technological continuity from the Early to High/Late Middle
Ages.
4.4.2 Colouring and decolouring agents
The colour of the vast majority of glass findings varies from green to yellow and pale
blue; five beakers have deep blue decorative rims, and were analysed separately (ASO-
17b, ASO-18b, ASO-19b, ASO-20b, ASO-21b). Iron was probably the main colouring
element and was introduced into the glass as an impurity. The TiO2 versus Fe2O3 plot
(Fig. 4.4.2, b) does show that the contents of these two elements are closely related in
most of the samples, indicating that iron was added unintentionally, together with
titanium, as mineral impurities in the sand. Manganese was the decolouring agent used
deliberately, its contents varying from 0.58 to 2.68 wt% (Table D.8). It was added to all
4. Raw materials in glass production: the textural, chemical and mineralogical study
95
samples, since contents above 0.5 wt% are considered intentional additions (Jackson,
2005). Group A/3 has the highest Mn percentage (2.29±0.23 wt%, Table 4.4.1), to
better contrast the colouring effect caused by high Fe (1.31 ±0.28 wt%, Table 4.4.1). In
two samples, ASL-01 and ASL-08, Sb2O3 is also present (0.15-0.26 wt% respectively,
Table 4.4.2) - the main decolouring agent, together with manganese, used in Roman
times. However, its contents are too low to be considered as an intentional addition so,
as already mentioned, the presence of Sb2O3 in some Asolo natron samples indicates
recycling of Roman glass.
The five high-Fe and low-Ti samples in the dotted area of Figure 4.4.2, b are the deep
blue decorative rims: in this case, the higher iron content is due to the raw materials
added to colour the glass. Except for colouring agents which, according to Mirti et al.
(1993), may have been added to the glass batch intentionally but are not related to the
basic raw materials, blue rims have a chemical composition similar to that of the
corresponding colourless body (Table D.8). This indicates that the same base glass was
used to produce both colourless and coloured (blue) glass, and that it was modified by
adding colouring and/or decolouring agents. Among trace elements, higher percentages
of lead (0.11-0.18%, Table D.8) were found in three colourless beakers (ASO-18t,
ASO-19t, ASO-21t) and are probably due to the recycling of coloured glass scraps or
cullets.
As already mentioned, analyses show that the blue glass was obtained by adding a Co-
based colourant to the same glass employed for the colourless body (Table D.8). In this
context, the elements related to the colourant were quantified by subtracting the
composition of the colourless glass from the coloured and possible correlations between
them were investigated. In all five blue rims, cobalt correlates with copper and iron
(Fig. 4.4.3, a, b), suggesting that these elements were associated in the ores exploited to
produce the colourant.
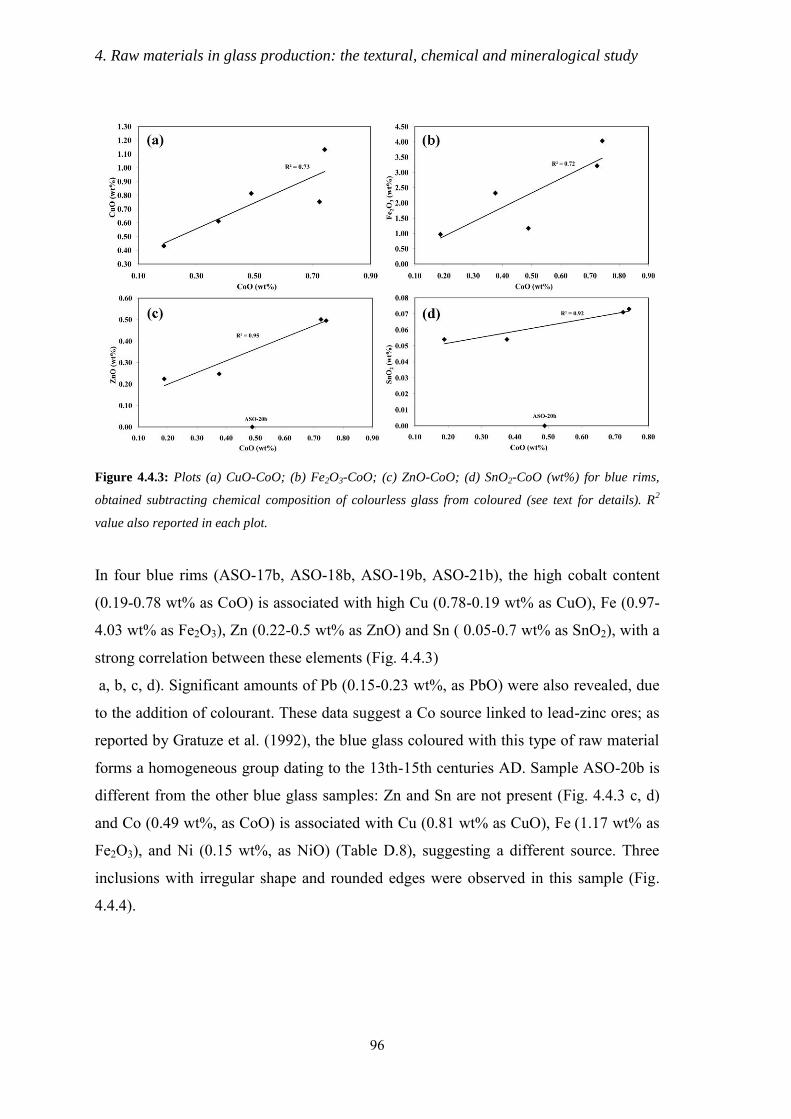
4. Raw materials in glass production: the textural, chemical and mineralogical study
96
Figure 4.4.3: Plots (a) CuO-CoO; (b) Fe2O3-CoO; (c) ZnO-CoO; (d) SnO2-CoO (wt%) for blue rims,
obtained subtracting chemical composition of colourless glass from coloured (see text for details). R2
value also reported in each plot.
In four blue rims (ASO-17b, ASO-18b, ASO-19b, ASO-21b), the high cobalt content
(0.19-0.78 wt% as CoO) is associated with high Cu (0.78-0.19 wt% as CuO), Fe (0.97-
4.03 wt% as Fe2O3), Zn (0.22-0.5 wt% as ZnO) and Sn ( 0.05-0.7 wt% as SnO2), with a
strong correlation between these elements (Fig. 4.4.3)
a, b, c, d). Significant amounts of Pb (0.15-0.23 wt%, as PbO) were also revealed, due
to the addition of colourant. These data suggest a Co source linked to lead-zinc ores; as
reported by Gratuze et al. (1992), the blue glass coloured with this type of raw material
forms a homogeneous group dating to the 13th-15th centuries AD. Sample ASO-20b is
different from the other blue glass samples: Zn and Sn are not present (Fig. 4.4.3 c, d)
and Co (0.49 wt%, as CoO) is associated with Cu (0.81 wt% as CuO), Fe (1.17 wt% as
Fe2O3), and Ni (0.15 wt%, as NiO) (Table D.8), suggesting a different source. Three
inclusions with irregular shape and rounded edges were observed in this sample (Fig.
4.4.4).
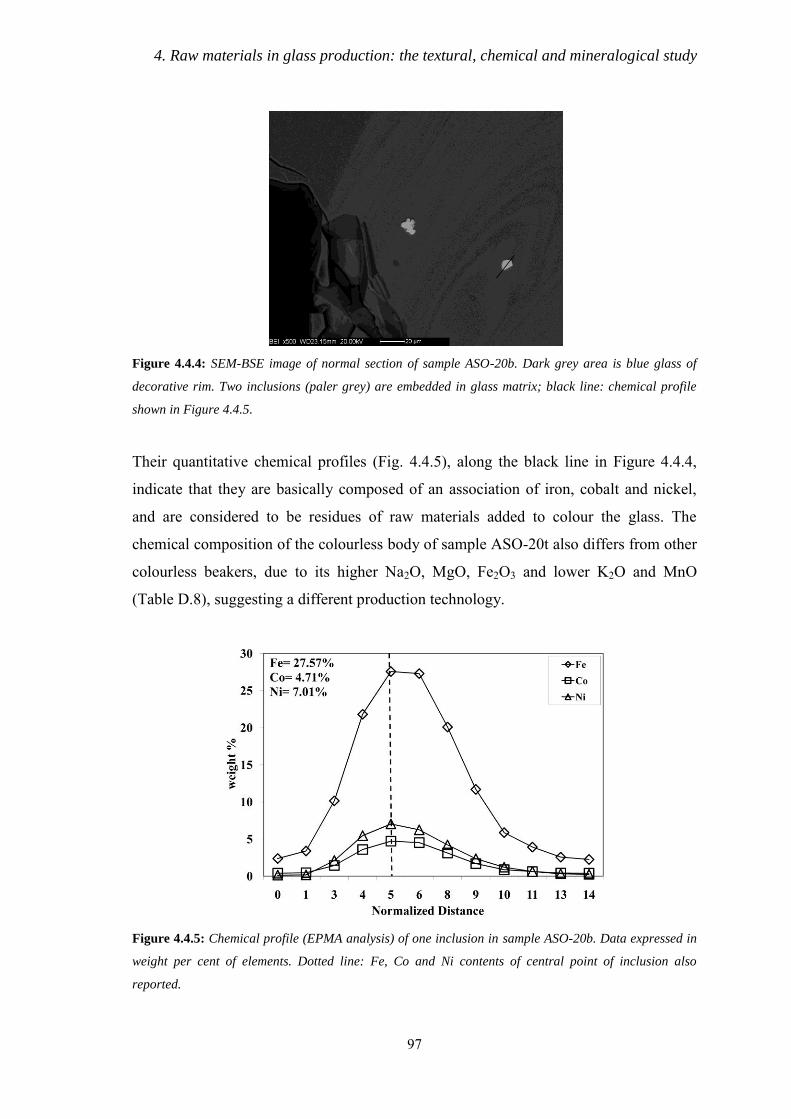
4. Raw materials in glass production: the textural, chemical and mineralogical study
97
Figure 4.4.4: SEM-BSE image of normal section of sample ASO-20b. Dark grey area is blue glass of
decorative rim. Two inclusions (paler grey) are embedded in glass matrix; black line: chemical profile
shown in Figure 4.4.5.
Their quantitative chemical profiles (Fig. 4.4.5), along the black line in Figure 4.4.4,
indicate that they are basically composed of an association of iron, cobalt and nickel,
and are considered to be residues of raw materials added to colour the glass. The
chemical composition of the colourless body of sample ASO-20t also differs from other
colourless beakers, due to its higher Na2O, MgO, Fe2O3 and lower K2O and MnO
(Table D.8), suggesting a different production technology.
Figure 4.4.5: Chemical profile (EPMA analysis) of one inclusion in sample ASO-20b. Data expressed in
weight per cent of elements. Dotted line: Fe, Co and Ni contents of central point of inclusion also
reported.
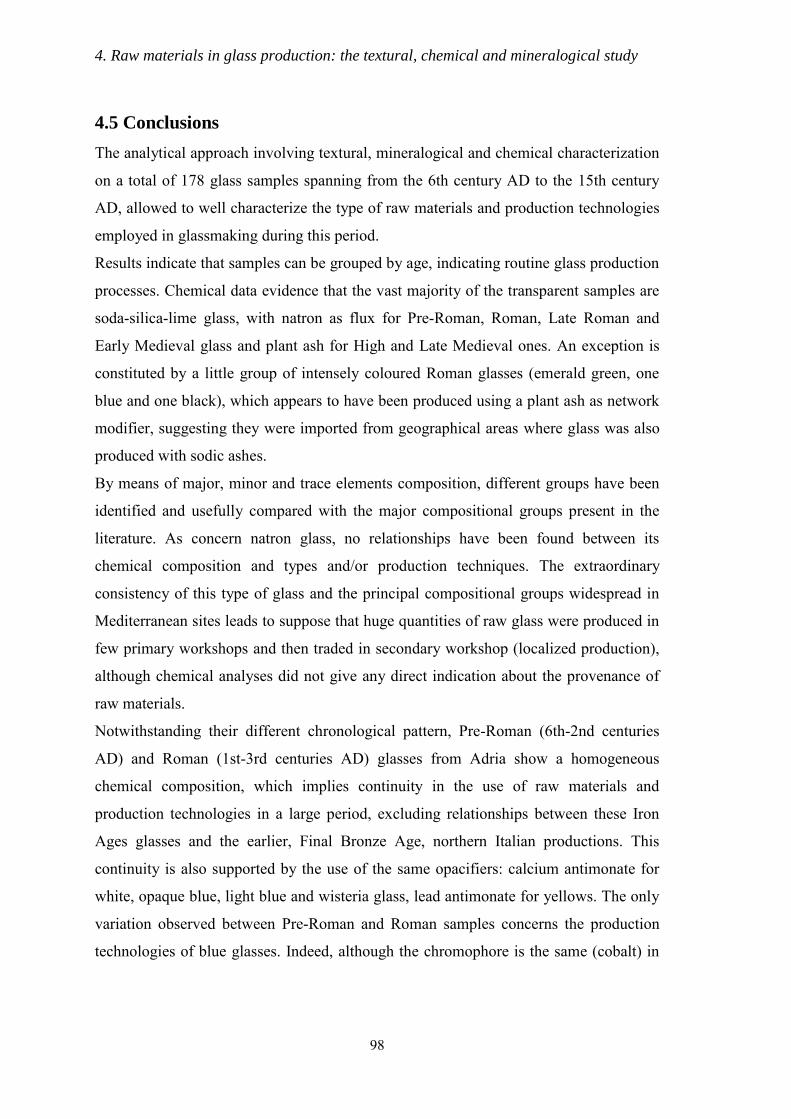
4. Raw materials in glass production: the textural, chemical and mineralogical study
98
4.5 Conclusions
The analytical approach involving textural, mineralogical and chemical characterization
on a total of 178 glass samples spanning from the 6th century AD to the 15th century
AD, allowed to well characterize the type of raw materials and production technologies
employed in glassmaking during this period.
Results indicate that samples can be grouped by age, indicating routine glass production
processes. Chemical data evidence that the vast majority of the transparent samples are
soda-silica-lime glass, with natron as flux for Pre-Roman, Roman, Late Roman and
Early Medieval glass and plant ash for High and Late Medieval ones. An exception is
constituted by a little group of intensely coloured Roman glasses (emerald green, one
blue and one black), which appears to have been produced using a plant ash as network
modifier, suggesting they were imported from geographical areas where glass was also
produced with sodic ashes.
By means of major, minor and trace elements composition, different groups have been
identified and usefully compared with the major compositional groups present in the
literature. As concern natron glass, no relationships have been found between its
chemical composition and types and/or production techniques. The extraordinary
consistency of this type of glass and the principal compositional groups widespread in
Mediterranean sites leads to suppose that huge quantities of raw glass were produced in
few primary workshops and then traded in secondary workshop (localized production),
although chemical analyses did not give any direct indication about the provenance of
raw materials.
Notwithstanding their different chronological pattern, Pre-Roman (6th-2nd centuries
AD) and Roman (1st-3rd centuries AD) glasses from Adria show a homogeneous
chemical composition, which implies continuity in the use of raw materials and
production technologies in a large period, excluding relationships between these Iron
Ages glasses and the earlier, Final Bronze Age, northern Italian productions. This
continuity is also supported by the use of the same opacifiers: calcium antimonate for
white, opaque blue, light blue and wisteria glass, lead antimonate for yellows. The only
variation observed between Pre-Roman and Roman samples concerns the production
technologies of blue glasses. Indeed, although the chromophore is the same (cobalt) in
4. Raw materials in glass production: the textural, chemical and mineralogical study
99
both the periods, the chemical and textural evidences indicate that the Co-bearing raw
materials were likely less refined in Pre-Roman productions.
The majority of Pre-Roman and Roman glasses (Group AD/N1) has a chemical
composition similar to that of the „typical‟ Roman glass, suggesting that the same raw
materials were used in their manufacture. However, the presence of two other small
compositional groups (AD/N2a and AD/N2b) indicates that different source of raw
materials could have been exploited during Roman period. In particular, Group AD/N2b
is related to the well attested production of the Sb-colourless glass, involving the use of
high purity sands, while Group AD/N2a does not show any comparison with literature
group.
For some reasons not yet clarified, from the end of the 3rd-early 4th century AD a
change in the aesthetic properties of the glass occurred and coincided also with a change
in glass composition, leading the hypothesis that new sources of raw materials were
exploited in this period. The Late Roman/Early Medieval glass from the site of Aquileia
(Groups AQ/1a, AQ/1b, AQ/2a, AQ/2b and AQ/3) shows a perfect correspondence with
some of the most important compositional groups recognized in Mediterranean from the
4th century onwards (HIMT, Levantine I and Série 3.2) and generally appears to have
been made from newly manufactured material. However, the geochemical differences
observed in HIMT Aquileia assemblage allowed to define two subgroups of HIMT
glasses (Groups AQ/1a and AQ/1b), which indicate that different ores were likely
exploited for the production of this type of glass. In particular one of these subgroups
(Group AQ/1a) was never reported in literature and then can be considered as a new
compositional group within the HIMT assemblage.
Contemporary glasses from northeastern inland site (Asolo) and from western sites
(Tuscany) show marked differences when compared with Aquileia glasses, since most
of them are made by recycled glass of the earlier Roman period (e.g. Group AD/N1).
Glass type HIMT and Série 3.2 constitutes a minor percentage of Asolo and Tuscan
sample set and, in any case, appears to have been subjected to a strong recycling. These
evidences imply the influence of the geographical position on the distribution of „fresh‟
glass: the strategic location of Aquileia allowed an easier supply of newly manufactured
material, whereas in other areas it was likely more convenient to recycle old glass.
4. Raw materials in glass production: the textural, chemical and mineralogical study
100
As concerns High/Late Medieval glasses (Rocca di Asolo samples) three compositional
groups have been identified (A/1, A/2 and A/3), indicating that at least three different
silica sources were employed in their production. A purer silica source, probably
siliceous pebbles, was used for window panes and the vast majority of the beakers,
whereas two types of sand were mostly employed to produce bottles. This evidence
suggests a correlation between chemical composition and type, although a larger
number of data, based on both chemical and typological analysis, is necessary to
support this hypothesis. A probable Venetian origin of Rocca di Asolo findings is
supported by the similarity with Venetian glasses of the same period. In addition, the
good match between Rocca di Asolo ash samples and ancient glass from Grado and
Vicenza, of “Islamic” composition (9th-10th centuries AD), may be another indication of
Venetian provenance, due to the well-attested relationship between Venetian and
Islamic glass-making, and testifies to technological continuity from the early to
High/Late Middle Ages. This chemical evidence also matches the political situation of
the Rocca which, from the end of the 14th century until its decay, was under the
influence of the Venetian Republic, one of the most important centres of glass
manufacture and trade in western Europe.
For what concerns the colour of all the glasses here investigated, iron is likely the main
colouring agent in unintentionally coloured glasses and it was introduced in the batch as
an impurity. In colourless glasses its effect is neutralized by adding manganese and/or
antimony oxides, the principal decolouring agents used in ancient times. On the other
hand, the intensely colours observed in many Pre-Roman (blue) and Roman (blue,
emerald green, purple, amber, black) glasses are due to the effect of different
chromophores: manganese for purples, cobalt for blues, copper for emerald greens, iron
for black. Discernable colouring agents have not been revealed in amber glasses: in this
case the colour is likely due to a (Fe+3S-2) complex, which formed in reducing
conditions, but further analysis on the oxidation states of these elements are necessary
to prove this hypothesis.
5. The provenance of raw materials in glass: the isotopic approach
101
CHAPTER 5
THE PROVENANCE OF RAW MATERIALS IN GLASS: THE ISOTOPIC APPROACH
Provenance determination of archaeological and historical artefacts relies on the
assumption that there is a scientifically measurable property that will link an artifact to a
particular source or production site (Degryse et al., 2010a; Degryse et al., 2009a). In
this respect, mineralogical, petrographical or elemental chemical analyses are the
techniques most often used to try to identify where inorganic artefacts were produced.
In ancient glass provenancing, chemical composition may provide a characterization of
the glass type, which may then suggest a specific source. However, although attempts to
provide a provenance for glass by elemental analysis continue, a direct relationship
between mineral raw materials and the artefacts made from them can be transformed at
high temperatures (Degryse et al., 2009a). In many recent studies, new questions about
glass production have been addressed using radiogenic and stable isotopes (Degryse et
al., 2009a and references therein), since transformations as melting have a little effects
on the isotopic ratio.
5.1 Features and principles of the technique
Different isotopes of an element have the same atomic number but different atomic
masses, since they have differing numbers of neutrons. Radioactive decay is the
spontaneous disintegration on an unstable radioactive parent isotope to a radiogenic
daughter and a nuclear particle. Some isotopes, e.g. those of light elements such as
hydrogen, oxygen or nitrogen, have negligible radioactivity and are called stable.
However, a fair number of elements with relatively large atomic masses are radioactive
(Degryse et al., 2009a). Such parent and resulting radiogenic daughter isotopes are often
used for dating the time of formation of minerals or rocks, but are also very useful in
tracing the sources of detrital matter (Banner, 2004). Moreover, variations in many
stable isotope ratios reflect different geological origins, due to different formation
processes. The isotopic composition of a raw material is thus largely dependent on the
5. The provenance of raw materials in glass: the isotopic approach
102
geological age and origin of that material. Conversely, especially the heavy isotopes of
e.g. lead, strontium and neodymium are, due to their relatively high masses at low
internal mass differences (Faure, 1986), not fractionated during technical processes. The
isotopic composition of the artefact will hence be identical, within analytical errors, to
the raw materials of which it was derived, while the signatures of different raw
materials used, and hence the resulting artefacts, may differ (Brill and Wampler, 1965;
Gale and Stos-Gale, 1982).
5.1.1 Strontium and Neodymium
There are four naturally occurring isotopes of strontium with the following approximate
abundances 84Sr= 0.55%, 86Sr= 9.75%, 87Sr= 6.96, 88Sr= 82.74%.
The isotopic abundances of 84Sr, 86Sr and 88Sr are constant in nature. These species are
neither radioactive nor the decay products of any naturally radioactive isotope.
Geological processes do not produce any fractionation of strontium isotopes. There are
small natural variations in the abundances of 87Sr, however, due to variable increments
of 87Sr produced by the radioactive beta decay of 87Rb which constitutes about 28% of
natural rubidium. The variations of 87Sr are small because rubidium occurs in low
abundance in most natural materials and the half-life of 87Rb is long (50x109 years). The 87Rb-87Sr chronometer has been extremely useful in determining geological and
cosmological ages and also the isotopic composition of strontium has been useful as
tracer of various geological processes (Wedepohl, 1971). However, as demonstrated by
recent studies (Degryse et al., 2006b; Degryse and Schneider, 2008; Degryse et al.,
2009b), of particular interest in provenancing raw materials of ancient glass is the
variation in the isotopic composition of marine carbonates (e.g., shell and limestone).
Calcium carbonate permits Sr2+ to replace Ca2+ but excludes Rb+. As a result, calcite
has a very low Rb/Sr ratio, and its 87Sr/86Sr ratio is not significantly altered by
radioactive decay of 87Rb to 87Sr after deposition (Banner, 2004). Instead, the isotope
composition of Sr in calcite deposited in the oceans results from mixing of different
isotopic varieties of Sr that enter the oceans. The principal sources of marine Sr having
distinctive 87Sr/86Sr ratios are: (1) old granitic basements rocks of the continental crust
(high Rb/Sr, high 87Sr/86Sr); (2) young volcanic rocks along midocean ridges, in oceanic
islands, and along continental margins (low Rb/Sr, low 87Sr/86Sr); (3) marine carbonates
5. The provenance of raw materials in glass: the isotopic approach
103
rocks on the continents (low Rb/Sr, intermediate 87Sr/86Sr) (Banner, 2004). The isotopes
of Sr are not fractionated during precipitation of calcite or aragonite from aqueous
solutions because the mass difference between 87Sr and 86Sr is only 1.2%. Because the
absence of isotope fractionation effects and the negligibly small production of
radiogenic 87Sr by decay of 87Rb in carbonate rocks, marine and non-marine carbonate
rocks record the isotope composition of Sr in the fluid phase at the time of deposition.
Isotope analyses of Sr in a large number of marine limestones of Precambrian and
Phanerozoic age have revealed that the 87Sr/86Sr ratio of seawater has varied
systematically with time (Fig.5.1.1, Burke et al., 1982). These variations must have
been caused by changes in the isotopic composition of Sr that entered in the oceans
from various sources and by changes in the relative proportions of these inputs. It
should be noted that the residence time of strontium in the oceans is long, relative to the
rate of ocean mixing, so that geographical variations in the strontium isotope
composition of seawater are negligible (Banner, 2004; Freestone et al., 2003). For
example, the mean and standard deviation of 15 Holocene shells collected worldwide
are given by DePaolo and Ingram (1985) as 0.709234±0.000009. A particularly
noteworthy feature of Figure 5.1 is the rapid increase in 87Sr/86Sr over the past 40
million years or so. This is attributed to the uplift and erosion of the Himalayas, which
contain rocks with high 87Sr/86Sr, which is transferred to the oceans via groundwater
and surface run-off (e.g., Basu et al. 2001). Modern marine shell has a 87Sr/86Sr value
equivalent to that of modern seawater, from which it is precipitated, and this is
significantly higher than, for example, the value for Cretaceous limestone (Fig.5.1.1).
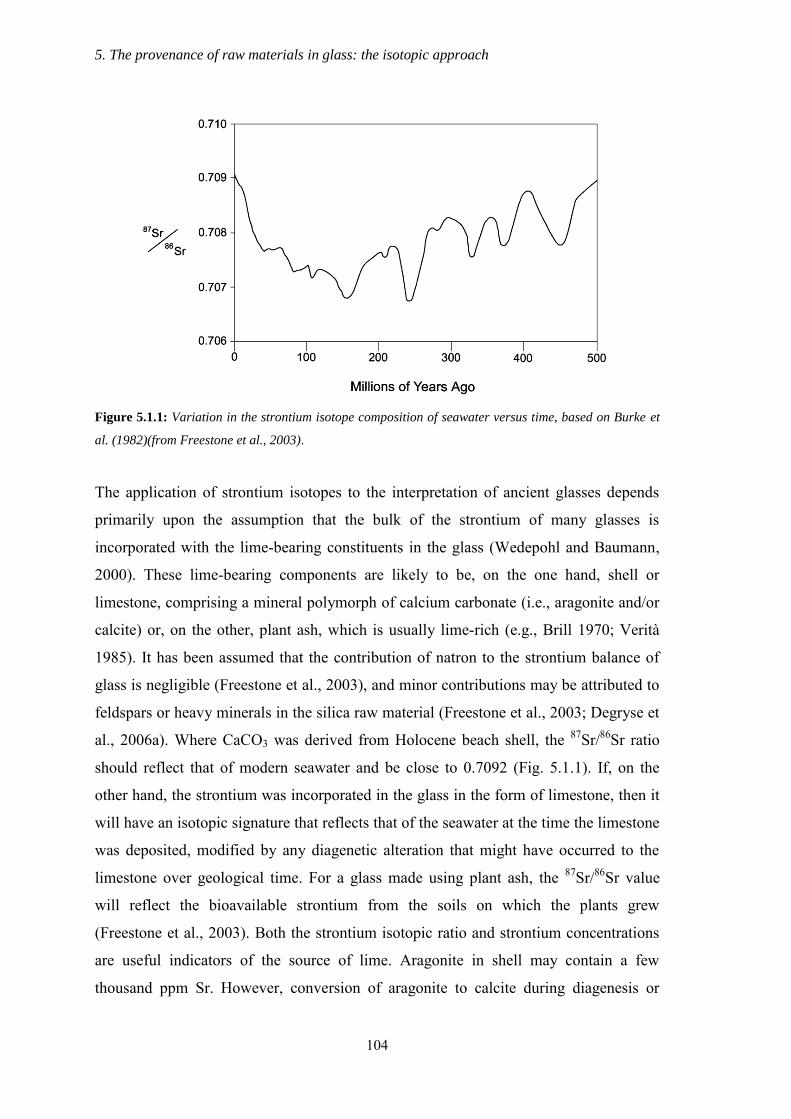
5. The provenance of raw materials in glass: the isotopic approach
104
Figure 5.1.1: Variation in the strontium isotope composition of seawater versus time, based on Burke et
al. (1982)(from Freestone et al., 2003).
The application of strontium isotopes to the interpretation of ancient glasses depends
primarily upon the assumption that the bulk of the strontium of many glasses is
incorporated with the lime-bearing constituents in the glass (Wedepohl and Baumann,
2000). These lime-bearing components are likely to be, on the one hand, shell or
limestone, comprising a mineral polymorph of calcium carbonate (i.e., aragonite and/or
calcite) or, on the other, plant ash, which is usually lime-rich (e.g., Brill 1970; Verità
1985). It has been assumed that the contribution of natron to the strontium balance of
glass is negligible (Freestone et al., 2003), and minor contributions may be attributed to
feldspars or heavy minerals in the silica raw material (Freestone et al., 2003; Degryse et
al., 2006a). Where CaCO3 was derived from Holocene beach shell, the 87Sr/86Sr ratio
should reflect that of modern seawater and be close to 0.7092 (Fig. 5.1.1). If, on the
other hand, the strontium was incorporated in the glass in the form of limestone, then it
will have an isotopic signature that reflects that of the seawater at the time the limestone
was deposited, modified by any diagenetic alteration that might have occurred to the
limestone over geological time. For a glass made using plant ash, the 87Sr/86Sr value
will reflect the bioavailable strontium from the soils on which the plants grew
(Freestone et al., 2003). Both the strontium isotopic ratio and strontium concentrations
are useful indicators of the source of lime. Aragonite in shell may contain a few
thousand ppm Sr. However, conversion of aragonite to calcite during diagenesis or
5. The provenance of raw materials in glass: the isotopic approach
105
chemical precipitation of calcite or limestone will incorporate only a few hundred ppm
of Sr (Freestone et al., 2003). Plant ash glasses can have high strontium contents,
sometimes of the same order of magnitude as or higher than glasses made from natron
and sand with shell (Freestone et al., 2003).
Neodymium is a rare earth element (REE), which has five stable isotopes (142Nd, 143Nd, 145Nd, 146Nd and 148Nd) and two radioisotopes (144Nd and 150Nd). 147Sm decays by alpha
emission to stable 143Nd, with a half-life of 1.53 x 10¹¹ years. Variations in Nd isotopic
compositions (143Nd/144Nd) are the result of elemental fractionations occurring between 143Nd and its parent 147Sm during radioactive decay. This has made Nd useful for age
dating terrestrial and extraterrestrial materials as well as many other geologic
applications (DePaolo, 1988). The isotopic variations are expressed relative to the
stable, non-radiogenic isotope 144Nd (143Nd/144Nd ratio) and a sample’s deviation from
the value for the bulk earth at a given time is expressed using the epsilon notation εNd:
143 144
4
143 144
( )1 10
( )
sample
CHUR
Nd NdNd
Nd Nd
where CHUR is a chondritic uniform reservoir, which represents a bulk earth Nd
isotope composition deduced from measurements in chondrites (De Paolo and
Wasserburg, 1976). Since different rock types can have different Nd isotopic
compositions and because clastic sediments are in fact just mechanical disintegration
products of igneous, metamorphic and older sedimentary rocks which are exposed in
the source area, the Nd isotopic values of the sediments can help to identify the
sediment source (Brems et al., in press). In particular, although actually the number of
anlyse is small, there seems to be significant differences in Nd isotopic signatures
between the easternmost part of the Mediterranean Sea and the rest of the basin.
The introduction of neodymium isotopes in glass studies is very recent. Nd in glass is
likely to have originated partly from the clay mineral content and partly, but principally,
from the heavy mineral content of the silica raw material (Degryse et al., 2006b;
Degryse and Schneider, 2008). The effect of recycling on the Nd isotopic composition
of a glass batch is not significant, and neither is the effect of colourants and opacifiers (
Freestone et al., 2005). This offers a great potential in tracing the origins of primary
5. The provenance of raw materials in glass: the isotopic approach
106
glass production. The first example of this approach was shown in the provenance
determination of early Byzantine 4th to 8th century glass from Syro-Palestine and Egypt
(Degryse et al., 2006b; Freestone et al., in press). The consistency of the Nd isotope
composition of the glass with Nile dominated sediments (Weldeab et al., 2002; Stanley
et al., 2003) suggested an origin of these glass types situated in between the Nile delta
and what is now Lebanon-Israel (Degryse and Shortland, 2009). In a second study
(Degryse and Schneider, 2008), a Roman 1st to 3rd century glass showed exotic Sr-Nd
isotopic compositions, which does not correspond to the signatures from the known
production centres in Egypt and Syro-Palestine. These signatures were moreover not
consistent with any possible glass raw material in the eastern Mediterranean, but do
correspond well to sediments from the western Mediterranean, suggesting that primary
production likely lies in the Western Roman Empire (Degryse and Shortland, 2009).
5.1.2 Oxygen isotopes
Oxygen has three stable isotopes: 16O, 17O and 18O; 16O is the most abundant isotope of
this element (99.762%). The stable isotopes are fractionated during changes in their
states of aggregation and by chemical reactions between compounds in which the
elements occur. The extent of fractionation of two isotopes of the same element is
controlled primarily by the difference in their masses and by the temperature of the
environment (Faure and Mensing, 2005). The resulting variations of the isotopic
compositions convey information about the physical and geochemical processes that
acted on the element and on the compounds in which it occurs.
Oxygen was, together with lead, the first isotope that was used to investigate the
provenance of ancient glass. Its potential was pioneered by Brill and co-workers (Brill,
1970, 1988; Brill et al,.1999), which showed that isotopes of oxygen have characteristic
ranges for certain glass groups. For a typical soda–lime–silica glass, the bulk of the
oxygen is about 45% and approximately 70% of it enters the glass as a component of
the silica. Even in strongly coloured glasses, the bulk of the oxygen is derived from the
major components of the base glass (Leslie et al., 2006). For this reason the oxygen
isotopic composition of ancient glass mainly depends on the silica source, with minor
influences of flux and stabilizer (Brill, 1970; Brill et al,.1999). In addition, it was
experimentally demonstrated that variations in melting time and temperature had no
5. The provenance of raw materials in glass: the isotopic approach
107
measurable effects on the final oxygen signature of the glass (Brill et al., 1999).
Therefore the isotopes of oxygen may be expected to be useful discriminants of raw
material sources. The standard notation for oxygen isotope composition of a substance
is δ18O, which expresses the deviation of the isotopic ratio of the material from Vienna
Standard Mean Ocean Water (VSMOW):
δ18O= (RSAMPLE/RVSMOW-1)x1000
where R is the ratio 18O/16O. Silicate minerals are enriched in 18O relative to SMOW
and have positive 18O values that range from +20‰ in quartz to values between +5 and
+6‰ in ferromagnesian minerals such as olivine and pyroxene (Faure and Mensing,
2005); on the other hand, Egyptian natron, which is believed to have been extensively
used in early glass-making, has a value around +40‰ (Brill et al., 1999).
In spite of its apparent promise and the important pioneering work of Brill and co-
workers, oxygen isotope analysis has not been widely applied in the investigation of
glass. Only recently Henderson et al. (2005), Leslie et al. (2006) and Silvestri et al.
(2010) have contributed to amplify the database of oxygen isotope data for various
archaeological glass samples and possible raw materials.
5.2 Materials
In the present work 38 samples were selected for the analysis of Sr and Nd isotopes and
40 for O isotope. They belong to Adria and Aquileia sample sets and are both Roman
(1st-3rd century AD) and Late Roman/Early Medieval in date (4th-8th century AD).
The selection was carefully conducted, in order to represent the various archeological
types, colours and the different compositional groups identified and detailed in chapter
4.
5.3 Results and discussion
5.3.1 Strontium and neodymium isotopes
Strontium and neodymium composition and elemental concentrations of the glass
samples are given in Table E.1, Appendix E.
5. The provenance of raw materials in glass: the isotopic approach
108
The 87Sr/86Sr ratios of the vast majority of the glass samples range between 0.70884 and
0.70916 (Tab.E.1, Fig. 5.3.1 a, b), independently from age, site, colour and
compositional group, and are close to the ratio for the present-day seawater (0.7092).
Along with their high Sr values (Sr= 322-534 ppm, Tab.E.1), this suggests that the
source of strontium was marine shell and consequently that most likely beach sands
were used. The 87Sr/86Sr ratio of the soda ash glass (sample AD-VE-2) is also similar to
the present day water composition (0.70894, Tab.E.1). In recent work (Degryse et al.,
2010a) it was demonstrated that the strontium intake of plants may be dominated by the
total (rain)water ingested, and only moderately influenced by the bedrock geology,
possibly resulting in a marine signature of the plant.
However, some samples show clearly different Sr isotopic signatures. The sample AD-
B-4, defined as outlier since its unusual chemical composition (see section 4.1.2),
differs from the other glass with a particularly high 87Sr/86Sr ratio (87Sr/86Sr= 0.71089,
Tab. E.1, Fig.5.3.1 a). This suggests that it was manufactured with a sand rich in
minerals with more radiogenic strontium, probably feldspars, as suggested also by the
higher aluminum contents observed in its bulk composition (see Table D.1, Appendix
D). Both the two purple glasses analyzed show a different Sr signature, lower in sample
AD-V-4 (87Sr/86Sr= 0.70854) and higher in sample AD-V-2 (87Sr/86Sr= 0.70955) (Tab.
E.1, Fig. 5.3.1 b). This variation could be explained by the fact that sand is not the only
source of strontium in purple glass, but also Mn-bearing raw material, added as
colourant, introduces strontium in the batch (see section 4.1.2), and consequently
modifies the 87Sr/86Sr ratio. The higher Sr contents (Sr= 592-657 ppm) in these two
glasses with respect to the other samples (Sr= 322-534 ppm, Tab. E.1, Fig. 5.3.1 b)
supports this hypothesis. Moreover, the ‘inhomogeneous’ Sr signature in the two purple
samples is probably attributable to the use of different kind of Mn-bearing raw material,
as already supposed in section 4.1.2. Finally, one blue glass of Group 2a (AD-B-7) and
all the samples with HIMT composition (Group AQ/1a and AQ/1b) form a distinct
group, which differs from other glasses for lower 87Sr/86Sr ratios (87Sr/86Sr= 0.70832-
0.70881, Tab. E.1, Fig. 5.3.1 b), suggesting the influence of a less radiogenic source of
strontium. For HIMT glass, this characteristic has been already observed in glasses
coming from Carthage, North Sinai, Billingsgate and Sagalassos (Freestone et al., 2005;
Freestone et al., in press; Freestone et al., 2009; Degryse et al., 2009b).
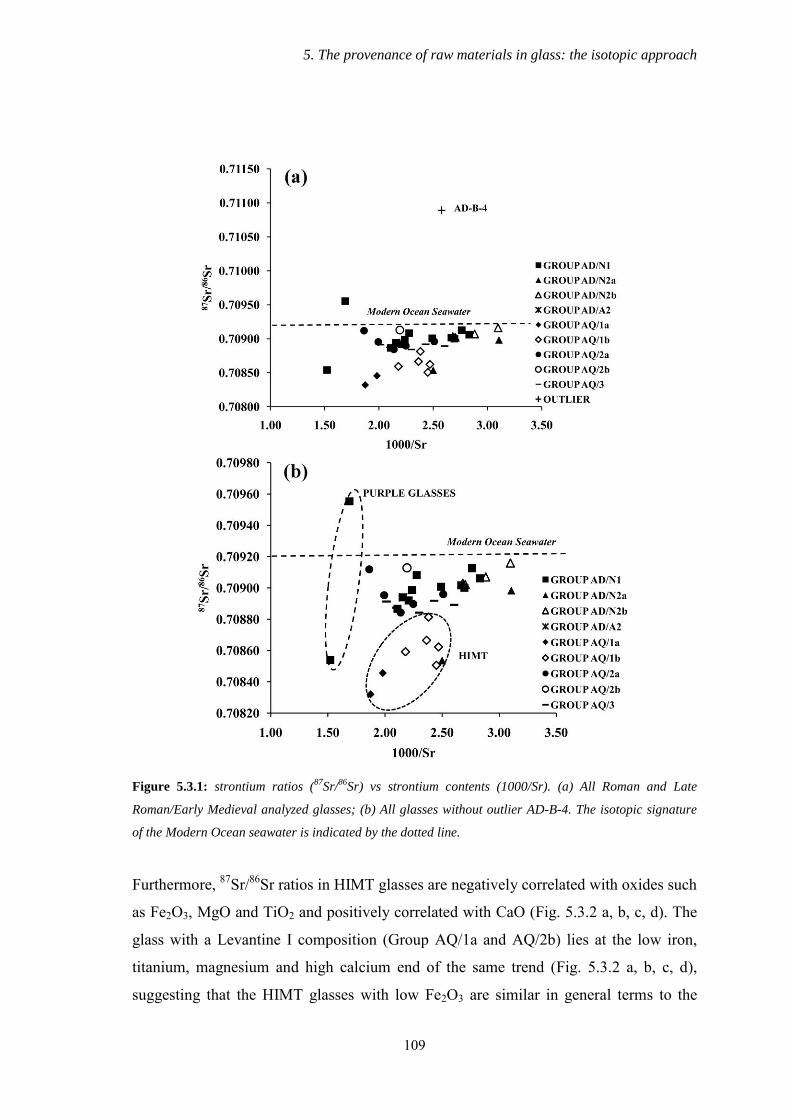
5. The provenance of raw materials in glass: the isotopic approach
109
Figure 5.3.1: strontium ratios (
87Sr/
86Sr) vs strontium contents (1000/Sr). (a) All Roman and Late
Roman/Early Medieval analyzed glasses; (b) All glasses without outlier AD-B-4. The isotopic signature
of the Modern Ocean seawater is indicated by the dotted line.
Furthermore, 87Sr/86Sr ratios in HIMT glasses are negatively correlated with oxides such
as Fe2O3, MgO and TiO2 and positively correlated with CaO (Fig. 5.3.2 a, b, c, d). The
glass with a Levantine I composition (Group AQ/1a and AQ/2b) lies at the low iron,
titanium, magnesium and high calcium end of the same trend (Fig. 5.3.2 a, b, c, d),
suggesting that the HIMT glasses with low Fe2O3 are similar in general terms to the
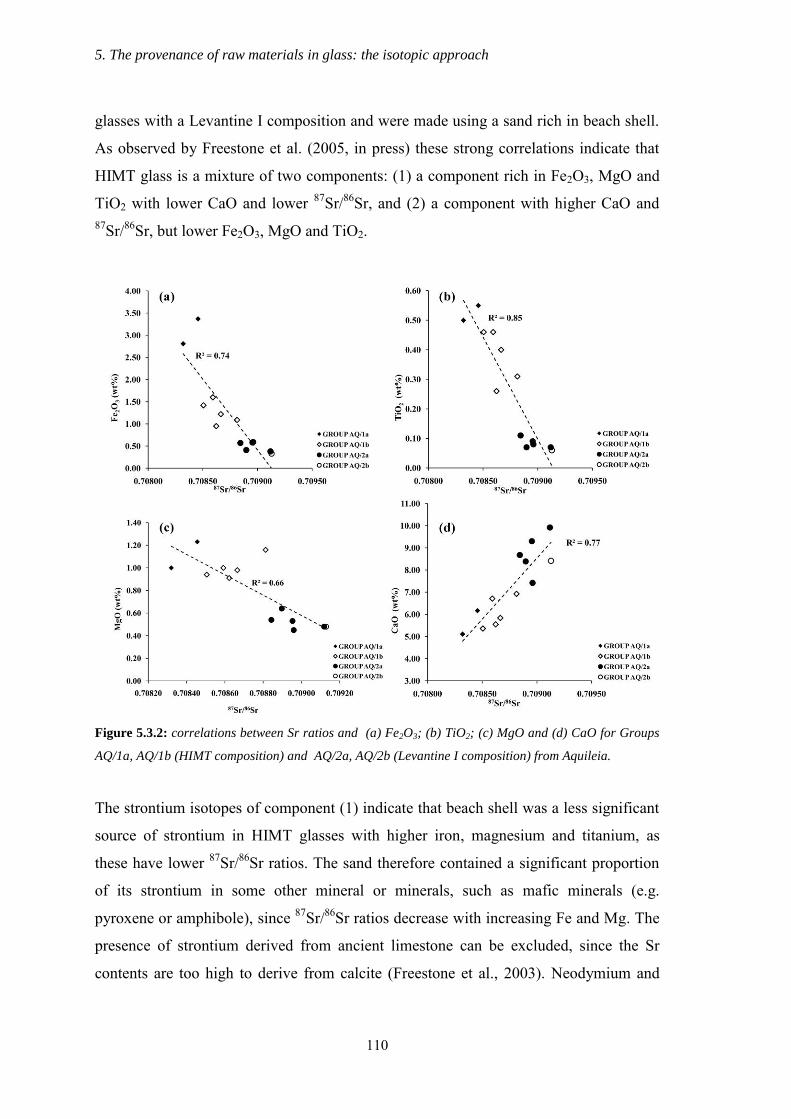
5. The provenance of raw materials in glass: the isotopic approach
110
glasses with a Levantine I composition and were made using a sand rich in beach shell.
As observed by Freestone et al. (2005, in press) these strong correlations indicate that
HIMT glass is a mixture of two components: (1) a component rich in Fe2O3, MgO and
TiO2 with lower CaO and lower 87Sr/86Sr, and (2) a component with higher CaO and 87Sr/86Sr, but lower Fe2O3, MgO and TiO2.
Figure 5.3.2: correlations between Sr ratios and (a) Fe2O3; (b) TiO2; (c) MgO and (d) CaO for Groups
AQ/1a, AQ/1b (HIMT composition) and AQ/2a, AQ/2b (Levantine I composition) from Aquileia.
The strontium isotopes of component (1) indicate that beach shell was a less significant
source of strontium in HIMT glasses with higher iron, magnesium and titanium, as
these have lower 87Sr/86Sr ratios. The sand therefore contained a significant proportion
of its strontium in some other mineral or minerals, such as mafic minerals (e.g.
pyroxene or amphibole), since 87Sr/86Sr ratios decrease with increasing Fe and Mg. The
presence of strontium derived from ancient limestone can be excluded, since the Sr
contents are too high to derive from calcite (Freestone et al., 2003). Neodymium and
5. The provenance of raw materials in glass: the isotopic approach
111
strontium measurements on HIMT glasses from North Sinai, Carthage and Billingsgate
(London) were reported by Freestone et al. (in press). They noted that the lower 87Sr/86Sr ratios of the HIMT range favoured an area of origin on the Egyptian coast,
between Alexandria and Gaza, where the Nile strontium isotope signature dominates the
sediments (Weldeab et al., 2002). Indeed 87Sr/86Sr values in silicates around the
Mediterranean are higher than seawater except where the content of material derived
from the Nile is exceptionally high, close to the delta in the Southeast (Krom et al.,
1999; Weldeab et al., 2002). This model is also consistent with the higher levels of Mg,
Fe, Ti etc observed in HIMT glasses, since the sands close the mouth of the Nile are
richer of heavy minerals, mainly pyroxene and amphibole (Emery and Neev, 1960),
which gradually decrease progressing up the eastern Mediterranean coast
(Pomerancblum, 1966, Mange and Wright, 2007).
The analyzed glass shows a wide range of Nd isotopic signatures (Tab. E.1). The earlier
glass, dating 1st-3rd century AD, is more heterogeneous, with 143Nd/144Nd between
0.51212 and 0.51251, corresponding to values between -2.59 and -10.04 for εNd (Tab.
E.1). On the other hand, the Late Roman/Early Medieval glass, dating late 3rd-8th
century AD, shows a much smaller range, with 143Nd/144Nd between 0.51236 and
0.51245, corresponding to values between -3.67 and -5.35 for εNd (Tab. E.1). A closer
examination of the existing literature data was necessary in order to interpret these
values.
Studies from Goldstein et al. (1984), Grousset et al. (1988) and Weldeab et al. (2002)
have demonstrated that Nd isotopic signatures of the beach sands show a decrease in
εNd from east to west (Brems et al., in press). Detrital deep-sea surface sediments in the
North-Atlantic and the Mediterranean were measured by Frost et al. (1986) and
Grousset el el. (1988). These studies showed that the sediments in the east-west axis
ranged from -10.1 at Gibraltar to -3.3 at the mouth of the river Nile. The sediment load
of the Nile, which dominates the sands in the south-eastern Mediterranean, has an
exceptional high Nd isotopic composition, as it is dominated by East African volcanic
rocks from the Ethiopian Plateau (Mange and Wright, 2007). Western Mediterranean
sediments around the Spanish and southern French coasts have a homogeneous
composition between -9.7 and -10.1. Sediment around the Italian coasts show a range
between εNd= -12.4 and -7.6 in Tyrrhenian Sea, and an εNd value of -10.8 in the
5. The provenance of raw materials in glass: the isotopic approach
112
Adriatic Sea. The variable values around the Italian peninsula are explained by the
influence of African aerosols and Saharan dust (Grousset et al., 1988). In a study
performed by Degryse and Schneider (2008), the Sr-Nd isotopic signature of possible
silica raw materials for primary glassmaking was determined. Sands from the river
Belus (Israel), from the river Volturno (Italy) and from near lake Fazda (Egypt) were
analyzed. All these locations are mentioned in Pliny the Elder’s Naturalis Historia
(XXXVI, 194) as locations for primary glass production using local raw materials. In
addition, also Tertiary deposits in Belgium were geochemically characterized, since
they represent possible sand sources from the Gallic provinces, as described by Pliny.
The results show that both the sands from river Belus and Volturno, considered suitable
for glassmaking, present a Sr signature close to that of the modern seawater but are
distinguished from the Nd isotopic signature (εNd= -4.8 in Levantine sands and –6.9
and -9.9 in Volturno sands). On the other hand, sands from Egypt (εNd= -6.8 and -8.6)
and from Belgium (εNd= -11.4 and -12.7) are clearly distinguished for their lower 87Sr/86Sr ratios, indicating that they are not influenced by shell material, which is absent
in the sand (Degryse and Schneider, 2008). Moreover, in a recent work, Brems et al.
(submitted b) analyzed the Sr and Nd isotopic composition of 76 beach sands from
Spain, France and Italy. Results show that Spanish and French sands have relatively low
εNd values from -12.4 to -8.0, in close agreement with the data from the deep sea
sediments. On the other hand, Italian sands show a wide range of εNd values between -
12.8 and -3.0 (Brems et al., submitted b). Three sands from Italy were identified as
being suitable for Roman glass production (Brems et al., submitted a). One comes from
Tuscany and has a rather low εNd value of -9.42. The other two come from Basilicata
and Apulia region, in southeastern Italy, and have relatively high εNd values (-6.1 and -
4.2, respectively, Brems et al., submitted b) and coincide with the range of Nd isotopic
signatures previously thought to be characteristic for an eastern Mediterranean origin
(Degryse and Schneider, 2008; Freestone et al., in press). However, only the Apulia
sand has a Sr-Nd isotopic composition comparable with the majority of the glasses
analyzed in the present study (87Sr/86Sr= 0.70867, εNd= -4.2, Brems et al., submitted b),
since the other shows a too high 87Sr/86Sr ratio (87Sr/86Sr= 0.71079, Brems et al.,
submitted b).
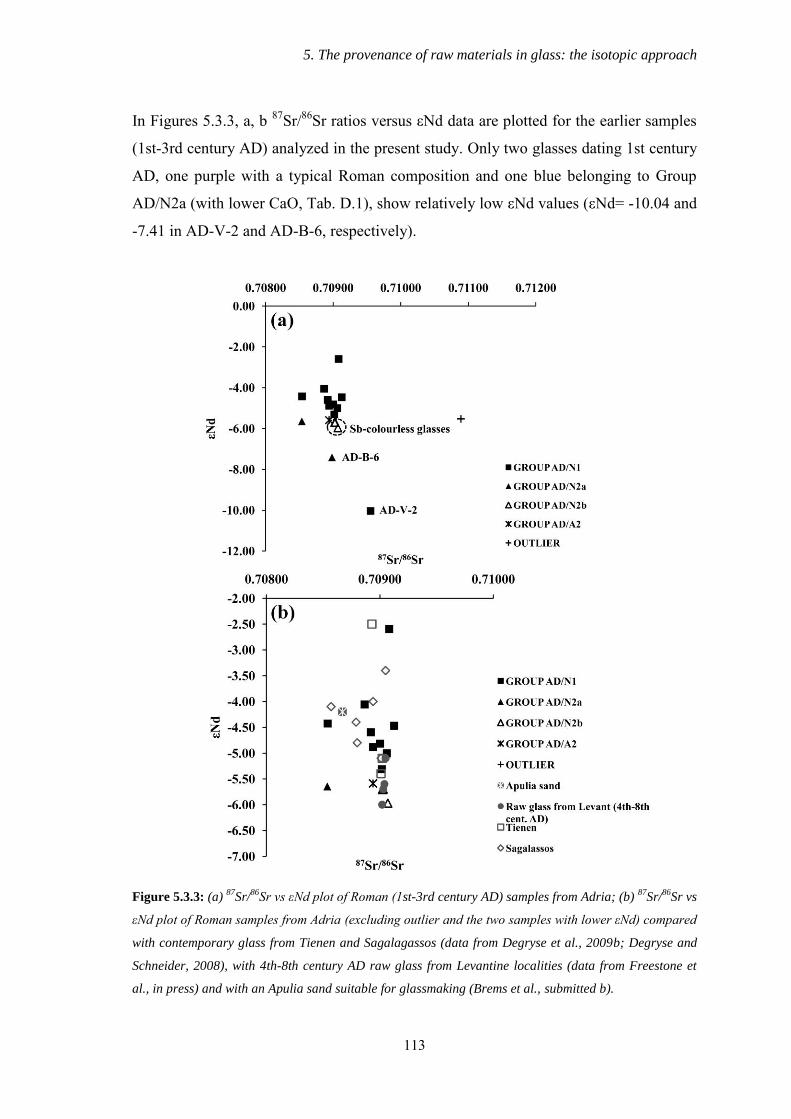
5. The provenance of raw materials in glass: the isotopic approach
113
In Figures 5.3.3, a, b 87Sr/86Sr ratios versus εNd data are plotted for the earlier samples
(1st-3rd century AD) analyzed in the present study. Only two glasses dating 1st century
AD, one purple with a typical Roman composition and one blue belonging to Group
AD/N2a (with lower CaO, Tab. D.1), show relatively low εNd values (εNd= -10.04 and
-7.41 in AD-V-2 and AD-B-6, respectively).
Figure 5.3.3: (a)
87Sr/
86Sr vs εNd plot of Roman (1st-3rd century AD) samples from Adria; (b)
87Sr/
86Sr vs
εNd plot of Roman samples from Adria (excluding outlier and the two samples with lower εNd) compared
with contemporary glass from Tienen and Sagalagassos (data from Degryse et al., 2009b; Degryse and
Schneider, 2008), with 4th-8th century AD raw glass from Levantine localities (data from Freestone et
al., in press) and with an Apulia sand suitable for glassmaking (Brems et al., submitted b).
5. The provenance of raw materials in glass: the isotopic approach
114
As previously explained, these signatures are inconsistent with any sediment in the
eastern Mediterranean but correspond well to the range in isotopic values of beach and
deep-sea sediments from the western Mediterranean, from the Italian peninsula to the
French and Spanish coasts. The raw materials of this glass therefore likely lies in
Western Roman Empire, as already suggested for some 1st-3rd century glass from
Maastricht, Bocholtz, Tienen and Kelemantia (Degryse and Schneider, 2008; Degryse
et al., 2009b), but actually this remains only a speculation due to the low number of
analyzed sample. Conversely, the main part of Adria glass shows values between -4.06
and -5.97; one sample (AD-AM-2) has an εNd particularly high (-2.59) (Tab. E.1, Figg.
5.3.3, a, b). The large spread in the isotopic composition may indicate the use of
multiple sand sources or, alternatively, an intense recycling of glass with different
primary origins and thus different signatures. Generally speaking, relationships between
isotopic composition and compositional group, colour, type and flux were not observed.
An exception is constituted by the small Group AD/N2b, including three Sb-colourless
glasses, which show a very homogeneous Nd composition (εNd= -5.70 to -5.97, Tab.
E.1, Fig. 5.3.3, a). This evidence was already observed by Ganio et al. (in press) for Sb-
colourless glass coming from the Embiez shipwreck (2nd-3rd century AD) and
characterized by an average εNd value of -5.23±0.10. The general homogeneity of Nd
composition in Sb-colourless glasses indicates that they represent a well distinct
production and were subjected to a limited or selective recycling. The Sr-Nd isotopic
composition of early Roman Adria glasses is identical or very similar to the signature of
contemporary glass from Sagalassos and Tienen (Degryse et al., 2009b) and also to the
known 4th-8th century AD primary production centres in the Levant (εNd= -5.0 to -6.0,
Freestone et al., in press) (Fig. 5.3.3, b), suggesting an analogous provenance, although
not necessarily in the same geographical area of aforementioned Late Byzantine glass
units, especially for samples with a Nd isotopic signature between -4.88 and -2.59. This
hypothesis is also reinforced by archaeological evidences, as the discovery of early
Roman glass furnaces in Beirut, Lebanon (Kouwatli et al., 2008). However, in the light
of the results of Brems et al. (submitted b), a southern Italian provenance cannot be
excluded with total certainty, even if at the present it is not supported by any
archaeological data. For this reason, further research is necessary to determine whether
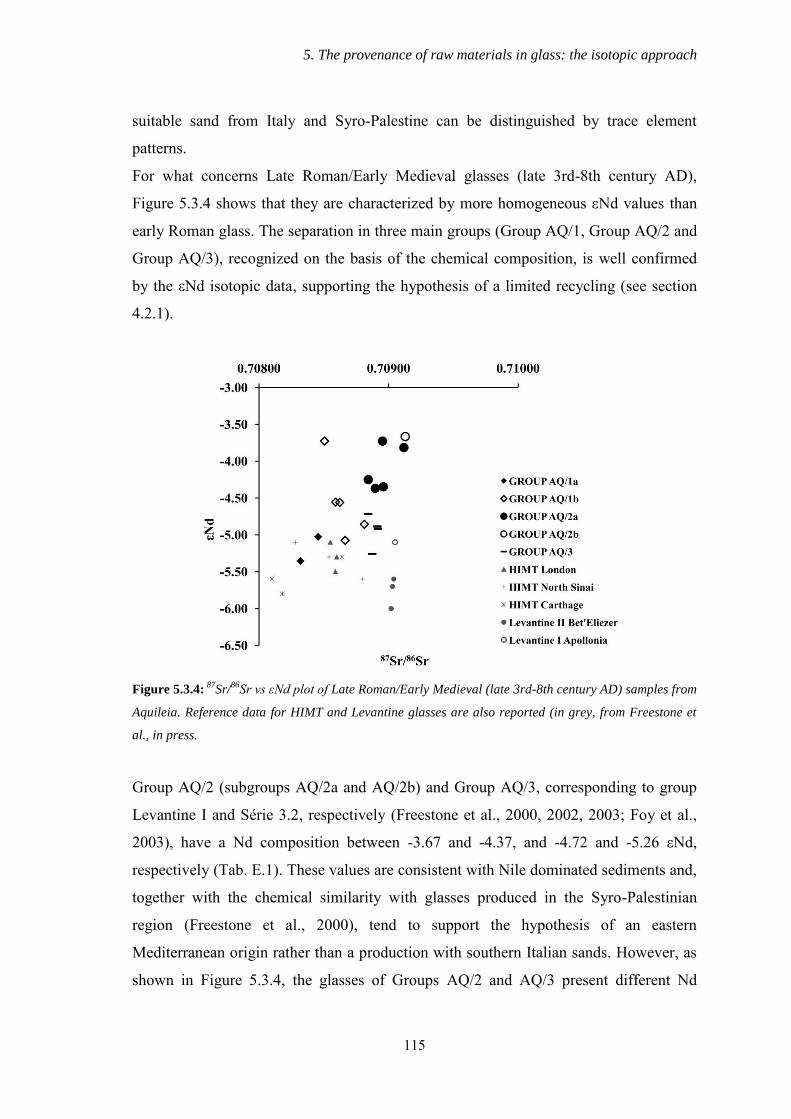
5. The provenance of raw materials in glass: the isotopic approach
115
suitable sand from Italy and Syro-Palestine can be distinguished by trace element
patterns.
For what concerns Late Roman/Early Medieval glasses (late 3rd-8th century AD),
Figure 5.3.4 shows that they are characterized by more homogeneous εNd values than
early Roman glass. The separation in three main groups (Group AQ/1, Group AQ/2 and
Group AQ/3), recognized on the basis of the chemical composition, is well confirmed
by the εNd isotopic data, supporting the hypothesis of a limited recycling (see section
4.2.1).
Figure 5.3.4:
87Sr/
86Sr vs εNd plot of Late Roman/Early Medieval (late 3rd-8th century AD) samples from
Aquileia. Reference data for HIMT and Levantine glasses are also reported (in grey, from Freestone et
al., in press.
Group AQ/2 (subgroups AQ/2a and AQ/2b) and Group AQ/3, corresponding to group
Levantine I and Série 3.2, respectively (Freestone et al., 2000, 2002, 2003; Foy et al.,
2003), have a Nd composition between -3.67 and -4.37, and -4.72 and -5.26 εNd,
respectively (Tab. E.1). These values are consistent with Nile dominated sediments and,
together with the chemical similarity with glasses produced in the Syro-Palestinian
region (Freestone et al., 2000), tend to support the hypothesis of an eastern
Mediterranean origin rather than a production with southern Italian sands. However, as
shown in Figure 5.3.4, the glasses of Groups AQ/2 and AQ/3 present different Nd
5. The provenance of raw materials in glass: the isotopic approach
116
signatures with respect the Levantine raw glass coming from the primary workshops of
Bet Eli’ezer and Apollonia (Israel) (εNd= -5.10 and -6.00, Freestone et al., in press),
indicating their silica raw materials would not originate from exactly the same locations
and suggesting that likely different materials were exploited.
The Nd signature of Groups 1a and 1b (HIMT glasses) ranges between -3.73 and -5.35
εNd (Tab. E.1). Notwithstanding only some samples show a Nd composition similar to
that of other HIMT glasses reported in literature (Fig. 5.3.4, Freeestone et al., in press),
the εNd values consistent with Nile-dominated sediments, the differences in elemental
composition (higher levels of Mg, Fe, Mn and Ti) and the lower 87Sr/86Sr ratios
observed in these glasses concur to support, for the reasons already discussed, the
hypothesis of an Egyptian origin.
5.3.2 Oxygen isotopes
The results of the oxygen isotopic analysis are reported in Table E.2. The samples are
the same as analyzed for Sr and Nd isotopes with the addition of two plant ash glasses
(AD-VE-3 and AD-VE-4).
For what concerns the Roman natron glasses, it can be observed that the vast majority
of them show fairly homogeneous δ18O values, ranging between 15.1‰ to 16.2‰
(VSMOW), with a mean value of 15.6‰±0.2 (Table E.2, Fig. 5.3.5, a). The
compositional group, the type and the colour do not affect the δ18O of these glasses:
light blue/green, blue, amber and purple samples show, within the range of
reproducibility, the same isotopic composition. Similarly, the δ18O values measured on
one sample decolourised with Mn and on three samples decolourised with Sb are
identical to that of coloured glass (15.6‰-15.7‰, Table E.2). Only one Sb-colourless
glass (AD-I-2) shows a δ18O value significantly higher with respect the other Roman
natron glasses (17.5‰, Table E.2, Fig. 5.3.5, a). In recent work, Silvestri et al., 2010
observed a similar behavior in some contemporary Sb-colourless glasses, which show
δ18O values systematically higher than those of coloured or Mn-colourless glasses (Fig.
5.3.5, a). The authors excluded that the enrichment in δ18O depends on the addition of
decolourizers and assessed it is likely due to the greater addition of flux in this glass
type, which determines a higher percentage of Na2O content. However this cannot be
the explanation of the δ18O enrichment in AD-I-2 sample, since it has the lowest Na2O
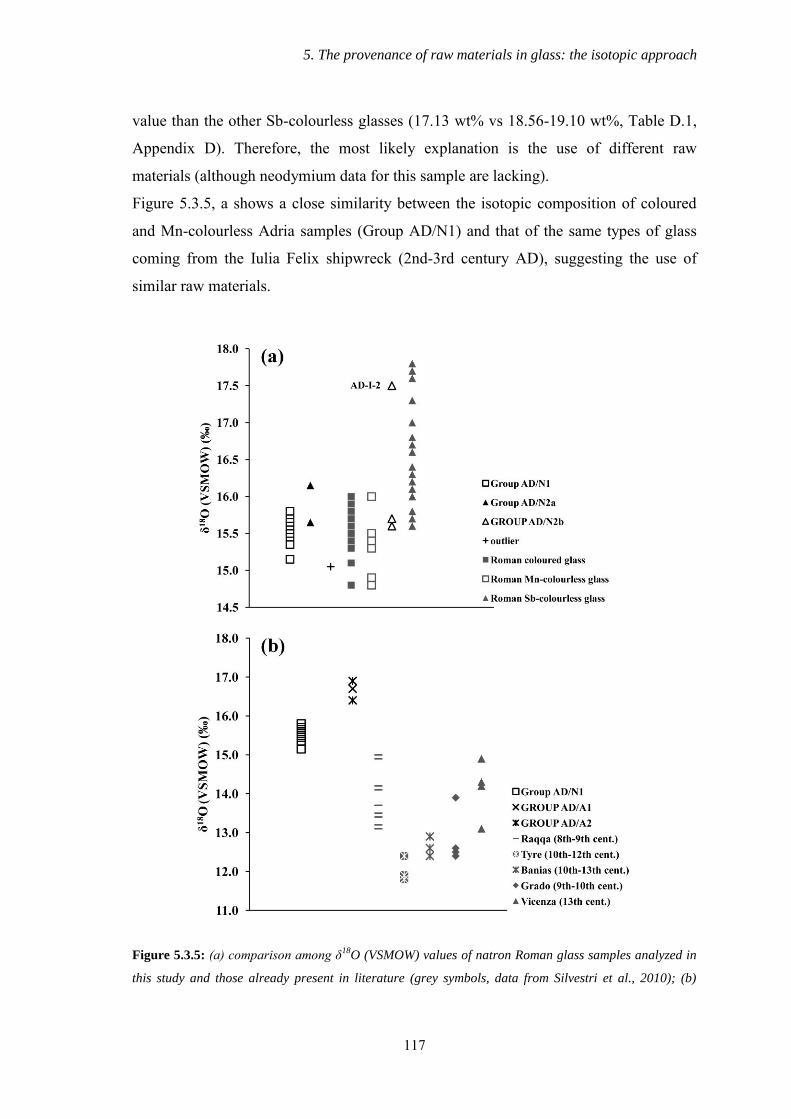
5. The provenance of raw materials in glass: the isotopic approach
117
value than the other Sb-colourless glasses (17.13 wt% vs 18.56-19.10 wt%, Table D.1,
Appendix D). Therefore, the most likely explanation is the use of different raw
materials (although neodymium data for this sample are lacking).
Figure 5.3.5, a shows a close similarity between the isotopic composition of coloured
and Mn-colourless Adria samples (Group AD/N1) and that of the same types of glass
coming from the Iulia Felix shipwreck (2nd-3rd century AD), suggesting the use of
similar raw materials.
Figure 5.3.5: (a) comparison among δ18
O (VSMOW) values of natron Roman glass samples analyzed in
this study and those already present in literature (grey symbols, data from Silvestri et al., 2010); (b)
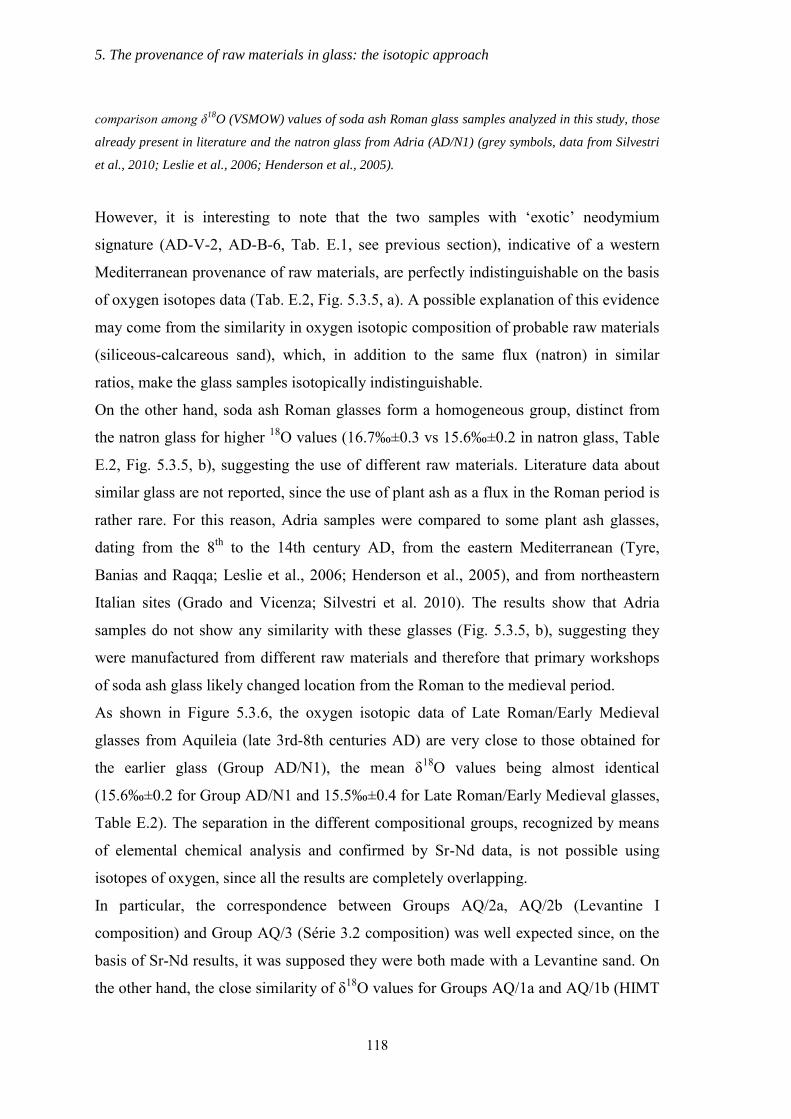
5. The provenance of raw materials in glass: the isotopic approach
118
comparison among δ18
O (VSMOW) values of soda ash Roman glass samples analyzed in this study, those
already present in literature and the natron glass from Adria (AD/N1) (grey symbols, data from Silvestri
et al., 2010; Leslie et al., 2006; Henderson et al., 2005).
However, it is interesting to note that the two samples with ‘exotic’ neodymium
signature (AD-V-2, AD-B-6, Tab. E.1, see previous section), indicative of a western
Mediterranean provenance of raw materials, are perfectly indistinguishable on the basis
of oxygen isotopes data (Tab. E.2, Fig. 5.3.5, a). A possible explanation of this evidence
may come from the similarity in oxygen isotopic composition of probable raw materials
(siliceous-calcareous sand), which, in addition to the same flux (natron) in similar
ratios, make the glass samples isotopically indistinguishable.
On the other hand, soda ash Roman glasses form a homogeneous group, distinct from
the natron glass for higher 18O values (16.7‰±0.3 vs 15.6‰±0.2 in natron glass, Table
E.2, Fig. 5.3.5, b), suggesting the use of different raw materials. Literature data about
similar glass are not reported, since the use of plant ash as a flux in the Roman period is
rather rare. For this reason, Adria samples were compared to some plant ash glasses,
dating from the 8th to the 14th century AD, from the eastern Mediterranean (Tyre,
Banias and Raqqa; Leslie et al., 2006; Henderson et al., 2005), and from northeastern
Italian sites (Grado and Vicenza; Silvestri et al. 2010). The results show that Adria
samples do not show any similarity with these glasses (Fig. 5.3.5, b), suggesting they
were manufactured from different raw materials and therefore that primary workshops
of soda ash glass likely changed location from the Roman to the medieval period.
As shown in Figure 5.3.6, the oxygen isotopic data of Late Roman/Early Medieval
glasses from Aquileia (late 3rd-8th centuries AD) are very close to those obtained for
the earlier glass (Group AD/N1), the mean δ18O values being almost identical
(15.6‰±0.2 for Group AD/N1 and 15.5‰±0.4 for Late Roman/Early Medieval glasses,
Table E.2). The separation in the different compositional groups, recognized by means
of elemental chemical analysis and confirmed by Sr-Nd data, is not possible using
isotopes of oxygen, since all the results are completely overlapping.
In particular, the correspondence between Groups AQ/2a, AQ/2b (Levantine I
composition) and Group AQ/3 (Série 3.2 composition) was well expected since, on the
basis of Sr-Nd results, it was supposed they were both made with a Levantine sand. On
the other hand, the close similarity of δ18O values for Groups AQ/1a and AQ/1b (HIMT
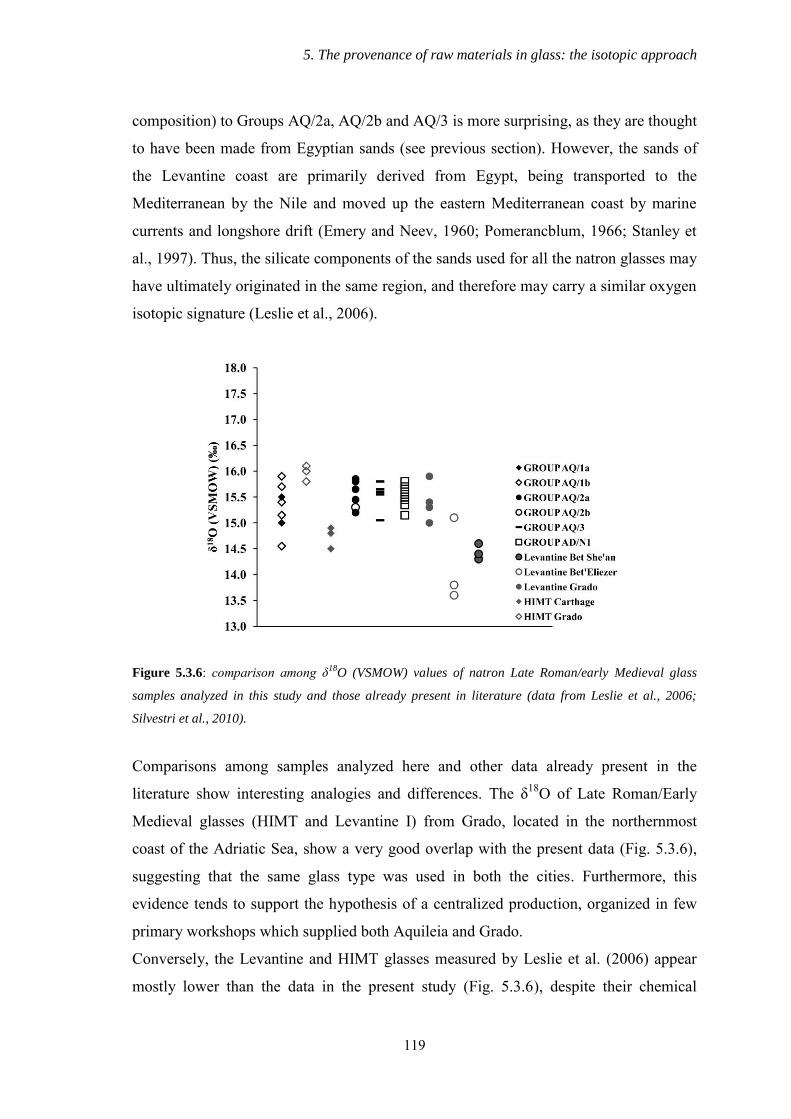
5. The provenance of raw materials in glass: the isotopic approach
119
composition) to Groups AQ/2a, AQ/2b and AQ/3 is more surprising, as they are thought
to have been made from Egyptian sands (see previous section). However, the sands of
the Levantine coast are primarily derived from Egypt, being transported to the
Mediterranean by the Nile and moved up the eastern Mediterranean coast by marine
currents and longshore drift (Emery and Neev, 1960; Pomerancblum, 1966; Stanley et
al., 1997). Thus, the silicate components of the sands used for all the natron glasses may
have ultimately originated in the same region, and therefore may carry a similar oxygen
isotopic signature (Leslie et al., 2006).
Figure 5.3.6: comparison among δ
18O (VSMOW) values of natron Late Roman/early Medieval glass
samples analyzed in this study and those already present in literature (data from Leslie et al., 2006;
Silvestri et al., 2010).
Comparisons among samples analyzed here and other data already present in the
literature show interesting analogies and differences. The δ18O of Late Roman/Early
Medieval glasses (HIMT and Levantine I) from Grado, located in the northernmost
coast of the Adriatic Sea, show a very good overlap with the present data (Fig. 5.3.6),
suggesting that the same glass type was used in both the cities. Furthermore, this
evidence tends to support the hypothesis of a centralized production, organized in few
primary workshops which supplied both Aquileia and Grado.
Conversely, the Levantine and HIMT glasses measured by Leslie et al. (2006) appear
mostly lower than the data in the present study (Fig. 5.3.6), despite their chemical
5. The provenance of raw materials in glass: the isotopic approach
120
similarity. As already suggested by Leslie et al. (2006) and Silvestri et al. (2010), a
possible explanation for the differences in oxygen composition could be the exploitation
of different raw materials on the coast of the eastern Mediterranean, as also already
suggested by Nd data. Supporting this possibility are the isotopic composition of two
Belus samples, which have different 18O values, due to different ratios between most
abundant minerals (quartz and calcite), even though they were sampled from two
different sites 200 m from each other (Silvestri et al., 2010). Moreover, another
possibility may be the use of different sources of natron, with distinct isotopic signature
which influenced the final glass in a different way (Silvestri et al., 2010).
In summary, the homogeneity in oxygen isotopic signature between Roman and Late
Roman/early Medieval glasses from Adria and Aquileia indicates a common origin of
their raw materials, notwithstanding the slight differences in chemical composition
suggest that they do not come from exactly the same geographical area and that
different materials were exploited. Moreover, the chemical and isotopic similarity
between Late Roman/early Medieval glass from Grado and Aquileia, together with the
chemical correspondence among Groups AQ/2a and AQ/2b and Levantine glass (see
section 4.2.1), suggest they come from the same raw material source which tends to
support the hypothesis that glass was imported in Adriatic zone from primary
workshops likely located in the Near East.
5.4 Conclusions
The combined analyses of strontium, neodymium and oxygen isotopes proved to be a
valid supplement to the chemical characterization for tracing the provenance of raw
materials in ancient glass.
Nd is characteristic of the mineral fraction other than quartz in the silica raw material,
while Sr is in most cases characteristic of the lime component. Except the glasses with
HIMT composition (Groups AQ/1a and AQ/1b), the greater part of natron glass here
analyzed, independently from the age, shows values of strontium close to the modern
ocean seawater (0.7092), indicating that the source of lime was marine shell and then
that coastal sands were likely employed in its production. However, chemical and
isotopic data on purple glasses show that Mn-bearing colourants can introduce
strontium in the batch and then modify both the total content and the isotopic signature.
5. The provenance of raw materials in glass: the isotopic approach
121
All Late Roman/early Medieval (late 3rd-8th century AD) glasses from Aquileia show a
Nile-dominated Mediterranean Nd signature (higher than -6 εNd), in some cases similar
to that of 4th-8th century AD primary workshops in the Levant. In addition, Groups
AQ/2a, AQ/2b and AQ/3 (Levantine I and Série 3.2) have a chemical composition close
to contemporary glass produced in some Levantine workshops. Therefore, the chemical
and isotopic data of these glasses concur to support the hypothesis of an eastern
Mediterranean origin, likely in the Syro-Palestinian region, although not necessary in
the same workshops reported in literature. On the other hand, HIMT glasses (Groups
AQ/1a and AQ/1b), which show similar Nd signatures, are distinguished from
Levantine glasses by lower 87Sr/86Sr values, also correlated to higher contents of Fe2O3,
TiO2, MgO and lower CaO. These evidences indicate that they were produced from
geochemically distinctive, but geographically proximal sands. So far, the chemical and
isotopic data seem to favour an area of origin on the Egyptian coast, between
Alexandria and Gaza (Freestone et al., in press).
Assigning the primary origin to 1st-3rd century AD glasses is more difficult. The large
spread in their isotopic composition suggests the use of multiple sand sources or,
alternatively, an intense recycling of glass with different primary origins. Sb-colourless
glasses represent an exception, since their homogeneous isotopic composition indicates
that they are a well distinct production and were subjected to a limited or selective
recycling. As the Late Roman/early Medieval glass from Aquileia, the majority of
Roman glass coming from Adria show a relatively high Nd signature (> -6 εNd), similar
to that of aforementioned 4th-8th century AD primary production centres located in the
Syro-Palestinian coast, pointing to an analogous provenance. However, the slight but
clear differences in major element chemistry among Roman Adria glasses and the
Byzantine glass produced in the Levantine workshop raise the problem of a possible
different origin. Indeed, notwithstanding it is probable that these variations could be due
to exploitation of different ores along the Syro-Palestinian coast, the use of other
primary sources cannot be completely excluded. In particular, the recent discovery in
southern Italy of sand, suitable for glassmaking, and with a Nd signature coincident
with the range of Nd values previously thought to be characteristic for an eastern
Mediterranean origin (Brems et al., submitted b), represents a critical point in the
application of Nd isotopes for provenancing ancient glass. Further geochemical studies
5. The provenance of raw materials in glass: the isotopic approach
122
on trace elements are essential to determine if Italian and Levantine sands can be
distinguished, but it is also necessary to expand the current number of analyses of raw
materials, as well as of more glass from primary furnace.
Only two Roman glasses with a different Nd signature (lower than -7 εNd) have been
identified in Adria sample set. This data is inconsistent with any sediment in the eastern
Mediterranean and tends to locate primary production in western Mediterranean or
north-western Europe, as already suggested by other authors (Degryse and Schneider,
2008). It is interesting to note that these samples are chemically indistinguishable from
the others, indicating that the main element and isotopic data not always concur.
Conversely, both techniques are complementary, indicating that the preferred approach
in investigation of ancient glasses is likely the use of the two methods in tandem.
For what concerns oxygen isotopes, it was observed that the contribution of both flux
and sand to the isotopic composition of the glass makes it somewhat less powerful than
neodymium in provenancing raw materials. Overall, oxygen isotopes appear to be quite
effective as discriminants of glass raw material sources, in particular they proved to be a
diagnostic method to discriminate natron and plant ash glass.
The substantial homogeneity in oxygen isotopes between natron Roman and Late
Roman/early Medieval glasses from Adria and Aquileia implies the use of similar raw
materials and suggests a common origin, although it is probable that different ores were
exploited in the same area. Moreover, by combining the data of O, Sr-Nd and chemical
analyses, the hypothesis that glass was produced in few primary workshops, likely
located in Syro-Palestine and Egypt, and then imported in northern Adriatic area seems
to be strongly supported.
123
CONCLUDING REMARKS
The evolution of glass production (type and provenance of raw materials, production
technologies) in a large chronological period (6th century BC-15th century AD) and in
a specific geographical area, the northeastern Adriatic Italy, was here mainly
investigated. The sample set, including a total of 178 glasses, comes from some of the
most important sites in the period and in the area considered, such as Aquileia, Adria
and Rocca di Asolo. Few samples coming from Tuscan sites (San Genesio, Pieve di
Pava and Pieve di Coneo), similar in age and types to Aquileia glasses, were also
analyzed, in order to have a comparison among eastern and western Italy.
The analytical approach involved textural, mineralogical, chemical and isotopic (Sr, Nd,
O) analyses and the results proved the complementarity of these techniques, suggesting
that the preferred approach in investigation of ancient glasses should be the combined
use of these methods.
A substantial continuity in the use of the type of raw materials (siliceous-calcareous
sand in addition to natron) from Pre-Roman period until early Middle Ages was
testified. The continuity between Pre-Roman and Roman production is also supported
by the use of the same opacifiers: calcium antimonate in white and light blue, lead
antimonate in yellow glasses. Conversely, a complete change in the use of flux is
evident in High/Late Medieval glasses, in which natron was replaced by soda ashes. A
little group of intensely coloured (emerald green, one blue and one black) soda ash
glasses from Adria, dating 1st-3rd century AD, constitutes a peculiarity and suggest
they were imported from geogaphical areas where the use of plant ashes was never
interrupted.
Chemical analyses show that samples can be grouped by age, indicating routine glass
production processes; on the other hand, no particularly relationships were observed
between types and chemical composition. Different groups have been identified and
usefully compared with the major compositional groups present in the literature. The
extraordinary consistency of natron glass and the principal compositional groups
widespread in Mediterranean sites tends to support the model of the localized
124
production, organized in a small number of primary workshops which supplied raw
glass to a great number of secondary workshops, where the glass was re-melted and
shaped into objects. Moreover, data collected in this study show that, at least in Late
Roman/early Medieval period, the geographical position was an important factor
influencing the distribution of newly manufactured glass. Indeed, it appears that the
supply of ‘fresh’ glass was easier for the Aquileia, located in a strategic position on the
northeastern Italian side and well connected by sea to the eastern Mediterranean area,
than for other sites located in the opposite part of the Italian peninsula (Tuscan sites) or
far away from the sea (Rocca di Asolo).
The transition from the use of natron to that of plant ash likely determined a change also
in the organization of glass production and in the location of primary workshops. For
what concerns northeastern Italy, although the the transition of the glass industry from
Roman to Medieval periods has not been completely understood, it is known that, at
least from the 12th century ash glass was produced in Venice (Verità et al., 2002; Verità
and Zecchin, 2009). The analytical and historical evidence on High/Late Medieval
glasses from Rocca di Asolo strongly suggests that they come from Venice, giving a
further indication of the fundamental role that this city played in glass manufacture and
trade during Middle Ages.
For what concerns the provenance of raw materials, an essential contribution was
provided from isotopic analysis, in particular those of Sr and Nd. At this stage the study
mainly focused on a selection of Roman and Late Roman/early Medieval glasses,
coming from Adria and Aquileia, respectively. The combination of isotopic and
chemical data, together with archaeological evidence and literature data on both raw
materials and glass from primary furnaces, suggests that the vast majority of Roman and
Late Roman/early Medieval glasses analyzed in this study were likely produced in
workshops located on the Syro-Palestinian and Egyptian coasts, although not
necessarily in same ateliers so far identified. However, the recent discovery in southern
Italy of sand with Nd signature coincident with the range of Nd values previously
thought to be characteristic for an eastern Mediterranean origin (Brems et al., submitted
b), implies that the use of primary sources located in western Mediterranean cannot be
definitely excluded and necessitate further analyses on trace elements in order to
determine if Italian and Levantine sands can be distinguished.
125
On the other hand, oxygen isotopes have been demonstrated to be a less powerful tool
than neodymium for provenancing raw materials, since the contribution of the same
flux and of the quartz contained in the sand, uniforms the isotopic signature of natron
glass, making it indistinguishable. Conversely, they appear to be a diagnostic method to
discriminate natron and plant ash glass.
In synthesis, the results collected in the present work tend to indicate that the origin of
the majority of Roman and Late Roman/early Medieval glasses, coming from Adria and
Aquileia, has to be localized in the eastern Mediterranean. However, this evidence does
not exclude the possibility that secondary workshops could have been active in these
cities and, in this respect, future studies on production indicators (drops, filaments, raw
glass), never analyzed from an archaeometric point of view, are desirable.
On the other hand, during High Middle Ages the transition from natron to soda ash
determined the affirmation of Venice as ‘point of reference’ for glass production in
northern Adriatic area. However, the import in this city of Levantine ashes and the
similarity among some Venetian and Islamic glasses suggest that exchanges of know-
how and raw materials between the northern Adriatic Italy and the eastern
Mediterranean still continued throughout the Middle Ages.
127
REFERENCES
- Aerts , B. Velde , K. Janssens , W. Dijkman , 2003, Change in silica sources in
Roman and post-Roman glass, Spectrochimica Acta part B 58, 659-667.
- F. Aldsworth, G. Haggarty, S. Jennings, D. Whitehouse, 2002, Medieval
glassmaking at Tyre, Lebanon, Journal of Glass Studies 44, 49-66.
- D. Allen, 1998, Roman Glass in Britain, ed. J. Dyer., Princes Risborough,
Buckinghamshire: Shire Publications.
- Angelini, G. Artioli, P. Bellintani, A. Cardarelli, V. Diella, A. Polla, Residori,
2002, Project: “Glass materials in the protohistory North Italy”: a first summary,
in C. D‟Amico (Ed.), Atti II Congresso Nazionale di Archeometria, Patron
Editore, Bologna, 581-595.
- Angelini, G. Artioli, P. Bellintani, V. Diella, M. Gemmi, A. Polla, A. Rossi,
2004, Chemical analyses of Bronze Age glasses from Frattesina di Rovigo,
northern Italy, Journal of Archaeological Science 31, 1175-1184.
- I. Angelini, C. Nicola, G. Artioli, 2006, Studio analitico dei materiali vetrosi, in
M. Venturino Gambari (Ed.), Navigando lungo l‟Eridano. La necropoli
protogolasecchiana di Morano sul Po, Museo Civico, Città di Casale
Monferrato, 77-82, 111–117.
- R. Arletti, M.C. Dalconi, S. Quartieri, M. Triscari, G. Vezzalini, 2006, Roman
coloured and opaque glass: a chemical and spectroscopic study. Applied Physics
A 83, 239–245.
- R. Arletti, G. Vezzalini, S. Benati, 2010 a, Roman window glass: a comparison
of findings from three different Italian sites, Archaeometry 52(2), 252–271.
- R. Arletti, C. Maiorano, D. Ferrari, G. Vezzalini, S. Quartieri, 2010b, The first
archaeometric data on polychrome Iron Age glass from sites located in northern
Italy, Journal of Archaeological Science 37, 703–712.
- R. Arletti, L. Rivi, D. Ferrari, G. Vezzalini, 2011, The Mediterranean Group II:
analyses of vessels from Etruscan contexts in northern Italy, Journal of
Archaeological Science 38, 2094-2100.
128
- E. Ashtor, G. Cevidalli, 1983, Levantine alkali ashes and European industries,
European Journal of Economic History 12, 475–522.
- J. L. Banner, 2004, Radiogenic isotopes: systematic and applications to earth
surface processes and chemical statigraphy, Earth Science Reviews 65, 141-194.
- R. Basu, S. B. Jacobsen, R. J. Poreda, C. B. Dowling, P. K. Aggrawal, 2001,
Large groundwater strontium flux to the oceans from the Nemgal Basin and the
marine strontium isotope record, Science, 293, 1470–3.
- M. J. Baxter, H. E. M. Cool, C. M. Jackson, 2005, Further studies in the
compositional variability of colourless Romano-British vessel glass,
Archaeometry 47, 45–68.
- L. Bertacchi, 2003, Nuova pianta archeologica di Aquileia, Edizioni del
Confine, Udine.
- M. Bimson, I.C. Freestone, 1983, An analytical study of the relationship
between the Portland vase and other Roman cameo glasses, Journal of Glass
Studies 25, 55-64.
- J. Bonetto, 1993, L'area del Monte Ricco: evoluzione delle strutture insediative
e di difesa dal VI/VII al XV/XVI secolo, in F. Bocchi, G. Rosada (Eds.), Atlante
Storico delle Città Italiane-Asolo, Grafis Edizioni, Casalecchio di Reno
(Bologna).
- J. Bonetto, M. Salvadori, in press, Aquileia. Edilizia domestica. I progetti di
ricerca presso la cd. Domus delle Bestie ferite e presso l‟area dei fondi ex
Cossar, in Primo Forum sulla ricerca archeologica in Friuli Venezia Giulia, in
L. Fozzati and G. Petrucci (Eds.), Quaderni della Soprintendenza per i Beni
Archeologici del Friuli Venezia Giulia.
- S. Bonomi, 1996, Vetri Antichi del Museo Archeologico Nazionale di Adria,
Corpus delle Collezioni Archeologiche del Veneto, Comitato Nazionale Italiano
AIHV.
- D. Brems, M. Ganio, M. Walton, P. Degryse, In press, Mediterranean sand
deposits as a raw material for glass production in Antiquity. Annales du 18e
Congrès de l‟Association Internationale pour l‟Histoire du Verre, Thessaloniki.
129
- D. Brems, P. Degryse, F. Hasendoncks, D. Gimeno, A. Silvestri, E. Vassilieva,
S. Luypaers, J. Honings, submitted a, Western Mediterranean sand deposits as a
raw material for Roman glass production, Journal of Archaeological Science.
- D. Brems, submitted b, M. Ganio, K. Latruwe, L. Balcaen, D. Gimeno, A.
Silvestri, F. Vanhaecke, P. Muchez, P. Degryse, Isotopes on the beach-Sr and
Nd isotopic analysis for provenancing Roman glassmaking, Journal of
Analytical Atomic Spectrometry.
- R. H. Brill, J. M. Wampler, 1965, Isotope studies of ancient lead, American
Journal of Archaeology 71, 63-77.
- R. H. Brill, 1970, The chemical interpretation of the texts, in A. L. Oppenheim,
R. H. Brill, D. Barag and A. von Saldern (Eds.) Glass and glassmaking in
ancient Mesopotamia, Corning Museum of Glass, New York, pp. 105–128.
- R. Brill, 1988, Scientific Investigations of the Jalame glass and related finds, in
G.D Weinberg (Ed.) Excavations at Jalame: site of a glass factory in Late
Roman Palestine, University of Missouri Press, Columbia.
- R. H. Brill, 1999, Chemical analyses of early glasses, vols 1 and 2, Corning
Museum of Glass, New York.
- M. Buora, L. Mandruzzato, M. Verità, 2009, Vecchie e nuove evidenze di
officine vetrarie romane ad Aquileia, Quaderni di Archeologia Friulana XIX,
51-58.
- W. A. Burke, R. E. Denison, E. A. Hetherington, R. B. Koepnik, H. F. Nelson, J.
B. Otto, 1982, Variations of seawater 87Sr/86Sr throughout Phanerozoic time,
Geology 10, 516–19.
- K. H. Butler, M. J. Bergin, V. M. B. Hannaford, 1950, Calcium antimonates,
Electrochemical Society Journal 97, 117-122.
- Cagno, S., Janssens, K., Mendera, M., 2008, Compositional analysis of Tuscan
glass samples: in search of raw material fingerprints, Analytical and
Bioanalytical Chemistry 391(4), 1389–1395.
- Cagno, S., Mendera, M., Jeffries, T., Janssens, K., 2010, Raw materials for
medieval to post-medieval Tuscan glassmaking: new insight from LA-ICP-MS
analyses, Journal of Archaeological Science 37(12), 3030-3036.
130
- S. Cagno, L. Favaretto, M. Mendera, A. Izmer, F. Vanhaecke, K. Janssens,
2011, Evidence of early medieval soda ash glass in the archaeological site of
San Genesio (Tuscany), Journal of Archaeological Science, doi:
10.1016/j.jas.2011.12.031.
- M. C. Calvi, 1968, I Vetri Romani del Museo di Aquileia, Associazione
nazionale per Aquileia.
- S. Campana, C. Felici, R. Francovich, L. Marasco, C. Lubritto, I. Passariello, F.
Marzioli, N. De Cesare, M. Rubino, G. Borriello, A. D‟Onofrio, F. Terrasi,
2007, L‟utilizzo delle datazioni al radiocarbonio nel sito archeologico di Pava,
in C. D‟amico (Ed.), Atti IV Congresso AIAr, Patron Editore, Bologna.
- F. Cantini, 2010, Vicus Wallari-borgo San Genesio. Il contributo
dell‟archeologia alla ricostruzione della storia di un central place della valle
dell‟Arno, in Vico Wallari-San Genesio. Ricerca storica e indagini
archeologiche su una comunità del Medio Valdarno, Firenze University Press.
- M. Chiabà, 2009, Dalla fondazione all‟età tetrarchica, in: F. Ghedini, M. Bueno,
M. Novello (Eds.), Moenibus et portu celeberrima, Aquileia: storia di una città,
Istituto poligrafico e Zecca dello Stato, Roma, 7-22.
- G. Ciampoltrini, 2008, Vie e pievi, pievi e castelli. Storie parallele di due plebes
baptismales del territorio di Lucca, in Chiese e insediamenti nei secoli di
formazione dei paesaggi medievali della Toscana (V-X secolo), Quaderni del
Dipartimento di Archeologia e Storia delle Arti. Sezione Archeologica 64.
- P. Costagliola, G. Baldi, C. Cipriani, E. Pecchioni, A. Buccianti, 2000,
Mineralogical and chemical characterization of the Medicean glass mosaic
tesserae and mortars of the Grotta del Buontalenti, Giardino di Boboli, Firenze,
Italy Journal of Cultural Heritage 1, 287-299.
- R.L. Cullers , S. Chaudhuri , N. Kilbane, R. Koch , 1979, Rare earths in size
fractions and sedimentary rocks of Pennsylvanian-Permian age from the mid-
continent of the USA, Geochimica Cosmochimica Acta 43, 1285-1302.
- K. Cummings, 2002, A History of Glassforming. University of Pennsylvania
Press.
- P. Degryse, J. Schneider, U. Haack, V. Lauwers, J. Poblome, M. Waelkens, Ph.
Muchez, 2006a, Evidence for glass „recycling‟ using Pb and Sr isotopic ratios
131
and Sr-mixing lines: the case of early Byzantine Sagalassos. Journal of
Archaeological Science 33, 494-501.
- P. Degryse, J. Schneider, V. Lauwers, D. De Muynck, F. Vanhaecke, M.
Waelkens, Ph. Muchez, 2006b, Sr and Nd isotopic evidence in the primary
provenance determination of Roman glass from Sagalassos (SW Turkey), in K.
Janssens, P. Degryse, P. Cosyns, J. Caen, L. Van‟t Dack (Eds.), Annales du 17e
Congrès de l‟Association Internationale pour l‟Histoire du Verre, Anvers, 564-
570.
- P. Degryse, J. Schneider, 2008, Pliny the Elder and Sr-Nd isotopes: tracing the
provenance of raw materials for Roman glass production, Journal of
Archaeological Science 35, 1993-2000.
- P. Degryse, J. Henderson, G. Hodgins, 2009a, Isotopes in vitreous materials, a
state-of-the-art and perspectives, in P. Degryse, J. Henderson, G. Hodgins
(Eds.), Isotopes in vitreous materials, Studies in Archaeological Sciences,
Leuven University Press, 15-30.
- P. Degryse, J. Schneider, V. Lauwers, J. Henderson, B. Van Daele, M. Martens,
H.D.J. Huisman, D. De Muynck, Ph. Muchez, 2009b, Neodymium and
strontium isotopes in the provenance determination of primary natron glass
production, in P. Degryse, J. Henderson, G. Hodgins (Eds.), Isotopes in vitreous
materials, Studies in Archaeological Sciences, Leuven University Press, Leuven
University Press, 53-72.
- P. Degryse, A. Shortland, 2009, Trace elements in provenancing raw
materialsfor Roman glass production, Geologica Belgica 12/3-4, 135-143.
- P. Degryse, A. Shortland, D. De Muynck, L. Van Heghe, R. Scott, Bert Neyt,
Frank Vanhaecke, 2010a, Considerations on the provenance determination of
plant ash glasses using strontium isotopes, Journal of Archaeological Science
37, 3129-3135.
- P. Degryse, I.C. Freestone, J. Schneider, S. Jennings, 2010b, Technology and
provenance study of Levantine plant ash glass using Sr-Nd isotope analysis, In J.
Drauschke, D. Keller, (Eds.), Glas in Byzanz e Produktion, Verwendung,
Analysen, RGZM Tagungen Band 8.
132
- M. De Min, 1987, Adria, in: Il veneto nell‟età Romana. II. Note di urbanistica e
di archeologia del territorio, Verona, 255-268.
- D . De Muynck, G. Huelga-Suarez, L. Van Heghe, P. Degryse, F. Vanhaecke,
2009, Systematic evaluation of a strontium-specific extraction chromatographic
resin for obtaining a purified Sr fraction with quantitative recovery from
complex and Ca-rich matrices, Journal of Analytical Atomic Spectrometry 24
(11), 1498-1510.
- D. J. DePaolo, G. J. Wasserburg, 1976, „Nd isotopic variations and petrogenic
models‟, Geophysical Research Letters 3, 249-252.
- D. J. DePaolo, B. I. Ingram, 1985, High resolution stratigraphy with strontium
isotopes, Science, 227, 938–41.
- G. De Tommaso, 1990, Ampullae vitreae. Contenitori in vetro di unguenti e
sostanze aromatiche dell‟Italia romana (I sec.a.C.-III sec.d.C.), Roma.
- J. Dik, K. Janssens, G. Van der Snickt, L. van der Loeff, K. Rickers, M. Cotte,
Visualization of a lost painting by Vincent van Gogh using synchrotron
radiation based X-ray fluorescence elemental mapping, Analytical Chemistry 80
(16), 6436 -6442.
- E. Eichholz, 1962, Pliny, Natural history, vol. X, books XXXVI and XXXVII,
Heinemann, London/Harvard University Press, Cambridge, MA.
- K.O. Emery, D. Neev, 1960, Mediterranean Beaches of Israel, Geological
Survey Israel Bulletin 26, 1-23.
- G. Faure, 1986, Principles of isotope geology, 2nd ed, John Wiley and Sons.
- G. Faure, T. M. Mensing, 2005, Isotopes: Principles and application, 3rd edition,
John Wiley & Sons.
- D. Ferrari, A. Larese, G. Meconcelli Notarianni, M. Verità, 1998, Glossario del
vetro antico, Venezia. Trad. Inglese D.B. Whitehouse.
- C. Fiori, M. Vandini, 2004, Chemical composition of glass and its raw
materials: chronological and geographical development in the first millennium
AD, in M. Beretta (Ed.), When glass matters: Studies in the History of Science
and Art from Graeco-Roman Antiquity to Early-Modern Era, Leo S. Olschki,
Firenze.
133
- S. J. Fleming, 1999, Roman Glass: reflections on cultural change, Philadelphia,
University of Pennsylvania Museum of Archaeology and Anthropology.
- G. Fogolari, B. M. Scarfì, 1970, Adria Antica, Alfieri, Edizioni d‟Arte, Venezia.
- E. Foster, C. M. Jackson, 2009, The composition of „naturally coloured‟ late
Roman vessel glass from Britain and the implications for models of glass
production and supply, Journal of Archaeological Science 36(2), 189–204.
- D. Foy, M. Jezegou, 1998, Commerce et technologie du verre antique. Le
témoignage de l‟épave „Ouest Embiez 1‟, in Actes du 121e Congrès national des
sociétés historiques et scientifiques, Archéologie-Méditerranée, Nice, 1996:
Méditerranée antique. Pêche, navigation, commerce, 121–34.
- D. Foy, M. Vichy, M. Picon, 2000, Lingots de verre en Méditerrané occidentale,
in Annales du 14th congrès de l‟Association pour l‟Histoire du Verre AIHV,
Amsterdam, 51-57.
- D. Foy, M. Picon, M. Vichy, V. Thirion-Merle, 2003, Caractérisation des verres
de la fin de l‟Antiquité en Méditerranée occidentale: l‟émergence de nouveaux
courants commerciaux, in D. Foy and M.D. Nenna (Eds.) Échanges et
commerce du verre dans le monde antique, Actes du colloque de l‟Association
Française pour l‟Archéologie du Verre, Aix-en-Provence et Marseille, 7–9 juin
2001, Editions Monique Mergoil, Montagnac, 41–85.
- Frank, S., 1982, Glass and archaeology, Academic Press, London.
- I. C. Freestone, 1992, Theophilus and the composition of medieval glass, in B.
P. Vandiver, J.R. Druzik, G.S. Wheeler and I.C. Freestone (Eds.), Materials
Issues in Art and Archaeology III, Materials Research Society Simposium
Proceedings, volume 267, (San Francisco, California, U.S.A., 27 April-1 May
1992), Materials Research Society Pittsburg, Pennsylvania, 739-745.
- I. C. Freestone, 1993, Compositions and origins of glasses from Romanesque
champlevé enamels, in N. Stratford (Ed.), Catalogue of medieval enamels in the
British Museum, British Museum, London, vol II, 37–45.
- Freestone, I. C., 1994, Chemical analysis of „raw‟ glass fragments, in
Excavation at Carthage, volume II, the Circular Harbour, north side. The site
and finds other than pottery, H. R. Hurst (ed.), British Academy Monographs in
Archeology, N°4, Oxford University Press, Oxford.
134
- I. C. Freestone, Y. Gorin-Rosen, 1999, The great glass slab at Beth She'arim: an
early Islamic glass-making experiment'?, Journal of Glass Studies 41, 105- l 16.
- I.C. Freestone, Y. Gorin-Rosen, M.J. Hughes, 2000, Primary glass from Israel
and the production of glass in Late Antiquity and the Early Islamic period, In
M.D. Nenna (Ed.), La route du verre. Ateliers primaires et secondaires du
second millénaire avant J.C. au Moyen Age. Travaux de la Maison de l‟Orient
Méditerranéen, 33. TMO, Lyon, 65-82.
- I.C. Freestone , M. Ponting, J. Hughes , 2002, The origins of Byzantine glass
from Maroni Petrera, Cyprus, Archaeometry 44, 257-272.
- I.C. Freestone, K. A. Leslie, M. Thirlwell, Y. Gorin-Rosen, 2003, Strontium
isotopes in the investigation of early glass production: Byzantine and early
Islamic glass from the Near East, Archaeometry 45(1), 19–32.
- I.C., Freestone, S. Wolf, M. Thirlwall, 2005, The production of HIMT glass:
elemental and isotopic evidence. Annales du 16e Congress of the Association
Internationale pour l‟Histoire du Verre, London, 153-157.
- I. C. Freestone, 2006, Glass production in Late Antiquity and the Early Islamic
period: a geochemical perspective, in M. Maggetti, B. Messiga (Eds.),
Geomaterials in Cultural Heritage, Geological Society of London, Special
Publications 257, 201-216.
- I.C. Freestone, 2008, Pliny on Roman Glassmaking, in M. Matinón-Torres, T.
Rehren, (Eds.), Archaeology, History and Science. Integrating Approaches to
Ancient Materials (UCL Institute of Archaeology Publications), Oxford, 77-100.
- I. C. Freestone, S. Wolf, M. Thrlwall, 2009, Isotopic composition from the
Levant and the south-eastern Mediterranena region, in P. Degryse, J. Henderson,
G. Hodgins (Eds.), Isotopes in vitreous materials, Studies in Archaeological
Sciences, Leuven University Press, 31-51.
- C. Freestone, P. Degryse, J. Shepherd, Y. Gorin-Rosen, J. Schneider, In press,
Neodymium and strontium isotopes indicate a Near Eastern origin for late
Roman glass in London, Journal of Archaeological Science.
- C.D. Frost, R.K. O‟Nions, S.L. Goldstein, 1986, Mass balance for Nd in the
Mediterranean Sea, Chemical Geology 55, 45-50.
135
- N. H. Gale, Z. Stos-Gale, 1982, Bronza Age Copper Sources in the
Mediterranean: a New Approach, Science 216, 11-19.
- F. Gallo, A. Marcante, G. Molin, A. Silvestri, 2011, Glass from Casa delle
Bestie Ferite (Aquileia, UD): an archaeological and archaeometric study (Oral
presentation), National Day of Study on Excavations at Aquileia, Padova (Italy),
21-22 February.
- M. Ganio, S. Boyen, D. Brems, R. Scott, D. Foy, K. Latruwe, G. Molin, A.
Silvestri, F. Vanhaecke, P. Degryse, In press, Trade Routes across the
Mediterranean: a Sr/Nd isotopic investigation on Roman colourkess galss,
Journal of the Society of Glass Technology.
- E. Gliozzo, A. Santagostino Barbone, F. D'Acapito, M. Turchiano, I. Turbanti
Memmi, G. Volpe, 2010, The Sectilia Panels of Faragola (Ascoli Satriano,
Southern Italy): A Multi-Analytical Study of the Green, Marbled (Green and
Yellow), Blue and Blackish Glass Slabs, Archeometry 52(3), 389-415.
- S.L. Goldstein, R.K. O‟Nions, P.J. Hamilton, 1984, A Sm-Nd isotopic study of
atmospheric dusts and particulates from major river systems, Earth and
Planetary Science Letters 70, 221-236.
- Y. Gorin-Rosen, 2000, The ancient glass industry in Israel: summary of finds
and new discoveries, in M.D. Nenna (Ed.), La route du verre. Ateliers primaires
et secondaires du second millénaire avant J.C. au Moyen Age. Travaux de la
Maison de l‟Orient Méditerranéen 33, Lyon, 49-64.
- K. Govindaraju, 1994, 1994 Compilation of working values and sample
description for 383 geostandards, Geostandards Newsletter, XVIII, Special
Issue, July, 1–158.
- B. Gratuze, I. Soulier, J. N. Barradon, D. Foy, 1992, De l‟origine du cobalt
dans le verres, Revue d‟Archéométrie 16, 97-108.
- Gratuze, C. Moretti, 2001, Lingotti e rottami di vetro destinati alla rifusione
rinvenuti nella navi naufragate in Mediterraneo (III sec a.C. – III sec. d.C):
analisi chimica dei reperti e recenti ipotesi sull‟organizzazione produttiva in
vetrerie primarie e secondarie, in C. Piccioli, F. Sogliano (Eds.), Il vetro in
Italia meridionale e insulare, VII Giornate nazionali di studio Comitato
Nazionale Italiano AIHV, Napoli, 5–7 dicembre 2001, 401–13.
136
- B. Gratuze, Y. Billaud, 2003, La circulation des perles en verre dans le Bassin
Méditerranéen, de l‟Age du Bronze moyen jusqu‟au Hallstatt, in D. Foy, M.D.
Nenna, (Eds.), Echanges et commerce du verre dans le monde antique. Actes du
colloque AFAV, Aix-en-Provence et Marseille 2001, Mergoil Editor,
Montagnac, 11-15.
- L.R. Green, F.A. Hart, 1987, Colour and chemical composition in ancient glass:
an examination of some Roman and Wealden glass by means of ultraviolet-
visible-infra-red spectrometry and Electron microprobe analysis, Journal of
Archeaological Science 14, 271-282.
- S. Greiff, J. Schuster, 2008, Technological study of enamelling on Roman glass:
The nature of opacifying, decolourizing and fining agents used with the glass
beakers from Lübsow (Lubieszewo, Poland), Journal of Cultural Heritage 9, 27-
32.
- D. F. Grose, 1989, Early Ancient Glass: core-formed, rod-formed and cast
vessels and objects from the late Bronze Age to the early Roman Empire, 1600
BC to AD 50, Hudson Hills Press, New York.
- D.F. Grose, 1991, Early Imperial Roman cast glass: The translucent coloured
and colourless fine wares, in Roman Glass: two centuries of art and invention,
M. Newby and K. Painter, Editors. 1991, Society of Antiquaries of London:
London.
- F. E. Grousset, P.E. Biscaye, A. Zindler, J. Prospero, R. Chester, 1988,
Neodymium isotopes as tracers in marine sediments and aerosols: North
Atlantic, Earth and Planetary Science Letters 87, 367-378.
- J. Guilaine, B. Gratuze, J.-N. Barrandon, 1990, Les perles de verre du
Calcolithique et de l‟Age du Bronze, in Proceedings 1er Colloque de Beynac,
“Le Bronze Atlantique”, 10-14 Septembre 1990, 255-266.
- D.B. Harden, 1981, Catalogue of Greek and Roman Glass in the British
Museum, I, London.
- I. Hartmann, K. Kappel, B. Grote, B. Arndt, 1997, Chemistry and Technology of
Prehistoric Glass from Lower Saxony and Hesse, Journal of Archaeological
Sciences 24, 547-559.
137
- J.W. Hayes, 1975, Roman and Pre-Roman Glass in the Royal Ontario Museum.
A Catalogue, Toronto.
- J. Henderson, 1985, The Raw Materials of Early Glass Production, Oxford
Journal of Archaeology 4, 267-291.
- J. Henderson, 1988, Glass production and Bronze Age Europe, Antiquity 62,
435–451.
- J. Henderson, 1993, Chemical analysis of the glass and faience from Hauterive-
Champréveyeres, Switzerland, in: A. M. Rychner- Faraggi (Ed.), Hauterive
Champréveyeres, 9: Mètal et Parure au Bronze Final, Musèe Cantonal
d‟Archèologie, Neuchatel.
- J. Henderson, 1996, Scientific analysis of selected Fishbourne vessel glass and
its archaeological interpretation, in B. W. Cunliffe, A. G. Down, D. J. Rudkin
(Eds.), Chichester excavations IX, excavations at Fishbourne 1969-1988, 189-
192.
- J. Henderson, 2000, The science and archaeology of materials, Routledge,
London.
- J. Henderson, 2002, Tradition and experiment in first millennium A.D. glass
production - the emergence of early Islamic glass technology in late Antiquity,
Accounts of Chemical Research 35(8), 594–602.
- J. Henderson, J. A. Evans, H. J. Sloane, M. J. Leng, C. Doherty, 2005, The use
of oxygen, strontium and lead isotopes to provenance ancient glasses in the
Middle East, Journal of Archaeological Science, 52, 655–74.
- D. J. Huisman, T. De Grot, S. Pols, B. J. H. Van Os, P. Degryse, 2009,
Compositional variation in Roman colourless glass objects from the Bocholtz
burial (The Netherlands), Archaeometry 5 (3), 413–439.
- C. Isings, 1957, Roman Glass from Dated Finds, Groningen-Djakarta.
- C. M. Jackson, 1996, From Roman to early Medieval glasses. Many happy
returns or a new birth? in Annales du 13e Congrès de l‟Association
Internationale pour l‟Histoire du Verre (AIHV), Lochem, The Netherlands, 289–
301.
138
- M. Jackson, L. Joyner, C.A. Booth, P.M. Day, E.C. Wager, V. Kilikoglou, 2003,
Roman glass-making at Coppergate York? Analytical evidence for the nature of
production, Archaeometry 45, 435-456.
- C. M. Jackson, 2005, Making colourless glass in the Roman period,
Archaeometry, 47(4), 763–80.
- C. Jackson, J. Price, C. Lemke, 2006, Glass production in the 1st century AD:
insights into glass technology, in K. Janssens, P. Degryse, P. Cosyns, J. Caen, L.
Van‟t Dack (Eds.), Annales du 17e Congrès de l‟Association Internationale pour
l‟Histoire du Verre, Anvers, 150-155.
- Jacoby, D., 1993, Raw materials for the glass industry of Venice and the
Terraferma about 1370–about 1460, Journal of Glass Studies 35, 65–90.
- Kouwatli, H. H. Curvers, B. Sturt, Y. Sablerolles, J. Henderson, P. Reynolds,
2008, A pottery and glass production site in Beirut (015), BAAL, 10.
- M. D. Krom, R: A. Cliff, L. M. Eijsink, B. Herut, R. Chester, 199, The
characterization of Saharan dusts and Nile particulate matter in surface
sediments from the Levantine basin using Sr isotopes, Marine Geology 155,
319-330.
- S. Lahlil, I. Biron, L. Galoisy, G. Morin, 2006, Technological Processes to
produce antimonate opacified glass throught history, in K. Janssens, P. Degryse,
P. Cosyns, J. Caen, L. Van‟t Dack (Eds.), Annales du 17e Congrès de
l‟Association Internationale pour l‟Histoire du Verre, Anvers, 571-579.
- S. Lahlil, I. Biron, L. Galoisy, G. Morin, 2008, Rediscovering ancient glass
technologies through the examination of opacifier crystals, Applied Physics A
92, 109–116.
- S. Lahlil, I. Biron, M. Cotte, J. Susini, 2010a, New insight on the in situ
crystallization of calcium antimonate opacified glass during the Roman period,
Applied Physics A 100, 683–692.
- S. Lahlil, I. Biron, M. Cotte, J. Susini, N. Menguy,n2010b, Synthesis of calcium
antimonate nano-crystals by the 18th dynasty Egyptian glassmakers, Applied
Physics A 98, 1–8.
- C. Lemke, 1998, Reflections of the Roman empire: the first century glass
industry as seen through tradition of manufacture, in P. McCray, W.D.Kingery
139
(Eds.), The Preihistory and History of Glass and Glassmaking Technology,
Ceramics and Civilisation, vol. VIII, The American Ceramic Society, Columbus,
Ohio, 269-291.
- K.A. Leslie, I.C. Freestone, D. Lowry, M. Thirlwall, 2006, Provenance and
technology of near Eastern glass: oxygen isotopes by laser fluorination as a
compliment to Sr, Archaeometry 48, 253-270.
- C.S. Lightfoot, 1987, A Group of early Roman Mould-Blown Flasks from the
West. Journal of Glass Studies 29: 11–18.
- L. Mandruzzato, A. Marcante, 2005, Vetri Antichi del Museo Archeologico
Nazionale di Aquileia, Il Vasellame da Mensa, Corpus delle collezioni del Vetro
nel Friuli Venezia Giulia, Comitato Nazionale Italiano AIHV.
- L. Mandruzzato, A. Marcante, 2007, Vetri Antichi del Museo Archeologico
Nazionale di Aquileia, Balsamari, olle e pissidi, Corpus delle collezioni del
Vetro nel Friuli Venezia Giulia, Comitato Nazionale Italiano AIHV.
- M. A. Mange, D. T. Wright, 2007, Heavy Minerals in Use, vol. 58, Elsevier
Science.
- Y. A. Marano, 2009, La città Tardoantica, in: F. Ghedini, M. Bueno, M. Novello
(Eds.), Moenibus et portu celeberrima, Aquileia: storia di una città, Istituto
poligrafico e Zecca dello Stato, Roma, 23-33.
- B. Mason, 1979, Cosmochemistry, part I, Meteorites, Chapter B, in M. Fleischer
(Ed.), Data of geochemistry, 6th edition, US Geological Survey Prof. Paper 440-
B-1.
- J. L. Mass, R. E. Stone, M. T. Wypyski, 1998, The mineralogical and
metallurgical origins of Roman opaque colored glasses, in P. McCray, W. D.
Kingery (Eds.), The prehistory and history of glassmaking technology, The
American Ceramics Society, Columbus, Ohio, 251–268.
- J.L. Mass, M.T. Wypyski, R.E. Stone, 2002, Malkata and Lisht glassmaking
technologies: towards a specific link between second millennium BC
metallurgists and glassmakers, Archaeometry 44 (1), 67–82.
- S.M. McLennan , 1989, REE in sedimentary rocks: influence of provenance and
sedimentary processes, in B.R. Lipin, G.A. McKay (Eds.), Geochemistry and
140
Mineralogy of Rare Earth Elements, Reviews in Mineralogy 21. Mineralogical
Society of America, 169-200.
- B. Messiga, M. P. Riccardi, 2001, A petrological approach to the study of
ancient glass, Periodico di Mineralogia 70 (1), 50-70.
- Mirti, P., Casoli, A., and Appolonia, L., 1993, Scientific analysis of Roman
glass from Augusta Praetoria, Archaeometry 35(2), 225–40.
- Mirti, P., Lepora, A., and Saguì, L., 2000, Scientific analysis of seventh-century
glass fragments from the Cripta Balbi in Rome, Archaeometry, 42(2), 359-374.
- P. Mirti, P. Davit, M. Gulmini, 2002, Colourants and opacifiers in seventh and
eighth century glass investigated by spectroscopic techniques, Analytical and
Bioanalytical Chemistry 372, 221–229.
- P. Mirti, M. Pace, M. Negro Ponzi, M. Aceto, 2008, ICP–MS analysis of glass
fragments of Parthian and Sasanian epoch from Seleucia and Veh Ardašīr
(Central Iraq), Archaeometry 50, 429-50.
- P. Mirti, M. Pace, M. Malandrino, M. Negro Ponzi, 2009, Sasanian glass from
Veh Ardašīr: new evidences by ICP-MS analysis, Journal of Archaeological
Science 36, 1061-1069.
- C. Moretti, 2002, Glossario del vetro veneziano, Venezia.
- M. D. Nenna, M. Vichy, M. Picon, 1997, L‟Atelier de verrier de Lyon, du Ier
siècle après J.-C., et l‟origine des verres „„Romains‟‟, Revue d‟Archèomètrie 21,
81-87.
- M. D. Nenna, M. Picon, M. Vichy, 2000, Ateliers primaries et secondaires en
Égypte à l‟époque gréco-romaine, in M. D. Nenna (ed.), La route du verre.
Ateliers primaries et secondaires du second millénaire av. J.-C. au Moyen Âge,
Travaux de la Maison de l‟Orient Mediterranéen no. 33, Lyon, 97–112.
- M. D. Nenna, M. Picon, V. Thirion-Merle, M. Vichy, 2005, Ateliers primarie du
Wadi Natrun: nouvelles decouvertes, Annales du 16e Congres de l‟association
Internationale pour l‟Histoire du Verre, 59-63.
- R.G. Newton, 1985, The durability of glass: a review, Glass Technology 26, 21-
38.
- R. Newton, S. Davison, 1996, Conservation of glass, Butterworth-Heinemann,
Oxford.
141
- A.L. Oppenheim, 1973, Towards a history of glass in the Ancient Near East,
Journal of the American Oriental Society 93, 259-266.
- S. Paynter, 2006, Analyses of colourless Roman glass from Binchester, County
Durham, Journal of Archaeological Science 33, 1037-1057.
- M. Picon, M. Vichy, 2003, D‟Orient en Occident: l‟origine du verre à l‟époque
romaine et durant le haut Moyen Âge, in D. Foy, M.D. Nenna (Eds.), Échanges
et commerce du verre dans le monde antique, Actes du colloque de
l‟Association Francaise pour l‟Archéologie du Verre, Aix-en-Provence et
Marseille, 7-9 juin 2001, éditions Monique Mergoil, Montagnac, 17-31.
- C. Pin, D. Briot, C. Bassin, F. Poitrasson, 1994, Concomitant separation of
strontium and samarium-neodymium for isotopic analysis in silicate samples,
based on specific extraction chromatography, Analytica Chimica Acta, 209-217.
- C. Pin, J.F.S. Zalduegui, 1997, Sequential separation of light rare-earth
elements, thorium and uranium by miniaturized extraction chromatography:
application to isotopic analyses of silicate rocks, Analytica Chimica Acta 339
(1-2), 79-89.
- A.M. Pollard, C. Heron, 1995, Archaeological Chemistry, Royal Society of
Chemistry, 149-195.
- M. Pomerancblum, 1966, The distribution of heavy minerals and their hydraulic
equivalents of the Mediterranean continental shelf of Israel, Journal of
Sedimentary Petrology 36, 162-174.
- J. Price, 1991, Decorated Mould-Blown Glass Tablewares in the First century
AD. In M. Newby & K. Painter (eds.), Roman Glass: Two Centuries of Art and
Invention. pp. 56–75. The Society of Antiquaries of London, London.
- T. Rehren, E.B. Pusch, 2005, Late Bronze Age Egyptian glass production at
Qantir-Piramesses, Science 308, 1756-1760.
- N. Rigoni, 1986, I materiali, in G. Rosada (Ed.), Progetto Rocca: lo scavo 1985,
Quaderni di Archeologia del Veneto, II, Giunta Regionale del Veneto, Venezia,
39-69.
- Rosada, 1989, Asolo. Progetto Rocca: lo scavo 1987-1988, in G. Rosada (Ed.)
Indagini archeologiche ad Asolo, scavi nella Rocca Medievale e nel Teatro
romano, CEDAM, Padova, 66-69.
142
- B. Rütti, 1991, Die römischen Gläser aus Augst und Kaiseraugst, Augst.
- D.C.W. Sanderson, J.R. Hunter, S.E. Warren, 1984, Energy dispersive X-ray
fluorescence analysis of 1st millennium AD glass from Britain, Journal of
Archaeological Science 11(1), 53-69.
- Santagostino Barbone, E. Gliozzo, F. D‟Acapito, I. Memmi Turbanti, M.
Turchiano, G. Volpe, 2008, The Sectilia panels of Faragola (Ascoli Satriano
Southern Italy): a multi-analytical study of the red, orange and yellow glass
slabs, Archaeometry 50, 451–473.
- P. Santropadre, M. Verità, 2000, Analyses of the Production of Italian Vitreous
Materials of the Bronze Age, Journal of Glass Studies 42, 25-40.
- E.V. Sayre, R.V. Smith, 1961, Compositional categories of ancient glass,
Science 133, 1824-1826.
- E. V. Sayre, 1963, The intentional use of antimony and manganese in ancient
glasses, in F. R. Matson, G. Rindone (Eds.), Advances in glass technology, part
2, Plenum Press, New York, 263–82.
- J.W.H. Schreurs, R.H. Brill, 1984, Iron and sulfur related colors in ancient
glasses, Archaeometry 26, 199-209.
- A.J. Shortland, 2002, The use and origin of antimonate colorants in early
Egyptian glass, Archaeometry 44 (4), 517–530.
- A. J. Shortland, 2003, Comments on J.L. Mass, M.T. Wypyski and R.E. Stone
„Malkata and Lisht glassmaking technologies: towards a specific link between
the second millennium BC metallurgists and glassmakers‟, Archaeometry 44
(1), 67–82. Reply (2002) Archaeometry 45(1), 190–191.
- J. Shortland, 2004, Evaporites of the Wadi Natrun: seasonal and annual variation
and its implication for ancient exploitation, Archaeometry 46, 497-516.
- J. Shortland, T. Schachner, I. C. Freestone, M. Tite, 2006, Natron as a flux in the
early vitreous materials industry-sources, beginnings and reasons for decline,
Journal of Archaeological Science 33(4), 521-530.
- A. J. Shortland, N. Rogers , K., Eremin , 2007, Trace element discriminants
between Egyptian and Mesopotamian late Bronze Age glasses, Journal of
Archaeological Science 34, 781-789.
143
- A. Silvestri, G. Molin, G. Salviulo, 2005, Roman and Medieval glass from the
Italian area: bulk characterization and relationships with production
technologies, Archaeometry 47, 797-816.
- A. Silvestri, 2008, The coloured glass of Iulia Felix. Journal of Archaeological
Science 35, 1489-1501.
- Silvestri, G. Molin, G. Salviulo, 2008, The colourless glass of Iulia Felix,
Journal of Archaeological Science 35, 331-341.
- A. Silvestri, A. Longinelli, G. Molin, 2010, δ18O measurements of
archaeological glass (Roman to Modern age) and raw materials: possible
interpretation, Journal of Archaeological Science 37, 549–560.
- A. Silvestri, A. Marcante, 2011, The glass of Nogara (Verona): a “window” on
production technology of mid-Medieval times in Northern Italy, Journal of
Archaeological Science 38 (10), 2509-2522.
- C. Sotinel, 2001, L‟utilisation des ports dans l‟arc Adriatique à l‟Époque
Tardive (IVe-VIe siècles), in Strutture portuali e rotte marittime nell'adriatico di
età romana, École Française de Rome, Trieste-Roma.
- D. J. Stanley, Y. Mart, Y. Nir, 1997, Clay mineral distributions to interpret Nile
cell provenance and dispersal: II. Coastal plain from Nile delta to northern
Israel, Journal of Coastal Research, 13, 506–33.
- J. D. Stanley, M.D. Krom, R.A. Cliff, J.C. Woodward, 2003, Nile flow failure at
the end of the Old Kingdom, Egypt: strontium isotopic evidence,
Geoarchaeology 18, 395-402.
- E.M. Stern, B. Schlick-Nolte, 1994, Early Glass of the Ancient World 1600 BC
– AD 50 Ernesto Wolfe Collection, Verlag Hatje, Ostfildern, Germany.
- M. Sternini, 1995, La fenicie di sabbia. Storia e tecnologia del vetro antico,
Edipuglia, Bari.
- D. Stiaffini, 1991, Contributo ad una prima sistemazione tipologica dei materiali
vitrei medievali, in M. Mendera (Ed.), Archeologia e storia del vetro
preindustriale, Atti del Convegno Internazionale, Colle Val d‟Elsa-Gambassi,
April 2-4 1990, Firenze, 177-266.
144
- D. Stiaffini, 1999, L‟evoluzione morfologica del vasellame vitreo da mensa
durante il Rinascimento. L‟esempio della Toscana, Archeologia Postmedievale
3, 151-186.
- O. Tal, R. E. Jackson-Tal, I. C. Freestone, 2004, New Evidence of the
production of raw glass at Late Byzantine Apollonia-Arsuf (Israel), Journal of
glass studies 46, 51-66.
- M.F. Thirlwall, 1991, Long-term reproducibility of multicollector Sr and Nd
isotope ratio analysis, Chemical Geology 94, 85-104.
- M. S. Tite, A. Shortland, Y. Maniatis, D. Kavoussanaki, S. A. Harris, 2006, The
composition of the soda-rich and mixed alkali plant ashes used in the production
of glass, Journal of Archaeological Science 33(9), 1284-1292.
- M. S. Tite, T. Pradell, A. J. Shortland, 2008, Discovery, production and use of
tin-based opacifiers in glasses, enamels and glazes from the Late Iron Age
onwards: a reassessment, Archaeometry 50, 67-84.
- Toniolo, 2007, Il vetro nell'Alto Adriatico, in D. Ferrari, A.M. Visser Travagli
(Eds.), Atti delle IX Giornate Nazionali di Studio AIHV, Ferrara, 57-70.
- S. Tonietto, 2010, Indagini archeometriche sul mosaico paleocristiano a tessere
vitree del sacello di S. Prosdocimo (Padova). Caratterizzazione chimico-fisica e
cristallografia dei materiali mediante metodiche analitiche micro-e non
distruttive, Università di Padova, unpublished PhD thesis.
- P. Triantafyllidis, 2003, Classical and Hellenistic workshop from Rhodes, in D.
Foy, M.D. Nenna (Eds.), Echanges et commerce du verre dans le monde
antique. Actes du colloque AHIV, Aix-en-Provence et Marseille 2001. Mergoil
Editor, Montagnac, 131-138.
- W. E. S. Turner, 1956, Studies in ancient glasses and glass-making processes.
Part V. Raw materials and melting processes, Journal of the Society of Glass
Technology 40, 276–300.
- M. Uboldi, M. Verità, 2003, Scientific analyses of glasses from late antique and
early medieval archaeological sites in Northern Italy, Journal of Glass Studies
45, 115–37.
- M. Vallotto, M. Verità, 2000, Glasses from Pompeii and Herculaneum and the
sands of the rivers Belus and Volturno, in J Renn, G. Castagnetti (Eds.), Homo
145
faber: studies on nature, technology and science at the time of Pompeii,
presented at a conference at the Deutsches Museum, Munich, 21–22 March
2000, 63–73, „L‟Erma‟ di Bretschneider.
- V. Van Der Linden, P. Cosyns, O. Schalm, S. Cagno, K. Nys, K. Janssens, A.
Nowak, B. Wagner, E. Bulska, 2009, Deeply coloured and black glass in the
northern provinces of the roman Empire: differences and similarities in chemical
composition before and after AD 150, Archaeometry 51 (5), 822–844.
- Van der Werf, A. Mangone, L. Carla Giannossa, A. Traini, R. Laviano, A.
Coralini, L. Sabbatini, 2009, Archaeometric investigation of Roman tesserae
from Herculaneum (Italy) by the combined use of complementary micro-
destructive analytical techniques, Journal of Archaeological Science 36, 2625–
2634.
- M. Verità, 1985, L‟invenzione del cristallo Muranese: una verifica analitica
delle fonti storiche, Rivista della Stazione Sperimentale del Vetro 1, 117–36.
- M. Verità, 2000, Tecniche di fabbricazione dei materiali musivi vitrei, Indagini
chimiche e mineralogiche, in E. Borsook, F. Giuffredi Superbi, G. Pagliarulo
(Eds.), Medieval mosaics, light, color, materials, Silvana Editoriale, Cinisello
Balsamo, 25.34.
- M. Verità, A. Renier, S. Zecchin, 2002, Chemical analyses of ancient glass
findings excavated in the Venetian lagoon, Journal of Cultural Heritage 3, 261–
71.
- M. Verità, S. Zecchin, 2009, Thousand years of Venetian glass: the evolution of
chemical composition from the origins to the 18th century, in K. Janssens, P.
Degryse, P. Cosyns, J. Caen, L. Van‟t Dack (Eds.), Annales du 17e Congrès de
l‟Association Internationale pour l‟Histoire du Verre, Anvers, 602-613.
- E.P. Vicenzi, S. Eggins, A. Logan, R. Wysoczanski, 2002. Microbeam
characterization of Corning archaeological reference glasses: new additions to
the Smithsonian microbeam standard collection, Journal of Research of the
National Institute of Standards and Technology 107, 719-727.
- K. H. Wedepohl, 1971, Geochemistry, New York: Holt Rinehart and Winston.
- K. H. Wedepohl, 1995, The composition of the continental crust, Geochimica et
Cosmochimica Acta 59, 1217–1232.
146
- K. H. Wedepohl, A. Baumann, 2000, The use of marine molluskan shells for
Roman glass and local raw glass production in the Eifel area (Western
Germany), Naturwissenschaften, 87, 129–32.
- K. H. Wedepohl, W. Gaitzsch, A. B. Follmann-Schulz, 2003, Glassmaking and
glassworking in six Roman factories in the Hambach Forest, Germany, Annales
du 15e Congres de l‟Association Internationale de l‟Histoire du Verre AIHV,
53-55.
- K. H. Wedepohl, K. Simon, A. Kronz, 2011, Data on 61 chemical elements for
the characterization of three major glass compositions in Late Antiquity and the
Middle Ages, Archaeometry 53(1), 81–102.
- S. Weldeab, K.C. Emeis, C. Hemleben, W. Siebel, 2002, Provenance of
lithogenic surface sediments and pathways of riverine suspended matter in the
eastern Mediterranean Sea: evidence from 143Nd/144Nd and 87Sr/86Sr ratios,
Chemical Geology 186, 139-149.
- D. Whitehouse, 1988, Glass of the Roman Empire. Corning Museum of Glass,
Corning, NY.
- S. Wolf, C. M. Kessler, W. B. Stern, Y. Gerber, 2005, The composition and
manufacture of early Medieval coloured window glass from Sion (Valais,
Switzerland) – a Roman glass making tradition or innovative craftsmanship?,
Archaeometry 47(2), 361-380.
- C. Zaccaria, S. Pesavento Mattioli, 2009, Uomini e merci, in: F. Ghedini, M.
Bueno, M. Novello (Eds.), Moenibus et portu celeberrima, Aquileia: storia di
una città, Istituto poligrafico e Zecca dello Stato, Roma, 275-287.
- L. Zecchin, 1956, I vetri del Museo di Adria, Venezia.
147
APPENDIX A
In this Appendix the features (colour, type, age, production technique, provenance) of
all the samples analyzed in the present study are reported. In addition, some pictures of
the most representative colours/types are also shown.
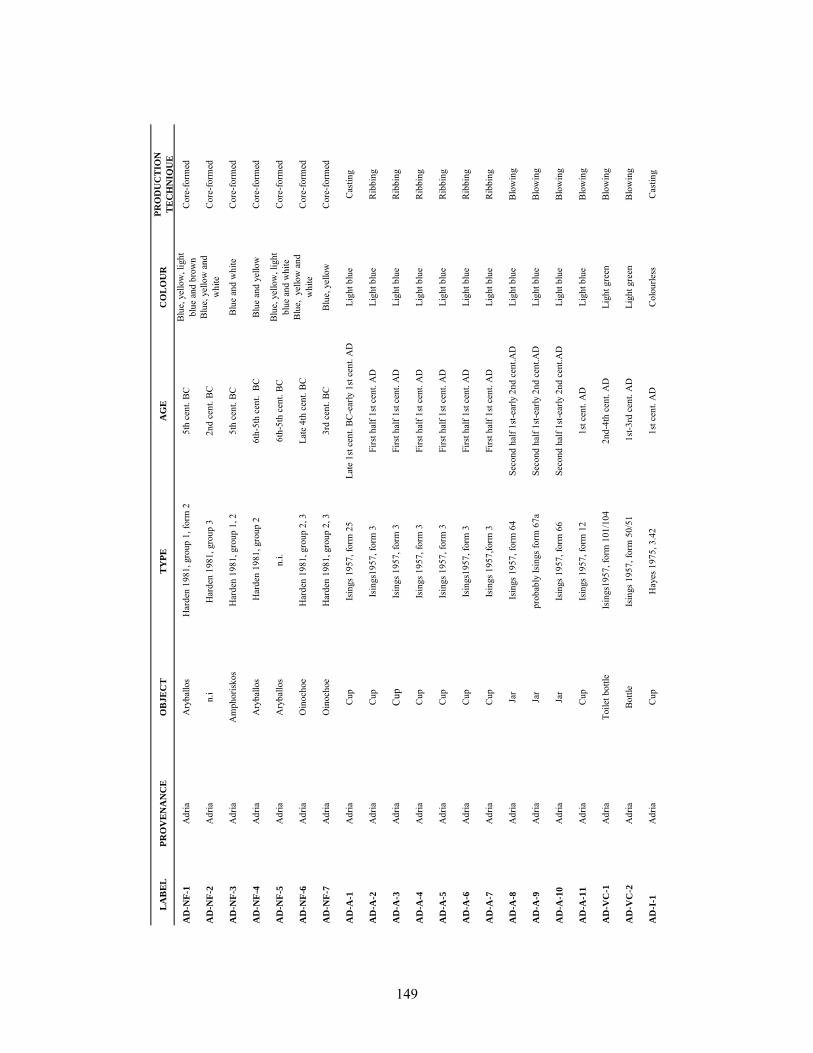
LA
BE
LP
RO
VE
NA
NC
EO
BJ
EC
TT
YP
EA
GE
C
OL
OU
RP
RO
DU
CT
ION
TE
CH
NIQ
UE
AD
-NF
-1A
dria
Ary
ballo
s H
arde
n 19
81, g
roup
1, f
orm
25t
h ce
nt. B
CB
lue,
yel
low
, lig
ht
blue
and
bro
wn
Cor
e-fo
rmed
AD
-NF
-2A
dria
n.i
Har
den
1981
, gro
up 3
2nd
cent
. BC
Blu
e, y
ello
w a
nd
whi
te
Cor
e-fo
rmed
AD
-NF
-3A
dria
Am
phor
isko
s H
arde
n 19
81, g
roup
1, 2
5th
cent
. BC
Blu
e an
d w
hite
C
ore-
form
ed
AD
-NF
-4A
dria
Ary
ballo
s H
arde
n 19
81, g
roup
26t
h-5t
h ce
nt.
BC
Blu
e an
d ye
llow
C
ore-
form
ed
AD
-NF
-5A
dria
Ary
ballo
s n
.i.
6th-
5th
cent
. BC
Blu
e, y
ello
w, l
ight
bl
ue a
nd w
hite
C
ore-
form
ed
AD
-NF
-6A
dria
Oin
ocho
e H
arde
n 19
81, g
roup
2, 3
Late
4th
cen
t. B
CB
lue,
yel
low
and
w
hite
C
ore-
form
ed
AD
-NF
-7A
dria
Oin
ocho
e H
arde
n 19
81, g
roup
2, 3
3rd
cent
. BC
Blu
e, y
ello
w
Cor
e-fo
rmed
AD
-A-1
Adr
iaC
upIs
ings
195
7, fo
rm 2
5La
te 1
st c
ent.
BC
-ear
ly 1
st c
ent.
AD
Ligh
t blu
eC
astin
g
AD
-A-2
Adr
iaC
upIs
ings
1957
, for
m 3
Firs
t hal
f 1st
cen
t. A
DLi
ght b
lue
Rib
bing
AD
-A-3
Adr
iaC
upIs
ings
195
7, fo
rm 3
Firs
t hal
f 1st
cen
t. A
DLi
ght b
lue
Rib
bing
AD
-A-4
Adr
iaC
upIs
ings
195
7, fo
rm 3
Firs
t hal
f 1st
cen
t. A
DLi
ght b
lue
Rib
bing
AD
-A-5
Adr
iaC
upIs
ings
195
7, fo
rm 3
Firs
t hal
f 1st
cen
t. A
DLi
ght b
lue
Rib
bing
AD
-A-6
Adr
iaC
upIs
ings
1957
, for
m 3
Firs
t hal
f 1st
cen
t. A
DLi
ght b
lue
Rib
bing
AD
-A-7
Adr
iaC
upIs
ings
195
7,fo
rm 3
Firs
t hal
f 1st
cen
t. A
DLi
ght b
lue
Rib
bing
AD
-A-8
Adr
iaJa
r Is
ings
195
7, fo
rm 6
4Se
cond
hal
f 1st
-ear
ly 2
nd c
ent.A
DLi
ght b
lue
Blo
win
g
AD
-A-9
Adr
iaJa
rpr
obab
ly Is
ings
form
67a
Seco
nd h
alf 1
st-e
arly
2nd
cen
t.AD
Ligh
t blu
eB
low
ing
AD
-A-1
0A
dria
Jar
Isin
gs 1
957,
form
66
Seco
nd h
alf 1
st-e
arly
2nd
cen
t.AD
Ligh
t blu
eB
low
ing
AD
-A-1
1A
dria
Cup
Isin
gs 1
957,
form
12
1st c
ent.
AD
Ligh
t blu
eB
low
ing
AD
-VC
-1A
dria
To
ilet b
ottle
Isin
gs19
57, f
orm
101
/104
2nd-
4th
cent
. AD
Ligh
t gre
enB
low
ing
AD
-VC
-2A
dria
B
ottle
Isin
gs 1
957,
form
50/
51 1
st-3
rd c
ent.
AD
Ligh
t gre
enB
low
ing
AD
-I-1
Adr
iaC
upH
ayes
197
5, 3
.42
1st c
ent.
AD
Col
ourle
ssC
astin
g
149
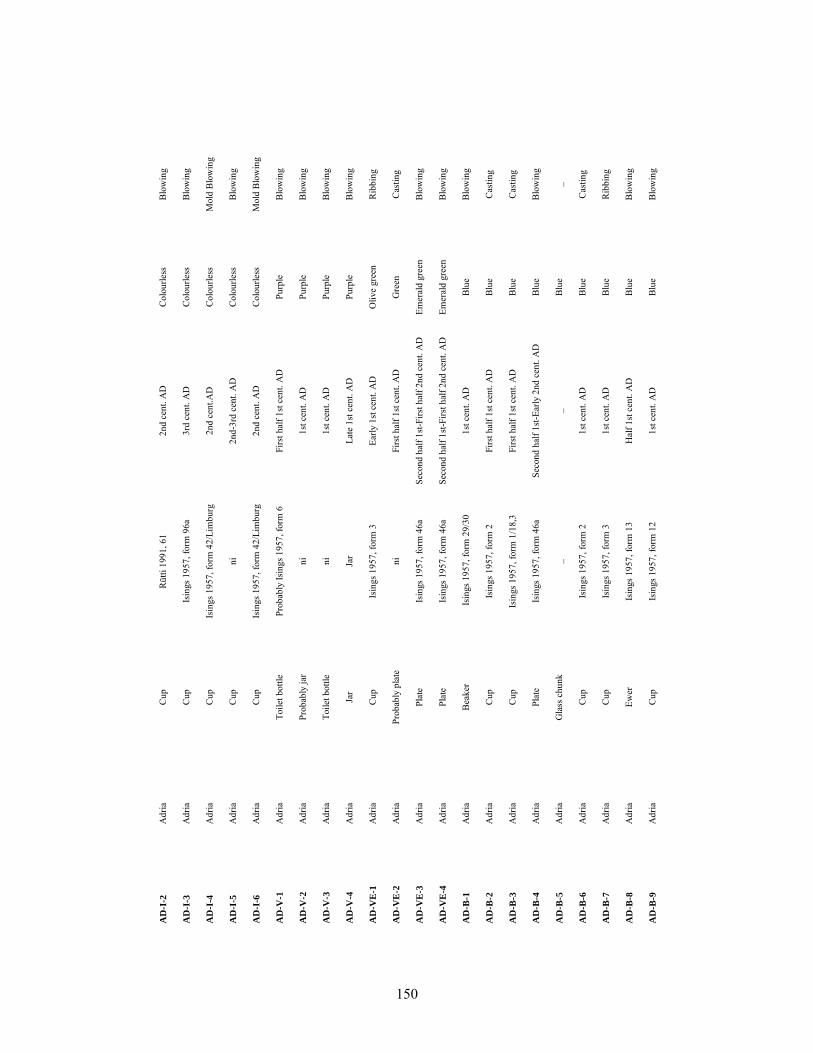
AD
-I-2
Adr
iaC
upR
ütti
1991
, 61
2nd
cent
. AD
Col
ourle
ssB
low
ing
AD
-I-3
Adr
iaC
upIs
ings
195
7, fo
rm 9
6a3r
d ce
nt. A
DC
olou
rless
Blo
win
g
AD
-I-4
Adr
iaC
upIs
ings
195
7, fo
rm 4
2/Li
mbu
rg
2nd
cent
.AD
Col
ourle
ssM
old
Blo
win
g
AD
-I-5
Adr
iaC
upni
2nd-
3rd
cent
. AD
Col
ourle
ssB
low
ing
AD
-I-6
Adr
iaC
upIs
ings
195
7, fo
rm 4
2/Li
mbu
rg2n
d ce
nt. A
DC
olou
rless
Mol
d B
low
ing
AD
-V-1
Adr
iaTo
ilet b
ottle
Prob
ably
Isin
gs 1
957,
form
6Fi
rst h
alf 1
st c
ent.
AD
Purp
leB
low
ing
AD
-V-2
Adr
iaPr
obab
ly ja
rni
1st c
ent.
AD
Purp
leB
low
ing
AD
-V-3
Adr
iaTo
ilet b
ottle
ni1s
t cen
t. A
DPu
rple
Blo
win
g
AD
-V-4
Adr
iaJa
rJa
rLa
te 1
st c
ent.
AD
Purp
leB
low
ing
AD
-VE
-1A
dria
Cup
Isin
gs 1
957,
form
3Ea
rly 1
st c
ent.
AD
Oliv
e gr
een
Rib
bing
AD
-VE
-2A
dria
Prob
ably
pla
teni
Firs
t hal
f 1st
cen
t. A
DG
reen
Cas
ting
AD
-VE
-3A
dria
Plat
eIs
ings
195
7, fo
rm 4
6aSe
cond
hal
f 1st
-Firs
t hal
f 2nd
cen
t. A
DEm
eral
d gr
een
Blo
win
g
AD
-VE
-4A
dria
Plat
eIs
ings
195
7, fo
rm 4
6aSe
cond
hal
f 1st
-Firs
t hal
f 2nd
cen
t. A
DEm
eral
d gr
een
Blo
win
g
AD
-B-1
Adr
ia
Bea
ker
Isin
gs 1
957,
form
29/
301s
t cen
t. A
DB
lue
Blo
win
g
AD
-B-2
Adr
iaC
upIs
ings
195
7, fo
rm 2
Firs
t hal
f 1st
cen
t. A
DB
lue
Cas
ting
AD
-B-3
Adr
iaC
upIs
ings
195
7, fo
rm 1
/18,
3Fi
rst h
alf 1
st c
ent.
AD
Blu
eC
astin
g
AD
-B-4
Adr
iaPl
ate
Isin
gs 1
957,
form
46a
Seco
nd h
alf 1
st-E
arly
2nd
cen
t. A
DB
lue
Blo
win
g
AD
-B-5
Adr
iaG
lass
chu
nk_
_B
lue
_
AD
-B-6
Adr
iaC
upIs
ings
195
7, fo
rm 2
1st c
ent.
AD
Blu
eC
astin
g
AD
-B-7
Adr
iaC
upIs
ings
195
7, fo
rm 3
1st c
ent.
AD
Blu
eR
ibbi
ng
AD
-B-8
Adr
iaEw
erIs
ings
195
7, fo
rm 1
3H
alf 1
st c
ent.
AD
Blu
eB
low
ing
AD
-B-9
Adr
iaC
upIs
ings
195
7, fo
rm 1
21s
t cen
t. A
DB
lue
Blo
win
g
150
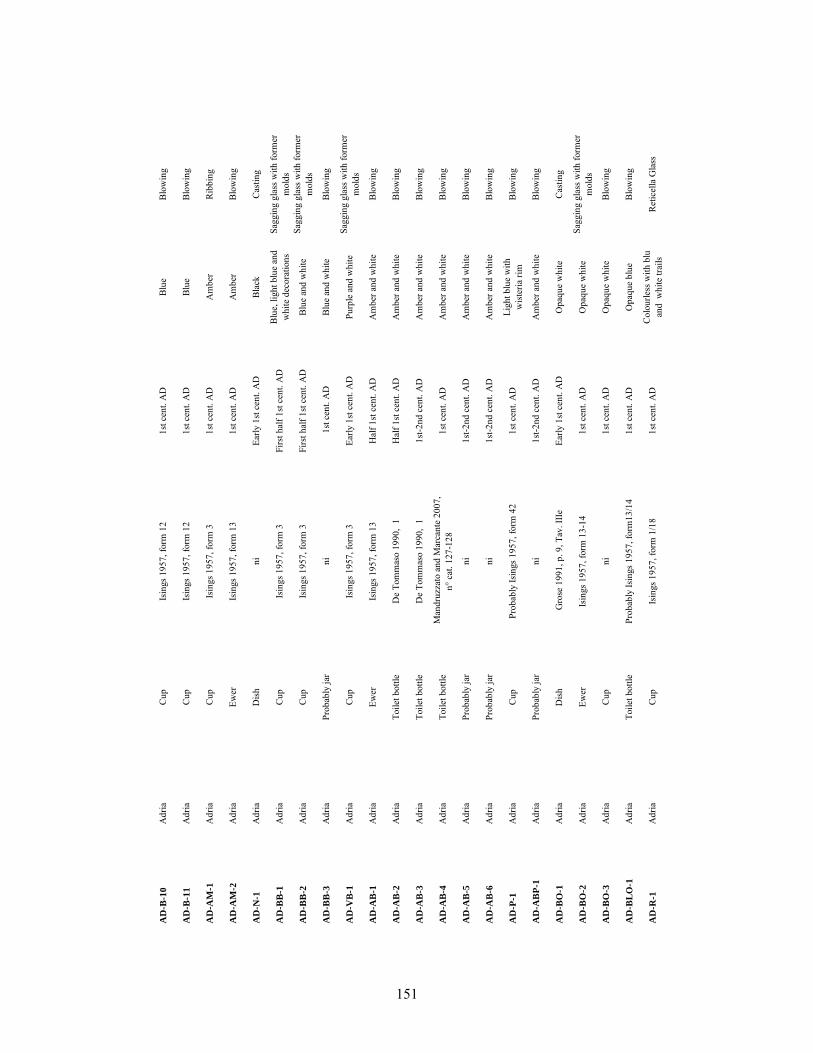
AD
-B-1
0A
dria
Cup
Isin
gs 1
957,
form
12
1st c
ent.
AD
Blu
eB
low
ing
AD
-B-1
1A
dria
Cup
Isin
gs 1
957,
form
12
1st c
ent.
AD
Blu
eB
low
ing
AD
-AM
-1A
dria
Cup
Isin
gs 1
957,
form
31s
t cen
t. A
DA
mbe
rR
ibbi
ng
AD
-AM
-2A
dria
Ewer
Isin
gs 1
957,
form
13
1st c
ent.
AD
Am
ber
Blo
win
g
AD
-N-1
Adr
iaD
ish
niEa
rly 1
st c
ent.
AD
Bla
ckC
astin
g
AD
-BB
-1A
dria
Cup
Isin
gs 1
957,
form
3Fi
rst h
alf 1
st c
ent.
AD
Blu
e, li
ght b
lue
and
whi
te d
ecor
atio
nsSa
ggin
g gl
ass w
ith fo
rmer
m
olds
AD
-BB
-2A
dria
Cup
Isin
gs 1
957,
form
3Fi
rst h
alf 1
st c
ent.
AD
Blu
e an
d w
hite
Sa
ggin
g gl
ass w
ith fo
rmer
m
olds
AD
-BB
-3A
dria
Prob
ably
jar
ni 1
st c
ent.
AD
Blu
e an
d w
hite
B
low
ing
AD
-VB
-1A
dria
Cup
Isin
gs 1
957,
form
3Ea
rly 1
st c
ent.
AD
Purp
le a
nd w
hite
Sa
ggin
g gl
ass w
ith fo
rmer
m
olds
AD
-AB
-1A
dria
Ewer
Isin
gs 1
957,
form
13
Hal
f 1st
cen
t. A
DA
mbe
r and
whi
te
Blo
win
g
AD
-AB
-2
Adr
iaTo
ilet b
ottle
De
Tom
mas
o 19
90,
1H
alf 1
st c
ent.
AD
Am
ber a
nd w
hite
B
low
ing
AD
-AB
-3
Adr
iaTo
ilet b
ottle
De
Tom
mas
o 19
90,
11s
t-2nd
cen
t. A
DA
mbe
r and
whi
te
Blo
win
g
AD
-AB
-4
Adr
iaTo
ilet b
ottle
Man
druz
zato
and
Mar
cant
e 20
07,
n° c
at. 1
27-1
281s
t cen
t. A
DA
mbe
r and
whi
te
Blo
win
g
AD
-AB
-5A
dria
Prob
ably
jar
ni1s
t-2nd
cen
t. A
DA
mbe
r and
whi
te
Blo
win
g
AD
-AB
-6A
dria
Prob
ably
jar
ni1s
t-2nd
cen
t. A
DA
mbe
r and
whi
te
Blo
win
g
AD
-P-1
Adr
iaC
upPr
obab
ly Is
ings
195
7, fo
rm 4
21s
t cen
t. A
DLi
ght b
lue
with
w
iste
ria ri
mB
low
ing
AD
-AB
P-1
Adr
iaPr
obab
ly ja
rni
1st-2
nd c
ent.
AD
Am
ber a
nd w
hite
B
low
ing
AD
-BO
-1A
dria
Dis
h G
rose
199
1, p
. 9, T
av. I
IIeEa
rly 1
st c
ent.
AD
Opa
que
whi
teC
astin
g
AD
-BO
-2A
dria
Ewer
Isin
gs 1
957,
form
13-
141s
t cen
t. A
DO
paqu
e w
hite
Sagg
ing
glas
s with
form
er
mol
ds
AD
-BO
-3A
dria
Cup
ni1s
t cen
t. A
DO
paqu
e w
hite
Blo
win
g
AD
-BL
O-1
A
dria
Toile
t bot
tlePr
obab
ly Is
ings
195
7, fo
rm13
/14
1st c
ent.
AD
Opa
que
blue
Blo
win
g
AD
-R-1
Adr
iaC
upIs
ings
195
7, fo
rm 1
/18
1st c
ent.
AD
Col
ourle
ss w
ith b
lu
and
whi
te tr
ails
Ret
icel
la G
lass
151
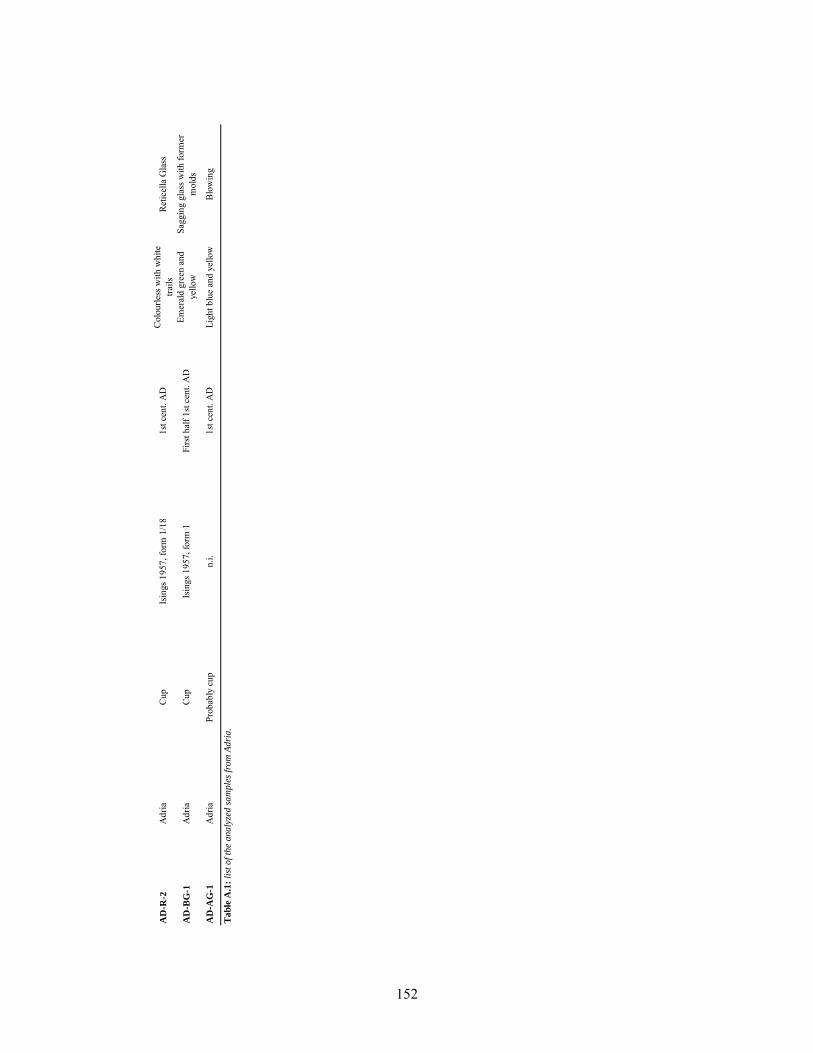
AD
-R-2
Adr
iaC
upIs
ings
195
7, fo
rm 1
/18
1st c
ent.
AD
Col
ourle
ss w
ith w
hite
tra
ilsR
etic
ella
Gla
ss
AD
-BG
-1A
dria
Cup
Isin
gs 1
957,
form
1Fi
rst h
alf 1
st c
ent.
AD
Emer
ald
gree
n an
d ye
llow
Sa
ggin
g gl
ass w
ith fo
rmer
m
olds
AD
-AG
-1A
dria
Prob
ably
cup
n.i.
1st c
ent.
AD
Ligh
t blu
e an
d ye
llow
B
low
ing
Ta
ble
A.1
: li
st o
f th
e a
na
lyze
d s
am
ple
s fr
om
Ad
ria
.
152
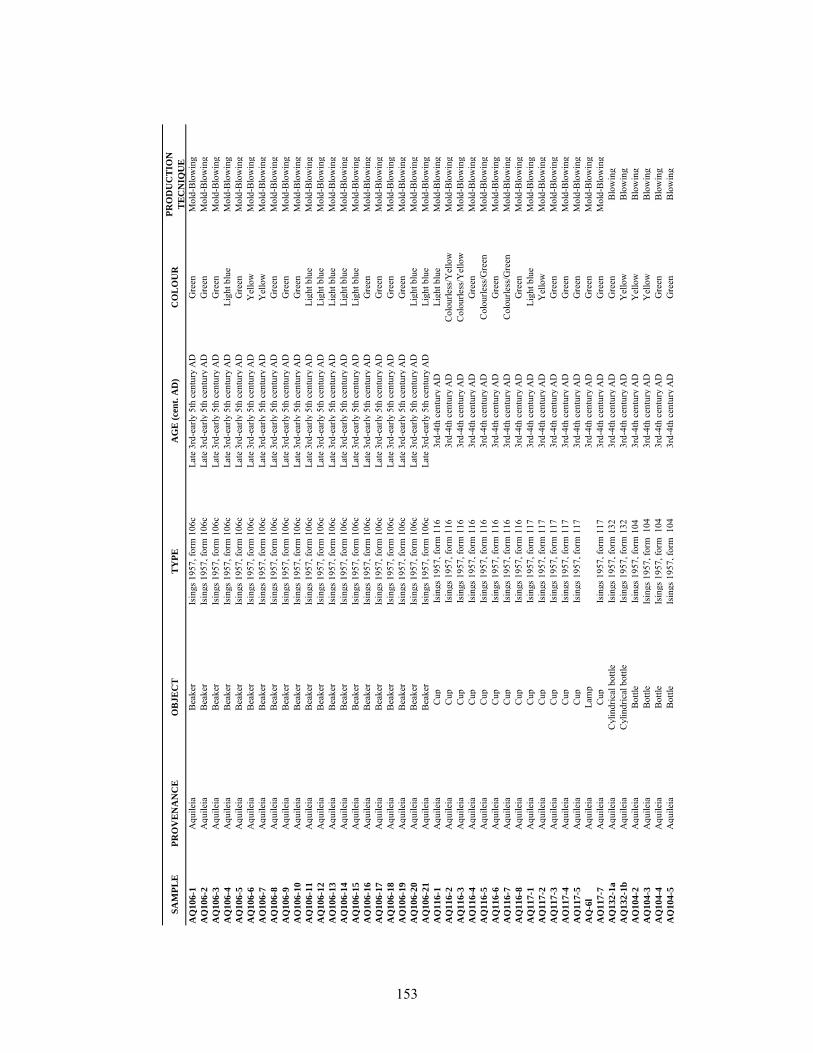
SA
MP
LE
PR
OV
EN
AN
CE
OB
JE
CT
TY
PE
AG
E (
cen
t. A
D)
CO
LO
UR
PR
OD
UC
TIO
N
TE
CN
IQU
E
AQ
10
6-1
Aqu
ileia
Bea
ker
Isin
gs 1
957,
form
106
cLa
te 3
rd-e
arly
5th
cen
tury
AD
Gre
enM
old-
Blo
win
gA
Q1
06
-2A
quile
iaB
eake
rIs
ings
195
7, fo
rm 1
06c
Late
3rd
-ear
ly 5
th c
entu
ry A
DG
reen
Mol
d-B
low
ing
AQ
10
6-3
Aqu
ileia
Bea
ker
Isin
gs 1
957,
form
106
cLa
te 3
rd-e
arly
5th
cen
tury
AD
Gre
enM
old-
Blo
win
gA
Q1
06
-4A
quile
iaB
eake
rIs
ings
195
7, fo
rm 1
06c
Late
3rd
-ear
ly 5
th c
entu
ry A
DLi
ght b
lue
Mol
d-B
low
ing
AQ
10
6-5
Aqu
ileia
Bea
ker
Isin
gs 1
957,
form
106
cLa
te 3
rd-e
arly
5th
cen
tury
AD
Gre
enM
old-
Blo
win
gA
Q1
06
-6A
quile
iaB
eake
rIs
ings
195
7, fo
rm 1
06c
Late
3rd
-ear
ly 5
th c
entu
ry A
DY
ello
wM
old-
Blo
win
gA
Q1
06
-7A
quile
iaB
eake
rIs
ings
195
7, fo
rm 1
06c
Late
3rd
-ear
ly 5
th c
entu
ry A
DY
ello
wM
old-
Blo
win
gA
Q1
06
-8A
quile
iaB
eake
rIs
ings
195
7, fo
rm 1
06c
Late
3rd
-ear
ly 5
th c
entu
ry A
DG
reen
Mol
d-B
low
ing
AQ
10
6-9
Aqu
ileia
Bea
ker
Isin
gs 1
957,
form
106
cLa
te 3
rd-e
arly
5th
cen
tury
AD
Gre
enM
old-
Blo
win
gA
Q1
06
-10
Aqu
ileia
Bea
ker
Isin
gs 1
957,
form
106
cLa
te 3
rd-e
arly
5th
cen
tury
AD
Gre
enM
old-
Blo
win
gA
Q1
06
-11
Aqu
ileia
Bea
ker
Isin
gs 1
957,
form
106
cLa
te 3
rd-e
arly
5th
cen
tury
AD
Ligh
t blu
eM
old-
Blo
win
gA
Q1
06
-12
Aqu
ileia
Bea
ker
Isin
gs 1
957,
form
106
cLa
te 3
rd-e
arly
5th
cen
tury
AD
Ligh
t blu
eM
old-
Blo
win
gA
Q1
06
-13
Aqu
ileia
Bea
ker
Isin
gs 1
957,
form
106
cLa
te 3
rd-e
arly
5th
cen
tury
AD
Ligh
t blu
eM
old-
Blo
win
gA
Q1
06
-14
Aqu
ileia
Bea
ker
Isin
gs 1
957,
form
106
cLa
te 3
rd-e
arly
5th
cen
tury
AD
Ligh
t blu
eM
old-
Blo
win
gA
Q1
06
-15
Aqu
ileia
Bea
ker
Isin
gs 1
957,
form
106
cLa
te 3
rd-e
arly
5th
cen
tury
AD
Ligh
t blu
eM
old-
Blo
win
gA
Q1
06
-16
Aqu
ileia
Bea
ker
Isin
gs 1
957,
form
106
cLa
te 3
rd-e
arly
5th
cen
tury
AD
Gre
enM
old-
Blo
win
gA
Q1
06
-17
Aqu
ileia
Bea
ker
Isin
gs 1
957,
form
106
cLa
te 3
rd-e
arly
5th
cen
tury
AD
Gre
enM
old-
Blo
win
gA
Q1
06
-18
Aqu
ileia
Bea
ker
Isin
gs 1
957,
form
106
cLa
te 3
rd-e
arly
5th
cen
tury
AD
Gre
enM
old-
Blo
win
gA
Q1
06
-19
Aqu
ileia
Bea
ker
Isin
gs 1
957,
form
106
cLa
te 3
rd-e
arly
5th
cen
tury
AD
Gre
enM
old-
Blo
win
gA
Q1
06
-20
Aqu
ileia
Bea
ker
Isin
gs 1
957,
form
106
cLa
te 3
rd-e
arly
5th
cen
tury
AD
Ligh
t blu
eM
old-
Blo
win
gA
Q1
06
-21
A
quile
iaB
eake
rIs
ings
195
7, fo
rm 1
06c
Late
3rd
-ear
ly 5
th c
entu
ry A
DLi
ght b
lue
Mol
d-B
low
ing
AQ
11
6-1
Aqu
ileia
Cup
Isin
gs 1
957,
form
116
3rd-
4th
cent
ury
AD
Ligh
t blu
eM
old-
Blo
win
gA
Q1
16
-2A
quile
iaC
upIs
ings
195
7, fo
rm 1
163r
d-4t
h ce
ntur
y A
DC
olou
rless
/Yel
low
Mol
d-B
low
ing
AQ
11
6-3
Aqu
ileia
Cup
Isin
gs 1
957,
form
116
3rd-
4th
cent
ury
AD
Col
ourle
ss/Y
ello
wM
old-
Blo
win
gA
Q1
16
-4A
quile
iaC
upIs
ings
195
7, fo
rm 1
163r
d-4t
h ce
ntur
y A
DG
reen
Mol
d-B
low
ing
AQ
11
6-5
Aqu
ileia
Cup
Isin
gs 1
957,
form
116
3rd-
4th
cent
ury
AD
Col
ourle
ss/G
reen
Mol
d-B
low
ing
AQ
11
6-6
Aqu
ileia
Cup
Isin
gs 1
957,
form
116
3rd-
4th
cent
ury
AD
Gre
enM
old-
Blo
win
gA
Q1
16
-7A
quile
iaC
upIs
ings
195
7, fo
rm 1
163r
d-4t
h ce
ntur
y A
DC
olou
rless
/Gre
enM
old-
Blo
win
gA
Q1
16
-8A
quile
iaC
upIs
ings
195
7, fo
rm 1
163r
d-4t
h ce
ntur
y A
DG
reen
Mol
d-B
low
ing
AQ
11
7-1
Aqu
ileia
Cup
Isin
gs 1
957,
form
117
3rd-
4th
cent
ury
AD
Ligh
t blu
eM
old-
Blo
win
gA
Q1
17
-2A
quile
iaC
upIs
ings
195
7, fo
rm 1
173r
d-4t
h ce
ntur
y A
DY
ello
wM
old-
Blo
win
gA
Q1
17
-3A
quile
iaC
upIs
ings
195
7, fo
rm 1
173r
d-4t
h ce
ntur
y A
DG
reen
Mol
d-B
low
ing
AQ
11
7-4
Aqu
ileia
Cup
Isin
gs 1
957,
form
117
3rd-
4th
cent
ury
AD
Gre
enM
old-
Blo
win
gA
Q1
17
-5A
quile
iaC
upIs
ings
195
7, fo
rm 1
173r
d-4t
h ce
ntur
y A
DG
reen
Mol
d-B
low
ing
AQ
-6l
Aqu
ileia
Lam
p_
3rd-
4th
cent
ury
AD
Gre
enM
old-
Blo
win
gA
Q1
17
-7A
quile
iaC
upIs
ings
195
7, fo
rm 1
173r
d-4t
h ce
ntur
y A
DG
reen
Mol
d-B
low
ing
AQ
13
2-1
aA
quile
iaC
ylin
dric
al b
ottle
Isin
gs 1
957,
form
132
3rd-
4th
cent
ury
AD
Gre
enB
low
ing
AQ
13
2-1
bA
quile
iaC
ylin
dric
al b
ottle
Isin
gs 1
957,
form
132
3rd-
4th
cent
ury
AD
Yel
low
Blo
win
gA
Q1
04
-2A
quile
iaB
ottle
Isin
gs 1
957,
form
104
3rd-
4th
cent
ury
AD
Yel
low
Blo
win
gA
Q1
04
-3A
quile
iaB
ottle
Isin
gs 1
957,
form
104
3rd-
4th
cent
ury
AD
Yel
low
Blo
win
gA
Q1
04
-4A
quile
iaB
ottle
Isin
gs 1
957,
form
104
3rd-
4th
cent
ury
AD
Gre
enB
low
ing
AQ
10
4-5
Aqu
ileia
Bot
tleIs
ings
195
7, fo
rm 1
043r
d-4t
h ce
ntur
y A
DG
reen
Blo
win
g
153
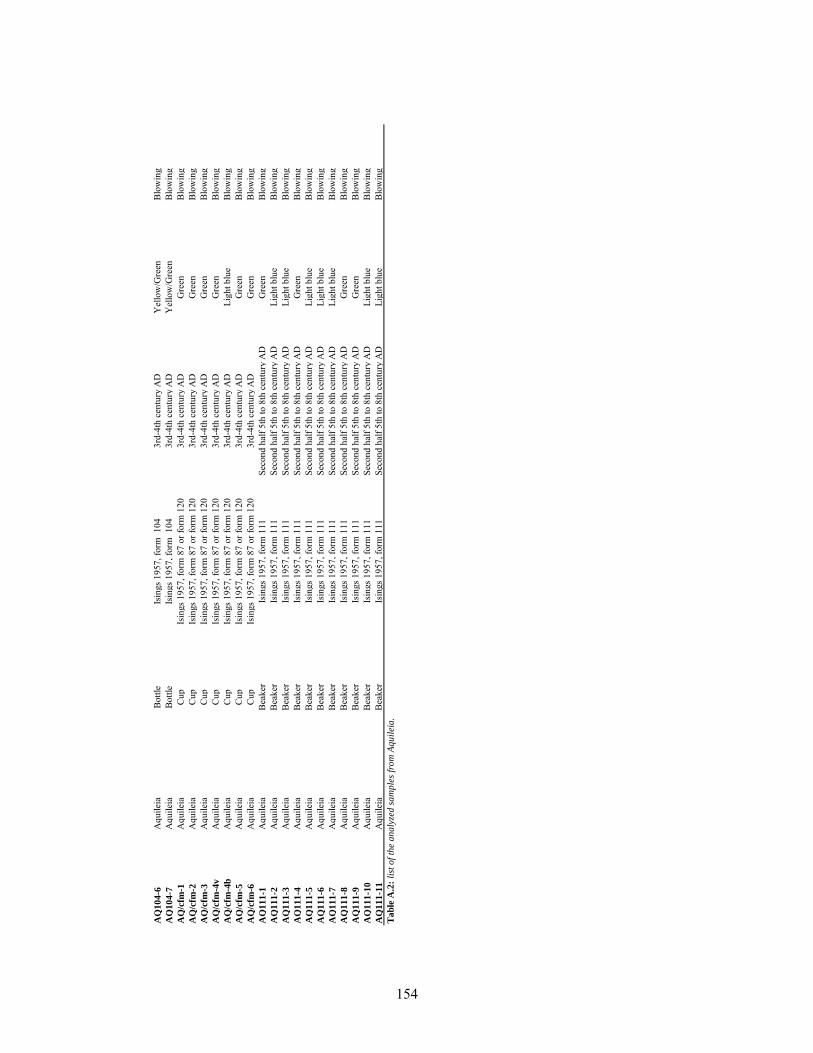
AQ
10
4-6
Aqu
ileia
Bot
tleIs
ings
195
7, fo
rm 1
043r
d-4t
h ce
ntur
y A
DY
ello
w/G
reen
Blo
win
gA
Q1
04
-7A
quile
iaB
ottle
Isin
gs 1
957,
form
104
3rd-
4th
cent
ury
AD
Yel
low
/Gre
enB
low
ing
AQ
/cfm
-1A
quile
iaC
up
Isin
gs 1
957,
form
87
or fo
rm 1
203r
d-4t
h ce
ntur
y A
DG
reen
Blo
win
gA
Q/c
fm-2
Aqu
ileia
Cup
Is
ings
195
7, fo
rm 8
7 or
form
120
3rd-
4th
cent
ury
AD
Gre
enB
low
ing
AQ
/cfm
-3A
quile
iaC
up
Isin
gs 1
957,
form
87
or fo
rm 1
203r
d-4t
h ce
ntur
y A
DG
reen
Blo
win
gA
Q/c
fm-4
vA
quile
iaC
up
Isin
gs 1
957,
form
87
or fo
rm 1
203r
d-4t
h ce
ntur
y A
DG
reen
Blo
win
gA
Q/c
fm-4
bA
quile
iaC
up
Isin
gs 1
957,
form
87
or fo
rm 1
203r
d-4t
h ce
ntur
y A
DLi
ght b
lue
Blo
win
gA
Q/c
fm-5
Aqu
ileia
Cup
Is
ings
195
7, fo
rm 8
7 or
form
120
3rd-
4th
cent
ury
AD
Gre
enB
low
ing
AQ
/cfm
-6A
quile
iaC
up
Isin
gs 1
957,
form
87
or fo
rm 1
203r
d-4t
h ce
ntur
y A
DG
reen
Blo
win
gA
Q1
11
-1A
quile
iaB
eake
rIs
ings
195
7, fo
rm 1
11Se
cond
hal
f 5th
to 8
th c
entu
ry A
DG
reen
Blo
win
gA
Q1
11
-2A
quile
iaB
eake
rIs
ings
195
7, fo
rm 1
11Se
cond
hal
f 5th
to 8
th c
entu
ry A
DLi
ght b
lue
Blo
win
gA
Q1
11
-3A
quile
iaB
eake
rIs
ings
195
7, fo
rm 1
11Se
cond
hal
f 5th
to 8
th c
entu
ry A
DLi
ght b
lue
Blo
win
gA
Q1
11
-4A
quile
iaB
eake
rIs
ings
195
7, fo
rm 1
11Se
cond
hal
f 5th
to 8
th c
entu
ry A
DG
reen
Blo
win
gA
Q1
11
-5A
quile
iaB
eake
rIs
ings
195
7, fo
rm 1
11Se
cond
hal
f 5th
to 8
th c
entu
ry A
DLi
ght b
lue
Blo
win
gA
Q1
11
-6A
quile
iaB
eake
rIs
ings
195
7, fo
rm 1
11Se
cond
hal
f 5th
to 8
th c
entu
ry A
DLi
ght b
lue
Blo
win
gA
Q1
11
-7A
quile
iaB
eake
rIs
ings
195
7, fo
rm 1
11Se
cond
hal
f 5th
to 8
th c
entu
ry A
DLi
ght b
lue
Blo
win
gA
Q1
11
-8A
quile
iaB
eake
rIs
ings
195
7, fo
rm 1
11Se
cond
hal
f 5th
to 8
th c
entu
ry A
DG
reen
Blo
win
gA
Q1
11
-9A
quile
iaB
eake
rIs
ings
195
7, fo
rm 1
11Se
cond
hal
f 5th
to 8
th c
entu
ry A
DG
reen
Blo
win
gA
Q1
11
-10
Aqu
ileia
Bea
ker
Isin
gs 1
957,
form
111
Seco
nd h
alf 5
th to
8th
cen
tury
AD
Ligh
t blu
eB
low
ing
AQ
11
1-1
1A
quile
iaB
eake
rIs
ings
195
7, fo
rm 1
11Se
cond
hal
f 5th
to 8
th c
entu
ry A
DLi
ght b
lue
Blo
win
gT
ab
le A
.2:
list
of
the
an
aly
zed
sa
mp
les
fro
m A
qu
ilei
a.
154
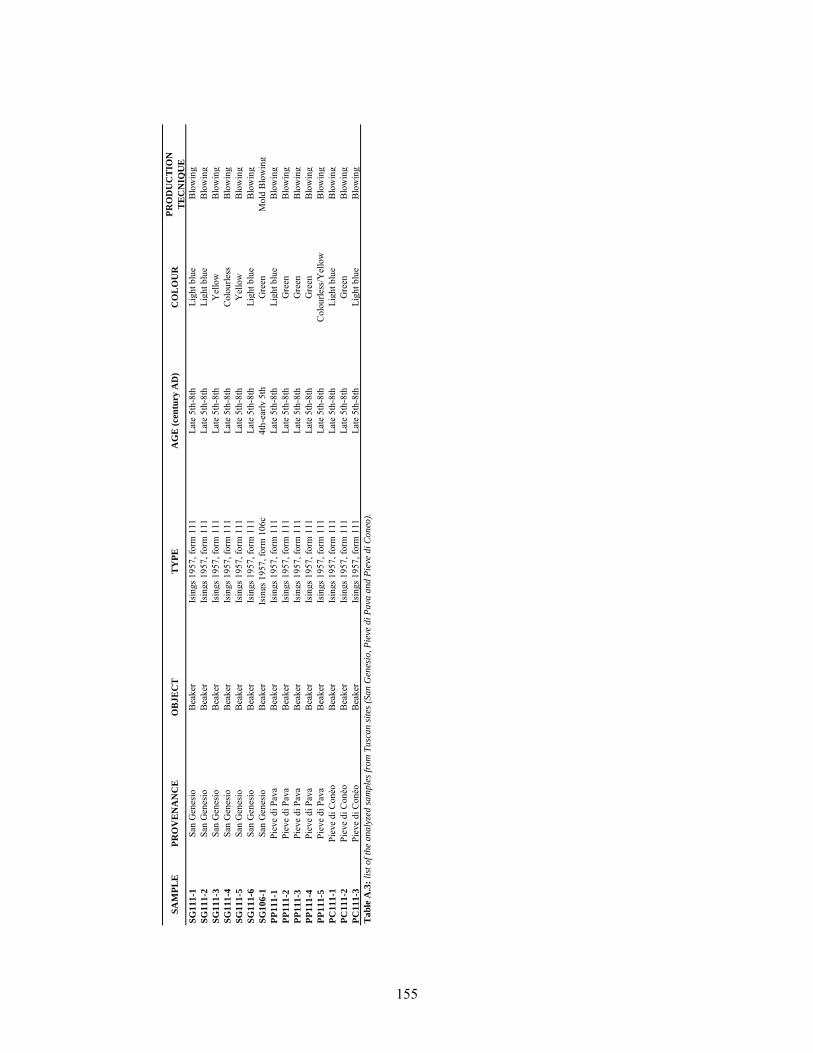
SA
MP
LE
PR
OV
EN
AN
CE
OB
JE
CT
TY
PE
AG
E (
cen
tury
AD
)C
OL
OU
RP
RO
DU
CT
ION
TE
CN
IQU
E
SG
11
1-1
San
Gen
esio
Bea
ker
Isin
gs 1
957,
form
111
Late
5th
-8th
Li
ght b
lue
Blo
win
gS
G1
11
-2Sa
n G
enes
ioB
eake
rIs
ings
195
7, fo
rm 1
11La
te 5
th-8
th
Ligh
t blu
e B
low
ing
SG
11
1-3
San
Gen
esio
Bea
ker
Isin
gs 1
957,
form
111
Late
5th
-8th
Y
ello
w B
low
ing
SG
11
1-4
San
Gen
esio
Bea
ker
Isin
gs 1
957,
form
111
Late
5th
-8th
C
olou
rless
Blo
win
gS
G1
11
-5Sa
n G
enes
ioB
eake
rIs
ings
195
7, fo
rm 1
11La
te 5
th-8
th
Yel
low
Blo
win
gS
G1
11
-6Sa
n G
enes
ioB
eake
rIs
ings
195
7, fo
rm 1
11La
te 5
th-8
th
Ligh
t blu
e B
low
ing
SG
10
6-1
San
Gen
esio
Bea
ker
Isin
gs 1
957,
form
106
c4t
h-ea
rly 5
th
Gre
enM
old
Blo
win
gP
P1
11
-1Pi
eve
di P
ava
Bea
ker
Isin
gs 1
957,
form
111
Late
5th
-8th
Li
ght b
lue
Blo
win
gP
P1
11
-2Pi
eve
di P
ava
Bea
ker
Isin
gs 1
957,
form
111
Late
5th
-8th
G
reen
Blo
win
gP
P1
11
-3Pi
eve
di P
ava
Bea
ker
Isin
gs 1
957,
form
111
Late
5th
-8th
G
reen
Blo
win
gP
P1
11
-4Pi
eve
di P
ava
Bea
ker
Isin
gs 1
957,
form
111
Late
5th
-8th
G
reen
Blo
win
gP
P1
11
-5Pi
eve
di P
ava
Bea
ker
Isin
gs 1
957,
form
111
Late
5th
-8th
C
olou
rless
/Yel
low
Blo
win
gP
C1
11
-1Pi
eve
di C
onèo
Bea
ker
Isin
gs 1
957,
form
111
Late
5th
-8th
Li
ght b
lue
Blo
win
gP
C1
11
-2Pi
eve
di C
onèo
Bea
ker
Isin
gs 1
957,
form
111
Late
5th
-8th
G
reen
Blo
win
gP
C1
11
-3Pi
eve
di C
onèo
Bea
ker
Isin
gs 1
957,
form
111
Late
5th
-8th
Li
ght b
lue
Blo
win
gT
ab
le A
.3:
list
of
the
an
aly
zed
sa
mp
les
fro
m T
usc
an
sit
es (
Sa
n G
enes
io,
Pie
ve d
i P
ava
an
d P
ieve
di
Co
neo
).
155
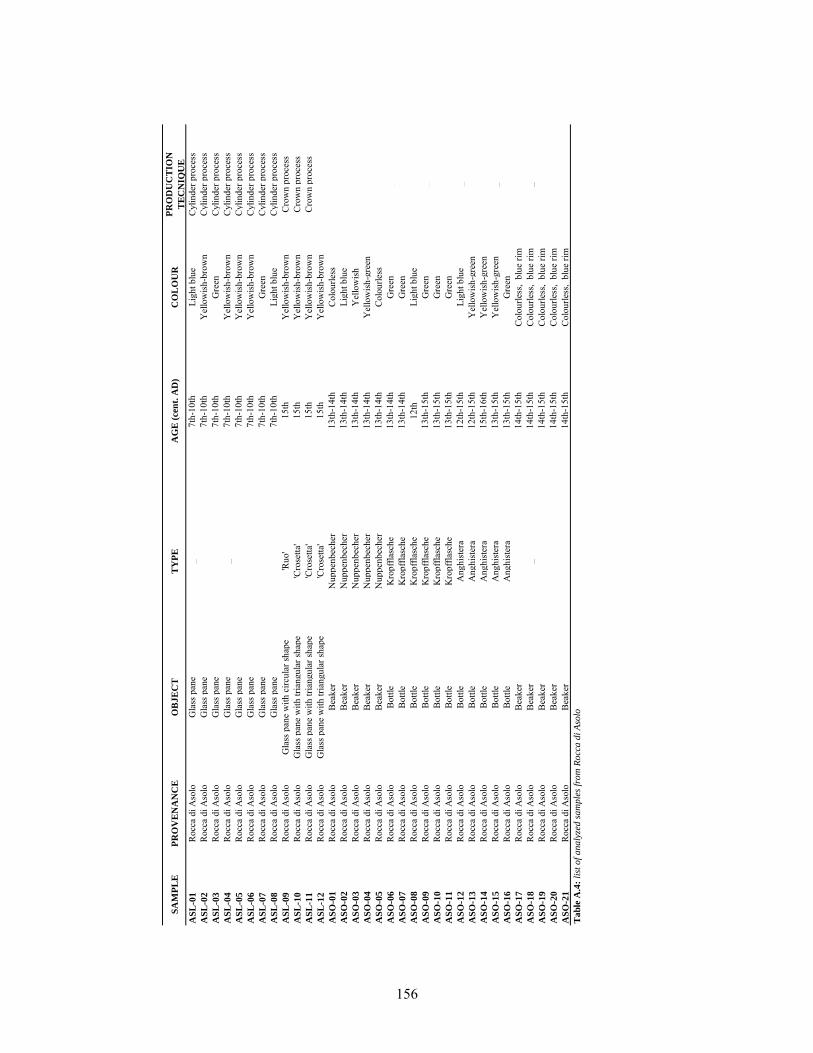
SA
MP
LE
PR
OV
EN
AN
CE
OB
JE
CT
TY
PE
AG
E (
cen
t. A
D)
CO
LO
UR
PR
OD
UC
TIO
N
TE
CN
IQU
E
AS
L-0
1R
occa
di A
solo
Gla
ss p
ane
_7t
h-10
th
Ligh
t blu
eC
ylin
der p
roce
ssA
SL
-02
Roc
ca d
i Aso
loG
lass
pan
e_
7th-
10th
Y
ello
wis
h-br
own
Cyl
inde
r pro
cess
AS
L-0
3
Roc
ca d
i Aso
loG
lass
pan
e_
7th-
10th
G
reen
Cyl
inde
r pro
cess
AS
L-0
4R
occa
di A
solo
Gla
ss p
ane
_7t
h-10
th
Yel
low
ish-
brow
nC
ylin
der p
roce
ssA
SL
-05
Roc
ca d
i Aso
loG
lass
pan
e_
7th-
10th
Y
ello
wis
h-br
own
Cyl
inde
r pro
cess
AS
L-0
6R
occa
di A
solo
Gla
ss p
ane
_7t
h-10
th
Yel
low
ish-
brow
nC
ylin
der p
roce
ssA
SL
-07
Roc
ca d
i Aso
loG
lass
pan
e_
7th-
10th
G
reen
Cyl
inde
r pro
cess
AS
L-0
8R
occa
di A
solo
Gla
ss p
ane
_7t
h-10
th
Ligh
t blu
eC
ylin
der p
roce
ssA
SL
-09
Roc
ca d
i Aso
loG
lass
pan
e w
ith c
ircul
ar sh
ape
'Ruo
'15
thY
ello
wis
h-br
own
Cro
wn
proc
ess
AS
L-1
0R
occa
di A
solo
Gla
ss p
ane
with
tria
ngul
ar sh
ape
'Cro
setta
'15
thY
ello
wis
h-br
own
Cro
wn
proc
ess
AS
L-1
1R
occa
di A
solo
Gla
ss p
ane
with
tria
ngul
ar sh
ape
'Cro
setta
'15
thY
ello
wis
h-br
own
Cro
wn
proc
ess
AS
L-1
2R
occa
di A
solo
Gla
ss p
ane
with
tria
ngul
ar sh
ape
'Cro
setta
'15
thY
ello
wis
h-br
own
_A
SO
-01
Roc
ca d
i Aso
loB
eake
rN
uppe
nbec
her
13th
-14t
hC
olou
rless
_A
SO
-02
Roc
ca d
i Aso
loB
eake
rN
uppe
nbec
her
13th
-14t
hLi
ght b
lue
_A
SO
-03
Roc
ca d
i Aso
loB
eake
rN
uppe
nbec
her
13th
-14t
hY
ello
wis
h_
AS
O-0
4R
occa
di A
solo
Bea
ker
Nup
penb
eche
r13
th-1
4th
Yel
low
ish-
gree
n_
AS
O-0
5R
occa
di A
solo
Bea
ker
Nup
penb
eche
r13
th-1
4th
Col
ourle
ss_
AS
O-0
6R
occa
di A
solo
Bot
tle
Kro
pffla
sche
13th
-14t
hG
reen
_A
SO
-07
Roc
ca d
i Aso
loB
ottle
K
ropf
flasc
he13
th-1
4th
Gre
en_
AS
O-0
8R
occa
di A
solo
Bot
tle
Kro
pffla
sche
12th
Ligh
t blu
e_
AS
O-0
9R
occa
di A
solo
Bot
tle
Kro
pffla
sche
13th
-15t
hG
reen
_A
SO
-10
Roc
ca d
i Aso
loB
ottle
K
ropf
flasc
he13
th-1
5th
Gre
en_
AS
O-1
1R
occa
di A
solo
Bot
tle
Kro
pffla
sche
13th
-15t
hG
reen
_A
SO
-12
Roc
ca d
i Aso
loB
ottle
A
nghi
ster
a12
th-1
5th
Ligh
t blu
e_
AS
O-1
3R
occa
di A
solo
Bot
tle
Ang
hist
era
12th
-15t
hY
ello
wis
h-gr
een
_A
SO
-14
Roc
ca d
i Aso
loB
ottle
A
nghi
ster
a15
th-1
6th
Yel
low
ish-
gree
n_
AS
O-1
5R
occa
di A
solo
Bot
tle
Ang
hist
era
13th
-15t
hY
ello
wis
h-gr
een
_A
SO
-16
Roc
ca d
i Aso
loB
ottle
A
nghi
ster
a13
th-1
5th
Gre
en_
AS
O-1
7R
occa
di A
solo
Bea
ker
_14
th-1
5th
Col
ourle
ss,
blue
rim
_A
SO
-18
Roc
ca d
i Aso
loB
eake
r_
14th
-15t
hC
olou
rless
, bl
ue ri
m_
AS
O-1
9R
occa
di A
solo
Bea
ker
_14
th-1
5th
Col
ourle
ss,
blue
rim
_A
SO
-20
Roc
ca d
i Aso
loB
eake
r_
14th
-15t
hC
olou
rless
, bl
ue ri
m_
AS
O-2
1R
occa
di A
solo
Bea
ker
_14
th-1
5th
Col
ourle
ss,
blue
rim
_T
ab
le A
.4:
list
of
an
aly
zed
sa
mp
les
fro
m R
occ
a d
i A
solo
156
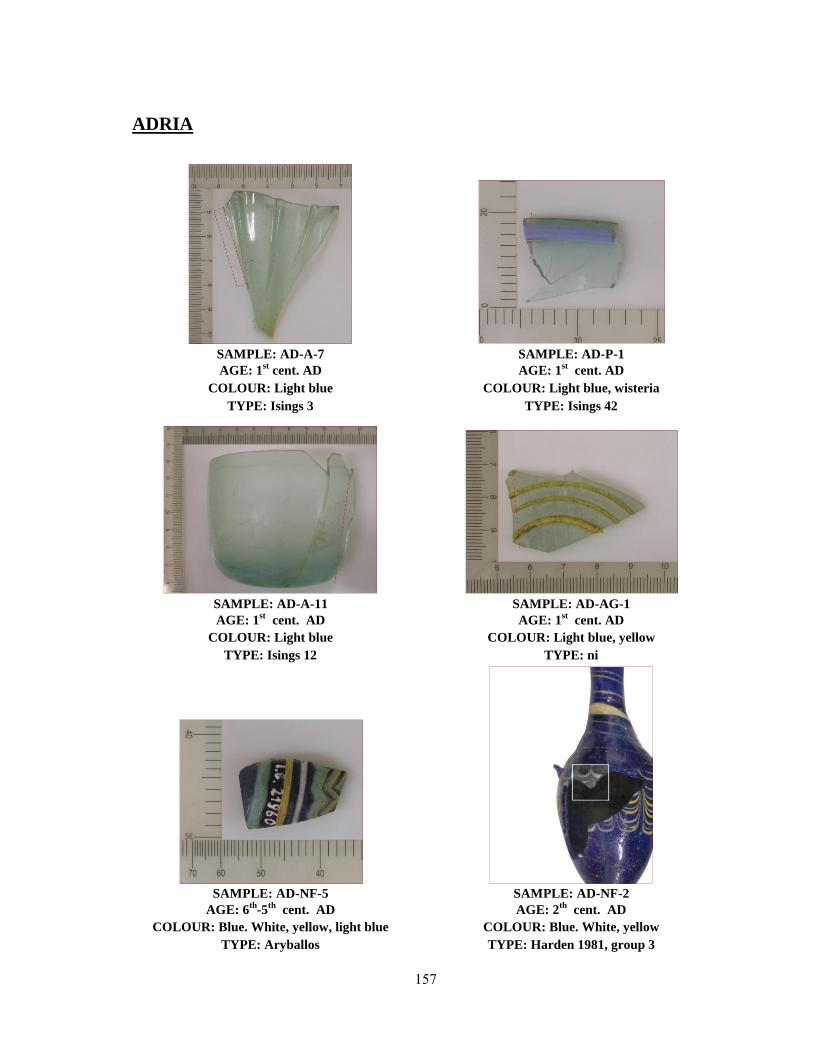
157
ADRIA
SAMPLE: AD-A-7 SAMPLE: AD-P-1
AGE: 1st cent. AD AGE: 1
st cent. AD
COLOUR: Light blue COLOUR: Light blue, wisteria
TYPE: Isings 3 TYPE: Isings 42
SAMPLE: AD-A-11 SAMPLE: AD-AG-1
AGE: 1st cent. AD AGE: 1
st cent. AD
COLOUR: Light blue COLOUR: Light blue, yellow
TYPE: Isings 12 TYPE: ni
SAMPLE: AD-NF-5 SAMPLE: AD-NF-2
AGE: 6th
-5th
cent. AD AGE: 2th
cent. AD
COLOUR: Blue. White, yellow, light blue COLOUR: Blue. White, yellow
TYPE: Aryballos TYPE: Harden 1981, group 3
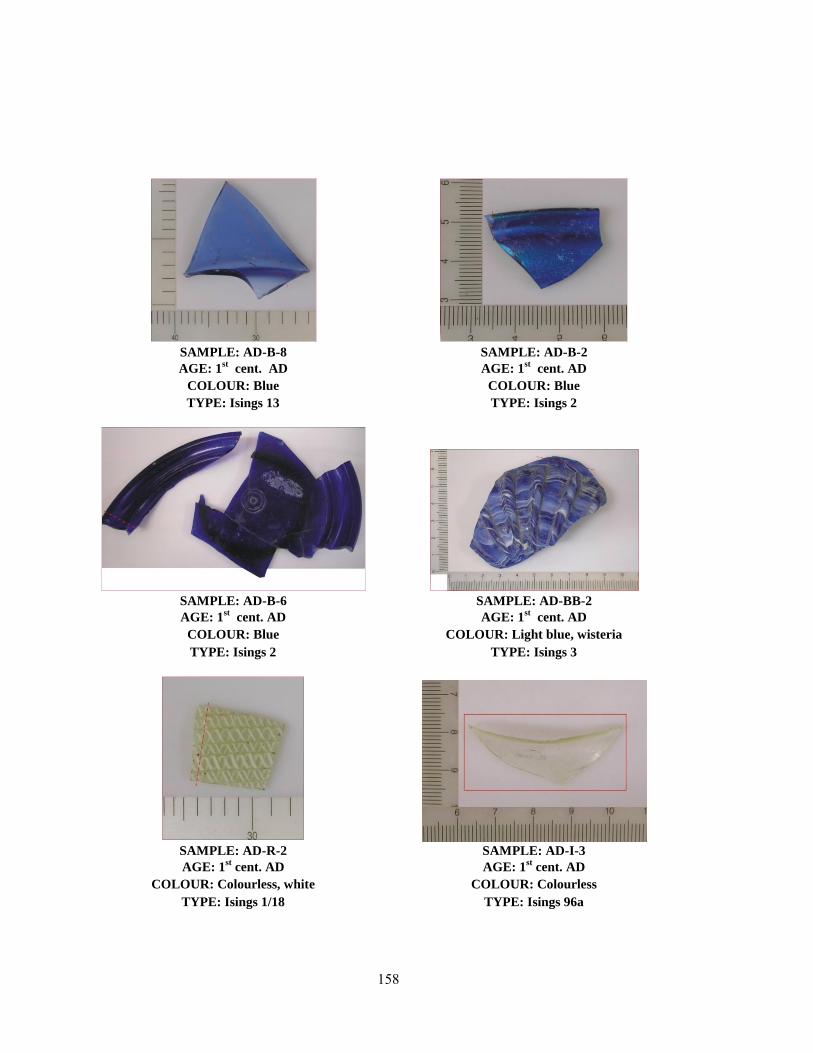
158
SAMPLE: AD-B-8 SAMPLE: AD-B-2
AGE: 1st cent. AD AGE: 1
st cent. AD
COLOUR: Blue COLOUR: Blue
TYPE: Isings 13 TYPE: Isings 2
SAMPLE: AD-B-6 SAMPLE: AD-BB-2
AGE: 1st cent. AD AGE: 1
st cent. AD
COLOUR: Blue COLOUR: Light blue, wisteria
TYPE: Isings 2 TYPE: Isings 3
SAMPLE: AD-R-2 SAMPLE: AD-I-3
AGE: 1st cent. AD AGE: 1
st cent. AD
COLOUR: Colourless, white COLOUR: Colourless
TYPE: Isings 1/18 TYPE: Isings 96a
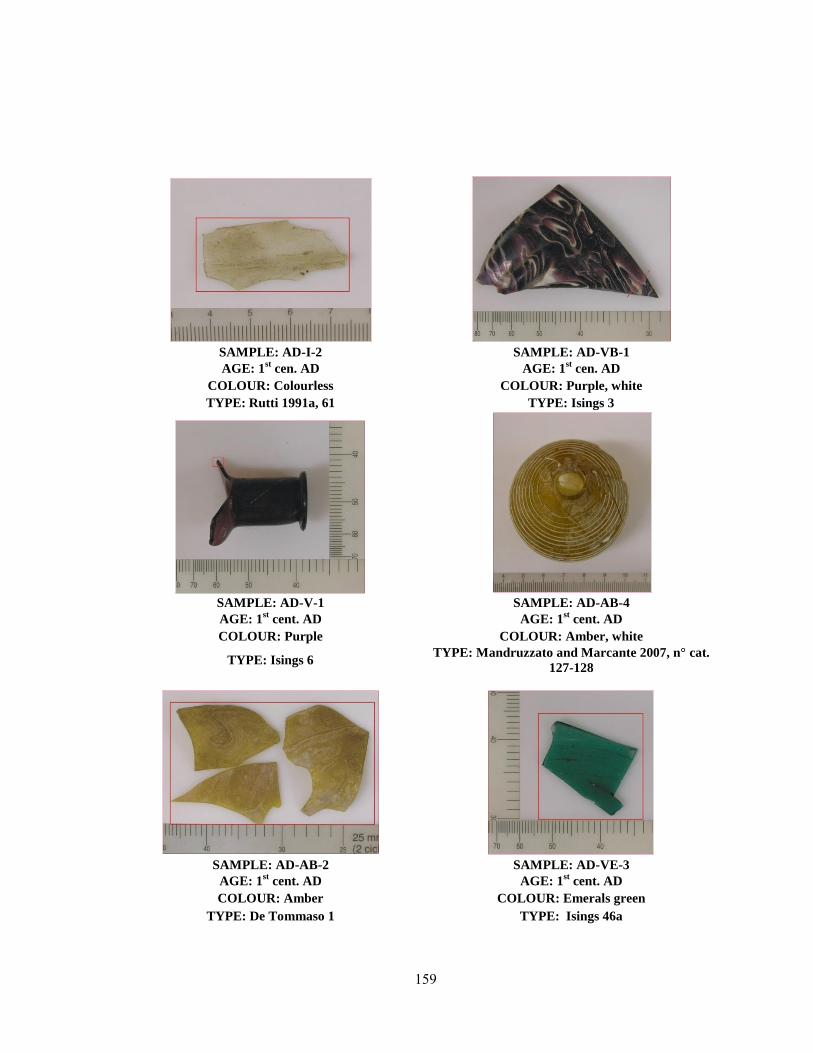
159
SAMPLE: AD-I-2 SAMPLE: AD-VB-1
AGE: 1st cen. AD AGE: 1
st cen. AD
COLOUR: Colourless COLOUR: Purple, white
TYPE: Rutti 1991a, 61 TYPE: Isings 3
SAMPLE: AD-V-1 SAMPLE: AD-AB-4
AGE: 1st cent. AD AGE: 1
st cent. AD
COLOUR: Purple COLOUR: Amber, white
TYPE: Isings 6 TYPE: Mandruzzato and Marcante 2007, n° cat.
127-128
SAMPLE: AD-AB-2 SAMPLE: AD-VE-3
AGE: 1st cent. AD AGE: 1
st cent. AD
COLOUR: Amber COLOUR: Emerals green
TYPE: De Tommaso 1 TYPE: Isings 46a
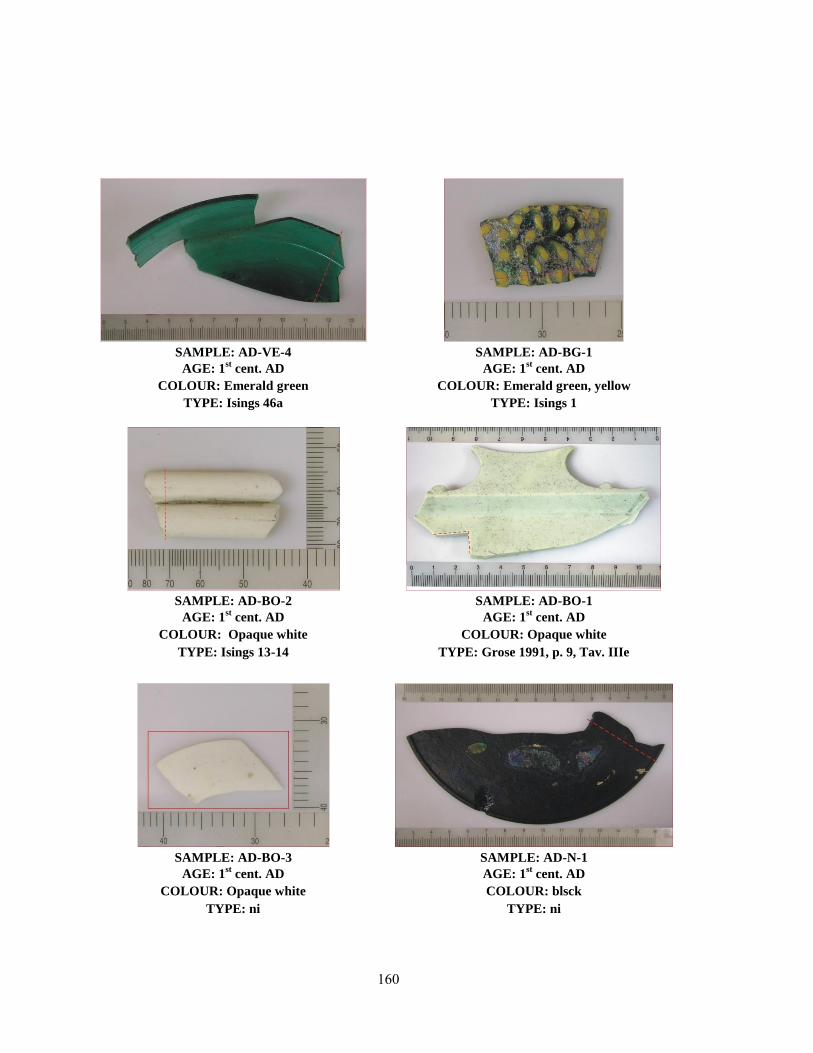
160
SAMPLE: AD-VE-4 SAMPLE: AD-BG-1
AGE: 1st cent. AD AGE: 1
st cent. AD
COLOUR: Emerald green COLOUR: Emerald green, yellow
TYPE: Isings 46a TYPE: Isings 1
SAMPLE: AD-BO-2 SAMPLE: AD-BO-1
AGE: 1st cent. AD AGE: 1
st cent. AD
COLOUR: Opaque white COLOUR: Opaque white
TYPE: Isings 13-14 TYPE: Grose 1991, p. 9, Tav. IIIe
SAMPLE: AD-BO-3 SAMPLE: AD-N-1
AGE: 1st cent. AD AGE: 1
st cent. AD
COLOUR: Opaque white COLOUR: blsck
TYPE: ni TYPE: ni
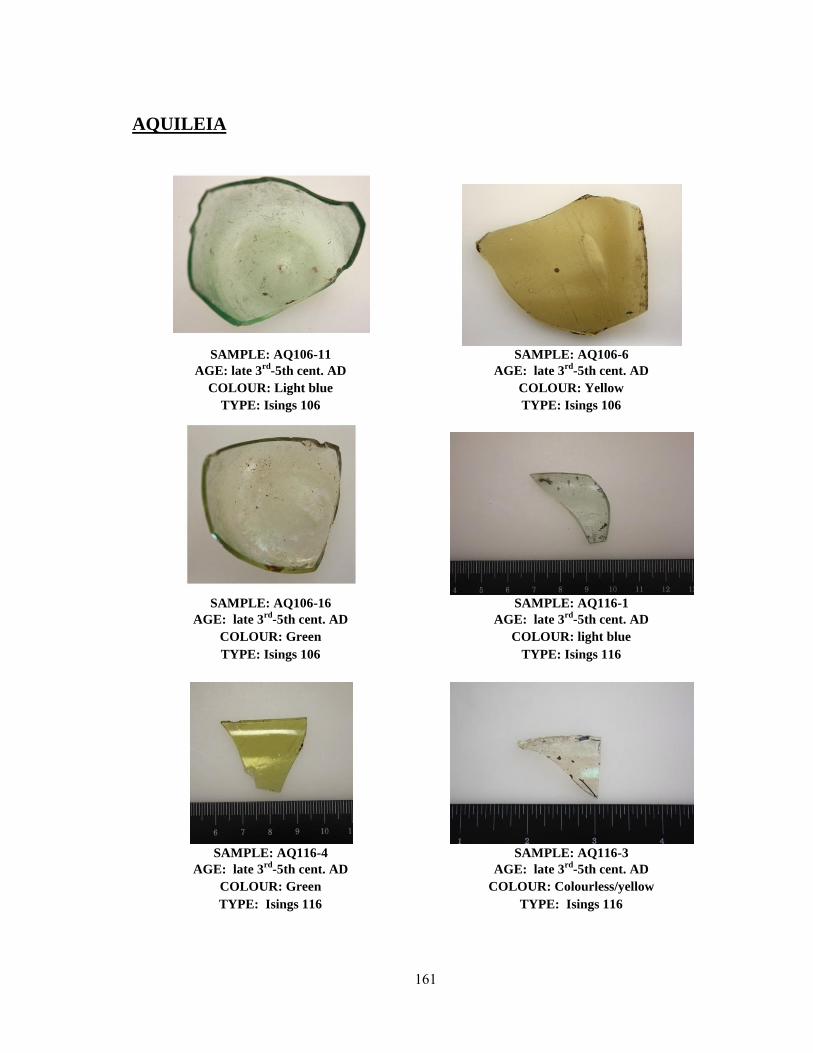
161
AQUILEIA
SAMPLE: AQ106-11 SAMPLE: AQ106-6
AGE: late 3rd
-5th cent. AD AGE: late 3rd
-5th cent. AD
COLOUR: Light blue COLOUR: Yellow
TYPE: Isings 106 TYPE: Isings 106
SAMPLE: AQ106-16 SAMPLE: AQ116-1
AGE: late 3rd
-5th cent. AD AGE: late 3rd
-5th cent. AD
COLOUR: Green COLOUR: light blue
TYPE: Isings 106 TYPE: Isings 116
SAMPLE: AQ116-4 SAMPLE: AQ116-3
AGE: late 3rd
-5th cent. AD AGE: late 3rd
-5th cent. AD
COLOUR: Green COLOUR: Colourless/yellow
TYPE: Isings 116 TYPE: Isings 116
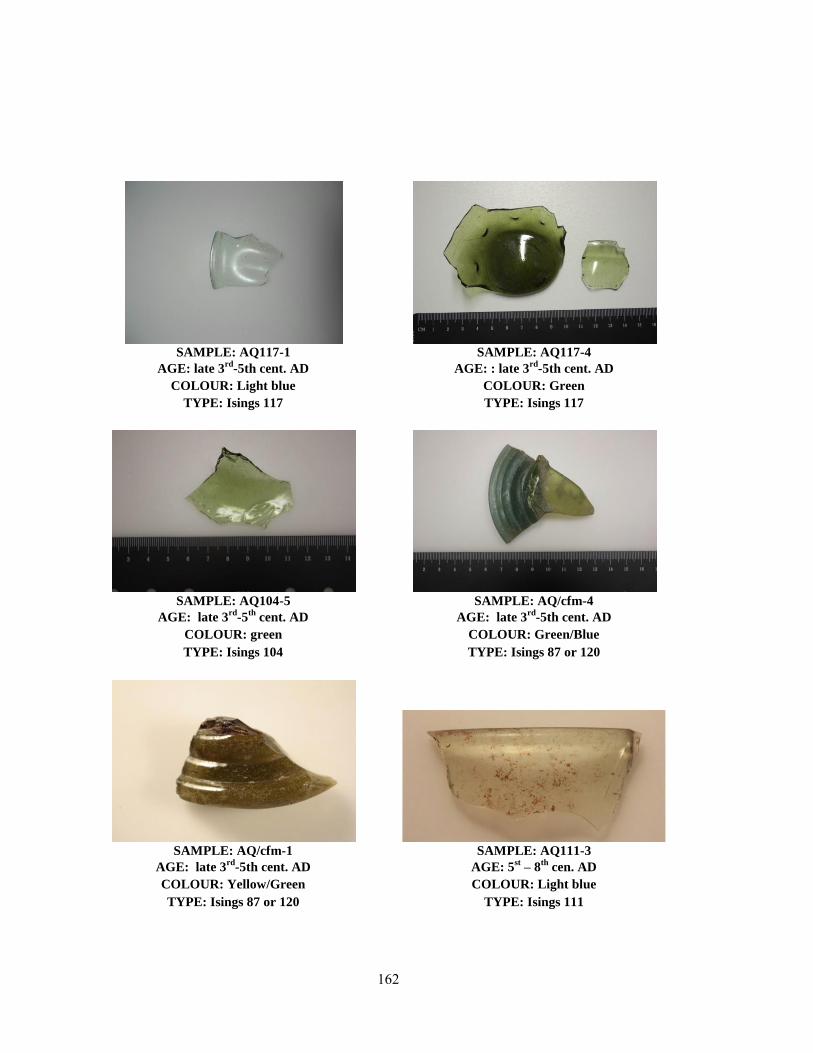
162
SAMPLE: AQ117-1 SAMPLE: AQ117-4
AGE: late 3rd
-5th cent. AD AGE: : late 3rd
-5th cent. AD
COLOUR: Light blue COLOUR: Green
TYPE: Isings 117 TYPE: Isings 117
SAMPLE: AQ104-5 SAMPLE: AQ/cfm-4
AGE: late 3rd
-5th
cent. AD AGE: late 3rd
-5th cent. AD
COLOUR: green COLOUR: Green/Blue
TYPE: Isings 104 TYPE: Isings 87 or 120
SAMPLE: AQ/cfm-1 SAMPLE: AQ111-3
AGE: late 3rd
-5th cent. AD AGE: 5st – 8
th cen. AD
COLOUR: Yellow/Green COLOUR: Light blue
TYPE: Isings 87 or 120 TYPE: Isings 111
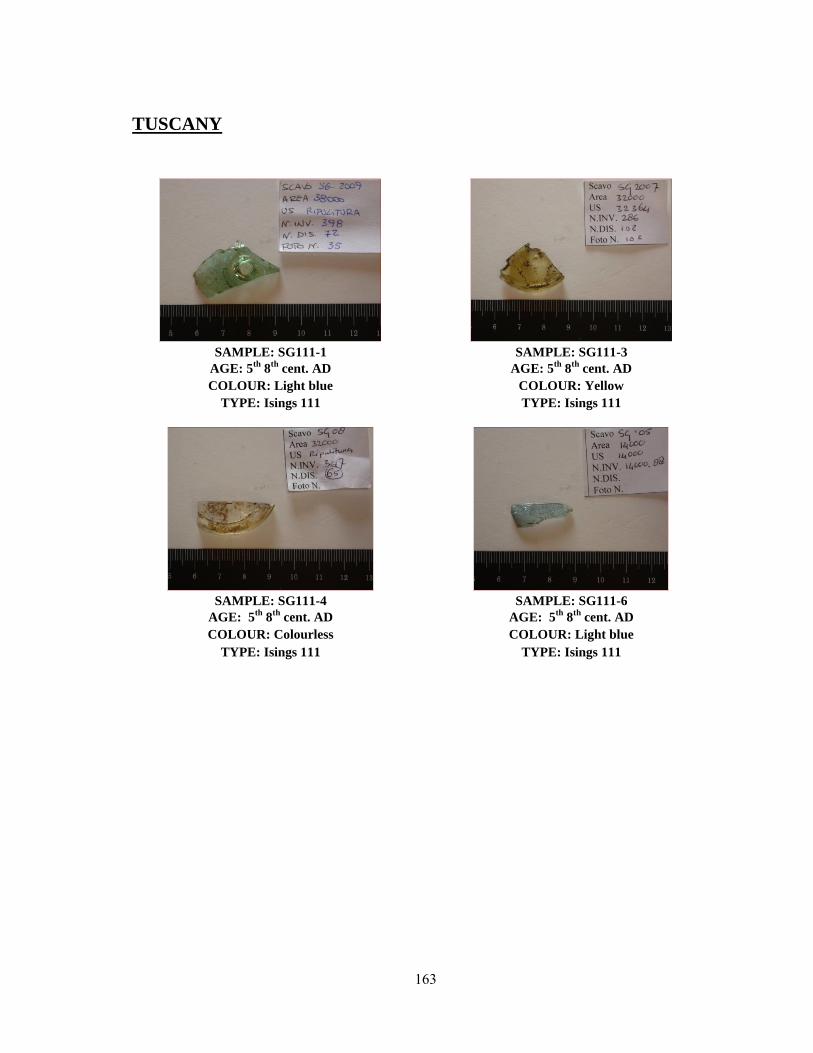
163
TUSCANY
SAMPLE: SG111-1 SAMPLE: SG111-3
AGE: 5th
8th
cent. AD AGE: 5th
8th
cent. AD
COLOUR: Light blue COLOUR: Yellow
TYPE: Isings 111 TYPE: Isings 111
SAMPLE: SG111-4 SAMPLE: SG111-6
AGE: 5th
8th
cent. AD AGE: 5th
8th
cent. AD
COLOUR: Colourless COLOUR: Light blue
TYPE: Isings 111 TYPE: Isings 111
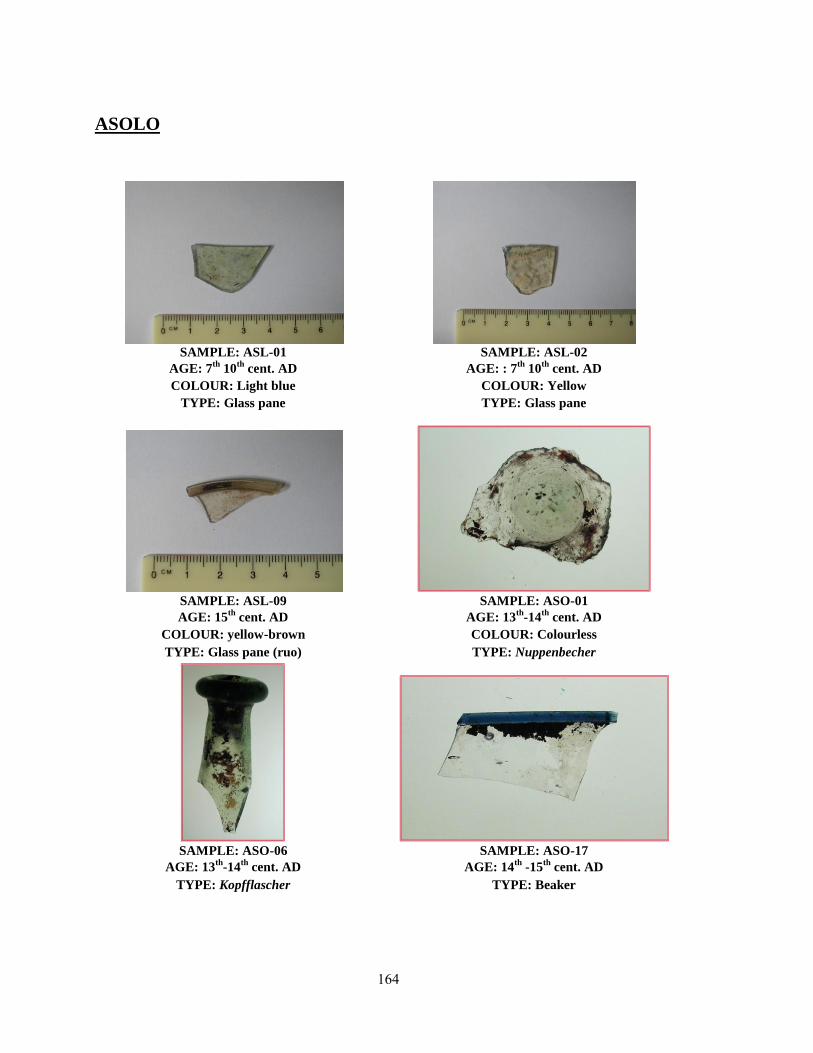
164
ASOLO
SAMPLE: ASL-01 SAMPLE: ASL-02
AGE: 7th
10th
cent. AD AGE: : 7th
10th
cent. AD
COLOUR: Light blue COLOUR: Yellow
TYPE: Glass pane TYPE: Glass pane
SAMPLE: ASL-09 SAMPLE: ASO-01
AGE: 15th
cent. AD AGE: 13th
-14th
cent. AD
COLOUR: yellow-brown COLOUR: Colourless
TYPE: Glass pane (ruo) TYPE: Nuppenbecher
SAMPLE: ASO-06 SAMPLE: ASO-17
AGE: 13th
-14th
cent. AD AGE: 14th
-15th
cent. AD
TYPE: Kopfflascher TYPE: Beaker
165
APPENDIX B
In this Appendix all the analytical techniques employed to characterize each samples
(XRPD, OM, SEM-EDS, XRF,LA-ICP-MS, MC-ICP-MS, EPMA, High Temperature
Laser Fluorination) are listed.
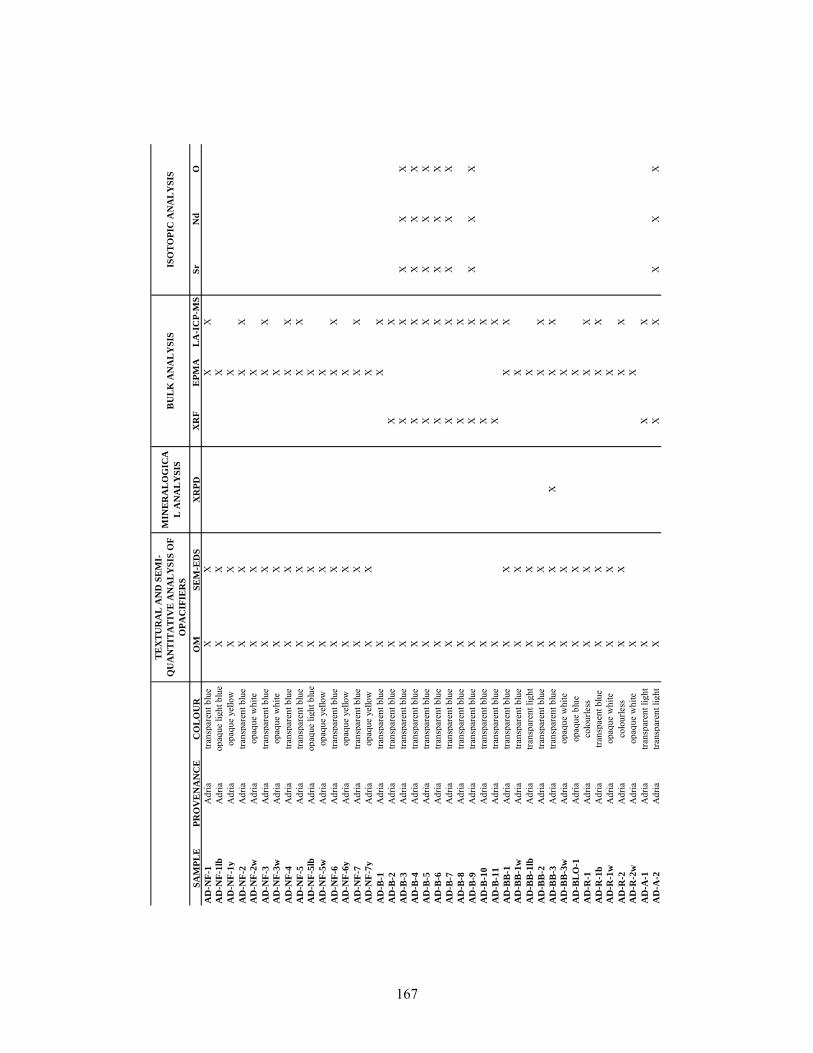
MIN
ER
AL
OG
ICA
L A
NA
LY
SIS
SA
MP
LE
PR
OV
EN
AN
CE
CO
LO
UR
OM
SE
M-E
DS
XR
PD
XR
FE
PM
AL
A-I
CP
-MS
Sr
Nd
O
AD
-NF
-1A
dria
trans
pare
nt b
lue
XX
XX
AD
-NF
-1lb
Adr
iaop
aque
ligh
t blu
eX
XX
AD
-NF
-1y
Adr
iaop
aque
yel
low
XX
XA
D-N
F-2
Adr
iatra
nspa
rent
blu
eX
XX
XA
D-N
F-2
wA
dria
opaq
ue w
hite
XX
XA
D-N
F-3
Adr
iatra
nspa
rent
blu
eX
XX
XA
D-N
F-3
wA
dria
opaq
ue w
hite
XX
XA
D-N
F-4
Adr
iatra
nspa
rent
blu
eX
XX
XA
D-N
F-5
Adr
iatra
nspa
rent
blu
eX
XX
XA
D-N
F-5
lbA
dria
opaq
ue li
ght b
lue
XX
XA
D-N
F-5
wA
dria
opaq
ue y
ello
wX
XX
AD
-NF
-6A
dria
trans
pare
nt b
lue
XX
XX
AD
-NF
-6y
Adr
iaop
aque
yel
low
XX
XA
D-N
F-7
Adr
iatra
nspa
rent
blu
eX
XX
XA
D-N
F-7
yA
dria
opaq
ue y
ello
wX
XX
AD
-B-1
Adr
iatra
nspa
rent
blu
eX
XX
AD
-B-2
Adr
iatra
nspa
rent
blu
eX
XX
AD
-B-3
Adr
iatra
nspa
rent
blu
eX
XX
XX
XA
D-B
-4A
dria
trans
pare
nt b
lue
XX
XX
XX
AD
-B-5
Adr
iatra
nspa
rent
blu
eX
XX
XX
XA
D-B
-6A
dria
trans
pare
nt b
lue
XX
XX
XX
AD
-B-7
Adr
iatra
nspa
rent
blu
eX
XX
XX
XA
D-B
-8A
dria
trans
pare
nt b
lue
XX
XA
D-B
-9A
dria
trans
pare
nt b
lue
XX
XX
XX
AD
-B-1
0A
dria
trans
pare
nt b
lue
XX
XA
D-B
-11
Adr
iatra
nspa
rent
blu
eX
XX
AD
-BB
-1A
dria
trans
pare
nt b
lue
XX
XX
AD
-BB
-1w
Adr
iatra
nspa
rent
blu
eX
XX
AD
-BB
-1lb
Adr
iatra
nspa
rent
ligh
t X
XX
AD
-BB
-2A
dria
trans
pare
nt b
lue
XX
XX
AD
-BB
-3A
dria
trans
pare
nt b
lue
XX
XX
XA
D-B
B-3
wA
dria
opaq
ue w
hite
XX
XA
D-B
LO
-1A
dria
opaq
ue b
lue
XX
XA
D-R
-1A
dria
colo
urle
ssX
XX
XA
D-R
-1b
Adr
iatra
nspa
ent b
lue
XX
XX
AD
-R-1
wA
dria
opaq
ue w
hite
XX
XA
D-R
-2A
dria
colo
urle
ssX
XX
XA
D-R
-2w
Adr
iaop
aque
whi
teX
XA
D-A
-1A
dria
trans
pare
nt li
ght
XX
XA
D-A
-2A
dria
trans
pare
nt li
ght
XX
XX
XX
TE
XT
UR
AL
AN
D S
EM
I-
QU
AN
TIT
AT
IVE
AN
AL
YS
IS O
F
OP
AC
IFIE
RS
BU
LK
AN
AL
YS
ISIS
OT
OP
IC A
NA
LY
SIS
167
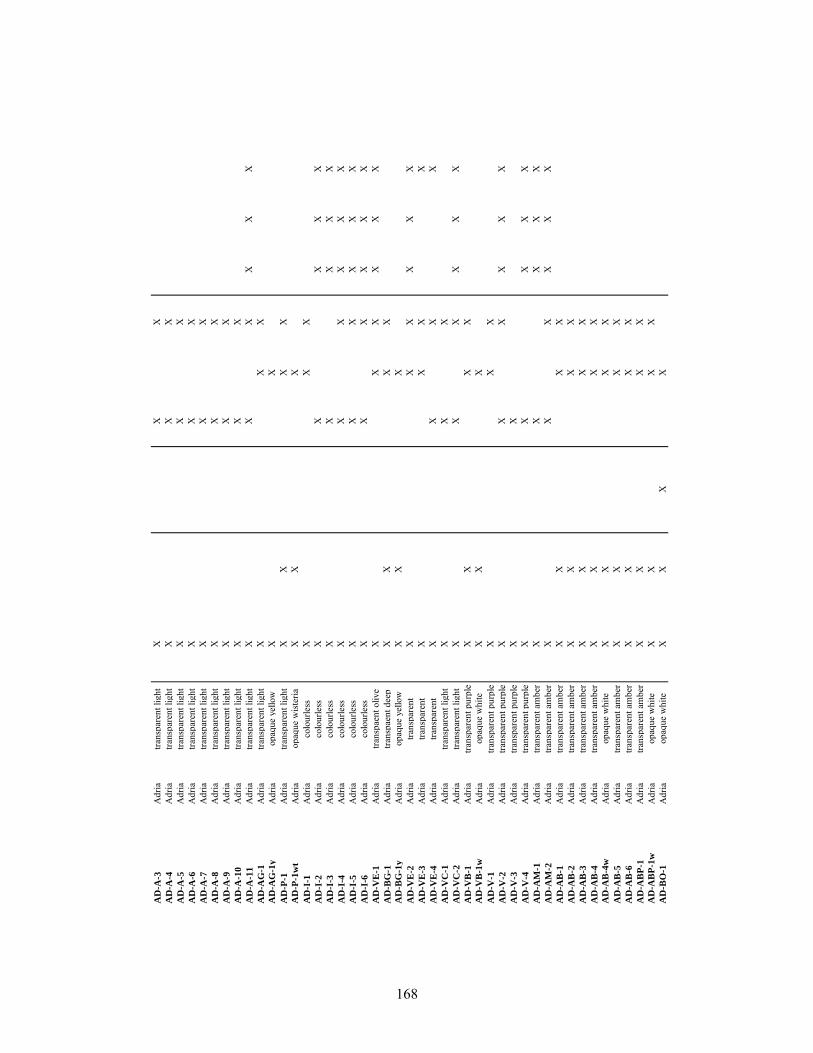
AD
-A-3
Adr
iatra
nspa
rent
ligh
t X
XX
AD
-A-4
Adr
iatra
nspa
rent
ligh
t X
XX
AD
-A-5
Adr
iatra
nspa
rent
ligh
t X
XX
AD
-A-6
Adr
iatra
nspa
rent
ligh
t X
XX
AD
-A-7
Adr
iatra
nspa
rent
ligh
t X
XX
AD
-A-8
Adr
iatra
nspa
rent
ligh
t X
XX
AD
-A-9
Adr
iatra
nspa
rent
ligh
t X
XX
AD
-A-1
0A
dria
trans
pare
nt li
ght
XX
XA
D-A
-11
Adr
iatra
nspa
rent
ligh
t X
XX
XX
XA
D-A
G-1
Adr
iatra
nspa
rent
ligh
t X
XX
AD
-AG
-1y
Adr
iaop
aque
yel
low
XX
AD
-P-1
Adr
iatra
nspa
rent
ligh
t X
XX
XA
D-P
-1w
tA
dria
opaq
ue w
iste
riaX
XX
AD
-I-1
Adr
iaco
lour
less
XX
XA
D-I
-2A
dria
colo
urle
ssX
XX
XX
AD
-I-3
Adr
iaco
lour
less
XX
XX
XA
D-I
-4A
dria
colo
urle
ssX
XX
XX
XA
D-I
-5A
dria
colo
urle
ssX
XX
XX
XA
D-I
-6A
dria
colo
urle
ssX
XX
XX
XA
D-V
E-1
Adr
iatra
nspa
ent o
live
XX
XX
XX
AD
-BG
-1A
dria
trans
paen
t dee
p X
XX
XA
D-B
G-1
yA
dria
opaq
ue y
ello
wX
XX
AD
-VE
-2A
dria
trans
pare
nt
XX
XX
XX
AD
-VE
-3A
dria
trans
pare
nt
XX
XX
AD
-VE
-4A
dria
trans
pare
nt
XX
XX
AD
-VC
-1A
dria
trans
pare
nt li
ght
XX
XA
D-V
C-2
Adr
iatra
nspa
rent
ligh
t X
XX
XX
XA
D-V
B-1
Adr
iatra
nspa
rent
pur
ple
XX
XX
AD
-VB
-1w
Adr
iaop
aque
whi
teX
XX
AD
-V-1
Adr
iatra
nspa
rent
pur
ple
XX
XA
D-V
-2A
dria
trans
pare
nt p
urpl
eX
XX
XX
XA
D-V
-3A
dria
trans
pare
nt p
urpl
eX
XA
D-V
-4A
dria
trans
pare
nt p
urpl
eX
XX
XX
AD
-AM
-1A
dria
trans
pare
nt a
mbe
rX
XX
XX
AD
-AM
-2A
dria
trans
pare
nt a
mbe
rX
XX
XX
XA
D-A
B-1
Adr
iatra
nspa
rent
am
ber
XX
XX
AD
-AB
-2A
dria
trans
pare
nt a
mbe
rX
XX
XA
D-A
B-3
Adr
iatra
nspa
rent
am
ber
XX
XX
AD
-AB
-4A
dria
trans
pare
nt a
mbe
rX
XX
XA
D-A
B-4
wA
dria
opaq
ue w
hite
XX
XX
AD
-AB
-5A
dria
trans
pare
nt a
mbe
rX
XX
XA
D-A
B-6
Adr
iatra
nspa
rent
am
ber
XX
XX
AD
-AB
P-1
Adr
iatra
nspa
rent
am
ber
XX
XX
AD
-AB
P-1
wA
dria
opaq
ue w
hite
XX
XX
AD
-BO
-1A
dria
opaq
ue w
hite
XX
XX
168
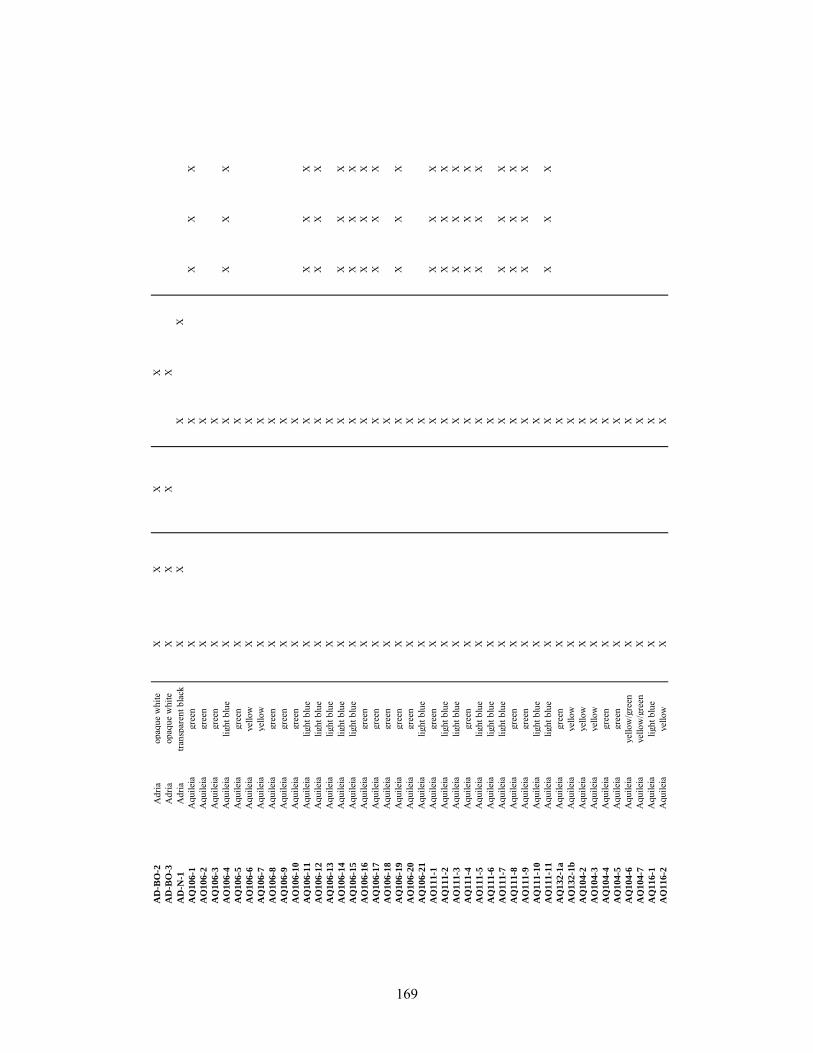
AD
-BO
-2A
dria
opaq
ue w
hite
XX
XX
AD
-BO
-3A
dria
opaq
ue w
hite
XX
XX
AD
-N-1
Adr
iatra
nspa
rent
bla
ckX
XX
XA
Q1
06
-1A
quile
iagr
een
XX
XX
XA
Q1
06
-2A
quile
iagr
een
XX
AQ
10
6-3
Aqu
ileia
gree
nX
XA
Q1
06
-4A
quile
ialig
ht b
lue
XX
XX
XA
Q1
06
-5A
quile
iagr
een
XX
AQ
10
6-6
Aqu
ileia
yello
wX
XA
Q1
06
-7A
quile
iaye
llow
XX
AQ
10
6-8
Aqu
ileia
gree
nX
XA
Q1
06
-9A
quile
iagr
een
XX
AQ
10
6-1
0A
quile
iagr
een
XX
AQ
10
6-1
1A
quile
ialig
ht b
lue
XX
XX
XA
Q1
06
-12
Aqu
ileia
light
blu
eX
XX
XX
AQ
10
6-1
3A
quile
ialig
ht b
lue
XX
AQ
10
6-1
4A
quile
ialig
ht b
lue
XX
XX
XA
Q1
06
-15
Aqu
ileia
light
blu
eX
XX
XX
AQ
10
6-1
6A
quile
iagr
een
XX
XX
XA
Q1
06
-17
Aqu
ileia
gree
nX
XX
XX
AQ
10
6-1
8A
quile
iagr
een
XX
AQ
10
6-1
9A
quile
iagr
een
XX
XX
XA
Q1
06
-20
Aqu
ileia
gree
nX
XA
Q1
06
-21
Aqu
ileia
light
blu
eX
XA
Q1
11
-1A
quile
iagr
een
XX
XX
XA
Q1
11
-2A
quile
ialig
ht b
lue
XX
XX
XA
Q1
11
-3A
quile
ialig
ht b
lue
XX
XX
XA
Q1
11
-4A
quile
iagr
een
XX
XX
XA
Q1
11
-5A
quile
ialig
ht b
lue
XX
XX
XA
Q1
11
-6A
quile
ialig
ht b
lue
XX
AQ
11
1-7
Aqu
ileia
light
blu
eX
XX
XX
AQ
11
1-8
Aqu
ileia
gree
nX
XX
XX
AQ
11
1-9
Aqu
ileia
gree
nX
XX
XX
AQ
11
1-1
0A
quile
ialig
ht b
lue
XX
AQ
11
1-1
1A
quile
ialig
ht b
lue
XX
XX
XA
Q1
32
-1a
Aqu
ileia
gree
nX
XA
Q1
32
-1b
Aqu
ileia
yello
wX
XA
Q1
04
-2A
quile
iaye
llow
XX
AQ
10
4-3
Aqu
ileia
yello
wX
XA
Q1
04
-4A
quile
iagr
een
XX
AQ
10
4-5
Aqu
ileia
gree
nX
XA
Q1
04
-6A
quile
iaye
llow
/gre
enX
XA
Q1
04
-7A
quile
iaye
llow
/gre
enX
XA
Q1
16
-1A
quile
ialig
ht b
lue
XX
AQ
11
6-2
Aqu
ileia
yello
wX
X
169
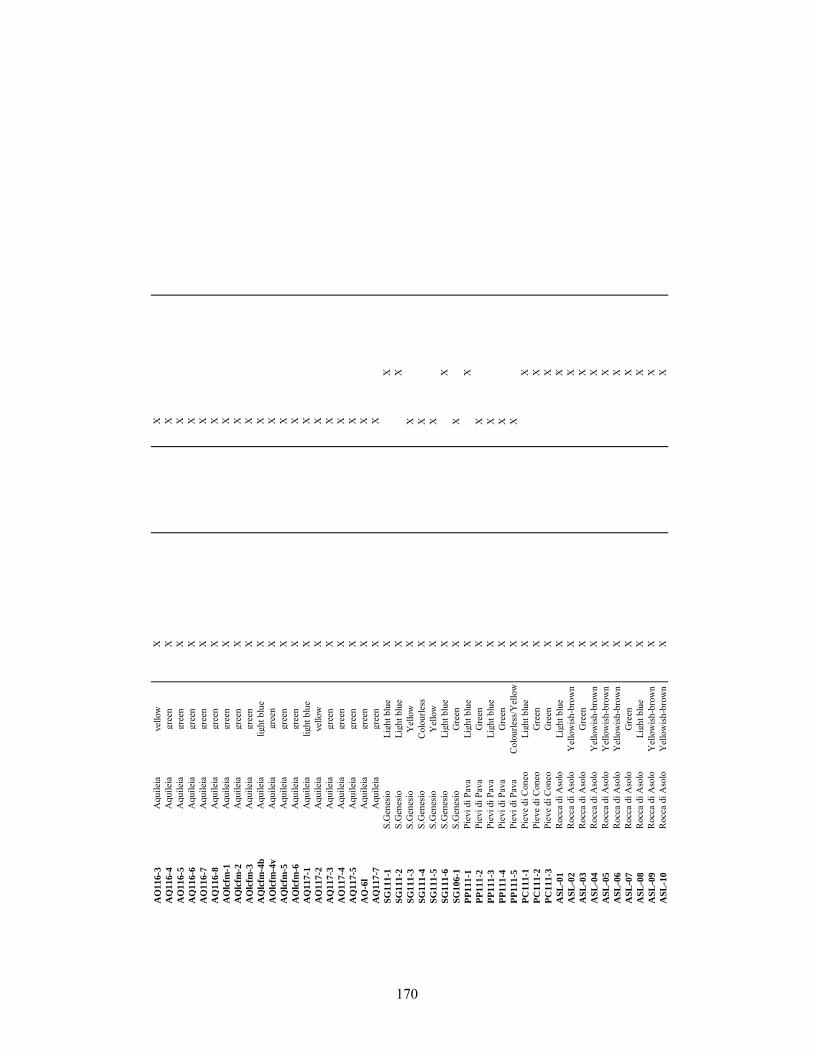
AQ
11
6-3
Aqu
ileia
yello
wX
XA
Q1
16
-4A
quile
iagr
een
XX
AQ
11
6-5
Aqu
ileia
gree
nX
XA
Q1
16
-6A
quile
iagr
een
XX
AQ
11
6-7
Aqu
ileia
gree
nX
XA
Q1
16
-8A
quile
iagr
een
XX
AQ
lcfm
-1A
quile
iagr
een
XX
AQ
lcfm
-2A
quile
iagr
een
XX
AQ
lcfm
-3A
quile
iagr
een
XX
AQ
lcfm
-4b
Aqu
ileia
light
blu
eX
XA
Qlc
fm-4
vA
quile
iagr
een
XX
AQ
lcfm
-5A
quile
iagr
een
XX
AQ
lcfm
-6A
quile
iagr
een
XX
AQ
11
7-1
Aqu
ileia
light
blu
eX
XA
Q1
17
-2A
quile
iaye
llow
XX
AQ
11
7-3
Aqu
ileia
gree
nX
XA
Q1
17
-4A
quile
iagr
een
XX
AQ
11
7-5
Aqu
ileia
gree
nX
XA
Q-6
lA
quile
iagr
een
XX
AQ
11
7-7
Aqu
ileia
gree
nX
XS
G1
11
-1S.
Gen
esio
Ligh
t blu
eX
XS
G1
11
-2S.
Gen
esio
Ligh
t blu
eX
XS
G1
11
-3S.
Gen
esio
Yel
low
XX
SG
11
1-4
S.G
enes
ioC
olou
rless
XX
SG
11
1-5
S.G
enes
ioY
ello
wX
XS
G1
11
-6S.
Gen
esio
Ligh
t blu
eX
XS
G1
06
-1S.
Gen
esio
Gre
enX
XP
P1
11
-1Pi
evi d
i Pav
aLi
ght b
lue
XX
PP
11
1-2
Piev
i di P
ava
Gre
enX
XP
P1
11
-3Pi
evi d
i Pav
aLi
ght b
lue
XX
PP
11
1-4
Piev
i di P
ava
Gre
enX
XP
P1
11
-5Pi
evi d
i Pav
aC
olou
rless
/Yel
low
XX
PC
11
1-1
Piev
e di
Con
eoLi
ght b
lue
XX
PC
11
1-2
Piev
e di
Con
eoG
reen
XX
PC
11
1-3
Piev
e di
Con
eoG
reen
XX
AS
L-0
1R
occa
di A
solo
Ligh
t blu
eX
XA
SL
-02
Roc
ca d
i Aso
loY
ello
wis
h-br
own
XX
AS
L-0
3R
occa
di A
solo
Gre
enX
XA
SL
-04
Roc
ca d
i Aso
loY
ello
wis
h-br
own
XX
AS
L-0
5R
occa
di A
solo
Yel
low
ish-
brow
nX
XA
SL
-06
Roc
ca d
i Aso
loY
ello
wis
h-br
own
XX
AS
L-0
7R
occa
di A
solo
Gre
enX
XA
SL
-08
Roc
ca d
i Aso
loLi
ght b
lue
XX
AS
L-0
9R
occa
di A
solo
Yel
low
ish-
brow
nX
XA
SL
-10
Roc
ca d
i Aso
loY
ello
wis
h-br
own
XX
170
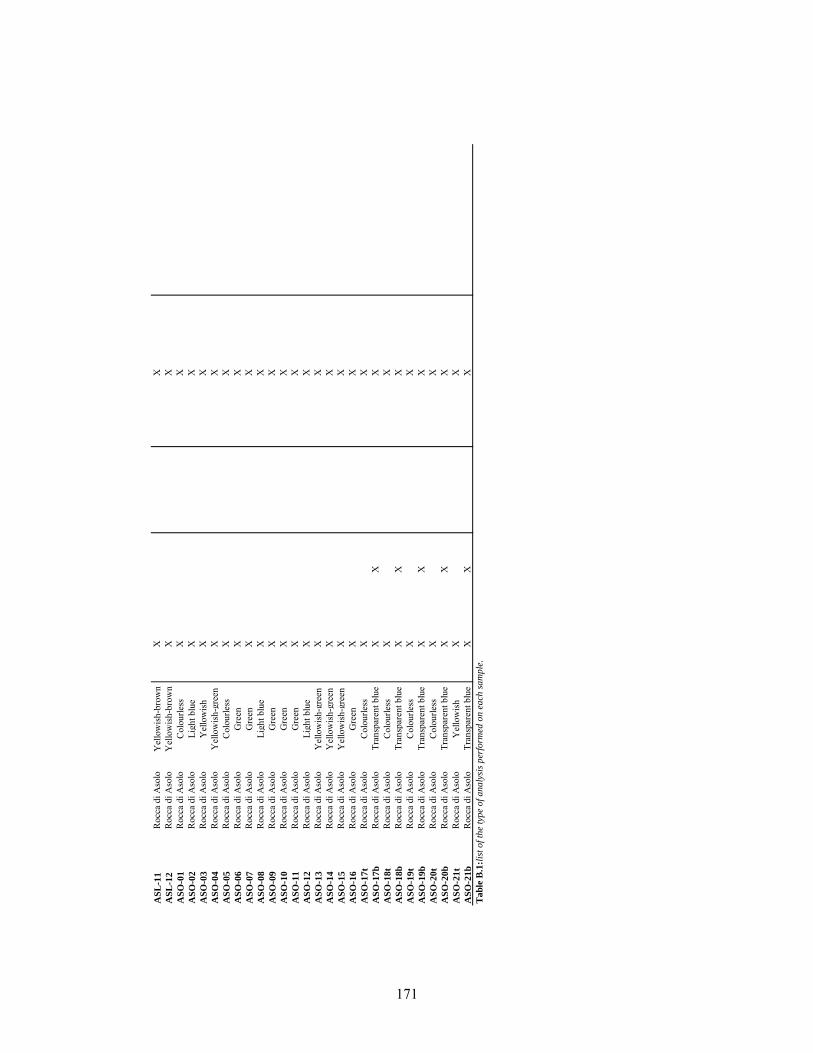
AS
L-1
1R
occa
di A
solo
Yel
low
ish-
brow
nX
XA
SL
-12
Roc
ca d
i Aso
loY
ello
wis
h-br
own
XX
AS
O-0
1R
occa
di A
solo
Col
ourle
ssX
XA
SO
-02
Roc
ca d
i Aso
loLi
ght b
lue
XX
AS
O-0
3R
occa
di A
solo
Yel
low
ish
XX
AS
O-0
4R
occa
di A
solo
Yel
low
ish-
gree
nX
XA
SO
-05
Roc
ca d
i Aso
loC
olou
rless
XX
AS
O-0
6R
occa
di A
solo
Gre
enX
XA
SO
-07
Roc
ca d
i Aso
loG
reen
XX
AS
O-0
8R
occa
di A
solo
Ligh
t blu
eX
XA
SO
-09
Roc
ca d
i Aso
loG
reen
XX
AS
O-1
0R
occa
di A
solo
Gre
enX
XA
SO
-11
Roc
ca d
i Aso
loG
reen
XX
AS
O-1
2R
occa
di A
solo
Ligh
t blu
eX
XA
SO
-13
Roc
ca d
i Aso
loY
ello
wis
h-gr
een
XX
AS
O-1
4R
occa
di A
solo
Yel
low
ish-
gree
nX
XA
SO
-15
Roc
ca d
i Aso
loY
ello
wis
h-gr
een
XX
AS
O-1
6R
occa
di A
solo
Gre
enX
XA
SO
-17
tR
occa
di A
solo
Col
ourle
ss
XX
AS
O-1
7b
Roc
ca d
i Aso
loTr
ansp
aren
t blu
eX
XX
AS
O-1
8t
Roc
ca d
i Aso
loC
olou
rless
X
XA
SO
-18
bR
occa
di A
solo
Tran
spar
ent b
lue
XX
XA
SO
-19
tR
occa
di A
solo
Col
ourle
ss
XX
AS
O-1
9b
Roc
ca d
i Aso
loTr
ansp
aren
t blu
eX
XX
AS
O-2
0t
Roc
ca d
i Aso
loC
olou
rless
X
XA
SO
-20
bR
occa
di A
solo
Tran
spar
ent b
lue
XX
XA
SO
-21
tR
occa
di A
solo
Yel
low
ish
XX
AS
O-2
1b
Roc
ca d
i Aso
loTr
ansp
aren
t blu
eX
XX
Ta
ble
B.1
:lis
t o
f th
e ty
pe
of
an
aly
sis
per
form
ed o
n e
ach
sa
mp
le.
171
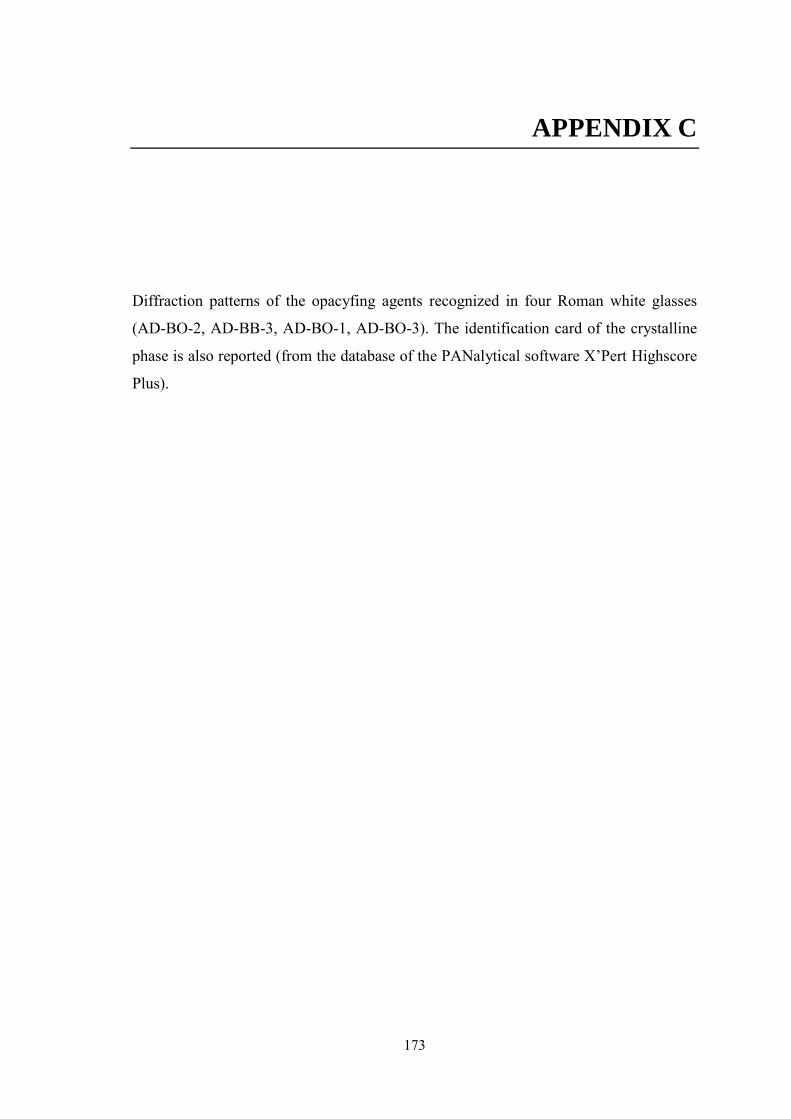
173
APPENDIX C
Diffraction patterns of the opacyfing agents recognized in four Roman white glasses
(AD-BO-2, AD-BB-3, AD-BO-1, AD-BO-3). The identification card of the crystalline
phase is also reported (from the database of the PANalytical software X’Pert Highscore
Plus).
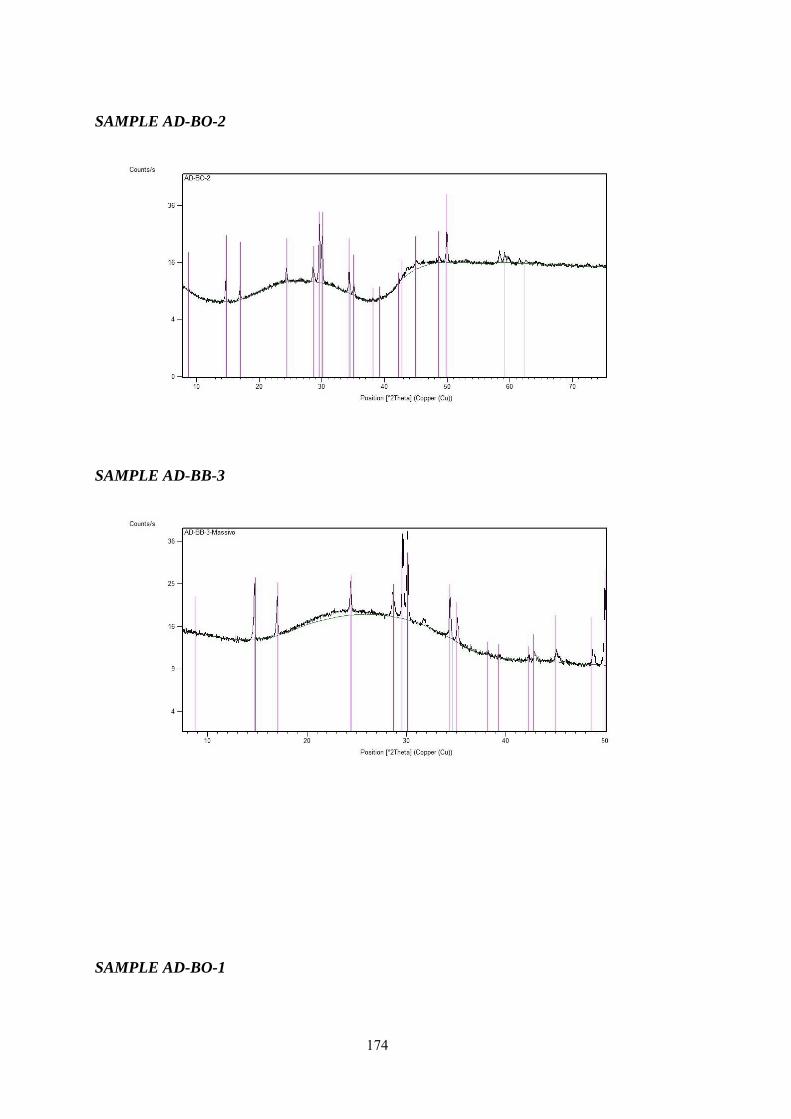
174
SAMPLE AD-BO-2
SAMPLE AD-BB-3
SAMPLE AD-BO-1
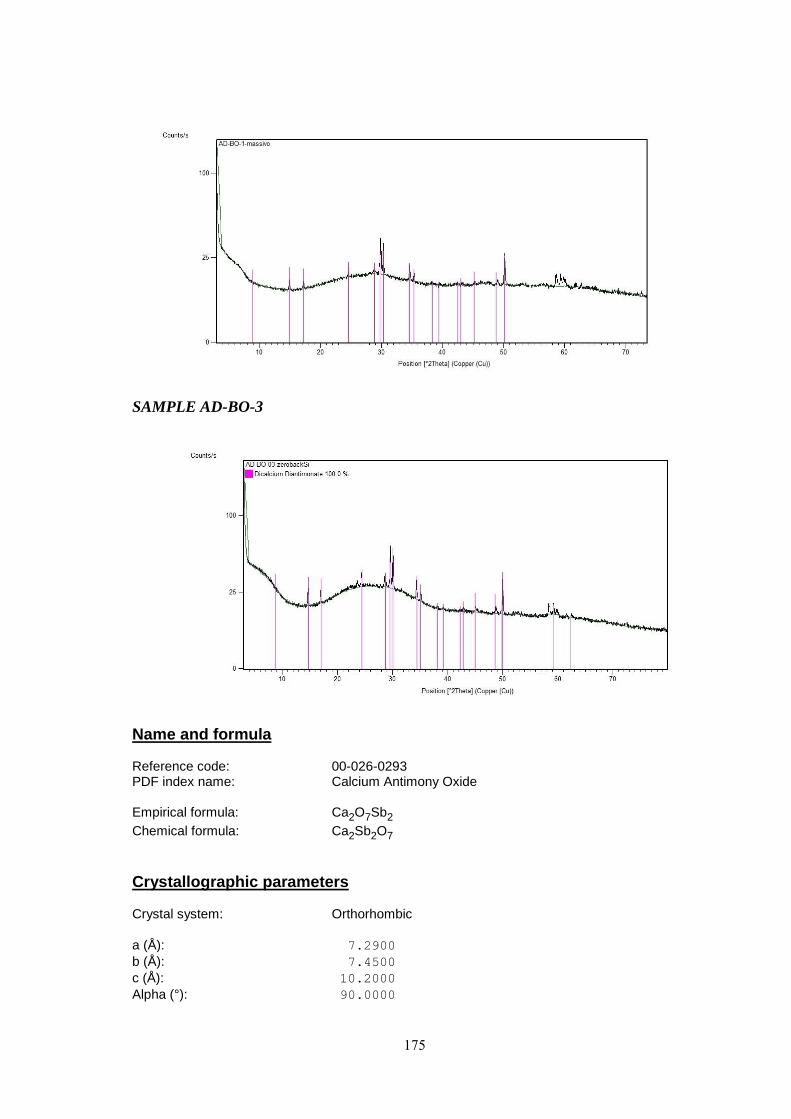
175
SAMPLE AD-BO-3
Name and formula Reference code: 00-026-0293 PDF index name: Calcium Antimony Oxide Empirical formula: Ca2O7Sb2
Chemical formula: Ca2Sb2O7
Crystallographic parameters Crystal system: Orthorhombic
a (Å): 7.2900
b (Å): 7.4500
c (Å): 10.2000
Alpha (°): 90.0000
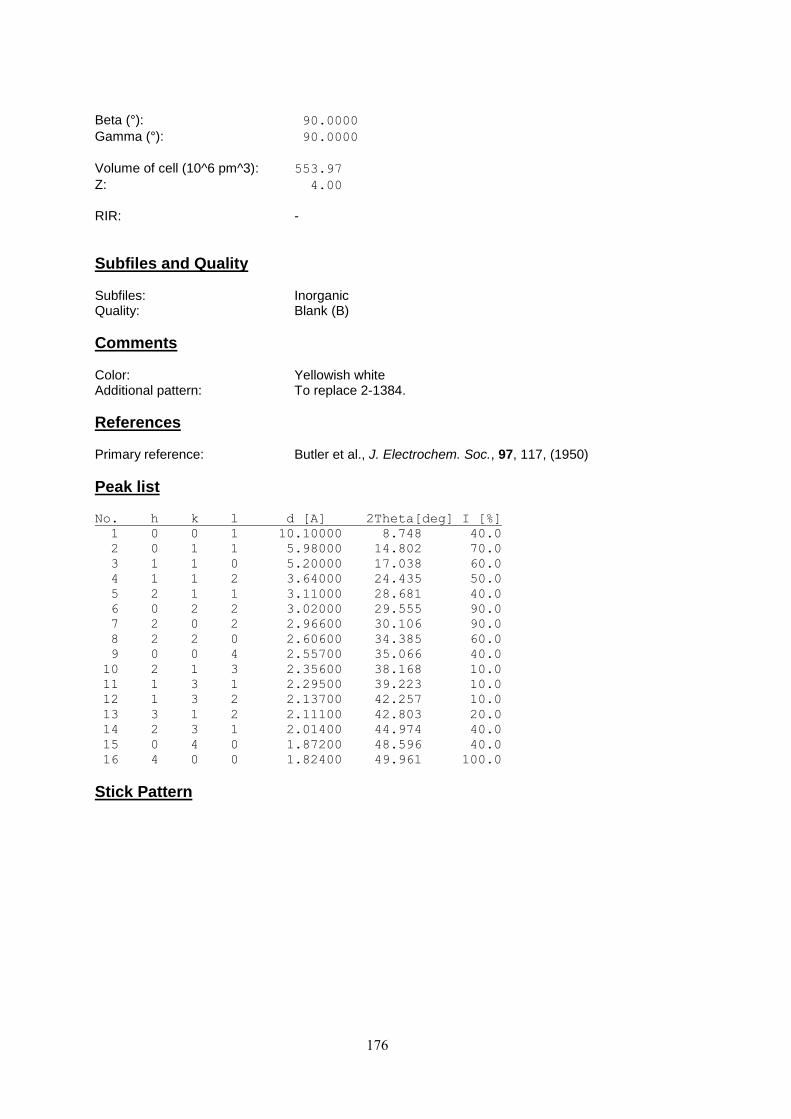
176
Beta (°): 90.0000
Gamma (°): 90.0000
Volume of cell (10^6 pm^3): 553.97
Z: 4.00
RIR: -
Subfiles and Quality Subfiles: Inorganic Quality: Blank (B)
Comments Color: Yellowish white Additional pattern: To replace 2-1384.
References Primary reference: Butler et al., J. Electrochem. Soc., 97, 117, (1950)
Peak list No. h k l d [A] 2Theta[deg] I [%]
1 0 0 1 10.10000 8.748 40.0
2 0 1 1 5.98000 14.802 70.0
3 1 1 0 5.20000 17.038 60.0
4 1 1 2 3.64000 24.435 50.0
5 2 1 1 3.11000 28.681 40.0
6 0 2 2 3.02000 29.555 90.0
7 2 0 2 2.96600 30.106 90.0
8 2 2 0 2.60600 34.385 60.0
9 0 0 4 2.55700 35.066 40.0
10 2 1 3 2.35600 38.168 10.0
11 1 3 1 2.29500 39.223 10.0
12 1 3 2 2.13700 42.257 10.0
13 3 1 2 2.11100 42.803 20.0
14 2 3 1 2.01400 44.974 40.0
15 0 4 0 1.87200 48.596 40.0
16 4 0 0 1.82400 49.961 100.0
Stick Pattern
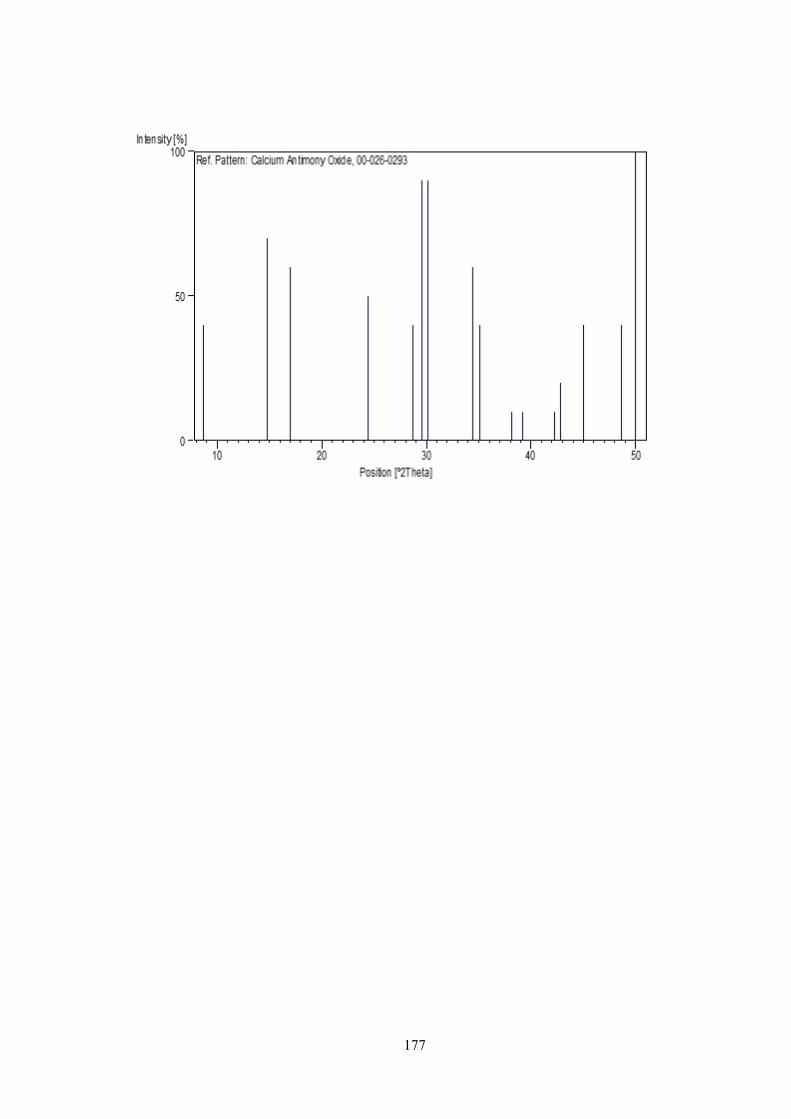
177
179
APPENDIX D
Major, minor and trace elements composition of all transparent and opaque glasses
analyzed. Results are expressed as wt% for major and minor elements, as ppm for
traces, and are given by XRF, EPMA, and LA-ICP-MS.
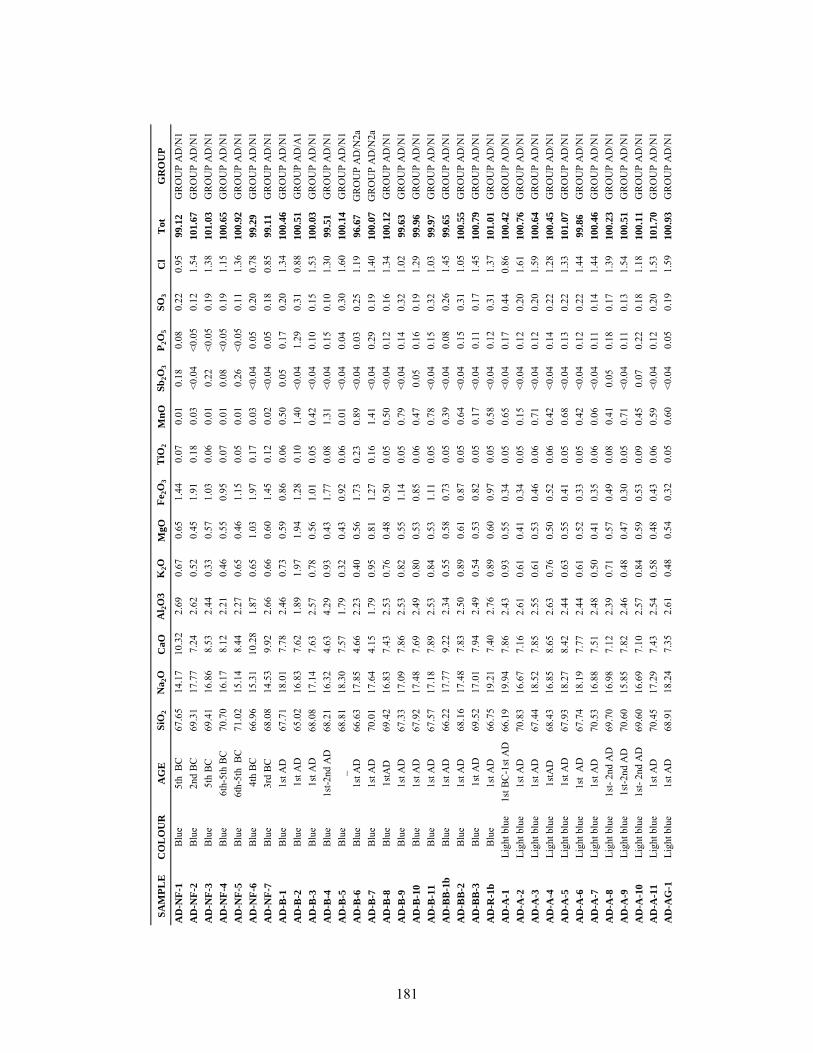
SA
MP
LE
CO
LO
UR
AG
ES
iO2
Na
2O
CaO
Al 2
O3
K2O
MgO
Fe 2
O3
TiO
2M
nO
Sb
2O
3P
2O
5S
O3
Cl
To
tG
RO
UP
AD
-NF
-1Bl
ue5t
h B
C67
.65
14.1
710
.32
2.69
0.67
0.65
1.44
0.07
0.01
0.18
0.08
0.22
0.95
99
.12
GR
OU
P A
D/N
1A
D-N
F-2
Blue
2nd
BC69
.31
17.7
77.
242.
620.
520.
451.
910.
180.
03<0
.04
<0.0
50.
121.
541
01
.67
GR
OU
P A
D/N
1A
D-N
F-3
Blue
5th
BC69
.41
16.8
68.
532.
440.
330.
571.
030.
060.
010.
22<0
.05
0.19
1.38
10
1.0
3G
RO
UP
AD
/N1
AD
-NF
-4Bl
ue6t
h-5t
h BC
70.7
016
.17
8.12
2.21
0.46
0.55
0.95
0.07
0.01
0.08
<0.0
50.
191.
151
00
.65
GR
OU
P A
D/N
1A
D-N
F-5
Blue
6th-
5th
BC
71.0
215
.14
8.44
2.27
0.65
0.46
1.15
0.05
0.01
0.26
<0.0
50.
111.
361
00
.92
GR
OU
P A
D/N
1A
D-N
F-6
Blue
4th
BC
66.9
615
.31
10.2
81.
870.
651.
031.
970.
170.
03<0
.04
0.05
0.20
0.78
99
.29
GR
OU
P A
D/N
1A
D-N
F-7
Blue
3rd
BC68
.08
14.5
39.
922.
660.
660.
601.
450.
120.
02<0
.04
0.05
0.18
0.85
99
.11
GR
OU
P A
D/N
1A
D-B
-1Bl
ue1s
t AD
67.7
118
.01
7.78
2.46
0.73
0.59
0.86
0.06
0.50
0.05
0.17
0.20
1.34
10
0.4
6G
RO
UP
AD
/N1
AD
-B-2
Blue
1st
AD
65.0
216
.83
7.62
1.89
1.97
1.94
1.28
0.10
1.40
<0.0
41.
290.
310.
881
00
.51
GR
OU
P A
D/A
1A
D-B
-3Bl
ue 1
st A
D68
.08
17.1
47.
632.
570.
780.
561.
010.
050.
42<0
.04
0.10
0.15
1.53
10
0.0
3G
RO
UP
AD
/N1
AD
-B-4
Blue
1st-2
nd A
D68
.21
16.3
24.
634.
290.
930.
431.
770.
081.
31<0
.04
0.15
0.10
1.30
99
.51
GR
OU
P A
D/N
1A
D-B
-5Bl
ue_
68.8
118
.30
7.57
1.79
0.32
0.43
0.92
0.06
0.01
<0.0
40.
040.
301.
601
00
.14
GR
OU
P A
D/N
1A
D-B
-6Bl
ue1s
t AD
66.6
317
.85
4.66
2.23
0.40
0.56
1.73
0.23
0.89
<0.0
40.
030.
251.
199
6.6
7G
RO
UP
AD
/N2a
AD
-B-7
Blue
1st A
D70
.01
17.6
44.
151.
790.
950.
811.
270.
161.
41<0
.04
0.29
0.19
1.40
10
0.0
7G
RO
UP
AD
/N2a
AD
-B-8
Blue
1stA
D69
.42
16.8
37.
432.
530.
760.
480.
500.
050.
50<0
.04
0.12
0.16
1.34
10
0.1
2G
RO
UP
AD
/N1
AD
-B-9
Blue
1st A
D67
.33
17.0
97.
862.
530.
820.
551.
140.
050.
79<0
.04
0.14
0.32
1.02
99
.63
GR
OU
P A
D/N
1A
D-B
-10
Blue
1st A
D67
.92
17.4
87.
692.
490.
800.
530.
850.
060.
470.
050.
160.
191.
299
9.9
6G
RO
UP
AD
/N1
AD
-B-1
1Bl
ue1s
t AD
67.5
717
.18
7.89
2.53
0.84
0.53
1.11
0.05
0.78
<0.0
40.
150.
321.
039
9.9
7G
RO
UP
AD
/N1
AD
-BB
-1b
Blue
1st A
D66
.22
17.7
79.
222.
340.
550.
580.
730.
050.
39<0
.04
0.08
0.26
1.45
99
.65
GR
OU
P A
D/N
1A
D-B
B-2
Blue
1st A
D68
.16
17.4
87.
832.
500.
890.
610.
870.
050.
64<0
.04
0.15
0.31
1.05
10
0.5
5G
RO
UP
AD
/N1
AD
-BB
-3Bl
ue 1
st A
D69
.52
17.0
17.
942.
490.
540.
530.
820.
050.
17<0
.04
0.11
0.17
1.45
10
0.7
9G
RO
UP
AD
/N1
AD
-R-1
bBl
ue1s
t AD
66.7
519
.21
7.40
2.76
0.89
0.60
0.97
0.05
0.58
<0.0
40.
120.
311.
371
01
.01
GR
OU
P A
D/N
1A
D-A
-1Li
ght b
lue
1st
BC
-1st
AD
66.1
919
.94
7.86
2.43
0.93
0.55
0.34
0.05
0.65
<0.0
40.
170.
440.
861
00
.42
GR
OU
P A
D/N
1A
D-A
-2Li
ght b
lue
1st A
D70
.83
16.6
77.
162.
610.
610.
410.
340.
050.
15<0
.04
0.12
0.20
1.61
10
0.7
6G
RO
UP
AD
/N1
AD
-A-3
Ligh
t blu
e1s
t AD
67.4
418
.52
7.85
2.55
0.61
0.53
0.46
0.06
0.71
<0.0
40.
120.
201.
591
00
.64
GR
OU
P A
D/N
1A
D-A
-4Li
ght b
lue
1stA
D68
.43
16.8
58.
652.
630.
760.
500.
520.
060.
42<0
.04
0.14
0.22
1.28
10
0.4
5G
RO
UP
AD
/N1
AD
-A-5
Ligh
t blu
e 1
st A
D67
.93
18.2
78.
422.
440.
630.
550.
410.
050.
68<0
.04
0.13
0.22
1.33
10
1.0
7G
RO
UP
AD
/N1
AD
-A-6
Ligh
t blu
e1s
t A
D67
.74
18.1
97.
772.
440.
610.
520.
330.
050.
42<0
.04
0.12
0.22
1.44
99
.86
GR
OU
P A
D/N
1A
D-A
-7Li
ght b
lue
1st A
D70
.53
16.8
87.
512.
480.
500.
410.
350.
060.
06<0
.04
0.11
0.14
1.44
10
0.4
6G
RO
UP
AD
/N1
AD
-A-8
Ligh
t blu
e 1
st- 2
nd A
D69
.70
16.9
87.
122.
390.
710.
570.
490.
080.
410.
050.
180.
171.
391
00
.23
GR
OU
P A
D/N
1A
D-A
-9Li
ght b
lue
1st
-2nd
AD
70.6
015
.85
7.82
2.46
0.48
0.47
0.30
0.05
0.71
<0.0
40.
110.
131.
541
00
.51
GR
OU
P A
D/N
1A
D-A
-10
Ligh
t blu
e 1
st- 2
nd A
D69
.60
16.6
97.
102.
570.
840.
590.
530.
090.
450.
070.
220.
181.
181
00
.11
GR
OU
P A
D/N
1A
D-A
-11
Ligh
t blu
e1s
t AD
70.4
517
.29
7.43
2.54
0.58
0.48
0.43
0.06
0.59
<0.0
40.
120.
201.
531
01
.70
GR
OU
P A
D/N
1A
D-A
G-1
Ligh
t blu
e1s
t AD
68.9
118
.24
7.35
2.61
0.48
0.54
0.32
0.05
0.60
<0.0
40.
050.
191.
591
00
.93
GR
OU
P A
D/N
1
181
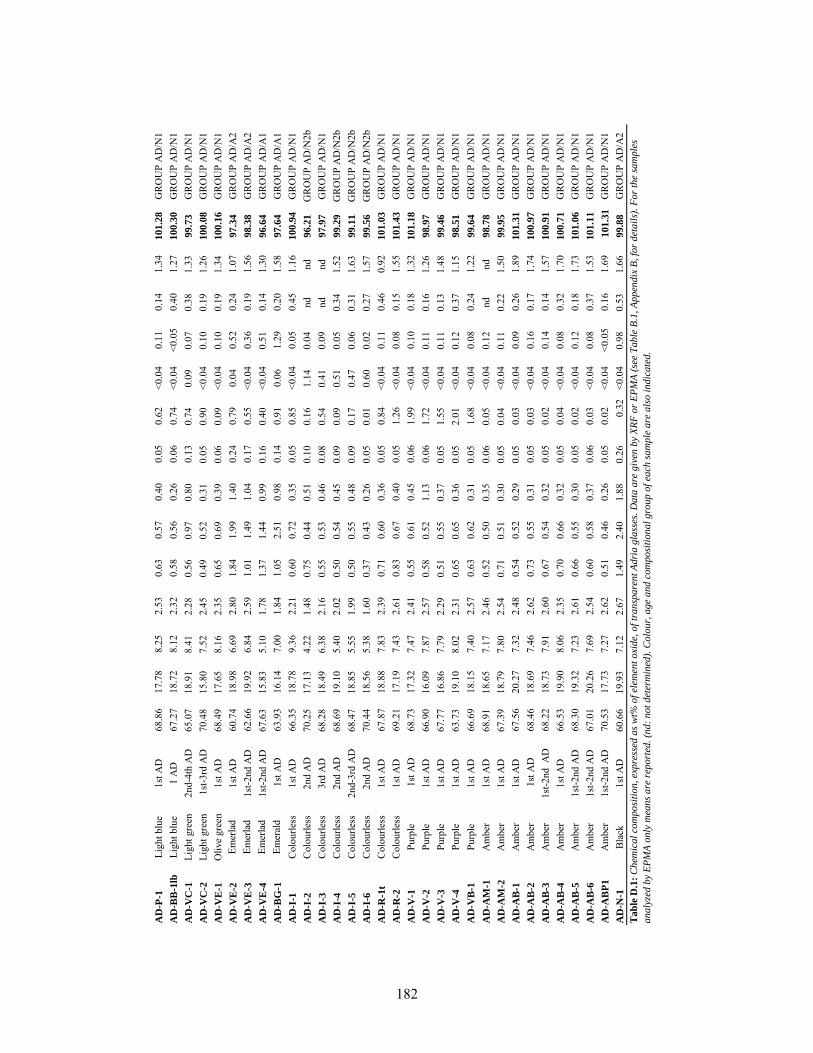
AD
-P-1
Ligh
t blu
e1s
t AD
68.8
617
.78
8.25
2.53
0.63
0.57
0.40
0.05
0.62
<0.0
40.
110.
141.
341
01
.28
GR
OU
P A
D/N
1A
D-B
B-1
lbLi
ght b
lue
1 A
D67
.27
18.7
28.
122.
320.
580.
560.
260.
060.
74<0
.04
<0.0
50.
401.
271
00
.30
GR
OU
P A
D/N
1A
D-V
C-1
Ligh
t gre
en2n
d-4t
h A
D65
.07
18.9
18.
412.
280.
560.
970.
800.
130.
740.
090.
070.
381.
339
9.7
3G
RO
UP
AD
/N1
AD
-VC
-2Li
ght g
reen
1st
-3rd
AD
70.4
815
.80
7.52
2.45
0.49
0.52
0.31
0.05
0.90
<0.0
40.
100.
191.
261
00
.08
GR
OU
P A
D/N
1A
D-V
E-1
Oliv
e gr
een
1st A
D68
.49
17.6
58.
162.
350.
650.
690.
390.
060.
09<0
.04
0.10
0.19
1.34
10
0.1
6G
RO
UP
AD
/N1
AD
-VE
-2Em
erla
d gr
een
1st A
D60
.74
18.9
86.
692.
801.
841.
991.
400.
240.
790.
040.
520.
241.
079
7.3
4G
RO
UP
AD
/A2
AD
-VE
-3Em
erla
d gr
een
1st-2
nd A
D62
.66
19.9
26.
842.
591.
011.
491.
040.
170.
55<0
.04
0.36
0.19
1.56
98
.38
GR
OU
P A
D/A
2A
D-V
E-4
Emer
lad
gree
n1s
t-2nd
AD
67.6
315
.83
5.10
1.78
1.37
1.44
0.99
0.16
0.40
<0.0
40.
510.
141.
309
6.6
4G
RO
UP
AD
/A1
AD
-BG
-1Em
eral
d gr
een
1st
AD
63.9
316
.14
7.00
1.84
1.05
2.51
0.98
0.14
0.91
0.06
1.29
0.20
1.58
97
.64
GR
OU
P A
D/A
1A
D-I
-1C
olou
rless
1st A
D66
.35
18.7
89.
362.
210.
600.
720.
350.
050.
85<0
.04
0.05
0.45
1.16
10
0.9
4G
RO
UP
AD
/N1
AD
-I-2
Col
ourle
ss2n
d A
D70
.25
17.1
34.
221.
480.
750.
440.
510.
100.
161.
140.
04nd
nd9
6.2
1G
RO
UP
AD
/N2b
AD
-I-3
Col
ourle
ss3r
d A
D68
.28
18.4
96.
382.
160.
550.
530.
460.
080.
540.
410.
09nd
nd9
7.9
7G
RO
UP
AD
/N1
AD
-I-4
Col
ourle
ss2n
d A
D68
.69
19.1
05.
402.
020.
500.
540.
450.
090.
090.
510.
050.
341.
529
9.2
9G
RO
UP
AD
/N2b
AD
-I-5
Col
ourle
ss2n
d-3r
d A
D68
.47
18.8
55.
551.
990.
500.
550.
480.
090.
170.
470.
060.
311.
639
9.1
1G
RO
UP
AD
/N2b
AD
-I-6
Col
ourle
ss2n
d A
D70
.44
18.5
65.
381.
600.
370.
430.
260.
050.
010.
600.
020.
271.
579
9.5
6G
RO
UP
AD
/N2b
AD
-R-1
tC
olou
rless
1st A
D67
.87
18.8
87.
832.
390.
710.
600.
360.
050.
84<0
.04
0.11
0.46
0.92
10
1.0
3G
RO
UP
AD
/N1
AD
-R-2
Col
ourle
ss1s
t AD
69.2
117
.19
7.43
2.61
0.83
0.67
0.40
0.05
1.26
<0.0
40.
080.
151.
551
01
.43
GR
OU
P A
D/N
1A
D-V
-1Pu
rple
1st
AD
68.7
317
.32
7.47
2.41
0.55
0.61
0.45
0.06
1.99
<0.0
40.
100.
181.
321
01
.18
GR
OU
P A
D/N
1A
D-V
-2Pu
rple
1st A
D66
.90
16.0
97.
872.
570.
580.
521.
130.
061.
72<0
.04
0.11
0.16
1.26
98
.97
GR
OU
P A
D/N
1A
D-V
-3Pu
rple
1st A
D67
.77
16.8
67.
792.
290.
510.
550.
370.
051.
55<0
.04
0.11
0.13
1.48
99
.46
GR
OU
P A
D/N
1A
D-V
-4Pu
rple
1st A
D63
.73
19.1
08.
022.
310.
650.
650.
360.
052.
01<0
.04
0.12
0.37
1.15
98
.51
GR
OU
P A
D/N
1A
D-V
B-1
Purp
le1s
t AD
66.6
918
.15
7.40
2.57
0.63
0.62
0.31
0.05
1.68
<0.0
40.
080.
241.
229
9.6
4G
RO
UP
AD
/N1
AD
-AM
-1A
mbe
r1s
t AD
68.9
118
.65
7.17
2.46
0.52
0.50
0.35
0.06
0.05
<0.0
40.
12nd
nd9
8.7
8G
RO
UP
AD
/N1
AD
-AM
-2A
mbe
r1s
t AD
67.3
918
.79
7.80
2.54
0.71
0.51
0.30
0.05
0.04
<0.0
40.
110.
221.
509
9.9
5G
RO
UP
AD
/N1
AD
-AB
-1A
mbe
r1s
t AD
67.5
620
.27
7.32
2.48
0.54
0.52
0.29
0.05
0.03
<0.0
40.
090.
261.
891
01
.31
GR
OU
P A
D/N
1A
D-A
B-2
Am
ber
1st
AD
68.4
618
.69
7.46
2.62
0.73
0.55
0.31
0.05
0.03
<0.0
40.
160.
171.
741
00
.97
GR
OU
P A
D/N
1A
D-A
B-3
Am
ber
1st-2
nd A
D68
.22
18.7
37.
912.
600.
670.
540.
320.
050.
02<0
.04
0.14
0.14
1.57
10
0.9
1G
RO
UP
AD
/N1
AD
-AB
-4A
mbe
r1s
t AD
66.5
319
.90
8.06
2.35
0.70
0.66
0.32
0.05
0.04
<0.0
40.
080.
321.
701
00
.71
GR
OU
P A
D/N
1A
D-A
B-5
Am
ber
1st-2
nd A
D68
.30
19.3
27.
232.
610.
660.
550.
300.
050.
02<0
.04
0.12
0.18
1.73
10
1.0
6G
RO
UP
AD
/N1
AD
-AB
-6A
mbe
r1s
t-2nd
AD
67.0
120
.26
7.69
2.54
0.60
0.58
0.37
0.06
0.03
<0.0
40.
080.
371.
531
01
.11
GR
OU
P A
D/N
1A
D-A
BP
1A
mbe
r1s
t-2nd
AD
70.5
317
.73
7.27
2.62
0.51
0.46
0.26
0.05
0.02
<0.0
4<0
.05
0.16
1.69
10
1.3
1G
RO
UP
AD
/N1
AD
-N-1
Blac
k1s
t AD
60.6
619
.93
7.12
2.67
1.49
2.40
1.88
0.26
0.32
<0.0
40.
980.
531.
669
9.8
8G
RO
UP
AD
/A2
Tab
le D
.1:
Chem
ical
com
posi
tion, ex
pre
ssed
as
wt%
of
elem
ent
oxi
de,
of
transp
are
nt
Adri
a g
lass
es.
Data
are
giv
en b
y X
RF
or
EP
MA
(se
e T
ab
le B
.1, A
pp
end
ix B
, fo
r d
eta
ils)
. F
or
the
sam
ple
s
analy
zed b
y E
PM
A o
nly
mea
ns
are
rep
ort
ed. (n
d:
not
det
erm
ined
). C
olo
ur,
age
and c
om
posi
tional
gro
up o
f ea
ch s
am
ple
are
als
o i
ndic
ate
d.
182
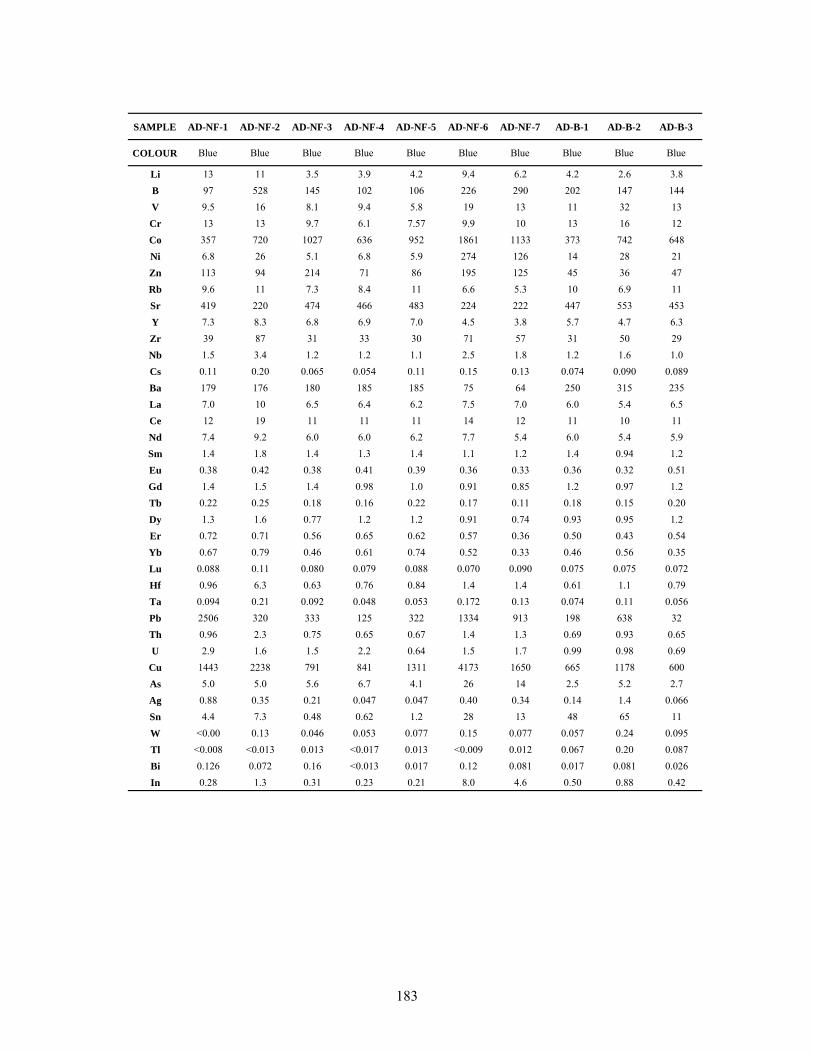
SAMPLE AD-NF-1 AD-NF-2 AD-NF-3 AD-NF-4 AD-NF-5 AD-NF-6 AD-NF-7 AD-B-1 AD-B-2 AD-B-3
COLOUR Blue Blue Blue Blue Blue Blue Blue Blue Blue Blue
Li 13 11 3.5 3.9 4.2 9.4 6.2 4.2 2.6 3.8B 97 528 145 102 106 226 290 202 147 144V 9.5 16 8.1 9.4 5.8 19 13 11 32 13Cr 13 13 9.7 6.1 7.57 9.9 10 13 16 12Co 357 720 1027 636 952 1861 1133 373 742 648Ni 6.8 26 5.1 6.8 5.9 274 126 14 28 21Zn 113 94 214 71 86 195 125 45 36 47Rb 9.6 11 7.3 8.4 11 6.6 5.3 10 6.9 11Sr 419 220 474 466 483 224 222 447 553 453Y 7.3 8.3 6.8 6.9 7.0 4.5 3.8 5.7 4.7 6.3Zr 39 87 31 33 30 71 57 31 50 29Nb 1.5 3.4 1.2 1.2 1.1 2.5 1.8 1.2 1.6 1.0Cs 0.11 0.20 0.065 0.054 0.11 0.15 0.13 0.074 0.090 0.089Ba 179 176 180 185 185 75 64 250 315 235La 7.0 10 6.5 6.4 6.2 7.5 7.0 6.0 5.4 6.5Ce 12 19 11 11 11 14 12 11 10 11Nd 7.4 9.2 6.0 6.0 6.2 7.7 5.4 6.0 5.4 5.9Sm 1.4 1.8 1.4 1.3 1.4 1.1 1.2 1.4 0.94 1.2Eu 0.38 0.42 0.38 0.41 0.39 0.36 0.33 0.36 0.32 0.51Gd 1.4 1.5 1.4 0.98 1.0 0.91 0.85 1.2 0.97 1.2Tb 0.22 0.25 0.18 0.16 0.22 0.17 0.11 0.18 0.15 0.20Dy 1.3 1.6 0.77 1.2 1.2 0.91 0.74 0.93 0.95 1.2Er 0.72 0.71 0.56 0.65 0.62 0.57 0.36 0.50 0.43 0.54Yb 0.67 0.79 0.46 0.61 0.74 0.52 0.33 0.46 0.56 0.35Lu 0.088 0.11 0.080 0.079 0.088 0.070 0.090 0.075 0.075 0.072Hf 0.96 6.3 0.63 0.76 0.84 1.4 1.4 0.61 1.1 0.79Ta 0.094 0.21 0.092 0.048 0.053 0.172 0.13 0.074 0.11 0.056Pb 2506 320 333 125 322 1334 913 198 638 32Th 0.96 2.3 0.75 0.65 0.67 1.4 1.3 0.69 0.93 0.65U 2.9 1.6 1.5 2.2 0.64 1.5 1.7 0.99 0.98 0.69
Cu 1443 2238 791 841 1311 4173 1650 665 1178 600As 5.0 5.0 5.6 6.7 4.1 26 14 2.5 5.2 2.7Ag 0.88 0.35 0.21 0.047 0.047 0.40 0.34 0.14 1.4 0.066Sn 4.4 7.3 0.48 0.62 1.2 28 13 48 65 11W <0.00 0.13 0.046 0.053 0.077 0.15 0.077 0.057 0.24 0.095Tl <0.008 <0.013 0.013 <0.017 0.013 <0.009 0.012 0.067 0.20 0.087Bi 0.126 0.072 0.16 <0.013 0.017 0.12 0.081 0.017 0.081 0.026In 0.28 1.3 0.31 0.23 0.21 8.0 4.6 0.50 0.88 0.42
183
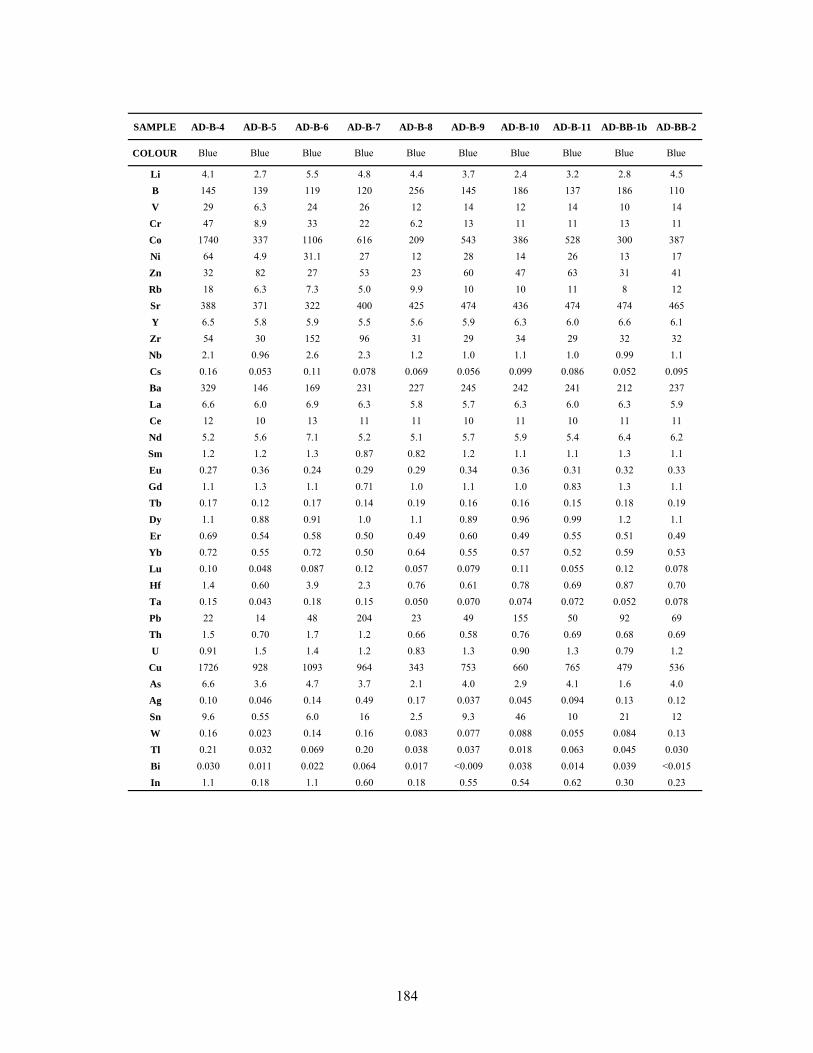
SAMPLE AD-B-4 AD-B-5 AD-B-6 AD-B-7 AD-B-8 AD-B-9 AD-B-10 AD-B-11 AD-BB-1b AD-BB-2
COLOUR Blue Blue Blue Blue Blue Blue Blue Blue Blue Blue
Li 4.1 2.7 5.5 4.8 4.4 3.7 2.4 3.2 2.8 4.5B 145 139 119 120 256 145 186 137 186 110V 29 6.3 24 26 12 14 12 14 10 14Cr 47 8.9 33 22 6.2 13 11 11 13 11Co 1740 337 1106 616 209 543 386 528 300 387Ni 64 4.9 31.1 27 12 28 14 26 13 17Zn 32 82 27 53 23 60 47 63 31 41Rb 18 6.3 7.3 5.0 9.9 10 10 11 8 12Sr 388 371 322 400 425 474 436 474 474 465Y 6.5 5.8 5.9 5.5 5.6 5.9 6.3 6.0 6.6 6.1Zr 54 30 152 96 31 29 34 29 32 32Nb 2.1 0.96 2.6 2.3 1.2 1.0 1.1 1.0 0.99 1.1Cs 0.16 0.053 0.11 0.078 0.069 0.056 0.099 0.086 0.052 0.095Ba 329 146 169 231 227 245 242 241 212 237La 6.6 6.0 6.9 6.3 5.8 5.7 6.3 6.0 6.3 5.9Ce 12 10 13 11 11 10 11 10 11 11Nd 5.2 5.6 7.1 5.2 5.1 5.7 5.9 5.4 6.4 6.2Sm 1.2 1.2 1.3 0.87 0.82 1.2 1.1 1.1 1.3 1.1Eu 0.27 0.36 0.24 0.29 0.29 0.34 0.36 0.31 0.32 0.33Gd 1.1 1.3 1.1 0.71 1.0 1.1 1.0 0.83 1.3 1.1Tb 0.17 0.12 0.17 0.14 0.19 0.16 0.16 0.15 0.18 0.19Dy 1.1 0.88 0.91 1.0 1.1 0.89 0.96 0.99 1.2 1.1Er 0.69 0.54 0.58 0.50 0.49 0.60 0.49 0.55 0.51 0.49Yb 0.72 0.55 0.72 0.50 0.64 0.55 0.57 0.52 0.59 0.53Lu 0.10 0.048 0.087 0.12 0.057 0.079 0.11 0.055 0.12 0.078Hf 1.4 0.60 3.9 2.3 0.76 0.61 0.78 0.69 0.87 0.70Ta 0.15 0.043 0.18 0.15 0.050 0.070 0.074 0.072 0.052 0.078Pb 22 14 48 204 23 49 155 50 92 69Th 1.5 0.70 1.7 1.2 0.66 0.58 0.76 0.69 0.68 0.69U 0.91 1.5 1.4 1.2 0.83 1.3 0.90 1.3 0.79 1.2
Cu 1726 928 1093 964 343 753 660 765 479 536As 6.6 3.6 4.7 3.7 2.1 4.0 2.9 4.1 1.6 4.0Ag 0.10 0.046 0.14 0.49 0.17 0.037 0.045 0.094 0.13 0.12Sn 9.6 0.55 6.0 16 2.5 9.3 46 10 21 12W 0.16 0.023 0.14 0.16 0.083 0.077 0.088 0.055 0.084 0.13Tl 0.21 0.032 0.069 0.20 0.038 0.037 0.018 0.063 0.045 0.030Bi 0.030 0.011 0.022 0.064 0.017 <0.009 0.038 0.014 0.039 <0.015In 1.1 0.18 1.1 0.60 0.18 0.55 0.54 0.62 0.30 0.23
184
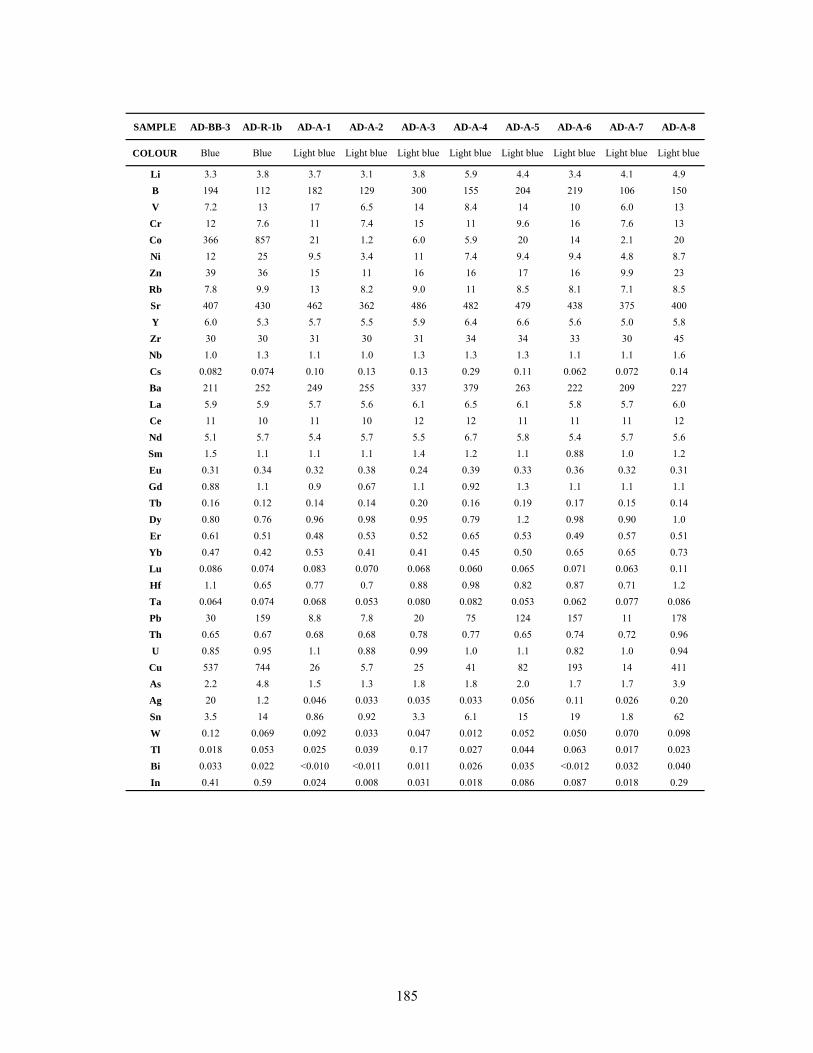
SAMPLE AD-BB-3 AD-R-1b AD-A-1 AD-A-2 AD-A-3 AD-A-4 AD-A-5 AD-A-6 AD-A-7 AD-A-8
COLOUR Blue Blue Light blue Light blue Light blue Light blue Light blue Light blue Light blue Light blue
Li 3.3 3.8 3.7 3.1 3.8 5.9 4.4 3.4 4.1 4.9B 194 112 182 129 300 155 204 219 106 150V 7.2 13 17 6.5 14 8.4 14 10 6.0 13Cr 12 7.6 11 7.4 15 11 9.6 16 7.6 13Co 366 857 21 1.2 6.0 5.9 20 14 2.1 20Ni 12 25 9.5 3.4 11 7.4 9.4 9.4 4.8 8.7Zn 39 36 15 11 16 16 17 16 9.9 23Rb 7.8 9.9 13 8.2 9.0 11 8.5 8.1 7.1 8.5Sr 407 430 462 362 486 482 479 438 375 400Y 6.0 5.3 5.7 5.5 5.9 6.4 6.6 5.6 5.0 5.8Zr 30 30 31 30 31 34 34 33 30 45Nb 1.0 1.3 1.1 1.0 1.3 1.3 1.3 1.1 1.1 1.6Cs 0.082 0.074 0.10 0.13 0.13 0.29 0.11 0.062 0.072 0.14Ba 211 252 249 255 337 379 263 222 209 227La 5.9 5.9 5.7 5.6 6.1 6.5 6.1 5.8 5.7 6.0Ce 11 10 11 10 12 12 11 11 11 12Nd 5.1 5.7 5.4 5.7 5.5 6.7 5.8 5.4 5.7 5.6Sm 1.5 1.1 1.1 1.1 1.4 1.2 1.1 0.88 1.0 1.2Eu 0.31 0.34 0.32 0.38 0.24 0.39 0.33 0.36 0.32 0.31Gd 0.88 1.1 0.9 0.67 1.1 0.92 1.3 1.1 1.1 1.1Tb 0.16 0.12 0.14 0.14 0.20 0.16 0.19 0.17 0.15 0.14Dy 0.80 0.76 0.96 0.98 0.95 0.79 1.2 0.98 0.90 1.0Er 0.61 0.51 0.48 0.53 0.52 0.65 0.53 0.49 0.57 0.51Yb 0.47 0.42 0.53 0.41 0.41 0.45 0.50 0.65 0.65 0.73Lu 0.086 0.074 0.083 0.070 0.068 0.060 0.065 0.071 0.063 0.11Hf 1.1 0.65 0.77 0.7 0.88 0.98 0.82 0.87 0.71 1.2Ta 0.064 0.074 0.068 0.053 0.080 0.082 0.053 0.062 0.077 0.086Pb 30 159 8.8 7.8 20 75 124 157 11 178Th 0.65 0.67 0.68 0.68 0.78 0.77 0.65 0.74 0.72 0.96U 0.85 0.95 1.1 0.88 0.99 1.0 1.1 0.82 1.0 0.94
Cu 537 744 26 5.7 25 41 82 193 14 411As 2.2 4.8 1.5 1.3 1.8 1.8 2.0 1.7 1.7 3.9Ag 20 1.2 0.046 0.033 0.035 0.033 0.056 0.11 0.026 0.20Sn 3.5 14 0.86 0.92 3.3 6.1 15 19 1.8 62W 0.12 0.069 0.092 0.033 0.047 0.012 0.052 0.050 0.070 0.098Tl 0.018 0.053 0.025 0.039 0.17 0.027 0.044 0.063 0.017 0.023Bi 0.033 0.022 <0.010 <0.011 0.011 0.026 0.035 <0.012 0.032 0.040In 0.41 0.59 0.024 0.008 0.031 0.018 0.086 0.087 0.018 0.29
185
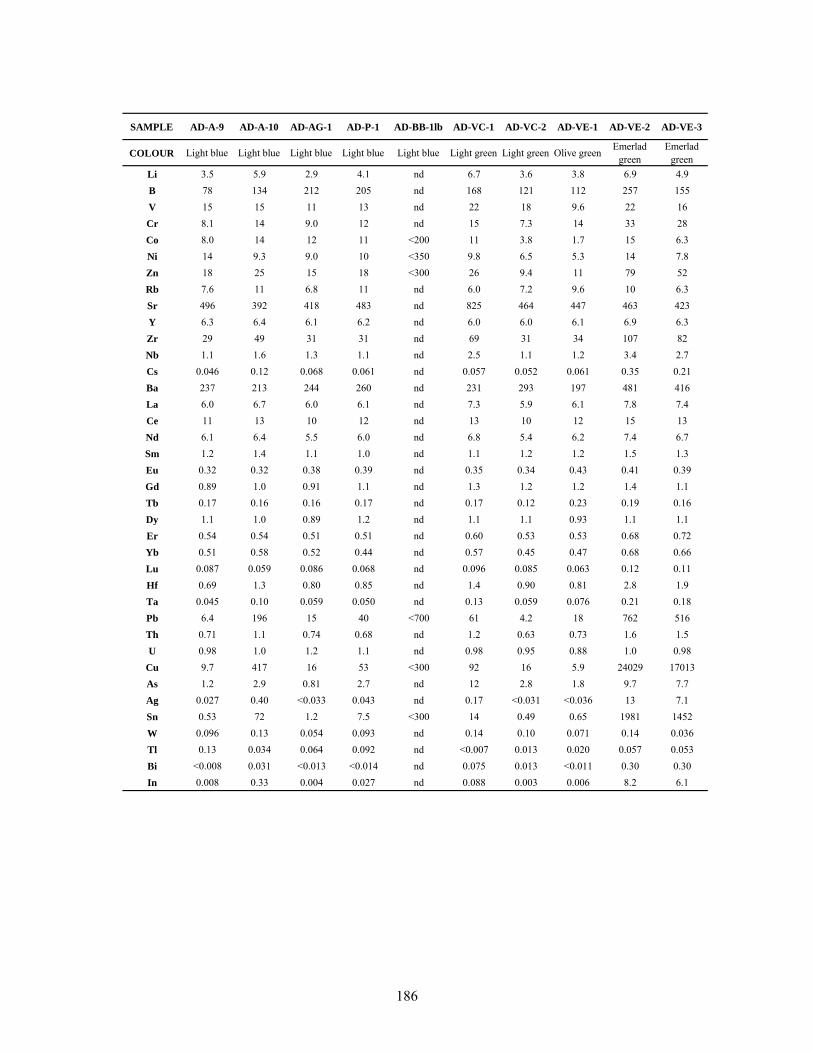
SAMPLE AD-A-9 AD-A-10 AD-AG-1 AD-P-1 AD-BB-1lb AD-VC-1 AD-VC-2 AD-VE-1 AD-VE-2 AD-VE-3
COLOUR Light blue Light blue Light blue Light blue Light blue Light green Light green Olive green Emerlad green
Emerlad green
Li 3.5 5.9 2.9 4.1 nd 6.7 3.6 3.8 6.9 4.9B 78 134 212 205 nd 168 121 112 257 155V 15 15 11 13 nd 22 18 9.6 22 16Cr 8.1 14 9.0 12 nd 15 7.3 14 33 28Co 8.0 14 12 11 <200 11 3.8 1.7 15 6.3Ni 14 9.3 9.0 10 <350 9.8 6.5 5.3 14 7.8Zn 18 25 15 18 <300 26 9.4 11 79 52Rb 7.6 11 6.8 11 nd 6.0 7.2 9.6 10 6.3Sr 496 392 418 483 nd 825 464 447 463 423Y 6.3 6.4 6.1 6.2 nd 6.0 6.0 6.1 6.9 6.3Zr 29 49 31 31 nd 69 31 34 107 82Nb 1.1 1.6 1.3 1.1 nd 2.5 1.1 1.2 3.4 2.7Cs 0.046 0.12 0.068 0.061 nd 0.057 0.052 0.061 0.35 0.21Ba 237 213 244 260 nd 231 293 197 481 416La 6.0 6.7 6.0 6.1 nd 7.3 5.9 6.1 7.8 7.4Ce 11 13 10 12 nd 13 10 12 15 13Nd 6.1 6.4 5.5 6.0 nd 6.8 5.4 6.2 7.4 6.7Sm 1.2 1.4 1.1 1.0 nd 1.1 1.2 1.2 1.5 1.3Eu 0.32 0.32 0.38 0.39 nd 0.35 0.34 0.43 0.41 0.39Gd 0.89 1.0 0.91 1.1 nd 1.3 1.2 1.2 1.4 1.1Tb 0.17 0.16 0.16 0.17 nd 0.17 0.12 0.23 0.19 0.16Dy 1.1 1.0 0.89 1.2 nd 1.1 1.1 0.93 1.1 1.1Er 0.54 0.54 0.51 0.51 nd 0.60 0.53 0.53 0.68 0.72Yb 0.51 0.58 0.52 0.44 nd 0.57 0.45 0.47 0.68 0.66Lu 0.087 0.059 0.086 0.068 nd 0.096 0.085 0.063 0.12 0.11Hf 0.69 1.3 0.80 0.85 nd 1.4 0.90 0.81 2.8 1.9Ta 0.045 0.10 0.059 0.050 nd 0.13 0.059 0.076 0.21 0.18Pb 6.4 196 15 40 <700 61 4.2 18 762 516Th 0.71 1.1 0.74 0.68 nd 1.2 0.63 0.73 1.6 1.5U 0.98 1.0 1.2 1.1 nd 0.98 0.95 0.88 1.0 0.98
Cu 9.7 417 16 53 <300 92 16 5.9 24029 17013As 1.2 2.9 0.81 2.7 nd 12 2.8 1.8 9.7 7.7Ag 0.027 0.40 <0.033 0.043 nd 0.17 <0.031 <0.036 13 7.1Sn 0.53 72 1.2 7.5 <300 14 0.49 0.65 1981 1452W 0.096 0.13 0.054 0.093 nd 0.14 0.10 0.071 0.14 0.036Tl 0.13 0.034 0.064 0.092 nd <0.007 0.013 0.020 0.057 0.053Bi <0.008 0.031 <0.013 <0.014 nd 0.075 0.013 <0.011 0.30 0.30In 0.008 0.33 0.004 0.027 nd 0.088 0.003 0.006 8.2 6.1
186
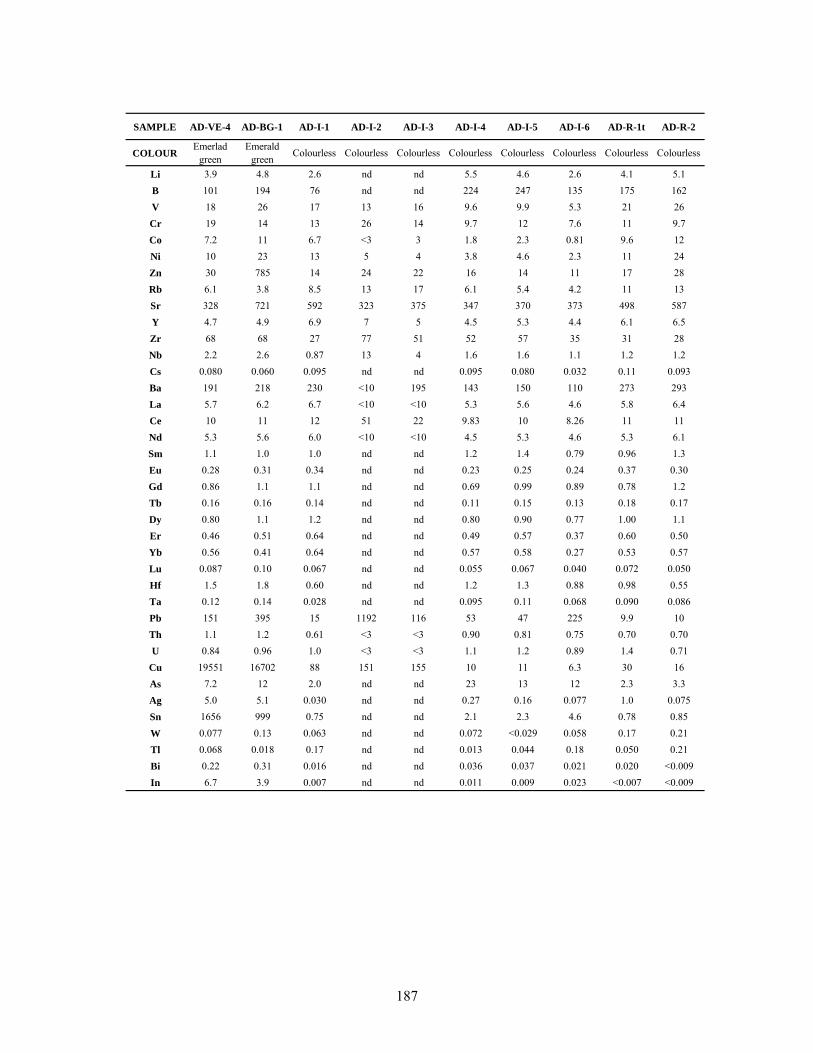
SAMPLE AD-VE-4 AD-BG-1 AD-I-1 AD-I-2 AD-I-3 AD-I-4 AD-I-5 AD-I-6 AD-R-1t AD-R-2
COLOUREmerlad
greenEmerald
green Colourless Colourless Colourless Colourless Colourless Colourless Colourless Colourless
Li 3.9 4.8 2.6 nd nd 5.5 4.6 2.6 4.1 5.1B 101 194 76 nd nd 224 247 135 175 162V 18 26 17 13 16 9.6 9.9 5.3 21 26Cr 19 14 13 26 14 9.7 12 7.6 11 9.7Co 7.2 11 6.7 <3 3 1.8 2.3 0.81 9.6 12Ni 10 23 13 5 4 3.8 4.6 2.3 11 24Zn 30 785 14 24 22 16 14 11 17 28Rb 6.1 3.8 8.5 13 17 6.1 5.4 4.2 11 13Sr 328 721 592 323 375 347 370 373 498 587Y 4.7 4.9 6.9 7 5 4.5 5.3 4.4 6.1 6.5Zr 68 68 27 77 51 52 57 35 31 28Nb 2.2 2.6 0.87 13 4 1.6 1.6 1.1 1.2 1.2Cs 0.080 0.060 0.095 nd nd 0.095 0.080 0.032 0.11 0.093Ba 191 218 230 <10 195 143 150 110 273 293La 5.7 6.2 6.7 <10 <10 5.3 5.6 4.6 5.8 6.4Ce 10 11 12 51 22 9.83 10 8.26 11 11Nd 5.3 5.6 6.0 <10 <10 4.5 5.3 4.6 5.3 6.1Sm 1.1 1.0 1.0 nd nd 1.2 1.4 0.79 0.96 1.3Eu 0.28 0.31 0.34 nd nd 0.23 0.25 0.24 0.37 0.30Gd 0.86 1.1 1.1 nd nd 0.69 0.99 0.89 0.78 1.2Tb 0.16 0.16 0.14 nd nd 0.11 0.15 0.13 0.18 0.17Dy 0.80 1.1 1.2 nd nd 0.80 0.90 0.77 1.00 1.1Er 0.46 0.51 0.64 nd nd 0.49 0.57 0.37 0.60 0.50Yb 0.56 0.41 0.64 nd nd 0.57 0.58 0.27 0.53 0.57Lu 0.087 0.10 0.067 nd nd 0.055 0.067 0.040 0.072 0.050Hf 1.5 1.8 0.60 nd nd 1.2 1.3 0.88 0.98 0.55Ta 0.12 0.14 0.028 nd nd 0.095 0.11 0.068 0.090 0.086Pb 151 395 15 1192 116 53 47 225 9.9 10Th 1.1 1.2 0.61 <3 <3 0.90 0.81 0.75 0.70 0.70U 0.84 0.96 1.0 <3 <3 1.1 1.2 0.89 1.4 0.71
Cu 19551 16702 88 151 155 10 11 6.3 30 16As 7.2 12 2.0 nd nd 23 13 12 2.3 3.3Ag 5.0 5.1 0.030 nd nd 0.27 0.16 0.077 1.0 0.075Sn 1656 999 0.75 nd nd 2.1 2.3 4.6 0.78 0.85W 0.077 0.13 0.063 nd nd 0.072 <0.029 0.058 0.17 0.21Tl 0.068 0.018 0.17 nd nd 0.013 0.044 0.18 0.050 0.21Bi 0.22 0.31 0.016 nd nd 0.036 0.037 0.021 0.020 <0.009In 6.7 3.9 0.007 nd nd 0.011 0.009 0.023 <0.007 <0.009
187
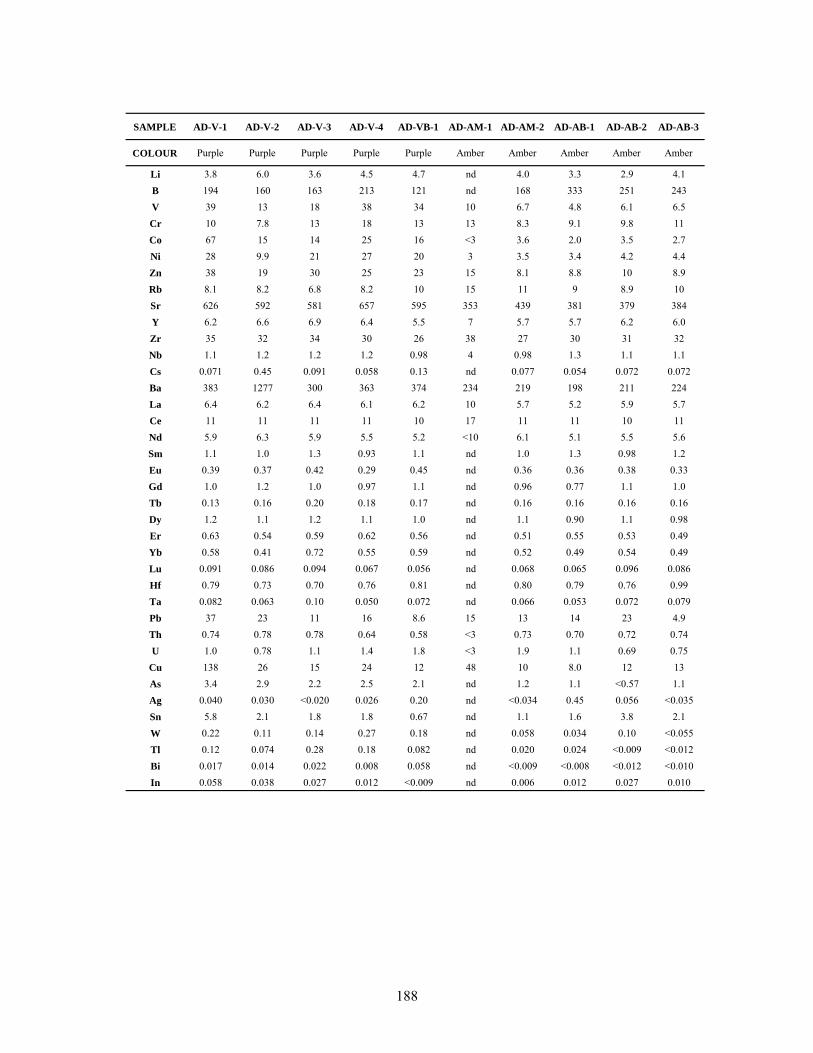
SAMPLE AD-V-1 AD-V-2 AD-V-3 AD-V-4 AD-VB-1 AD-AM-1 AD-AM-2 AD-AB-1 AD-AB-2 AD-AB-3
COLOUR Purple Purple Purple Purple Purple Amber Amber Amber Amber Amber
Li 3.8 6.0 3.6 4.5 4.7 nd 4.0 3.3 2.9 4.1B 194 160 163 213 121 nd 168 333 251 243V 39 13 18 38 34 10 6.7 4.8 6.1 6.5Cr 10 7.8 13 18 13 13 8.3 9.1 9.8 11Co 67 15 14 25 16 <3 3.6 2.0 3.5 2.7Ni 28 9.9 21 27 20 3 3.5 3.4 4.2 4.4Zn 38 19 30 25 23 15 8.1 8.8 10 8.9Rb 8.1 8.2 6.8 8.2 10 15 11 9 8.9 10Sr 626 592 581 657 595 353 439 381 379 384Y 6.2 6.6 6.9 6.4 5.5 7 5.7 5.7 6.2 6.0Zr 35 32 34 30 26 38 27 30 31 32Nb 1.1 1.2 1.2 1.2 0.98 4 0.98 1.3 1.1 1.1Cs 0.071 0.45 0.091 0.058 0.13 nd 0.077 0.054 0.072 0.072Ba 383 1277 300 363 374 234 219 198 211 224La 6.4 6.2 6.4 6.1 6.2 10 5.7 5.2 5.9 5.7Ce 11 11 11 11 10 17 11 11 10 11Nd 5.9 6.3 5.9 5.5 5.2 <10 6.1 5.1 5.5 5.6Sm 1.1 1.0 1.3 0.93 1.1 nd 1.0 1.3 0.98 1.2Eu 0.39 0.37 0.42 0.29 0.45 nd 0.36 0.36 0.38 0.33Gd 1.0 1.2 1.0 0.97 1.1 nd 0.96 0.77 1.1 1.0Tb 0.13 0.16 0.20 0.18 0.17 nd 0.16 0.16 0.16 0.16Dy 1.2 1.1 1.2 1.1 1.0 nd 1.1 0.90 1.1 0.98Er 0.63 0.54 0.59 0.62 0.56 nd 0.51 0.55 0.53 0.49Yb 0.58 0.41 0.72 0.55 0.59 nd 0.52 0.49 0.54 0.49Lu 0.091 0.086 0.094 0.067 0.056 nd 0.068 0.065 0.096 0.086Hf 0.79 0.73 0.70 0.76 0.81 nd 0.80 0.79 0.76 0.99Ta 0.082 0.063 0.10 0.050 0.072 nd 0.066 0.053 0.072 0.079Pb 37 23 11 16 8.6 15 13 14 23 4.9Th 0.74 0.78 0.78 0.64 0.58 <3 0.73 0.70 0.72 0.74U 1.0 0.78 1.1 1.4 1.8 <3 1.9 1.1 0.69 0.75
Cu 138 26 15 24 12 48 10 8.0 12 13As 3.4 2.9 2.2 2.5 2.1 nd 1.2 1.1 <0.57 1.1Ag 0.040 0.030 <0.020 0.026 0.20 nd <0.034 0.45 0.056 <0.035Sn 5.8 2.1 1.8 1.8 0.67 nd 1.1 1.6 3.8 2.1W 0.22 0.11 0.14 0.27 0.18 nd 0.058 0.034 0.10 <0.055Tl 0.12 0.074 0.28 0.18 0.082 nd 0.020 0.024 <0.009 <0.012Bi 0.017 0.014 0.022 0.008 0.058 nd <0.009 <0.008 <0.012 <0.010In 0.058 0.038 0.027 0.012 <0.009 nd 0.006 0.012 0.027 0.010
188
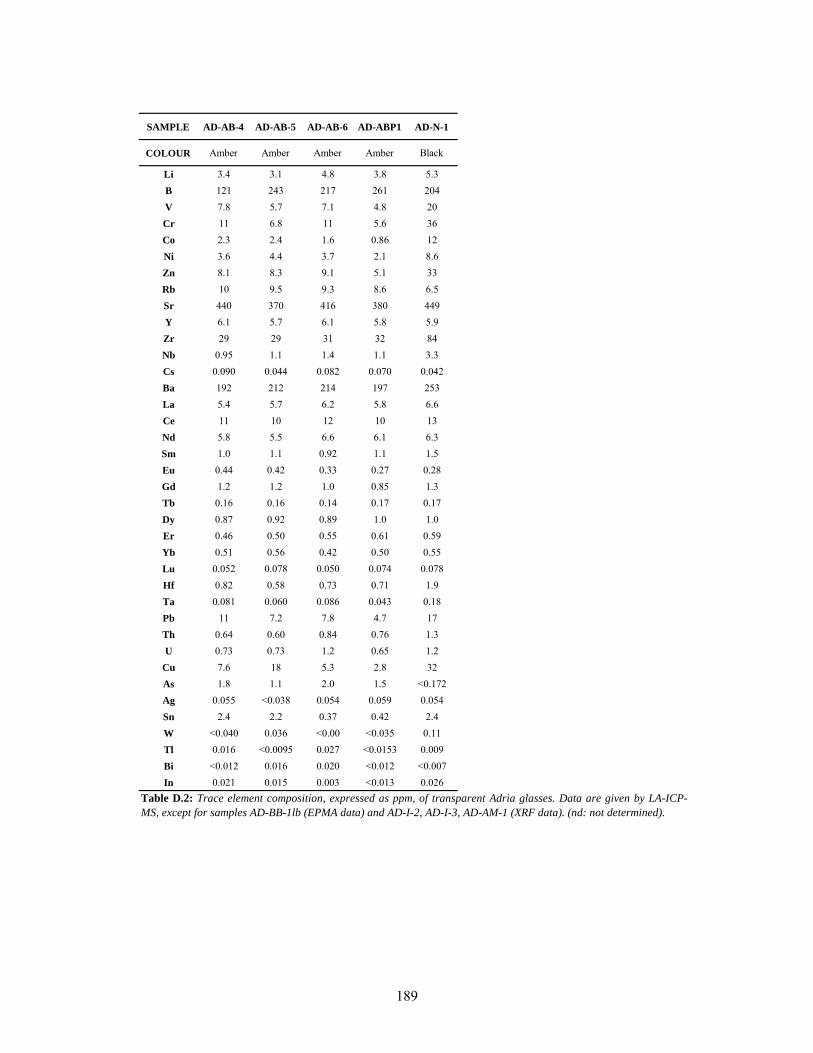
SAMPLE AD-AB-4 AD-AB-5 AD-AB-6 AD-ABP1 AD-N-1
COLOUR Amber Amber Amber Amber Black
Li 3.4 3.1 4.8 3.8 5.3B 121 243 217 261 204V 7.8 5.7 7.1 4.8 20Cr 11 6.8 11 5.6 36Co 2.3 2.4 1.6 0.86 12Ni 3.6 4.4 3.7 2.1 8.6Zn 8.1 8.3 9.1 5.1 33Rb 10 9.5 9.3 8.6 6.5Sr 440 370 416 380 449Y 6.1 5.7 6.1 5.8 5.9Zr 29 29 31 32 84Nb 0.95 1.1 1.4 1.1 3.3Cs 0.090 0.044 0.082 0.070 0.042Ba 192 212 214 197 253La 5.4 5.7 6.2 5.8 6.6Ce 11 10 12 10 13Nd 5.8 5.5 6.6 6.1 6.3Sm 1.0 1.1 0.92 1.1 1.5Eu 0.44 0.42 0.33 0.27 0.28Gd 1.2 1.2 1.0 0.85 1.3Tb 0.16 0.16 0.14 0.17 0.17Dy 0.87 0.92 0.89 1.0 1.0Er 0.46 0.50 0.55 0.61 0.59Yb 0.51 0.56 0.42 0.50 0.55Lu 0.052 0.078 0.050 0.074 0.078Hf 0.82 0.58 0.73 0.71 1.9Ta 0.081 0.060 0.086 0.043 0.18Pb 11 7.2 7.8 4.7 17Th 0.64 0.60 0.84 0.76 1.3U 0.73 0.73 1.2 0.65 1.2
Cu 7.6 18 5.3 2.8 32As 1.8 1.1 2.0 1.5 <0.172Ag 0.055 <0.038 0.054 0.059 0.054Sn 2.4 2.2 0.37 0.42 2.4W <0.040 0.036 <0.00 <0.035 0.11Tl 0.016 <0.0095 0.027 <0.0153 0.009Bi <0.012 0.016 0.020 <0.012 <0.007In 0.021 0.015 0.003 <0.013 0.026
Table D.2: Trace element composition, expressed as ppm, of transparent Adria glasses. Data are given by LA-ICP-
MS, except for samples AD-BB-1lb (EPMA data) and AD-I-2, AD-I-3, AD-AM-1 (XRF data). (nd: not determined).
189
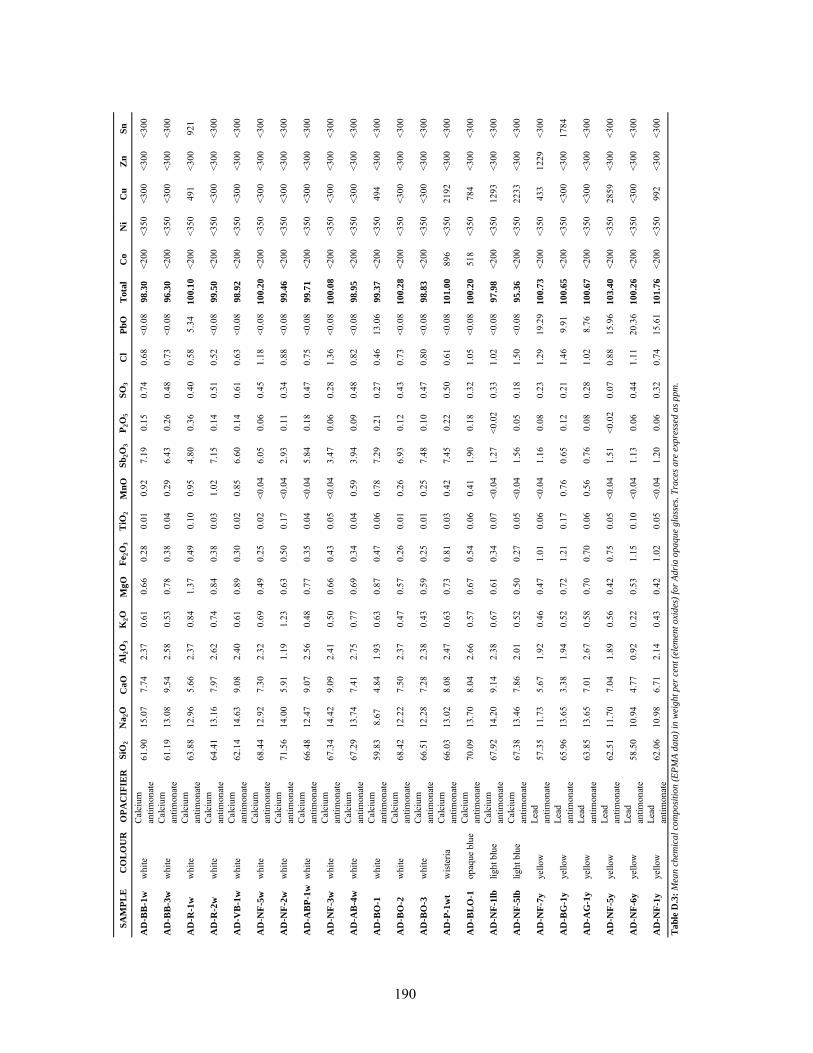
SA
MP
LE
CO
LO
UR
OP
AC
IFIE
RS
iO2
Na
2O
Ca
OA
l 2O
3K
2O
Mg
OF
e 2O
3T
iO2
Mn
OS
b2O
3P
2O
5S
O3
Cl
Pb
OT
ota
lC
oN
iC
uZ
nS
n
AD
-BB
-1w
whi
teC
alci
um
antim
onat
e61
.90
15.0
77.
742.
370.
610.
660.
280.
010.
927.
190.
150.
740.
68<0
.08
98
.30
<200
<350
<300
<300
<300
AD
-BB
-3w
whi
teC
alci
um
antim
onat
e61
.19
13.0
89.
542.
580.
530.
780.
380.
040.
296.
430.
260.
480.
73<0
.08
96
.30
<200
<350
<300
<300
<300
AD
-R-1
ww
hite
Cal
cium
an
timon
ate
63.8
812
.96
5.66
2.37
0.84
1.37
0.49
0.10
0.95
4.80
0.36
0.40
0.58
5.34
10
0.1
0<2
00<3
5049
1<3
0092
1
AD
-R-2
ww
hite
Cal
cium
an
timon
ate
64.4
113
.16
7.97
2.62
0.74
0.84
0.38
0.03
1.02
7.15
0.14
0.51
0.52
<0.0
89
9.5
0<2
00<3
50<3
00<3
00<3
00
AD
-VB
-1w
whi
teC
alci
um
antim
onat
e62
.14
14.6
39.
082.
400.
610.
890.
300.
020.
856.
600.
140.
610.
63<0
.08
98
.92
<200
<350
<300
<300
<300
AD
-NF
-5w
whi
teC
alci
um
antim
onat
e68
.44
12.9
27.
302.
320.
690.
490.
250.
02<0
.04
6.05
0.06
0.45
1.18
<0.0
81
00
.20
<200
<350
<300
<300
<300
AD
-NF
-2w
whi
teC
alci
um
antim
onat
e71
.56
14.0
05.
911.
191.
230.
630.
500.
17<0
.04
2.93
0.11
0.34
0.88
<0.0
89
9.4
6<2
00<3
50<3
00<3
00<3
00
AD
-AB
P-1
ww
hite
Cal
cium
an
timon
ate
66.4
812
.47
9.07
2.56
0.48
0.77
0.35
0.04
<0.0
45.
840.
180.
470.
75<0
.08
99
.71
<200
<350
<300
<300
<300
AD
-NF
-3w
whi
teC
alci
um
antim
onat
e67
.34
14.4
29.
092.
410.
500.
660.
430.
05<0
.04
3.47
0.06
0.28
1.36
<0.0
81
00
.08
<200
<350
<300
<300
<300
AD
-AB
-4w
whi
teC
alci
um
antim
onat
e67
.29
13.7
47.
412.
750.
770.
690.
340.
040.
593.
940.
090.
480.
82<0
.08
98
.95
<200
<350
<300
<300
<300
AD
-BO
-1w
hite
Cal
cium
an
timon
ate
59.8
38.
674.
841.
930.
630.
870.
470.
060.
787.
290.
210.
270.
4613
.06
99
.37
<200
<350
494
<300
<300
AD
-BO
-2w
hite
Cal
cium
an
timon
ate
68.4
212
.22
7.50
2.37
0.47
0.57
0.26
0.01
0.26
6.93
0.12
0.43
0.73
<0.0
81
00
.28
<200
<350
<300
<300
<300
AD
-BO
-3w
hite
Cal
cium
an
timon
ate
66.5
112
.28
7.28
2.38
0.43
0.59
0.25
0.01
0.25
7.48
0.10
0.47
0.80
<0.0
89
8.8
3<2
00<3
50<3
00<3
00<3
00
AD
-P-1
wt
wis
teria
Cal
cium
an
timon
ate
66.0
313
.02
8.08
2.47
0.63
0.73
0.81
0.03
0.42
7.45
0.22
0.50
0.61
<0.0
81
01
.00
896
<350
2192
<300
<300
AD
-BL
O-1
opaq
ue b
lue
Cal
cium
an
timon
ate
70.0
913
.70
8.04
2.66
0.57
0.67
0.54
0.06
0.41
1.90
0.18
0.32
1.05
<0.0
81
00
.20
518
<350
784
<300
<300
AD
-NF
-1lb
light
blu
eC
alci
um
antim
onat
e67
.92
14.2
09.
142.
380.
670.
610.
340.
07<0
.04
1.27
<0.0
20.
331.
02<0
.08
97
.98
<200
<350
1293
<300
<300
AD
-NF
-5lb
light
blu
eC
alci
um
antim
onat
e67
.38
13.4
67.
862.
010.
520.
500.
270.
05<0
.04
1.56
0.05
0.18
1.50
<0.0
89
5.3
6<2
00<3
5022
33<3
00<3
00
AD
-NF
-7y
yello
wLe
ad
antim
onat
e57
.35
11.7
35.
671.
920.
460.
471.
010.
06<0
.04
1.16
0.08
0.23
1.29
19.2
91
00
.73
<200
<350
433
1229
<300
AD
-BG
-1y
yello
wLe
ad
antim
onat
e65
.96
13.6
53.
381.
940.
520.
721.
210.
170.
760.
650.
120.
211.
469.
911
00
.65
<200
<350
<300
<300
1784
AD
-AG
-1y
yello
wLe
ad
antim
onat
e63
.85
13.6
57.
012.
670.
580.
700.
700.
060.
560.
760.
080.
281.
028.
761
00
.67
<200
<350
<300
<300
<300
AD
-NF
-5y
yello
wLe
ad
antim
onat
e62
.51
11.7
07.
041.
890.
560.
420.
750.
05<0
.04
1.51
<0.0
20.
070.
8815
.96
10
3.4
0<2
00<3
5028
59<3
00<3
00
AD
-NF
-6y
yello
wLe
ad
antim
onat
e58
.50
10.9
44.
770.
920.
220.
531.
150.
10<0
.04
1.13
0.06
0.44
1.11
20.3
61
00
.26
<200
<350
<300
<300
<300
AD
-NF
-1y
yello
wLe
ad
antim
onat
e62
.06
10.9
86.
712.
140.
430.
421.
020.
05<0
.04
1.20
0.06
0.32
0.74
15.6
11
01
.76
<200
<350
992
<300
<300
Ta
ble
D.3
: M
ean
ch
emic
al
com
po
siti
on
(E
PM
A d
ata
) in
wei
gh
t p
er c
ent
(ele
men
t o
xid
es)
for
Ad
ria
op
aq
ue
gla
sses
. T
race
s a
re e
xpre
ssed
as
pp
m.
190
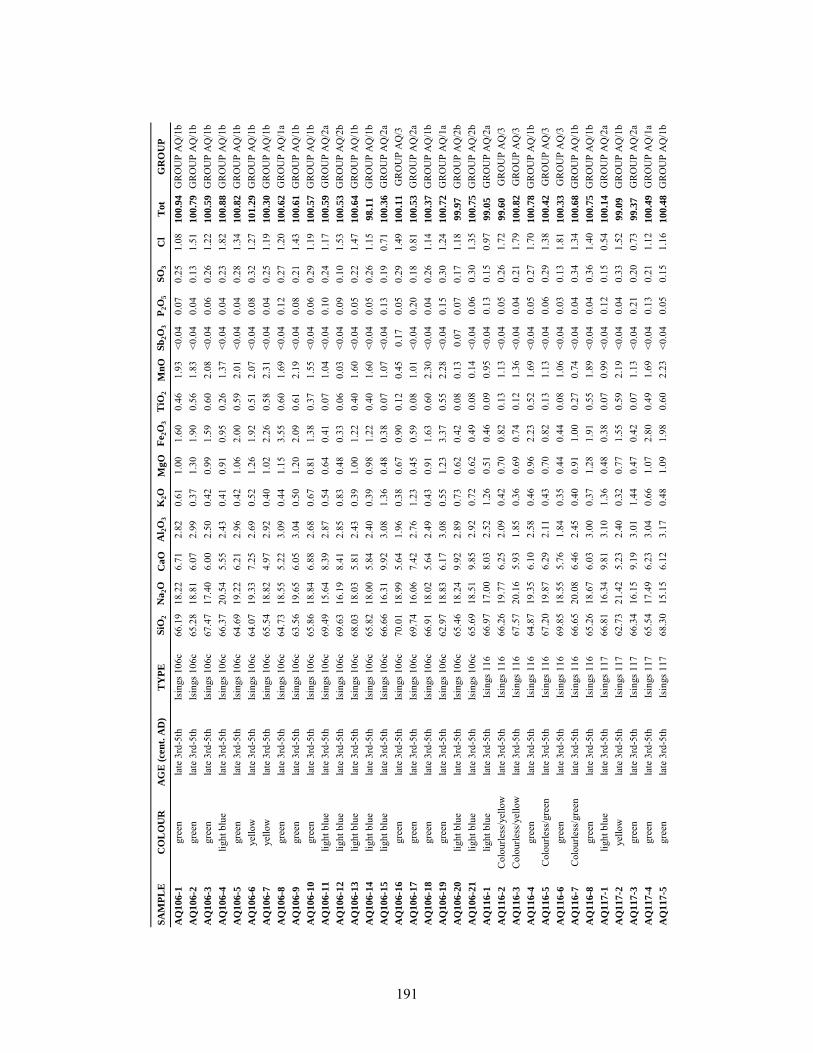
SA
MP
LE
CO
LO
UR
AG
E (
cen
t. A
D)
TY
PE
SiO
2N
a2O
Ca
OA
l 2O
3K
2O
Mg
OF
e 2O
3T
iO2
Mn
OS
b2O
3P
2O
5S
O3
Cl
Tot
GR
OU
P
AQ
10
6-1
gree
nla
te 3
rd-5
thIs
ings
106
c66
.19
18.2
26.
712.
820.
611.
001.
600.
461.
93<0
.04
0.07
0.25
1.08
10
0.9
4G
RO
UP
AQ
/1b
AQ
10
6-2
gree
nla
te 3
rd-5
thIs
ings
106
c65
.28
18.8
16.
072.
990.
371.
301.
900.
561.
83<0
.04
0.04
0.13
1.51
10
0.7
9G
RO
UP
AQ
/1b
AQ
10
6-3
gree
nla
te 3
rd-5
thIs
ings
106
c67
.47
17.4
06.
002.
500.
420.
991.
590.
602.
08<0
.04
0.06
0.26
1.22
10
0.5
9G
RO
UP
AQ
/1b
AQ
10
6-4
light
blu
ela
te 3
rd-5
thIs
ings
106
c66
.37
20.5
45.
552.
430.
410.
910.
950.
261.
37<0
.04
0.04
0.23
1.82
10
0.8
8G
RO
UP
AQ
/1b
AQ
10
6-5
gree
nla
te 3
rd-5
thIs
ings
106
c64
.69
19.2
26.
212.
960.
421.
062.
000.
592.
01<0
.04
0.04
0.28
1.34
10
0.8
2G
RO
UP
AQ
/1b
AQ
10
6-6
yello
wla
te 3
rd-5
thIs
ings
106
c64
.07
19.3
37.
252.
690.
521.
261.
920.
512.
07<0
.04
0.08
0.32
1.27
10
1.2
9G
RO
UP
AQ
/1b
AQ
10
6-7
yello
wla
te 3
rd-5
thIs
ings
106
c65
.54
18.8
24.
972.
920.
401.
022.
260.
582.
31<0
.04
0.04
0.25
1.19
10
0.3
0G
RO
UP
AQ
/1b
AQ
10
6-8
gree
nla
te 3
rd-5
thIs
ings
106
c64
.73
18.5
55.
223.
090.
441.
153.
550.
601.
69<0
.04
0.12
0.27
1.20
10
0.6
2G
RO
UP
AQ
/1a
AQ
10
6-9
gree
nla
te 3
rd-5
thIs
ings
106
c63
.56
19.6
56.
053.
040.
501.
202.
090.
612.
19<0
.04
0.08
0.21
1.43
10
0.6
1G
RO
UP
AQ
/1b
AQ
10
6-1
0gr
een
late
3rd
-5th
Isin
gs 1
06c
65.8
618
.84
6.88
2.68
0.67
0.81
1.38
0.37
1.55
<0.0
40.
060.
291.
191
00
.57
GR
OU
P A
Q/1
bA
Q1
06
-11
light
blu
ela
te 3
rd-5
thIs
ings
106
c69
.49
15.6
48.
392.
870.
540.
640.
410.
071.
04<0
.04
0.10
0.24
1.17
10
0.5
9G
RO
UP
AQ
/2a
AQ
10
6-1
2lig
ht b
lue
late
3rd
-5th
Isin
gs 1
06c
69.6
316
.19
8.41
2.85
0.83
0.48
0.33
0.06
0.03
<0.0
40.
090.
101.
531
00
.53
GR
OU
P A
Q/2
bA
Q1
06
-13
light
blu
ela
te 3
rd-5
thIs
ings
106
c68
.03
18.0
35.
812.
430.
391.
001.
220.
401.
60<0
.04
0.05
0.22
1.47
10
0.6
4G
RO
UP
AQ
/1b
AQ
10
6-1
4lig
ht b
lue
late
3rd
-5th
Isin
gs 1
06c
65.8
218
.00
5.84
2.40
0.39
0.98
1.22
0.40
1.60
<0.0
40.
050.
261.
159
8.1
1G
RO
UP
AQ
/1b
AQ
10
6-1
5lig
ht b
lue
late
3rd
-5th
Isin
gs 1
06c
66.6
616
.31
9.92
3.08
1.36
0.48
0.38
0.07
1.07
<0.0
40.
130.
190.
711
00
.36
GR
OU
P A
Q/2
aA
Q1
06
-16
gree
nla
te 3
rd-5
thIs
ings
106
c70
.01
18.9
95.
641.
960.
380.
670.
900.
120.
450.
170.
050.
291.
491
00
.11
GR
OU
P A
Q/3
AQ
10
6-1
7gr
een
late
3rd
-5th
Isin
gs 1
06c
69.7
416
.06
7.42
2.76
1.23
0.45
0.59
0.08
1.01
<0.0
40.
200.
180.
811
00
.53
GR
OU
P A
Q/2
aA
Q1
06
-18
gree
nla
te 3
rd-5
thIs
ings
106
c66
.91
18.0
25.
642.
490.
430.
911.
630.
602.
30<0
.04
0.04
0.26
1.14
10
0.3
7G
RO
UP
AQ
/1b
AQ
10
6-1
9gr
een
late
3rd
-5th
Isin
gs 1
06c
62.9
718
.83
6.17
3.08
0.55
1.23
3.37
0.55
2.28
<0.0
40.
150.
301.
241
00
.72
GR
OU
P A
Q/1
aA
Q1
06
-20
light
blu
ela
te 3
rd-5
thIs
ings
106
c65
.46
18.2
49.
922.
890.
730.
620.
420.
080.
130.
070.
070.
171.
189
9.9
7G
RO
UP
AQ
/2b
AQ
10
6-2
1lig
ht b
lue
late
3rd
-5th
Isin
gs 1
06c
65.6
918
.51
9.85
2.92
0.72
0.62
0.49
0.08
0.14
<0.0
40.
060.
301.
351
00
.75
GR
OU
P A
Q/2
bA
Q1
16
-1lig
ht b
lue
late
3rd
-5th
Isin
gs 1
1666
.97
17.0
08.
032.
521.
260.
510.
460.
090.
95<0
.04
0.13
0.15
0.97
99
.05
GR
OU
P A
Q/2
aA
Q1
16
-2C
olou
rless
/yel
low
late
3rd
-5th
Isin
gs 1
1666
.26
19.7
76.
252.
090.
420.
700.
820.
131.
13<0
.04
0.05
0.26
1.72
99
.60
GR
OU
P A
Q/3
AQ
11
6-3
Col
ourle
ss/y
ello
wla
te 3
rd-5
thIs
ings
116
67.5
720
.16
5.93
1.85
0.36
0.69
0.74
0.12
1.36
<0.0
40.
040.
211.
791
00
.82
GR
OU
P A
Q/3
AQ
11
6-4
gree
nla
te 3
rd-5
thIs
ings
116
64.8
719
.35
6.10
2.58
0.46
0.96
2.23
0.52
1.69
<0.0
40.
050.
271.
701
00
.78
GR
OU
P A
Q/1
bA
Q1
16
-5C
olou
rless
/gre
enla
te 3
rd-5
thIs
ings
116
67.2
019
.87
6.29
2.11
0.43
0.70
0.82
0.13
1.13
<0.0
40.
060.
291.
381
00
.42
GR
OU
P A
Q/3
AQ
11
6-6
gree
nla
te 3
rd-5
thIs
ings
116
69.8
518
.55
5.76
1.84
0.35
0.44
0.44
0.08
1.06
<0.0
40.
030.
131.
811
00
.33
GR
OU
P A
Q/3
AQ
11
6-7
Col
ourle
ss/g
reen
late
3rd
-5th
Isin
gs 1
1666
.65
20.0
86.
462.
450.
400.
911.
000.
270.
74<0
.04
0.04
0.34
1.34
10
0.6
8G
RO
UP
AQ
/1b
AQ
11
6-8
gree
nla
te 3
rd-5
thIs
ings
116
65.2
618
.67
6.03
3.00
0.37
1.28
1.91
0.55
1.89
<0.0
40.
040.
361.
401
00
.75
GR
OU
P A
Q/1
bA
Q1
17
-1lig
ht b
lue
late
3rd
-5th
Isin
gs 1
1766
.81
16.3
49.
813.
101.
360.
480.
380.
070.
99<0
.04
0.12
0.15
0.54
10
0.1
4G
RO
UP
AQ
/2a
AQ
11
7-2
yello
wla
te 3
rd-5
thIs
ings
117
62.7
321
.42
5.23
2.40
0.32
0.77
1.55
0.59
2.19
<0.0
40.
040.
331.
529
9.0
9G
RO
UP
AQ
/1b
AQ
11
7-3
gree
nla
te 3
rd-5
thIs
ings
117
66.3
416
.15
9.19
3.01
1.44
0.47
0.42
0.07
1.13
<0.0
40.
210.
200.
739
9.3
7G
RO
UP
AQ
/2a
AQ
11
7-4
gree
nla
te 3
rd-5
thIs
ings
117
65.5
417
.49
6.23
3.04
0.66
1.07
2.80
0.49
1.69
<0.0
40.
130.
211.
121
00
.49
GR
OU
P A
Q/1
aA
Q1
17
-5gr
een
late
3rd
-5th
Isin
gs 1
1768
.30
15.1
56.
123.
170.
481.
091.
980.
602.
23<0
.04
0.05
0.15
1.16
10
0.4
8G
RO
UP
AQ
/1b
191
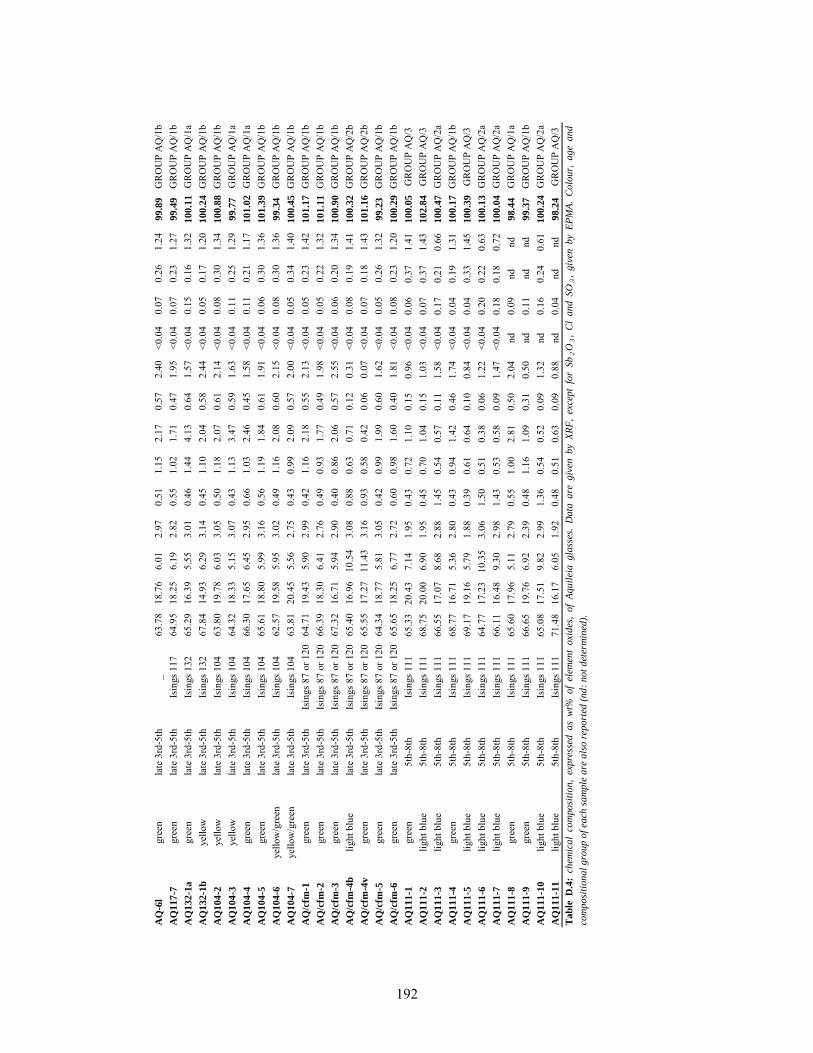
AQ
-6l
gree
nla
te 3
rd-5
th_
63.7
818
.76
6.01
2.97
0.51
1.15
2.17
0.57
2.40
<0.0
40.
070.
261.
249
9.8
9G
RO
UP
AQ
/1b
AQ
11
7-7
gree
nla
te 3
rd-5
thIs
ings
117
64.9
518
.25
6.19
2.82
0.55
1.02
1.71
0.47
1.95
<0.0
40.
070.
231.
279
9.4
9G
RO
UP
AQ
/1b
AQ
13
2-1
agr
een
late
3rd
-5th
Isin
gs 1
3265
.29
16.3
95.
553.
010.
461.
444.
130.
641.
57<0
.04
0.15
0.16
1.32
10
0.1
1G
RO
UP
AQ
/1a
AQ
13
2-1
bye
llow
late
3rd
-5th
Isin
gs 1
3267
.84
14.9
36.
293.
140.
451.
102.
040.
582.
44<0
.04
0.05
0.17
1.20
10
0.2
4G
RO
UP
AQ
/1b
AQ
10
4-2
yello
wla
te 3
rd-5
thIs
ings
104
63.8
019
.78
6.03
3.05
0.50
1.18
2.07
0.61
2.14
<0.0
40.
080.
301.
341
00
.88
GR
OU
P A
Q/1
bA
Q1
04
-3ye
llow
late
3rd
-5th
Isin
gs 1
0464
.32
18.3
35.
153.
070.
431.
133.
470.
591.
63<0
.04
0.11
0.25
1.29
99
.77
GR
OU
P A
Q/1
aA
Q1
04
-4gr
een
late
3rd
-5th
Isin
gs 1
0466
.30
17.6
56.
452.
950.
661.
032.
460.
451.
58<0
.04
0.11
0.21
1.17
10
1.0
2G
RO
UP
AQ
/1a
AQ
10
4-5
gree
nla
te 3
rd-5
thIs
ings
104
65.6
118
.80
5.99
3.16
0.56
1.19
1.84
0.61
1.91
<0.0
40.
060.
301.
361
01
.39
GR
OU
P A
Q/1
bA
Q1
04
-6ye
llow
/gre
enla
te 3
rd-5
thIs
ings
104
62.5
719
.58
5.95
3.02
0.49
1.16
2.08
0.60
2.15
<0.0
40.
080.
301.
369
9.3
4G
RO
UP
AQ
/1b
AQ
10
4-7
yello
w/g
reen
late
3rd
-5th
Isin
gs 1
0463
.81
20.4
55.
562.
750.
430.
992.
090.
572.
00<0
.04
0.05
0.34
1.40
10
0.4
5G
RO
UP
AQ
/1b
AQ
/cfm
-1gr
een
late
3rd
-5th
Isin
gs 8
7 or
120
64.7
119
.43
5.90
2.99
0.42
1.16
2.18
0.55
2.13
<0.0
40.
050.
231.
421
01
.17
GR
OU
P A
Q/1
bA
Q/c
fm-2
gree
nla
te 3
rd-5
thIs
ings
87
or 1
2066
.39
18.3
06.
412.
760.
490.
931.
770.
491.
98<0
.04
0.05
0.22
1.32
10
1.1
1G
RO
UP
AQ
/1b
AQ
/cfm
-3gr
een
late
3rd
-5th
Isin
gs 8
7 or
120
67.3
216
.71
5.94
2.90
0.40
0.86
2.06
0.57
2.55
<0.0
40.
060.
201.
341
00
.90
GR
OU
P A
Q/1
bA
Q/c
fm-4
blig
ht b
lue
late
3rd
-5th
Isin
gs 8
7 or
120
65.4
016
.96
10.5
43.
080.
880.
630.
710.
120.
31<0
.04
0.08
0.19
1.41
10
0.3
2G
RO
UP
AQ
/2b
AQ
/cfm
-4v
gree
nla
te 3
rd-5
thIs
ings
87
or 1
2065
.55
17.2
711
.43
3.16
0.93
0.58
0.42
0.06
0.07
<0.0
40.
070.
181.
431
01
.16
GR
OU
P A
Q/2
bA
Q/c
fm-5
gree
nla
te 3
rd-5
thIs
ings
87
or 1
2064
.34
18.7
75.
813.
050.
420.
991.
990.
601.
62<0
.04
0.05
0.26
1.32
99
.23
GR
OU
P A
Q/1
bA
Q/c
fm-6
gree
nla
te 3
rd-5
thIs
ings
87
or 1
2065
.65
18.2
56.
772.
720.
600.
981.
600.
401.
81<0
.04
0.08
0.23
1.20
10
0.2
9G
RO
UP
AQ
/1b
AQ
11
1-1
gree
n5t
h-8t
hIs
ings
111
65.3
320
.43
7.14
1.95
0.43
0.72
1.10
0.15
0.96
<0.0
40.
060.
371.
411
00
.05
GR
OU
P A
Q/3
AQ
11
1-2
light
blu
e5t
h-8t
hIs
ings
111
68.7
520
.00
6.90
1.95
0.45
0.70
1.04
0.15
1.03
<0.0
40.
070.
371.
431
02
.84
GR
OU
P A
Q/3
AQ
11
1-3
light
blu
e5t
h-8t
hIs
ings
111
66.5
517
.07
8.68
2.88
1.45
0.54
0.57
0.11
1.58
<0.0
40.
170.
210.
661
00
.47
GR
OU
P A
Q/2
aA
Q1
11
-4gr
een
5th-
8th
Isin
gs 1
1168
.77
16.7
15.
362.
800.
430.
941.
420.
461.
74<0
.04
0.04
0.19
1.31
10
0.1
7G
RO
UP
AQ
/1b
AQ
11
1-5
light
blu
e5t
h-8t
hIs
ings
111
69.1
719
.16
5.79
1.88
0.39
0.61
0.64
0.10
0.84
<0.0
40.
040.
331.
451
00
.39
GR
OU
P A
Q/3
AQ
11
1-6
light
blu
e5t
h-8t
hIs
ings
111
64.7
717
.23
10.3
53.
061.
500.
510.
380.
061.
22<0
.04
0.20
0.22
0.63
10
0.1
3G
RO
UP
AQ
/2a
AQ
11
1-7
light
blu
e5t
h-8t
hIs
ings
111
66.1
116
.48
9.30
2.98
1.43
0.53
0.58
0.09
1.47
<0.0
40.
180.
180.
721
00
.04
GR
OU
P A
Q/2
aA
Q1
11
-8gr
een
5th-
8th
Isin
gs 1
1165
.60
17.9
65.
112.
790.
551.
002.
810.
502.
04nd
0.09
ndnd
98
.44
GR
OU
P A
Q/1
aA
Q1
11
-9gr
een
5th-
8th
Isin
gs 1
1166
.65
19.7
66.
922.
390.
481.
161.
090.
310.
50nd
0.11
ndnd
99
.37
GR
OU
P A
Q/1
bA
Q1
11
-10
light
blu
e5t
h-8t
hIs
ings
111
65.0
817
.51
9.82
2.99
1.36
0.54
0.52
0.09
1.32
nd0.
160.
240.
611
00
.24
GR
OU
P A
Q/2
aA
Q1
11
-11
light
blu
e5t
h-8t
hIs
ings
111
71.4
816
.17
6.05
1.92
0.48
0.51
0.63
0.09
0.88
nd0.
04nd
nd9
8.2
4G
RO
UP
AQ
/3T
ab
leD
.4:
chem
ica
lco
mp
osi
tio
n,
exp
ress
eda
sw
t%o
fel
emen
to
xid
es,
of
Aq
uil
eia
gla
sses
.D
ata
are
giv
enb
yX
RF
,ex
cep
tfo
rS
b2O
3,
Cl
an
dS
O3,
giv
enb
yE
PM
A.
Co
lou
r,a
ge
an
d
com
po
siti
on
al
gro
up
of
each
sa
mp
le a
re a
lso
rep
ort
ed (
nd
: n
ot
det
erm
ined
).
192
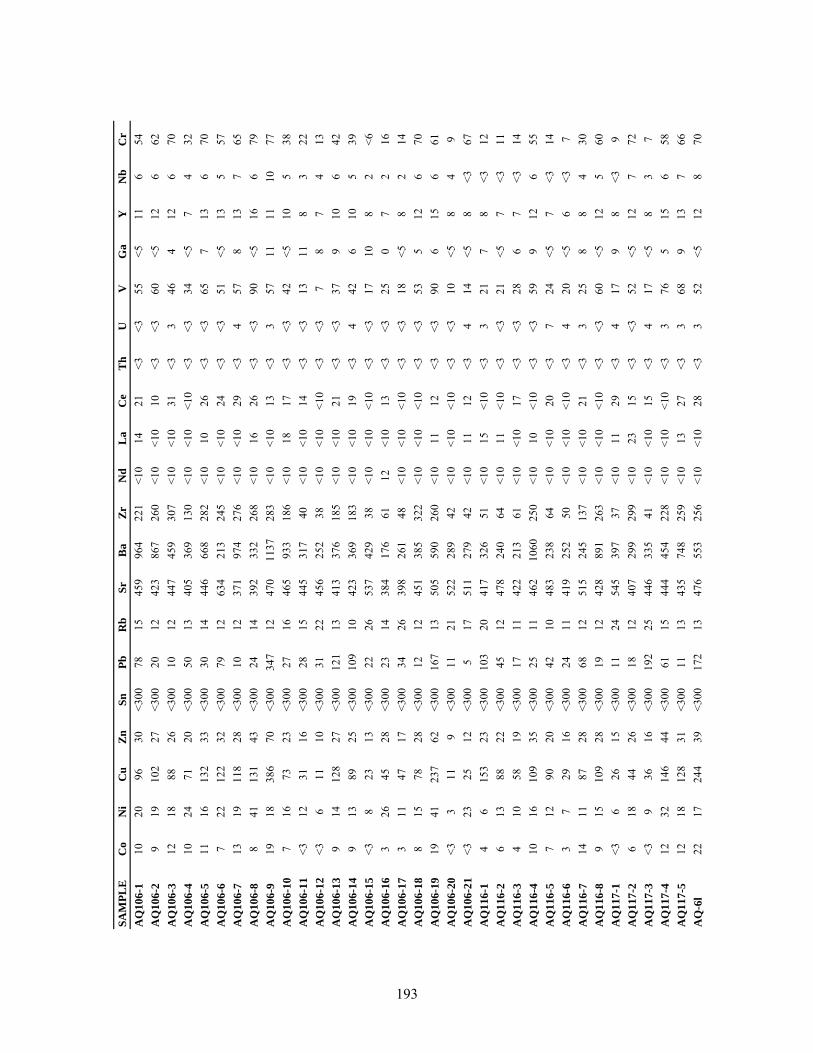
SA
MP
LE
Co
Ni
Cu
Zn
Sn
Pb
Rb
Sr
Ba
Zr
Nd
La
Ce
Th
UV
Ga
YN
bC
r
AQ
10
6-1
1020
9630
<300
7815
459
964
221
<10
1421
<3<3
55<5
116
54A
Q1
06
-29
1910
227
<300
2012
423
867
260
<10
<10
10<3
<360
<512
662
AQ
10
6-3
1218
8826
<300
1012
447
459
307
<10
<10
31<3
346
412
670
AQ
10
6-4
1024
7120
<300
5013
405
369
130
<10
<10
<10
<3<3
34<5
74
32A
Q1
06
-511
1613
233
<300
3014
446
668
282
<10
1026
<3<3
657
136
70A
Q1
06
-67
2212
232
<300
7912
634
213
245
<10
<10
24<3
<351
<513
557
AQ
10
6-7
1319
118
28<3
0010
1237
197
427
6<1
0<1
029
<34
578
137
65A
Q1
06
-88
4113
143
<300
2414
392
332
268
<10
1626
<3<3
90<5
166
79A
Q1
06
-919
1838
670
<300
347
1247
011
3728
3<1
0<1
013
<33
5711
1110
77A
Q1
06
-10
716
7323
<300
2716
465
933
186
<10
1817
<3<3
42<5
105
38A
Q1
06
-11
<312
3116
<300
2815
445
317
40<1
0<1
014
<3<3
1311
83
22A
Q1
06
-12
<36
1110
<300
3122
456
252
38<1
0<1
0<1
0<3
<37
87
413
AQ
10
6-1
39
1412
827
<300
121
1341
337
618
5<1
0<1
021
<3<3
379
106
42A
Q1
06
-14
913
8925
<300
109
1042
336
918
3<1
0<1
019
<34
426
105
39A
Q1
06
-15
<38
2313
<300
2226
537
429
38<1
0<1
0<1
0<3
<317
108
2<6
AQ
10
6-1
63
2645
28<3
0023
1438
417
661
12<1
013
<3<3
250
72
16A
Q1
06
-17
311
4717
<300
3426
398
261
48<1
0<1
0<1
0<3
<318
<58
214
AQ
10
6-1
88
1578
28<3
0012
1245
138
532
2<1
0<1
0<1
0<3
<353
512
670
AQ
10
6-1
919
4123
762
<300
167
1350
559
026
0<1
011
12<3
<390
615
661
AQ
10
6-2
0<3
311
9<3
0011
2152
228
942
<10
<10
<10
<3<3
10<5
84
9A
Q1
06
-21
<323
2512
<300
517
511
279
42<1
011
12<3
414
<58
<367
AQ
11
6-1
46
153
23<3
0010
320
417
326
51<1
015
<10
<33
217
8<3
12A
Q1
16
-26
1388
22<3
0045
1247
824
064
<10
11<1
0<3
<321
<57
<311
AQ
11
6-3
410
5819
<300
1711
422
213
61<1
0<1
017
<3<3
286
7<3
14A
Q1
16
-410
1610
935
<300
2511
462
1060
250
<10
10<1
0<3
<359
912
655
AQ
11
6-5
712
9020
<300
4210
483
238
64<1
0<1
020
<37
24<5
7<3
14A
Q1
16
-63
729
16<3
0024
1141
925
250
<10
<10
<10
<34
20<5
6<3
7A
Q1
16
-714
1187
28<3
0068
1251
524
513
7<1
0<1
021
<33
258
84
30A
Q1
16
-89
1510
928
<300
1912
428
891
263
<10
<10
<10
<3<3
60<5
125
60A
Q1
17
-1<3
626
15<3
0011
2454
539
737
<10
1129
<34
179
8<3
9A
Q1
17
-26
1844
26<3
0018
1240
729
929
9<1
023
15<3
<352
<512
772
AQ
11
7-3
<39
3616
<300
192
2544
633
541
<10
<10
15<3
417
<58
37
AQ
11
7-4
1232
146
44<3
0061
1544
445
422
8<1
0<1
0<1
0<3
376
515
658
AQ
11
7-5
1218
128
31<3
0011
1343
574
825
9<1
013
27<3
368
913
766
AQ
-6l
2217
244
39<3
0017
213
476
553
256
<10
<10
28<3
352
<512
870
193
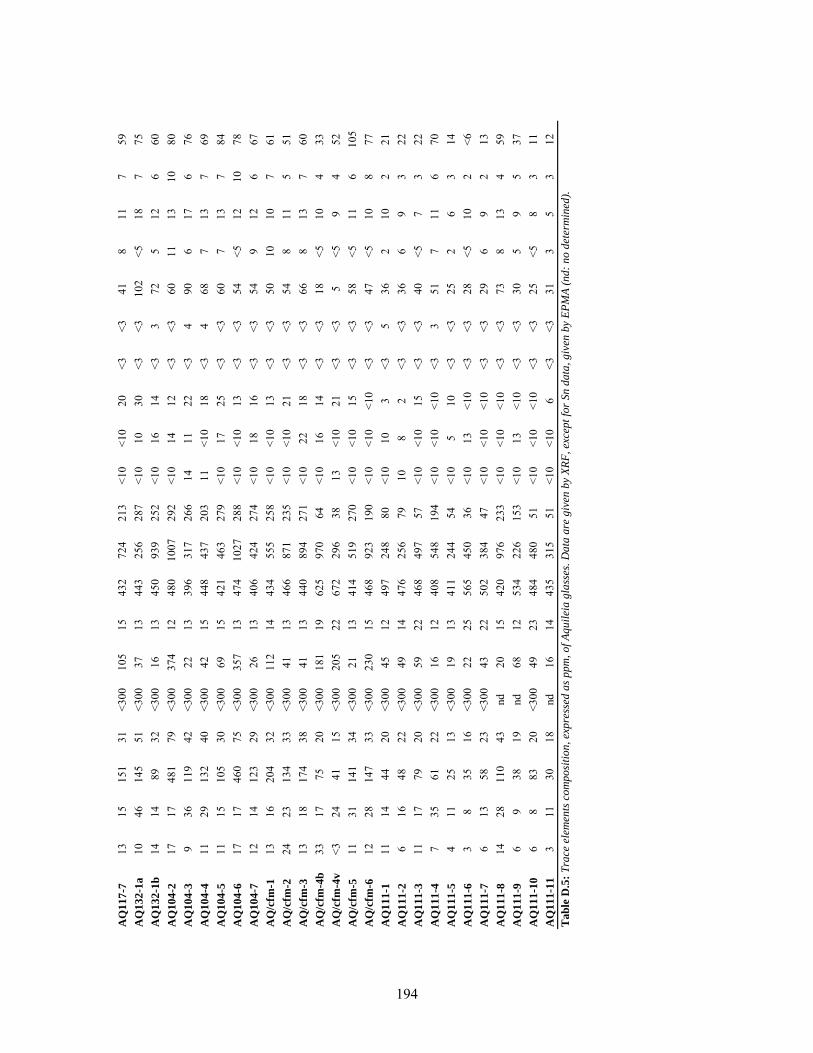
AQ
11
7-7
1315
151
31<3
0010
515
432
724
213
<10
<10
20<3
<341
811
759
AQ
13
2-1
a10
4614
551
<300
3713
443
256
287
<10
1030
<3<3
102
<518
775
AQ
13
2-1
b14
1489
32<3
0016
1345
093
925
2<1
016
14<3
372
512
660
AQ
10
4-2
1717
481
79<3
0037
412
480
1007
292
<10
1412
<3<3
6011
1310
80A
Q1
04
-39
3611
942
<300
2213
396
317
266
1411
22<3
490
617
676
AQ
10
4-4
1129
132
40<3
0042
1544
843
720
311
<10
18<3
468
713
769
AQ
10
4-5
1115
105
30<3
0069
1542
146
327
9<1
017
25<3
<360
713
784
AQ
10
4-6
1717
460
75<3
0035
713
474
1027
288
<10
<10
13<3
<354
<512
1078
AQ
10
4-7
1214
123
29<3
0026
1340
642
427
4<1
018
16<3
<354
912
667
AQ
/cfm
-113
1620
432
<300
112
1443
455
525
8<1
0<1
013
<3<3
5010
107
61A
Q/c
fm-2
2423
134
33<3
0041
1346
687
123
5<1
0<1
021
<3<3
548
115
51A
Q/c
fm-3
1318
174
38<3
0041
1344
089
427
1<1
022
18<3
<366
813
760
AQ
/cfm
-4b
3317
7520
<300
181
1962
597
064
<10
1614
<3<3
18<5
104
33A
Q/c
fm-4
v<3
2441
15<3
0020
522
672
296
3813
<10
21<3
<35
<59
452
AQ
/cfm
-511
3114
134
<300
2113
414
519
270
<10
<10
15<3
<358
<511
610
5A
Q/c
fm-6
1228
147
33<3
0023
015
468
923
190
<10
<10
<10
<3<3
47<5
108
77A
Q1
11
-111
1444
20<3
0045
1249
724
880
<10
103
<35
362
102
21A
Q1
11
-26
1648
22<3
0049
1447
625
679
108
2<3
<336
69
322
AQ
11
1-3
1117
7920
<300
5922
468
497
57<1
0<1
015
<3<3
40<5
73
22A
Q1
11
-47
3561
22<3
0016
1240
854
819
4<1
0<1
0<1
0<3
351
711
670
AQ
11
1-5
411
2513
<300
1913
411
244
54<1
05
10<3
<325
26
314
AQ
11
1-6
38
3516
<300
2225
565
450
36<1
013
<10
<3<3
28<5
102
<6A
Q1
11
-76
1358
23<3
0043
2250
238
447
<10
<10
<10
<3<3
296
92
13A
Q1
11
-814
2811
043
nd20
1542
097
623
3<1
0<1
0<1
0<3
<373
813
459
AQ
11
1-9
69
3819
nd68
1253
422
615
3<1
013
<10
<3<3
305
95
37A
Q1
11
-10
68
8320
<300
4923
484
480
51<1
0<1
0<1
0<3
<325
<58
311
AQ
11
1-1
13
1130
18nd
1614
435
315
51<1
0<1
06
<3<3
313
53
12T
ab
le D
.5:
Tra
ce e
lem
ents
co
mp
osi
tio
n,
exp
ress
ed a
s p
pm
, o
f A
qu
ilei
a g
lass
es.
Da
ta a
re g
iven
by
XR
F,
exce
pt
for
Sn
da
ta,
giv
en b
y E
PM
A (
nd
: n
o d
eter
min
ed).
194
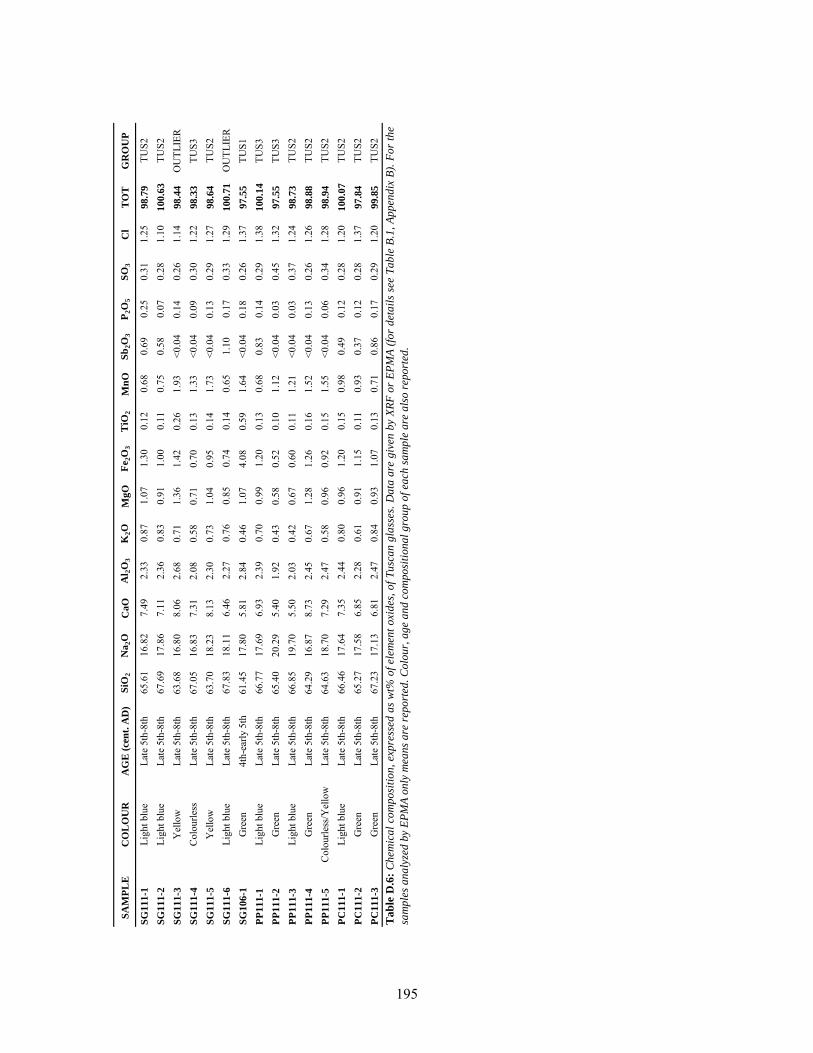
SA
MP
LE
CO
LO
UR
AG
E (
cen
t. A
D)
SiO
2N
a2O
CaO
Al 2
O3
K2O
MgO
Fe 2
O3
TiO
2M
nO
Sb
2O
3P
2O
5S
O3
Cl
TO
TG
RO
UP
SG
111-1
Ligh
t blu
eLa
te 5
th-8
th
65.6
116
.82
7.49
2.33
0.87
1.07
1.30
0.12
0.68
0.69
0.25
0.31
1.25
98
.79
TUS2
SG
111-2
Ligh
t blu
eLa
te 5
th-8
th
67.6
917
.86
7.11
2.36
0.83
0.91
1.00
0.11
0.75
0.58
0.07
0.28
1.10
10
0.6
3TU
S2S
G111-3
Yel
low
Late
5th
-8th
63
.68
16.8
08.
062.
680.
711.
361.
420.
261.
93<0
.04
0.14
0.26
1.14
98
.44
OU
TLIE
RS
G111-4
Col
ourle
ssLa
te 5
th-8
th
67.0
516
.83
7.31
2.08
0.58
0.71
0.70
0.13
1.33
<0.0
40.
090.
301.
229
8.3
3TU
S3S
G111-5
Yel
low
Late
5th
-8th
63
.70
18.2
38.
132.
300.
731.
040.
950.
141.
73<0
.04
0.13
0.29
1.27
98
.64
TUS2
SG
111-6
Ligh
t blu
eLa
te 5
th-8
th
67.8
318
.11
6.46
2.27
0.76
0.85
0.74
0.14
0.65
1.10
0.17
0.33
1.29
10
0.7
1O
UTL
IER
SG
106-1
Gre
en4t
h-ea
rly 5
th
61.4
517
.80
5.81
2.84
0.46
1.07
4.08
0.59
1.64
<0.0
40.
180.
261.
379
7.5
5TU
S1P
P111-1
Ligh
t blu
eLa
te 5
th-8
th
66.7
717
.69
6.93
2.39
0.70
0.99
1.20
0.13
0.68
0.83
0.14
0.29
1.38
10
0.1
4TU
S3P
P111-2
Gre
enLa
te 5
th-8
th
65.4
020
.29
5.40
1.92
0.43
0.58
0.52
0.10
1.12
<0.0
40.
030.
451.
329
7.5
5TU
S3
PP
111-3
Ligh
t blu
eLa
te 5
th-8
th
66.8
519
.70
5.50
2.03
0.42
0.67
0.60
0.11
1.21
<0.0
40.
030.
371.
249
8.7
3TU
S2P
P111-4
Gre
enLa
te 5
th-8
th
64.2
916
.87
8.73
2.45
0.67
1.28
1.26
0.16
1.52
<0.0
40.
130.
261.
269
8.8
8TU
S2P
P111-5
Col
ourle
ss/Y
ello
wLa
te 5
th-8
th
64.6
318
.70
7.29
2.47
0.58
0.96
0.92
0.15
1.55
<0.0
40.
060.
341.
289
8.9
4TU
S2P
C111-1
Ligh
t blu
eLa
te 5
th-8
th
66.4
617
.64
7.35
2.44
0.80
0.96
1.20
0.15
0.98
0.49
0.12
0.28
1.20
10
0.0
7TU
S2P
C111-2
Gre
enLa
te 5
th-8
th
65.2
717
.58
6.85
2.28
0.61
0.91
1.15
0.11
0.93
0.37
0.12
0.28
1.37
97
.84
TUS2
PC
111-3
Gre
enLa
te 5
th-8
th
67.2
317
.13
6.81
2.47
0.84
0.93
1.07
0.13
0.71
0.86
0.17
0.29
1.20
99
.85
TUS2
Ta
ble
D.6
:C
hem
ica
lco
mp
osi
tio
n,
exp
ress
eda
sw
t%o
fel
emen
to
xid
es,
of
Tu
sca
ng
lass
es.
Da
taa
reg
iven
by
XR
Fo
rE
PM
A(f
or
det
ail
sse
eT
ab
leB
.1,
Ap
pen
dix
B).
Fo
rth
e
sam
ple
s a
na
lyze
d b
y E
PM
A o
nly
mea
ns
are
rep
ort
ed.
Co
lou
r, a
ge
an
d c
om
po
siti
on
al
gro
up
of
each
sa
mp
le a
re a
lso
rep
ort
ed.
195
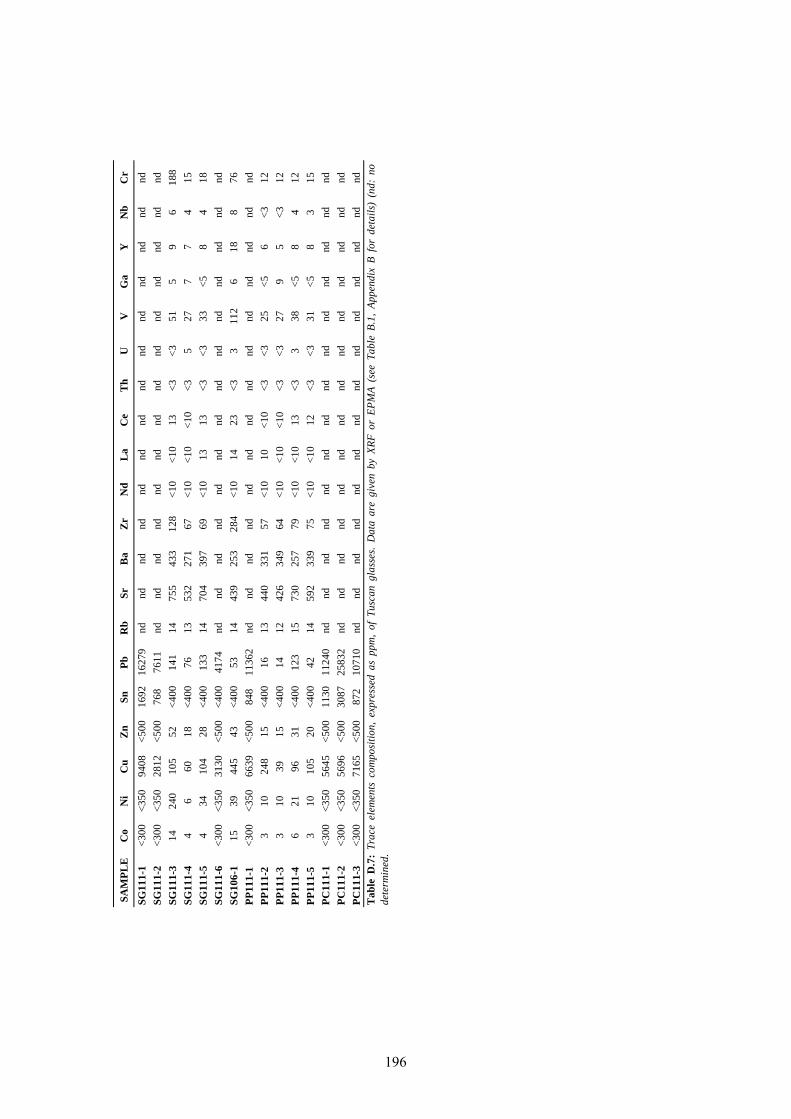
SAM
PL
EC
oN
iC
uZ
nSn
Pb
Rb
SrB
aZ
rN
dL
aC
eT
hU
VG
aY
Nb
Cr
SG11
1-1
<30
0<
350
9408
<50
016
9216
279
ndnd
ndnd
ndnd
ndnd
ndnd
ndnd
ndnd
SG11
1-2
<30
0<
350
2812
<50
076
876
11nd
ndnd
ndnd
ndnd
ndnd
ndnd
ndnd
nd
SG11
1-3
1424
010
552
<40
014
114
755
433
128
<10
<10
13<
3<
351
59
618
8
SG11
1-4
46
6018
<40
076
1353
227
167
<10
<10
<10
<3
527
77
415
SG11
1-5
434
104
28<
400
133
1470
439
769
<10
1313
<3
<3
33<
58
418
SG11
1-6
<30
0<
350
3130
<50
0<
400
4174
ndnd
ndnd
ndnd
ndnd
ndnd
ndnd
ndnd
SG10
6-1
1539
445
43<
400
5314
439
253
284
<10
1423
<3
311
26
188
76
PP
111-
1<
300
<35
066
39<
500
848
1136
2nd
ndnd
ndnd
ndnd
ndnd
ndnd
ndnd
nd
PP
111-
23
1024
815
<40
016
1344
033
157
<10
10<
10<
3<
325
<5
6<
312
PP
111-
33
1039
15<
400
1412
426
349
64<
10<
10<
10<
3<
327
95
<3
12
PP
111-
46
2196
31<
400
123
1573
025
779
<10
<10
13<
33
38<
58
412
PP
111-
53
1010
520
<40
042
1459
233
975
<10
<10
12<
3<
331
<5
83
15
PC
111-
1<
300
<35
056
45<
500
1130
1124
0nd
ndnd
ndnd
ndnd
ndnd
ndnd
ndnd
nd
PC
111-
2<
300
<35
056
96<
500
3087
2583
2nd
ndnd
ndnd
ndnd
ndnd
ndnd
ndnd
nd
PC
111-
3<
300
<35
071
65<
500
872
1071
0nd
ndnd
ndnd
ndnd
ndnd
ndnd
ndnd
ndT
able
D.7
:T
race
elem
ents
com
posi
tion
,ex
pres
sed
aspp
m,
ofT
usca
ngl
asse
s.D
ata
are
give
nby
XR
For
EP
MA
(see
Tab
leB
.1,
App
endi
xB
for
deta
ils)
(nd:
node
term
ined
.
196
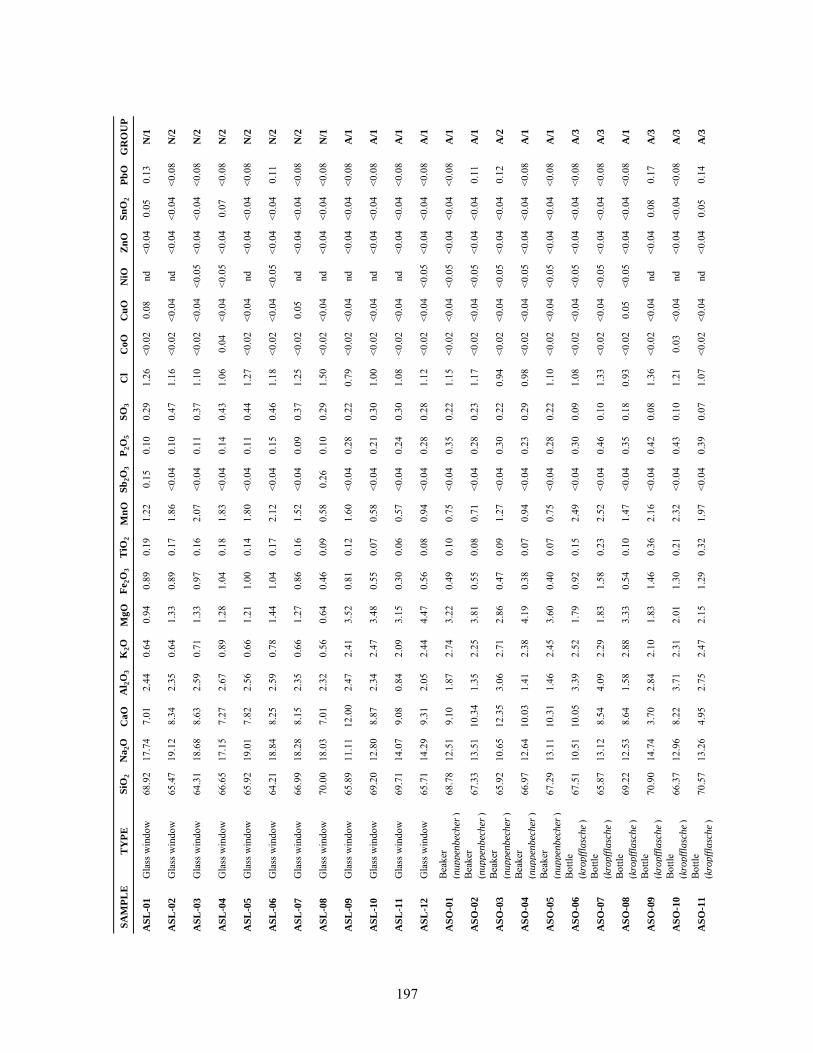
SA
MP
LE
TY
PE
SiO
2N
a2O
CaO
Al 2
O3
K2O
MgO
Fe 2
O3
TiO
2M
nO
Sb
2O
3P
2O
5S
O3
Cl
Co
OC
uO
NiO
Zn
OS
nO
2
Pb
OG
RO
UP
AS
L-0
1G
lass
win
dow
68.9
217
.74
7.01
2.44
0.64
0.94
0.89
0.19
1.22
0.15
0.10
0.29
1.26
<0.0
20.
08nd
<0.0
40.
050.
13N
/1
AS
L-0
2G
lass
win
dow
65.4
719
.12
8.34
2.35
0.64
1.33
0.89
0.17
1.86
<0.0
40.
100.
471.
16<0
.02
<0.0
4nd
<0.0
4<0
.04
<0.0
8N
/2
AS
L-0
3G
lass
win
dow
64.3
118
.68
8.63
2.59
0.71
1.33
0.97
0.16
2.07
<0.0
40.
110.
371.
10<0
.02
<0.0
4<0
.05
<0.0
4<0
.04
<0.0
8N
/2
AS
L-0
4G
lass
win
dow
66.6
517
.15
7.27
2.67
0.89
1.28
1.04
0.18
1.83
<0.0
40.
140.
431.
060.
04<0
.04
<0.0
5<0
.04
0.07
<0.0
8N
/2
AS
L-0
5G
lass
win
dow
65.9
219
.01
7.82
2.56
0.66
1.21
1.00
0.14
1.80
<0.0
40.
110.
441.
27<0
.02
<0.0
4nd
<0.0
4<0
.04
<0.0
8N
/2
AS
L-0
6G
lass
win
dow
64.2
118
.84
8.25
2.59
0.78
1.44
1.04
0.17
2.12
<0.0
40.
150.
461.
18<0
.02
<0.0
4<0
.05
<0.0
4<0
.04
0.11
N/2
AS
L-0
7G
lass
win
dow
66.9
918
.28
8.15
2.35
0.66
1.27
0.86
0.16
1.52
<0.0
40.
090.
371.
25<0
.02
0.05
nd<0
.04
<0.0
4<0
.08
N/2
AS
L-0
8G
lass
win
dow
70.0
018
.03
7.01
2.32
0.56
0.64
0.46
0.09
0.58
0.26
0.10
0.29
1.50
<0.0
2<0
.04
nd<0
.04
<0.0
4<0
.08
N/1
AS
L-0
9G
lass
win
dow
65
.89
11.1
112
.00
2.47
2.41
3.52
0.81
0.12
1.60
<0.0
40.
280.
220.
79<0
.02
<0.0
4nd
<0.0
4<0
.04
<0.0
8A
/1
AS
L-1
0G
lass
win
dow
69
.20
12.8
08.
872.
342.
473.
480.
550.
070.
58<0
.04
0.21
0.30
1.00
<0.0
2<0
.04
nd<0
.04
<0.0
4<0
.08
A/1
AS
L-1
1G
lass
win
dow
69
.71
14.0
79.
080.
842.
093.
150.
300.
060.
57<0
.04
0.24
0.30
1.08
<0.0
2<0
.04
nd<0
.04
<0.0
4<0
.08
A/1
AS
L-1
2G
lass
win
dow
65
.71
14.2
99.
312.
052.
444.
470.
560.
080.
94<0
.04
0.28
0.28
1.12
<0.0
2<0
.04
<0.0
5<0
.04
<0.0
4<0
.08
A/1
AS
O-0
1Be
aker
(n
uppen
bec
her
)68
.78
12.5
19.
101.
872.
743.
220.
490.
100.
75<0
.04
0.35
0.22
1.15
<0.0
2<0
.04
<0.0
5<0
.04
<0.0
4<0
.08
A/1
AS
O-0
2Be
aker
(n
uppen
bec
her
)67
.33
13.5
110
.34
1.35
2.25
3.81
0.55
0.08
0.71
<0.0
40.
280.
231.
17<0
.02
<0.0
4<0
.05
<0.0
4<0
.04
0.11
A/1
AS
O-0
3Be
aker
(n
uppen
bec
her
)65
.92
10.6
512
.35
3.06
2.71
2.86
0.47
0.09
1.27
<0.0
40.
300.
220.
94<0
.02
<0.0
4<0
.05
<0.0
4<0
.04
0.12
A/2
AS
O-0
4Be
aker
(n
uppen
bec
her
)66
.97
12.6
410
.03
1.41
2.38
4.19
0.38
0.07
0.94
<0.0
40.
230.
290.
98<0
.02
<0.0
4<0
.05
<0.0
4<0
.04
<0.0
8A
/1
AS
O-0
5Be
aker
(n
uppen
bec
her
)67
.29
13.1
110
.31
1.46
2.45
3.60
0.40
0.07
0.75
<0.0
40.
280.
221.
10<0
.02
<0.0
4<0
.05
<0.0
4<0
.04
<0.0
8A
/1
AS
O-0
6Bo
ttle
(kro
pff
lasc
he
)67
.51
10.5
110
.05
3.39
2.52
1.79
0.92
0.15
2.49
<0.0
40.
300.
091.
08<0
.02
<0.0
4<0
.05
<0.0
4<0
.04
<0.0
8A
/3
AS
O-0
7Bo
ttle
(kro
pff
lasc
he
)65
.87
13.1
28.
544.
092.
291.
831.
580.
232.
52<0
.04
0.46
0.10
1.33
<0.0
2<0
.04
<0.0
5<0
.04
<0.0
4<0
.08
A/3
AS
O-0
8Bo
ttle
(kro
pff
lasc
he
)69
.22
12.5
38.
641.
582.
883.
330.
540.
101.
47<0
.04
0.35
0.18
0.93
<0.0
20.
05<0
.05
<0.0
4<0
.04
<0.0
8A
/1
AS
O-0
9Bo
ttle
(kro
pff
lasc
he
)70
.90
14.7
43.
702.
842.
101.
831.
460.
362.
16<0
.04
0.42
0.08
1.36
<0.0
2<0
.04
nd<0
.04
0.08
0.17
A/3
AS
O-1
0Bo
ttle
(kro
pff
lasc
he
)66
.37
12.9
68.
223.
712.
312.
011.
300.
212.
32<0
.04
0.43
0.10
1.21
0.03
<0.0
4nd
<0.0
4<0
.04
<0.0
8A
/3
AS
O-1
1Bo
ttle
(kro
pff
lasc
he
)70
.57
13.2
64.
952.
752.
472.
151.
290.
321.
97<0
.04
0.39
0.07
1.07
<0.0
2<0
.04
nd<0
.04
0.05
0.14
A/3
197
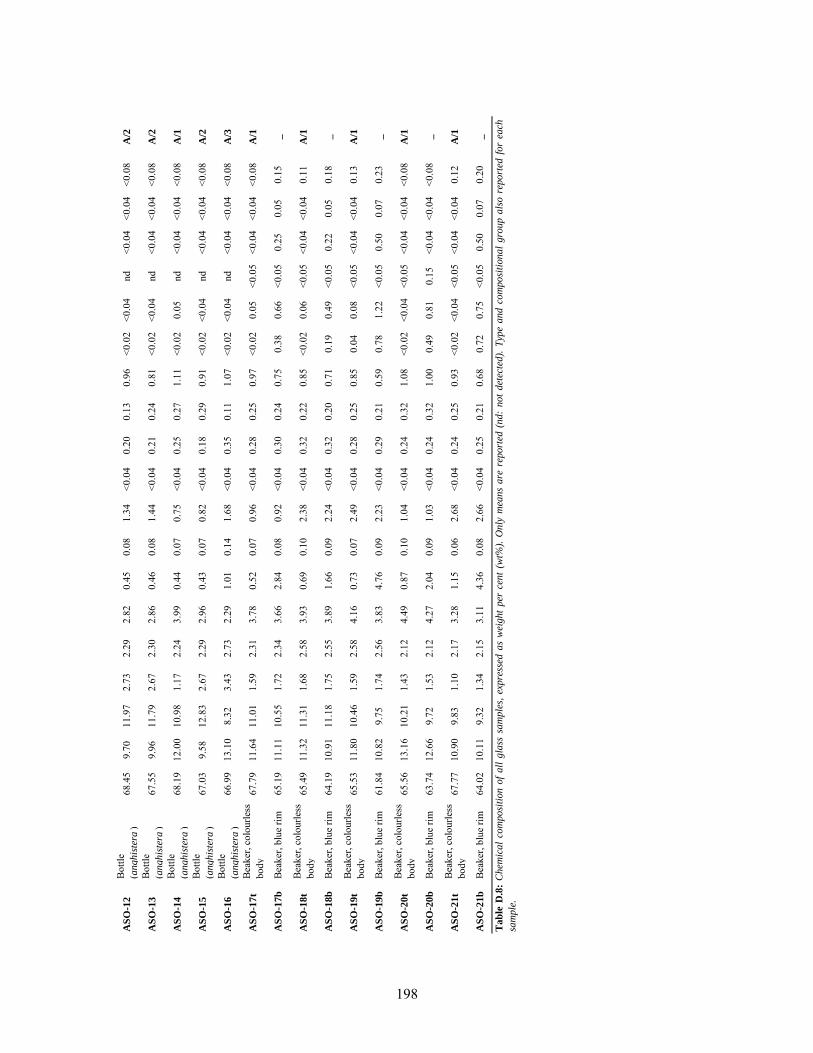
AS
O-1
2Bo
ttle
(anghis
tera
)68
.45
9.70
11.9
72.
732.
292.
820.
450.
081.
34<0
.04
0.20
0.13
0.96
<0.0
2<0
.04
nd<0
.04
<0.0
4<0
.08
A/2
AS
O-1
3Bo
ttle
(anghis
tera
)67
.55
9.96
11.7
92.
672.
302.
860.
460.
081.
44<0
.04
0.21
0.24
0.81
<0.0
2<0
.04
nd<0
.04
<0.0
4<0
.08
A/2
AS
O-1
4Bo
ttle
(anghis
tera
)68
.19
12.0
010
.98
1.17
2.24
3.99
0.44
0.07
0.75
<0.0
40.
250.
271.
11<0
.02
0.05
nd<0
.04
<0.0
4<0
.08
A/1
AS
O-1
5Bo
ttle
(anghis
tera
)67
.03
9.58
12.8
32.
672.
292.
960.
430.
070.
82<0
.04
0.18
0.29
0.91
<0.0
2<0
.04
nd<0
.04
<0.0
4<0
.08
A/2
AS
O-1
6Bo
ttle
(anghis
tera
)66
.99
13.1
08.
323.
432.
732.
291.
010.
141.
68<0
.04
0.35
0.11
1.07
<0.0
2<0
.04
nd<0
.04
<0.0
4<0
.08
A/3
AS
O-1
7t
Beak
er, c
olou
rless
bo
dy67
.79
11.6
411
.01
1.59
2.31
3.78
0.52
0.07
0.96
<0.0
40.
280.
250.
97<0
.02
0.05
<0.0
5<0
.04
<0.0
4<0
.08
A/1
AS
O-1
7b
Beak
er, b
lue
rim65
.19
11.1
110
.55
1.72
2.34
3.66
2.84
0.08
0.92
<0.0
40.
300.
240.
750.
380.
66<0
.05
0.25
0.05
0.15
_
AS
O-1
8t
Beak
er, c
olou
rless
bo
dy65
.49
11.3
211
.31
1.68
2.58
3.93
0.69
0.10
2.38
<0.0
40.
320.
220.
85<0
.02
0.06
<0.0
5<0
.04
<0.0
40.
11A
/1
AS
O-1
8b
Beak
er, b
lue
rim64
.19
10.9
111
.18
1.75
2.55
3.89
1.66
0.09
2.24
<0.0
40.
320.
200.
710.
190.
49<0
.05
0.22
0.05
0.18
_
AS
O-1
9t
Beak
er, c
olou
rless
bo
dy65
.53
11.8
010
.46
1.59
2.58
4.16
0.73
0.07
2.49
<0.0
40.
280.
250.
850.
040.
08<0
.05
<0.0
4<0
.04
0.13
A/1
AS
O-1
9b
Beak
er, b
lue
rim61
.84
10.8
29.
751.
742.
563.
834.
760.
092.
23<0
.04
0.29
0.21
0.59
0.78
1.22
<0.0
50.
500.
070.
23_
AS
O-2
0t
Beak
er, c
olou
rless
bo
dy65
.56
13.1
610
.21
1.43
2.12
4.49
0.87
0.10
1.04
<0.0
40.
240.
321.
08<0
.02
<0.0
4<0
.05
<0.0
4<0
.04
<0.0
8A
/1
AS
O-2
0b
Beak
er, b
lue
rim63
.74
12.6
69.
721.
532.
124.
272.
040.
091.
03<0
.04
0.24
0.32
1.00
0.49
0.81
0.15
<0.0
4<0
.04
<0.0
8_
AS
O-2
1t
Beak
er, c
olou
rless
bo
dy67
.77
10.9
09.
831.
102.
173.
281.
150.
062.
68<0
.04
0.24
0.25
0.93
<0.0
2<0
.04
<0.0
5<0
.04
<0.0
40.
12A
/1
AS
O-2
1b
Beak
er, b
lue
rim64
.02
10.1
19.
321.
342.
153.
114.
360.
082.
66<0
.04
0.25
0.21
0.68
0.72
0.75
<0.0
50.
500.
070.
20_
Tab
leD
.8:
Chem
ical
com
posi
tion
of
all
gla
sssa
mple
s,ex
pre
ssed
as
wei
ght
per
cent
(wt%
).O
nly
mea
ns
are
report
ed(n
d:
not
det
ecte
d).
Typ
ea
nd
com
po
siti
on
al
gro
up
als
ore
po
rted
for
each
sam
ple
.
198
199
APPENDIX E
Results of the strontium, neodymium and oxygen isotopic analyses performed on a
selection of Roman and Late Roman/early Medieval samples from Adria and Aquileia.
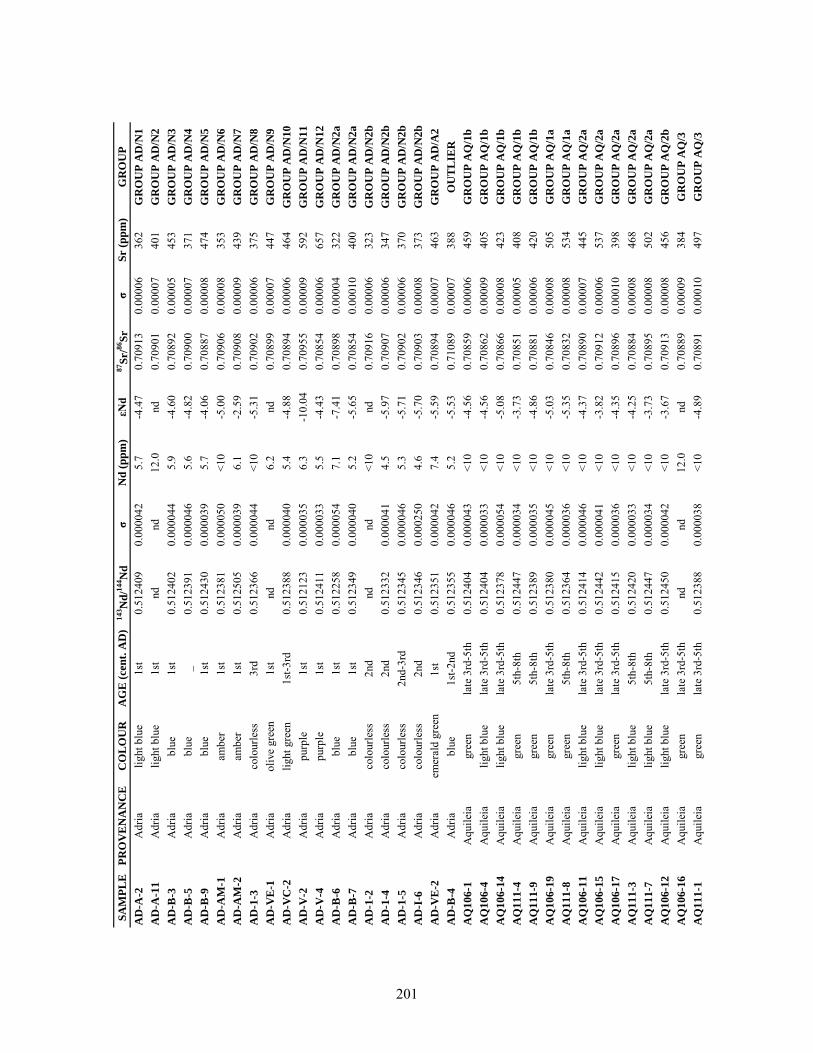
SA
MP
LE
PR
OV
EN
AN
CE
CO
LO
UR
AG
E (
cen
t. A
D)
14
3N
d/1
44N
dσ
Nd
(p
pm
)εN
d8
7S
r/8
6S
rσ
Sr (
pp
m)
GR
OU
P
AD
-A-2
Adr
ialig
ht b
lue
1st
0.51
2409
0.00
0042
5.7
-4.4
70.
7091
30.
0000
636
2G
RO
UP
AD
/N1
AD
-A-1
1A
dria
light
blu
e1s
t nd
nd12
.0nd
0.70
901
0.00
007
401
GR
OU
P A
D/N
2
AD
-B-3
Adr
iabl
ue1s
t 0.
5124
020.
0000
445.
9-4
.60
0.70
892
0.00
005
453
GR
OU
P A
D/N
3
AD
-B-5
Adr
iabl
ue_
0.51
2391
0.00
0046
5.6
-4.8
20.
7090
00.
0000
737
1G
RO
UP
AD
/N4
AD
-B-9
Adr
iabl
ue1s
t 0.
5124
300.
0000
395.
7-4
.06
0.70
887
0.00
008
474
GR
OU
P A
D/N
5
AD
-AM
-1A
dria
ambe
r1s
t 0.
5123
810.
0000
50<1
0-5
.00
0.70
906
0.00
008
353
GR
OU
P A
D/N
6
AD
-AM
-2A
dria
ambe
r1s
t 0.
5125
050.
0000
396.
1-2
.59
0.70
908
0.00
009
439
GR
OU
P A
D/N
7
AD
-1-3
Adr
iaco
lour
less
3rd
0.51
2366
0.00
0044
<10
-5.3
10.
7090
20.
0000
637
5G
RO
UP
AD
/N8
AD
-VE
-1A
dria
oliv
e gr
een
1st
ndnd
6.2
nd0.
7089
90.
0000
744
7G
RO
UP
AD
/N9
AD
-VC
-2A
dria
light
gre
en1s
t-3rd
0.
5123
880.
0000
405.
4-4
.88
0.70
894
0.00
006
464
GR
OU
P A
D/N
10
AD
-V-2
Adr
iapu
rple
1st
0.51
2123
0.00
0035
6.3
-10.
040.
7095
50.
0000
959
2G
RO
UP
AD
/N1
1
AD
-V-4
Adr
iapu
rple
1st
0.51
2411
0.00
0033
5.5
-4.4
30.
7085
40.
0000
665
7G
RO
UP
AD
/N1
2
AD
-B-6
Adr
iabl
ue1s
t0.
5122
580.
0000
547.
1-7
.41
0.70
898
0.00
004
322
GR
OU
P A
D/N
2a
AD
-B-7
Adr
iabl
ue1s
t0.
5123
490.
0000
405.
2-5
.65
0.70
854
0.00
010
400
GR
OU
P A
D/N
2a
AD
-1-2
Adr
iaco
lour
less
2nd
ndnd
<10
nd0.
7091
60.
0000
632
3G
RO
UP
AD
/N2
b
AD
-1-4
Adr
iaco
lour
less
2nd
0.51
2332
0.00
0041
4.5
-5.9
70.
7090
70.
0000
634
7G
RO
UP
AD
/N2
b
AD
-1-5
Adr
iaco
lour
less
2nd-
3rd
0.51
2345
0.00
0046
5.3
-5.7
10.
7090
20.
0000
637
0G
RO
UP
AD
/N2
b
AD
-I-6
Adr
iaco
lour
less
2nd
0.51
2346
0.00
0250
4.6
-5.7
00.
7090
30.
0000
837
3G
RO
UP
AD
/N2
b
AD
-VE
-2A
dria
emer
ald
gree
n1s
t 0.
5123
510.
0000
427.
4-5
.59
0.70
894
0.00
007
463
GR
OU
P A
D/A
2
AD
-B-4
Adr
iabl
ue1s
t-2nd
0.51
2355
0.00
0046
5.2
-5.5
30.
7108
90.
0000
738
8O
UT
LIE
R
AQ
10
6-1
Aqu
ileia
gree
nla
te 3
rd-5
th
0.51
2404
0.00
0043
<10
-4.5
60.
7085
90.
0000
645
9G
RO
UP
AQ
/1b
AQ
10
6-4
Aqu
ileia
light
blu
ela
te 3
rd-5
th
0.51
2404
0.00
0033
<10
-4.5
60.
7086
20.
0000
940
5G
RO
UP
AQ
/1b
AQ
10
6-1
4A
quile
ialig
ht b
lue
late
3rd
-5th
0.
5123
780.
0000
54<1
0-5
.08
0.70
866
0.00
008
423
GR
OU
P A
Q/1
b
AQ
11
1-4
Aqu
ileia
gree
n5t
h-8t
h 0.
5124
470.
0000
34<1
0-3
.73
0.70
851
0.00
005
408
GR
OU
P A
Q/1
b
AQ
11
1-9
Aqu
ileia
gree
n5t
h-8t
h 0.
5123
890.
0000
35<1
0-4
.86
0.70
881
0.00
006
420
GR
OU
P A
Q/1
b
AQ
10
6-1
9A
quile
iagr
een
late
3rd
-5th
0.
5123
800.
0000
45<1
0-5
.03
0.70
846
0.00
008
505
GR
OU
P A
Q/1
a
AQ
11
1-8
Aqu
ileia
gree
n5t
h-8t
h 0.
5123
640.
0000
36<1
0-5
.35
0.70
832
0.00
008
534
GR
OU
P A
Q/1
a
AQ
10
6-1
1A
quile
ialig
ht b
lue
late
3rd
-5th
0.
5124
140.
0000
46<1
0-4
.37
0.70
890
0.00
007
445
GR
OU
P A
Q/2
a
AQ
10
6-1
5A
quile
ialig
ht b
lue
late
3rd
-5th
0.
5124
420.
0000
41<1
0-3
.82
0.70
912
0.00
006
537
GR
OU
P A
Q/2
a
AQ
10
6-1
7A
quile
iagr
een
late
3rd
-5th
0.
5124
150.
0000
36<1
0-4
.35
0.70
896
0.00
010
398
GR
OU
P A
Q/2
a
AQ
11
1-3
Aqu
ileia
light
blu
e5t
h-8t
h 0.
5124
200.
0000
33<1
0-4
.25
0.70
884
0.00
008
468
GR
OU
P A
Q/2
a
AQ
11
1-7
Aqu
ileia
light
blu
e5t
h-8t
h 0.
5124
470.
0000
34<1
0-3
.73
0.70
895
0.00
008
502
GR
OU
P A
Q/2
a
AQ
10
6-1
2A
quile
ialig
ht b
lue
late
3rd
-5th
0.
5124
500.
0000
42<1
0-3
.67
0.70
913
0.00
008
456
GR
OU
P A
Q/2
b
AQ
10
6-1
6A
quile
iagr
een
late
3rd
-5th
nd
nd12
.0nd
0.70
889
0.00
009
384
GR
OU
P A
Q/3
AQ
11
1-1
Aqu
ileia
gree
nla
te 3
rd-5
th
0.51
2388
0.00
0038
<10
-4.8
90.
7089
10.
0001
049
7G
RO
UP
AQ
/3
201
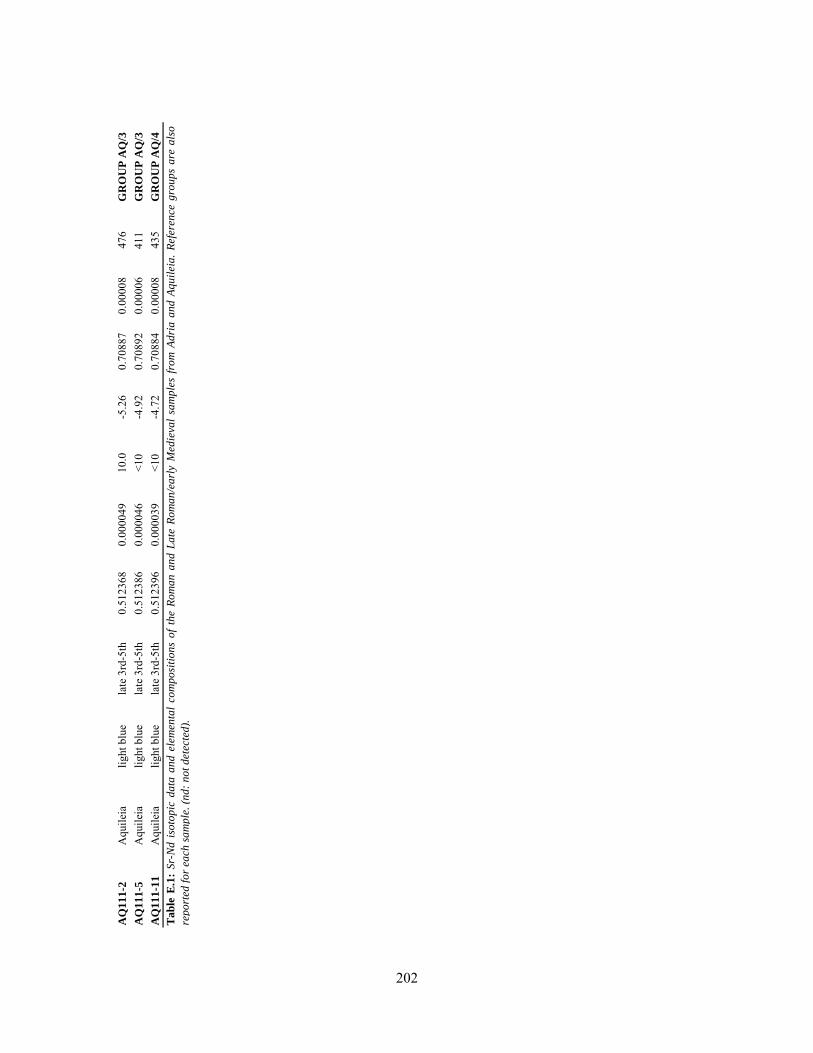
AQ
11
1-2
Aqu
ileia
light
blu
ela
te 3
rd-5
th
0.51
2368
0.00
0049
10.0
-5.2
60.
7088
70.
0000
847
6G
RO
UP
AQ
/3
AQ
11
1-5
Aqu
ileia
light
blu
ela
te 3
rd-5
th
0.51
2386
0.00
0046
<10
-4.9
20.
7089
20.
0000
641
1G
RO
UP
AQ
/3
AQ
11
1-1
1A
quile
ialig
ht b
lue
late
3rd
-5th
0.
5123
960.
0000
39<1
0-4
.72
0.70
884
0.00
008
435
GR
OU
P A
Q/4
Ta
ble
E.1
:S
r-N
dis
oto
pic
da
taa
nd
elem
enta
lco
mp
osi
tio
ns
of
the
Ro
ma
na
nd
La
teR
om
an
/ea
rly
Med
ieva
lsa
mp
les
fro
mA
dri
aa
nd
Aq
uil
eia
.R
efer
ence
gro
up
sa
rea
lso
rep
ort
ed f
or
each
sa
mp
le.
(nd
: n
ot
det
ecte
d).
202
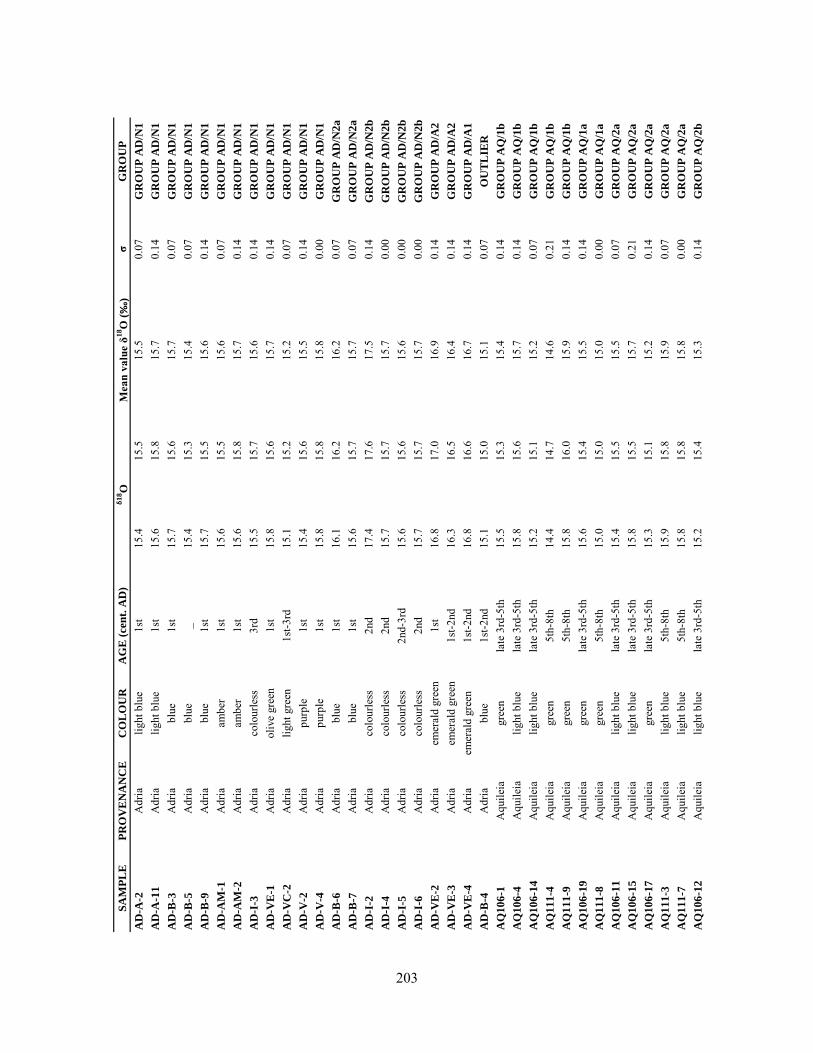
SA
MP
LE
PR
OV
EN
AN
CE
CO
LO
UR
AG
E (
cen
t. A
D)
Mea
n v
alu
e δ
18O
(‰
)σ
GR
OU
P
AD
-A-2
Adr
ialig
ht b
lue
1st
15.4
15.5
15.5
0.07
GR
OU
P A
D/N
1
AD
-A-1
1A
dria
light
blu
e1s
t15
.615
.815
.70.
14G
RO
UP
AD
/N1
AD
-B-3
Adr
iabl
ue1s
t15
.715
.615
.70.
07G
RO
UP
AD
/N1
AD
-B-5
Adr
iabl
ue_
15.4
15.3
15.4
0.07
GR
OU
P A
D/N
1
AD
-B-9
Adr
iabl
ue1s
t15
.715
.515
.60.
14G
RO
UP
AD
/N1
AD
-AM
-1A
dria
ambe
r1s
t15
.615
.515
.60.
07G
RO
UP
AD
/N1
AD
-AM
-2A
dria
ambe
r1s
t15
.615
.815
.70.
14G
RO
UP
AD
/N1
AD
-I-3
Adr
iaco
lour
less
3rd
15.5
15.7
15.6
0.14
GR
OU
P A
D/N
1
AD
-VE
-1A
dria
oliv
e gr
een
1st
15.8
15.6
15.7
0.14
GR
OU
P A
D/N
1
AD
-VC
-2A
dria
light
gre
en1s
t-3rd
15.1
15.2
15.2
0.07
GR
OU
P A
D/N
1
AD
-V-2
Adr
iapu
rple
1st
15.4
15.6
15.5
0.14
GR
OU
P A
D/N
1
AD
-V-4
Adr
iapu
rple
1st
15.8
15.8
15.8
0.00
GR
OU
P A
D/N
1
AD
-B-6
Adr
iabl
ue1s
t16
.116
.216
.20.
07G
RO
UP
AD
/N2
a
AD
-B-7
Adr
iabl
ue1s
t15
.615
.715
.70.
07G
RO
UP
AD
/N2
a
AD
-I-2
Adr
iaco
lour
less
2nd
17.4
17.6
17.5
0.14
GR
OU
P A
D/N
2b
AD
-I-4
Adr
iaco
lour
less
2nd
15.7
15.7
15.7
0.00
GR
OU
P A
D/N
2b
AD
-I-5
Adr
iaco
lour
less
2nd-
3rd
15.6
15.6
15.6
0.00
GR
OU
P A
D/N
2b
AD
-I-6
Adr
iaco
lour
less
2nd
15.7
15.7
15.7
0.00
GR
OU
P A
D/N
2b
AD
-VE
-2A
dria
emer
ald
gree
n1s
t16
.817
.016
.90.
14G
RO
UP
AD
/A2
AD
-VE
-3A
dria
emer
ald
gree
n1s
t-2nd
16.3
16.5
16.4
0.14
GR
OU
P A
D/A
2
AD
-VE
-4A
dria
emer
ald
gree
n1s
t-2nd
16.8
16.6
16.7
0.14
GR
OU
P A
D/A
1
AD
-B-4
Adr
iabl
ue1s
t-2nd
15.1
15.0
15.1
0.07
OU
TL
IER
AQ
10
6-1
Aqu
ileia
gree
nla
te 3
rd-5
th15
.515
.315
.40.
14G
RO
UP
AQ
/1b
AQ
10
6-4
Aqu
ileia
light
blu
ela
te 3
rd-5
th15
.815
.615
.70.
14G
RO
UP
AQ
/1b
AQ
10
6-1
4A
quile
ialig
ht b
lue
late
3rd
-5th
15.2
15.1
15.2
0.07
GR
OU
P A
Q/1
b
AQ
11
1-4
Aqu
ileia
gree
n5t
h-8t
h14
.414
.714
.60.
21G
RO
UP
AQ
/1b
AQ
11
1-9
Aqu
ileia
gree
n5t
h-8t
h15
.816
.015
.90.
14G
RO
UP
AQ
/1b
AQ
10
6-1
9A
quile
iagr
een
late
3rd
-5th
15.6
15.4
15.5
0.14
GR
OU
P A
Q/1
a
AQ
11
1-8
Aqu
ileia
gree
n5t
h-8t
h15
.015
.015
.00.
00G
RO
UP
AQ
/1a
AQ
10
6-1
1A
quile
ialig
ht b
lue
late
3rd
-5th
15.4
15.5
15.5
0.07
GR
OU
P A
Q/2
a
AQ
10
6-1
5A
quile
ialig
ht b
lue
late
3rd
-5th
15.8
15.5
15.7
0.21
GR
OU
P A
Q/2
a
AQ
10
6-1
7A
quile
iagr
een
late
3rd
-5th
15.3
15.1
15.2
0.14
GR
OU
P A
Q/2
a
AQ
11
1-3
Aqu
ileia
light
blu
e5t
h-8t
h15
.915
.815
.90.
07G
RO
UP
AQ
/2a
AQ
11
1-7
Aqu
ileia
light
blu
e5t
h-8t
h15
.815
.815
.80.
00G
RO
UP
AQ
/2a
AQ
10
6-1
2A
quile
ialig
ht b
lue
late
3rd
-5th
15.2
15.4
15.3
0.14
GR
OU
P A
Q/2
b
δ1
8O
203
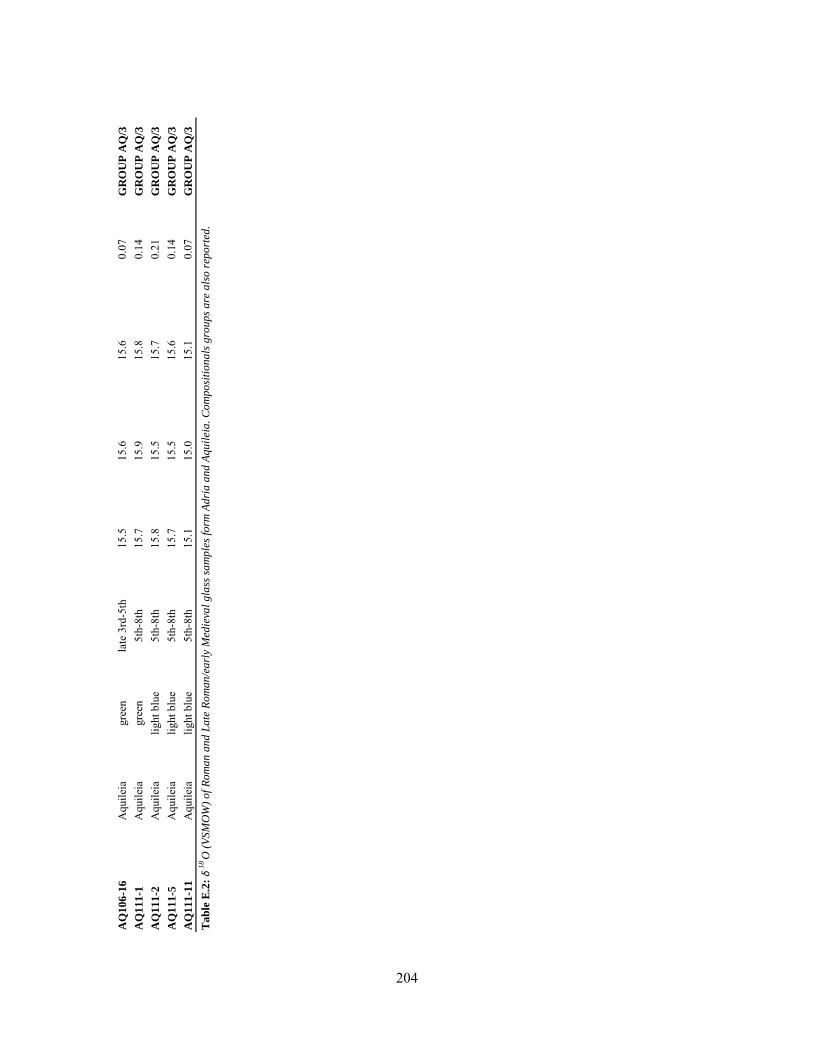
AQ
10
6-1
6A
quile
iagr
een
late
3rd
-5th
15.5
15.6
15.6
0.07
GR
OU
P A
Q/3
AQ
11
1-1
Aqu
ileia
gree
n5t
h-8t
h15
.715
.915
.80.
14G
RO
UP
AQ
/3
AQ
11
1-2
Aqu
ileia
light
blu
e5t
h-8t
h15
.815
.515
.70.
21G
RO
UP
AQ
/3
AQ
11
1-5
Aqu
ileia
light
blu
e5t
h-8t
h15
.715
.515
.60.
14G
RO
UP
AQ
/3
AQ
11
1-1
1A
quile
ialig
ht b
lue
5th-
8th
15.1
15.0
15.1
0.07
GR
OU
P A
Q/3
Ta
ble
E.2
: δ
18O
(V
SM
OW
) o
f R
om
an
an
d L
ate
Ro
ma
n/e
arl
y M
edie
val
gla
ss s
am
ple
s fo
rm A
dri
a a
nd
Aq
uil
eia
. C
om
po
siti
on
als
gro
up
s a
re a
lso
rep
ort
ed.
204