Embed Size (px)
Citation preview

1
Glastir Woodland Creation: Opportunities Map Guidance
This guidance shows how the Glastir Woodland Creation (GWC) opportunity map works in order to support decision making on new planting in Wales.
Contents 1. Find the GWC opportunity map 2
2. Language selection 2
3. Using the opportunity map 3
Step 1 – Find an area of interest Step 2 – Select a base map Step 3 – Set layers and adjust transparency Step 4 – Draw a new planting area Step 5 – Draw a fence line Step 6 – Find out if there are sensitivities in the new planting area Step 7 – Information on Woodland Creation scoring Step 8 – Information on Special Guidance layers
Annexe 1: Why the opportunity map was developed 10 Annexe 2: How the opportunity map was developed 10 Annexe 3: Woodland Creation scoring layers 11 Annexe 4: Woodland Creation information layers 13

2
1. WHERE TO FIND THE GWC OPPORTUNITY MAP Lle is a spatial data system provided by the Welsh Government and serves as a centre for online geographical information. It can be found by navigating to http://lle.gov.wales/apps/woodlandopportunities. Alternatively, navigate through the Lle website by selecting “Applications” and choose “Glastir Woodland Creation – Opportunities Map” – see Figure 1 below. Figure 1 - A guide to navigate to the GWC opportunity map from the Lle homepage
2. LANGUAGE SELECTION On opening the Glastir Woodland Creation opportunity map, an information box will appear. In the top right corner Cymraeg can be selected. The language selection can be changed between English and Welsh at any time.

3
3. USING THE GWC OPPORTUNITY MAP This section shows how to determine the suitability of an area for new planting, and how to find whether there are any constraints or sensitivities associated with that area (see Annexe 4 for more information).
Step 1: Find the area of interest There are 3 ways to find a place of interest:-
Use the scroll button on the mouse to zoom in to the area of interest
Use the zoom buttons in the top left of the map screen (+ and – symbols) - (see Figure 2 – 1A)
Use the search option at the top centre of the map screen (see Figure 2 – 1B) by typing a place name, postcode, or grid reference, e.g. Aberystwyth, SY23 3UR (use a space when using postcodes) or SN 591 809.
A 6 digit national grid reference will be displayed wherever your cursor is over the map browser. This is shown in the bottom right corner of the screen and may be useful for planting applications (see Figure 2 – 1C).
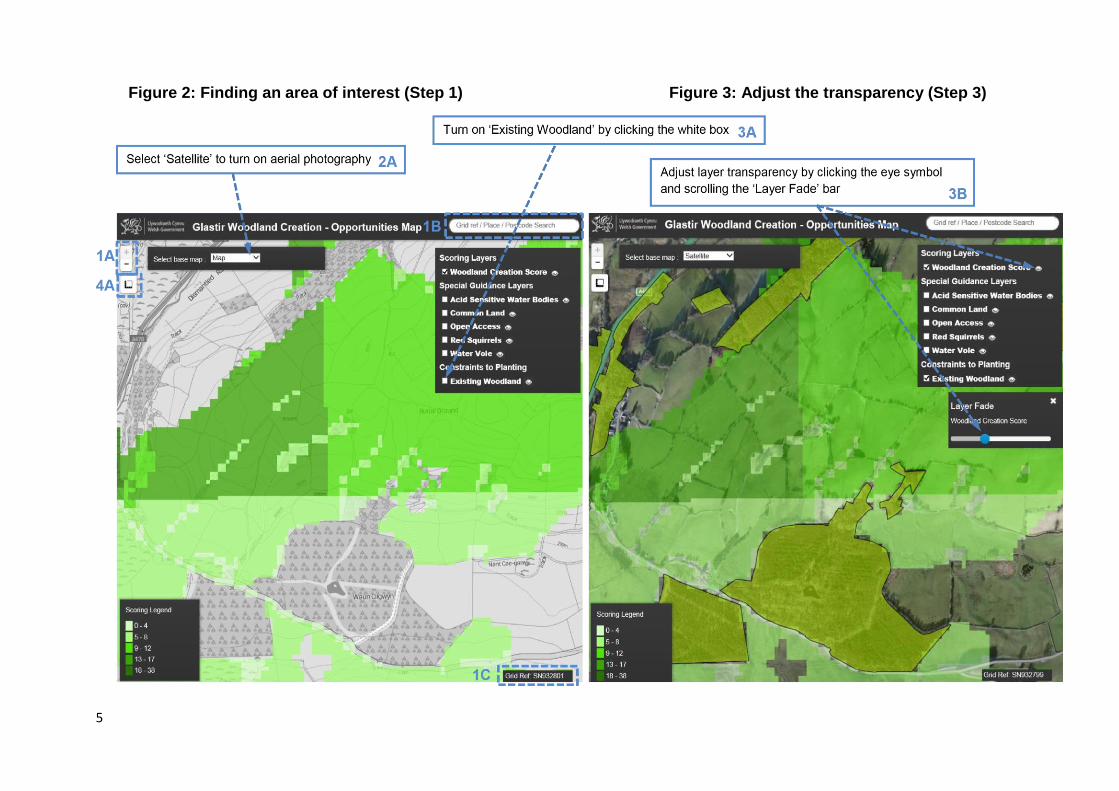
In Figure 2, there are green areas of different shading as well as transparent areas showing the Ordnance Survey (OS) map underneath. A green area indicates there are no identified constraints or sensitivities for woodland creation. A transparent area indicates an area with a sensitivity which is likely to require stakeholder consultation. Step 2: Select a base map The next step is to select which base map you would like to use - either greyscale mapping, colour mapping or aerial photography (see Figure 2 – 2A). Step 3: Set the layers of choice and adjust transparency Only the ‘Woodland Creation Score’ on the Scoring Layer is switched on, but others can be selected, existing woodland for example (see Figure 2 – 3A). Annexe 2 gives more information on the Woodland Creation scoring layer. To adjust layer transparency, click the eye symbol and scroll the transparency bar until the optimal displace is reached (see Figure 3 – 3B). Step 4: Draw a new planting area Click the ‘Measure distances and areas’ box (see Figure 2 – 4A) and select the ‘Create new area measurement’ option. The cursor and left mouse clicks can be used to draw an area of interest around a proposed woodland creation site. Once a suitable area has been drawn, double left click the mouse on the final point and an ‘Area Measurement’ box will appear (see Figure 4). The area of potential new woodland is shown in hectares which can be used in a GWC application. Step 5: Draw a fence line Click the ‘Create a new line measurement’ (see Figure 2 – 4A) to get fencing length around a new woodland creation site. Use the left mouse button to click from the beginning to the end of the fencing and use additional mouse clicks for corners or bends. Figure 5 shows a red line representing a fencing length around a new planting area.

4
Step 6: Find out if there are sensitivities in the new planting area Green shading represents an area without constraints or sensitivities. In transparent areas, constraints or sensitivities will be shown once a new planting area has been drawn (Step 4). To determine individual sensitivities, click on the blue text “Click here to view the points of interest the area intersects” (see Figure 6 – red box A). To get more information on the sensitivity, click the sensitivity label (see Figure 6 – red box B). This will bring up another information box describing the sensitivity and will often direct you to the relevant stakeholder (see Figure 6 – C). Step 7: Information on Woodland Creation scoring Click on the Woodland Creation Score title to get more information on the layers (see Figure 7 – red box A). Each of the scored input layers can also be clicked on for additional information (see Figure 7 – red box B and C). Annexe 3 gives some background information on the Woodland Creation scoring layers.
Step 8: Information on Special Guidance layers Each Special Guidance layer can be clicked on to get more information on their creation and what the data shows. For example, the e.g. Acid Sensitive Catchments background information can be found by clicking its title in the table of contents – see Figure 8 red box A. Links to stakeholders can also then be used by clicking the blue text (see Figure 8 red box B).
5
Figure 2: Finding an area of interest (Step 1) Figure 3: Adjust the transparency (Step 3)

6
Figure 4: Draw a new planting area (Step 4) Figure 5: Draw fence line (Step 5)

7
Figure 6: Find out if there are sensitivities within a new planting area (Step 6)
C
A
B

8
Figure 7: Woodland Creation scoring layer (Step 7)
B
C
A

9
Figure 8: Woodland Creation scoring layer (Step 8)
A
B

10
Annexe 1: Why the opportunity map was developed?
Glastir is the Welsh Government’s (WG) land management scheme which financially rewards land managers and farmers for the delivery of specific environmental goods and services. Glastir Woodland Creation (GWC) aims to support land managers and farmers to create new woodland within Wales http://gov.wales/topics/environmentcountryside/farmingandcountryside/farming/schemes/glastir/glastir-woodland/glastirwoodlandcreation Stakeholders have provided spatial data which show suitable and less suitable areas for new planting (see Annexe 2 for details of the spatial data). The GWC opportunities map has been developed to show the results of merging these spatial datasets.
Annexe 2 : How the opportunity map was developed
Each geographic data layer acquired from stakeholders was either allocated to a scoring layer or an information layer i.e. shows constraints or sensitivities which may impact on new planting. A list of all data layers included in the current GWC opportunity map is shown in Table 1. Table 1 – Layers shown in the GWC opportunity map
Scoring layer (Green layer) Information layer (Transparent layer) Communities First Areas Areas of Outstanding Natural Beauty
(AONBs)
Noise Pollution Areas Bracken with Pearl Bordered Fritillary Habitat
Nitrate Vulnerable Zones (NVZs) Upland Special Protection Area (SPA) with 500m buffer
Habitat Suitability (habitat surveys) NRW Sensitive Habitats (habitat surveys)
New Flood Plain and Riparian Woodland (NFPW)
National Parks with 800m buffer (excluding Brecon Beacons)
Air Pollution Areas Grassland Fungi Potential Habitat
Woodland Habitat Networks (WHNs) Sensitive Arable Plant Records
University of East Anglia: Woodland creation potential
Deep peat and modified deep peat
Protected Species (Birds) Potential Habitat
Protected Species (Great Crested Newt) Potential Habitat
Regionally Important Geodiversity Site (RIGS)
Scheduled Ancient Monument (SAM)
Sites of Special Scientific Interest (SSSIs)
Biological SSSI with 300m buffer
Historic Environment Features (WATs_
Historic Landscape Areas (WATs)
Historic Parks and Gardens
World Heritage Site

11
Annexe 3: Woodland Creation scoring layers
To create the “woodland creation score” 8 scored layers were aligned to a representation of a 20m2 grid – these 8 datasets are shown in Figure 9. Figure 9 - Geographical datasets for the Woodland Creation scoring layers
12
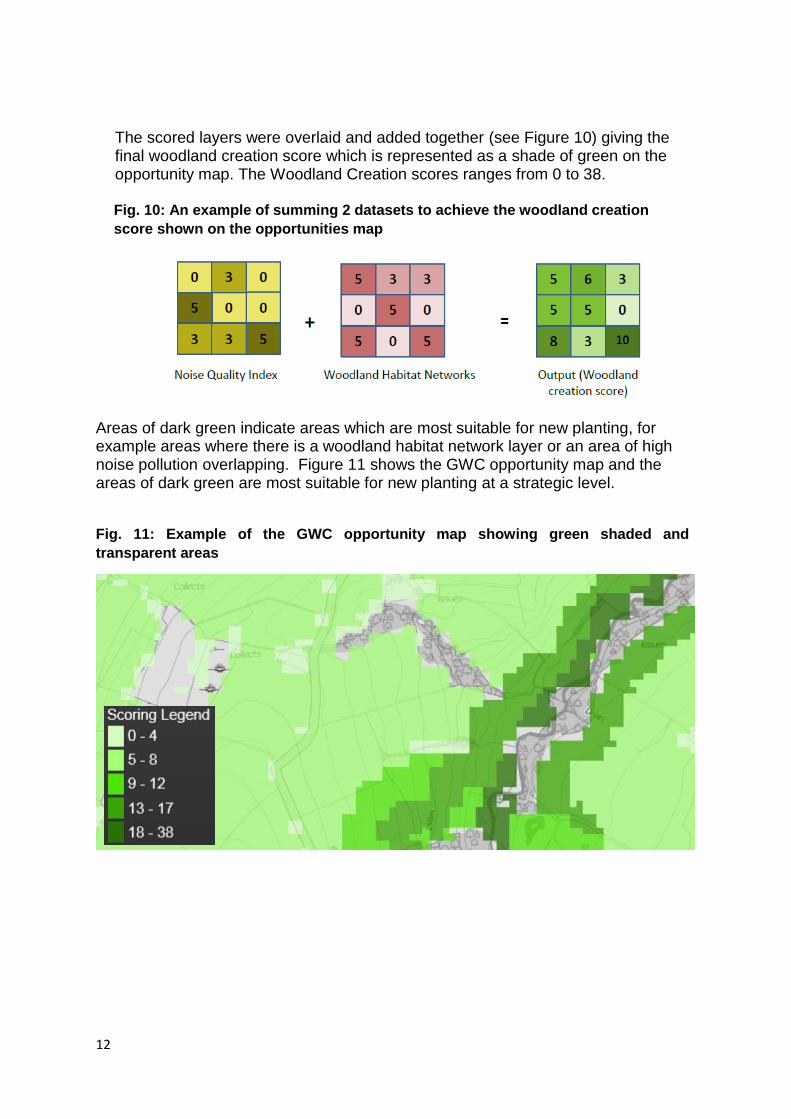
The scored layers were overlaid and added together (see Figure 10) giving the final woodland creation score which is represented as a shade of green on the opportunity map. The Woodland Creation scores ranges from 0 to 38. Fig. 10: An example of summing 2 datasets to achieve the woodland creation
score shown on the opportunities map
Areas of dark green indicate areas which are most suitable for new planting, for example areas where there is a woodland habitat network layer or an area of high noise pollution overlapping. Figure 11 shows the GWC opportunity map and the areas of dark green are most suitable for new planting at a strategic level.
Fig. 11: Example of the GWC opportunity map showing green shaded and
transparent areas

13
Annexe 4: Woodland Creation information layers
There are 18 information layers (see Figure 12) which show constraints or sensitivities for woodland creation. These information layers were provided by stakeholders and are deemed to be potentially unsuitable for new woodland creation. It is important to bear in mind data resolution here. The information layers often take a precautionary approach to ensure that areas to be conserved are well protected. To ensure a fair application, all GWC plans are verified by Natural Resources Wales to comply with UK Forestry Standard (UKFS).
Fig. 12: Information layers used for the GWC opportunities map
Approximately 50% of Wales is covered by at least one information layer. These areas are shown as transparent in the GWC opportunity map. Over time these information layers will change as refined data becomes available or as policy changes. There may also be suitable areas for woodland creation within these transparent areas particularly within large expanses of landscape designations such as AONBs or National Parks so it is important to seek advice from the appropriate stakeholder.