Embed Size (px)
Citation preview
GLOBAL COMPETITION FOR THE JAPANESE FRUIT JUICE MARKET:A Uniform Substitute
Demand Analysis
Shiferaw T. Feleke, Research Associate,
Department of Animal Sciences, University of Florida
and
Richard L. Kilmer,
Professor, Food and Resource Economics Department,
University of Florida
Selected Paper prepared for the American Agricultural Economics Association Annual Meeting, Portland, Oregon, July 29August 1, 2007.
Copyright 2007 by Shiferaw T. Feleke and Richard L. Kilmer. All rights reserved. Readers may make verbatim copies of this document for non-commercial purposes by any means, provided that this copyrights notice appears on all such copies.
2
GLOBAL COMPETITION FOR THE JAPANESE FRUIT JUICE MARKET: A Uniform Demand Analysis
Shiferaw T. Feleke and Richard L. Kilmer
__________________________________________________________________ Abstract
This study analyzes the competitiveness of countries exporting fruit juices into Japan through market structure analysis (MSA) within the context of a consumer demand theory using the relative price version of the Rotterdam model and the block-wise dependent uniform substitute Rotterdam model The models were estimated for six different kinds of fruit juices (orange, grapefruit, other citrus, apple, pineapple and grape juices imported from 18 countries) on monthly per capita data over the period December, 1995, to May, 2005, using the non-linear least squares (LSQ) in the Time Series Processor (TSP) program. Results indicate that the market structure underlying the competition for the Japanese fruit juice market is non-uniformly competitive. Consequently, an exporter can’t take market share from another exporter quickly through price reductions. Product promotion and further product differentiation seems to be a more plausible option than a price reduction option for most countries to stay more competitive in Japan’s fruit juice market. Nevertheless, Brazil has the most to gain from an increase in the size of the Japanese fruit juice market. The United States citrus industry and the Philippines fruit industry have a competitive advantage in the export of orange and pineapple juices, respectively.
__________________________________________________________________
Key words: Competitiveness, Fruit juice, Japan, Relative price version,
INTRODUCTION
Following the deregulation of imports of apple, grapefruit, and pineapple juices as of
April 1990 and that of orange juice as of April 1992, the import penetration ratio (the fraction of
income spent on imports or the increase in the extent of consumption of imports) of processed
fruits into Japan has increased (JETRO). Furthermore, Japan is undergoing a profound change as
a result of its aging population. Japan's statistical agency has measured a decline in population
growth that is about to become an absolute decline, and population shrank for the first time in
2006 and will gradually fall for a number of years thereafter. The impact of this demographic
3
change on the demand for fruit in Japan is an empirical question, since either the aging affluent
consumers may increase consumption of fruits to stay healthy or demand may decrease with the
absolute decrease in population size. In either case, the increase of import penetration in the face
of an aging population and declining population growth will lead to an increased competition
among exporters.
Given that Japan is the second largest economy in the world with a population of about
127 million, importing agricultural products worth over $30 billion each year, this study is useful
and relevant to better understand the global fruit juice market. The objectives of this study are to
assess the competitiveness of the world’s largest exporters of fruit juice into Japan through MSA
and to simulate the impact of changes in population growth on the growth rate of demand for
fruit juices by country of origin. To this end, the relative price version of the Rotterdam model
was estimated.
Global Fruit Trade
International trade in fruits and vegetables has expanded more rapidly than trade in other
agricultural commodities, especially since the 1980s (Huang, 2004). This is attributed to rising
incomes, falling transportation costs, improved technology, and evolving international
agreements. Citrus fruits rank first in international fruit trade in terms of value (UNCTAD). As
a result of trade liberalization and technological advances in fruit transport and storage, the citrus
fruit industry is becoming more global in scope. The major players in the global trade of fruits
and vegetables are the E.U, the North American Free Trade Agreement (NAFTA) countries,
China and Japan.
The international trade on fruits and vegetables is dominated by processed forms. Citrus
fruit processing accounts for approximately one third of total citrus fruit production. More than
80% of it is orange processing, mostly for orange juice production. The major feature of the
4
world market for orange juice is the geographical concentration of production. There are only
two main players: the State of Florida in the U.S. and the State of Sao Paulo in Brazil.
Production of orange juice between these two players account for over 80% of world orange
juice production (Spreen et al. 2006). The major difference between them is that Brazil exports
99 percent of its production while 90 percent of Florida’s production is consumed domestically
and only 10 percent is exported (UNCTAD).
The E.U. is the largest importer of orange juice, accounting for over 80% of the world
orange juice imports (UNCTAD). The other major importers of orange juice are Canada and
Japan. Most of imports by the E.U. and Japan come from Brazil. Brazil’s exports of orange juice
to Japan account for over 70% of Japan’s total import of orange juice (Table 1). In North
America, the U.S. and Canada consume orange juice mainly from Florida, while a small quantity
of imports comes from Brazil. The U.S. is the leading exporter of apple juice, grapefruit juice
and grape juice to Japan. Thailand and Israel are the leading exporters of pineapple juice and
other citrus, respectively. The U.S. share of grapefruit import is significant. However, the slow
growth rate of grapefruit production in U.S. implies that the U.S. is unlikely to continue as a
dominant supplier of grapefruit juice. The same is true with apple juice since the apple
production growth rate in U.S. is slower relative to other countries such as China. Currently, the
U.S. is a dominant supplier of apple juice to the Japanese market, followed by China and Austria.
With regard to grape juice, the U.S. is still the dominant supplier and is expected to dominant the
market since its production has been growing while that of France and Italy, which are the
world’s largest producers, has been declining.
Global Fruit Consumption
Fruits are consumed mainly in industrialized countries, not only because consumers in
these countries have high income levels but also because they have increasing concerns about
5
healthy eating. However, the growth of per capita consumption of fruits in these countries seems
to be stagnating. Over the period 1980 to 2003, the per capita consumption of citrus fruits
(oranges, grapefruit and lemons and limes) in these countries grew at an average rate of one
percent per annum (FAO, 2005).
Among 26 industrialized countries, the U.S. and Canada are the largest consumers of
orange and mandarins followed by the EU. In fact, some E.U. countries such as Ireland, the
Netherlands and Greece consume more oranges than do the U.S. and Canada on a per capita
basis. The average per capita consumption of oranges and Mandarins in industrialized countries
over the period 1990 to 2003 is 29 kilograms while that of grapefruit and lemons and limes is 3.0
and 3.6 kilograms, respectively (Table 2).
Japan’s consumption of both citrus (except grapefruit) and non-citrus fruits is small
compared to other industrialized countries. The average annual per capita consumption of
oranges and apples in Japan over the period 1980 to 2003 is about 14 and 12 kilograms,
respectively, while those of grapes and grapefruit are 2.8 and 2.5 kilograms, respectively (Table
2).
Japan’s domestic supply of pineapples is heavily dependent on imports. In 2003, 95% of
the domestic supply of pineapples came from imports (FAO, 2005). Japan is also heavily
dependent on imports for its supply of lemons and limes. In terms of apples and grapes, the
significance of imports has been increasing since the last decade during which the deregulation
was in effect.
Market Structure Analysis (MSA)
A fundamental understanding of the competition for market share involves MSA, which
refers to the process of organizing a set of products such that their interrelationships are apparent
6
(Allenby, 1989) or decomposing product markets into managerially useful partitions (Russel and
Bolton, 1988). MSA explains the nature and extent of competition or the extent to which
products are substitutes or complements.
MSA in marketing is concerned with identifying closely competing brands of the same
product (Clements and Selvanathan, 1988). The identification of market structure is useful for
assessing strategic opportunities, developing marketing programs, and assessing market share to
evaluate performance (Vilcassim, 1989). Consumption theory is amenable to the identification of
market structure through the analysis of the change in marginal utilities of a certain product due
to a change in consumption of a closely related product. The changes in marginal utilities
depend on how consumers perceive a specific commodity from one country and the same
commodity from another country.
The decrease in marginal utility of one product with an increased consumption of another
product implies that the products are substitutes and are thus in a competitive market structure.
Otherwise, they are not substitutes (i.e., complements or independent) and are thus in a non-
competitive market structure. Substitute products can be uniform (close) or non-uniform
(differentiated). Similarly, competitive market structure can be uniformly competitive or non-
uniformly competitive. A group of closely-related products are uniform substitutes when the
cross effect of an additional dollar spent on one product on the marginal utility of another dollar
spent on another product is the same for all pairs of products in the group (Brown, 1993). If
two products are uniform substitutes, consumers are not influenced by the country of origin.
They perceive a specific commodity from one country and the same commodity from another
country as homogenous. Consequently, price will be the overriding factor in the decision of
purchase. In this case, price reduction is recommended to increase market share.
7
On the contrary, if two products are non-uniform substitutes, consumers are influenced
by the country of origin. They perceive a specific commodity from one country and the same
commodity from another country as differentiated. Consequently, price will be just one factor
affecting consumers’ decision of purchase. Product attributes come into play in consumers’
decision of purchase. In this case, a non-price marketing strategy (e.g., product promotion)
and/or price reduction is recommended to increase market share.
In order to identify the market structure underlying the global competition for the
Japanese fruit juice market, we hypothesize that the relationship between any two fruit juices in
two different groups is block wise dependent and the relationship between any two fruit juices
within the same product group is uniform. The null hypothesis of block wise dependent
relationship states that the marginal utility of a dollar spent on the thi product ( )gSi∈ caused by
an extra dollar spent on the thj product which belongs to a different group ( )hgSj h ≠∈ , equals
some constant gha and the null hypothesis of uniform substitute relationship states that the
marginal utility of a dollar spent on the thi product ( )gSi∈ caused by an extra dollar spent on the
ths product which belongs to the same group ( )gSs∈ equals some constant α. This joint
hypothesis can mathematically expressed as
(1) ( )
( ) ( )( )
( ) ( ) Ss i,for
;;;;;:
G
22
0
∈
=∂∂
∂≠∈∈=
∂∂∂ α
ssiihggh
jjii qpqpquhgSjSia
qpqpquH
( )( ) ( )
( )( ) ( )
Ss i,for
;;;;;:
G
22
∈
≠∂∂
∂≠∈∈≠
∂∂∂ α
ssiihggh
jjiiA qpqp
quhgSjSiaqpqp
quH
where ( ) ( ) ( ) ( )( )mg1 Mn1MMGn1GGn1111 q,...,qu,...,q,...,qu,...,q,...,quuqu =
8
The joint null hypothesis 0H defines the uniformly competitive market structure while
the alternative hypothesis AH defines the non-uniformly competitive market structure. The non-
uniformly competitive structure involves a competition between products such that the effect of a
change in price of a given product on the demand for another product varies from product to
product irrespective of their groups. The uniformly competitive structure involves a competition
between products such that the effect of a change in price of a given product in one product
group on the demand for another product in another product group is the same to all pairs of
products in the two groups. These market structures are derived based on the relationship
between the changes in marginal utilities and cross price effects. The changes in marginal
utilities (equation 1) are related to cross price effects as mpupv jij
iij = where ijv is the specific
relative price coefficient; ip is the price of product i ; iju is the rate of change of marginal
utilities; jp is the price of product j and m is total expenditure. The variation in cross price
effects between any two products in two different product groups is explained by the variation in
the rate of changes of marginal utilities. The changes in the rate of marginal utilities and hence
in cross price effects between any two products in two different product groups in the uniformly
competitive market structure are the same while they are different in the non-uniformly
competitive market structure.
(1) Uniformly competitive market
This is the case where a product is competing with another product outside its product
group such that the effect of a change in price of a product in one group on the demand for
another product which belongs to a different group is the same for all pairs of products in the two
groups. Further, the effect of a change in price of a product in one group on the demand for
another product within the same group is the same for all pairs of products within that group.
9
This implies that consumers don’t care about the country of origin of the product. This means,
for example, that the change in marginal utility of a dollar spent on Brazilian orange juice caused
by an extra dollar spent on the rest of the world (ROW) orange juice is the same as the change in
marginal utility of a dollar spent on the U.S. orange juice caused by an extra dollar spent on the
ROW orange juice. This implies that consumers may not pay a different price for products of the
same group since they perceive one product as homogenous to the other.
(2) Non-uniformly competitive market
This is a case where competition occurs between products such that the effect of a change
in price of a given product on the demand for another product varies from product to product
irrespective of their groups. In this market structure, consumers care about the country of origin
of the product because the change in marginal utility of a dollar spent on product i caused by an
extra dollar spent on product j is different from the change in the marginal utility of a dollar
spent on product k caused by an extra dollar spent on product j . This means, for example, that
the change in marginal utility of a dollar spent on Brazilian orange juice caused by an extra
dollar spent on the rest of the world (ROW) orange juice is different from the change in marginal
utility of a dollar spent on the U.S. orange juice caused by an extra dollar spent on the ROW
orange juice. This implies that consumers may pay a different price for products of the same
group since they perceive one product as differentiated from the other.
MATERIALS AND METHODS
Model
The Relative Price Version of the Rotterdam Model
The Relative price version of the Rotterdam model is used to describe the non-uniformly
competitive market structure. This model of market structure analyzes the nature and extent of
10
competition between any two products irrespective of product group. Consumers treat each
individual product as different from another.
Following Theil (1980), the relative price version of the Rotterdam model can be given as
(2) itt
jtN
jijtiitit dP
dpvdQdqw εθ +⎟⎟
⎠
⎞⎜⎜⎝
⎛+= ∑
=1
.
where ( ) 212, −+= tiitit www is the average expenditure share ; ( )12,log −= tiitit qqdq is the finite
change in quantity imported of product i ; iθ is the marginal expenditure share of product i ;
ttttt dqwdqwdQ 181811 ...++= is the finite change version of the Divisia price index (real income) ;
ijv is the relative (Frisch-deflated) price coefficients; ( )12,log −= tjjtjt ppdp is the finite change
in price of product j ; ttt dpdpdP 181811 ... θθ ++= is the finite change version of the Frisch price
index; Note that the lower case p is for prices of individual products and the upper case P is
for Divisia price indices. itε is the demand disturbance.
Block-wise Dependent Uniform Substitute Rotterdam Model
The Block-wise dependent uniform substitute Rotterdam model is used to describe the
uniformly competitive market structure. It is derived from the relative price version of the
Rotterdam model (equation 2) by imposing the joint hypothesis of block wise dependence for
products in any two different product groups and uniform substitute relationship for products
within the same product group.
Following Theil (1980), the block-wise dependent Rotterdam model can be given as
(3) ih
ghgh
Sji
iSj
jijiii dP
dPV
dPdp
dQdqw
g
gε
θθ
νθ +⎟⎠⎞
⎜⎝⎛+⎟⎟
⎠
⎞⎜⎜⎝
⎛+= ∑∑∑
≠∈
∈
6

11
where ijv is the specific relative price coefficients of products within in a group; ghV is group
relative price coefficients; hdP is the Frisch price index of a group, and iε is the error term.
Now, following Seale (2003), the relative price coefficients ( )ijv in equation (3) are given
as
( )
⎪⎪
⎩
⎪⎪
⎨
⎧
≠Θ−
ΘΘ−=
=Θ−
Θ−Θ=
jik
kv
jik
kv
g
ggjggiij
gg
ggiggiij
1
11
)4(''
''
θθφ
θθφ
where φ is the income flexibility; 'iθ is the conditional marginal value share, k is a constant;
ggΘ is the group marginal value share.
Substituting equation (4) into equation (3), we obtain equation (5) which is called block-
wise dependent uniform substitute Rotterdam model.
(5) dPdP
VdPdp
kk
dPdp
kk
dQdqw h
ghghi
Sij
j
g
jiii
gi
iiiiii
g
∑∑≠∈≠
+Θ−
−+⎟
⎟⎠
⎞⎜⎜⎝
⎛
Θ−−
+= '
111
θθθ
φθ
φθθ
where iθ is the marginal expenditure share; 'iθ is the conditional marginal expenditure share; ghV is
the group relative price coefficient defined as ∑∑∈ ∈
=gi hj
ijgh vV , where hg ≠ . ∑∈
=Θgi
ig θ and
∑∈
=Θhj
jh θ are the gΘ are the group marginal expenditure shares of group g and h , respectively.
φ is the income flexibility; k is a constant.
Data Sources
The sources of data for this study are the Statistics Bureau of Japan and Japan’s Ministry
of Finance. Monthly population data from December 1995 to May 2005 came from the web
page (http://www.stat.go.jp/english/data/jinsui/2-2.htm) maintained by the Statistics Bureau of
12
Japan’s Ministry of Internal Affairs and Communications. Import data came from the Trade
Statistics of Japan that are published by the Ministry of Finance and the Customs under the
provision of the Customs Law and the relevant international conventions. It is available on the
web page http://www.customs.go.jp. The monthly imports and expenditures on imports of
orange, grapefruit, other citrus, apple, pineapple and grape juices were obtained for the period
December, 1995 to May, 2005. The values of imports are on a cost, insurance and freight (CIF)
basis, which include costs of the product, insurance and transportation. Unit import values,
which proxy commodity prices, were obtained by dividing import values by import quantities.
Analytical Methods
The method used to estimate the model is the non-linear least square (LSQ) in the Time
Series Processor Program (TSP 4.5). The LSQ command computes maximum likelihood
estimates if it is specified with no instruments and more than one equation (Hall and Cummins,
1999). Since the parameter estimates in this study are generated from a system of demand
equations without specifying instruments, they can be taken as maximum likelihood estimates.
With normally distributed disturbances ( itu ), the ML method has all the desirable asymptotical
properties of Maximum Likelihood (ML) estimators and, therefore, is asymptotically efficient
among all estimators (Greene, 2000). The likelihood ratio test is used to test for autocorrelation.
RESULTS AND DISCUSSION
Descriptive Results
Since Japan’s deregulation of imports in the 1990s, the imports of fruit juices have
increased with the exception of U.S. apple juice (Table 3). Over the period January, 1995 to
May, 2005, the imports of U.S. apple juice has decreased by 17% while that of U.S. orange,
grapefruit and grape juices increased by 4%, 12% and 5%, respectively. The highest increase
was attained by the ROW grapefruit juice (51%) followed by the Chinese apple juice (31%) and
13
the Israelis grapefruit fruit juice (26%). The analysis of import stability as measured by the
coefficient of variation shows that the imports of fruit juices in Japan over the given period have
exhibited a significant fluctuation. The fluctuation of imports varies from country to country.
U.S. orange and grape juices have experienced the highest fluctuation among U.S. fruit juices.
Over the same period, Japan’s import price of all fruit juices has decreased (Table 3). On
average, Japan’s import price of U.S. orange, grapefruit, apple and grape juices has decreased by
12%, 10%, 7% and 6% per month over the period December, 1995 to May, 2005. Over the same
period, apple juice imported from the rest of the world has witnessed the largest price decrease
(13%). Among U.S. products, prices of orange and grapefruit juices are relatively more stable
than those of the respective competitors’ products. The prices of apples are less stable compared
to their respective rival products.
Except for Brazilian orange juice (25%) and the ROW apple juice (19%), the average
expenditure share of fruit juices in Japan is below 10% (Table 3). Expenditure share of U.S.
juices, expressed as a percentage of total fruit juice expenditure, ranges from 6% for apple juice
to 8% for grapefruit juice.
Test for First-order Autocorrelation
A test for first order autocorrelation AR (1) was carried out for equation (2) and equation
(5), considering each model with and without autocorrelation as the unrestricted and restricted
model, respectively. The result of the test indicates that the null hypothesis of no autocorrelation
was rejected in both models (Table 4), implying that the data is serially correlated. The value of
ρ , which is common across equations in each system, is 0.31 for (2) and 0.33 for (5). Both are
significantly different from zero (P<0.001).
14
Following the correction for first-order autocorrelation, we tested the joint hypothesis of
block wise dependence and uniform substitution with a view to selecting the model that best
identifies the market structure of the Japanese fruit juice market. The identification of the market
structure involves a comparison between the relative price version of the Rotterdam model (2)
and the block-wise uniform substitute-Rotterdam model (5). The block wise dependent uniform
substitute model is a restricted model while the relative price version of the Rotterdam model is
an unrestricted model.
The likelihood value of the restricted equation (equation 2) is 4934.79 with 171 degrees
of freedom while that of the unrestricted equation (equation 5) is 4813.17 with 39 degrees of
freedom (Table 3). The value of the model chi-square is 243.24 which is greater than the critical
chi-square value at 1% probability level. Therefore, we reject the null hypothesis, and conclude
that the competition between products in different groups is not the same for all pairs of products
in the two groups. That is, the relationship between goods in any two groups is not block wise
dependent. Further, the relationship between goods within a group is not a uniform substitute.
This means that the change in marginal utility of a dollar spent on a product in one product group
caused by an extra dollar spent on another product in another product group is not the same for
all pairs of products in the two groups. For example, an extra dollar spent on U.S. orange juice,
affects the marginal utility of another dollar spent on Thai pineapple juice differently than does it
affect the marginal utility of a dollar spent on the Philippines pineapple juice. In other words,
the effect of the change in price of U.S. orange juice on the demand for Thai pineapple juice is
not the same as that of the effect on the demand for the Philippines pineapple juice. This implies
that the country of origin of the pineapple juice is important in consumers’ decision of purchase.
15
Furthermore, we can conclude that the change in marginal utility of a dollar spent on a
product caused by an extra dollar spent on another product is not the same for all pairs of
products within the same group. The country of origin is important in consumers’ choice of
products that belong to the same product group. For example, the change in marginal utility of a
dollar spent on U.S. orange juice, caused by an extra dollar spent on Brazilian orange juice is not
the same as that of the change in marginal utility of a dollar spent on U.S. orange juice caused by
an extra dollar spent on the ROW orange juice. This implies that consumers are influenced by
the country of origin and thus decide to buy orange juice based on the country of origin.
Therefore, based on the results of the likelihood ratio test (Table 5) the relative price
version of the Rotterdam model (2) is chosen. Thus, by default, the market structure of the
Japanese fruit juice market is a non-uniformly competitive. This implies that individual products
are competing with each other based on the country of origin in a non-uniform fashion. That is,
consumers view the specific commodity from one country as differentiated from the same
commodity from other countries. In summary, the country of origin is taken into account by
consumers when they choose between products that belong to different product groups and also
when they choose between products that belong to the same product group.
Parameter Estimates of the Selected Model
Table 6 presents the relative (Frisch-deflated) price coefficients ijv and marginal value
shares iθ and the coefficient of income flexibilityφ . The relative price coefficients measure the
specific substitution effect which accounts for the n price changes on the demand for the
thi product, or equivalently, the effect of such a change when the marginal utility of income
remains constant.
16
If the relative price coefficients ijv and jiv are both positive, it means that an increase in
the relative price of either product raises the demand for the other, and thus the two products are
called specific substitutes. Similarly, if ijv and jiv are both negative, it means that an increase in
the relative price (opportunity cost) of either product reduces the demand for the other, or thus
the two products are called specific complements.
Table 6 shows that most of the products are substitutes, and hence there is competition
between countries exporting those products. However, contrary to expectation, the cross price
effects of products that belong to the same group are not necessarily greater than the cross effects
of products that belong to different product groups. For example, the cross price effect of U.S.
grapefruit/ROW grapefruit juice is smaller than that of U.S. grapefruit /U.S apple juice.
Furthermore, products that belong to the same product group are not necessarily substitutes. For
example, U.S. apple/ROW apple that belong to the same product group are complements.
Expenditure Elasticities
The value of the expenditure elasticity of the marginal utility of income is φ1 = -0.5517.
This estimate is consistent with the estimates of Frisch (1959) for the richest section of the
population. According to Frisch (1959), a value of φ1 =-0.7 is for the better off part of the
population. Since Japanese consumers are among the richest in the world, a value of φ1 = -
0.5517 obtained in this study is a reasonable estimate for Japan.
The expenditure elasticities are calculated at the sample means of expenditure shares of
the respective imported fruit juices. The estimates of the expenditure elasticities are positive
except for those of the Israelis grapefruit juice and the ROW pineapple juice (Table 7). However,
the expenditure elasticity of Israel’s grapefruit juice is statistically insignificant while that of the
ROW pineapple juice is statistically significant. Thus, we can conclude that the Israelis
17
grapefruit juice is not an inferior product while that of the ROW pineapple juice is an inferior
product.
Among the 18 fruit juices, only the demand for Brazilian orange juice is expenditure
elastic (2.7522). All four major fruit juices (orange, grapefruit, apple and grape juices) that the
U.S. exports to Japan are expenditure inelastic, implying that there is less preference for the U.S.
juices. The expenditure elasticities of U.S. exports range from 0.1302 for grape juice to 0.8252
for apple juice. The demand for these products exported by the ROW is also expenditure
inelastic.
The high expenditure elasticity of Brazilian orange juice and low expenditure elasticities
of U.S. and the ROW products is not surprising given that Brazil’s share of the total import
expenditure is very high compared to that of other countries. The average expenditure share of
Brazilian orange juice is 25% while that of U.S. ranges from 5% for apple juice to 8% for
grapefruit juice. The average expenditure share of fruit juices imported from the ROW is the
smallest except for that of apple juice, which accounts for about 17% of the total import
expenditure on imported fruit juices. The major exporting country of apple juice in the category
of the ROW is Austria.
Given that Brazilian orange juice makes up the larger proportion of the total imports of
fruit juices in Japan, a one percent increase in expenditure on imported fruit juices results in a far
greater increase in actual imports; and, its market share would increase further upon the
expansion of the Japanese market of imported fruit juices over time. However, under conditions
in which the economy goes to recession, or expenditure growth slows down, Brazil will be worse
off because, a given percentage decrease in expenditure on imported fruit juices results in a far
greater decrease in actual imports; and its market share would decrease further upon the
18
contraction of the market of imported fruit juices over time because of its larger expenditure
elasticity. The fact that recession has been more frequent in Japan over the past few years
requires Brazil to devise an effective export strategy which takes account of the performance of
the economy.
In addition to recession, the growth of population is another major factor anticipated to
affect the demand for imported fruit juices in Japan as a result of its aging population. The
population growth of Japan has turned negative in 2006 (Statistics Bureau of Japan). With per
capita income growing at 2% per annum and assuming that it will remain constant until 2020,
and population growth starting to take negative rate since 2006, the growth of demand for fruit
juices imported into Japan is projected (Table 8). The growth of demand for fruit juice in Japan
is positive except for that of Israelis grapefruit juice over the over the period 2006 through 2014.
The demand for Israelis grapefruit is negative not only due to the population growth but also
negative expenditure elasticity. Products which have positive expenditure elasticity will
continue to grow at a declining rate regardless of the negative growth of population except for
U.S. grape juice and Israelis and Italian other citrus juices. From the result of the simulation, it
appears that grape and other citrus juice will be more affected than the other juices. The demand
for Brazilian orange juices declined from 5.53% in 2005 when the growth of population was
0.3% to 5.49% in 2006 when the growth of population turned negative. It will continue to shrink
over the period 2006 through 2020 while the demand for U.S. orange is projected to shrink at
1.12.9 to 0.66% over the same period.
Among U.S. products, apple juice will grow at a higher rate (more than 1%) while grape
juice will grow at the smallest rate (less than 0.25%). These simulations were made under the
assumption that the growth of per capita income will remain constant at 2% per annum over the
19
period 2006 through 2020. The increase in the growth of per capita income will offset the
decrease in population growth so that the decline in the growth of demand may be checked. If
income grows at more than 2%, demand may increase, though population growth slows down.
The prospect of the growth of demand for fruit juices will depend on the growth of per capita
income relative to the decline in growth of the population. If both move in the same direction,
the decline of the growth rate of demand for fruit juices will be greater.
Own-price Elasticities
In order to assess the responsiveness of Japan’s imports to changes in prices, two types of
own-price elasticities (uncompensated and compensated) were calculated. Results indicate that
both uncompensated and compensated own price elasticities of the demand for fruit juices in
Japan are all negative and statistically different from zero except for the ROW apple juice (Table
9). Among the 18 fruit juices, four fruit juices are price elastic and two are unitary price elastic.
These are Philippine pineapple juice, U.S. orange juice, the ROW orange juice, Italian other
citrus juice, Israelis other citrus juice and Brazilian orange juice. Of these, the demand for the
Philippines pineapple juice is the most price elastic (-3.0543) followed by that of the U.S. orange
juice (-1.5774), the ROW orange juice (-1.4521), and Italian other citrus juice (-1.1745). The
demand for Brazilian orange juice (-1.0109) and Israelis other citrus juice (-1.0039) are unitary
price elastic.
Although the absolute value of uncompensated price elasticities of most of the fruit juices
are higher than that of the respective compensated price elasticities, the magnitude of difference
between the two elasticities is very small. Some notable exceptions are Brazilian orange juice,
U.S. orange juice, U.S. grapefruit juices, and U.S. apple juice. These products have a relatively
larger income effect. Suffice to mention the high expenditure elasticity of the Brazilian orange
juice. The uncompensated price elasticity of Brazilian orange juice is -1.01096 while that of
20
compensated price elasticity is -.311240. This large difference is due to a large income effect.
This is apparent in the large expenditure elasticity of the Brazilian orange juice (2.7522). Based
on the magnitude of differences between the two elasticities, one can see which products have a
relatively larger income effect.
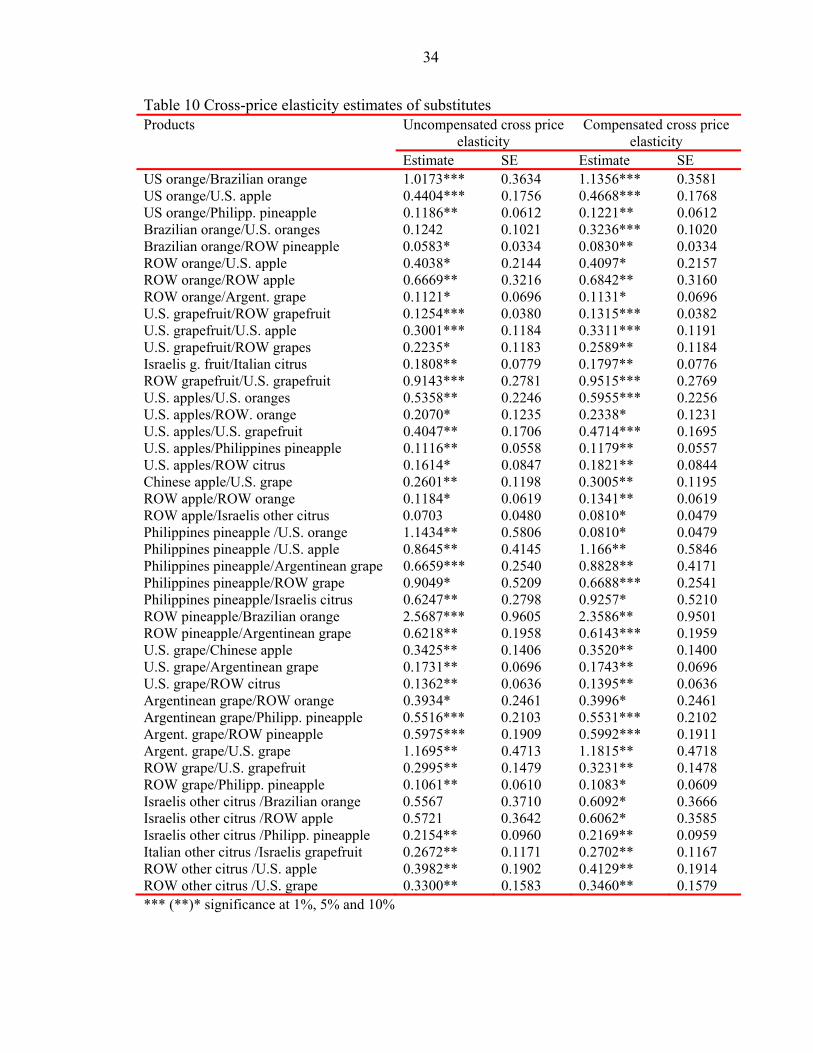
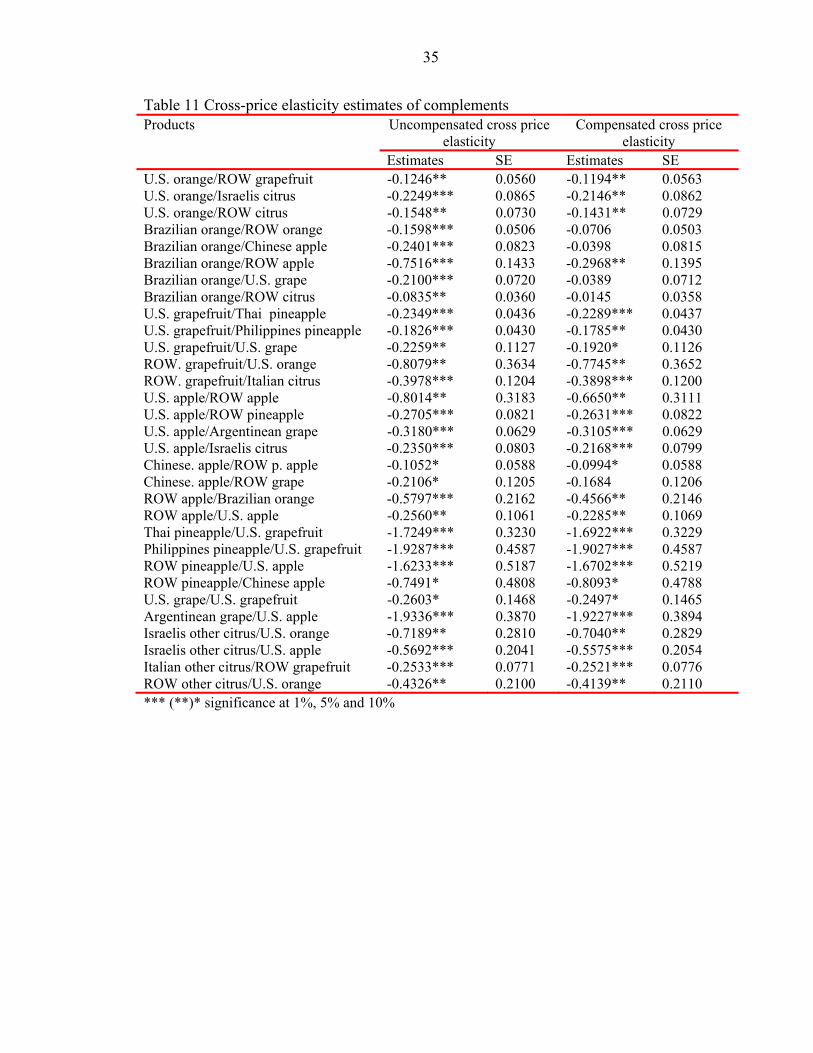
Cross-price Elasticities
Like the case with own price elasticities, two types of cross-price elasticities,
uncompensated and compensated, were calculated at the mean values of expenditure shares over
the period December, 1995 to May, 2005. Results indicate that more compensated cross price
elasticities are statistically significant than uncompensated price elasticities, and most products
are substitutes. This is consistent with Hick’s second law of demand.
Results indicate that Brazilian orange juice/U.S. grapefruit juice, Brazilian orange
juice/U.S. apple juice, Brazilian orange juice/Thai pineapple juice, Brazilian orange juice/ROW
grape juice, and Brazilian orange juice/ROW other citrus juice are gross complements and net
substitutes. Normally, we expect these products to be net substitutes. However, they are also
gross complements because of the strong income effect of the Brazilian orange juice. In other
words, when the prices of U.S. grapefruit juice, U.S. apple juice, Thai pineapple juice, ROW
grape juice and ROW other citrus juice fall, the substitution effect may be so small that the
consumer purchases more of Brazilian orange juice and less of the other juices.
Products which are net substitutes and thus belong to the same market structure include
U.S. orange juice/Brazilian orange juice and U.S. orange juice/Philippines pineapple juice, U.S.
apple juice/Philippines pineapple juice (Table 10). Products which have complementary
relationship include Israelis grapefruit juice and Thai pineapple juice (Table 11).
A decrease in the price of Brazilian orange juice has a larger negative effect on the
quantity demanded of U.S. orange juice. However, the decrease in the price of U.S. orange juice
21
has a very small negative effect on the demand for Brazilian orange juice. This is not
unexpected given that Brazil has the highest market share (25%) in Japan’s market. Because of
its high market share, it can influence the juice market in Japan. However, since the demand for
Brazilian orange juice is compensated price inelastic and less uncompensated price elastic than
that of U.S. orange juice, Brazil does not have a reason to decrease the price of its orange juice.
The benefit to Brazil comes mainly from the increase in the level of income because of its high
expenditure elasticity.
Another important product to which U.S. orange juice is a substitute is the Philippines
pineapple juice. A decrease in the price of U.S. orange juice has a larger negative effect on the
quantity demanded of the Philippines pineapple juice while a decrease in the price of the
Philippines pineapple juice has a very small negative effect on the demand for U.S. orange juice.
This implies that the U.S. may take some market share from the Philippines pineapple juice
should the price of the Philippines pineapple juice remain constant. Nonetheless, given that the
demand for both U.S. orange juice and the Philippines pineapple juice are price elastic, both have
reasons to decrease price to raise total sales. The move by both countries to decrease price will
positively impact the demand for their respective products.
Similarly, the U.S. orange juice is also a substitute to U.S. apple juice, which, in turn, is a
substitute to U.S. grapefruit juice, and vice versa. U.S. grapefruit juice is also a substitute to the
ROW grapefruit juice. Since all of them are price inelastic, the change in price of one product
will not have a big impact on the demand for other product.
A decrease in the price of Brazilian orange juice has a larger negative effect on the
quantity demanded of the ROW pineapple juice. However, the decrease in price of the ROW
pineapple juice has a very small negative effect on the demand for Brazilian orange juice.
22
Nonetheless, given that the demand for Brazilian orange juice is compensated price inelastic, the
decrease of Brazilian orange juice is disadvantageous to both Brazil and the ROW. This is
because consumers don’t significantly increase the consumption of Brazilian orange juice in
spite of price decrease. The best option for both countries is to increase price. This will,
however, benefit the ROW more if Brazil increases the price of its orange juice.
Similarly, a decrease in the price of U.S. grape juice has a larger negative effect on the
quantity demanded of Argentinean grape juice. However, the decrease in price of the
Argentinean grape juice has a very small negative effect on the demand for U.S. grape juice.
Nonetheless, given that the demand for grape juice from both countries is price inelastic, the
move by either country to decrease the price of its grape juice is disadvantageous to both of them.
This is because consumers don’t significantly increase the consumption of grape juice in spite of
a decrease in the price. Hence, the product option for both countries is to raise price. This will,
however, benefit Argentina more if the U.S. increases the price of its grape juice.
Given that most of the imported juices are price inelastic, most exporters can’t increase
their market share at the expense of their rivals through reducing prices. Some notable
exceptions are the Philippines pineapple juice, U.S. and ROW orange juice. In conclusion,
product differentiation/promotion appears to be a better option to increase market share. Product
differentiation will provide exporters with some monopolistic power over their products.
Conclusion and Implications
The main theme of the study is to assess the competition for the Japanese fruit juice
market through MSA. To this end, a differential consumer demand approach has been applied.
Since competitiveness is associated with the type of market structure, two market structures are
considered - the non-uniformly competitive and uniformly competitive. The non-uniformly
competitive structure involves a competition between products such that the effect of a change in
23
price of a given product on the demand for another product varies from product to product
irrespective of their groups. The uniformly competitive structure involves a competition between
products such that the effect of a change in price of a given product in one product group on the
demand for another product in another product group is the same to all pairs of products in the
two groups. The analysis of market structure in this study has involved the estimation of two
different versions of the Rotterdam model. These are the relative price version of the Rotterdam
model and the block-wise dependent uniform substitute-Rotterdam model. The former describes
the non-uniformly competitive market structure while the latter describes the uniformly
competitive market structure. The models were estimated for six fruit juices (orange, apple,
grapefruit, pineapple, grape, and other citrus) imported from 18 countries on data compiled over
the period January, 1995 to May, 2005.
Based on the likelihood ratio tests, the relative price version is selected, leading to the
choice of the non-uniformly competitive market structure. The results of the study have
important implications to countries exporting fruit juices to Japan for making marketing
strategies such as price reduction, product differentiation as well as export supply plan in light of
the expansion and contraction of the Japanese market for imported fruit juices because of the
change in income.
Given that the effectiveness of a supply plan in raising market share through export
expansion depends on the estimates of expenditure and price elasticities, the country which
benefits the most from the growth of income in Japan is Brazil. Brazilian orange juice has the
highest expenditure elasticity and market share in Japan’s market. An increase in Japan’s
expenditure on imported fruit juices results in a far greater increase in actual imports of Brazilian
orange juice. Consequently, Brazilian market share will increase upon the expansion of the
24
Japanese market of imported fruit juices over time. However, under conditions in which the
economy goes to recession, or income growth slows down, Brazil will be worse off because, a
decrease in expenditure on imported fruit juices results in a far greater decrease in actual
imports; and, its market share will decrease upon the contraction of the market of imported fruit
juices over time. The fact that recession has been more frequent in Japan over the past few years
requires Brazil to devise an effective export strategy which takes account of the performance of
Japan’s economy.
In addition to recession, the growth of population is another major factor anticipated to
affect the demand for imported fruit juices in Japan. The Japanese population growth turned
negative in 2006. Consequently, the growth of demand for fruit juices will be slow in the years to
come.
Given that the demand for the U.S. orange juice and the Philippines pineapple juice is
price elastic, price discounting can be an effective tool for the U.S. citrus industry and the
Philippines fruit industry in expanding their exports to Japan. Since the demand for other juices
from other countries including Brazil and U.S. (grapefruit, apple, grape juices) are price inelastic,
export supply expansion through price-oriented marketing strategies, trade negotiations or other
marketing activities that involve reduction of prices will negatively impact the exporting country
of the respective product. These countries should reduce their cost of production, processing,
and marketing so that they can stay more competitive in Japan’s import market.
The degree of competition depends on the magnitude of cross price elasticities. Given
that the cross price elasticities of most of the juices imported into Japan are below one, an
exporter can’t take market share from another exporter quickly through price reductions. Some
notable exceptions are the U.S/Brazilian orange juice and U.S. apple/Philippines pineapple juice.
25
A decrease in the price of Brazilian orange juice has a significant negative impact on the demand
for U.S. orange juice but not vice versa. However, since the demand for Brazilian orange juice is
price inelastic, Brazil does not have a reason to decrease price under the current market structure.
Nonetheless, if the current market structure changes to other market structures, Brazil may a
have a reason to decrease its price if the demand for its product under that structure becomes
price elastic. Therefore, the U.S. citrus industry should pay close attention to the development of
the Brazilian citrus industry. Assume, for example, that Brazil becomes more competitive by
introducing new technologies that reduce costs. Unless there is a similar response by the U.S.
citrus industry, there may be adverse effects on the demand for U.S. orange juice.
Similarly, the Philippines fruit industry should pay close attention to the development of
the U.S. orange and apple sector. In particular, further reductions in the cost of production,
processing or marketing activities of the U.S. orange and apple juices, if not matched by
decreases in the Philippines pineapple juice can have adverse effects on the demand for the
Philippines pineapple juice. Generally, because of the low cross price elasticities of fruit juices
in Japan, product promotion and further product differentiation seems to be a more plausible
option than a price reduction option for most countries to stay more competitive in Japan’s fruit
juice market.
26
LIST OF REFERENCES
Allenby, G. 1989. “A Unified Approach to Identifying, Estimating and Testing Demand Structures with Aggregate Scanner Data,” Marketing Science 8: 265-280.
Brown, M. 1993. “Demand Systems for Competing Commodities: An Application of
the Uniform Substitute Hypothesis.” Review of Agricultural Economics 15(3): 577-589.
Clements, K and E. Selvanathan, 1988. “The Rotterdam Model and its Application in Marketing.” Marketing Science, 7, 1:60-75.
FAO (Food and Agriculture Organization). Agricultural data. Available at
http://faostat.fao.org/faostat/collections?version=ext&hasbulk=0&subset=agriculture. (20 March 2005)
Frisch. 1959. “A Complete Scheme for Computing all Direct and Cross Demand
Elasticities in a Model with Many Sectors.” Econometrica 27:177-196
Greene, W., 2000. Economic Analysis. Upper Saddle River, NJ: Prentice Hall.
Hall, B and C. Cummins. 1999. Time Series Processor version 4.5. Reference Manual.
TSP International Palo Alto, California, USA Huang, S. 2004. Global Trade Patterns in Fruits and Vegetables. Agriculture and Trade
Report No. WRS-04-06. Available at http://www.errs/usda-gov/publications/wrs0406/wrs040dfm.pdf (11 April 2006)
JETRO (Japan External Trade Organization). Market Information for Fruit Drinks.
Available at http://www.jetro.go.jp/en/market/reports/jmr/024.pdf. (3 March 2006)
Russell, G., and R. Bolton. 1988. “Implications of Market Structure for Elasticity
Structure,” Journal of Marketing Research 25: 229-241. Seale, J. 2003. “Uniform Substitute When Group Preferences are Block-wise
Dependent.” Journal of Agricultural and Applied Economics 35(0): 51-55. Spreen,T.,R. Barber, M.Brown,, A. Hodges, J.Malugen, D. Mulkey, R., Muraro, R.
Norberg, M. Rahmani, F. Roka and R. Rouse 2006. An Economic Assessment of the Future Prospects for the Florida Citrus Industry. Available at http://www.fred.ifas.ufl.edu/economic_assess_flciturus_indus.pdf. (14 April 2006)
27
Statistics Bureau of Japan’s Ministry of Internal Affairs and Communications Population Eestimates. Available at (http://www.stat.go.jp/english/data/jinsui/2-2.htm (12 March 2006)
Theil, H.1980. The System-Wide Approach to Microeconomics. Chicago: University of Chicago Press.
Vilcassim, N. 1989. “Extending the Rotterdam Model to Test Hierarchical Market Structures,” Marketing Science,7:181-190
UNCTAD (United Nations Conference on Trade and Development). Citrus fruit. Available at. http://r0.unctad.org/infocomm/anglais/orange/market.htm (12 March 2006)
Table 1 Fruit juice imports to Japan by country of origin product Exporter % Orange juice Brazil 72.4
U.S. 23.7 Australia 1.4
Apple juice U.S. 22.4 China 18.9 Austria 18.6
Grapefruit juice U.S. 87.1 Israel 9.6 Australia 2.4
Grape juice U.S. 46.9 Brazil 14.1 Argentina 11.7
Pineapple juice Thailand 42.4 USA 28.6 The Philippines 27.6
Other citrus juice Israel 40.5 Italy 21.8 Argentina 13.9
Table 2 Per capita consumption of fruits in industrialized and developing countries
Fruits Developing countries
Industrialized Countries E.U. Canada Japan U.S.
Orange and mandarins 8.00 29.23 27.52 46.28 13.80 39.87 Grapefruit 0.32 2.91 2.17 4.05 2.49 4.12 Lemons and limes 1.25 3.59 3.78 2.60 0.84 5.26 Apples 4.67 20.3 24.82 18.82 11.58 21.02 Grapes 2.20 7.60 8.67 10.19 2.79 8.18 Pineapples 2.01 3.61 1.97 2.61 1.43 7.01
(Source: FAO, 2005)
29
Table 3 Fruit juice quantity and price log-changes, and expenditure shares, Japan, December 1995 to May 2005
Imports Quantity log-changes ( )1,log −= tiiti qqdq
Price log-changes ( )1,log −= tiiti ppdp
Expenditure shares ( )iw
Mean SD Mean SD Mean SD U.S. oranges 0.0410 0.6701 -0.1155 0.2803 0.0724 0.0335 Brazilian. oranges 0.0982 0.9847 -0.1033 0.2683 0.2542 0.0895 ROW oranges 0.0959 0.8876 -0.0083 0.4210 0.0324 0.0205 U.S. grapefruits 0.1200 0.4909 -0.0979 0.2907 0.0808 0.0302 Israelis grapefruits 0.2617 1.0503 -0.0720 0.5821 0.0259 0.0168 ROW grapefruits 0.5078 1.3739 -0.1149 0.8360 0.0111 0.0104 U.S. apples -0.1694 0.9249 -0.0690 0.2847 0.0567 0.0422 Chinese apples 0.3176 0.6891 -0.1405 0.2798 0.0727 0.0372 ROW apples 0.0760 0.4059 -0.0946 0.1958 0.1652 0.0510 Thai pineapples 0.1549 1.0317 -0.0572 0.3934 0.0109 0.0058 Philippines pineapples 0.1578 1.7814 -0.0606 0.3713 0.0075 0.0037 ROW pineapples 0.1109 1.5452 -0.0414 0.5171 0.0089 0.0062 U.S. grapes 0.0529 0.5942 -0.0647 0.2890 0.0621 0.0249 Argentinean grapes 0.2792 1.1260 -0.0969 0.3346 0.0091 0.0058 ROW grapes 0.1717 0.4728 -0.0802 0.2584 0.0648 0.0235 Israelis other citrus 0.0861 0.6349 -0.0924 0.3138 0.0220 0.0064 Italian other citrus 0.1756 0.7744 -0.0902 0.2412 0.0172 0.0069 ROW other citrus 0.2032 0.8238 -0.1031 0.5923 0.0250 0.0118 (Source: Study data)
Table 4: Test for first-order autocorrelation Model Coefficient Log Likelihood
value ( ) ( )( )θθ ~ˆ2 LL − a
Equation (2) Rho = 0.00 4892.99 83.60*** Rho = 0.31 4934.79
Equation (5)
Rho = 0.00 4748.99 128.36*** Rho = 0.33 4813.17
Table 5 Model selection Model Log likelihood
value Free parameters ( ) ( )( )θθ ~ˆ2 LL − a
Equation (2) 4934.79 171
Equation (5) 4813.17 39 243.24***
a Twice the difference between the log likelihood value for the unconstrained model, ( )θ̂L , and the
log likelihood value for the constrained model, ( )θ~L . *** The chi-square critical value is at the 1% significance level.
30
Table 6 Parameter estimates of cross prices of fruit juices in Japan Products Relative price coefficients Slutsky coefficients
Estimates SE Estimates SEU.S. orange/Brazilian orange 0.0395 0.0296 0.0822*** 0.0259U.S. orange/ROW grapefruit -0.0089** 0.0040 -0.0086** 0.0040U.S. orange/U.S. apple 0.0309** 0.0126 0.0338*** 0.0128U.S. orange/Philippines pineapple 0.0087** 0.0044 0.0088** 0.0044U.S. orange/Israelis citrus -0.0158** 0.0062 -0.0155** 0.0062U.S. orange/ROW citrus -0.0107** 0.0052 -0.0103** 0.0052Brazilian. orange/Chinese apple -0.0701*** 0.0236 -0.0101 0.0207Brazilian orange/ROW apple -0.1769*** 0.0402 -0.0754** 0.0354Brazilian orange/ROW p. apple 0.0304*** 0.0099 0.0211** 0.0085Brazilian orange/Israelis citrus 0.0076 0.9335 0.0134* 0.0080ROW orange/U.S apple 0.0129** 0.6936 0.0132* 0.0069ROW orange/ROW apple 0.0216** 0.0103 0.0221** 0.0102ROW orange/Argentinean grape 0.0036* 0.0022 0.0036* 0.0022U.S. grapefruit/ROW grapefruit 0.0102*** 0.0030 0.0106*** 0.0030U.S. grapefruit/U.S. apple 0.0230** 0.0096 0.0267*** 0.0096U.S. grapefruit/Thai. pineapple -0.0188*** 0.0035 -0.0185*** 0.0035U.S. grapefruit/Philippines pineapple -0.0146*** 0.0034 -0.0144*** 0.0034U.S. grapefruit/U.S. grape -0.0161* 0.0091 -0.0155* 0.0091U.S. grapefruit/ROW grape 0.0194** 0.0095 0.0209** 0.0095Israelis grapefruit/Italian citrus 0.00467** 0.0020 0.0046** 0.0020ROW grapefruit/Italian citrus -0.0043*** 0.0013 -0.0043*** 0.0013U.S. apple/ROW apple -0.0445** 0.0178 -0.0377** 0.0176U.S. apple/Philippines pineapple 0.00649** 0.0031 0.0066** 0.0031U.S. apple/ROW pineapple -0.0143*** 0.0046 -0.0149*** 0.0046U.S. apple/Argentinean grape -0.0177*** 0.0035 -0.0176*** 0.0035U.S. apple/Israelis citrus -0.0127*** 0.0045 -0.0123*** 0.0045U.S. apple/ROW citrus 0.0097** 0.0047 0.0103** 0.0047Chinese apple/ROW pineapple -0.0066 0.0043 -0.0072* 0.0042Chinese apple/U.S. grape 0.0211** 0.0087 0.0218** 0.0087ROW apple/Israelis citrus 0.0127* 0.0080 0.0133* 0.0079Philipp. pineapple/Argentinean grape 0.0050*** 0.0019 0.0050*** 0.0019Philipp. pineapple/ROW grape 0.0069* 0.0039 0.0070* 0.0039Philipp. pineapple/Israelis citrus 0.00477** 0.0021 0.0047** 0.0021ROW pineapple/Argentinean grape 0.0055*** 0.0017 0.0054*** 0.0017U.S. grape/Argentinean grape 0.0108** 0.0043 0.0108** 0.0043U.S. grape/ROW citrus 0.0085** 0.0039 0.0086** 0.0039*** (**)* significance at 1%, 5% and 10%
31
Table 7 Expenditure elasticity estimates of fruit juices in Japan Product Estimate SE
US orange 0.4654*** 0.1390 Brazil orange 2.7525*** 0.1467 ROW orange 0.1047 0.1789 US grapefruit 0.5463*** 0.0967 Israel grapefruit -0.0630 0.2300 ROW grapefruit 0.4603 0.3115 US apple 0.8252*** 0.2189 Chinese apple 0.6504*** 0.1267 ROW apple 0.4842*** 0.0963 Thailand pineapple 0.4048* 0.2158 Philippines pineapple 0.3212 0.2954 ROW pineapple -0.8262** 0.4060 US grape 0.1301 0.1226 Argentina grape 0.1921 0.2670 ROW grape 0.2912*** 0.1031 Israel other citrus 0.2065 0.1491 Italy other citrus 0.1153 0.1582 ROW other citrus 0.2578 0.1649
*** (**)* significance at 1%, 5% and 10%
32
Table 8 Projected growth estimates (%) of the demand for fruit juices in Japan
Year Population growth rate
U.S. oranges
Brazilian Oranges
U.S. grape fruits
Israelis grape- fruit
U.S. apples
Chinese apples
Thai pine apple
Philipp. p. apples
U.S grapes
Argenti- nean grapes
Israelis citrus
Italian citrus
2005 0.03 0.96 5.53 1.12 -0.09 1.68 1.33 0.83 0.67 0.29 0.41 0.44 0.26 2006 -0.01 0.92 5.49 1.08 -0.13 1.64 1.29 0.79 0.63 0.25 0.37 0.4 0.22 2007 -0.04 0.89 5.46 1.05 -0.16 1.61 1.26 0.76 0.6 0.22 0.34 0.37 0.19 2008 -0.07 0.86 5.43 1.02 -0.19 1.58 1.23 0.73 0.57 0.19 0.31 0.34 0.16 2009 -0.10 0.83 5.40 0.99 -0.22 1.55 1.20 0.7 0.54 0.16 0.28 0.31 0.13 2010 -0.13 0.80 5.37 0.96 -0.25 1.52 1.17 0.67 0.51 0.13 0.25 0.28 0.10 2011 -0.16 0.77 5.34 0.93 -0.28 1.49 1.14 0.64 0.48 0.10 0.22 0.25 0.07 2012 -0.19 0.74 5.31 0.90 -0.31 1.46 1.11 0.61 0.45 0.07 0.19 0.22 0.04 2013 -0.22 0.71 5.28 0.87 -0.34 1.43 1.08 0.58 0.42 0.04 0.16 0.19 0.01 2014 -0.25 0.68 5.25 0.84 -0.37 1.40 1.05 0.55 0.39 0.01 0.13 0.16 -0.01 2015 -0.28 0.65 5.22 0.81 -0.40 1.37 1.02 0.52 0.36 -0.01 0.10 0.13 -0.04 2016 -0.31 0.62 5.19 0.78 -0.43 1.34 0.99 0.49 0.33 -0.04 0.07 0.10 -0.07 2017 -0.35 0.58 5.15 0.74 -0.47 1.30 0.95 0.45 0.29 -0.08 0.03 0.06 -0.11 2018 -0.38 0.55 5.12 0.71 -0.50 1.27 0.92 0.42 0.26 -0.11 0.00 0.03 -0.14 2019 -0.4 0.53 5.10 0.69 -0.52 1.25 0.90 0.40 0.24 -0.13 -0.01 0.01 -0.16 2020 -0.43 0.50 5.07 0.66 -0.55 1.22 0.87 0.37 0.21 -0.16 -0.04 -0.01 -0.19
33
Table 9 Own price elasticities of fruit juices in Japan Product Uncompensated own
price elasticities Compensated own price
elasticities Estimate SE Estimate SE
US orange -1.577*** 0.3080 -1.5437*** 0.3100 Brazil orange -1.010*** 0.3404 -0.3112 0.3387 ROW orange -1.452*** 0.1649 -1.4487*** 0.1648 US grapefruit -0.5835*** 0.1625 -0.5394*** 0.1624 Israel grapefruit -0.5453*** 0.1771 -0.5469*** 0.1762 ROW grapefruit -0.7108*** 0.1429 -0.7056*** 0.1435 US apple -0.5191* 0.3150 -0.4722 0.3171 Chinese apple -0.5948*** 0.1848 -0.5474*** 0.1842 ROW apple 0.0609 0.2284 0.1410 0.2247 Thailand pineapple -0.8758*** 0.1945 -0.8714*** 0.1946 Philippines P. Apple -3.054*** 0.2731 -3.051*** 0.2730 ROW pineapple -0.6296** 0.3100 -0.6370** 0.3103 US grape -0.8484*** 0.2029 -0.8404*** 0.2029 Argentina grape -0.6447 0.4223 -0.6430 0.4226 ROW grape -0.6403*** 0.2301 -0.6215*** 0.2303 Israel other citrus -1.003*** 0.1928 -0.9994*** 0.1925 Italy other citrus -1.1745*** 0.2567 -1.1725*** 0.2562 ROW other citrus -0.9584*** 0.1061 -0.9520*** 0.1060 *** (**)* significance at 1%, 5% and 10%
34
Table 10 Cross-price elasticity estimates of substitutes Products Uncompensated cross price
elasticity Compensated cross price
elasticity Estimate SE Estimate SE
US orange/Brazilian orange 1.0173*** 0.3634 1.1356*** 0.3581 US orange/U.S. apple 0.4404*** 0.1756 0.4668*** 0.1768 US orange/Philipp. pineapple 0.1186** 0.0612 0.1221** 0.0612 Brazilian orange/U.S. oranges 0.1242 0.1021 0.3236*** 0.1020 Brazilian orange/ROW pineapple 0.0583* 0.0334 0.0830** 0.0334 ROW orange/U.S. apple 0.4038* 0.2144 0.4097* 0.2157 ROW orange/ROW apple 0.6669** 0.3216 0.6842** 0.3160 ROW orange/Argent. grape 0.1121* 0.0696 0.1131* 0.0696 U.S. grapefruit/ROW grapefruit 0.1254*** 0.0380 0.1315*** 0.0382 U.S. grapefruit/U.S. apple 0.3001*** 0.1184 0.3311*** 0.1191 U.S. grapefruit/ROW grapes 0.2235* 0.1183 0.2589** 0.1184 Israelis g. fruit/Italian citrus 0.1808** 0.0779 0.1797** 0.0776 ROW grapefruit/U.S. grapefruit 0.9143*** 0.2781 0.9515*** 0.2769 U.S. apples/U.S. oranges 0.5358** 0.2246 0.5955*** 0.2256 U.S. apples/ROW. orange 0.2070* 0.1235 0.2338* 0.1231 U.S. apples/U.S. grapefruit 0.4047** 0.1706 0.4714*** 0.1695 U.S. apples/Philippines pineapple 0.1116** 0.0558 0.1179** 0.0557 U.S. apples/ROW citrus 0.1614* 0.0847 0.1821** 0.0844 Chinese apple/U.S. grape 0.2601** 0.1198 0.3005** 0.1195 ROW apple/ROW orange 0.1184* 0.0619 0.1341** 0.0619 ROW apple/Israelis other citrus 0.0703 0.0480 0.0810* 0.0479 Philippines pineapple /U.S. orange 1.1434** 0.5806 0.0810* 0.0479 Philippines pineapple /U.S. apple 0.8645** 0.4145 1.166** 0.5846 Philippines pineapple/Argentinean grape 0.6659*** 0.2540 0.8828** 0.4171 Philippines pineapple/ROW grape 0.9049* 0.5209 0.6688*** 0.2541 Philippines pineapple/Israelis citrus 0.6247** 0.2798 0.9257* 0.5210 ROW pineapple/Brazilian orange 2.5687*** 0.9605 2.3586** 0.9501 ROW pineapple/Argentinean grape 0.6218** 0.1958 0.6143*** 0.1959 U.S. grape/Chinese apple 0.3425** 0.1406 0.3520** 0.1400 U.S. grape/Argentinean grape 0.1731** 0.0696 0.1743** 0.0696 U.S. grape/ROW citrus 0.1362** 0.0636 0.1395** 0.0636 Argentinean grape/ROW orange 0.3934* 0.2461 0.3996* 0.2461 Argentinean grape/Philipp. pineapple 0.5516*** 0.2103 0.5531*** 0.2102 Argent. grape/ROW pineapple 0.5975*** 0.1909 0.5992*** 0.1911 Argent. grape/U.S. grape 1.1695** 0.4713 1.1815** 0.4718 ROW grape/U.S. grapefruit 0.2995** 0.1479 0.3231** 0.1478 ROW grape/Philipp. pineapple 0.1061** 0.0610 0.1083* 0.0609 Israelis other citrus /Brazilian orange 0.5567 0.3710 0.6092* 0.3666 Israelis other citrus /ROW apple 0.5721 0.3642 0.6062* 0.3585 Israelis other citrus /Philipp. pineapple 0.2154** 0.0960 0.2169** 0.0959 Italian other citrus /Israelis grapefruit 0.2672** 0.1171 0.2702** 0.1167 ROW other citrus /U.S. apple 0.3982** 0.1902 0.4129** 0.1914 ROW other citrus /U.S. grape 0.3300** 0.1583 0.3460** 0.1579 *** (**)* significance at 1%, 5% and 10%
35
Table 11 Cross-price elasticity estimates of complements Products Uncompensated cross price
elasticity Compensated cross price
elasticity Estimates SE Estimates SE
U.S. orange/ROW grapefruit -0.1246** 0.0560 -0.1194** 0.0563 U.S. orange/Israelis citrus -0.2249*** 0.0865 -0.2146** 0.0862 U.S. orange/ROW citrus -0.1548** 0.0730 -0.1431** 0.0729 Brazilian orange/ROW orange -0.1598*** 0.0506 -0.0706 0.0503 Brazilian orange/Chinese apple -0.2401*** 0.0823 -0.0398 0.0815 Brazilian orange/ROW apple -0.7516*** 0.1433 -0.2968** 0.1395 Brazilian orange/U.S. grape -0.2100*** 0.0720 -0.0389 0.0712 Brazilian orange/ROW citrus -0.0835** 0.0360 -0.0145 0.0358 U.S. grapefruit/Thai pineapple -0.2349*** 0.0436 -0.2289*** 0.0437 U.S. grapefruit/Philippines pineapple -0.1826*** 0.0430 -0.1785** 0.0430 U.S. grapefruit/U.S. grape -0.2259** 0.1127 -0.1920* 0.1126 ROW. grapefruit/U.S. orange -0.8079** 0.3634 -0.7745** 0.3652 ROW. grapefruit/Italian citrus -0.3978*** 0.1204 -0.3898*** 0.1200 U.S. apple/ROW apple -0.8014** 0.3183 -0.6650** 0.3111 U.S. apple/ROW pineapple -0.2705*** 0.0821 -0.2631*** 0.0822 U.S. apple/Argentinean grape -0.3180*** 0.0629 -0.3105*** 0.0629 U.S. apple/Israelis citrus -0.2350*** 0.0803 -0.2168*** 0.0799 Chinese. apple/ROW p. apple -0.1052* 0.0588 -0.0994* 0.0588 Chinese. apple/ROW grape -0.2106* 0.1205 -0.1684 0.1206 ROW apple/Brazilian orange -0.5797*** 0.2162 -0.4566** 0.2146 ROW apple/U.S. apple -0.2560** 0.1061 -0.2285** 0.1069 Thai pineapple/U.S. grapefruit -1.7249*** 0.3230 -1.6922*** 0.3229 Philippines pineapple/U.S. grapefruit -1.9287*** 0.4587 -1.9027*** 0.4587 ROW pineapple/U.S. apple -1.6233*** 0.5187 -1.6702*** 0.5219 ROW pineapple/Chinese apple -0.7491* 0.4808 -0.8093* 0.4788 U.S. grape/U.S. grapefruit -0.2603* 0.1468 -0.2497* 0.1465 Argentinean grape/U.S. apple -1.9336*** 0.3870 -1.9227*** 0.3894 Israelis other citrus/U.S. orange -0.7189** 0.2810 -0.7040** 0.2829 Israelis other citrus/U.S. apple -0.5692*** 0.2041 -0.5575*** 0.2054 Italian other citrus/ROW grapefruit -0.2533*** 0.0771 -0.2521*** 0.0776 ROW other citrus/U.S. orange -0.4326** 0.2100 -0.4139** 0.2110 *** (**)* significance at 1%, 5% and 10%