Embed Size (px)
Citation preview
85
7 Government debt and contingent liabilities
In brief
Government’s net borrowing requirement – the amount needed to finance the budget deficit – is expected to decrease from R172.8 billion in 2015/16 to R151.3 billion in 2018/19. Net debt stabilises at 46.2 per cent of GDP in 2017/18.
Government’s foreign debt remains low, at 10 per cent of gross loan debt.
In 2018/19, gross bond issuance in the domestic market will be the lowest since 2011/12, reflecting the outcome of fiscal consolidation.
South Africa’s deep and liquid domestic capital markets, and its access to international borrowing, continue to provide resources for government’s financing needs. Domestic capital markets will remain the main source of borrowing.
Global investors hold 32 per cent of rand-denominated government bonds. Their holdings are sensitive to any shifts in US monetary policy and South Africa’s sovereign credit ratings.
Over the medium term, government’s borrowing strategy focuses on reducing the risks presented by the sharp increase in loan repayments beginning in 2016/17.
The National Treasury has updated the framework for reporting government’s contingent liabilities in line with international practice.
Overview
overnment’s medium-term borrowing strategy reflects a prudent
approach to managing debt in an environment of greater
uncertainty. Over the past year, global market volatility has been
fuelled by concerns about the world economic outlook, the Greek debt
crisis, the pace and scope of US interest rate increases, and the course of
China’s economic reforms. Capital outflows from emerging markets
totalled an estimated US$735 billion in 2015. In South Africa, a lower
economic growth outlook and exchange rate depreciation, alongside
concerns about policy certainty and sovereign credit ratings, contributed to
an unfavourable funding environment.
In combination, these developments have increased the cost that
government pays to borrow money. Between April 2015 and January of
G Borrowing strategy reflects
prudent approach to
managing debt in uncertain
environment
2016 BUDGET REVIEW
86
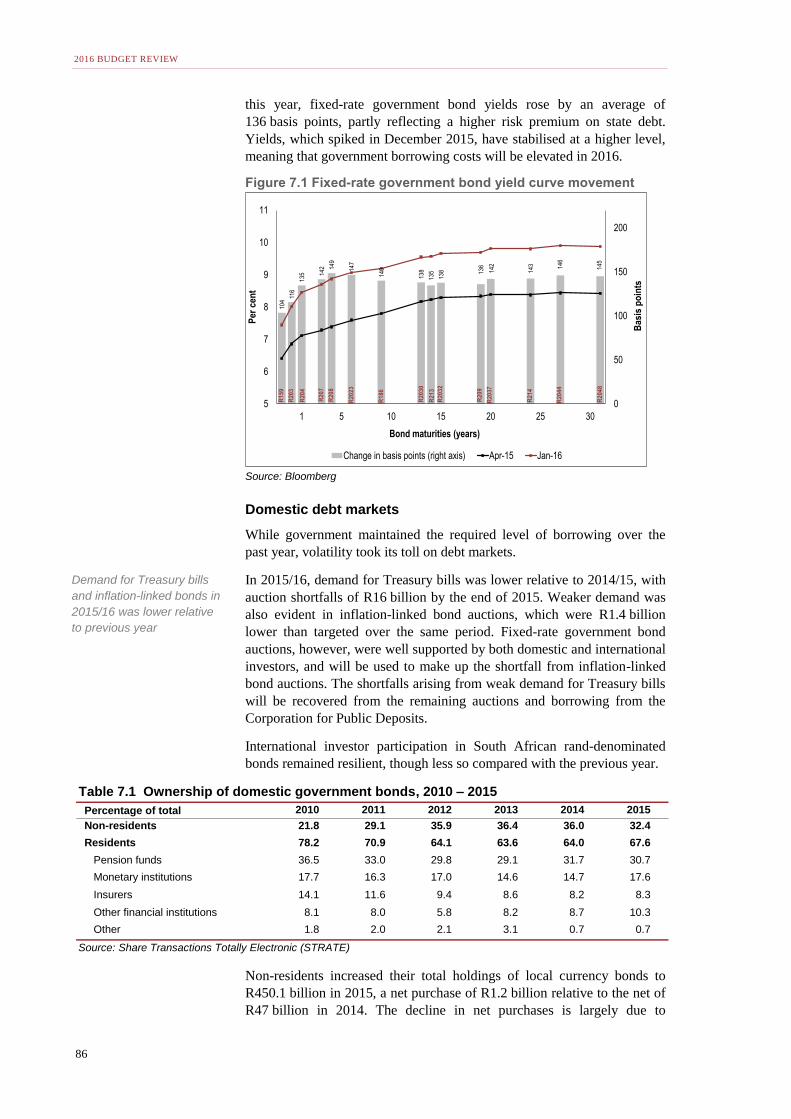
this year, fixed-rate government bond yields rose by an average of
136 basis points, partly reflecting a higher risk premium on state debt.
Yields, which spiked in December 2015, have stabilised at a higher level,
meaning that government borrowing costs will be elevated in 2016.
Figure 7.1 Fixed-rate government bond yield curve movement
Source: Bloomberg
Domestic debt markets
While government maintained the required level of borrowing over the
past year, volatility took its toll on debt markets.
In 2015/16, demand for Treasury bills was lower relative to 2014/15, with
auction shortfalls of R16 billion by the end of 2015. Weaker demand was
also evident in inflation-linked bond auctions, which were R1.4 billion
lower than targeted over the same period. Fixed-rate government bond
auctions, however, were well supported by both domestic and international
investors, and will be used to make up the shortfall from inflation-linked
bond auctions. The shortfalls arising from weak demand for Treasury bills
will be recovered from the remaining auctions and borrowing from the
Corporation for Public Deposits.
International investor participation in South African rand-denominated
bonds remained resilient, though less so compared with the previous year.
Non-residents increased their total holdings of local currency bonds to
R450.1 billion in 2015, a net purchase of R1.2 billion relative to the net of
R47 billion in 2014. The decline in net purchases is largely due to
10
4
116
13
5 14
2 14
9
14
7
14
0
13
8
13
5
13
8 13
6
14
2
14
3 14
6
14
5
0
50
100
150
200
5
6
7
8
9
10
11
1 5 10 15 20 25 30
Ba
sis
po
ints
Per
ce
nt
Bond maturities (years)
Change in basis points (right axis) Apr-15 Jan-16
R2
04
8
R1
59
R2
04
R2
14
R2
09
R2
13
R1
86
R2
02
3
R2
08
R2
07
R2
03
0
R2
03
7
R2
03
R2
03
2
R2
04
4
Table 7.1 Ownership of domestic government bonds, 2010 – 2015
Percentage of total 2010 2011 2012 2013 2014 2015
Non-residents 21.8 29.1 35.9 36.4 36.0 32.4
Residents 78.2 70.9 64.1 63.6 64.0 67.6
Pension funds 36.5 33.0 29.8 29.1 31.7 30.7
Monetary institutions 17.7 16.3 17.0 14.6 14.7 17.6
Insurers 14.1 11.6 9.4 8.6 8.2 8.3
Other financial institutions 8.1 8.0 5.8 8.2 8.7 10.3
Other 1.8 2.0 2.1 3.1 0.7 0.7
Source: Share Transactions Totally Electronic (STRATE)
Demand for Treasury bills
and inflation-linked bonds in
2015/16 was lower relative
to previous year
CHAPTER 7: GOVERNMENT DEBT AND CONTINGENT LIABILITIES
87
increasing risk aversion towards developing economies. At the end of
2015, global investors held about 32 per cent of government’s rand-
denominated bonds, down from 36 per cent a year earlier. Domestic
buyers continued to purchase government bonds, illustrating the depth and
liquidity of South Africa’s capital markets.
Managing risks
The main risks to government’s borrowing programme are as follows:
Rising interest rates and bond yields. The Reserve Bank, noting the
deteriorating inflation outlook, has raised interest rates by 100 basis
points since July 2015. If inflationary pressures continue during 2016,
investors will demand higher yields to compensate for inflation risk. In
addition, any deterioration in South Africa’s sovereign credit ratings
would increase bond yields. Standard & Poor’s and Fitch Ratings
currently rate South Africa at one notch above sub-investment grade
for foreign-currency denominated debt, with a negative and stable
outlook respectively. Moody’s is two notches higher, with a negative
outlook.
Volatile capital flows. Interest rate hikes by the US Federal Reserve
could reduce capital flows to developing countries, resulting in further
depreciation of the rand-dollar exchange rate, as well as reduced
demand and the re-pricing of government debt at a higher level.
Economic growth and the fiscal position. Continued deterioration of
the economic outlook or the fiscal position, or accelerated funding
difficulties at state-owned companies, could increase both the level and
cost of borrowing.
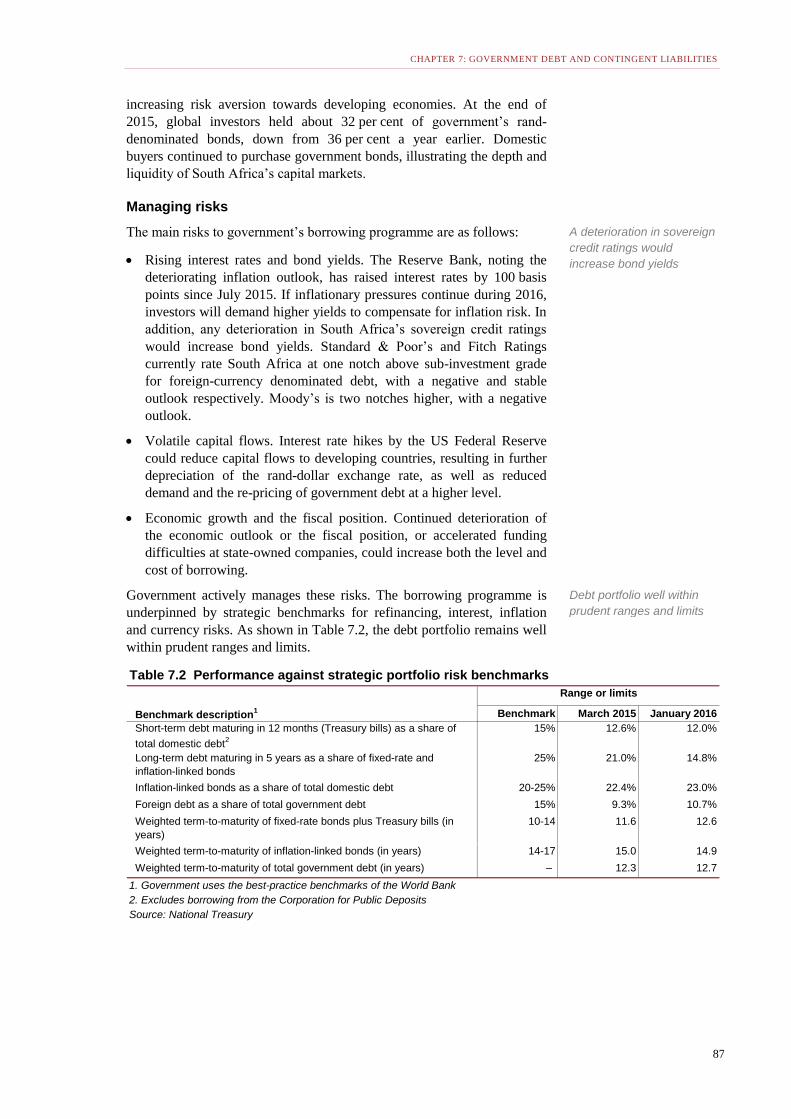
Government actively manages these risks. The borrowing programme is
underpinned by strategic benchmarks for refinancing, interest, inflation
and currency risks. As shown in Table 7.2, the debt portfolio remains well
within prudent ranges and limits.
Table 7.2 Performance against strategic portfolio risk benchmarks
Benchmark description1 Benchmark March 2015 January 2016
Short-term debt maturing in 12 months (Treasury bills) as a share of
total domestic debt2
15% 12.6% 12.0%
Long-term debt maturing in 5 years as a share of fixed-rate and
inflation-linked bonds
25% 21.0% 14.8%
Inflation-linked bonds as a share of total domestic debt 20-25% 22.4% 23.0%
Foreign debt as a share of total government debt 15% 9.3% 10.7%
Weighted term-to-maturity of fixed-rate bonds plus Treasury bills (in
years)
10-14 11.6 12.6
Weighted term-to-maturity of inflation-linked bonds (in years) 14-17 15.0 14.9
Weighted term-to-maturity of total government debt (in years) – 12.3 12.7
1. Government uses the best-practice benchmarks of the World Bank
2. Excludes borrowing from the Corporation for Public Deposits
Source: National Treasury
Range or limits
A deterioration in sovereign
credit ratings would
increase bond yields
Debt portfolio well within
prudent ranges and limits
2016 BUDGET REVIEW
88
Medium-term borrowing strategy
Government’s medium-term borrowing strategy takes a risk-sensitive
approach to financing debt over the next three years. In addition to
benchmarking, the strategy maintains a broad range of funding options in
the domestic and global markets. It includes measures to manage
refinancing risk – the risk that the state will not be able to raise money to
repay debt, or will have to do so at a higher cost – by adjusting the
composition and maturity of the debt portfolio.
A small proportion of government borrowing is financed through short-
term debt with maturities of less than a year – bought mainly by banks to
meet their prescribed liquid asset requirements. Government also
maintains a bond-switch programme that exchanges short- for longer-term
debt to ease pressure on targeted areas of the loan-redemption profile.
Through the foreign-borrowing programme, government partially finances
the state’s foreign-currency commitments and maintains benchmarks in
major currencies.
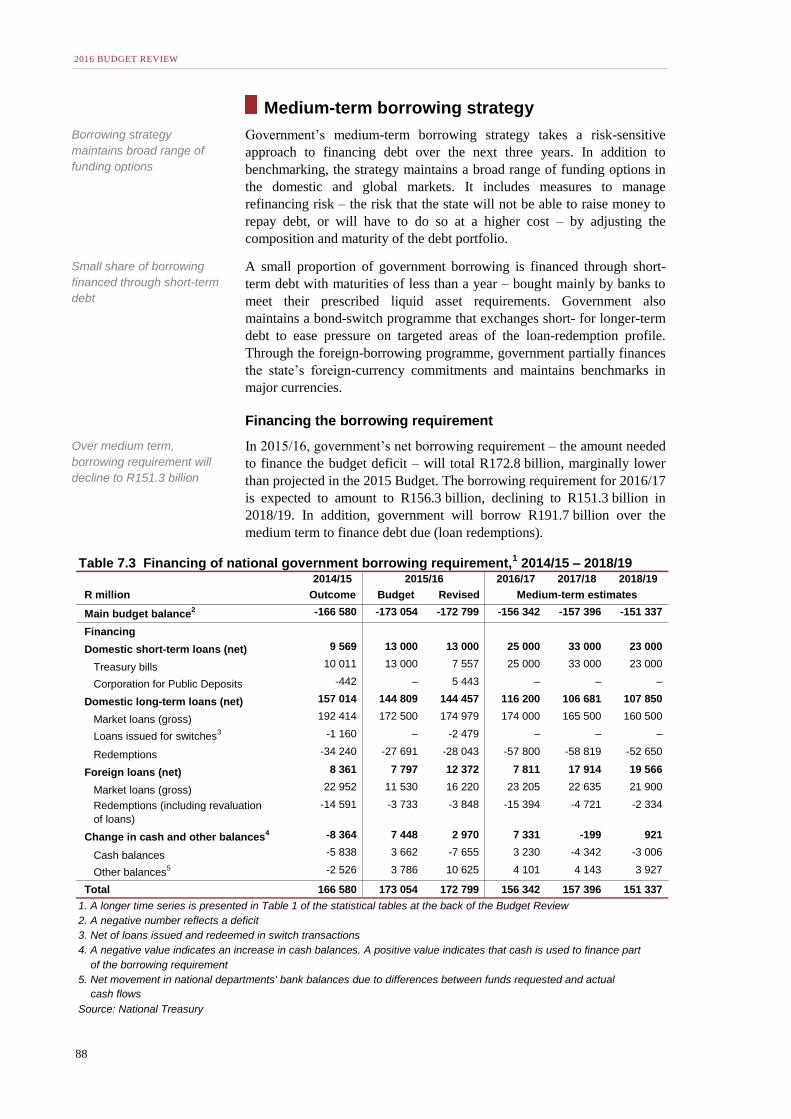
Financing the borrowing requirement
In 2015/16, government’s net borrowing requirement – the amount needed
to finance the budget deficit – will total R172.8 billion, marginally lower
than projected in the 2015 Budget. The borrowing requirement for 2016/17
is expected to amount to R156.3 billion, declining to R151.3 billion in
2018/19. In addition, government will borrow R191.7 billion over the
medium term to finance debt due (loan redemptions).
Table 7.3 Financing of national government borrowing requirement,1 2014/15 – 2018/19
2014/15 2015/16 2016/17 2017/18 2018/19
R million Outcome Budget Revised
Main budget balance2 -166 580 -173 054 -172 799 -156 342 -157 396 -151 337
Financing
Domestic short-term loans (net) 9 569 13 000 13 000 25 000 33 000 23 000
Treasury bills 10 011 13 000 7 557 25 000 33 000 23 000
Corporation for Public Deposits -442 – 5 443 – – –
Domestic long-term loans (net) 157 014 144 809 144 457 116 200 106 681 107 850
Market loans (gross) 192 414 172 500 174 979 174 000 165 500 160 500
Loans issued for switches3 -1 160 – -2 479 – – –
Redemptions -34 240 -27 691 -28 043 -57 800 -58 819 -52 650
Foreign loans (net) 8 361 7 797 12 372 7 811 17 914 19 566
Market loans (gross) 22 952 11 530 16 220 23 205 22 635 21 900
Redemptions (including revaluation
of loans)
-14 591 -3 733 -3 848 -15 394 -4 721 -2 334
Change in cash and other balances4 -8 364 7 448 2 970 7 331 -199 921
Cash balances -5 838 3 662 -7 655 3 230 -4 342 -3 006
Other balances5 -2 526 3 786 10 625 4 101 4 143 3 927
Total 166 580 173 054 172 799 156 342 157 396 151 337
1. A longer time series is presented in Table 1 of the statistical tables at the back of the Budget Review
2. A negative number reflects a deficit
3. Net of loans issued and redeemed in switch transactions
4. A negative value indicates an increase in cash balances. A positive value indicates that cash is used to finance part
of the borrowing requirement
5. Net movement in national departments' bank balances due to differences between funds requested and actual
cash flows
Source: National Treasury
Medium-term estimates
Borrowing strategy
maintains broad range of
funding options
Small share of borrowing
financed through short-term
debt
Over medium term,
borrowing requirement will
decline to R151.3 billion
CHAPTER 7: GOVERNMENT DEBT AND CONTINGENT LIABILITIES
89
Domestic short-term debt is made up of Treasury bills and borrowing from
the public sector through the Corporation for Public Deposits. Domestic
long-term loans consist of fixed-rate, inflation-linked and RSA retail
savings bonds with maturities up to 35 years, and are mainly held by
pension funds and other long-term investors to cover their future
commitments.
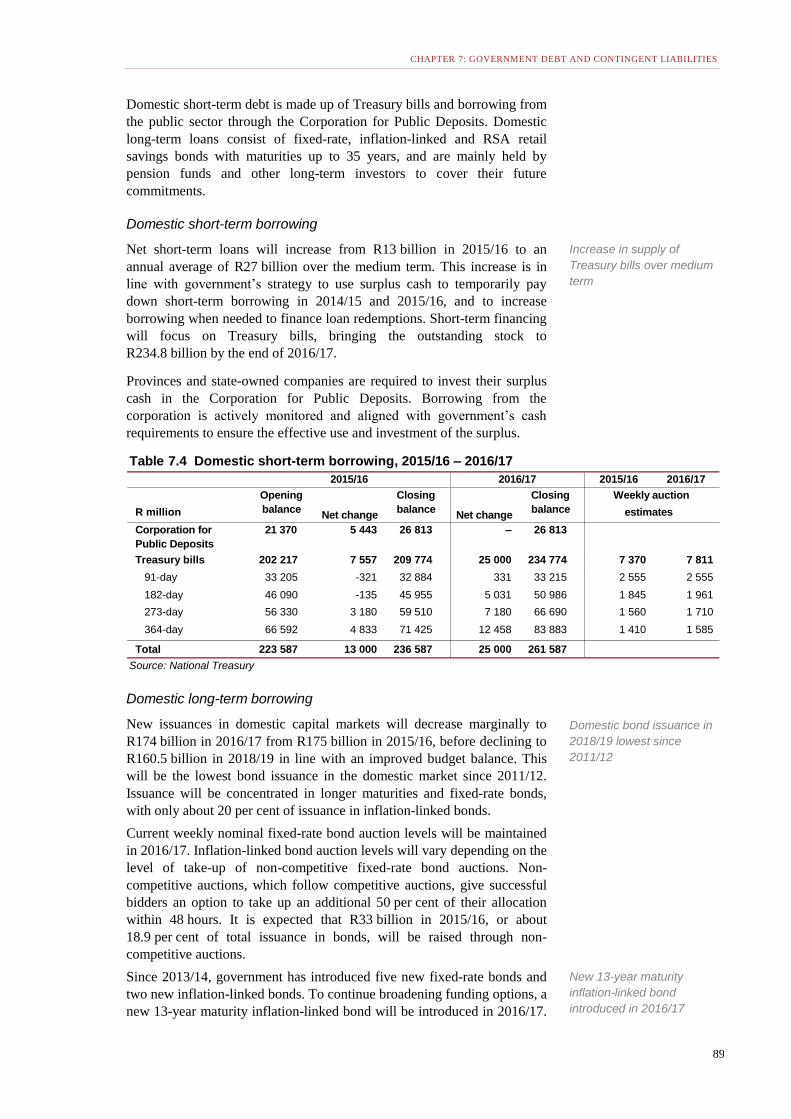
Domestic short-term borrowing
Net short-term loans will increase from R13 billion in 2015/16 to an
annual average of R27 billion over the medium term. This increase is in
line with government’s strategy to use surplus cash to temporarily pay
down short-term borrowing in 2014/15 and 2015/16, and to increase
borrowing when needed to finance loan redemptions. Short-term financing
will focus on Treasury bills, bringing the outstanding stock to
R234.8 billion by the end of 2016/17.
Provinces and state-owned companies are required to invest their surplus
cash in the Corporation for Public Deposits. Borrowing from the
corporation is actively monitored and aligned with government’s cash
requirements to ensure the effective use and investment of the surplus.
Domestic long-term borrowing
New issuances in domestic capital markets will decrease marginally to
R174 billion in 2016/17 from R175 billion in 2015/16, before declining to
R160.5 billion in 2018/19 in line with an improved budget balance. This
will be the lowest bond issuance in the domestic market since 2011/12.
Issuance will be concentrated in longer maturities and fixed-rate bonds,
with only about 20 per cent of issuance in inflation-linked bonds.
Current weekly nominal fixed-rate bond auction levels will be maintained
in 2016/17. Inflation-linked bond auction levels will vary depending on the
level of take-up of non-competitive fixed-rate bond auctions. Non-
competitive auctions, which follow competitive auctions, give successful
bidders an option to take up an additional 50 per cent of their allocation
within 48 hours. It is expected that R33 billion in 2015/16, or about
18.9 per cent of total issuance in bonds, will be raised through non-
competitive auctions.
Since 2013/14, government has introduced five new fixed-rate bonds and
two new inflation-linked bonds. To continue broadening funding options, a
new 13-year maturity inflation-linked bond will be introduced in 2016/17.
Table 7.4 Domestic short-term borrowing, 2015/16 – 2016/17
2015/16 2016/17
R million
Corporation for
Public Deposits
21 370 5 443 26 813 – 26 813
Treasury bills 202 217 7 557 209 774 25 000 234 774 7 370 7 811
91-day 33 205 -321 32 884 331 33 215 2 555 2 555
182-day 46 090 -135 45 955 5 031 50 986 1 845 1 961
273-day 56 330 3 180 59 510 7 180 66 690 1 560 1 710
364-day 66 592 4 833 71 425 12 458 83 883 1 410 1 585
Total 223 587 13 000 236 587 25 000 261 587
Source: National Treasury
Weekly auction
estimates
2015/16 2016/17
Opening
balance Net change
Closing
balance Net change
Closing
balance
Increase in supply of
Treasury bills over medium
term
Domestic bond issuance in
2018/19 lowest since
2011/12
New 13-year maturity
inflation-linked bond
introduced in 2016/17
2016 BUDGET REVIEW
90
No new fixed-rated bonds will be introduced in 2016/17. Issuance will be
concentrated in recently introduced bonds to allow the amounts
outstanding on these bonds to increase and improve liquidity.
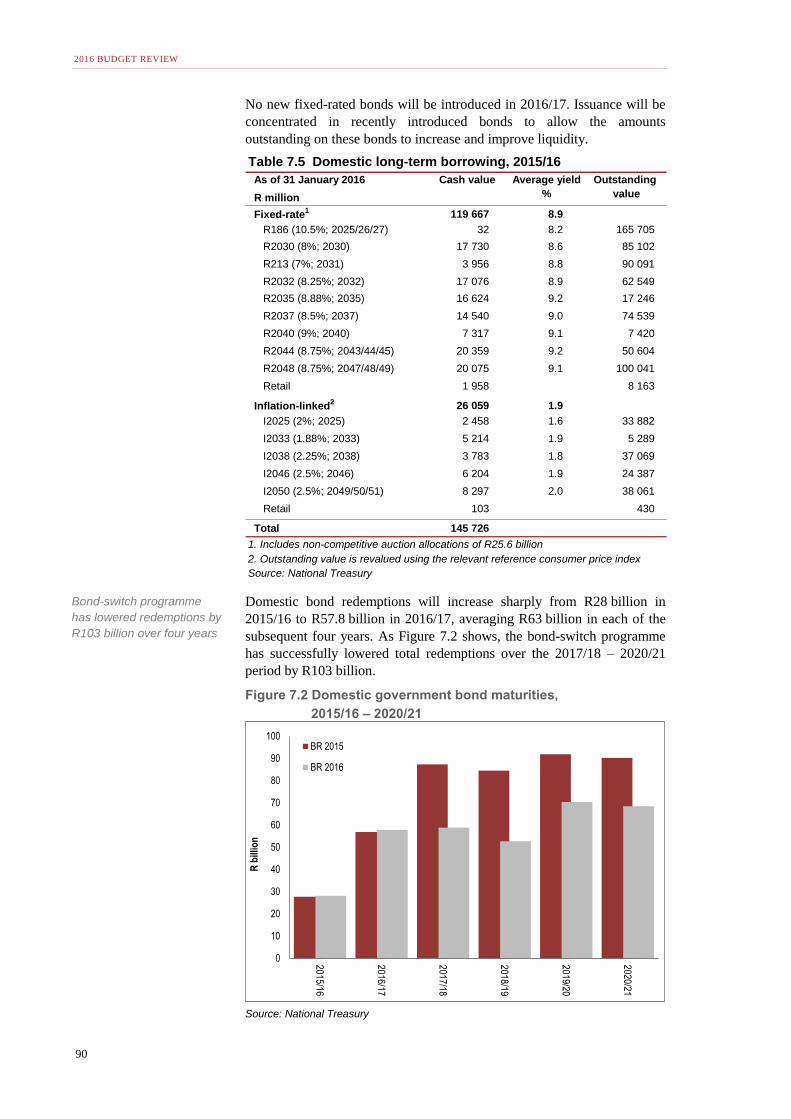
Domestic bond redemptions will increase sharply from R28 billion in
2015/16 to R57.8 billion in 2016/17, averaging R63 billion in each of the
subsequent four years. As Figure 7.2 shows, the bond-switch programme
has successfully lowered total redemptions over the 2017/18 – 2020/21
period by R103 billion.
Figure 7.2 Domestic government bond maturities,
2015/16 – 2020/21
Source: National Treasury
Table 7.5 Domestic long-term borrowing, 2015/16
As of 31 January 2016
R million
Fixed-rate1 119 667 8.9
R186 (10.5%; 2025/26/27) 32 8.2 165 705
R2030 (8%; 2030) 17 730 8.6 85 102
R213 (7%; 2031) 3 956 8.8 90 091
R2032 (8.25%; 2032) 17 076 8.9 62 549
R2035 (8.88%; 2035) 16 624 9.2 17 246
R2037 (8.5%; 2037) 14 540 9.0 74 539
R2040 (9%; 2040) 7 317 9.1 7 420
R2044 (8.75%; 2043/44/45) 20 359 9.2 50 604
R2048 (8.75%; 2047/48/49) 20 075 9.1 100 041
Retail 1 958 8 163
Inflation-linked2 26 059 1.9
I2025 (2%; 2025) 2 458 1.6 33 882
I2033 (1.88%; 2033) 5 214 1.9 5 289
I2038 (2.25%; 2038) 3 783 1.8 37 069
I2046 (2.5%; 2046) 6 204 1.9 24 387
I2050 (2.5%; 2049/50/51) 8 297 2.0 38 061
Retail 103 430
Total 145 726
1. Includes non-competitive auction allocations of R25.6 billion
2. Outstanding value is revalued using the relevant reference consumer price index
Source: National Treasury
Cash value Average yield
%
Outstanding
value
0
10
20
30
40
50
60
70
80
90
100
2015/16
2016/17
2017/18
2018/19
2019/20
2020
/21
R b
illio
n
BR 2015
BR 2016
Bond-switch programme
has lowered redemptions by
R103 billion over four years
CHAPTER 7: GOVERNMENT DEBT AND CONTINGENT LIABILITIES
91
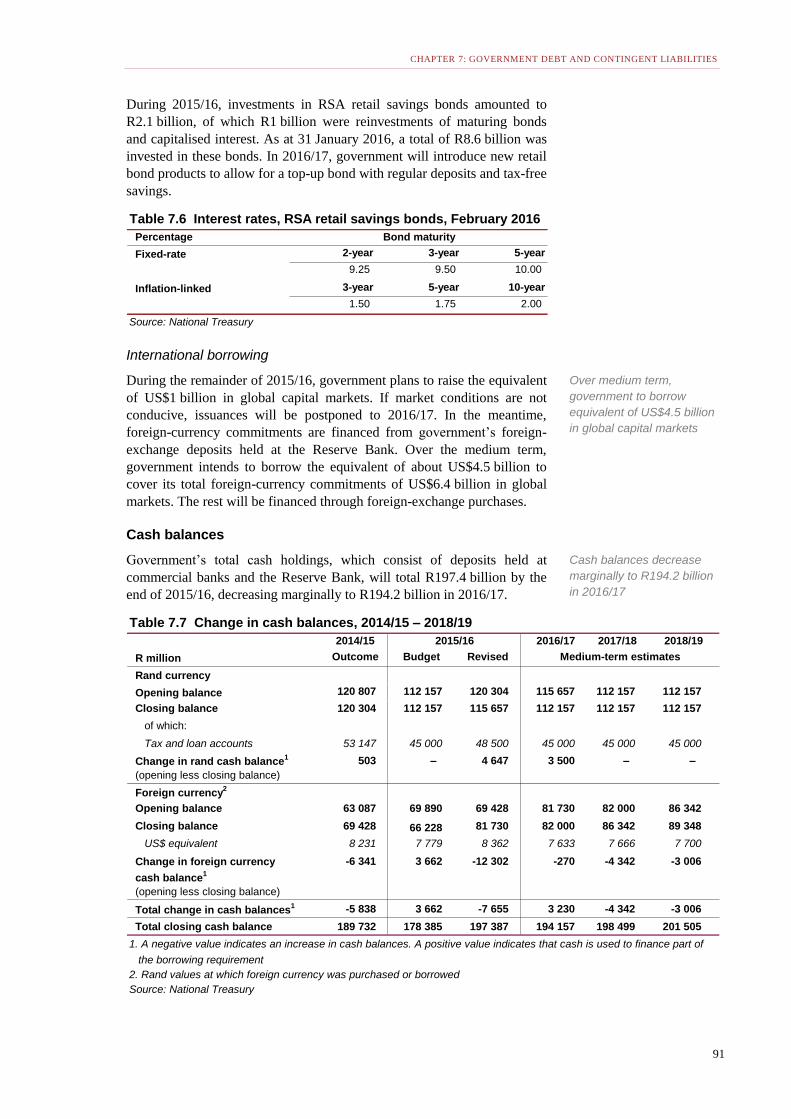
During 2015/16, investments in RSA retail savings bonds amounted to
R2.1 billion, of which R1 billion were reinvestments of maturing bonds
and capitalised interest. As at 31 January 2016, a total of R8.6 billion was
invested in these bonds. In 2016/17, government will introduce new retail
bond products to allow for a top-up bond with regular deposits and tax-free
savings.
International borrowing
During the remainder of 2015/16, government plans to raise the equivalent
of US$1 billion in global capital markets. If market conditions are not
conducive, issuances will be postponed to 2016/17. In the meantime,
foreign-currency commitments are financed from government’s foreign-
exchange deposits held at the Reserve Bank. Over the medium term,
government intends to borrow the equivalent of about US$4.5 billion to
cover its total foreign-currency commitments of US$6.4 billion in global
markets. The rest will be financed through foreign-exchange purchases.
Cash balances
Government’s total cash holdings, which consist of deposits held at
commercial banks and the Reserve Bank, will total R197.4 billion by the
end of 2015/16, decreasing marginally to R194.2 billion in 2016/17.
Table 7.6 Interest rates, RSA retail savings bonds, February 2016
Percentage
Fixed-rate 2-year 3-year 5-year
9.25 9.50 10.00
Inflation-linked 3-year 5-year 10-year
1.50 1.75 2.00
Source: National Treasury
Bond maturity
Table 7.7 Change in cash balances, 2014/15 – 2018/19
2014/15 2016/17 2017/18 2018/19
R million Outcome Budget Revised Medium-term estimates
Rand currency
Opening balance 120 807 112 157 120 304 115 657 112 157 112 157
Closing balance 120 304 112 157 115 657 112 157 112 157 112 157
of which:
Tax and loan accounts 53 147 45 000 48 500 45 000 45 000 45 000
Change in rand cash balance1
(opening less closing balance)
503 – 4 647 3 500 – –
Foreign currency2
Opening balance 63 087 69 890 69 428 81 730 82 000 86 342
Closing balance 69 428 66 228 81 730 82 000 86 342 89 348
US$ equivalent 8 231 7 779 8 362 7 633 7 666 7 700
Change in foreign currency
cash balance1
(opening less closing balance)
-6 341 3 662 -12 302 -270 -4 342 -3 006
Total change in cash balances1 -5 838 3 662 -7 655 3 230 -4 342 -3 006
Total closing cash balance 189 732 178 385 197 387 194 157 198 499 201 505
1. A negative value indicates an increase in cash balances. A positive value indicates that cash is used to finance part of
the borrowing requirement
2. Rand values at which foreign currency was purchased or borrowed
Source: National Treasury
2015/16
Over medium term,
government to borrow
equivalent of US$4.5 billion
in global capital markets
Cash balances decrease
marginally to R194.2 billion
in 2016/17
2016 BUDGET REVIEW
92
In the current year, of the total, R138.9 billion are deposits made with the
Reserve Bank to increase the level of official foreign-exchange reserves
and are only available for use by government as bridging finance.
Debt and other government obligations
Government monitors debt, cash balances and credit risk emanating from
contingent liabilities – commitments that may give rise to financial
obligations depending on the outcome of future events. These include
explicit liabilities – guarantees or other formal obligations binding
government to future financial commitments – and implicit liabilities,
which emanate from the state’s obligation to support entities deemed to be
of national interest.
The National Treasury, working with the World Bank and International
Monetary Fund (IMF), has updated the framework for reporting on
contingent liabilities in line with international standards. The 2016 Budget
Review includes two categories of obligations that were previously
excluded: public-private partnerships (PPPs) and power-purchasing
agreements.
Contingent liabilities vary considerably by callability, risk and default
probabilities. They also differ in nature and purpose.
National government debt
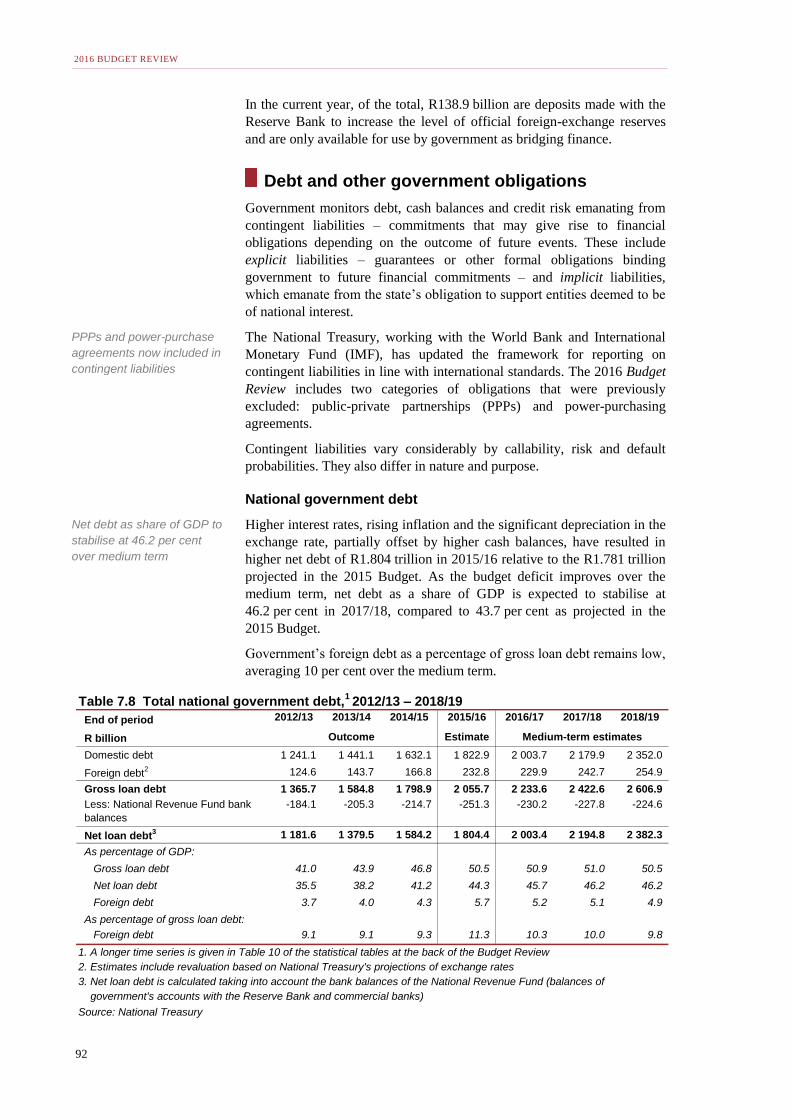
Higher interest rates, rising inflation and the significant depreciation in the
exchange rate, partially offset by higher cash balances, have resulted in
higher net debt of R1.804 trillion in 2015/16 relative to the R1.781 trillion
projected in the 2015 Budget. As the budget deficit improves over the
medium term, net debt as a share of GDP is expected to stabilise at
46.2 per cent in 2017/18, compared to 43.7 per cent as projected in the
2015 Budget.
Government’s foreign debt as a percentage of gross loan debt remains low,
averaging 10 per cent over the medium term.
Table 7.8 Total national government debt,1 2012/13 – 2018/19
End of period 2012/13 2013/14 2014/15 2015/16 2016/17 2017/18 2018/19
R billion Outcome Estimate
Domestic debt 1 241.1 1 441.1 1 632.1 1 822.9 2 003.7 2 179.9 2 352.0
Foreign debt2 124.6 143.7 166.8 232.8 229.9 242.7 254.9
Gross loan debt 1 365.7 1 584.8 1 798.9 2 055.7 2 233.6 2 422.6 2 606.9
Less: National Revenue Fund bank
balances
-184.1 -205.3 -214.7 -251.3 -230.2 -227.8 -224.6
Net loan debt3 1 181.6 1 379.5 1 584.2 1 804.4 2 003.4 2 194.8 2 382.3
As percentage of GDP:
Gross loan debt 41.0 43.9 46.8 50.5 50.9 51.0 50.5
Net loan debt 35.5 38.2 41.2 44.3 45.7 46.2 46.2
Foreign debt 3.7 4.0 4.3 5.7 5.2 5.1 4.9
As percentage of gross loan debt:
Foreign debt 9.1 9.1 9.3 11.3 10.3 10.0 9.8
1. A longer time series is given in Table 10 of the statistical tables at the back of the Budget Review
2. Estimates include revaluation based on National Treasury's projections of exchange rates
3. Net loan debt is calculated taking into account the bank balances of the National Revenue Fund (balances of
government's accounts with the Reserve Bank and commercial banks)
Source: National Treasury
Medium-term estimates
PPPs and power-purchase
agreements now included in
contingent liabilities
Net debt as share of GDP to
stabilise at 46.2 per cent
over medium term
CHAPTER 7: GOVERNMENT DEBT AND CONTINGENT LIABILITIES
93
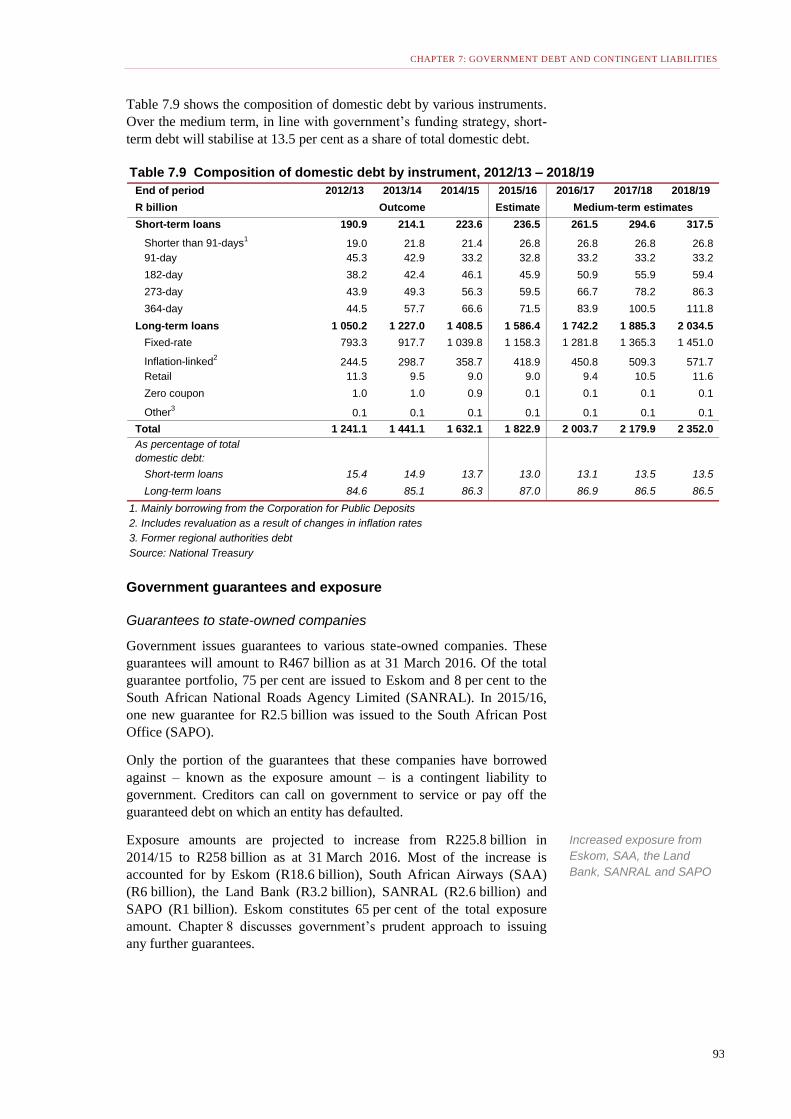
Table 7.9 shows the composition of domestic debt by various instruments.
Over the medium term, in line with government’s funding strategy, short-
term debt will stabilise at 13.5 per cent as a share of total domestic debt.
Government guarantees and exposure
Guarantees to state-owned companies
Government issues guarantees to various state-owned companies. These
guarantees will amount to R467 billion as at 31 March 2016. Of the total
guarantee portfolio, 75 per cent are issued to Eskom and 8 per cent to the
South African National Roads Agency Limited (SANRAL). In 2015/16,
one new guarantee for R2.5 billion was issued to the South African Post
Office (SAPO).
Only the portion of the guarantees that these companies have borrowed
against – known as the exposure amount – is a contingent liability to
government. Creditors can call on government to service or pay off the
guaranteed debt on which an entity has defaulted.
Exposure amounts are projected to increase from R225.8 billion in
2014/15 to R258 billion as at 31 March 2016. Most of the increase is
accounted for by Eskom (R18.6 billion), South African Airways (SAA)
(R6 billion), the Land Bank (R3.2 billion), SANRAL (R2.6 billion) and
SAPO (R1 billion). Eskom constitutes 65 per cent of the total exposure
amount. Chapter 8 discusses government’s prudent approach to issuing
any further guarantees.
Table 7.9 Composition of domestic debt by instrument, 2012/13 – 2018/19
End of period 2012/13 2013/14 2014/15 2015/16 2016/17 2017/18 2018/19
R billion Outcome Estimate Medium-term estimates
Short-term loans 190.9 214.1 223.6 236.5 261.5 294.6 317.5
Shorter than 91-days1
19.0 21.8 21.4 26.8 26.8 26.8 26.8
91-day 45.3 42.9 33.2 32.8 33.2 33.2 33.2
182-day 38.2 42.4 46.1 45.9 50.9 55.9 59.4
273-day 43.9 49.3 56.3 59.5 66.7 78.2 86.3
364-day 44.5 57.7 66.6 71.5 83.9 100.5 111.8
Long-term loans 1 050.2 1 227.0 1 408.5 1 586.4 1 742.2 1 885.3 2 034.5
Fixed-rate 793.3 917.7 1 039.8 1 158.3 1 281.8 1 365.3 1 451.0
Inflation-linked2
244.5 298.7 358.7 418.9 450.8 509.3 571.7
Retail 11.3 9.5 9.0 9.0 9.4 10.5 11.6
Zero coupon 1.0 1.0 0.9 0.1 0.1 0.1 0.1
Other3
0.1 0.1 0.1 0.1 0.1 0.1 0.1
Total 1 241.1 1 441.1 1 632.1 1 822.9 2 003.7 2 179.9 2 352.0
As percentage of total
domestic debt:
Short-term loans 15.4 14.9 13.7 13.0 13.1 13.5 13.5
Long-term loans 84.6 85.1 86.3 87.0 86.9 86.5 86.5
1. Mainly borrowing from the Corporation for Public Deposits
2. Includes revaluation as a result of changes in inflation rates
3. Former regional authorities debt
Source: National Treasury
Increased exposure from
Eskom, SAA, the Land
Bank, SANRAL and SAPO
2016 BUDGET REVIEW
94
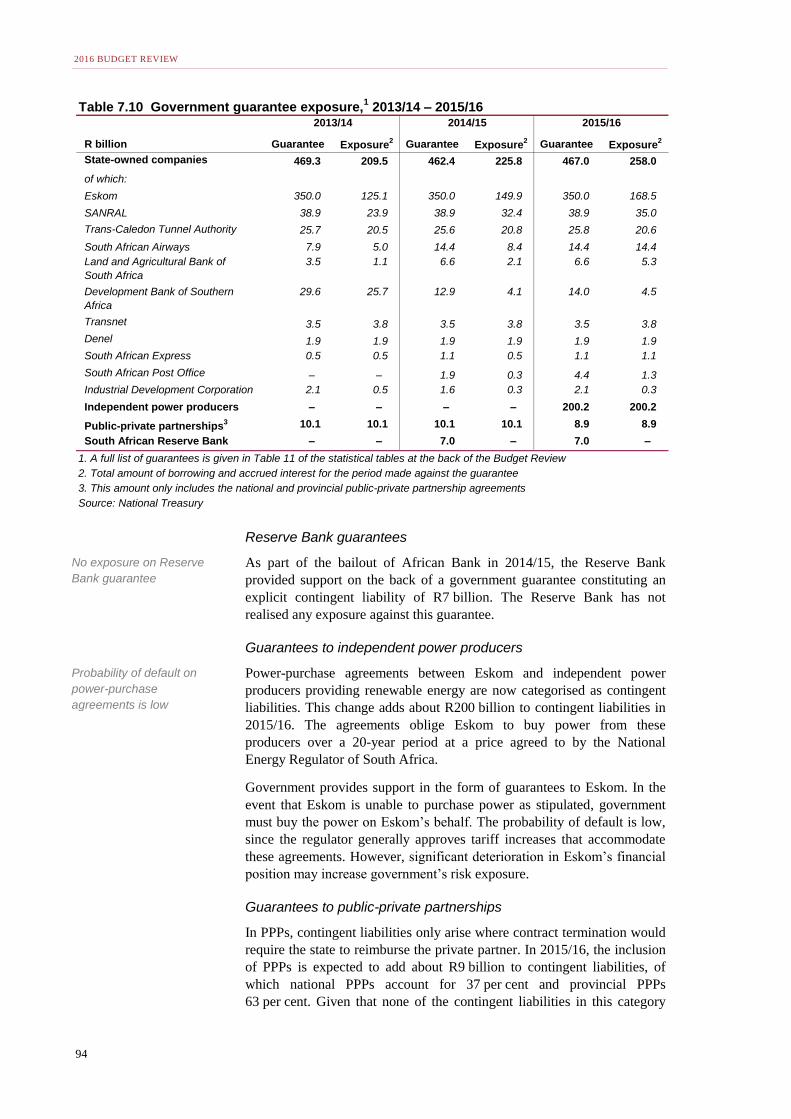
Reserve Bank guarantees
As part of the bailout of African Bank in 2014/15, the Reserve Bank
provided support on the back of a government guarantee constituting an
explicit contingent liability of R7 billion. The Reserve Bank has not
realised any exposure against this guarantee.
Guarantees to independent power producers
Power-purchase agreements between Eskom and independent power
producers providing renewable energy are now categorised as contingent
liabilities. This change adds about R200 billion to contingent liabilities in
2015/16. The agreements oblige Eskom to buy power from these
producers over a 20-year period at a price agreed to by the National
Energy Regulator of South Africa.
Government provides support in the form of guarantees to Eskom. In the
event that Eskom is unable to purchase power as stipulated, government
must buy the power on Eskom’s behalf. The probability of default is low,
since the regulator generally approves tariff increases that accommodate
these agreements. However, significant deterioration in Eskom’s financial
position may increase government’s risk exposure.
Guarantees to public-private partnerships
In PPPs, contingent liabilities only arise where contract termination would
require the state to reimburse the private partner. In 2015/16, the inclusion
of PPPs is expected to add about R9 billion to contingent liabilities, of
which national PPPs account for 37 per cent and provincial PPPs
63 per cent. Given that none of the contingent liabilities in this category
Table 7.10 Government guarantee exposure,1 2013/14 – 2015/16
R billion Guarantee Exposure2 Guarantee Exposure
2 Guarantee Exposure2
State-owned companies 469.3 209.5 462.4 225.8 467.0 258.0
of which:
Eskom 350.0 125.1 350.0 149.9 350.0 168.5
SANRAL 38.9 23.9 38.9 32.4 38.9 35.0
Trans-Caledon Tunnel Authority 25.7 20.5 25.6 20.8 25.8 20.6
South African Airways 7.9 5.0 14.4 8.4 14.4 14.4
Land and Agricultural Bank of
South Africa
3.5 1.1 6.6 2.1 6.6 5.3
Development Bank of Southern
Africa
29.6 25.7 12.9 4.1 14.0 4.5
Transnet 3.5 3.8 3.5 3.8 3.5 3.8
Denel 1.9 1.9 1.9 1.9 1.9 1.9
South African Express 0.5 0.5 1.1 0.5 1.1 1.1
South African Post Office – – 1.9 0.3 4.4 1.3
Industrial Development Corporation 2.1 0.5 1.6 0.3 2.1 0.3
Independent power producers – – – – 200.2 200.2
Public-private partnerships3 10.1 10.1 10.1 10.1 8.9 8.9
South African Reserve Bank – – 7.0 – 7.0 –
1. A full list of guarantees is given in Table 11 of the statistical tables at the back of the Budget Review
2. Total amount of borrowing and accrued interest for the period made against the guarantee
3. This amount only includes the national and provincial public-private partnership agreements
Source: National Treasury
2013/14 2014/15 2015/16
No exposure on Reserve
Bank guarantee
Probability of default on
power-purchase
agreements is low
CHAPTER 7: GOVERNMENT DEBT AND CONTINGENT LIABILITIES
95
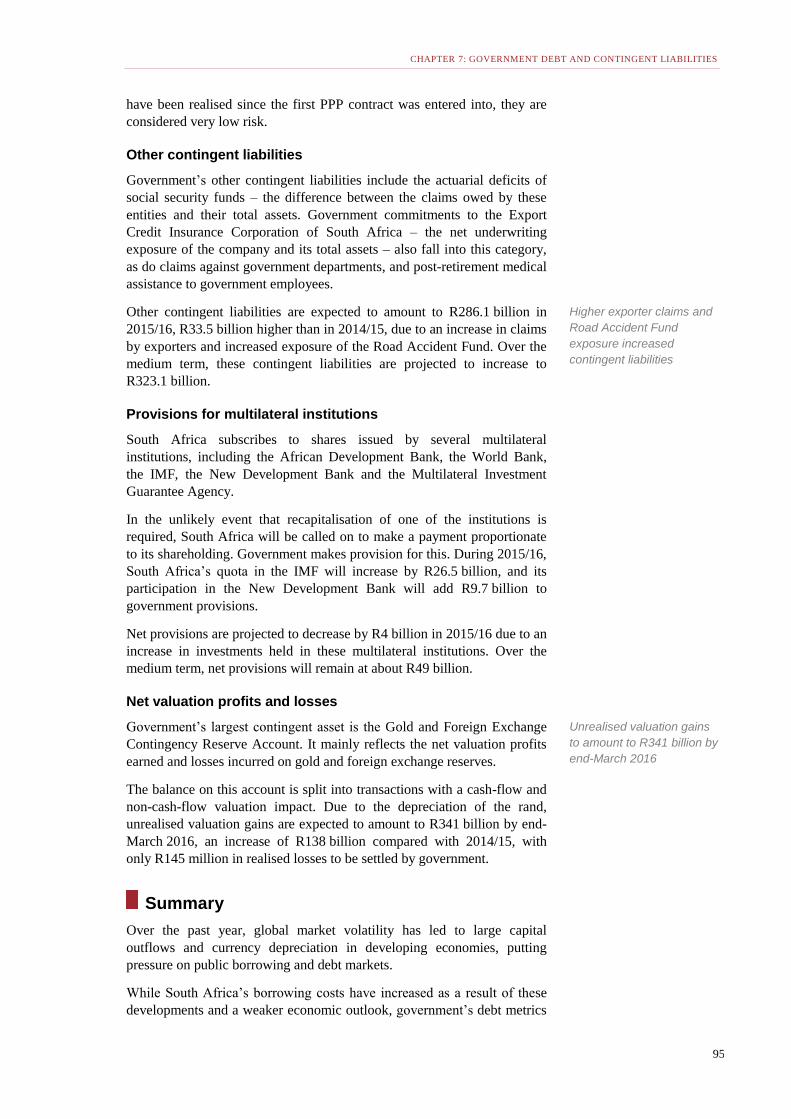
have been realised since the first PPP contract was entered into, they are
considered very low risk.
Other contingent liabilities
Government’s other contingent liabilities include the actuarial deficits of
social security funds – the difference between the claims owed by these
entities and their total assets. Government commitments to the Export
Credit Insurance Corporation of South Africa – the net underwriting
exposure of the company and its total assets – also fall into this category,
as do claims against government departments, and post-retirement medical
assistance to government employees.
Other contingent liabilities are expected to amount to R286.1 billion in
2015/16, R33.5 billion higher than in 2014/15, due to an increase in claims
by exporters and increased exposure of the Road Accident Fund. Over the
medium term, these contingent liabilities are projected to increase to
R323.1 billion.
Provisions for multilateral institutions
South Africa subscribes to shares issued by several multilateral
institutions, including the African Development Bank, the World Bank,
the IMF, the New Development Bank and the Multilateral Investment
Guarantee Agency.
In the unlikely event that recapitalisation of one of the institutions is
required, South Africa will be called on to make a payment proportionate
to its shareholding. Government makes provision for this. During 2015/16,
South Africa’s quota in the IMF will increase by R26.5 billion, and its
participation in the New Development Bank will add R9.7 billion to
government provisions.
Net provisions are projected to decrease by R4 billion in 2015/16 due to an
increase in investments held in these multilateral institutions. Over the
medium term, net provisions will remain at about R49 billion.
Net valuation profits and losses
Government’s largest contingent asset is the Gold and Foreign Exchange
Contingency Reserve Account. It mainly reflects the net valuation profits
earned and losses incurred on gold and foreign exchange reserves.
The balance on this account is split into transactions with a cash-flow and
non-cash-flow valuation impact. Due to the depreciation of the rand,
unrealised valuation gains are expected to amount to R341 billion by end-
March 2016, an increase of R138 billion compared with 2014/15, with
only R145 million in realised losses to be settled by government.
Summary
Over the past year, global market volatility has led to large capital
outflows and currency depreciation in developing economies, putting
pressure on public borrowing and debt markets.
While South Africa’s borrowing costs have increased as a result of these
developments and a weaker economic outlook, government’s debt metrics
Higher exporter claims and
Road Accident Fund
exposure increased
contingent liabilities
Unrealised valuation gains
to amount to R341 billion by
end-March 2016

2016 BUDGET REVIEW
96
remain well within benchmarks. Government’s prudent fiscal policy and
debt-management strategies, in combination with deep and liquid domestic
capital markets, will continue to support investment, ensure that
government can finance its borrowing requirement and improve the debt
trajectory.


![TOPIC 1 Accounting for Financial Liabilities[1]](https://img.pdfslide.tips/doc/110x75/5536ed794a795941208b4b31/topic-1-accounting-for-financial-liabilities1.jpg)