Embed Size (px)
Citation preview

SAND DEPOSITION MECHANISMS IN HOLOCENE MARSH STRATIGRAPHY FROM A
TSUNAMI PRONE LOCALITY, CRESCENT CITY, CALIFORNIA, SOUTHERN
CASCADIAN MARGIN
by
NICHOLAS ADAM GRAEHL
A Thesis
Presented to
The Faculty of Humboldt State University
In Partial Fulfillment
of the Requirements for the Degree
Bachelor of Science in Geology
May 14th, 2009
SAND DEPOISTION MECHANISMS IN HOLOCENE MARSH STRATIGRAPHY FROM A
TSUNAMI PRONE LOCALITY, CRESCENT CITY, CALIFORNIA, SOUTHERN
CASCADIAN MARGIN
By
Nicholas A. Graehl
iii
ABSTRACT
SAND DEPOSITION MECHANISMS IN HOLOCENE MARSH STRATIGRAPHY FROM A TSUNAMI PRONE LOCALITY, CRESCENT CITY, CALIFORNIA, SOUTHERN
CASCADIAN MARGIN
Nicholas A. Graehl
The objectives of the current study were to describe the stratigraphy of South Crescent Marsh
and to identify the candidate processes responsible for anomalous sand sheets in this coastal
freshwater marsh. Understanding the depositional mechanisms for the emplacement of
anomalous sands in coastal marshes will aid in the interpretation of marsh stratigraphy. To
investigate the stratigraphy at South Crescent marsh, 18 gouge cores were extracted along a
transect perpendicular to Crescent Beach that bisected the adjacent beach berm and South
Crescent Marsh. The subsurface stratigraphy was mapped approximately 200 meters east from
the western most edge of the marsh. All one-meter-long gouge cores were extracted at closely
spaced intervals to better asses the continuity of the subsurface stratigraphy and to facilitate in
layer correlations across the marsh. Four laterally continuous sand sheets were documented
within the stratigraphy of South Crescent Marsh. Because the marsh is a prime wash-over setting
located at MHHW behind a relatively small beach berm, elevated ocean levels from both
tsunamis and storms have an equal chance of inundating this area. Therefore the candidate
mechanisms responsible for the deposition of these four sand sheets are (1) near-field tsunamis
generated from the CSZ, (2) far-field tsunamis generated from within the Pacific Rim, and (3)
storm-waves caused by extreme climatic conditions. Findings from this study cannot attribute
with certainty which process caused the deposition of each of the sand sheets.

iv
DEDICATION
To my future child,
may we live life as a surprise like your birth will sure be
v
ACKNOWLEDGEMENTS
This work was supported in part by Lori Dengler of the Humboldt State Geology
Department. Her expertise, guidance, and genuine support were beneficial to the completion of
this report. A big thank you goes to Harvey Kelsey for project guidance and the technical review
of this paper. His work with paleoseismic investigations is an inspiration. Redwood National
Parks gave permission for this work in South Crescent marsh. Thanks to Chris Turner for helping
survey the study site, Bud Burke for letting me explore my thoughts about this project in Senior
Seminar, Curt Peterson for sharing his thoughts and work with me. And finally, to my wife,
Launa, who helped encourage and inspire me throughout this endeavor. This project would not
have been possible without her support, including incredibly good home-cooked food, countless
reviews, and most of all her unconditional love.
TABLE OF CONTENTS
ABSTRACT .................................................................................................................................... 3
DEDICATION ................................................................................................................................ 1
ACKNOWLEDGEMENTS ............................................................................................................ 1
INTRODUCTION .......................................................................................................................... 1
Crescent City ....................................................................................................................... 2
Setting ................................................................................................................................. 3
METHODS ..................................................................................................................................... 4
Selection of Study Site ........................................................................................................ 4
Field Study .......................................................................................................................... 4
RESULTS ....................................................................................................................................... 6
Stratigraphy ......................................................................................................................... 6
Mud ......................................................................................................................... 7
Muddy-peat ............................................................................................................. 7
Peaty-mud ............................................................................................................... 7
Peat .......................................................................................................................... 7
Sand......................................................................................................................... 7
Sand Sheets ......................................................................................................................... 8
Sand Sheet I ............................................................................................................ 8
Sand Sheet II ........................................................................................................... 8
Sand Sheet III .......................................................................................................... 9
Sand Sheet IV ......................................................................................................... 9
DISCUSSION ............................................................................................................................... 11
Sand Sheet I ...................................................................................................................... 11
Sand Sheets II and III ........................................................................................................ 11
Sand Sheet IV ................................................................................................................... 12
CONCLUSION ............................................................................................................................. 14
REFERENCES ............................................................................................................................. 15
LIST OF TABLES ........................................................................................................................ 18
Visual and Tactile Estimation of Lithology ...................................................................... 19
Sand Sheet Attributes from South Crescent Marsh .......................................................... 20
Individual Core Attributes ................................................................................................ 21
LIST OF FIGURES ...................................................................................................................... 22
Tectonic Overview and Northern California Tsunami Sites ............................................. 23
Magoon’s 1964 Far-Field Tsunami Inundation Map ........................................................ 24
Location of Study Site and Surrounding Area .................................................................. 25
South Crescent Marsh Oblique Aerial Photos .................................................................. 26
Transect and Cross Section of South Crescent Marsh ...................................................... 27
Simplified Stratigraphy of All South Crescent Marsh Cores............................................ 28
APPENDIX A ............................................................................................................................... 29
Cores 1 - 4 ......................................................................................................................... 30
Cores 5 - 8 ......................................................................................................................... 31
Cores 9 - 12 ....................................................................................................................... 32
Cores 13 - 16 ..................................................................................................................... 33
Cores 17 - 18 ..................................................................................................................... 34
APPENDIX B ............................................................................................................................... 35
Survey Data ....................................................................................................................... 36
SAND DEPOISTION MECHANISMS IN HOLOCENE MARSH STRATIGRAPHY FROM A TSUNAMI PRONE LOCALITY, CRESCENT CITY, CALIFORNIA, SOUTHERN CASCADIAN MARGIN
- 1 -
INTRODUCTION
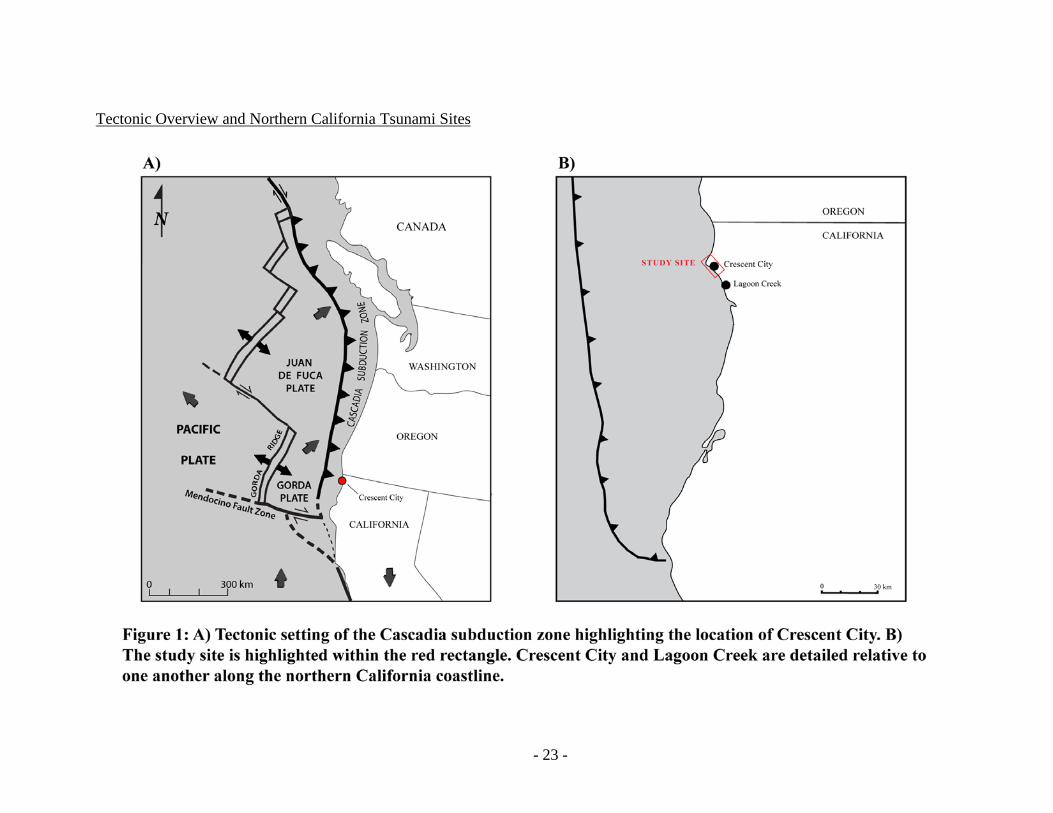
The Cascadia Subduction Zone (CSZ) is a ~1200 kilometer long convergent margin that
lies offshore roughly parallel to the Pacific coast and extends northward from Cape Mendocino,
California to Vancouver Island, British Columbia. The CSZ has generated at a minimum, seven
great (moment magnitude Mw ≥8) earthquakes over the last 2000 years (Atwater et al., 1995).
CSZ earthquakes vary in time ranging from 100 to 1200 years between subsequent quakes with
an average recurrence interval of approximately 500 years among sites that have a record dating
back 3500 years (Kelsey et al., 2005).
Coastal wetland and marsh stratigraphy along the CSZ exhibit evidence of tsunami
inundation and coseismic subsidence from tsunamis generated by great CSZ earthquakes (Clague
and Bobrowsky, 1994; Atwater et al., 1995). Anomalous sand sheets that are contained between
mud and peat are commonly interpreted to have been deposited by near-field tsunamis
coinciding with great earthquakes (Clague and Bobrowsky, 1994; Kelsey et al., 1998; Peters et
al., 2001). The last CSZ rupture took place on January 26, 1700. This great earthquake generated
a tsunami that inundated the Pacific coastline and deposited sand sheets which have been
identified in several coastal marshes from northern California to Vancouver Island (PG&E,
2002). More than 50 published studies have documented sites that contain confirmed or potential
geological evidence of tsunamis along the Pacific coast from northern California to Vancouver
Island (Peters et al., 2003). Several sites along the northern California coastline have identified
geologic evidence for tsunami inundation (Carver et al., 1996; Abramson, 1998; Garrison-Laney,
1998; PG&E, 2002; Patton, 2004).
SAND DEPOISTION MECHANISMS IN HOLOCENE MARSH STRATIGRAPHY FROM A TSUNAMI PRONE LOCALITY, CRESCENT CITY, CALIFORNIA, SOUTHERN CASCADIAN MARGIN
- 2 -
Crescent City
Historically, great subduction zone earthquakes, such as those in Chile, Alaska,
Kamchatka, Japan, and Indonesia, have generated tsunamis that have inundated coastal areas far
from the earthquake’s epicenter (Atwater, 1995; Dengler and Magoon, 2006). Two far-field
tsunamis, one from Chile in 1960 and the other from Alaska in 1964, inundated the Crescent City
area (PG&E, 2002; Dengler and Magoon, 2006). The deposits from these two far-field tsunamis
were preserved as two thin distinct sand sheets in Sand Mine Marsh near Crescent City (Carver
et al., 1996).
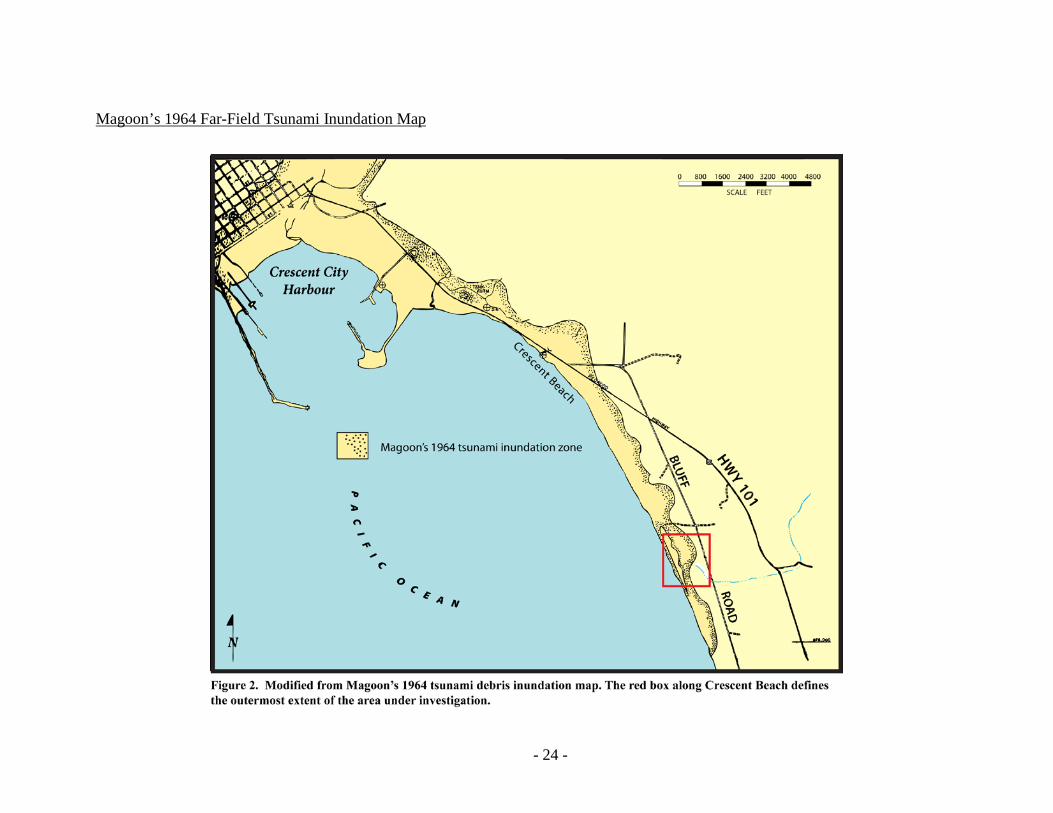
In historic times, Crescent City has been the most tsunami-prone area on the west coast of
the United States (Dengler and Magoon, 2006). Thirty-one tsunamis have been recorded at
Crescent City since 1933, nine with amplitudes of 0.5 meters or larger (NGDC, 2009). The 1964
far-field tsunami from Alaska was the largest historic event, flooding 29 city blocks in Crescent
City and inundating Crescent Beach to an elevation of approximately 20 feet (Magoon, 1966;
Figure 2). Paleoseismic investigations of Crescent City and Lagoon Creek (south of Crescent
City) show evidence of at least six large events in the past 3500 years (Abramson, 1998;
Garrison-Laney, 1998; PG&E, 2002). These sites contain the most complete stratigraphic record
of tsunami inundation in the Crescent City area (PG&E, 2002).
Several tsunamis have been recorded at Crescent City (Carver et al., 1996), yet these
seismically induced sea-waves represent only one of several processes responsible for the
deposition of anomalous sand sheets into coastal wetlands and marshes. Three processes are
considered as candidate depositional mechanisms in near sea level coastal marsh settings: (1)
near-field tsunamis generated from the CSZ, (2) far-field tsunamis generated from within the
Pacific Rim, and (3) storm-waves caused by extreme climatic conditions. Coastal marsh
SAND DEPOISTION MECHANISMS IN HOLOCENE MARSH STRATIGRAPHY FROM A TSUNAMI PRONE LOCALITY, CRESCENT CITY, CALIFORNIA, SOUTHERN CASCADIAN MARGIN
- 3 -
stratigraphy that includes multiple, laterally continuous sand sheets in wash-over settings may
contain sedimentary evidence of tsunami inundation as well as storm-wave run-up (Witter et al.,
1999). However, there is no published evidence for storm-wave deposits at Crescent City
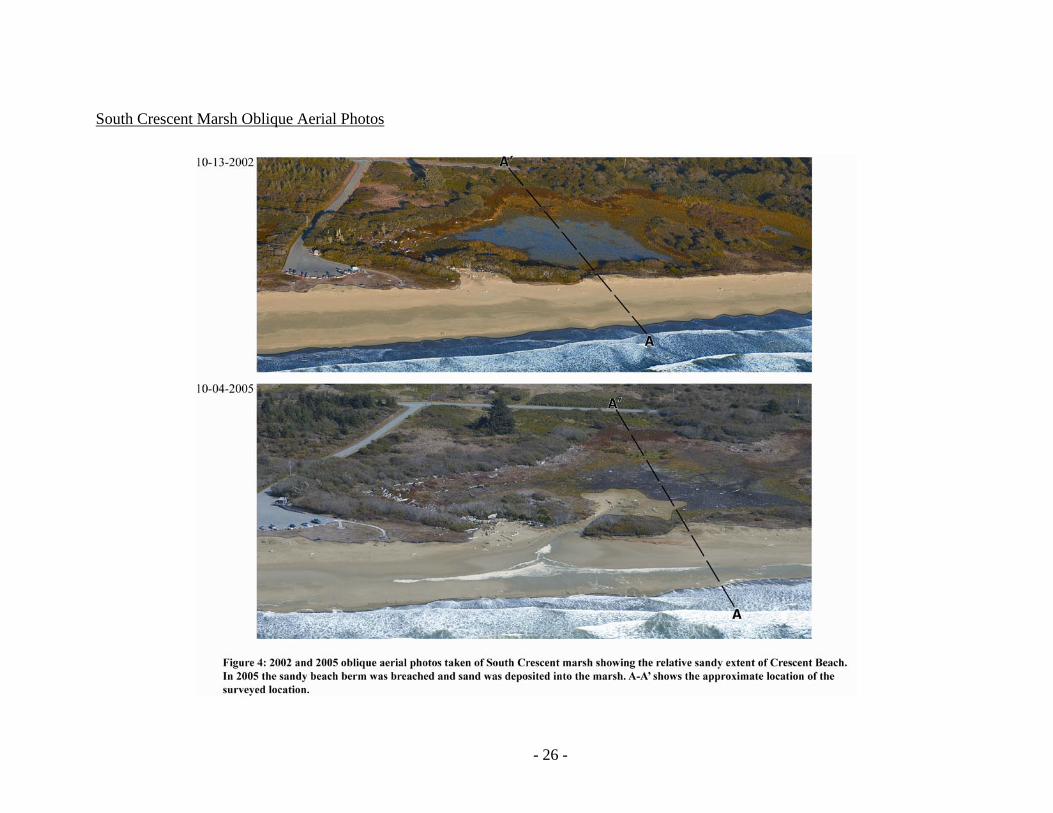
(PG&E, 2002). An oblique aerial photo in figure 4 documents the emplacement of a sand sheet
deposited from a high energy marine event which was laid down in a coastal marsh near
Crescent City.
The objectives of the current study were to describe the stratigraphy of South Crescent
Marsh and to identify the candidate processes responsible for anomalous sand sheets in this
coastal freshwater marsh. Understanding the depositional mechanisms for the emplacement of
anomalous sands in coastal marshes will aid in the interpretation of marsh stratigraphy.
Setting
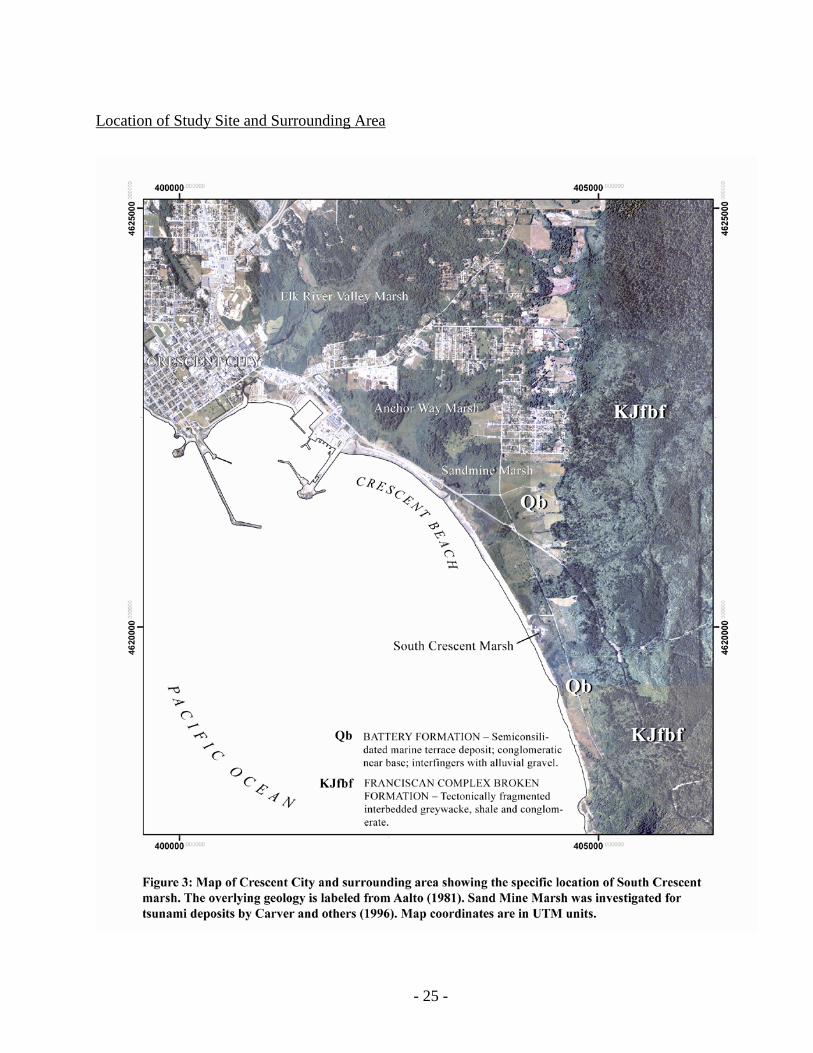
Research was conducted within the Redwood National Park at South Crescent Marsh
located approximately five kilometers south of Crescent City along Crescent Beach (Figure 3).
The study area is located on Quaternary Battery Formation (Qb) deposits directly west of the
Cretaceous-Jurassic Franciscan broken formation (KJfbf) (Aalto, 1981; Figure 3). A small
intermittent stream feeds into the eastern side of the marsh, underneath Bluff Road which is 3.8
meters above MHHW (mean higher high water is an average of higher high water height
observations over a period of 19 years for tidal datums), from approximately one kilometer
landward with its headwaters in the Franciscan Complex. An outlet to the ocean on the north-
west side of the marsh drains freshwater out onto Crescent Beach. A sandy beach berm 3.3
meters above MHHW separates the South Crescent Marsh from the ocean. The beach berm is
periodically breached by large storm events or times of higher discharge within the marsh,
exposing the marsh to sand deposition by high energy marine conditions (Figure 4).
SAND DEPOISTION MECHANISMS IN HOLOCENE MARSH STRATIGRAPHY FROM A TSUNAMI PRONE LOCALITY, CRESCENT CITY, CALIFORNIA, SOUTHERN CASCADIAN MARGIN
- 4 -
METHODS
Selection of Study Site
South Crescent Marsh (Figure 5) is susceptible to sand deposition from near-field
tsunamis generated from the CSZ, far-field tsunamis generated within the Pacific Rim, and storm
wave wash-over caused by extreme climatic conditions. It represents a semi-protected wetland
that has a high potential for preserving episodes of sand deposition related to high energy events.
Near-field tsunamis have been detailed in Sand Mine Marsh by Carver et al. (1996) which is
located two kilometers to the north, adjacent to Crescent Beach in a similar setting (Figure 3). In
addition, South Crescent Marsh lies within the zone of inundation by the 1964 tsunami making it
a good candidate for far-field preservation (Magoon, 1966). Large drift logs, greater than 0.5
meters in diameter, were emplaced by the 1964 tsunami and spatially coincide with Magoon’s
tsunami debris line (Magoon, 1966). The low elevation (approximately at the MHHW line) and
close proximity to the ocean make South Crescent Marsh a susceptible setting for periodic
episodes of wash-over from extreme climatic conditions. Strandlines of small woody debris were
observed overtopping the edge of the beach berm.
Field Study
To investigate the stratigraphy at South Crescent marsh, 18 two centimeter diameter
gouge cores were extracted along a transect perpendicular to Crescent Beach. These one-meter-
long gouge cores were taken at closely spaced intervals to better asses the continuity of the
subsurface stratigraphy and to facilitate in layer correlations across the marsh. All core samples
were digitally photographed in sections and logged at one millimeter intervals. Stratigraphic and
SAND DEPOISTION MECHANISMS IN HOLOCENE MARSH STRATIGRAPHY FROM A TSUNAMI PRONE LOCALITY, CRESCENT CITY, CALIFORNIA, SOUTHERN CASCADIAN MARGIN
- 5 -
sedimentologic evidence from the gouge cores were inspected by visual and tactile methods
(Table 1) and then recorded on field sheets that detailed sediment lithology, lithologic modifiers,
such as the presence of rip-up clasts or detritus, and the type of contact between each layer.
Sediment colors were interpreted in the field. The field sheets were then digitized later using
Adobe Illustrator (Appendix A). Core positions were recorded with a Garmin GPSmap 60Cx
handheld GPS device. With WAAS/EGNOS enabled, this device allowed for accuracy within
2.13 to 3.57 meters. All core locations are recorded in decimal degrees using NAD83 as the map
datum.
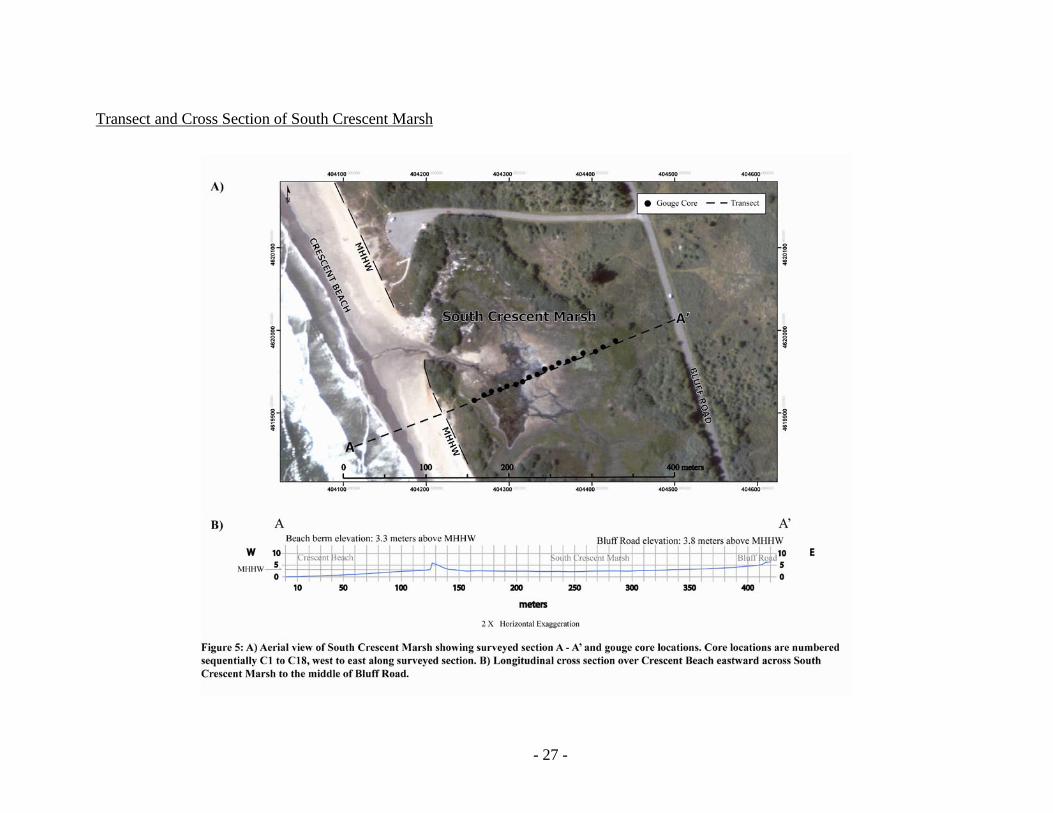
Using standard surveying equipment, a beach profile was created parallel to the gouge
core transect in order to connect positions of the gouge cores relative the beach topography
(Figure 5). This profile bisects the beach, adjacent beach berm, and marsh area starting from the
western most point and moving eastward perpendicular to the coastline. The MHHW line is
interpreted to be at the same elevation as the break-in-slope of the sandy beach berm which
corresponds to 2.6 meters above the survey’s starting point. At the Crescent City tidal station,
ID# 9419750, the diurnal range (difference in height between MHHW and MLLW) is 2.09
meters (NOAA-COOPS, 2009). For consistency, all elevation measurements use the MHHW
tidal datum which is set to 0 meters in this report.
SAND DEPOISTION MECHANISMS IN HOLOCENE MARSH STRATIGRAPHY FROM A TSUNAMI PRONE LOCALITY, CRESCENT CITY, CALIFORNIA, SOUTHERN CASCADIAN MARGIN
- 6 -
RESULTS
The subsurface stratigraphy was mapped approximately 200 meters east from the western
most edge of the marsh. Coring was restricted to this area due to the impenetrable substrate
outside of the marsh area. Several reconnaissance cores were taken east of Bluff road to confirm
that the furthest extent of marsh deposits lay at the western side of Bluff road. However, the
corer could not penetrate deeper than 15 centimeters. Based on the 15 centimeter deposits and
highly indurated character, it is interpreted that South Crescent Marsh transitions to Quaternary
Battery Formation deposits with increasing landward distance and elevation gain east of the
marsh.
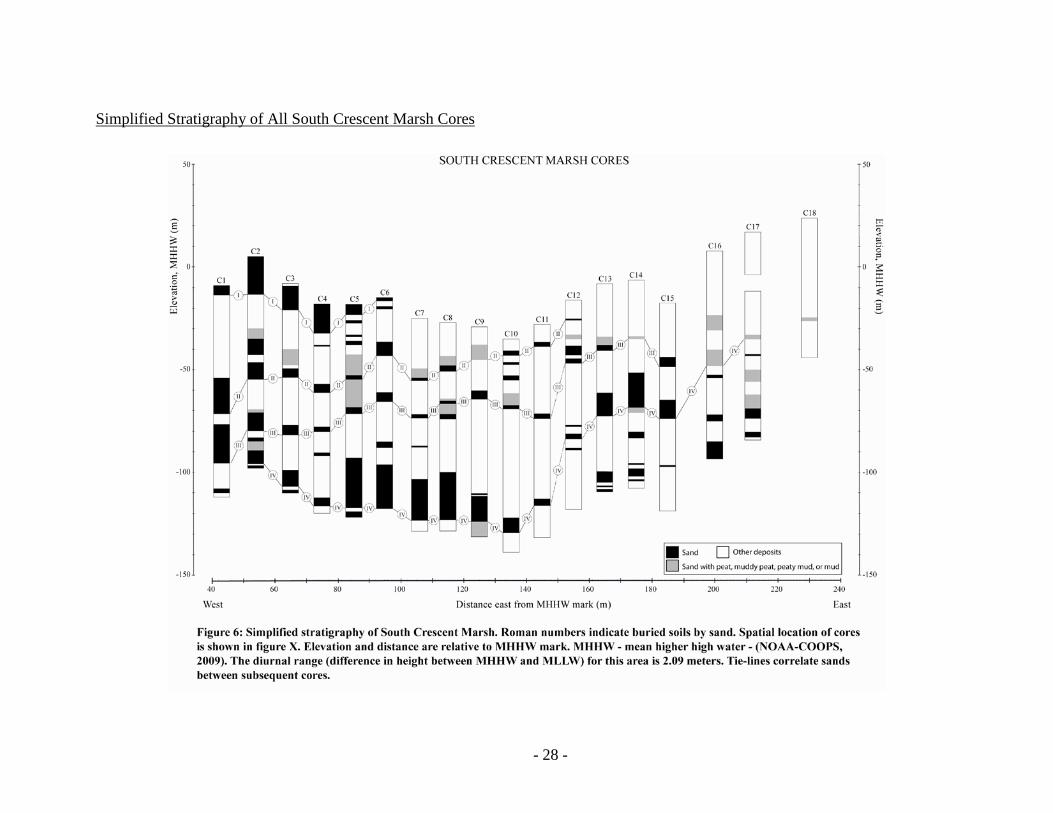
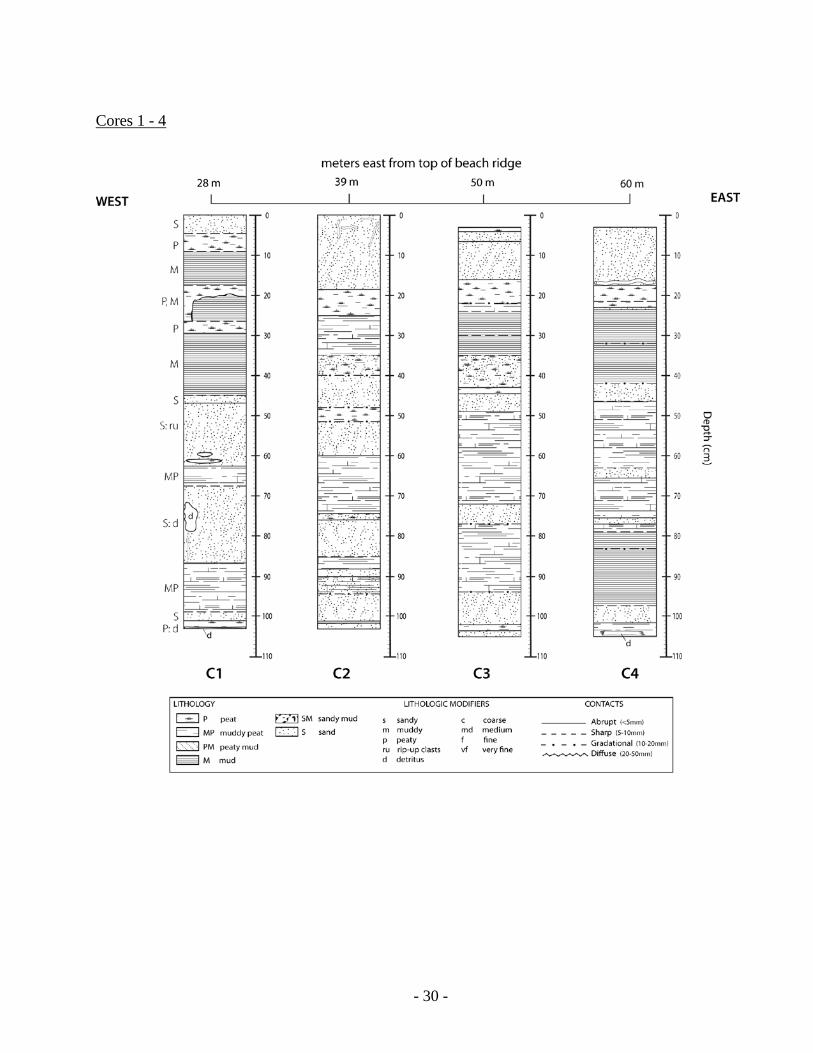
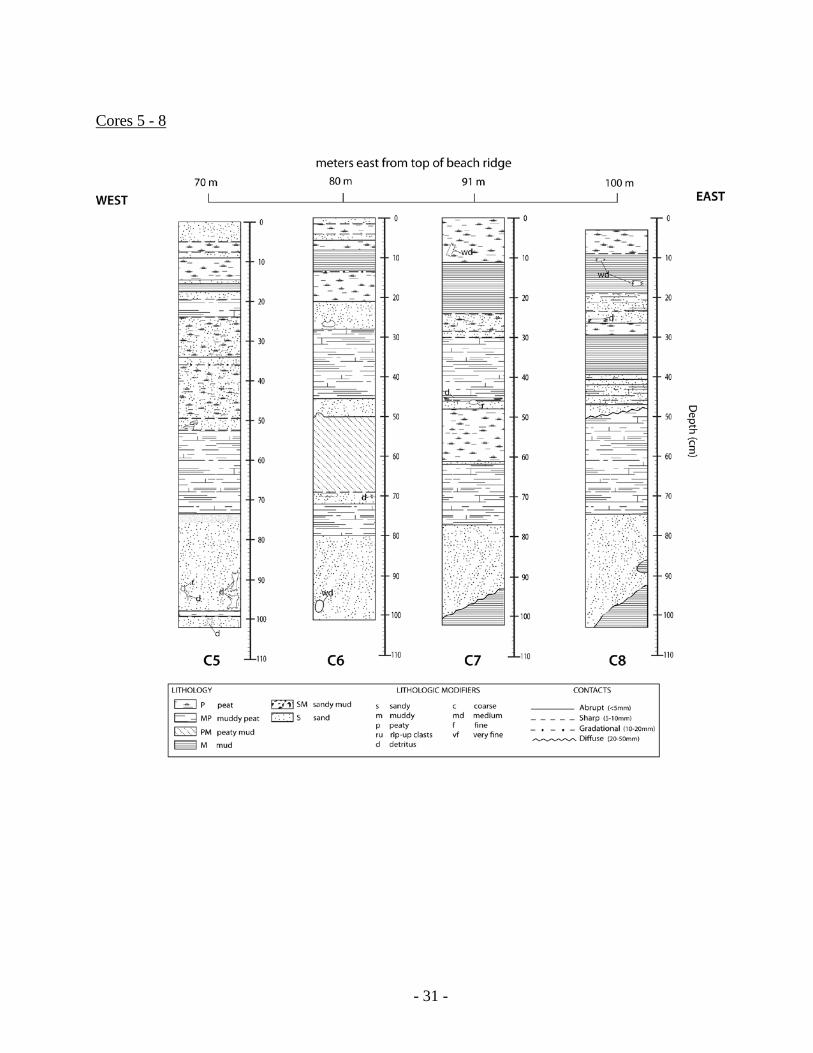
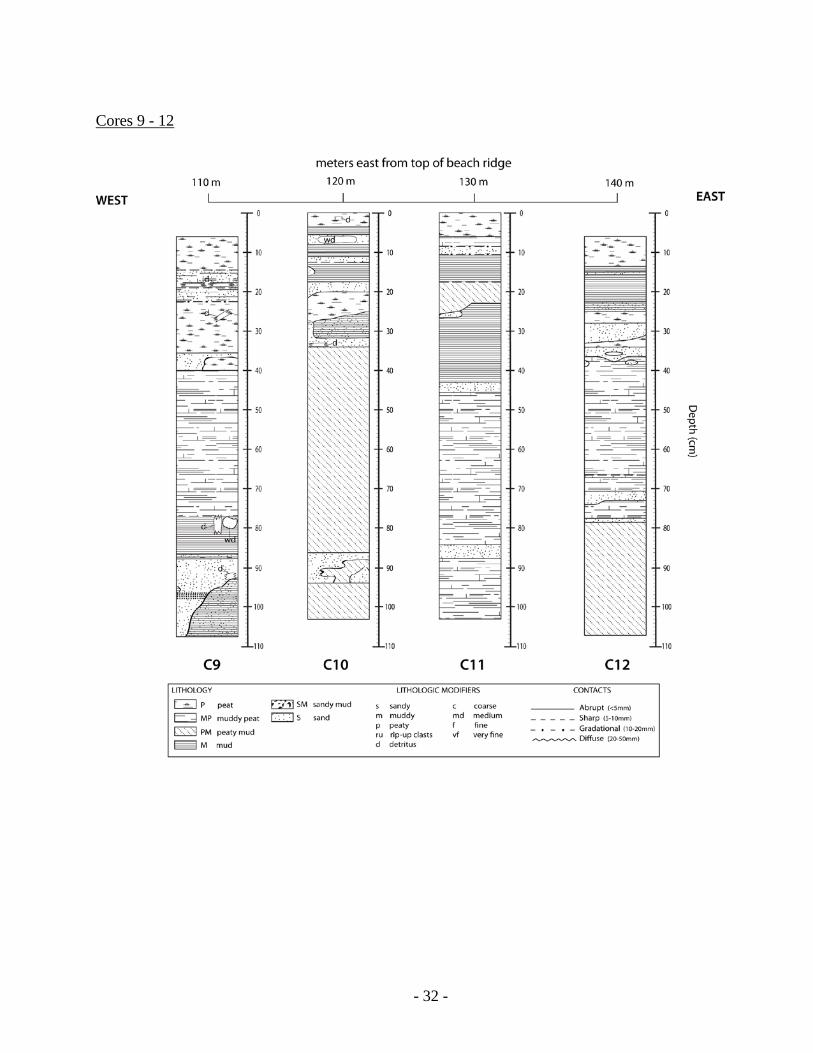
Sand was observed in every core taken from within South Crescent Marsh. Four laterally
continuous sand sheets were mapped out along with several other discontinuous sand layers
intermittently distributed across the marsh (Figure 6). The majority of cores at South Crescent
Marsh bottom out in either mud or muddy-peat deposits. Refer to Appendix A for detailed
illustrations of the marsh cores. Peaty-mud and muddy-peat layers generally get thicker in size as
the distance landward increases. Most peat layers were observed within the top most 60
centimeters of the gouge core samples. In some cores a distinctive light-grey mud layer used as a
marker bed was used to aid in layer correlations.
Stratigraphy
South Crescent marsh stratigraphy is represented by mud, muddy-peat, peaty-mud, peat,
and sand. A generalized description of each stratigraphic unit is included below and in Table 1.
SAND DEPOISTION MECHANISMS IN HOLOCENE MARSH STRATIGRAPHY FROM A TSUNAMI PRONE LOCALITY, CRESCENT CITY, CALIFORNIA, SOUTHERN CASCADIAN MARGIN
- 7 -
Mud: Mud units are composed of 95% fine grained material with less than 5% organics. Mud
deposits range in color from light-grey to grey and brown to dark-brown. The organic material
observed within the mud contains fibrous roots, rootlets, and small black specks colored brown
to dark-brown, and black.
Muddy-peat: Muddy-peat layers contain 50% or more clay content than organics. It can range in
color from brown to dark-brown in color. Overall it appears that there are on average more
muddy-peat layers than peaty-mud deposits.
Peaty-mud: Peaty-mud layers contain 50% or more organic material in a clay matrix. It can vary
from brown to black-brown in color.
Peat: Peat at South Crescent marsh is composed of nearly all organic material. It consists of
matted organic fibers with small roots and rootlets and in some locations contains pieces of
woody debris. In situ roots are preserved where marsh vegetation is growing. Compaction of
peaty material varies but generally peat at or near the marsh surface is loosely packed together
while peat observed deeper in the core was denser. Peat varied in color from dark brown to light
brown hues.
Sand: Sand layers preserved at South Crescent marsh are similar in grain size and lithology to
that of the adjacent Crescent Beach sands. Sand layers at South Crescent marsh are generally
well-sorted and range in size from fine to medium grained sands but may contain larger lithic
fragments such as in core C7 (Appendix A). Sand layer(s) may be massive or contain rip-up
SAND DEPOISTION MECHANISMS IN HOLOCENE MARSH STRATIGRAPHY FROM A TSUNAMI PRONE LOCALITY, CRESCENT CITY, CALIFORNIA, SOUTHERN CASCADIAN MARGIN
- 8 -
clasts of peat and muddy material. Organic material (roots, rootlets, woody debris) may also be
found within sandy layers.
Sand Sheets
From the 18 gouge cores taken, four continuous sand sheets (labeled I-IV; Figure 6) were
observed in the top meter of marsh sediment at South Crescent marsh. Tables 2 and 3 detail the
sand sheet and individual core attributes. Sand deposits contained in the marsh are similar in
texture and mineralogy to the adjacent beach berm and Crescent Beach sands, suggesting that the
sand deposits have a marine origin. The four sand sheets are discussed below in stratigraphic
order from youngest to oldest.
Sand Sheet I: Six of the 18 gouge cores taken at South Crescent marsh detail evidence of a
continuous sand sheet in the uppermost meter of stratigraphy. The sand deposits represent the
most recent deposition of sand at the western edge of the marsh. Sheet I extends 95 meters
eastward of the MHHW line. Sand thickness ranges from 1.5-19 centimeters. A general trend of
thinning landward is observed with the last trace of sand found at core 6 (Figure 6). Sheet I does
not show an increase in elevation with an increase in horizontal distance inland. This may be due
to its relatively short extent inland where deposits are blanketed over the inward sloping marsh
topography. Four abrupt (<5mm) and two sharp (5-10mm) basal contacts of sand deposits are
evident in the cores.
Sand Sheet II: Sheet II is the next continuous sand sheet underlying sheet I. Sheet II is found
within 12 of the 18 cores. This sand sheet extends 155 meters eastward of the MHHW line and is
observed between -25.5 and -71.5 centimeters beneath the marsh surface. Thickness of sand

SAND DEPOISTION MECHANISMS IN HOLOCENE MARSH STRATIGRAPHY FROM A TSUNAMI PRONE LOCALITY, CRESCENT CITY, CALIFORNIA, SOUTHERN CASCADIAN MARGIN
- 9 -
layers range from 0.5 to 15.5 centimeters. Sheet II thins landwards and pinches out at core 12.
Sand deposits rise in elevation as the distance increases eastward. Sand layers have seven abrupt,
two sharp, and three gradational (10-20mm) basal contacts.
Sand Sheet III: Sheet III is found in 15 of the 18 cores and extends 185 meters eastward of the
MHHW line. Sand layers range in size from 1.5 to 19 centimeters thick and are found between -
35 and -95.5 centimeters deep. The majority of basal contacts are abrupt (11), with three sharp
and one gradational contact detailed. Sheet III varies in thickness across the marsh as some
layers thin and thicken.
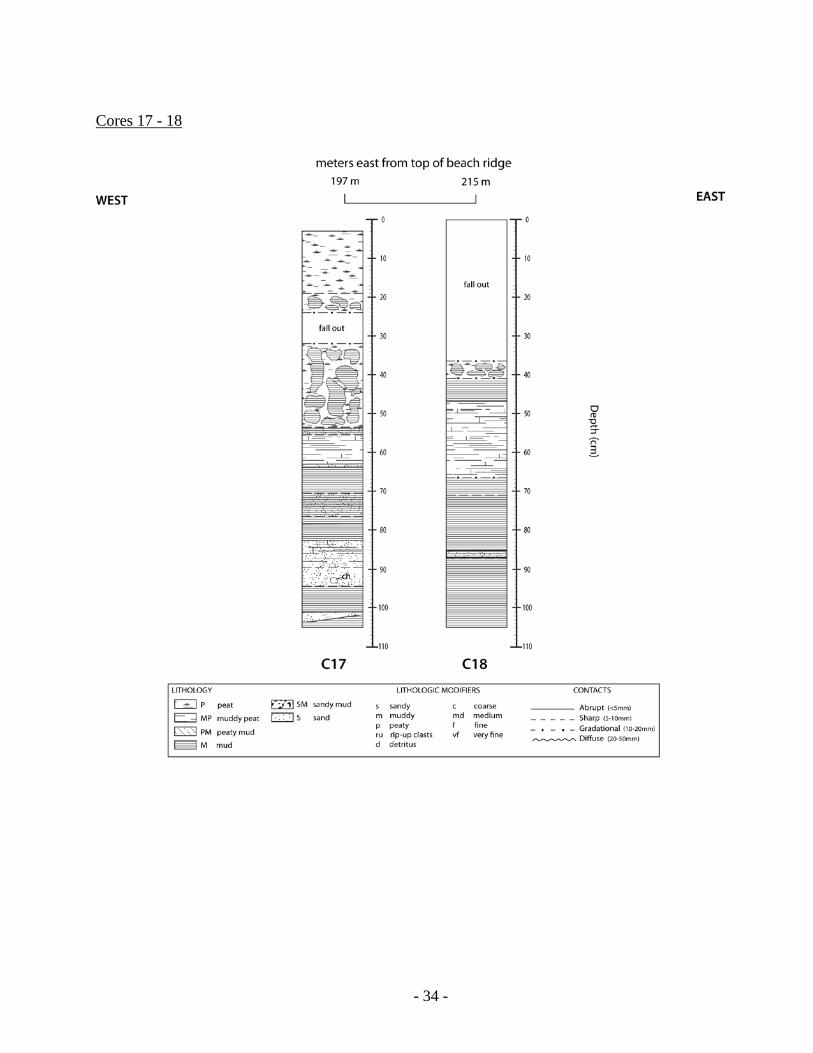
Sand Sheet IV: Sheet IV was captured in 16 of the 18 gouge cores. Sand deposits extend 212
meters eastward of the MHHW line across the marsh with the last sand layer observed at core 17.
Layers of sand ranged in thickness from two to 28.5 centimeters and were found between -35.5
and -129 centimeters below the marsh surface. Sand deposits rise in elevation as the distance
increases landward. Thickness of sheet IV varies between cores with some sheets thinning
between thicker adjacent deposits. 13 abrupt and two sharp basal contacts were detailed. Sheet
IV represents the deepest sand sheet captured by the one meter long gouge corer.
Sheet IV had discernable features which were used to aid in assessing lateral continuity between
cores. These features included a blue-grey appearance; sands that contained organic fragments of
wood, bark, roots, rootlets, and grass; included rip-up clasts of mud; and had larger sands that
were normally graded.

SAND DEPOISTION MECHANISMS IN HOLOCENE MARSH STRATIGRAPHY FROM A TSUNAMI PRONE LOCALITY, CRESCENT CITY, CALIFORNIA, SOUTHERN CASCADIAN MARGIN
- 10 -
In summary, all four sand sheets have similar characteristics, such as texture, mineralogy,
lateral continuity, and display abrupt and sharp basal contacts. However, they differ in other
physical attributes. Only sand sheets II, III, and IV contain evidence of rip-up clasts. Only sand
sheet IV exhibits normally graded sands and is also 9.5 centimeters thicker in size than the
thickest deposits recorded for sand sheets I-III. Sand sheet I does not increase in height as the
distance inland increases while all the other sand sheets have a general trend of gaining elevation
across the marsh.
SAND DEPOISTION MECHANISMS IN HOLOCENE MARSH STRATIGRAPHY FROM A TSUNAMI PRONE LOCALITY, CRESCENT CITY, CALIFORNIA, SOUTHERN CASCADIAN MARGIN
- 11 -
DISCUSSION
The objectives of the current study were to describe the stratigraphy of South Crescent
Marsh and to identify the candidate processes responsible for anomalous sand sheets in this
coastal freshwater marsh. From the 18 gouge cores, four well defined, laterally continuous sand
sheets (labeled I-IV) were mapped within the top meter of marsh sediment at South Crescent
Marsh. It is inferred from these observations that all of the sand sheets were deposited by high
energy marine waters. This limits the depositional mechanisms for the emplacement of these
anomalous sands at this coastal freshwater marsh to storm-wave run-up caused by extreme
climatic conditions and by tsunami inundation from near and far-field sources.
Sand Sheet I
Sand sheet I is interpreted as a potential high energy storm-wave deposit generated by the
wash-over effect created in part by extreme marine water conditions. This sand sheet lies at the
surface of the marsh stratigraphy and is located adjacent to a plume of sand emplaced by a
breach in the marsh beach berm (Figure 4, 5, and 6). However, it cannot be ruled out that this
sand sheet may have been deposited by a tsunami.
Sand Sheets II and III
Based on previous research conducted at Crescent City, there is a high potential for
preservation of a far-field tsunami deposit at South Crescent Marsh. Magoon’s map (1966;
Figure 2) of the 1964 tsunami inundation zone shows the outer edge of inundation extending
over South Crescent Marsh. Furthermore, Carver (1996) recorded the presence of the 1960 and
1964 far-field tsunamis at Sand Mine Marsh which is located 2 kilometers to the north along
SAND DEPOISTION MECHANISMS IN HOLOCENE MARSH STRATIGRAPHY FROM A TSUNAMI PRONE LOCALITY, CRESCENT CITY, CALIFORNIA, SOUTHERN CASCADIAN MARGIN
- 12 -
Crescent Beach in a similar setting (Figure 3). One of the four sand sheets detailed at South
Crescent Marsh may represent the 1964 far-field tsunami. The best candidate would most likely
be sand sheet II or III. Sand sheets II and III are preserved relatively shallow in the marsh
stratigraphy suggesting recent deposition. They extend inland close to the edge of inundation
mapped by Magoon (1966). Sand sheets II and III contain evidence of rip-up-clasts and have
numerous abrupt basal contacts. These physical attributes provide the best evidence to suggest
that they represent the 1964 tsunami. However, it is difficult to say with certainly by relying
solely on physical attributes of the sand layers.
Sand Sheet IV
Sand sheet IV represents the best candidate for a near-field tsunami. It exhibits a
landward thinning of sand layers, contains normally graded sand layers, has abrupt basal
contacts, and harbors evidence of rip-up-clasts. Additionally, near-field tsunamis have been
documented at Sand Mine Marsh (Carver et al., 1996) and at Lagoon Creek to the south
(Abramson, 1998; Garrison-Laney, 1998). This is the thickest of all sand sheets captured by the
one meter long gouge corer.
Distinguishing between candidate processes for sand deposition in coastal marsh
stratigraphy has its difficulties. For example, tsunami and storm deposits have the same spatial
characteristics; they both thin in size and texturally get finer as the distance landward increases
(Nelson et al., 1996b). In addition, sand layers recorded in marsh stratigraphy do not contain
unique physical characteristics that could be used to clearly distinguish between depositional
mechanisms, such as tsunamis versus storm waves (Witter et al., 1999). This makes it nearly
impossible to identify a true depositional mechanism for the sand sheets based on physical
SAND DEPOISTION MECHANISMS IN HOLOCENE MARSH STRATIGRAPHY FROM A TSUNAMI PRONE LOCALITY, CRESCENT CITY, CALIFORNIA, SOUTHERN CASCADIAN MARGIN
- 13 -
attributes alone. If sand sheet IV was deposited by a near-field tsunami, the only identified
source would be the 1700 AD earthquake (Satake et al., 1996).
SAND DEPOISTION MECHANISMS IN HOLOCENE MARSH STRATIGRAPHY FROM A TSUNAMI PRONE LOCALITY, CRESCENT CITY, CALIFORNIA, SOUTHERN CASCADIAN MARGIN
- 14 -
CONCLUSION
The current study documented four laterally continuous sand sheets within the
stratigraphy of South Crescent Marsh. The marsh is a prime wash-over setting located at MHHW
behind a relatively small berm, therefore elevated ocean levels from both tsunamis and storms
have an equal chance of inundating this area. The candidate mechanisms responsible for the
deposition of these four sand sheets are (1) near-field tsunamis generated from the CSZ, (2) far-
field tsunamis generated from within the Pacific Rim, and (3) storm-waves caused by extreme
climatic conditions. Findings from this study cannot attribute with certainty which process
caused the deposition of each of the sand sheets. However, based on depth, lateral extent and
thickness of the sand sheets, and on comparison of the sand sheets with sheets at Sand Mine
Marsh to the north and Lagoon Creek to the south, I suggest that sand sheet I was storm
generated and sand sheet IV may have been deposited by the 1700 AD CSZ earthquake. Sand
sheet II and III could have been deposited either by storms or by the 1960 and 1964 far-field
tsunamis.
- 15 -
REFERENCES
Aalto, K.R., 1981. Geology of the Coast Ranges in the Klamath and part of the Ship Mountain
quadrangles, Del Norte County, California. California Division of Mines and Geology,
mapped at 1:62,500.
Abramson, H.A., 1998. Evidence for tsunamis and earthquakes during the last 3500 years from
Lagoon Creek, a coastal freshwater marsh, Northern California. [M.S. thesis]: Arcata,
Humboldt State University, 76 p.
Atwater, B.F., Nelson, A.R., Clague, J.L., Carver, G.A., Yamagouchi, D.K., Bobrowsky, P.T., J.
Bourgeois, Darienzo, M.E., Grant, W.C.,Hemphill-Haley, E., Kelsey, H.M., Jacoby,
G.C., Nishenko, S.P., Palmer, S.P., Peterson, C.D., Reinhart, M.A., 1995. Summary of
coastal geologic evidence for past great earthquakes at the Cascadia Subduction Zone.
Earthquake Spectra, 11.1, p.1-18.
Carver, G.A., Peterson, C.D., Garrison, C.E., Doehler, R., 1996. Paleotsunami evidence of
subduction earthquakes from northern California. Geological Society of America
Abstracts with Programs, 28, A55.
Clague, J.J., Bobrowsky, P.T., 1994. Evidence for a large earthquake and tsunami 100-400 years
ago on western Vancouver Island, British Columbia. Quaternary Research, v. 41, p. 176-
184.
Clague, J.J., Bobrowski, P.T., Hutchinson, I., 2000. A review of Geological records of large
tsunamis at Vancouver Island, British Columbia, and implications for hazard. Quaternary
Science Reviews, v.19, p. 849-863.
- 16 -
Dengler, L., Magoon, O.T., 2006. Reassessing Crescent City, California’s tsunami risk, in
Proceedings 8th National Conference on Earthquake Engineering, Earthquake
Engineering Research Institute, paper R1451 on cdrom.
Garrison-Laney, C., 1998: Diatom evidence for tsunami inundation from Lagoon Creek, a
coastal freshwater pond, Del Norte County, California. [M.S. thesis]: Arcata, Humboldt
State University, 97 p.
Kelsey, H.M., Nelson, A.R., Hemphill-Haley, E., Witter, R.C., 2005. Tsunami history of an
Oregon coastal lake reveals a 4600 year record of great earthquakes on the Cascadia
subduction zone. Geological Society of America, v. 117, no. 7/8; p. 1009-1032.
Kelsey, H.M., Witter, R.C., Hemphill-Haley, E., 1998. Response of a small Oregon estuary to
coseismic subsidence and postseismic uplift in the past 300 years. Geology, 26, 231-234.
Magoon, O.T., 1966. Structural Damage by Tsunamis. Proceedings, American Society Civil
Engineers, Specialty Conference on Coastal Engineering. Santa Barbara, California, Oct.
1965, 35-68.
Nelson, A.R., Peronius, S.F., 1996. Great earthquake potential in Oregon and Washington – an
overview of recent coastal geologic studies and their bearing on segmentation of
Holocene ruptures, central Cascadia Subduction zone: in Assessing Earthquake Hazards
and Reducing Risk in the Pacific Northwest, Rogers, A.M., Walsh, T.J., Kockelman,
W.J., Priest, G.R., eds., USGS Professional Paper 1560, p. 91-114.
Nelson, A.R., Shennan, I., Long, A.L., 1996b. Identifying coseismic subsidence in tidal wetland
stratigraphic sequences at the Cascadia subduction zone of western North America.
Journal of Geophysical Research, v. 101, n. B3, p. 6115-6135.
- 17 -
NGDC, 2009. National Geophysical Data Center, Worldwide Tsunami Database, Natural
hazards data at: http://www.ngdc.noaa.gov/seg/hazard/. [email protected]. Date
accessed: February 9, 2009 10:19:02 PST.
NOAA-COOPS, 2009. Crescent City, Coastal Tidal Station Datums at: http://www.co-
ops.nos.noaa.gov/geo.shtml?location=8720855. Date accessed: February 7, 2009, 5:30:28
PST.
Patton, J.R., 2004. Late Holocene coseismic subsidence and coincident tsunamis, southern
Cascadia subduction zone, Hookton Slough, WIGI (Humboldt Bay), California. [M.S.
thesis]: Arcata, Humboldt State University, 76 p.
Peters, B., Jaffe, B.E., Gelfenbaum, G., Peterson, C.D., 2003. Cascadia tsunami deposit database.
U.S. Geological Survey, Open-File Report 0313, 19 pp.
Peters, R., Jaffe, B.E., Peterson, C.D., Gelfenbaum, G., Kelsey, H.M., 2001. An overview of
tsunami deposits along the Cascadia margin. International Tsunami Symposium, session
3, number 3-3, p. 479-490.
PG&E, 2002. Pacific Gas and Electric Company, Seismic Hazard Assessment for the Humboldt
Bay ISFSI Project. Technical Report TR-HBIP-2002-01, Revision 0, December 27, 2002.
Satake, K., Shimazaki, K., Tsuji, Y., Ueda, K., 1996. Time and size of a giant earthquake in
Cascadia inferred from Japanese tsunami records of January 1700. Nature, vol. 379,
January 18, 1996, pp. 246-248.
Witter, R.C., Kelsey, H.M., Hemphill-Haley, E., 1999. Pacific storms, El Nino and tsunamis:
competing mechanisms for sand deposition in a coastal marsh, Euchre Creek, Oregon.
Journal of Coastal Research, 17(3), pp. 563-583.
- 18 -
LIST OF TABLES
- 19 -
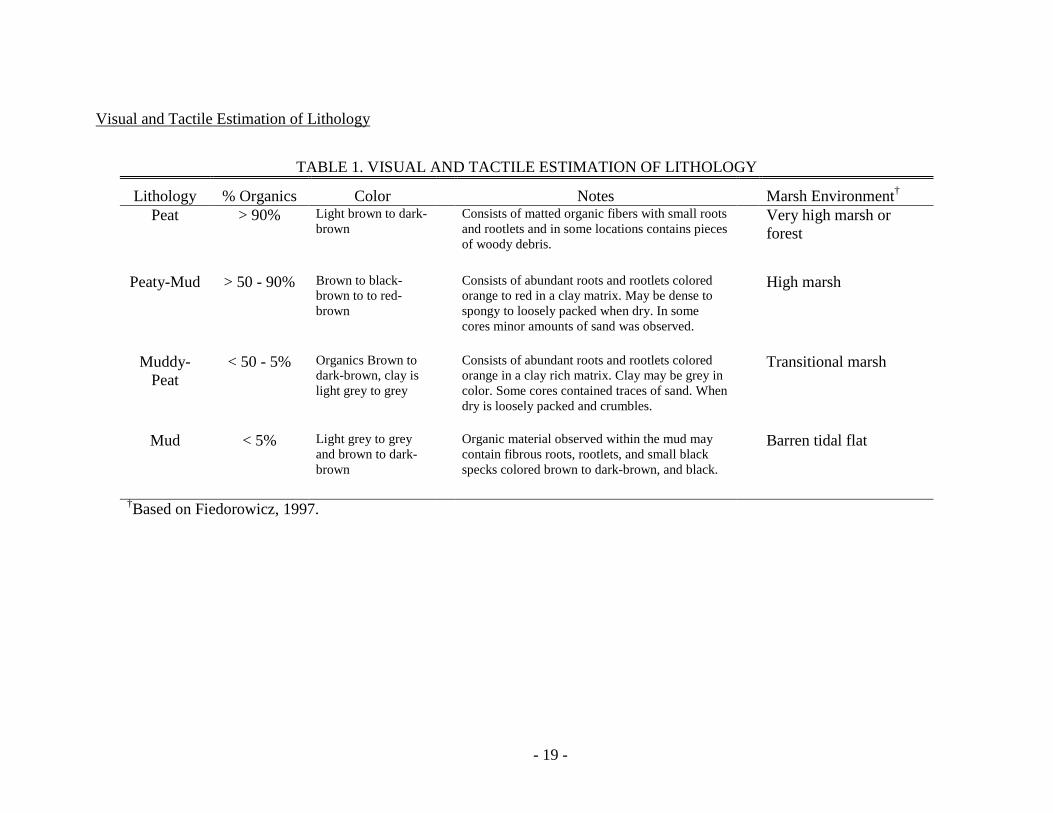
Visual and Tactile Estimation of Lithology
TABLE 1. VISUAL AND TACTILE ESTIMATION OF LITHOLOGY
Lithology % Organics Color Notes Marsh Environment† Peat > 90% Light brown to dark-
brown Consists of matted organic fibers with small roots
and rootlets and in some locations contains pieces of woody debris.
Very high marsh or forest
Peaty-Mud > 50 - 90% Brown to black-brown to to red-brown
Consists of abundant roots and rootlets colored orange to red in a clay matrix. May be dense to spongy to loosely packed when dry. In some cores minor amounts of sand was observed.
High marsh
Muddy-Peat
< 50 - 5% Organics Brown to dark-brown, clay is light grey to grey
Consists of abundant roots and rootlets colored orange in a clay rich matrix. Clay may be grey in color. Some cores contained traces of sand. When dry is loosely packed and crumbles.
Transitional marsh
Mud < 5% Light grey to grey and brown to dark-brown
Organic material observed within the mud may contain fibrous roots, rootlets, and small black specks colored brown to dark-brown, and black.
Barren tidal flat
†Based on Fiedorowicz, 1997.

- 20 -
Sand Sheet Attributes from South Crescent Marsh
TABLE 2. SAND SHEET ATTRIBUTES FROM SOUTH CRESCENT MARSH
Sand Sheet Number of Cores†
Thickness of Sand (cm)‡
Depth in Core (cm)¥ Number of Basal Contacts¤ Eastward Extent of Sand (m)§
Abrupt Sharp Gradational From MHHW From Beach Berm
I 6 1.5-19 -14.5 to -32.5 4 2 - 95 80 II 12 0.5-15.5 -71.5 to -25.5 7 2 3 155 140 III 15 1.5-19 -95.5 to -35 11 3 1 185 170 IV 16 2-28.5 -129 to -35.5 13 2 - 212 197
Note: Total of 18 gouge cores. †Number of cores in which disturbance event was identified. ‡Range in sand thickness among cores, including sand mixed with peat, muddy peat, peaty mud, or mud. ¥Range in depth of disturbance event measured from basal contact and arranged lowest to highest MHHW elevation. ¤Quantity of cores that have abrupt (<5mm), sharp (5-10mm), gradational (10-20mm) basal contacts. §Eastward extent of sand relative to MHHW mark and to the top of South Crescent Marsh’s adjacent beach berm.
- 21 -
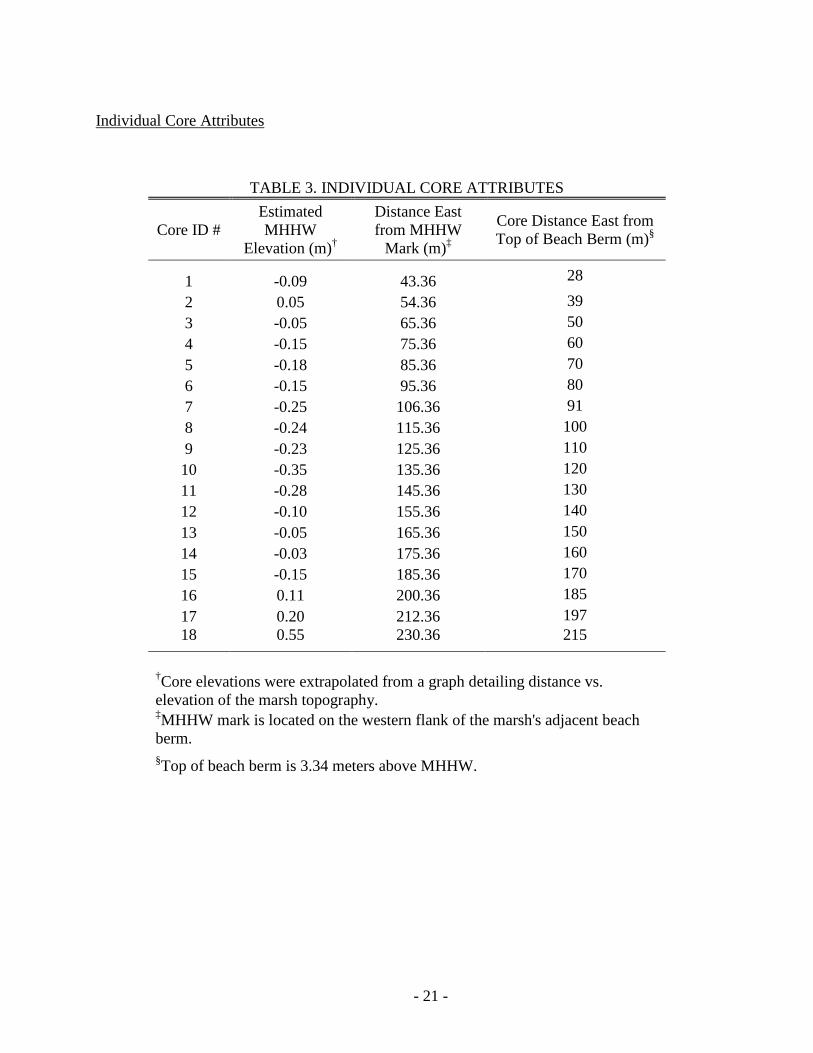
Individual Core Attributes
TABLE 3. INDIVIDUAL CORE ATTRIBUTES
Core ID # Estimated MHHW
Elevation (m)†
Distance East from MHHW
Mark (m)‡
Core Distance East from Top of Beach Berm (m)§
1 -0.09 43.36 28
2 0.05 54.36 39 3 -0.05 65.36 50 4 -0.15 75.36 60 5 -0.18 85.36 70 6 -0.15 95.36 80 7 -0.25 106.36 91 8 -0.24 115.36 100 9 -0.23 125.36 110 10 -0.35 135.36 120 11 -0.28 145.36 130 12 -0.10 155.36 140 13 -0.05 165.36 150 14 -0.03 175.36 160 15 -0.15 185.36 170 16 0.11 200.36 185 17 0.20 212.36 197 18 0.55 230.36 215
†Core elevations were extrapolated from a graph detailing distance vs. elevation of the marsh topography. ‡MHHW mark is located on the western flank of the marsh's adjacent beach berm. §Top of beach berm is 3.34 meters above MHHW.

- 22 -
LIST OF FIGURES
- 23 -
Tectonic Overview and Northern California Tsunami Sites
- 24 -
Magoon’s 1964 Far-Field Tsunami Inundation Map
- 25 -
Location of Study Site and Surrounding Area
- 26 -
South Crescent Marsh Oblique Aerial Photos
- 27 -
Transect and Cross Section of South Crescent Marsh
- 28 -
Simplified Stratigraphy of All South Crescent Marsh Cores
- 29 -
APPENDIX A
- 30 -
Cores 1 - 4
- 31 -
Cores 5 - 8
- 32 -
Cores 9 - 12

- 33 -
Cores 13 - 16
- 34 -
Cores 17 - 18

- 35 -
APPENDIX B
- 36 -
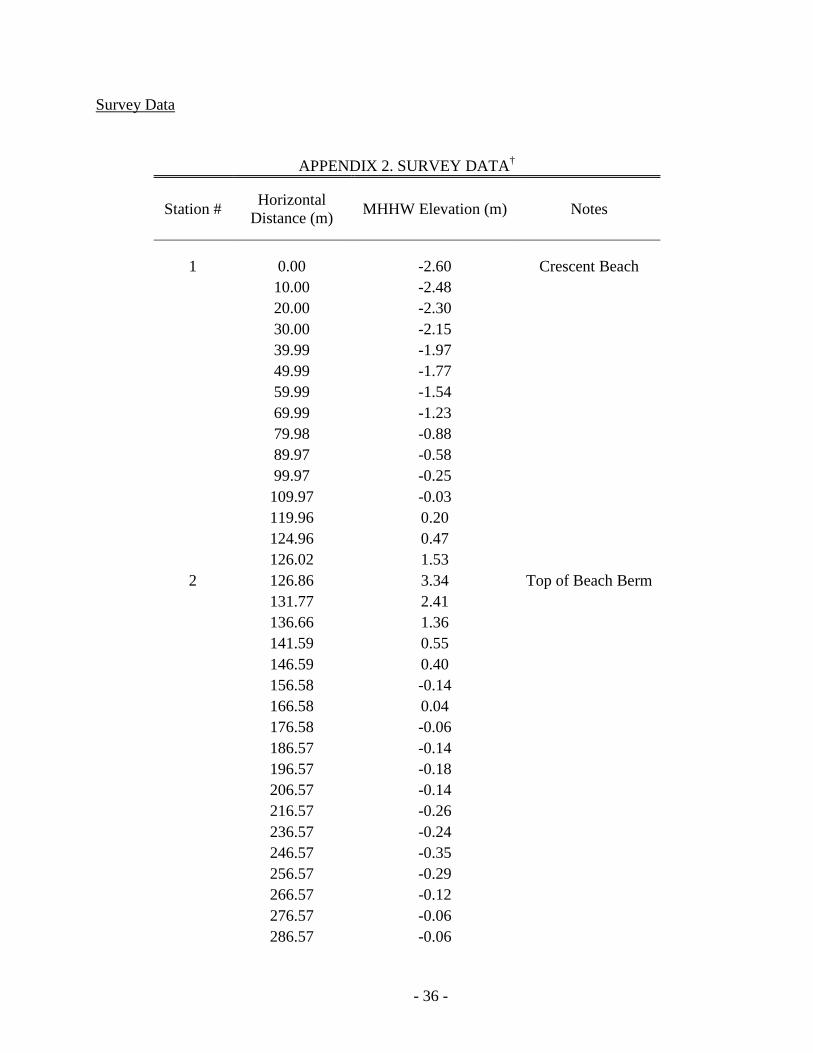
Survey Data
APPENDIX 2. SURVEY DATA†
Station # Horizontal Distance (m) MHHW Elevation (m) Notes
1 0.00 -2.60 Crescent Beach 10.00 -2.48 20.00 -2.30 30.00 -2.15 39.99 -1.97 49.99 -1.77 59.99 -1.54 69.99 -1.23 79.98 -0.88 89.97 -0.58 99.97 -0.25 109.97 -0.03 119.96 0.20 124.96 0.47 126.02 1.53 2 126.86 3.34 Top of Beach Berm 131.77 2.41 136.66 1.36 141.59 0.55 146.59 0.40 156.58 -0.14 166.58 0.04 176.58 -0.06 186.57 -0.14 196.57 -0.18 206.57 -0.14 216.57 -0.26 236.57 -0.24 246.57 -0.35 256.57 -0.29 266.57 -0.12 276.57 -0.06 286.57 -0.06
- 37 -
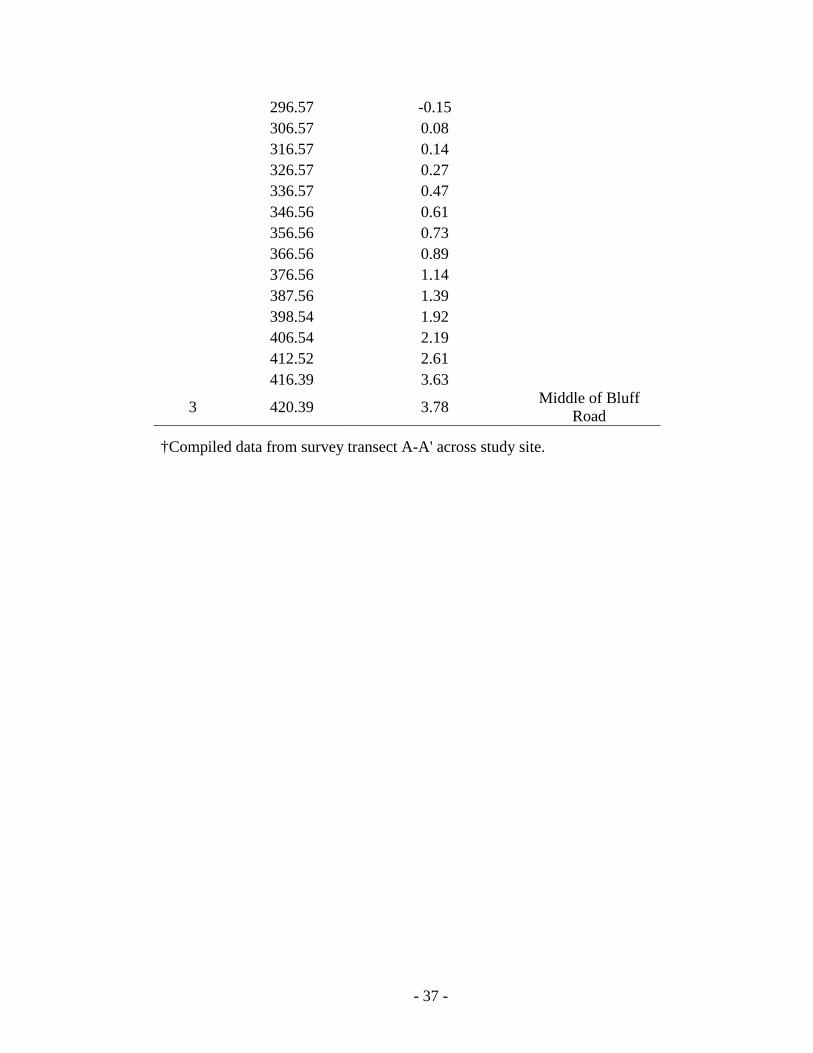
296.57 -0.15 306.57 0.08 316.57 0.14 326.57 0.27 336.57 0.47 346.56 0.61 356.56 0.73 366.56 0.89 376.56 1.14 387.56 1.39 398.54 1.92 406.54 2.19 412.52 2.61 416.39 3.63
3 420.39 3.78 Middle of Bluff Road
†Compiled data from survey transect A-A' across study site.
![NELDA TEST SITE REPORT Kostanay Site … · erosion resulted in wind-blown sand deposition in the middle of Turgai ... wild and anthropogenic forest fire. ... [Goodle Earht] data)](https://img.pdfslide.tips/doc/110x75/5b8302087f8b9a64618c3240/nelda-test-site-report-kostanay-site-erosion-resulted-in-wind-blown-sand-deposition.jpg)