Embed Size (px)
Citation preview

PR
IFY
SG
OL
BA
NG
OR
/ B
AN
GO
R U
NIV
ER
SIT
Y
Grain size selection in seagrass beds
Conley, D.; Austin, Martin; Davidson, I.; Buscombe, Daniel; Masselink, G.
Published: 17/06/2017
Peer reviewed version
Cyswllt i'r cyhoeddiad / Link to publication
Dyfyniad o'r fersiwn a gyhoeddwyd / Citation for published version (APA):Conley, D., Austin, M., Davidson, I., Buscombe, D., & Masselink, G. (2017). Grain size selectionin seagrass beds. Paper presented at Coastal Dynamics 2017, Helsingør, Denmark.
Hawliau Cyffredinol / General rightsCopyright and moral rights for the publications made accessible in the public portal are retained by the authors and/orother copyright owners and it is a condition of accessing publications that users recognise and abide by the legalrequirements associated with these rights.
• Users may download and print one copy of any publication from the public portal for the purpose of privatestudy or research. • You may not further distribute the material or use it for any profit-making activity or commercial gain • You may freely distribute the URL identifying the publication in the public portal ?
Take down policyIf you believe that this document breaches copyright please contact us providing details, and we will remove access tothe work immediately and investigate your claim.
18. Jun. 2020

Coastal Dynamics 2017 Paper No. 200
GRAIN SIZE SELECTION IN SEAGRASS BEDS
Daniel C. Conley1, Martin Austin2, Ian Davidson3, Daniel Buscombe4, and Gerd Masselink1
Abstract The role of seagrass in sediment dynamics is studied through observations and model simulations focused on the Zostera marina seagrass meadows in the Isles of Scilly UK. Observations are presented which indicate a clear selection for fine grained sediments inside seagrass meadows and coarser sediments surrounding them. A recent modification of the 1DV General Ocean Turbulence Model (GOTM) known as mGOTM has been performed and is presented including a validated methodology for simulating the suspension of a distribution of sediment sizes. Using hind cast wave data from the study site, mGOTM simulations are used to demonstrate how the interactions between seagrass and flow can lead to both a reduction of bed stress but an enhancement of turbulent kinetic energy throughout the flow and how this contributes to the grain size selection observed in this location. Key words: hydrodynamics, sediment transport, seagrass, sediment grading, ecomorphology, numerical modeling,
advection-diffusion 1. Introduction Seagrass meadows are internationally recognized as key biogenic habitats and are often classified as areas of high conservation value. In addition, modern ecosystem engineering concepts consider seagrass beds as autogenic engineering systems (Bouma et al., 2005). The standard paradigm considers seagrass beds which remove energy from incident flow thereby reducing flow speeds and damping waves (Koch, 1999) which leads to a region of sediment accumulation. Previous investigators have sought to determine how characteristics of seagrass patches such as, the percent of water depth coverage, frond length, and flow magnitude affect this phenomenon but in general, the paradigm holds that all sediments are trapped by seagrass beds. Practically all existing process based studies of sediment dynamics among seagrasses are either based on mono-grain sized sediments or focus on total sediment load as the variable of interest. Recent observational studies have however begun to examine that concept by visiting the nature of grain size distributions within seagrass beds even though the results are somewhat contradictory. Bos et al. (2007) observed that planted seagrass beds engendered sediment accumulation and that the finer sediment fraction was favored. In a comparison of vegetated vs. unvegetated sites, Koch (1999) observed generally lower rates of suspended load in vegetated sites but that certain conditions could lead to enhanced loads in seagrass sites. In both laboratory and field measurements, Wilkie (2012) observed enhanced retention of coarse grain sediments in patches of Zostera noltii. Ganthy et al. (2013) suggested that the coarse sediment fraction was inversely related to canopy density through a process of selective suspension.
Clarifying grain size selection in seagrass meadows is not merely academic curiosity but has implications for understanding seagrass ecosystem services such as nutrient dispersion and carbon capture. Furthermore, Valle et al. (2011) have identified bed grain size characteristics as the primary determinant for sea grass colonization. In order to mitigate the estimated annual seagrass reduction rate of 7% (Waycott et al., 2009), seagrass restoration efforts are becoming an increasingly common strategy and in the UK alone, the Biodiversity Action Plan (Tranche 2) for seagrasses specifically proposes the initial restoration of 1000 ha. Nonetheless, habitat restoration until present has had limited success with global project survival rates estimated at 37% (Van Katwijk et al., 2016) and to date, no successful programs in the UK. It has been 1School of Biological & Marine Sciences, University of Plymouth, UK. [email protected] 2School of Ocean Sciences, Bangor University. Menai Bridge, UK. [email protected] 3ABPmer, Southampton, UK. [email protected] 4School of Earth Sciences & Env. Sustainability, Northern Arizona University, USA. [email protected]

Coastal Dynamics 2017 Paper No. 200
suggested that one of the major factors contributing to this low success rate in seagrass restoration relates to poor models of habitat compatibility to which enhanced understanding of grain size selection in natural seagrass beds can make a significant contribution.
In this submission, in order to begin to understand grain size selection by seagrass, bed size distributions in and around a vibrant seagrass meadow exposed to relatively energetic conditions are examined. Wave simulations are performed to provide energetic forcing conditions within the meadow and a 1DV model which simulates flows and the dynamics of distributions of sediment in seagrass beds is used to examine grain size dependant transport divergence at the boundaries of such beds. The modeling results will be examined to determine whether they are consistent with the observed grain size distributions as well as to seek to understand what characteristics of the flow lead to the observed behavior. Section 2 of the submission will introduce the study site, describe the 1DV model and the wave simulations performed, section 3 will present and analyze the model results, section 4 will discuss the agreement between observations and simulations and section 5 will provide the final conclusions. 2. Methods
Figure 1. Site map (a.) of the study site (c.) in the Isles of Scilly(b) UK. IOS map (b) demonstrates potential for wave exposure from the southeast and southwest. Location of sediment samples are shown on the site map (c) and
simulations are performed for typical location in Great Ganinick meadow. 2.1. Study site The study is focused on the seagrass meadows in the Isles of Scilly (IOS) west of Cornwall in the UK (Figure 1). Composed predominantly of Zostera marina or eelgrass, these meadows are largely around the isles of St. Marten’s and St. Mary’s. While sediment samples were collected around Par Beach off of St. Marten’s and in the larger Great Ganinick meadow to the south, the simulations are loosely designed to represent the conditions found at the latter site. Sediments composed of medium to coarse grains, are present in an environment with a 5 m spring tide range and tidal currents on the order of 0.4 m/s. While the Great Ganinick meadow extends for an area of approximately 15 ha (Figure 1), the meadow itself is composed of alternating patches of vegetated and unvegetated bottom with spatial scales of order 10m. Depths in the study area are from 0-1 m at MLLW. 2.1.1. Grain size measurements Surficial sediment samples were collected (Figure 1c,) at both vegetated and unvegetated patches within the Par Beach and Great Ganinick seagrass meadows on 8-9 July 2015. Additional samples were collected at the most prominent sand bank just to the west of the meadows as a potential sediment source location for this region. A final set of beach sand samples were collected along Par Beach which is a mildly crescentic beach for which the eastern end of the beach is shadowed by the local seagrass meadow. The samples were washed to decant any buoyant material and then analyzed in triplicate using a 3m settling column.
a.) b.) c.)
Coastal Dynamics 2017 Paper No. 200
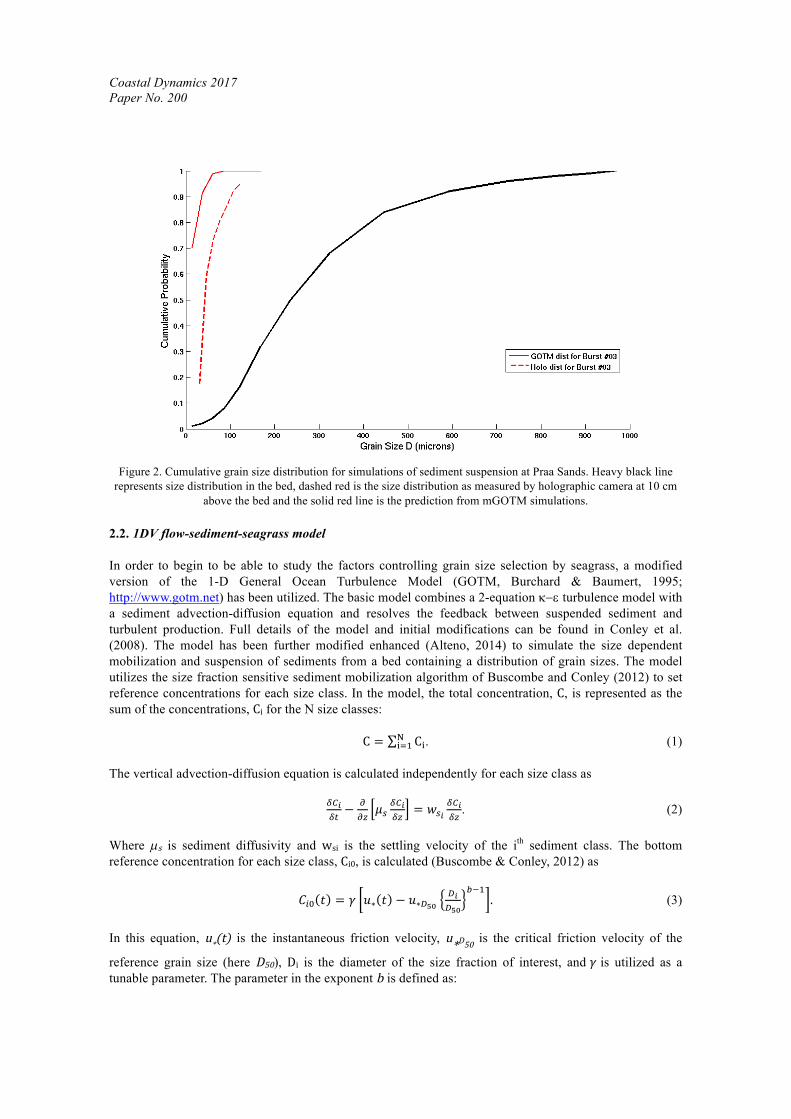
Figure 2. Cumulative grain size distribution for simulations of sediment suspension at Praa Sands. Heavy black line
represents size distribution in the bed, dashed red is the size distribution as measured by holographic camera at 10 cm above the bed and the solid red line is the prediction from mGOTM simulations.
2.2. 1DV flow-sediment-seagrass model In order to begin to be able to study the factors controlling grain size selection by seagrass, a modified version of the 1-D General Ocean Turbulence Model (GOTM, Burchard & Baumert, 1995; http://www.gotm.net) has been utilized. The basic model combines a 2-equation k-e turbulence model with a sediment advection-diffusion equation and resolves the feedback between suspended sediment and turbulent production. Full details of the model and initial modifications can be found in Conley et al. (2008). The model has been further modified enhanced (Alteno, 2014) to simulate the size dependent mobilization and suspension of sediments from a bed containing a distribution of grain sizes. The model utilizes the size fraction sensitive sediment mobilization algorithm of Buscombe and Conley (2012) to set reference concentrations for each size class. In the model, the total concentration, C, is represented as the sum of the concentrations, Ci for the N size classes: C = C$%
$&' . (1) The vertical advection-diffusion equation is calculated independently for each size class as ()*
(+− -
-.𝜇0
()*(.
= 𝑤0*()*(.
. (2) Where µs is sediment diffusivity and wsi is the settling velocity of the ith sediment class. The bottom reference concentration for each size class, Ci0, is calculated (Buscombe & Conley, 2012) as
𝐶67 𝑡 = 𝛾 𝑢∗ 𝑡 − 𝑢∗<=><*<=>
?@'. (3)
In this equation, u*(t) is the instantaneous friction velocity, u*D50 is the critical friction velocity of the
reference grain size (here D50), Di is the diameter of the size fraction of interest, and 𝛾 is utilized as a tunable parameter. The parameter in the exponent b is defined as:

Coastal Dynamics 2017 Paper No. 200
𝑏 = 1.04 M∗ NM∗O=>
PQ=>
− 1 . (4)
Where s is the standard deviation of the grain size distribution (sorting) and the constant 1.04 has been obtained from fitting to 103 test cases (Buscombe & Conley, 2012). A major assumption in the development of the model is that the sediment diffusivity, µs, is constant for all sediment grain and calculated using: 𝜇0 = 𝛽𝑐TU 𝜅𝐿. (5) In this equation, 𝑐TU is the stability function for sediment diffusivity and assumed equal to the momentum stability function, 𝜅 is the turbulent kinetic energy (TKE), 𝐿 is the turbulent mixing length. This means the parameter 𝛽 is the inverse of the Schmidt Number and represents the ratio of sediment diffusivity to momentum diffusivity. Future reference to this model will use the acronym mGOTM.
The model has been calibrated against a unique data set (Conley et al., 2012) where reliable mid water column measurements of grain size distributions were collected. The model was forced by observed velocities, the bottom size distribution was set to that observed in the field and 𝛾 and 𝛽 were adjusted to maximize model data agreement in total concentration. This resulted in a value for 𝛾 of 1.6 and 0.55 for 𝛽. Predicted and observed grain size distributions from this calibration are presented in Figure 2 where it is clear the model is reproducing the general selectivity of the suspension process even if showing a slight bias for finer sediments.
Figure 3. SWAN output from stationary model runs under HW conditions for storm of 24 February 2015. The magenta circle in the northwest region of the model grid is the location from which Great Ganinick wave conditions are derived. The effects of seagrass on the flow are simulated using the Seagrass module of GOTM. This module uses the active tracer technique originally described by Verduin & Backhaus (1998). Seagrass fronds are treated as passive Lagrangian tracers until the total travel distance is the length of the frond at which point mid

Coastal Dynamics 2017 Paper No. 200
depth quadratic drag is applied to the flow to represent the friction between the fronds and the current. In the simulations reported here we adopt frond characteristics equivalent to those of Verduin & Backhaus (1998) with maximum frond excursion of 0.72 m at a canopy height of 0.5m. 2.3. Wave model
SWAN (Booij et al, 1996) simulations were performed to identify antecedent wave conditions likely to have driven energetic wave conditions at the study site. Wave data were obtained at the offshore CEFAS Wavenet buoy west of the IOS and the Channel Coastal Observatory (CCO) inshore wave buoy in St. Mary’s Sound. For the months preceding the sediment sample collections, two significant events were identified, one on the 24th of February 2015 (offshore Hs = 8.76 m, Tp = 19.0 s, qp=281˚) and the other on 31 March 2015 (offshore Hs = 6.68 m, Tp = 13.6 s, qp =281˚). Stationary model runs of these events at both MSL and HW were performed with forcing derived from the CEFAS data and satisfactory validation derived from the CCO data. Not surprisingly, it was observed that a significantly higher level of low frequency wave propagation occurred for HW conditions. An example of the simulation results is presented in Figure 3 and a synthesis of the resulting wave parameters at Great Ganinick is provided in Table 1.
Table 1. SWAN derived wave parameters for Great Ganinick study site from the two largest storms of 2014-15 MSL Conditions HW Conditions Date Hs (m) Tp (s) qp (˚) Hs (m) Tp (s) qp (˚) 24/02/2015 0.83 18.4 235 1.10 20.1 235 31/03/2015 0.64 13.9 235 0.89 13.9 235 3. Results 3.1 Grain sizes
Figure 4. Grain size analysis for sediment samples collected in an unvegetated sand patch (green), a seagrass patch (red) and at a potential source bed (blue) for the Great Ganinick seagrass meadow. Size probability distribution
functions are presented in a.) and mean grain size for the 3 locations is provided in b.) where the error bars represent 99% confidence intervals.
a.) b.)

Coastal Dynamics 2017 Paper No. 200
The grain size analysis for the samples from Great Ganinick is presented in Figure 4. It is clear (Figure 4.b) that the sediments in the vegetated patch are significantly finer than those in the unvegetated patch despite their near proximity. While the identification of the source bed is highly speculative, there are clear indications that unvegetated patch has experienced enhancement of the coarse fraction which is significantly greater than the fine fraction enhancement in the vegetated patch. The results from the Par Beach meadow are consistent with these results in that the unvegetated patch is significantly coarser than the vegetated patch although both locations have grain sizes which are finer than the “source” sample. 3.2 mGOTM results
The most energetic conditions from Table 1 (Hs = 1.10m, Tp = 20.1s) have been selected for the forcing conditions for the mGOTM simulations. In order to introduce a degree of shoaling wave nonlinearity to the forcing, the regular wave form is composed of a principal component and its first subharmonic with amplitudes of 0.54m and 0.08m respectively and a phase lag of 45˚ for the subharmonic component. Two pairs of simulations have been run with each pair composed of a vegetated and an unvegetated run and the two pairs differentiated by the size distribution in the bed. One pair was performed using the sand patch distribution exhibited in Figure 4 and the other pair used the corresponding seagrass distribution. The model is run for 10 minutes of simulated time and the last zero up-crossing to zero up-crossing period is saved and analyzed.
Figure 5. The figure show the seagrass frond positions as a function of wave phase (0 phase is equivalent to sea surface elevation zero upcrossing). A rigid component is present at the bed after which the fronds move as neutrally buoyant
tracers until reaching the maximum extent of the frond at that depth after which the induce drag on the local flow field. Figure 5 provides a representation of the apparent frond location for various phases of the wave. For the long period wave examined in this submission, the fronds appear to be passively mobile and are therefore generating drag over the bottom 0.5 m of the water column for about 75% of the wave cycle. It is clear that the wave particle displacement diameter, d0, is a key parameter here and that if d0 is less than the total distance over which the fronds are free to move, then the effect of seagrass on the flow would be non-existent. In the case studied here it is clear that the effect of seagrass on the flow is significant and that the seagrass actively removes momentum from the bottom of the water column. This is confirmed by the results presented in Figure 6a where we can see that in the bottom of the water column, the presence of seagrass has led to a dramatic decrease in the kinetic energy in the flow because of dramatically reduced velocities. Clearly this has a knock on effect in that the quantity of near bed suspended sediment (Figure 6b) where the near bed sediment concentrations are almost an order of magnitude higher in the bare sand bed case than in the seagrass covered bed. This effect is even stronger in the near bed sediment flux conditions (Figure 6c) where in the seagrass case, the flux is the product of reduced sediment concentrations and reduced fluid velocities. It is beyond question that the local near bed sediment flux for

Coastal Dynamics 2017 Paper No. 200
the grain sizes where significant quantities of flux are observed is an order of magnitude higher for the bare sand case. A prudent observer will however note that this near-bed flux tapers out within 0.03m of the bottom and that under the seagrass conditions, there is an observable level of flux particularly for the finest sediments (96µm) but also for the sediment class one step coarser (118 µm) and that this transport extends from about 0.3m to 3m above the bed.
Figure 6. Comparison of mean (temporal) energy levels (a.), size specific mean sediment concentration (b.), and mean
sediment flux (c.). Bare sand patch results are given in dashed lines in (a.) where the vertical coordinate system is linear and solid lines in (b.) and (c.) where the scale is logarithmic. Inability to see expected lines indicates (eg. Dashed
green in a.) indicates the values are too close to 0 to be distinguishable. This extension in the seagrass case of a low magnitude sediment flux over a vertical extent which is two orders of magnitude larger than the region of intense near bottom transport observed in the bare sand patch case, begs for an explanation as to what drives this mid water column flux. The answer to this question is presumably revealed in the TKE results of Figure 6a. The TKE for the bare sand case is not discernible in this figure because the only source of turbulence generation present in that scenario is the near bed shear which results in measureable TKE only near the bottom. Instead, the seagrass scenario indicates a region of intense turbulence generation at the top of the seagrass canopy where the flow differential between the fully extended seagrass fronds and the rapidly moving wave orbital motion causes highly enhanced turbulence levels at this location which is then diffused both downwards and up into the water column.
The enhanced turbulence levels previously discussed provide some indication that the effect of seagrass on the sediment transport processes may be grain size specific. In particular, while sediments which have a high settling velocity (coarse grains) and rapidly fall out of suspension will be largely affected by the reduced bed shear stress and their effective transport rates will be significantly reduced in the seagrass. However the grains with lower settling velocity (fine grains) might be expected to preferentially respond to the higher turbulence levels and therefore diffuse higher into the water column where they would be transported by the enhanced velocities observed in the clear water – canopy boundary layer (Figure 6a). Thus it is conceptually conceivable that transport levels are decreased for some grain sizes and elevated for others. This is precisely what is observed in the grain size specific plots of depth integrated net transport demonstrated in Figure 7. If we consider the paired bare sand and seagrass simulations which are performed over bottom types containing the observed bare sand grain size distribution (Figure 7a), it is seen that while for sediments coarser than 118 µm, the transport rates are indeed reduced when entering into seagrass beds but for grains equal to or finer than this number, the depth integrated flux is indeed increased. Qualitatively the results are the same for the simulations containing a bed source distribution composed of the seagrass distribution (Figure 7b) although the transition occurs at a lower grain size threshold.
a.) b.) c.)

Coastal Dynamics 2017 Paper No. 200
Figure 7. Grain size dependent depth integrated net sediment flux for bare sand (blue) and seagrass covered locations.
Bed size distribution is either both bare sand composition (a.) or seagrass composition (b). 4. Discussion The results highlighted in Figure 7 can be examined to understand what occurs on a flat homogenous sediment bed in which a wave of constant characteristics propagates from an unvegetated bed to a vegetated bed. The implied divergence of sediment present in the figure clearly demonstrates that under wave conditions believed to have occurred near Great Ganinick during the winter of 2017, fine sediments would have been preferentially winnowed from the unvegetated location and coarser sediments would have been preferentially deposited. This process would eventually lead to a coarsening of the source bed material in the unvegetated bed and a fining of the sediments in the vegetated location precisely as observed in Figure 4. arising from Figure sediment. This treatment of the topic has only begun to touch on the processes at play in these environments and significant contributing factors such as, wave attenuation by the seagrass patch, and the presence of a commonly observed bed elevation change at the patch boundary, have been ignored. Nonetheless the results demonstrate conclusively that the flow modifications induced by the presence of seagrass alone can lead to grain size selection in the resulting transport processes.
Figure 8. Mean sediment grain sizes of the Par Beach sediment samples collected at the five locations shown in Figure 1. Squares represent the mean grain size and error bars represent the 99% confidence interval. Sample #1 is the western
most sample and #5 is the eastern most. While it is of little doubt that wave attenuation is a significant contributing factor to the sediment dynamics within the seagrass patch itself, a reversal of the divergences discussed above suggests that on the exit from
a.) b.)

Coastal Dynamics 2017 Paper No. 200
the seagrass, fine sediments will be preferentially deposited in the vegetated section and coarser sediments will be preferentially winnowed thereby further contributing to the grain size selection observed in Figure 4. That this process is contributing to regional sediment dynamics is suggested by the Par Beach (Figure 1) grain size analysis presented in Figure 8. Crescentic beaches such as Par Beach are common locations for studies of sediment grading by refracted waves but the grain size analysis presented in Figure 8 indicates that the only location in the entire beach which had a statistically different grain size from the other locations was sample #5. This location is the eastern most sample point and is situated directly in the shadow of the Par Beach seagrass meadow. All of the beach sands sampled are considerably coarser than any potential marine source sand sampled, suggesting that the beach building processes in this location lead to a coarsening of the source sediments. However, the relatively finer nature of sample #5 suggests that its source material is significantly finer than that on the other sections of the beach which is consistent with the Par Beach seagrass meadow being a relatively fine source bed, in line with size selection by seagrass beds. 5. Conclusions Observations of sediment size distributions within and around seagrass meadows in the Isles of Scilly have been presented which demonstrate significantly finer sediments within the meadows and coarser sediments in the bare sand patches. This result held even for bare patches on the order of tens of meters in dimension fully surrounded by seagrass. A 1DV numerical flow and advection-diffusion model for sediment which accounts for the fluid-plant interactions has been introduced and a validation against observations of suspended sediment grain size distributions was provided. Using hindcast wave parameters for energetic conditions at the Great Ganinick seagrass meadow, simulations of size dependent sediment suspension over homogenous sand beds under either bare sand or seagrass covered conditions were performed. Under these conditions, the presence of seagrass leads to a dramatic reduction in the bed shear stress but at the same time causes a dramatic increase in turbulence at the level of the canopy top which diffuses both upwards and downwards in the water column. This was shown to lead to grain size dependent increases or decreases in the net flux of sediment through the water column in a fashion which would contribute to relatively coarser sediments in the bare patches and finer sediments in the seagrass patches in line with the observations. 6. References Alteno, M., 2014, Implementation of size distribution effects in an advection-diffusion model of sediment transport,
Tesi di Laurea, Università degli Studi di Catania, Catania. Booij, N., Holthuijsen, L.H. and Ris, R.C., 1997. The" SWAN" wave model for shallow water. Coastal Engineering
1996 (pp. 668-676). Bos, A. R., Bouma, T. J., de Kort, G. L., & van Katwijk, M. M., 2007, Ecosystem engineering by annual intertidal
seagrass beds: sediment accretion and modification. Estuarine, Coastal and Shelf Science, 74(1), 344-348. Bouma, T. J., De Vries, M. B., Low, E., Peralta, G., Tanczos, I. C., van de Koppel, J., & Herman, P. M. J., 2005, Trade-
offs related to ecosystem engineering: a case study on stiffness of emerging macrophytes. Ecology, 86(8), 2187-2199.
Burchard, H., and H. Baumert, 1995, On the performace of a mixed-layer model based on the k-e turbulence closure, J. Geophys. Res. (C5), 100, 8523-8540, 1995
Buscombe, D. and Conley, D.C., 2012, Effective shear stress of graded sediments, Water Resources Research, 48, doi:10.1029/2010WR010341.
Conley, D.C., Falchetti, S., Lohmann, I.P. and Brocchini, M., 2008, The effects of flow stratification by non-cohesive sediment on transport in high-energy wave-driven flows. Journal of Fluid Mechanics, 610, 43-67, doi:10.1017/S0022112008002565.
Conley, D., Buscombe, D., & Nimmo-Smith, A., 2012. Use of digital holographic cameras to examine the measurement and understanding of sediment suspension in the nearshore.. Coastal Engineering Proceedings, 1(33), doi:https://doi.org/10.9753/icce.v33.sediment.73
Ganthy, F., Sottolichio, A., & Verney, R., 2013, Seasonal modification of tidal flat sediment dynamics by seagrass meadows of Zostera noltii (Bassin d'Arcachon, France). Journal of Marine Systems, 109, S233-S240.

Coastal Dynamics 2017 Paper No. 200
Koch, E. W., 1999, Sediment resuspension in a shallow Thalassia testudinum banks ex König bed. Aquatic Botany, 65(1), 269-280.
Valle, M., Borja, Á., Chust, G., Galparsoro, I. and Garmendia, J.M., 2011. Modelling suitable estuarine habitats for Zostera noltii, using ecological niche factor analysis and bathymetric LiDAR. Estuarine, Coastal and Shelf Science, 94(2), pp.144-154.
Van Katwijk, M.M., Thorhaug, A., Marbà, N., Orth, R.J., Duarte, C.M., Kendrick, G.A., Althuizen, I.H., Balestri, E., Bernard, G., Cambridge, M.L. and Cunha, A., 2016. Global analysis of seagrass restoration: the importance of large-scale planting. Journal of Applied Ecology, 53(2), pp.567-578.
Verduin, J.J., & Backhaus, J.O., 2000, Dynamics of plant flow interactions for the seagrass Amphibolis Antarctica: Field observations and model simulations. Estuarine, Coast and Shelf Science, v. 50, 185-204.
Waycott, M., Duarte, C.M., Carruthers, T.J., Orth, R.J., Dennison, W.C., Olyarnik, S., Calladine, A., Fourqurean, J.W., Heck, K.L., Hughes, A.R. and Kendrick, G.A., 2009. Accelerating loss of seagrasses across the globe threatens coastal ecosystems. Proceedings of the National Academy of Sciences, 106(30), pp.12377-12381.
Wilkie, L., O’Hare, M. T., Davidson, I., Dudley, B., & Paterson, D. M. (2012). Particle trapping and retention by Zostera noltii: A flume and field study. Aquatic Botany, 102, 15–22.