Embed Size (px)
Citation preview
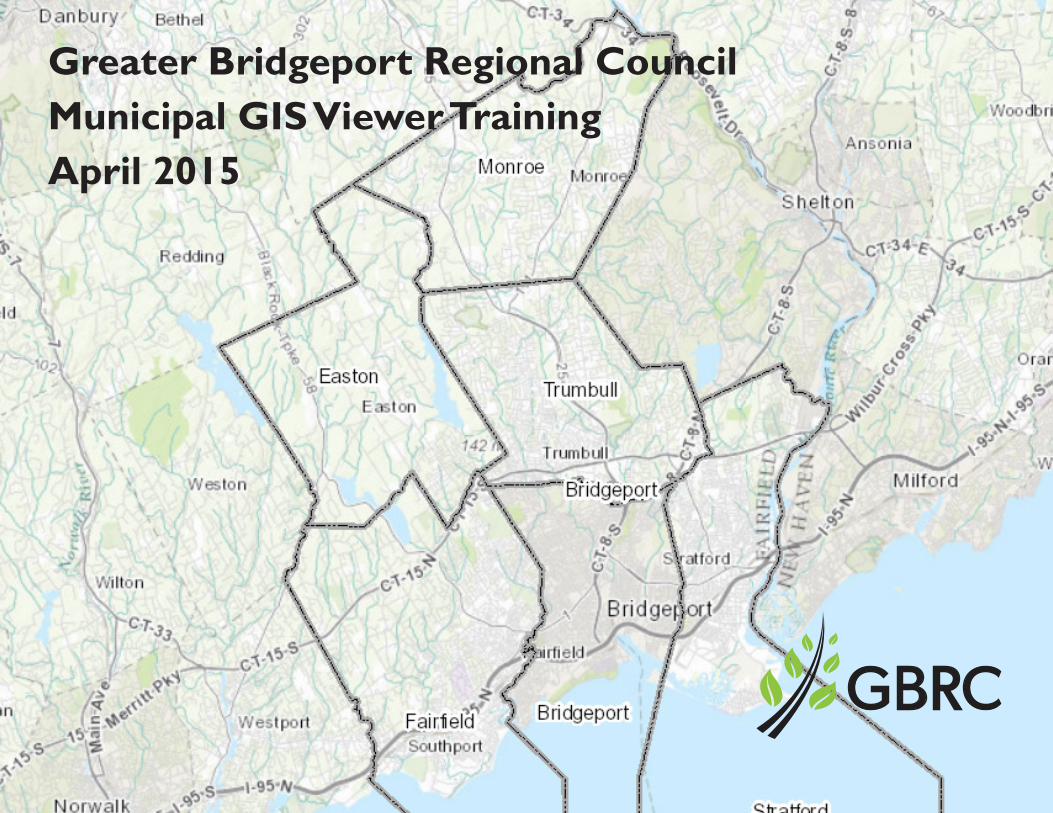
Greater Bridgeport Regional Council Municipal GIS Viewer TrainingApril 2015
GBRC GIS Web Training Manual 2
GBRC GIS Web Training
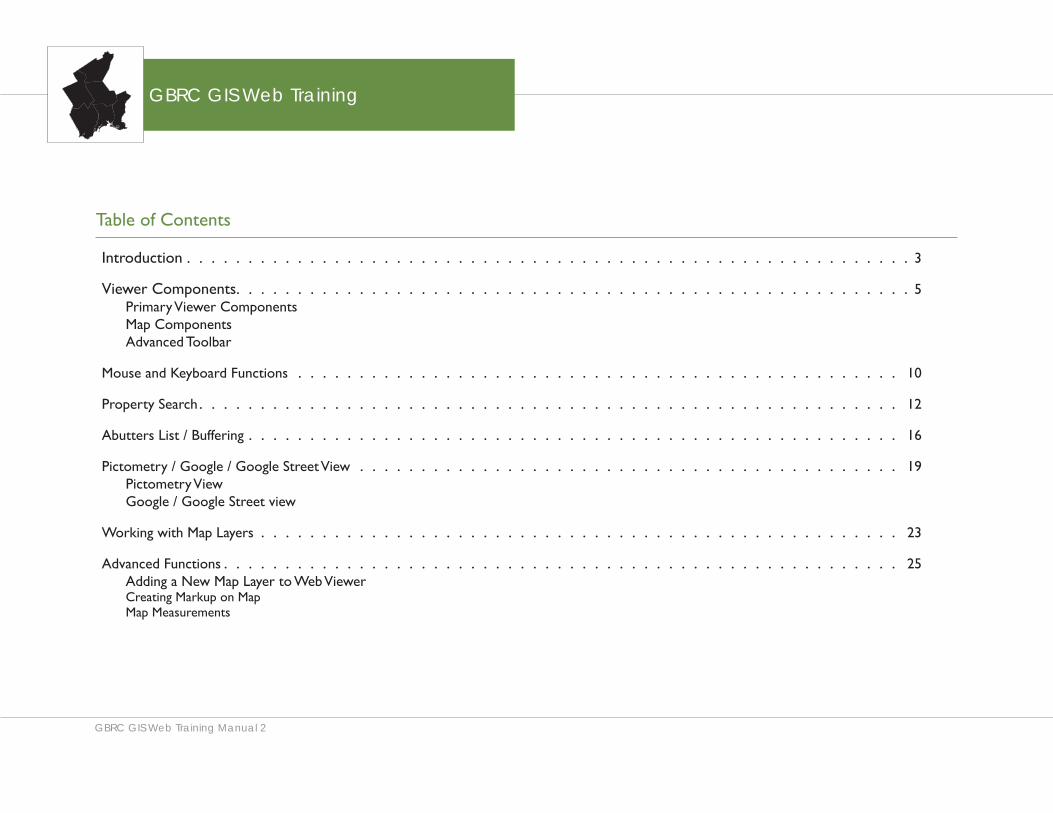
Table of Contents
Introduction � � � � � � � � � � � � � � � � � � � � � � � � � � � � � � � � � � � � � � � � � � � � � � � � � � � � � � � � � � � 3
Viewer Components� � � � � � � � � � � � � � � � � � � � � � � � � � � � � � � � � � � � � � � � � � � � � � � � � � � � � � � 5Primary Viewer ComponentsMap ComponentsAdvanced Toolbar
Mouse and Keyboard Functions � � � � � � � � � � � � � � � � � � � � � � � � � � � � � � � � � � � � � � � � � � � � � � � � � 10
Property Search � � � � � � � � � � � � � � � � � � � � � � � � � � � � � � � � � � � � � � � � � � � � � � � � � � � � � � � � � 12
Abutters List / Buffering � � � � � � � � � � � � � � � � � � � � � � � � � � � � � � � � � � � � � � � � � � � � � � � � � � � � � 16
Pictometry / Google / Google Street View � � � � � � � � � � � � � � � � � � � � � � � � � � � � � � � � � � � � � � � � � � � � 19Pictometry ViewGoogle / Google Street view
Working with Map Layers � � � � � � � � � � � � � � � � � � � � � � � � � � � � � � � � � � � � � � � � � � � � � � � � � � � � 23
Advanced Functions � � � � � � � � � � � � � � � � � � � � � � � � � � � � � � � � � � � � � � � � � � � � � � � � � � � � � � � 25Adding a New Map Layer to Web Viewer Creating Markup on MapMap Measurements
GBRC GIS Web Training Manual 3
GBRC GIS Web Training
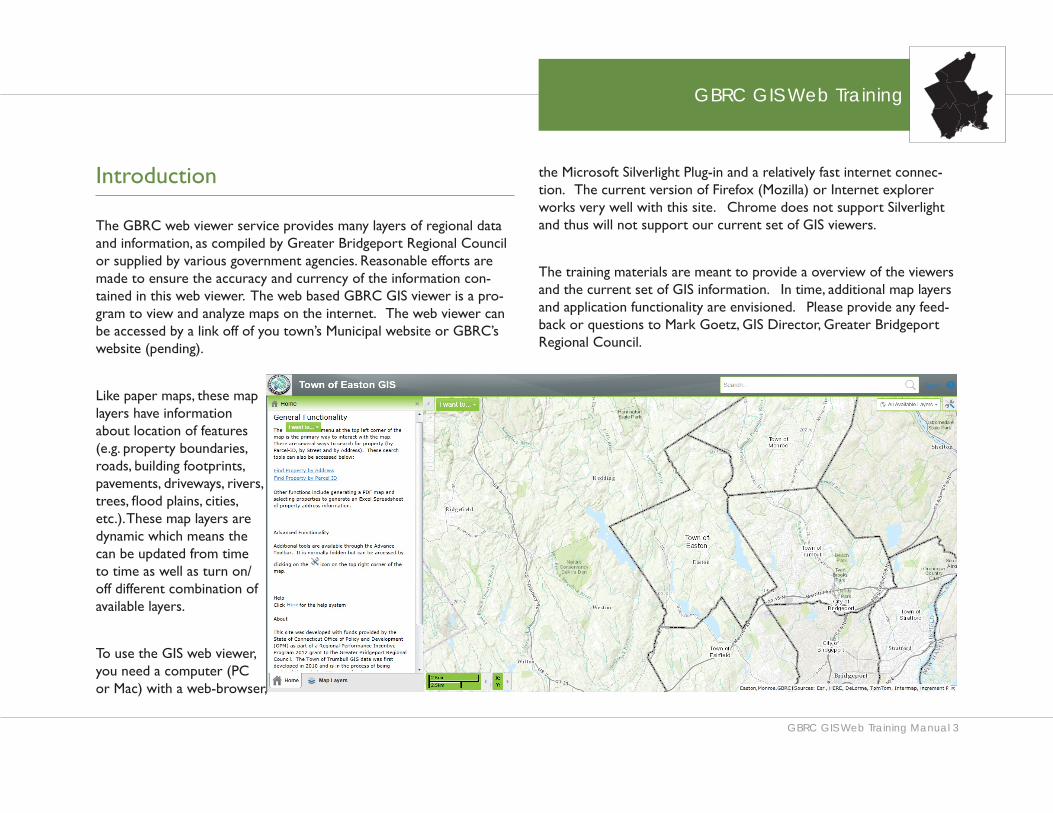
Introduction
The GBRC web viewer service provides many layers of regional data and information, as compiled by Greater Bridgeport Regional Council or supplied by various government agencies� Reasonable efforts are made to ensure the accuracy and currency of the information con-tained in this web viewer� The web based GBRC GIS viewer is a pro-gram to view and analyze maps on the internet� The web viewer can be accessed by a link off of you town’s Municipal website or GBRC’s website (pending)�
Like paper maps, these map layers have information about location of features (e�g� property boundaries, roads, building footprints, pavements, driveways, rivers, trees, flood plains, cities, etc�)� These map layers are dynamic which means the can be updated from time to time as well as turn on/off different combination of available layers�
To use the GIS web viewer, you need a computer (PC or Mac) with a web-browser,
the Microsoft Silverlight Plug-in and a relatively fast internet connec-tion� The current version of Firefox (Mozilla) or Internet explorer works very well with this site� Chrome does not support Silverlight and thus will not support our current set of GIS viewers�
The training materials are meant to provide a overview of the viewers and the current set of GIS information� In time, additional map layers and application functionality are envisioned� Please provide any feed-back or questions to Mark Goetz, GIS Director, Greater Bridgeport Regional Council�

Introduction
GBRC GIS Web Training Manual 4
Tutorial Objectives
This tutorial will help you to:
• Search on Parcel by … and open field card. • Search on Parcel by … and open Pictometry�• Search on Parcel by … and open Google Street View�• Search on Parcel by … and Print Map�• Navigate to area and identify parcels• Using the buffer tool to create parcel abutters lists• Create printed maps from the application • Use this help document in addition to the application template
help files.
Map Layers
Popular information available includes:
• Property ( Address, Street Name, and Town Boundaries)• Aerial imagery and topographic maps• Property and road boundaries• Soils• Local Basin• Natural Diversity Database Area• FEMA National Flood Hazard Layer• Various Municipal Specific Layers

Viewer Components
GBRC GIS Web Training Manual 5
Viewer Components
Open the GIS Viewer
1� Type the web address below into your browser window or type in your municipal GIS Web Viewer URL below�
https://maps�gbrct�org/BridgeportGIS/Viewer�html
https://maps�gbrct�org/EastonGIS/Viewer�html
https://maps.gbrct.org/FairfieldGIS/Viewer.html
https://maps�gbrct�org/MonroeGIS/Viewer�html
https://maps�gbrct�org/StratfordGIS/Viewer�html
https://maps�gbrct�org/TrumbullGIS/Viewer�html
2. Read then click OK to accept the web viewer Disclaimer�
Viewer Components
GBRC GIS Web Training Manual 6
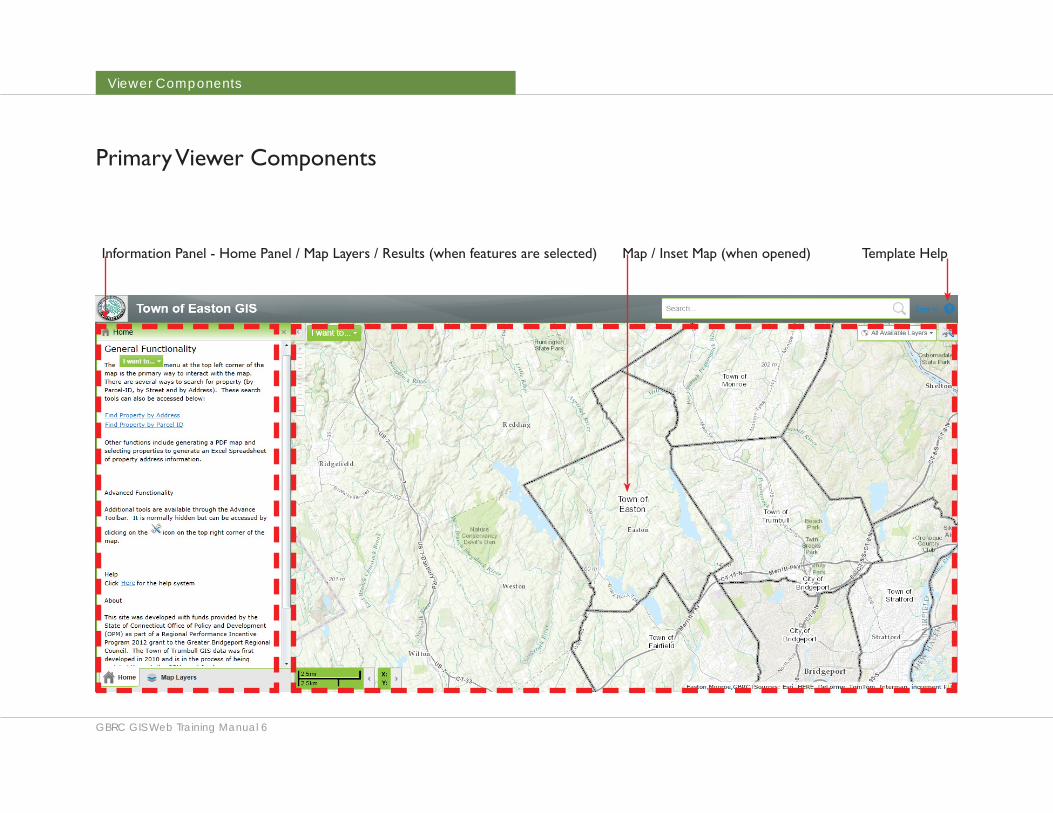
Primary Viewer Components
Information Panel - Home Panel / Map Layers / Results (when features are selected) Map / Inset Map (when opened) Template Help
Viewer Components
GBRC GIS Web Training Manual 7
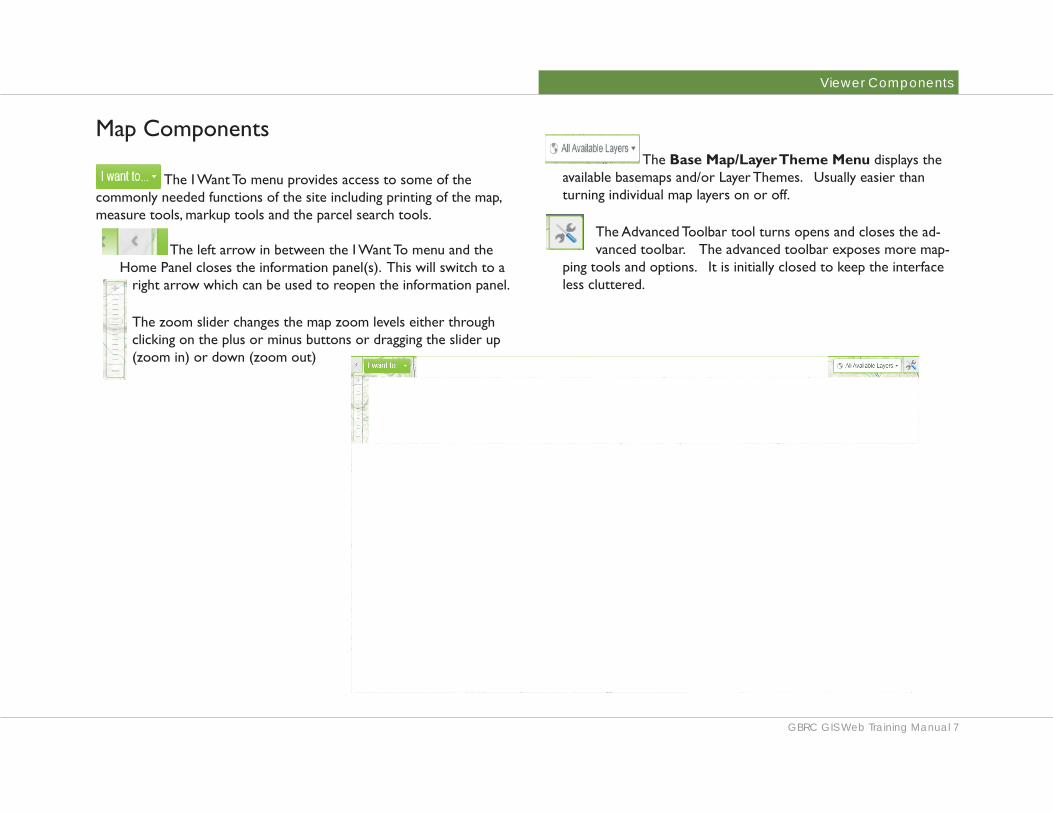
Map Components
The I Want To menu provides access to some of the commonly needed functions of the site including printing of the map, measure tools, markup tools and the parcel search tools�
The left arrow in between the I Want To menu and the Home Panel closes the information panel(s)� This will switch to a
right arrow which can be used to reopen the information panel�
The zoom slider changes the map zoom levels either through clicking on the plus or minus buttons or dragging the slider up (zoom in) or down (zoom out)
The Base Map/Layer Theme Menu displays the available basemaps and/or Layer Themes� Usually easier than turning individual map layers on or off�
The Advanced Toolbar tool turns opens and closes the ad-vanced toolbar� The advanced toolbar exposes more map-
ping tools and options� It is initially closed to keep the interface less cluttered�
Viewer Components
GBRC GIS Web Training Manual 8
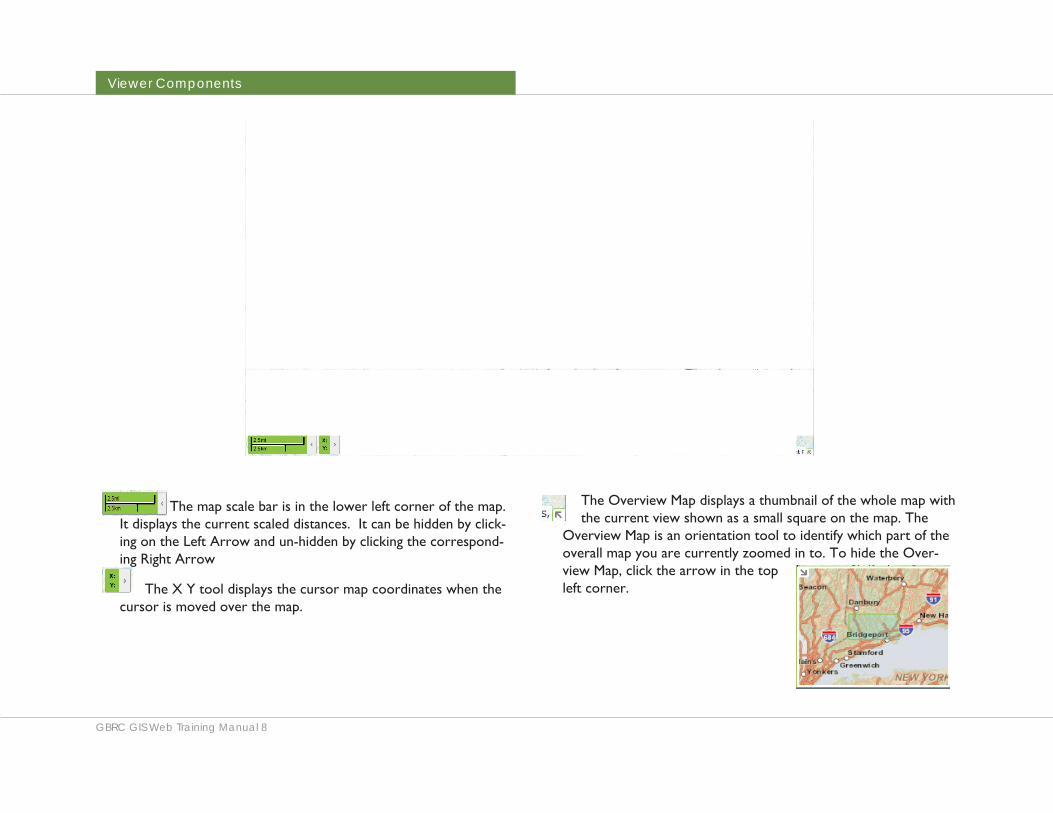
The map scale bar is in the lower left corner of the map� It displays the current scaled distances� It can be hidden by click-ing on the Left Arrow and un-hidden by clicking the correspond-ing Right Arrow
The X Y tool displays the cursor map coordinates when the cursor is moved over the map�
The Overview Map displays a thumbnail of the whole map with the current view shown as a small square on the map� The
Overview Map is an orientation tool to identify which part of the overall map you are currently zoomed in to� To hide the Over-view Map, click the arrow in the top left corner�
Viewer Components
GBRC GIS Web Training Manual 9
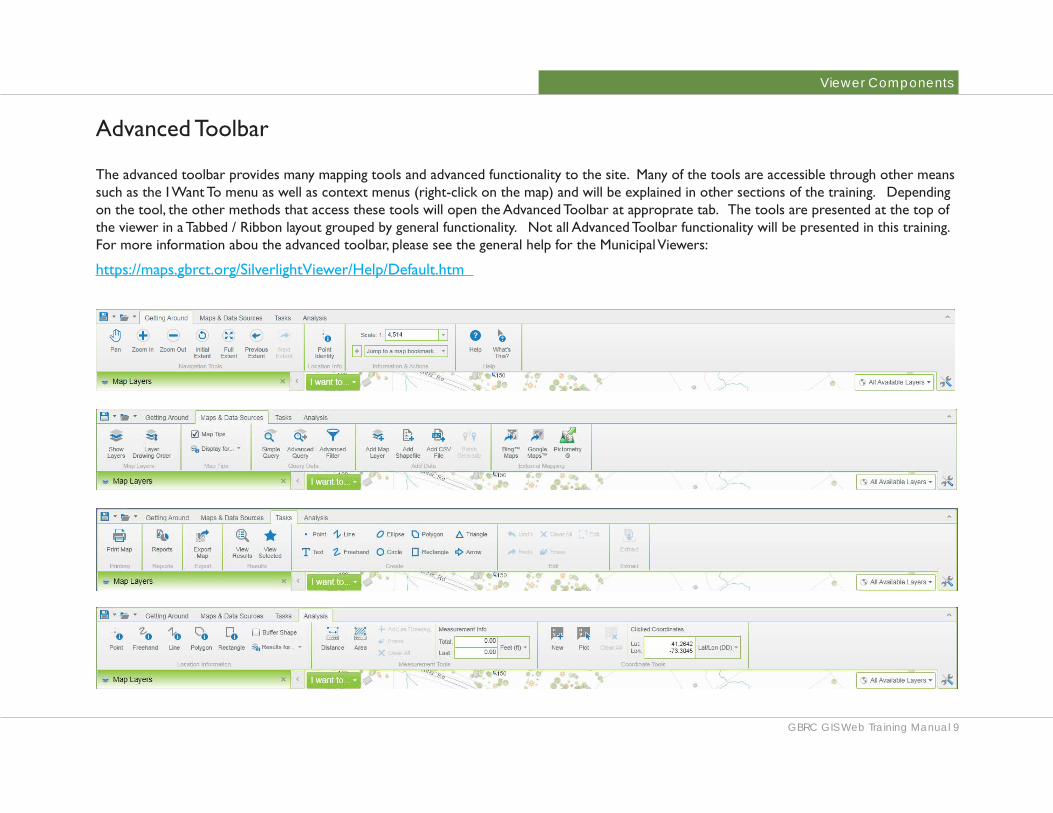
Advanced Toolbar
The advanced toolbar provides many mapping tools and advanced functionality to the site� Many of the tools are accessible through other means such as the I Want To menu as well as context menus (right-click on the map) and will be explained in other sections of the training� Depending on the tool, the other methods that access these tools will open the Advanced Toolbar at approprate tab� The tools are presented at the top of the viewer in a Tabbed / Ribbon layout grouped by general functionality� Not all Advanced Toolbar functionality will be presented in this training� For more information abou the advanced toolbar, please see the general help for the Municipal Viewers:
https://maps�gbrct�org/SilverlightViewer/Help/Default�htm
Mouse and Keyboard Functions
GBRC GIS Web Training Manual 10
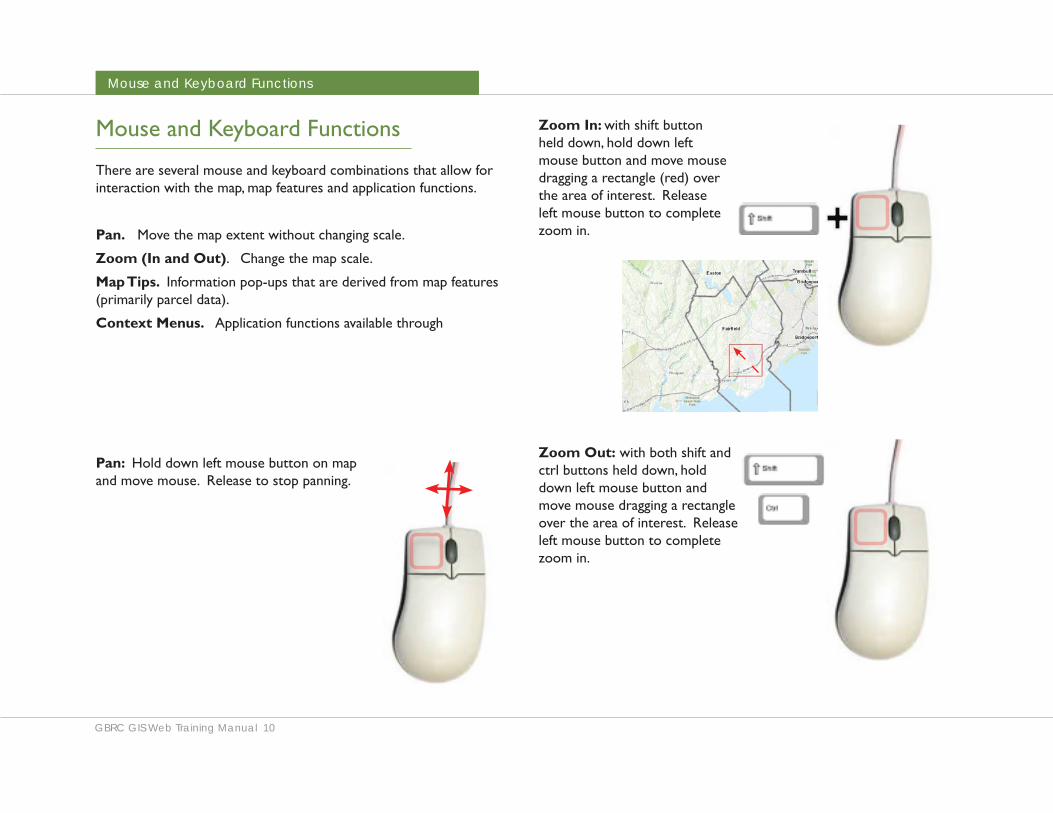
Pan: Hold down left mouse button on map and move mouse� Release to stop panning�
Zoom In: with shift button held down, hold down left mouse button and move mouse dragging a rectangle (red) over the area of interest� Release left mouse button to complete zoom in�
Zoom Out: with both shift and ctrl buttons held down, hold down left mouse button and move mouse dragging a rectangle over the area of interest� Release left mouse button to complete zoom in�
Mouse and Keyboard Functions
There are several mouse and keyboard combinations that allow for interaction with the map, map features and application functions�
Pan. Move the map extent without changing scale�
Zoom (In and Out)� Change the map scale�
Map Tips. Information pop-ups that are derived from map features (primarily parcel data)�
Context Menus. Application functions available through

Mouse and Keyboard Functions
GBRC GIS Web Training Manual 11
Right-Click Menu: A right-click on the map will enable the Right-Click menu� There are several options as indicated below�
Scroll Wheel can be also be used to zoom in and zoom out on the map at the cursor location�
Zoom In. Move scroll wheel forward with cursor on map�
Zoom Out. Move scrool wheel backwards with cursor on map�
Map Tips: The parcel data, when present, allow for some of the un-derlying informtion displayed and function links exposed as a pop-up when the user left-clicks on top of a parcel on the map� There may be instances when multiple records are selected using this method and the pop-up will indicate that Multiple Features Found in the pop-up�
Property Search
GBRC GIS Web Training Manual 12
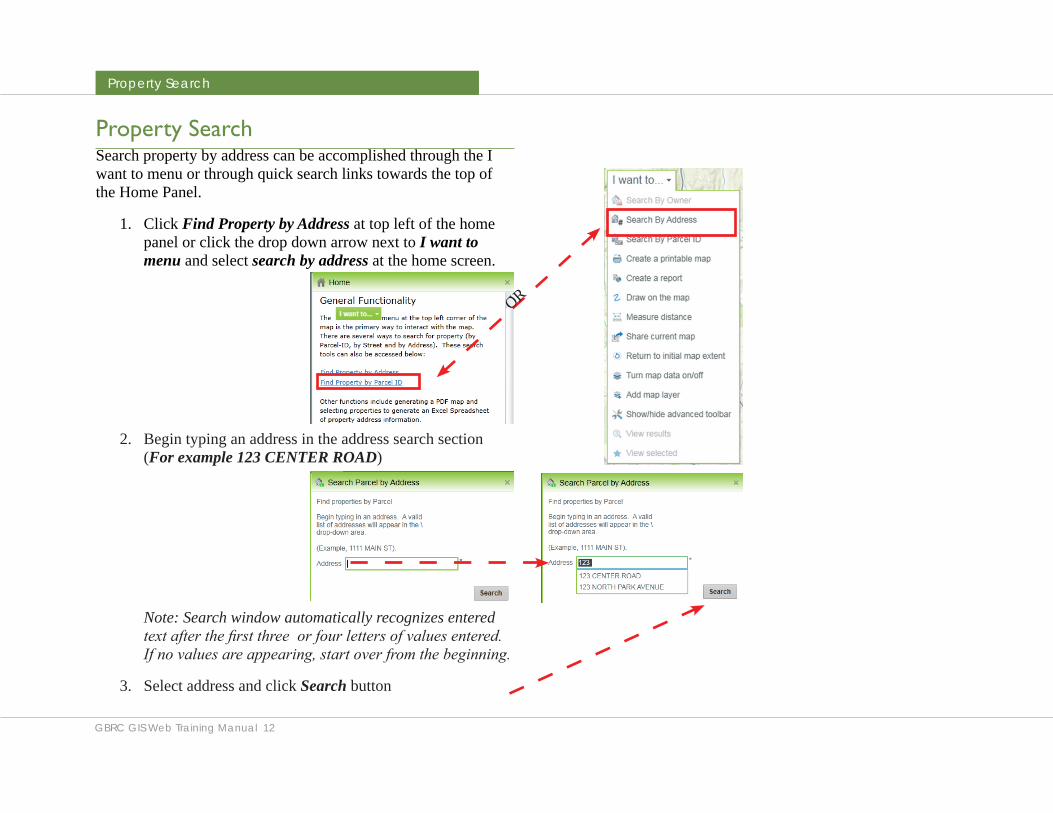
Property SearchSearch property by address can be accomplished through the I want to menu or through quick search links towards the top of the Home Panel.
1. Click Find Property by Address at top left of the home panel or click the drop down arrow next to I want to menu and select search by address at the home screen.
2. Begin typing an address in the address search section (For example 123 CENTER ROAD)
Note: Search window automatically recognizes entered text after the first three or four letters of values entered. If no values are appearing, start over from the beginning.
3. Select address and click Search button
OR
Property Search
GBRC GIS Web Training Manual 13
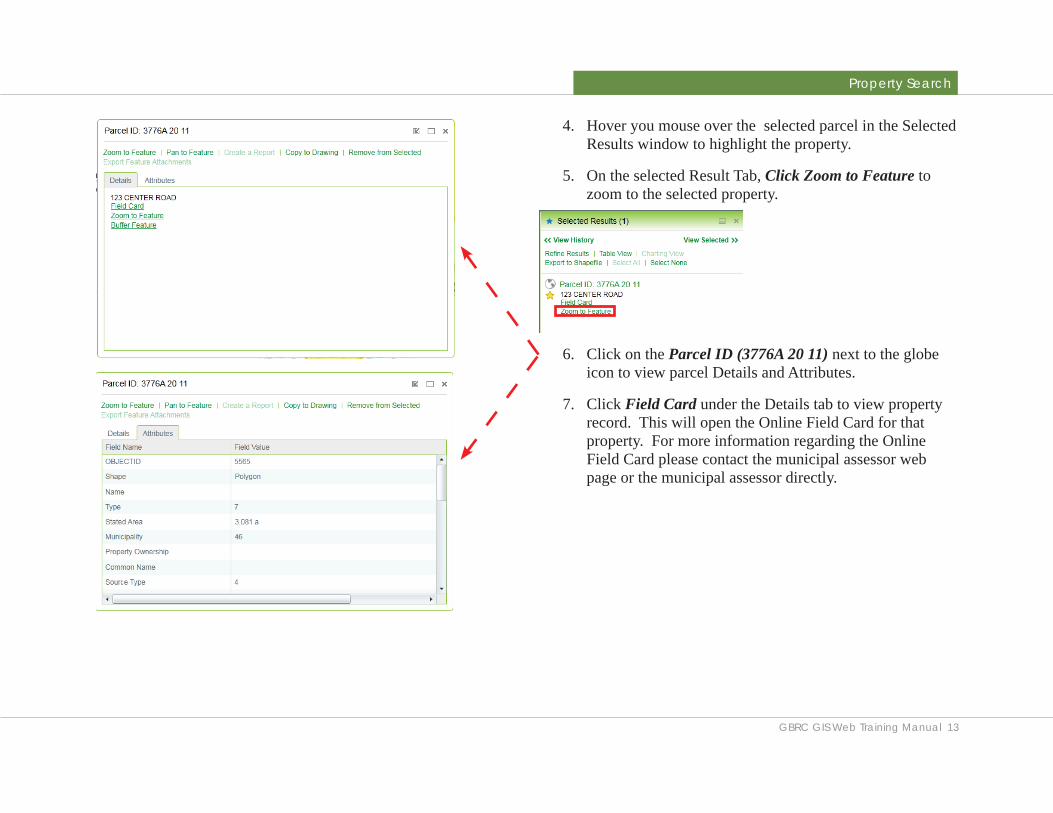
4. Hover you mouse over the selected parcel in the Selected Results window to highlight the property.
5. On the selected Result Tab, Click Zoom to Feature to zoom to the selected property.
6. Click on the Parcel ID (3776A 20 11) next to the globe icon to view parcel Details and Attributes.
7. Click Field Card under the Details tab to view property record. This will open the Online Field Card for that property. For more information regarding the Online Field Card please contact the municipal assessor web page or the municipal assessor directly.
Property Search
GBRC GIS Web Training Manual 14
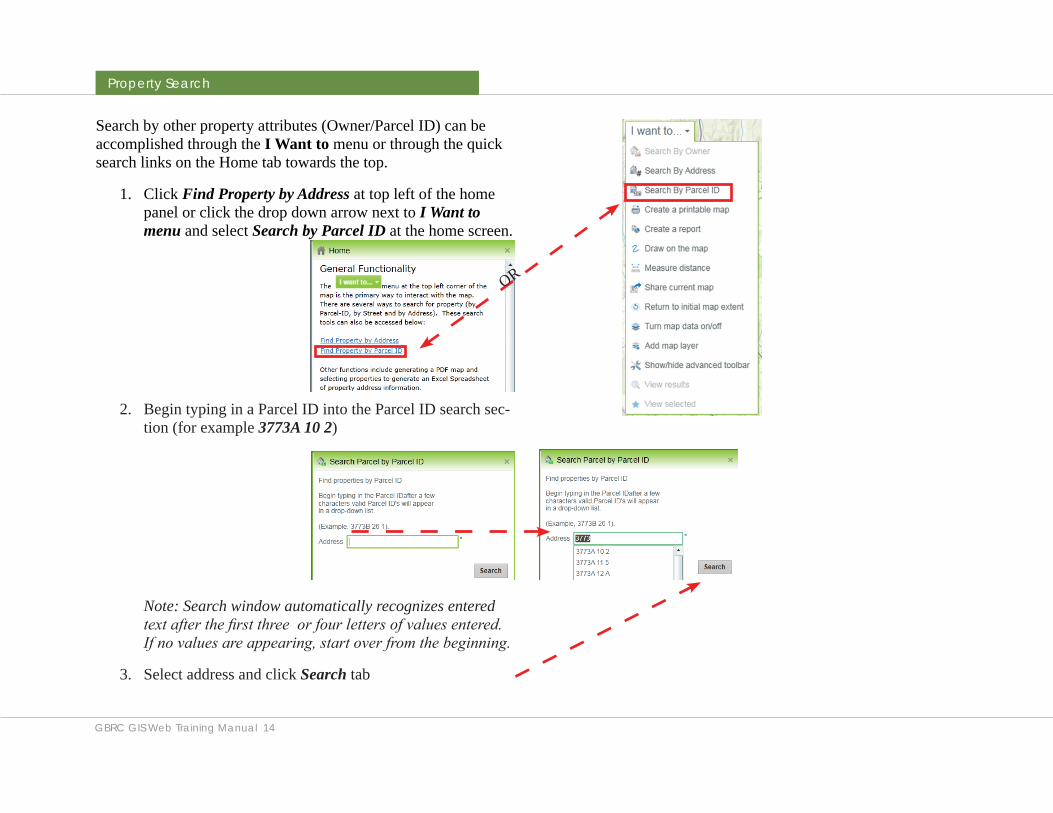
Search by other property attributes (Owner/Parcel ID) can be accomplished through the I Want to menu or through the quick search links on the Home tab towards the top.
1. Click Find Property by Address at top left of the home panel or click the drop down arrow next to I Want to menu and select Search by Parcel ID at the home screen.
2. Begin typing in a Parcel ID into the Parcel ID search sec-tion (for example 3773A 10 2)
Note: Search window automatically recognizes entered text after the first three or four letters of values entered. If no values are appearing, start over from the beginning.
3. Select address and click Search tab
OR
Property Search
GBRC GIS Web Training Manual 15
4. Hover you mouse over the selected parcel in the Selected Results window to highlight the property.
5. On the selected Result Tab, Click Zoom to Feature to zoom to the selected property.
6. Click the Parcel ID (3773A 2A 15) tab to view parcel Details and attribute.
7. Click Field Card under the Details tab to view property record.
Abutters List / Buffering
GBRC GIS Web Training Manual 16
Abutters List / Buffering
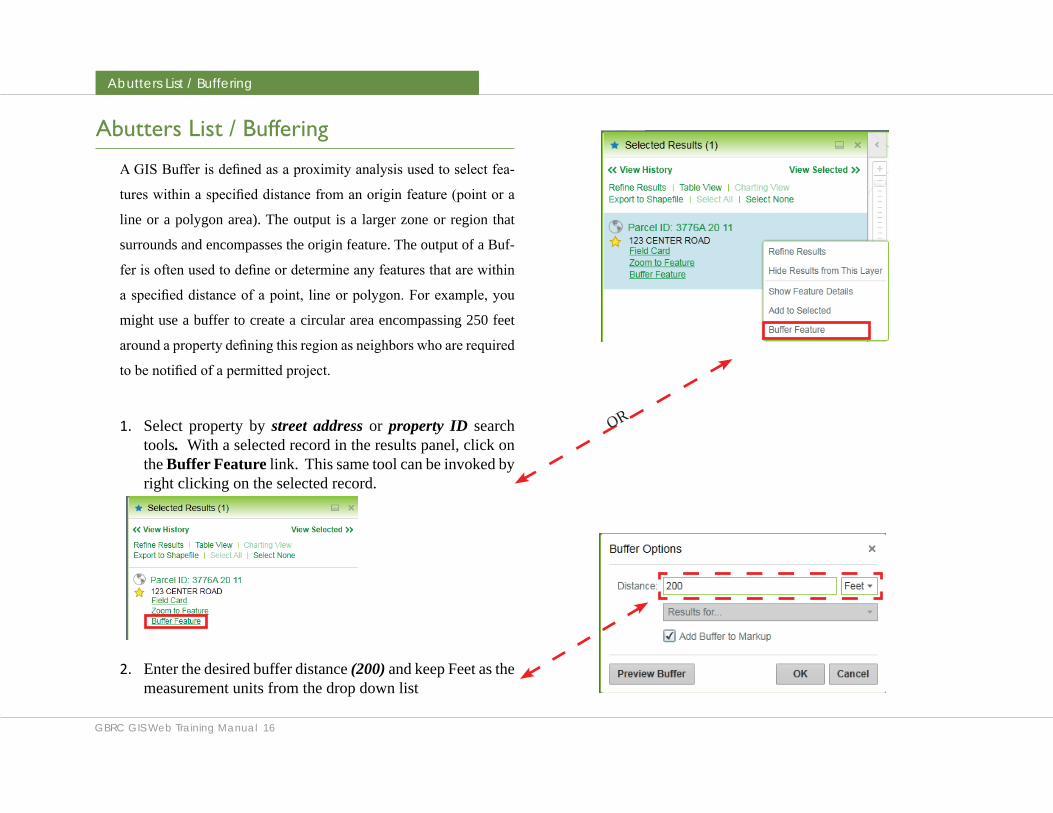
A GIS Buffer is defined as a proximity analysis used to select fea-
tures within a specified distance from an origin feature (point or a
line or a polygon area). The output is a larger zone or region that
surrounds and encompasses the origin feature. The output of a Buf-
fer is often used to define or determine any features that are within
a specified distance of a point, line or polygon. For example, you
might use a buffer to create a circular area encompassing 250 feet
around a property defining this region as neighbors who are required
to be notified of a permitted project.
1. Select property by street address or property ID search tools. With a selected record in the results panel, click on the Buffer Feature link. This same tool can be invoked by right clicking on the selected record.
2. Enter the desired buffer distance (200) and keep Feet as the measurement units from the drop down list
OR
Abutters List / Buffering
GBRC GIS Web Training Manual 17
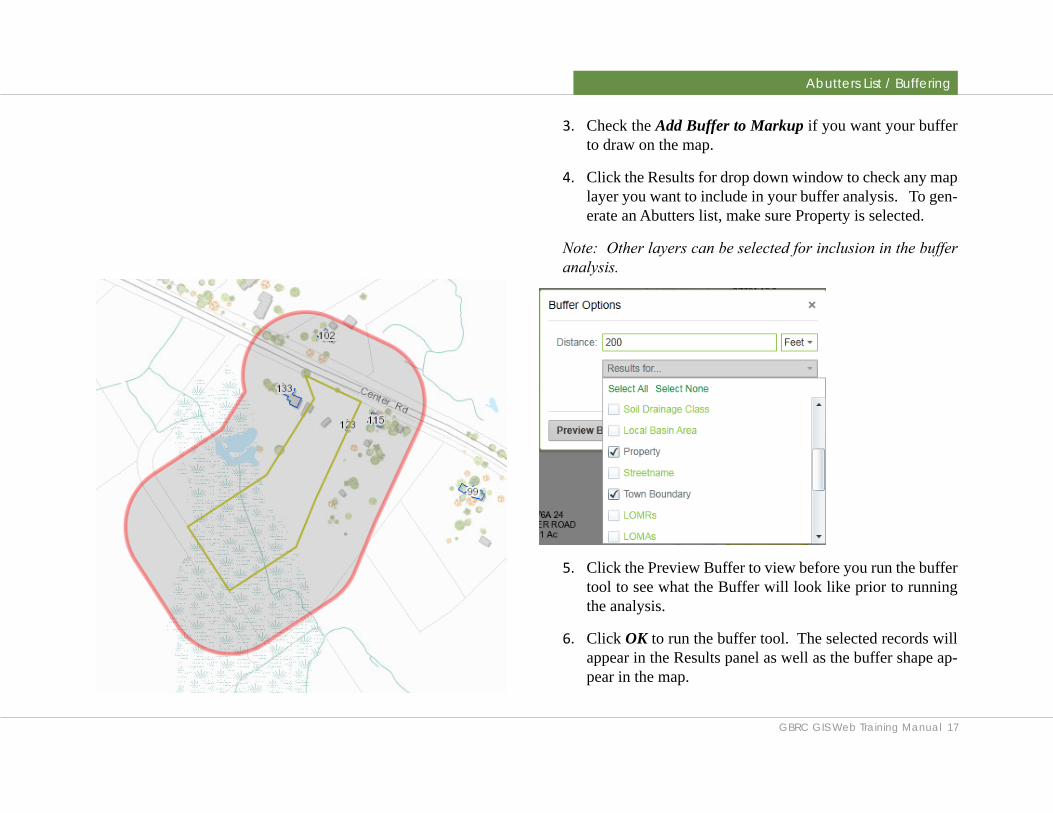
3. Check the Add Buffer to Markup if you want your buffer to draw on the map.
4. Click the Results for drop down window to check any map layer you want to include in your buffer analysis. To gen-erate an Abutters list, make sure Property is selected.
Note: Other layers can be selected for inclusion in the buffer analysis.
5. Click the Preview Buffer to view before you run the buffer tool to see what the Buffer will look like prior to running the analysis.
6. Click OK to run the buffer tool. The selected records will appear in the Results panel as well as the buffer shape ap-pear in the map.
Abutters List / Buffering
GBRC GIS Web Training Manual 18
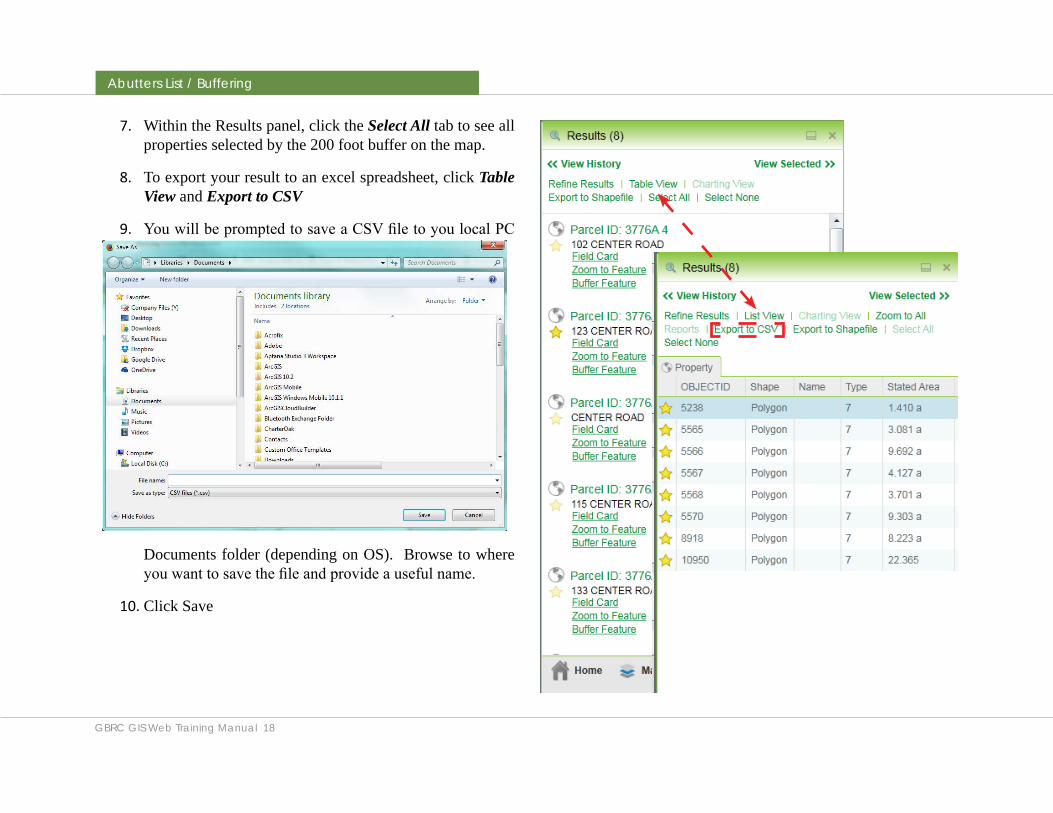
7. Within the Results panel, click the Select All tab to see all properties selected by the 200 foot buffer on the map.
8. To export your result to an excel spreadsheet, click Table View and Export to CSV
9. You will be prompted to save a CSV file to you local PC
Documents folder (depending on OS). Browse to where you want to save the file and provide a useful name.
10. Click Save
Pictometry / Google / Google Street View
GBRC GIS Web Training Manual 19
Pictometry / Google / Google Street View The Municipal Viewers are integrated with several external mapping resources� When one of the external mapping sources are invoked, a new browser window is opened with the external mapping resource� The two windows are two-way synchronized by the center of the map (Pictometry and Google Map) such that when you pan or zoom in one of the windows, the map or Pictometry View re-centers to the current window center location� For Google Street View, there is a one-way synchronized such that changes in Google Street View (move along street or change view rotation) updates the viewer window centering and updates the perspective indicator location and rotation�
Note: This concept works better with dual screen running
Pictometry View
1. Search property by address or property ID or simply pan and zoom to a location of interest.
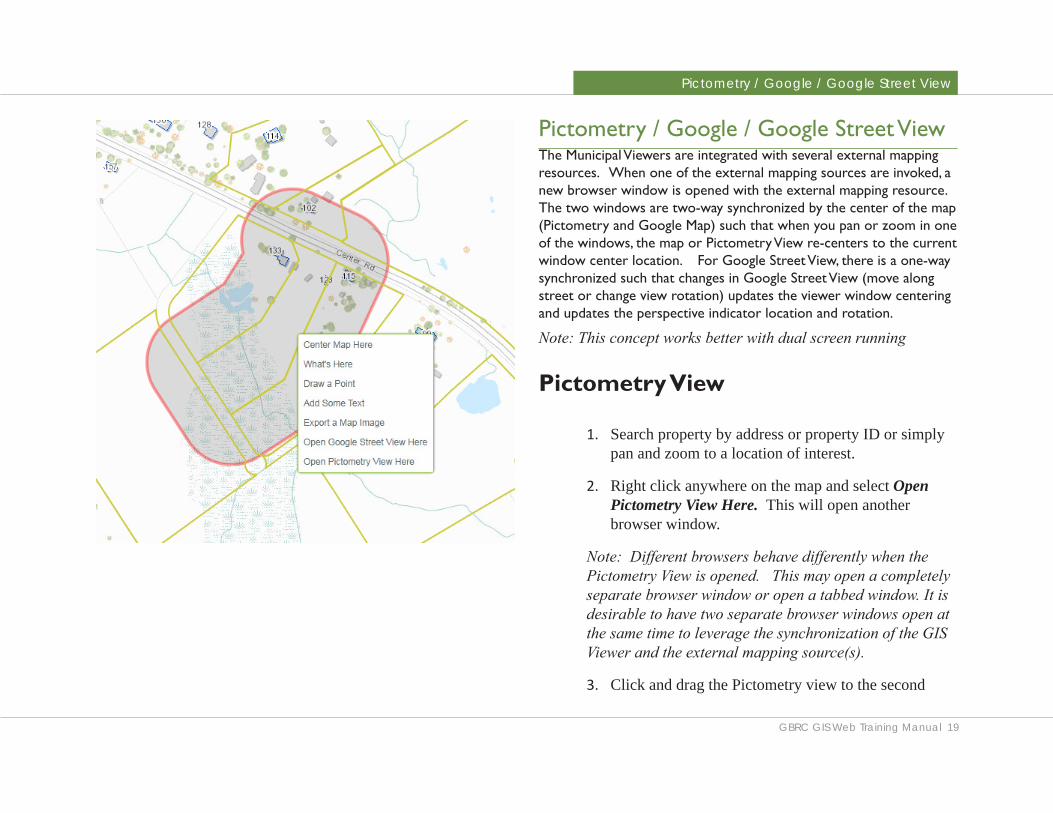
2. Right click anywhere on the map and select Open Pictometry View Here. This will open another browser window.
Note: Different browsers behave differently when the Pictometry View is opened. This may open a completely separate browser window or open a tabbed window. It is desirable to have two separate browser windows open at the same time to leverage the synchronization of the GIS Viewer and the external mapping source(s).
3. Click and drag the Pictometry view to the second

Pictometry / Google / Google Street View
GBRC GIS Web Training Manual 20
screen if you are using dual screens to view both the web viewer and pictometry side by side.
4. If you are using a single screen and the Pictometry View was launched in a Tab Window, right-click on the Pictometry View Tab and Select Move to New Window. Either re-size the both the GIS Viewer win-dow and the Pictometry View window to be viewable. Another option, with Windows 7, is to left-click and hold down the left-click button on the top of Pictom-etry View browser window, then drag the mouse to the far left or far right of the monitor until an outline appears in the left or right half of the monitor then re-lease the left-click button. The browser window (or other application windows) will automatically fill one half of your monitor. Do the same with GIS Viewer in the opposite side of the monitor.
5. With the mock dual monitor configuration set, pan within the map. The Pictometry View should move the and re-center at the same location as the center of the map.
6. The navigation within the Pictometry is primarily with the Pan tool. When you pan in the Pictometry View, the map will also re-adjust
based on the center point of the Pictometry View. If your mouse has a scroll wheel, you can zoom into the image by moving the scroll wheel forward and zoom out by moving the scroll wheel backwards.
Pictometry / Google / Google Street View
GBRC GIS Web Training Manual 21
7. Click the Image Date drop down arrow to access dif-ferent imagery available. Shortly, the default imagery will be from the Spring of 2015.
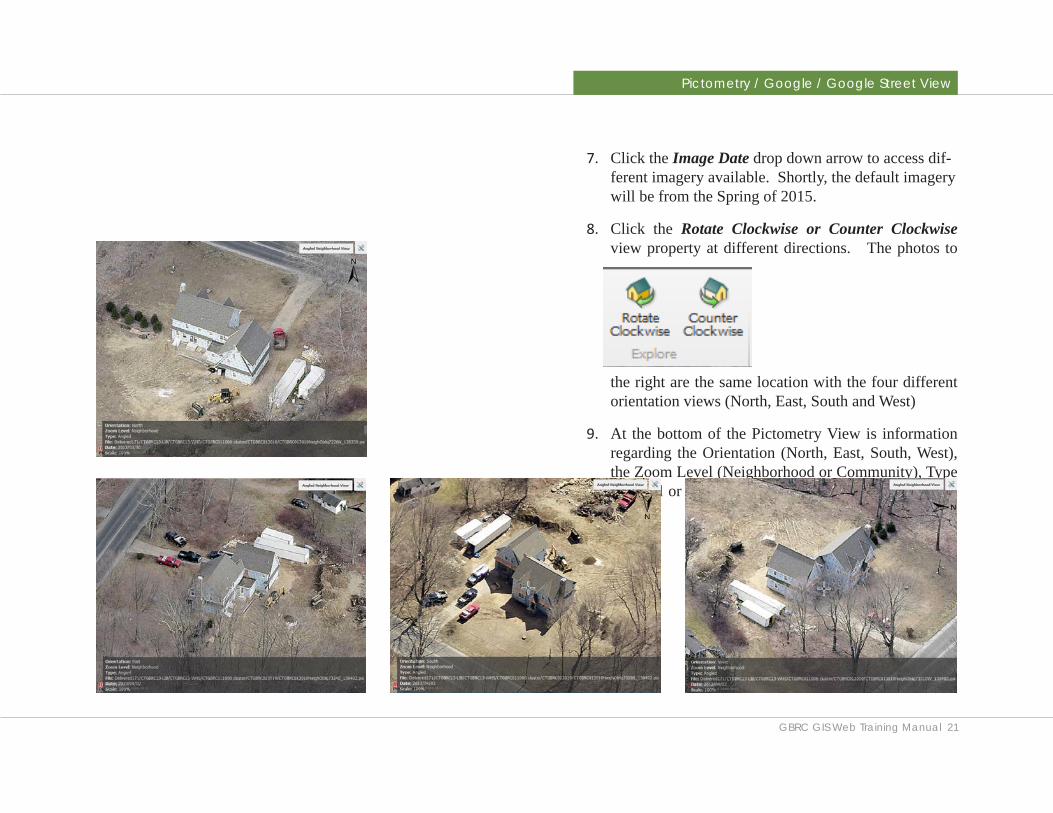
8. Click the Rotate Clockwise or Counter Clockwise view property at different directions. The photos to
the right are the same location with the four different orientation views (North, East, South and West)
9. At the bottom of the Pictometry View is information regarding the Orientation (North, East, South, West), the Zoom Level (Neighborhood or Community), Type (Angled or Top View), the Photo Date and the zoom Scale.
Pictometry / Google / Google Street View
GBRC GIS Web Training Manual 22
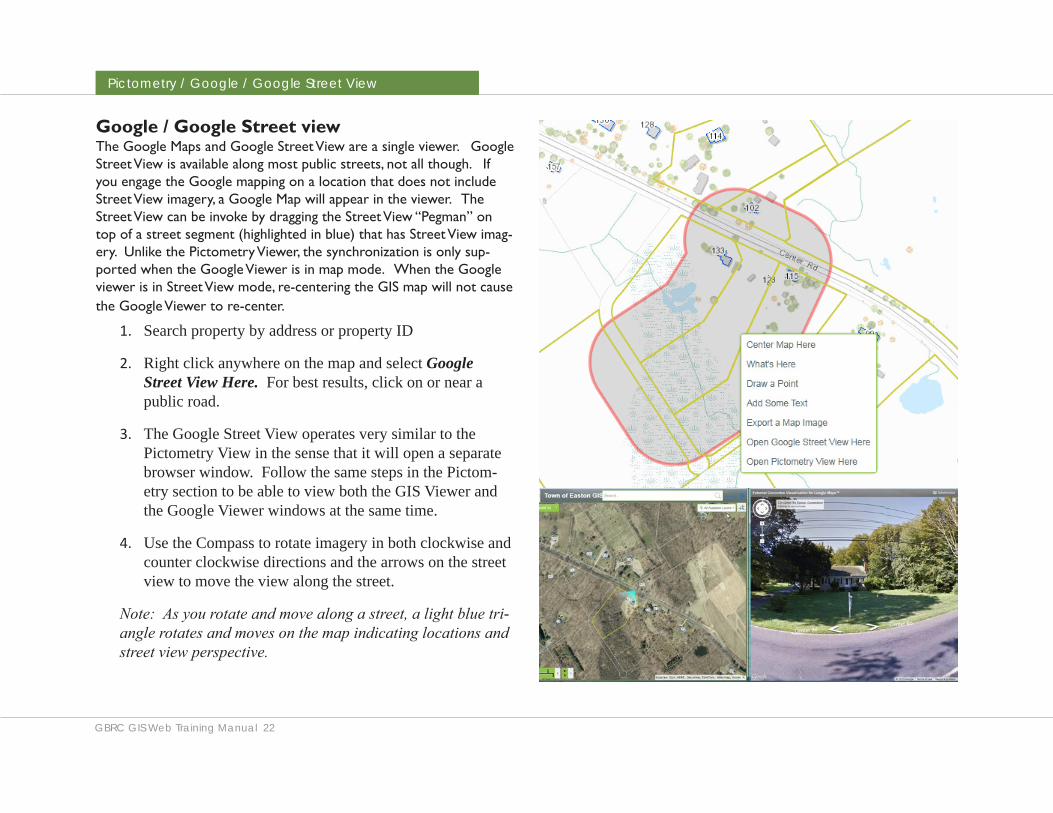
Google / Google Street viewThe Google Maps and Google Street View are a single viewer� Google Street View is available along most public streets, not all though� If you engage the Google mapping on a location that does not include Street View imagery, a Google Map will appear in the viewer� The Street View can be invoke by dragging the Street View “Pegman” on top of a street segment (highlighted in blue) that has Street View imag-ery� Unlike the Pictometry Viewer, the synchronization is only sup-ported when the Google Viewer is in map mode� When the Google viewer is in Street View mode, re-centering the GIS map will not cause the Google Viewer to re-center�
1. Search property by address or property ID
2. Right click anywhere on the map and select Google Street View Here. For best results, click on or near a public road.
3. The Google Street View operates very similar to the Pictometry View in the sense that it will open a separate browser window. Follow the same steps in the Pictom-etry section to be able to view both the GIS Viewer and the Google Viewer windows at the same time.
4. Use the Compass to rotate imagery in both clockwise and counter clockwise directions and the arrows on the street view to move the view along the street.
Note: As you rotate and move along a street, a light blue tri-angle rotates and moves on the map indicating locations and street view perspective.
Working with Map Layers
GBRC GIS Web Training Manual 23
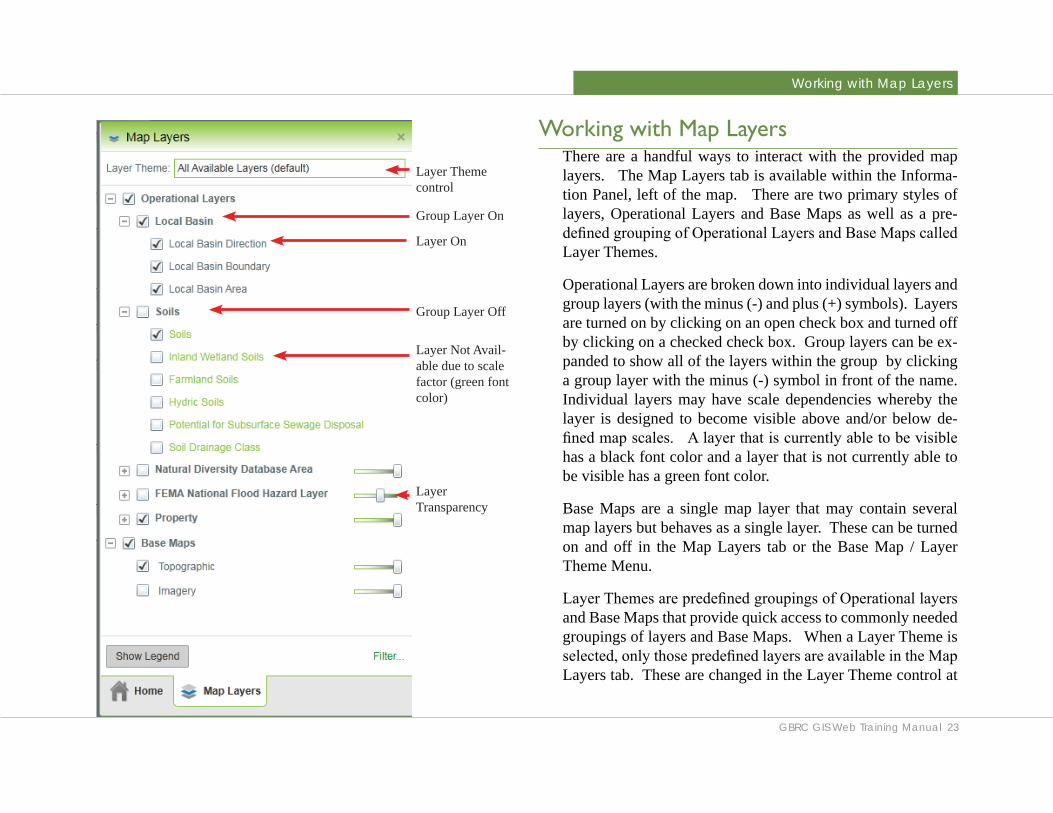
Working with Map LayersThere are a handful ways to interact with the provided map layers. The Map Layers tab is available within the Informa-tion Panel, left of the map. There are two primary styles of layers, Operational Layers and Base Maps as well as a pre-defined grouping of Operational Layers and Base Maps called Layer Themes.
Operational Layers are broken down into individual layers and group layers (with the minus (-) and plus (+) symbols). Layers are turned on by clicking on an open check box and turned off by clicking on a checked check box. Group layers can be ex-panded to show all of the layers within the group by clicking a group layer with the minus (-) symbol in front of the name. Individual layers may have scale dependencies whereby the layer is designed to become visible above and/or below de-fined map scales. A layer that is currently able to be visible has a black font color and a layer that is not currently able to be visible has a green font color.
Base Maps are a single map layer that may contain several map layers but behaves as a single layer. These can be turned on and off in the Map Layers tab or the Base Map / Layer Theme Menu.
Layer Themes are predefined groupings of Operational layers and Base Maps that provide quick access to commonly needed groupings of layers and Base Maps. When a Layer Theme is selected, only those predefined layers are available in the Map Layers tab. These are changed in the Layer Theme control at
Group Layer On
Group Layer Off
Layer On
Layer Not Avail-able due to scale factor (green font color)
Layer Theme control
Layer Transparency

Working with Map Layers
GBRC GIS Web Training Manual 24
the top of the Map Layers tab as well as within the Base Map / Layer Theme Menu.
Certain layers and group layers also have the ability to have the layer transparency to be adjusted by the end user. This allows underlying layers to be visible through the overlying layer.
1. Practice adjusting layer combinations.
2. Using the Base Map / Layer Themes menu, change the Base Map Topographic to Imagery (Aerial Photo).
3. Using the Base Map / Layer Themes menu, change the Layer Theme to any of the available categories.
4. Within the Map Layers tab, turn on or off individual layers and group layers.
5. Change the map scale and see the resulting changes in available layer visibility.
6. Turn on both the Topographic and Imagery Base Maps. Alter the top most Base Map transparency by selecting the transparency slider and moving it to the left and right to see the transparency effects.
Advanced Functions
GBRC GIS Web Training Manual 25
Advanced Functions
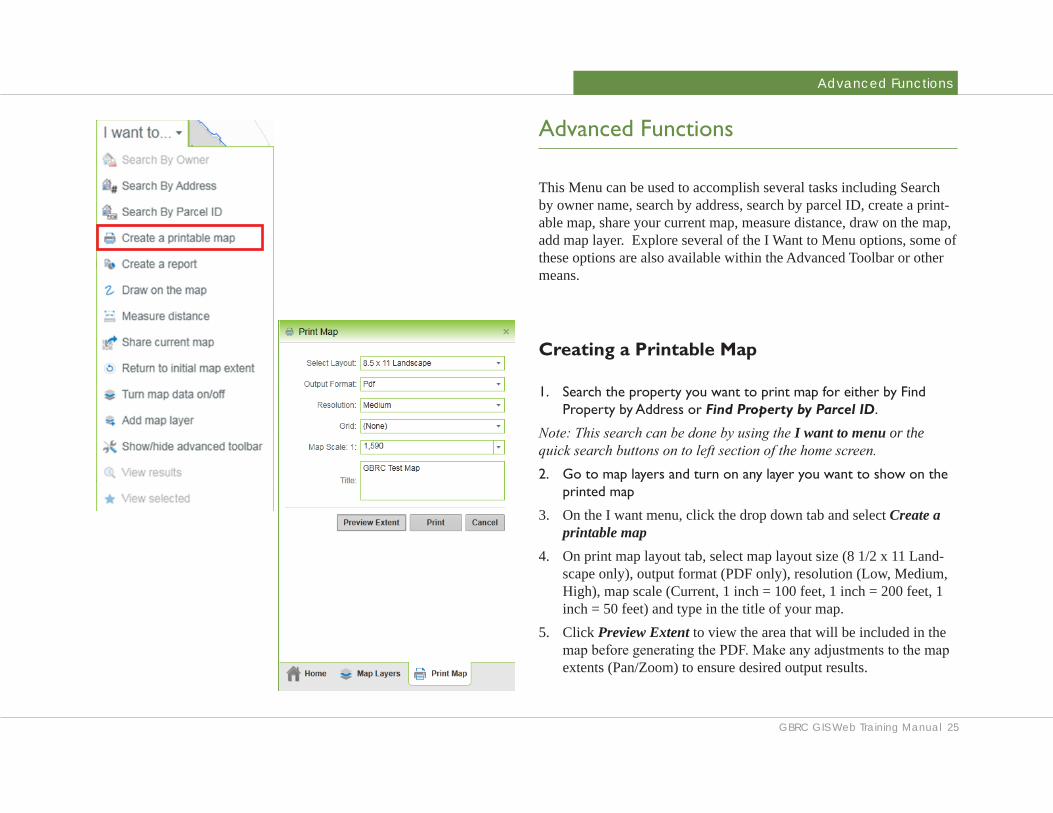
This Menu can be used to accomplish several tasks including Search by owner name, search by address, search by parcel ID, create a print-able map, share your current map, measure distance, draw on the map, add map layer. Explore several of the I Want to Menu options, some of these options are also available within the Advanced Toolbar or other means.
Creating a Printable Map
1� Search the property you want to print map for either by Find Property by Address or Find Property by Parcel ID�
Note: This search can be done by using the I want to menu or the quick search buttons on to left section of the home screen.2� Go to map layers and turn on any layer you want to show on the
printed map
3. On the I want menu, click the drop down tab and select Create a printable map
4. On print map layout tab, select map layout size (8 1/2 x 11 Land-scape only), output format (PDF only), resolution (Low, Medium, High), map scale (Current, 1 inch = 100 feet, 1 inch = 200 feet, 1 inch = 50 feet) and type in the title of your map.
5. Click Preview Extent to view the area that will be included in the map before generating the PDF. Make any adjustments to the map extents (Pan/Zoom) to ensure desired output results.
Advanced Functions
GBRC GIS Web Training Manual 26
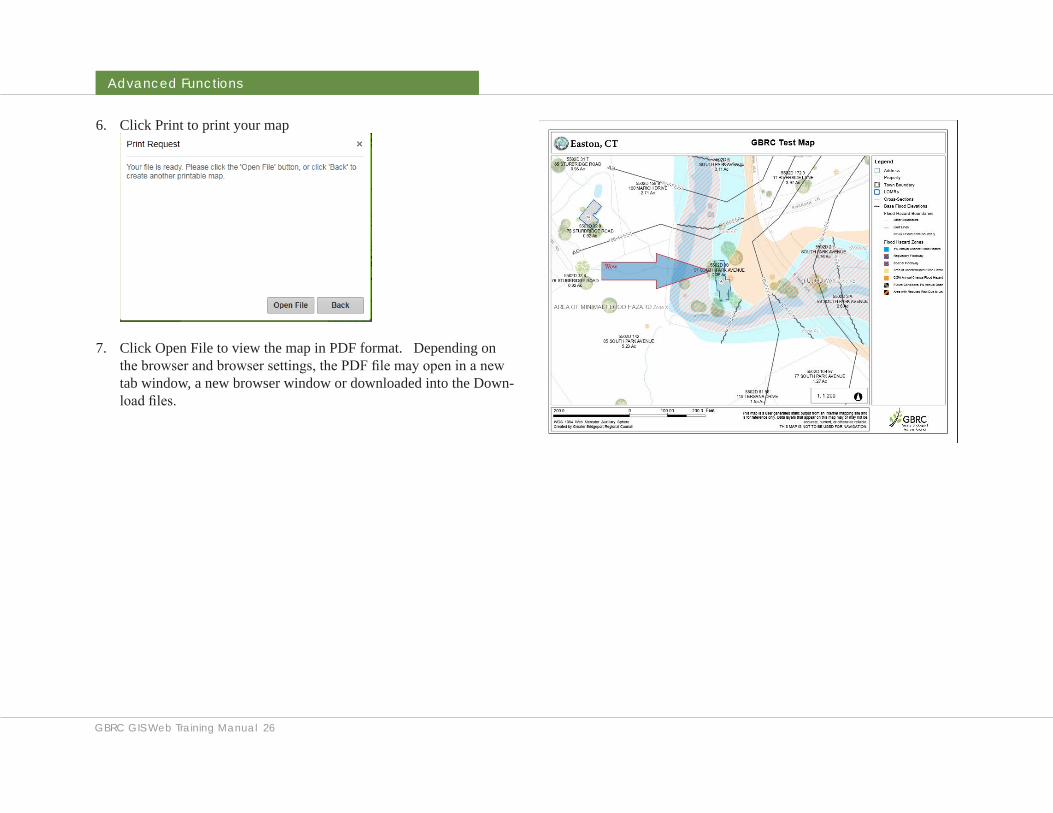
6. Click Print to print your map
7. Click Open File to view the map in PDF format. Depending on the browser and browser settings, the PDF file may open in a new tab window, a new browser window or downloaded into the Down-load files.
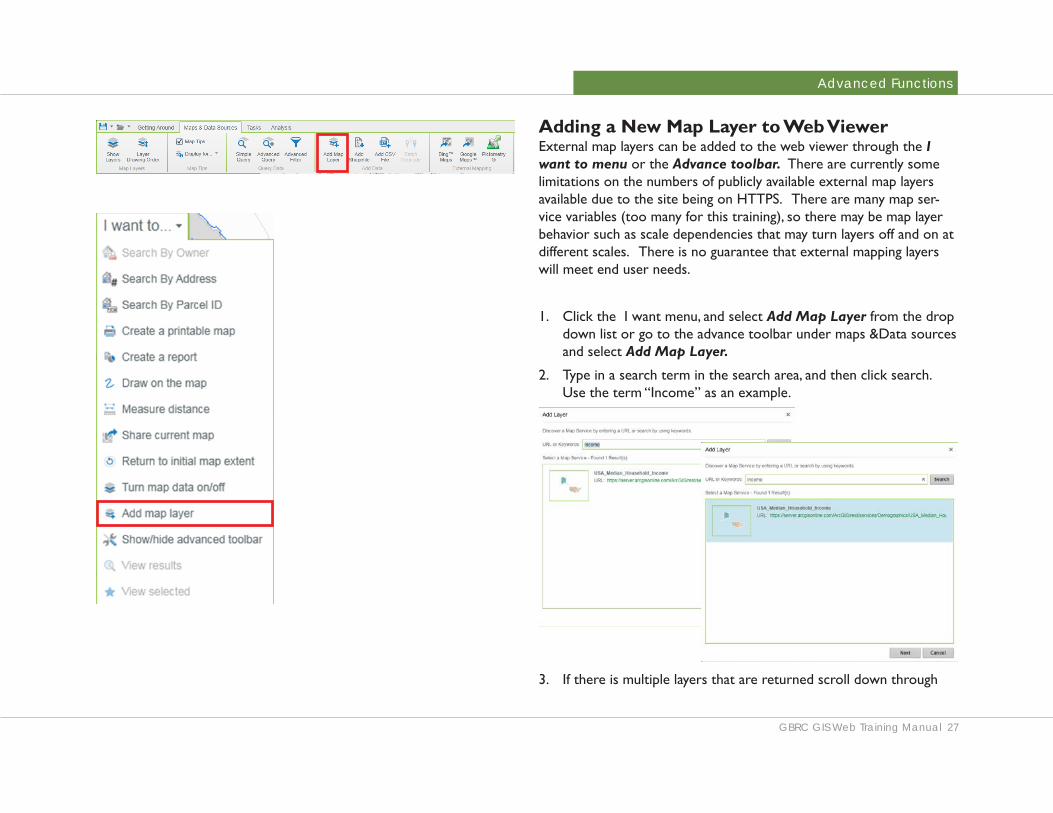
Advanced Functions
GBRC GIS Web Training Manual 27
Adding a New Map Layer to Web Viewer External map layers can be added to the web viewer through the I want to menu or the Advance toolbar. There are currently some limitations on the numbers of publicly available external map layers available due to the site being on HTTPS� There are many map ser-vice variables (too many for this training), so there may be map layer behavior such as scale dependencies that may turn layers off and on at different scales� There is no guarantee that external mapping layers will meet end user needs�
1� Click the I want menu, and select Add Map Layer from the drop down list or go to the advance toolbar under maps &Data sources and select Add Map Layer.
2� Type in a search term in the search area, and then click search� Use the term “Income” as an example�
3� If there is multiple layers that are returned scroll down through
Advanced Functions
GBRC GIS Web Training Manual 28
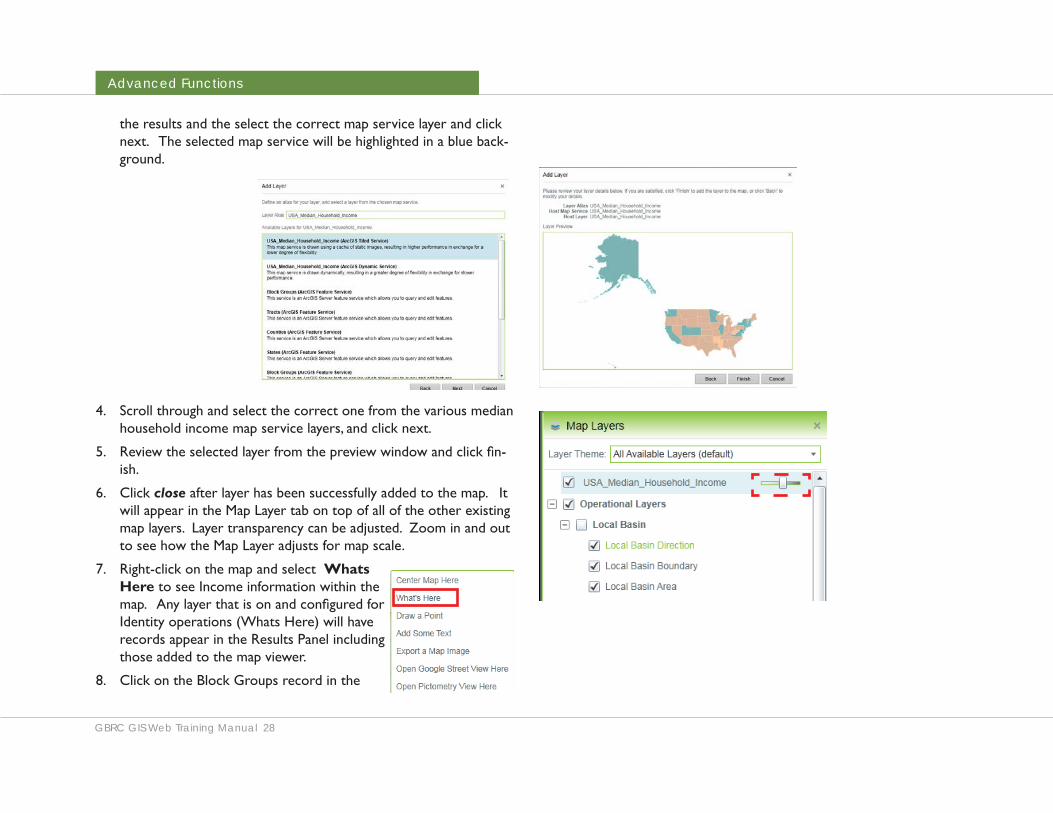
the results and the select the correct map service layer and click next� The selected map service will be highlighted in a blue back-ground�
4� Scroll through and select the correct one from the various median household income map service layers, and click next�
5� Review the selected layer from the preview window and click fin-ish�
6� Click close after layer has been successfully added to the map� It will appear in the Map Layer tab on top of all of the other existing map layers� Layer transparency can be adjusted� Zoom in and out to see how the Map Layer adjusts for map scale�
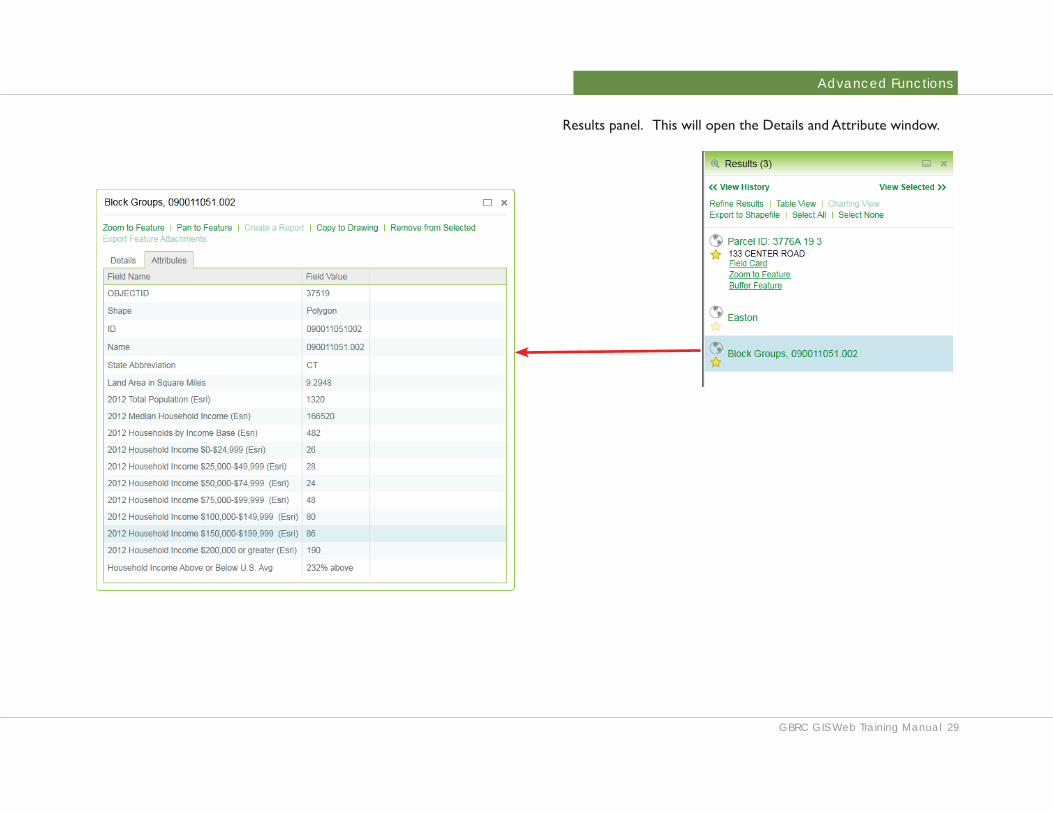
7� Right-click on the map and select Whats Here to see Income information within the map. Any layer that is on and configured for Identity operations (Whats Here) will have records appear in the Results Panel including those added to the map viewer�
8� Click on the Block Groups record in the
Advanced Functions
GBRC GIS Web Training Manual 29
Results panel� This will open the Details and Attribute window�
Advanced Functions
GBRC GIS Web Training Manual 30
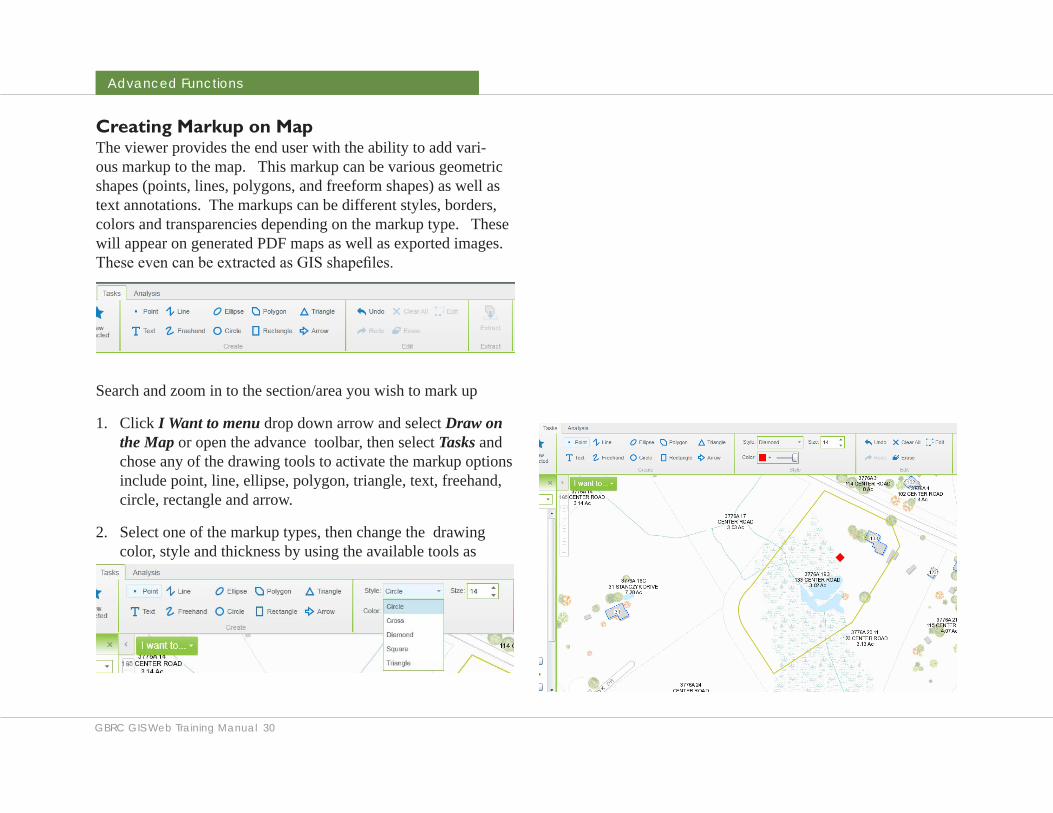
Creating Markup on MapThe viewer provides the end user with the ability to add vari-ous markup to the map. This markup can be various geometric shapes (points, lines, polygons, and freeform shapes) as well as text annotations. The markups can be different styles, borders, colors and transparencies depending on the markup type. These will appear on generated PDF maps as well as exported images. These even can be extracted as GIS shapefiles.
Search and zoom in to the section/area you wish to mark up
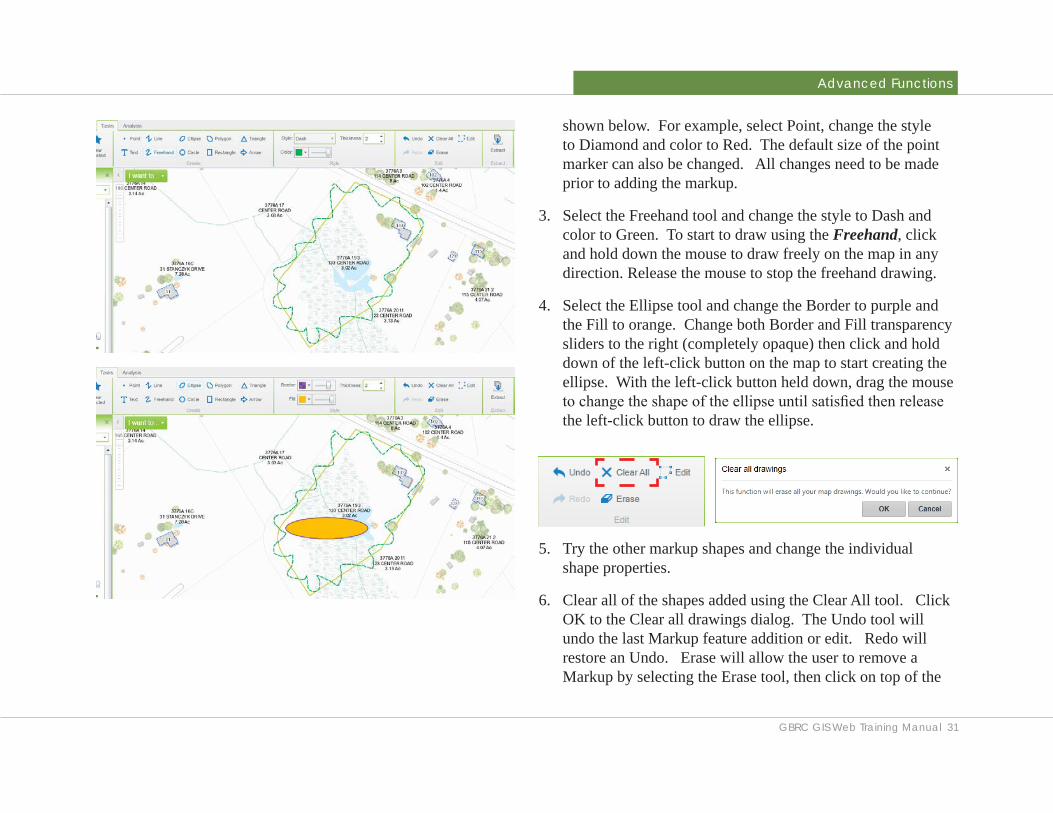
1. Click I Want to menu drop down arrow and select Draw on the Map or open the advance toolbar, then select Tasks and chose any of the drawing tools to activate the markup options include point, line, ellipse, polygon, triangle, text, freehand, circle, rectangle and arrow.
2. Select one of the markup types, then change the drawing color, style and thickness by using the available tools as
Advanced Functions
GBRC GIS Web Training Manual 31
shown below. For example, select Point, change the style to Diamond and color to Red. The default size of the point marker can also be changed. All changes need to be made prior to adding the markup.
3. Select the Freehand tool and change the style to Dash and color to Green. To start to draw using the Freehand, click and hold down the mouse to draw freely on the map in any direction. Release the mouse to stop the freehand drawing.
4. Select the Ellipse tool and change the Border to purple and the Fill to orange. Change both Border and Fill transparency sliders to the right (completely opaque) then click and hold down of the left-click button on the map to start creating the ellipse. With the left-click button held down, drag the mouse to change the shape of the ellipse until satisfied then release the left-click button to draw the ellipse.
5. Try the other markup shapes and change the individual shape properties.
6. Clear all of the shapes added using the Clear All tool. Click OK to the Clear all drawings dialog. The Undo tool will undo the last Markup feature addition or edit. Redo will restore an Undo. Erase will allow the user to remove a Markup by selecting the Erase tool, then click on top of the
Advanced Functions
GBRC GIS Web Training Manual 32
desired markup.
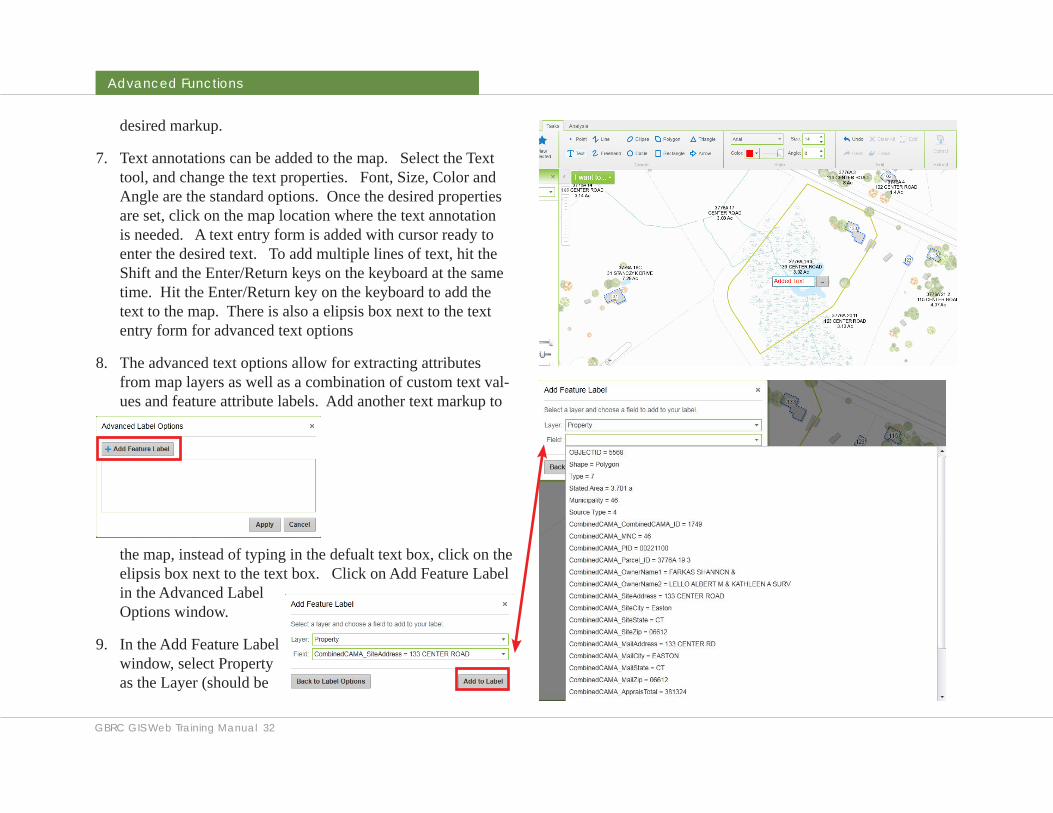
7. Text annotations can be added to the map. Select the Text tool, and change the text properties. Font, Size, Color and Angle are the standard options. Once the desired properties are set, click on the map location where the text annotation is needed. A text entry form is added with cursor ready to enter the desired text. To add multiple lines of text, hit the Shift and the Enter/Return keys on the keyboard at the same time. Hit the Enter/Return key on the keyboard to add the text to the map. There is also a elipsis box next to the text entry form for advanced text options
8. The advanced text options allow for extracting attributes from map layers as well as a combination of custom text val-ues and feature attribute labels. Add another text markup to
the map, instead of typing in the defualt text box, click on the elipsis box next to the text box. Click on Add Feature Label in the Advanced Label Options window.
9. In the Add Feature Label window, select Property as the Layer (should be
Advanced Functions
GBRC GIS Web Training Manual 33
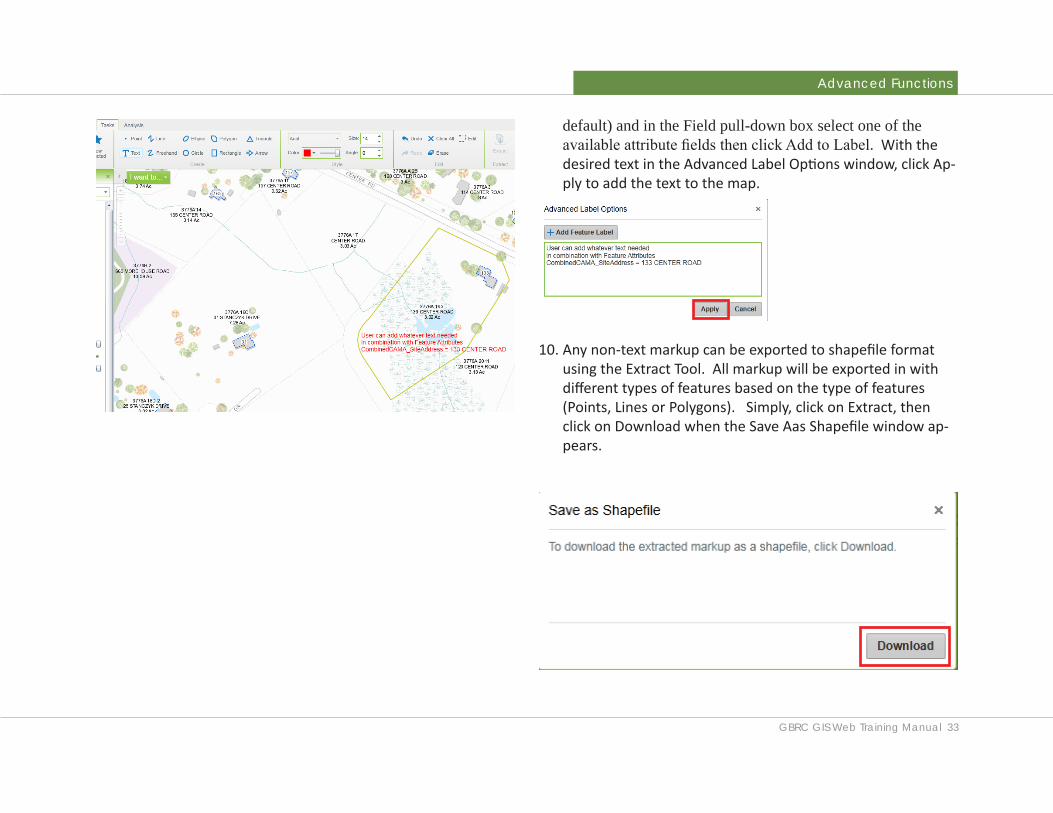
default) and in the Field pull-down box select one of the available attribute fields then click Add to Label. With the desired text in the Advanced Label Options window, click Ap-ply to add the text to the map.
10. Any non-text markup can be exported to shapefile format using the Extract Tool. All markup will be exported in with different types of features based on the type of features (Points, Lines or Polygons). Simply, click on Extract, then click on Download when the Save Aas Shapefile window ap-pears.
Advanced Functions
GBRC GIS Web Training Manual 34
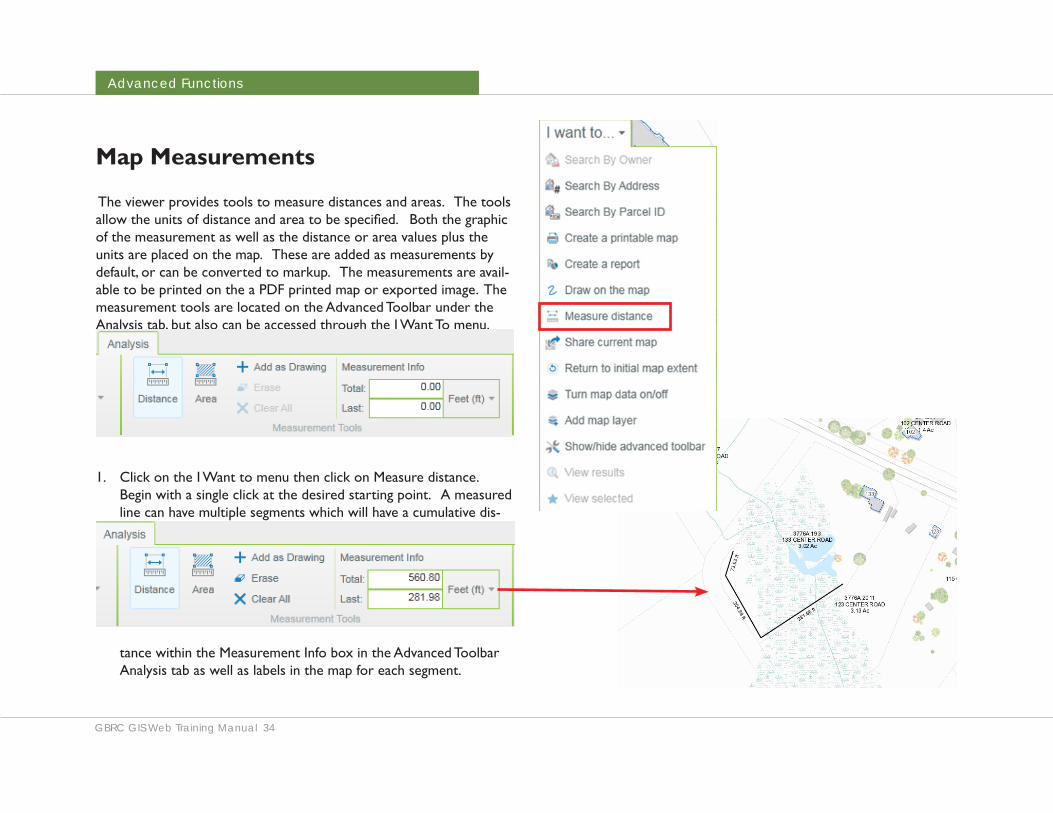
Map Measurements
The viewer provides tools to measure distances and areas� The tools allow the units of distance and area to be specified. Both the graphic of the measurement as well as the distance or area values plus the units are placed on the map� These are added as measurements by default, or can be converted to markup� The measurements are avail-able to be printed on the a PDF printed map or exported image� The measurement tools are located on the Advanced Toolbar under the Analysis tab, but also can be accessed through the I Want To menu�
1� Click on the I Want to menu then click on Measure distance� Begin with a single click at the desired starting point� A measured line can have multiple segments which will have a cumulative dis-
tance within the Measurement Info box in the Advanced Toolbar Analysis tab as well as labels in the map for each segment�
Advanced Functions
GBRC GIS Web Training Manual 35
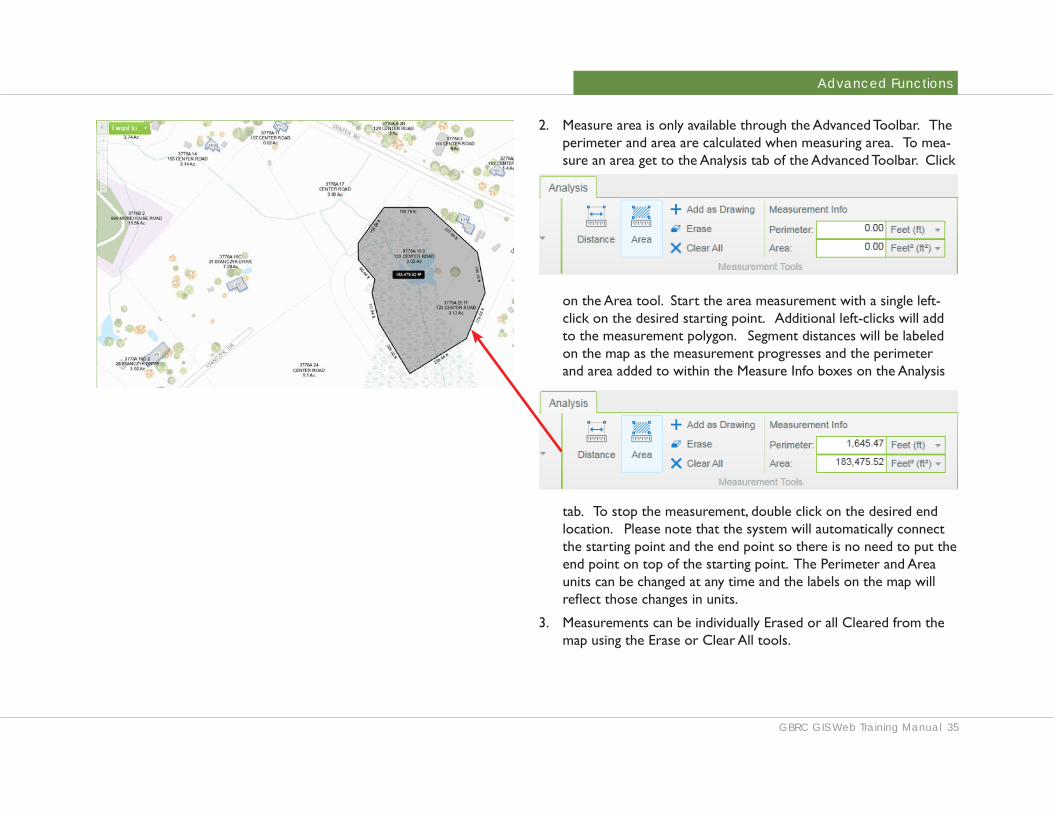
2� Measure area is only available through the Advanced Toolbar� The perimeter and area are calculated when measuring area� To mea-sure an area get to the Analysis tab of the Advanced Toolbar� Click
on the Area tool� Start the area measurement with a single left-click on the desired starting point� Additional left-clicks will add to the measurement polygon� Segment distances will be labeled on the map as the measurement progresses and the perimeter and area added to within the Measure Info boxes on the Analysis
tab� To stop the measurement, double click on the desired end location� Please note that the system will automatically connect the starting point and the end point so there is no need to put the end point on top of the starting point� The Perimeter and Area units can be changed at any time and the labels on the map will reflect those changes in units.
3� Measurements can be individually Erased or all Cleared from the map using the Erase or Clear All tools�
Funding Provided by the Office of Policy Management through the Regional Performance Incentive Pro-gram (RPIP) and State Grant in-Aid (SGIA) Program. For more infor-mation please contact:
Mark Goetz, GISPGIS DirectorGreater Bridgeport Regional Council525 Water StBridgeport, CT [email protected]