Embed Size (px)
Citation preview
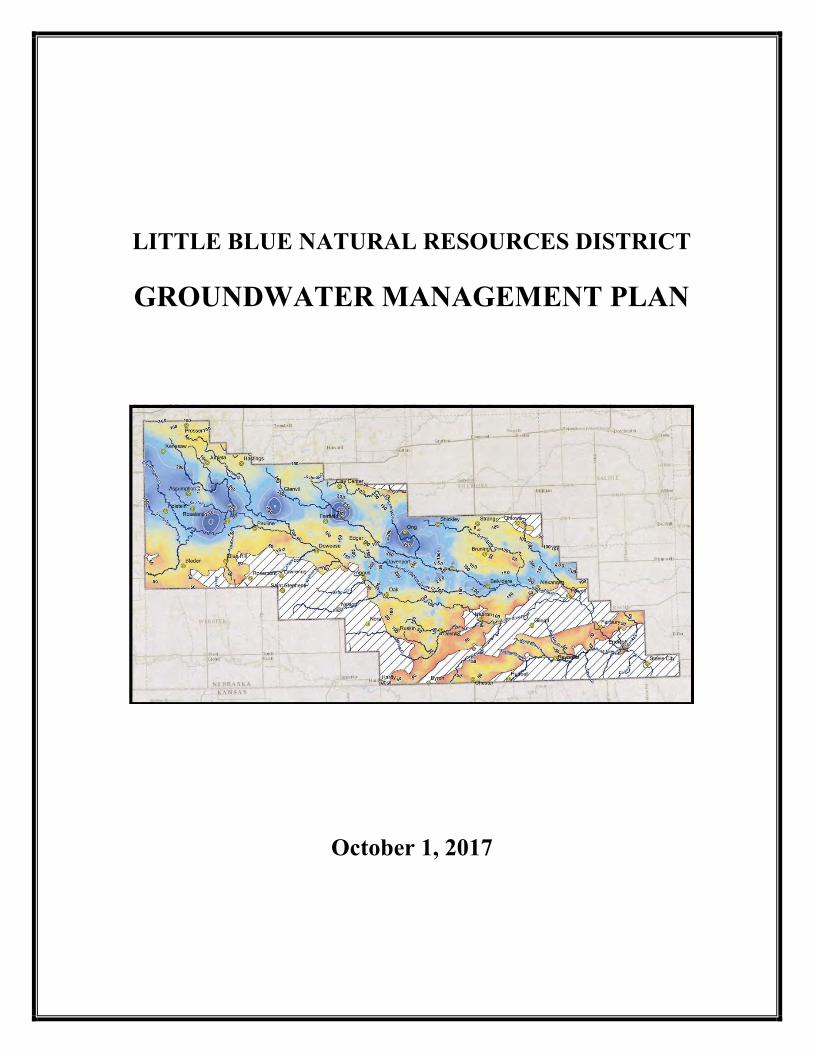
LITTLE BLUE NATURAL RESOURCES DISTRICT
GROUNDWATER MANAGEMENT PLAN
October 1, 2017
i
TABLE OF CONTENTS
1.0 INTRODUCTION
1.1 Purpose of Plan ………………………………………………………………………………..2 1.2 Statutory Authorities…………………………………………………………………………...2 1.3 Historical Water Planning and Activities Background………………………………………...3 1.4 LBNRD Groundwater Management Area…………………………………………………..…5 1.5 Land Use……………………………………………………………………………………….5
2.0 GROUNDWATER SUPPLIES AND GEOLOGY
2.1 Climate, Variations and Average Annual Precipitation……………………………………….6 2.2 Geologic Setting……………………………………………………………………………….8 2.3 Recharge Characteristics and Rates from Any Sources…………………………………........11 2.4 Available Supplemental Water Supplies & Opportunities for Groundwater Recharge…...….11 2.5 Past Supplemental Water Proposals…………………………………………………………..12 2.6 Sources of Supply - Opportunities to Integrate and Coordinate the Use of Water………...…13 2.7 Proposed Water Conservation and Supply Augmentation Programs………………………....13
3.0 DEMANDS FOR WATER
3.1 Groundwater Development and Use………………………………………………………….14 3.2 Surface Water Development and Use………………………………………………………...16 3.3 Crop Water Needs…………………………………………………………………………….16 3.4 LBNRD Population and Water Usage………………………………………………………..18 3.5 Fish and Wildlife Needs……………………………………………………………………....19 3.6 Existing Sub-irrigated Uses…………………………………………………………………...20 3.7 Relative Economic Value of Different Proposed or Existing Uses of Groundwater………....20
4.0 MONITORING
4.1 Current Groundwater Quantity Data Collection………………………………………….…..21 4.2 Groundwater Quantity Concerns………………………………………………………….….22 4.3 Current Groundwater Quality Data Collection ………………………….……………….…..24 4.4 Groundwater Quality Concerns……………………………………………………………....24 4.5 Groundwater Quality Programs and Activities………………………………………….…....27
5.0 GROUNDWATER MANAGEMENT OBJECTIVES
5.1 Current Water Conservation and Protection Activities in the Groundwater Management Area………………………………………………………………………………………...…..…28 5.2 Controls Proposed to Achieve Groundwater Reservoir Life Goal…………....……………...31
5.2.1 Groundwater Quality Triggers and Actions:………………………………………32 5.2.2 Groundwater Quantity Triggers and Actions……………………………………...32
5.3 Integrated Water Management Objectives…………………………………………………...33 6.0 REFERENCES 7.0 APPENDIX – LIST OF MAPS
1
1.0 INTRODUCTION
The Little Blue Natural Resources LBNRD (LBNRD) is a diverse District. It contains some of the most prolific groundwater wells in the state in those portions of the District which lie over the sand and gravel formation known as the High Plains Aquifer. In contrast, it also possesses areas where geology is completely different and virtually void of adequate groundwater, even for domestic water supply. Water, it is essential for everything we do. The natural resources districts (NRDs) have been given broad responsibilities to manage and protect groundwater resources through the passage of the Groundwater Management and Protection Act (Act) which was first signed into law in 1975. The law has been amended several times since adoption which directs the NRDs energy on specific water related problems and local resources needs. The intent and purpose of the Act is spelled out in State Statute 46-701 as follows:
“The Legislature finds that ownership of water is held by the state for the benefit of its citizens, that ground water is one of the most valuable natural resources in the state, and that an adequate supply of ground water is essential to the general welfare of the citizens of this state and to the present and future development of agriculture in the state. The Legislature recognizes its duty to define broad policy goals concerning the utilization and management of ground water and to ensure local implementation of those goals. The Legislature also finds that natural resources districts have the legal authority to regulate certain activities and, except as otherwise specifically provided by statute, as local entities are the preferred regulators of activities which may contribute to ground water depletion.”
“Every landowner shall be entitled to a reasonable and beneficial use of the ground water underlying his or her land subject to the provisions of Chapter 46, article 6, and the Nebraska Ground Water Management and Protection Act and the correlative rights of other landowners when the ground water supply is insufficient to meet the reasonable needs of all users. The Legislature determines that the goal shall be to extend ground water reservoir life to the greatest extent practicable consistent with reasonable and beneficial use of the ground water and best management practices.”
“The Legislature further recognizes and declares that the management, protection, and conservation of ground water and the reasonable and beneficial use thereof are essential to the economic prosperity and future well-being of the state and that the public interest demands procedures for the implementation of management practices to conserve and protect ground water supplies and to prevent the contamination or inefficient or improper use thereof.
“The Legislature recognizes the need to provide for orderly management systems in areas where management of ground water is necessary to achieve locally and regionally determined ground water management objectives and where available data, evidence, or other information indicates that present or potential ground water conditions, including sub-irrigation conditions, require the designation of areas with special regulation of development and use.”
October 1, 2017
2
1.1 Purpose of Plan Groundwater Management Plan (GMP) were mandated by Legislative Bill (LB) 1106 in 1984. The NRDs were charged with developing a comprehensive groundwater plan which focuses on water resources issues in each district, with those plans addressing the requirements spelled out in Nebraska Revised State Statutes (Neb. Rev. Stat.) § 46-709. The law required that the plans be reviewed and approved by the Nebraska Department of Natural Resources. The objectives of this Groundwater Management Plan (GMP) are to describe the water resources of the LBNRD, document the uses and demands on the resource, explain what measures are already in place to manage the resources and describe measures that the District will use in the future, should conditions dictate, to achieve the Reservoir Life Goal established by the LBNRD Board of Directors. The LBNRD is also updating the GMP to incorporate new hydrogeologic information and monitoring data which have been valuable in assessing the groundwater conditions and evaluating the direction of actions necessary to protect the resources for future generations.
1.2 Statutory Authorities
The Statutory authority for Groundwater Management Plans is dictated by Neb. Rev. Stat. § 46-709, which states:
Each district shall maintain a ground water management plan based upon the best available information and shall submit amendments to such plan to the Director of Natural Resources for review and approval.
The plan shall include, but not be limited to, the identification to the extent possible of:
(1) Ground water supplies within the district including transmissivity, saturated thickness maps, and other ground water reservoir information, if available;
(2) Local recharge characteristics and rates from any sources, if available;
(3) Average annual precipitation and the variations within the district;
(4) Crop water needs within the district;
(5) Current ground water data-collection programs;
(6) Past, present, and potential ground water use within the district;
(7) Ground water quality concerns within the district;
(8) Proposed water conservation and supply augmentation programs for the district;
(9) The availability of supplemental water supplies, including the opportunity for ground water recharge;
(10) The opportunity to integrate and coordinate the use of water from different sources of supply;
(11) Ground water management objectives, including a proposed ground water reservoir life goal for the district. For management plans adopted or revised after July 19, 1996, the ground water
October 1, 2017
3
management objectives may include any proposed integrated management objectives for hydrologically connected ground water and surface water supplies but a management plan does not have to be revised prior to the adoption or implementation of an integrated management plan pursuant to section 46-718 or 46-719;
(12) Existing subirrigation uses within the district;
(13) The relative economic value of different uses of ground water proposed or existing within the district; and
(14) The geographic and stratigraphic boundaries of any proposed management area.
Each district's ground water management plan shall also identify, to the extent possible, the levels and sources of ground water contamination within the district, ground water quality goals, long-term solutions necessary to prevent the levels of ground water contaminants from becoming too high and to reduce high levels sufficiently to eliminate health hazards, and practices recommended to stabilize, reduce, and prevent the occurrence, increase, or spread of ground water contamination.
1.3 Historical Water Planning and Activities Background The formation of natural resources districts in 1972 commenced a locally driven process for the management of natural resources. The Legislative authorities granted to districts included powers to manage water supply for any beneficial uses, and the development, management, utilization and conservation of ground water and surface water. Over the years, the legislature has refined those authorities giving specific powers to the districts to address evolving water related issues. As mentioned above, LB 577 established the Nebraska Groundwater Management Act in 1975 which gave districts authority to regulate irrigation runoff, conduct specific groundwater protection activities, and establish groundwater control areas in locations where declines in water levels were of concern. Due to consistent groundwater declines that were occurring in the LBNRD from the late 1950s through the 1970s’, and modeling work conducted by the then Nebraska Natural Resources Commission which projected continued and significant groundwater depletions across the District, the LBNRD Board took action to create a Groundwater Control Area (GCA) on January 2, 1979. The GCA included much of the principal aquifer of the LBNRD north of the Little Blue River and extended from approximately Bruning to Roseland. GCA rules were developed which identified calendar triggers and established plans for allocating groundwater to users. However, getting all wells equipped with meters and establishing the records to verify certified irrigated acres was a monumental task and allocations were delayed until 1985. At that time, groundwater levels had rebounded some and the LBNRD Board decided to delay the allocation schedule to see if the upward trend continued. In 1984, LB 1106 passed by the Nebraska Legislature established a requirement that the districts prepare a Groundwater Management Plan based upon the best available information, describing the groundwater resources of each district and outlining a strategy to protect and conserve those resources. In response to this mandate, the LBNRD adopted its first Groundwater Management Plan in 1986 specifically addressing water quantity issues. The Act at that time was renamed the Nebraska Groundwater Management and Protection Act.
October 1, 2017
4
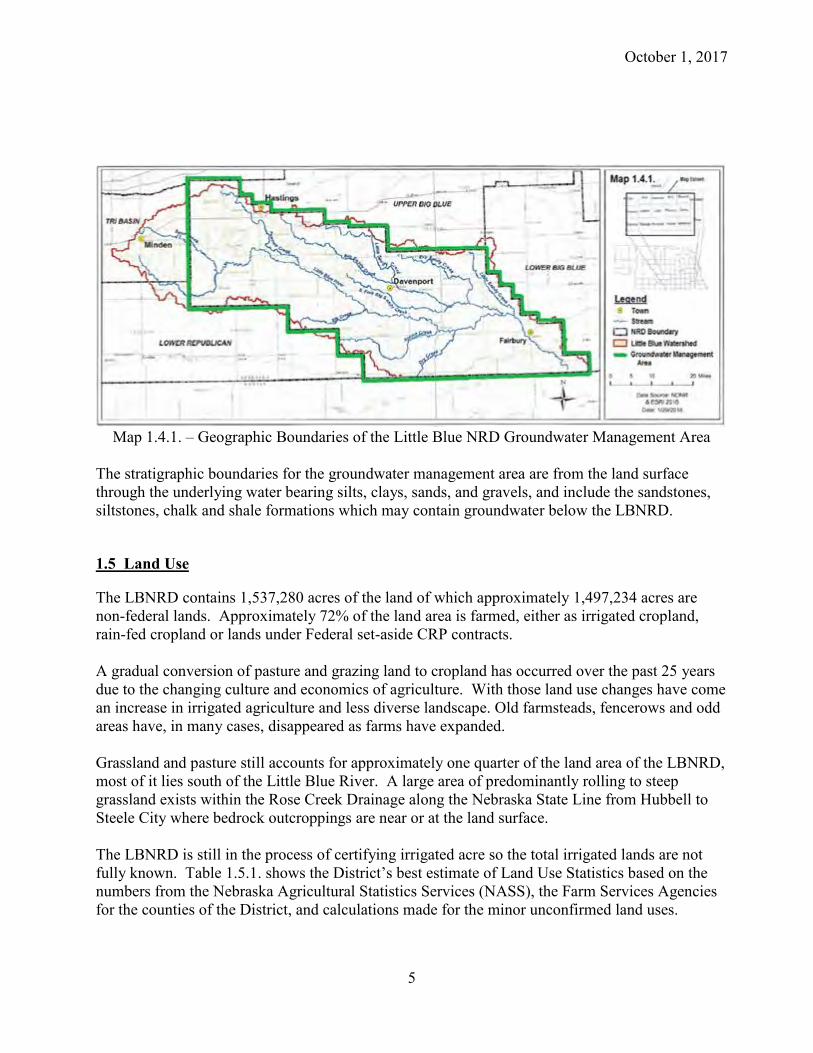
In 1991, LB 51 granted districts the additional responsibility to identify and address groundwater quality problems related to non-point source pollution. The law also allowed districts the option of establishing groundwater management areas for water related issues. In 1992, a problem with the LBNRD’s method of calculating water levels for initiating groundwater allocations, negated water level information which would have caused the implementing of allocations in 1993. As a result, the LBNRD Board opted to rewrite its groundwater rules and pursue a broader groundwater management area; the GCA was dissolved. The original Groundwater Management Plan was revised in 1994 to outline a strategy for dealing with water quantity and quality issues that were evolving in the LBNRD. On January 1, 1997, a district-wide groundwater management area was established, placing both groundwater quantity and quality measures in force across the LBNRD. From a groundwater quantity perspective, those requirements included well permits for all high capacity water wells and establishment of triggers which, if met, would dictate further groundwater quantity controls. Groundwater quality triggers were specified by the LBNRD Board and a process was established to determine water quality sub-areas boundaries and the actions to be implemented in affected sub-areas if the triggers were met. The LBNRD Board also established a restriction on agronomic nitrogen fertilizer applications prior to November 1st of each year. LB 962 was adopted in 2004 which authorized the Nebraska Department of Natural Resources (NeDNR) to conduct an evaluation of each river basin in the state to determine if the water supply for interconnected surface and groundwater was fully appropriated, or over appropriated. If such a determination were made, the NeDNR would work cooperatively with the natural resources districts involved in the basin to develop plans to manage the interconnected water supplies. (The lands of the Little Blue NRD have not been determined to be fully appropriated in past evaluations by the State.) The law was further revised in 2010 through LB 964 to allow natural resources districts in a basin which had not been determined to be fully appropriated or designated over appropriated, to develop a voluntary integrated water management plan jointly with the NeDNR. The groundwater management plan was further amended in 2005 when the LBNRD Board sought to revise the document to allow the enforcement of a high-capacity water well and acre expansion stay in an isolated paleovalley portion of the District and make minor changes to the triggers to further protect that area of the stay. 1.4 LBNRD Groundwater Management Area The Groundwater Management Area of the LBNRD was officially formed on January 1, 1997 and encompasses all the 2,402 square miles of land. The LBNRD is made up of portions of seven counties: Adams, Clay, Fillmore, Jefferson, Nuckolls, Thayer and Webster Counties. The boundaries of the LBNRD which follow the approximate boundary of the Little Blue River Basin, with the exception of those lands of the Little Blue River Basin which lie in extreme northeast Franklin County and eastern Kearney County, Nebraska. (See Map 1.4.1. on next page.) The Little Blue River Basin is bounded by the Republican River Basin to the south, Platte River to the northwest and Big Blue River Basin to the north and east.
October 1, 2017
5
Map 1.4.1. – Geographic Boundaries of the Little Blue NRD Groundwater Management Area
The stratigraphic boundaries for the groundwater management area are from the land surface through the underlying water bearing silts, clays, sands, and gravels, and include the sandstones, siltstones, chalk and shale formations which may contain groundwater below the LBNRD.
1.5 Land Use
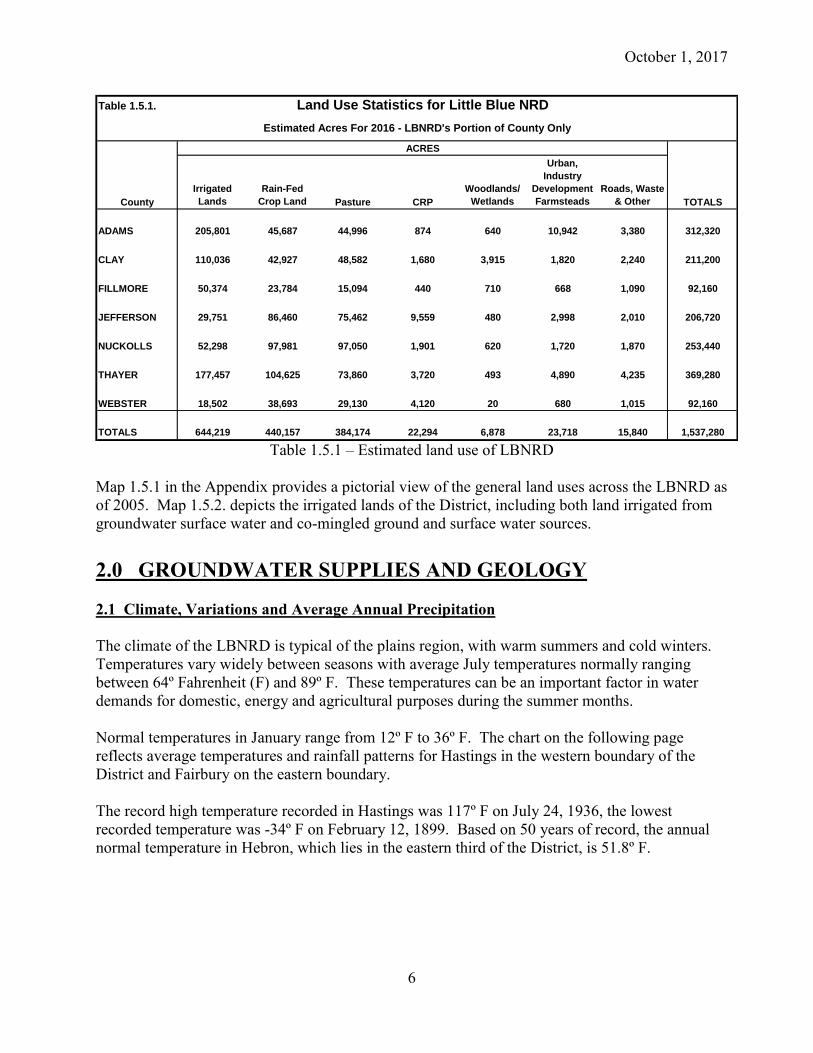
The LBNRD contains 1,537,280 acres of the land of which approximately 1,497,234 acres are non-federal lands. Approximately 72% of the land area is farmed, either as irrigated cropland, rain-fed cropland or lands under Federal set-aside CRP contracts. A gradual conversion of pasture and grazing land to cropland has occurred over the past 25 years due to the changing culture and economics of agriculture. With those land use changes have come an increase in irrigated agriculture and less diverse landscape. Old farmsteads, fencerows and odd areas have, in many cases, disappeared as farms have expanded. Grassland and pasture still accounts for approximately one quarter of the land area of the LBNRD, most of it lies south of the Little Blue River. A large area of predominantly rolling to steep grassland exists within the Rose Creek Drainage along the Nebraska State Line from Hubbell to Steele City where bedrock outcroppings are near or at the land surface. The LBNRD is still in the process of certifying irrigated acre so the total irrigated lands are not fully known. Table 1.5.1. shows the District’s best estimate of Land Use Statistics based on the numbers from the Nebraska Agricultural Statistics Services (NASS), the Farm Services Agencies for the counties of the District, and calculations made for the minor unconfirmed land uses.
October 1, 2017
6
Table 1.5.1.
ACRES
County
Irrigated
Lands
Rain-Fed
Crop Land Pasture CRP
Woodlands/
Wetlands
Urban,
Industry
Development
Farmsteads
Roads, Waste
& Other TOTALS
ADAMS 205,801 45,687 44,996 874 640 10,942 3,380 312,320
CLAY 110,036 42,927 48,582 1,680 3,915 1,820 2,240 211,200
FILLMORE 50,374 23,784 15,094 440 710 668 1,090 92,160
JEFFERSON 29,751 86,460 75,462 9,559 480 2,998 2,010 206,720
NUCKOLLS 52,298 97,981 97,050 1,901 620 1,720 1,870 253,440
THAYER 177,457 104,625 73,860 3,720 493 4,890 4,235 369,280
WEBSTER 18,502 38,693 29,130 4,120 20 680 1,015 92,160
TOTALS 644,219 440,157 384,174 22,294 6,878 23,718 15,840 1,537,280
Estimated Acres For 2016 - LBNRD's Portion of County Only
Land Use Statistics for Little Blue NRD
Table 1.5.1 – Estimated land use of LBNRD
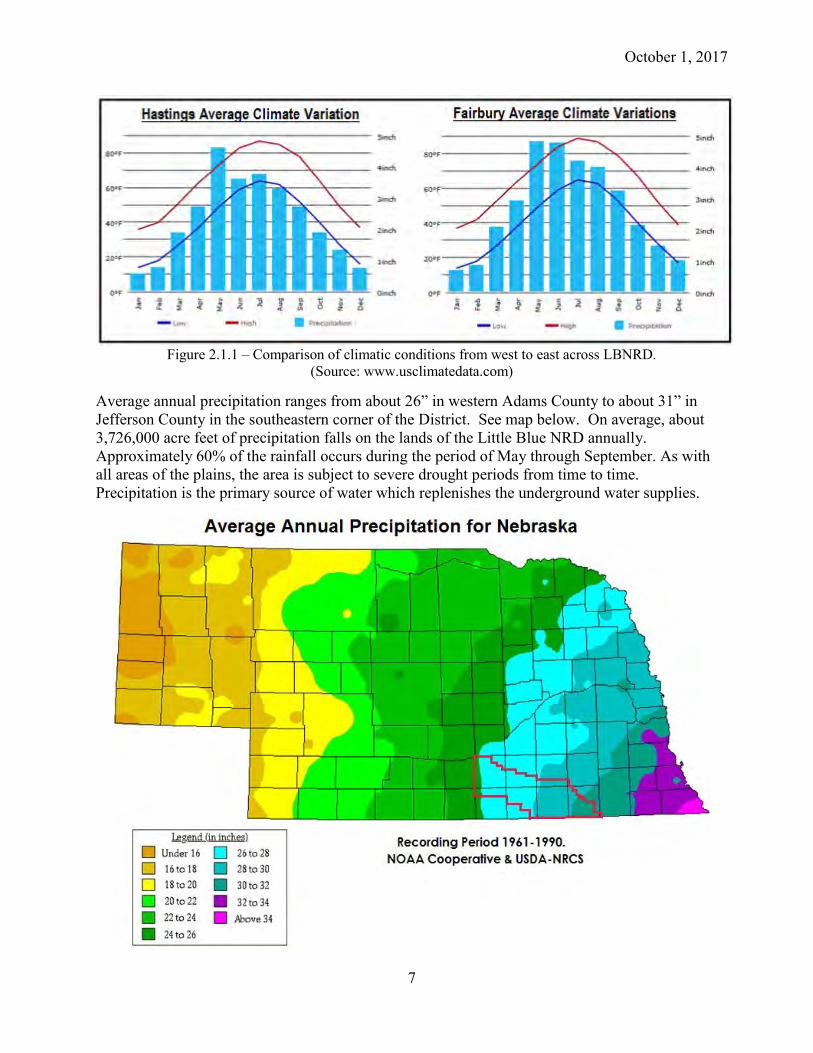
Map 1.5.1 in the Appendix provides a pictorial view of the general land uses across the LBNRD as of 2005. Map 1.5.2. depicts the irrigated lands of the District, including both land irrigated from groundwater surface water and co-mingled ground and surface water sources. 2.0 GROUNDWATER SUPPLIES AND GEOLOGY 2.1 Climate, Variations and Average Annual Precipitation The climate of the LBNRD is typical of the plains region, with warm summers and cold winters. Temperatures vary widely between seasons with average July temperatures normally ranging between 64º Fahrenheit (F) and 89º F. These temperatures can be an important factor in water demands for domestic, energy and agricultural purposes during the summer months. Normal temperatures in January range from 12º F to 36º F. The chart on the following page reflects average temperatures and rainfall patterns for Hastings in the western boundary of the District and Fairbury on the eastern boundary. The record high temperature recorded in Hastings was 117º F on July 24, 1936, the lowest recorded temperature was -34º F on February 12, 1899. Based on 50 years of record, the annual normal temperature in Hebron, which lies in the eastern third of the District, is 51.8º F.
October 1, 2017
7
Figure 2.1.1 – Comparison of climatic conditions from west to east across LBNRD.
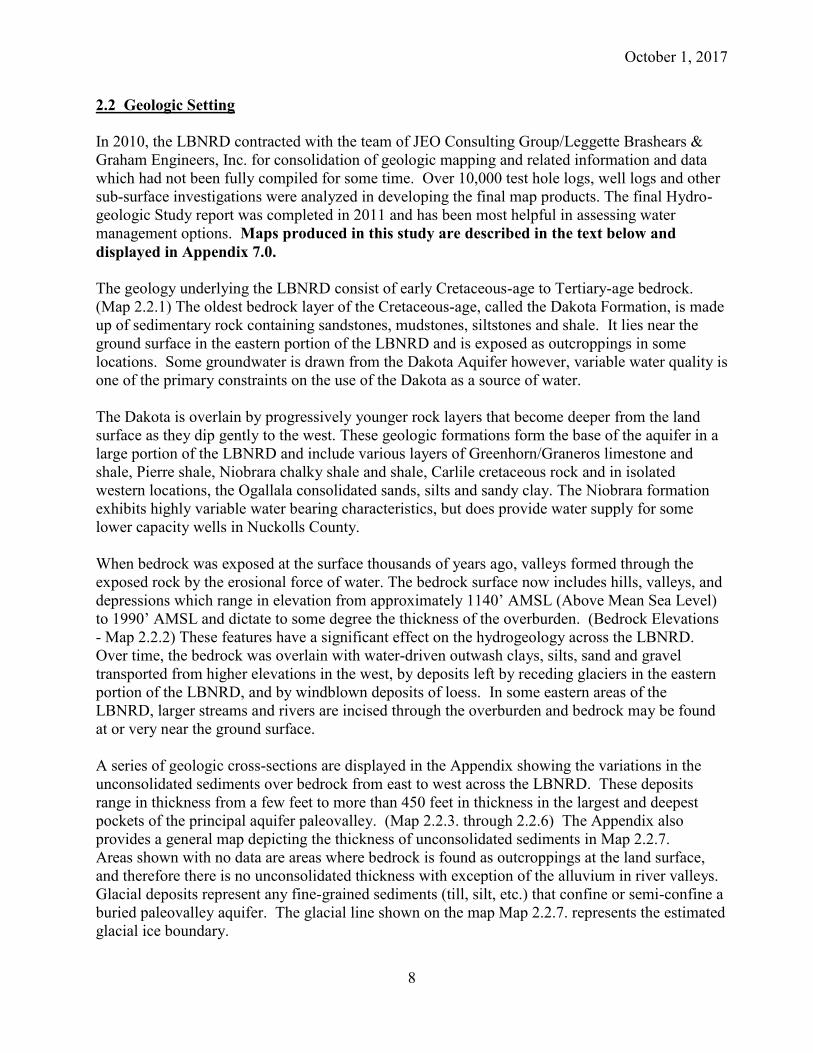
(Source: www.usclimatedata.com) Average annual precipitation ranges from about 26” in western Adams County to about 31” in Jefferson County in the southeastern corner of the District. See map below. On average, about 3,726,000 acre feet of precipitation falls on the lands of the Little Blue NRD annually. Approximately 60% of the rainfall occurs during the period of May through September. As with all areas of the plains, the area is subject to severe drought periods from time to time. Precipitation is the primary source of water which replenishes the underground water supplies.
October 1, 2017
8
2.2 Geologic Setting In 2010, the LBNRD contracted with the team of JEO Consulting Group/Leggette Brashears & Graham Engineers, Inc. for consolidation of geologic mapping and related information and data which had not been fully compiled for some time. Over 10,000 test hole logs, well logs and other sub-surface investigations were analyzed in developing the final map products. The final Hydro-geologic Study report was completed in 2011 and has been most helpful in assessing water management options. Maps produced in this study are described in the text below and displayed in Appendix 7.0. The geology underlying the LBNRD consist of early Cretaceous-age to Tertiary-age bedrock. (Map 2.2.1) The oldest bedrock layer of the Cretaceous-age, called the Dakota Formation, is made up of sedimentary rock containing sandstones, mudstones, siltstones and shale. It lies near the ground surface in the eastern portion of the LBNRD and is exposed as outcroppings in some locations. Some groundwater is drawn from the Dakota Aquifer however, variable water quality is one of the primary constraints on the use of the Dakota as a source of water. The Dakota is overlain by progressively younger rock layers that become deeper from the land surface as they dip gently to the west. These geologic formations form the base of the aquifer in a large portion of the LBNRD and include various layers of Greenhorn/Graneros limestone and shale, Pierre shale, Niobrara chalky shale and shale, Carlile cretaceous rock and in isolated western locations, the Ogallala consolidated sands, silts and sandy clay. The Niobrara formation exhibits highly variable water bearing characteristics, but does provide water supply for some lower capacity wells in Nuckolls County. When bedrock was exposed at the surface thousands of years ago, valleys formed through the exposed rock by the erosional force of water. The bedrock surface now includes hills, valleys, and depressions which range in elevation from approximately 1140’ AMSL (Above Mean Sea Level) to 1990’ AMSL and dictate to some degree the thickness of the overburden. (Bedrock Elevations - Map 2.2.2) These features have a significant effect on the hydrogeology across the LBNRD. Over time, the bedrock was overlain with water-driven outwash clays, silts, sand and gravel transported from higher elevations in the west, by deposits left by receding glaciers in the eastern portion of the LBNRD, and by windblown deposits of loess. In some eastern areas of the LBNRD, larger streams and rivers are incised through the overburden and bedrock may be found at or very near the ground surface. A series of geologic cross-sections are displayed in the Appendix showing the variations in the unconsolidated sediments over bedrock from east to west across the LBNRD. These deposits range in thickness from a few feet to more than 450 feet in thickness in the largest and deepest pockets of the principal aquifer paleovalley. (Map 2.2.3. through 2.2.6) The Appendix also provides a general map depicting the thickness of unconsolidated sediments in Map 2.2.7. Areas shown with no data are areas where bedrock is found as outcroppings at the land surface, and therefore there is no unconsolidated thickness with exception of the alluvium in river valleys. Glacial deposits represent any fine-grained sediments (till, silt, etc.) that confine or semi-confine a buried paleovalley aquifer. The glacial line shown on the map Map 2.2.7. represents the estimated glacial ice boundary.
October 1, 2017
9
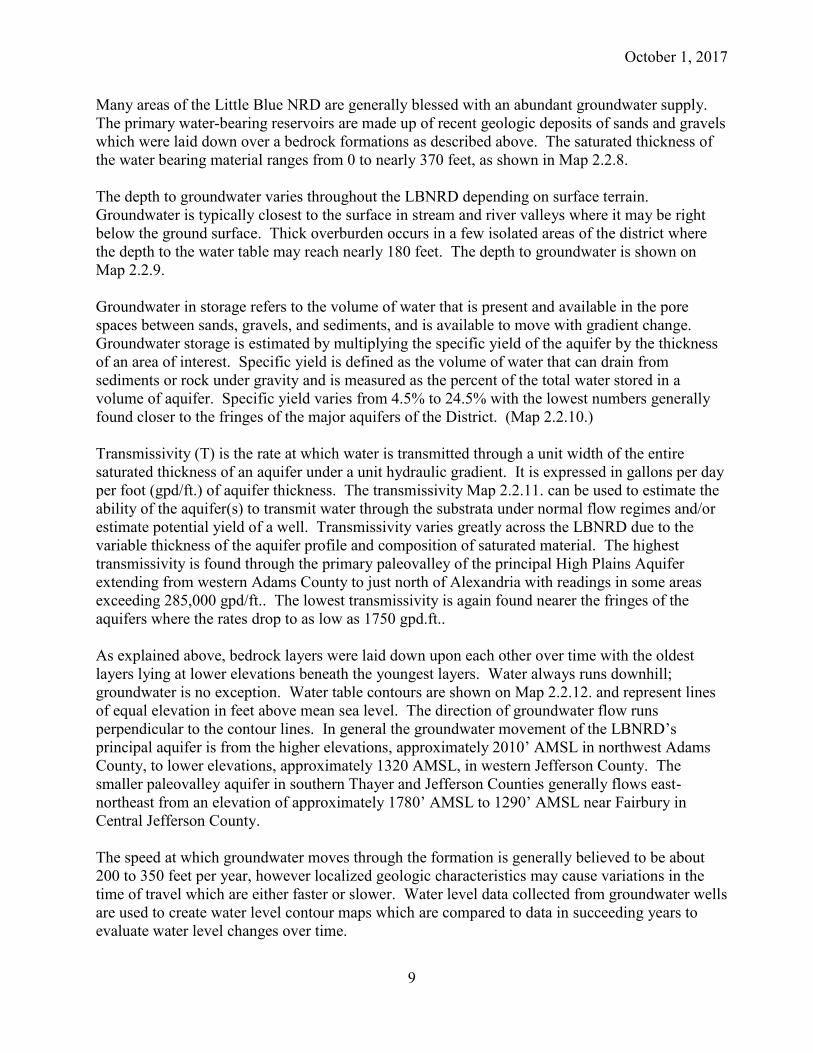
Many areas of the Little Blue NRD are generally blessed with an abundant groundwater supply. The primary water-bearing reservoirs are made up of recent geologic deposits of sands and gravels which were laid down over a bedrock formations as described above. The saturated thickness of the water bearing material ranges from 0 to nearly 370 feet, as shown in Map 2.2.8. The depth to groundwater varies throughout the LBNRD depending on surface terrain. Groundwater is typically closest to the surface in stream and river valleys where it may be right below the ground surface. Thick overburden occurs in a few isolated areas of the district where the depth to the water table may reach nearly 180 feet. The depth to groundwater is shown on Map 2.2.9. Groundwater in storage refers to the volume of water that is present and available in the pore spaces between sands, gravels, and sediments, and is available to move with gradient change. Groundwater storage is estimated by multiplying the specific yield of the aquifer by the thickness of an area of interest. Specific yield is defined as the volume of water that can drain from sediments or rock under gravity and is measured as the percent of the total water stored in a volume of aquifer. Specific yield varies from 4.5% to 24.5% with the lowest numbers generally found closer to the fringes of the major aquifers of the District. (Map 2.2.10.) Transmissivity (T) is the rate at which water is transmitted through a unit width of the entire saturated thickness of an aquifer under a unit hydraulic gradient. It is expressed in gallons per day per foot (gpd/ft.) of aquifer thickness. The transmissivity Map 2.2.11. can be used to estimate the ability of the aquifer(s) to transmit water through the substrata under normal flow regimes and/or estimate potential yield of a well. Transmissivity varies greatly across the LBNRD due to the variable thickness of the aquifer profile and composition of saturated material. The highest transmissivity is found through the primary paleovalley of the principal High Plains Aquifer extending from western Adams County to just north of Alexandria with readings in some areas exceeding 285,000 gpd/ft.. The lowest transmissivity is again found nearer the fringes of the aquifers where the rates drop to as low as 1750 gpd.ft.. As explained above, bedrock layers were laid down upon each other over time with the oldest layers lying at lower elevations beneath the youngest layers. Water always runs downhill; groundwater is no exception. Water table contours are shown on Map 2.2.12. and represent lines of equal elevation in feet above mean sea level. The direction of groundwater flow runs perpendicular to the contour lines. In general the groundwater movement of the LBNRD’s principal aquifer is from the higher elevations, approximately 2010’ AMSL in northwest Adams County, to lower elevations, approximately 1320 AMSL, in western Jefferson County. The smaller paleovalley aquifer in southern Thayer and Jefferson Counties generally flows east-northeast from an elevation of approximately 1780’ AMSL to 1290’ AMSL near Fairbury in Central Jefferson County. The speed at which groundwater moves through the formation is generally believed to be about 200 to 350 feet per year, however localized geologic characteristics may cause variations in the time of travel which are either faster or slower. Water level data collected from groundwater wells are used to create water level contour maps which are compared to data in succeeding years to evaluate water level changes over time.
October 1, 2017
10
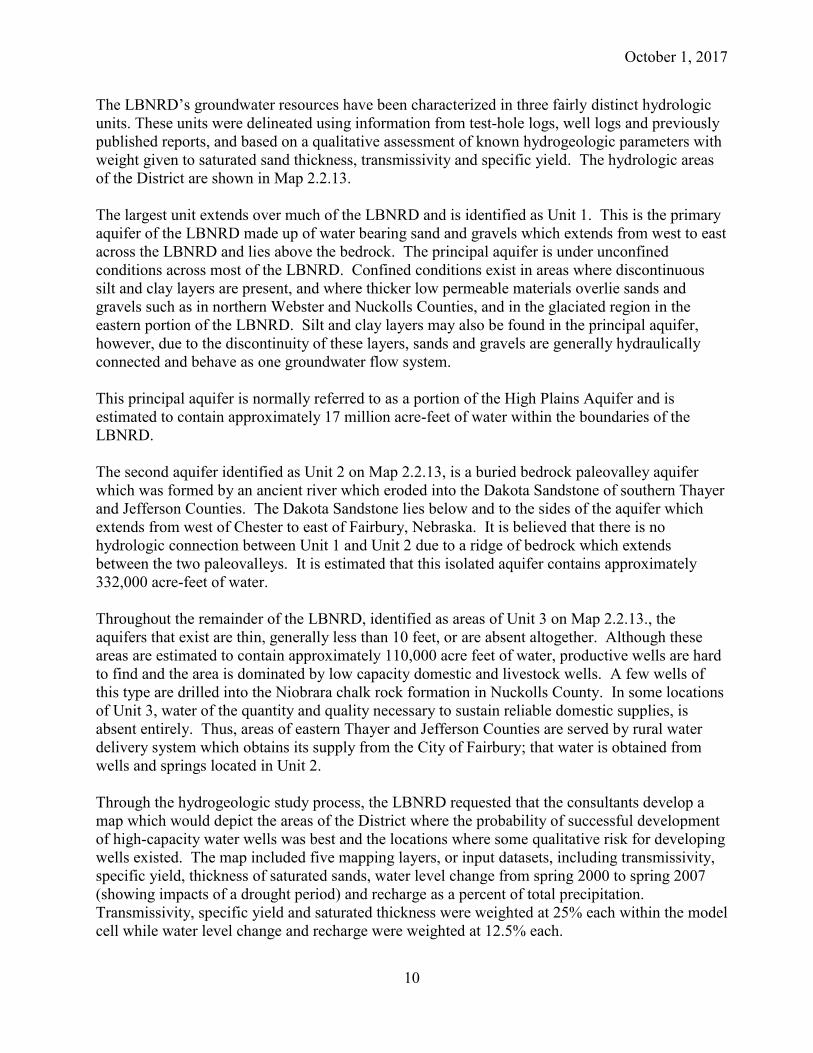
The LBNRD’s groundwater resources have been characterized in three fairly distinct hydrologic units. These units were delineated using information from test-hole logs, well logs and previously published reports, and based on a qualitative assessment of known hydrogeologic parameters with weight given to saturated sand thickness, transmissivity and specific yield. The hydrologic areas of the District are shown in Map 2.2.13. The largest unit extends over much of the LBNRD and is identified as Unit 1. This is the primary aquifer of the LBNRD made up of water bearing sand and gravels which extends from west to east across the LBNRD and lies above the bedrock. The principal aquifer is under unconfined conditions across most of the LBNRD. Confined conditions exist in areas where discontinuous silt and clay layers are present, and where thicker low permeable materials overlie sands and gravels such as in northern Webster and Nuckolls Counties, and in the glaciated region in the eastern portion of the LBNRD. Silt and clay layers may also be found in the principal aquifer, however, due to the discontinuity of these layers, sands and gravels are generally hydraulically connected and behave as one groundwater flow system. This principal aquifer is normally referred to as a portion of the High Plains Aquifer and is estimated to contain approximately 17 million acre-feet of water within the boundaries of the LBNRD. The second aquifer identified as Unit 2 on Map 2.2.13, is a buried bedrock paleovalley aquifer which was formed by an ancient river which eroded into the Dakota Sandstone of southern Thayer and Jefferson Counties. The Dakota Sandstone lies below and to the sides of the aquifer which extends from west of Chester to east of Fairbury, Nebraska. It is believed that there is no hydrologic connection between Unit 1 and Unit 2 due to a ridge of bedrock which extends between the two paleovalleys. It is estimated that this isolated aquifer contains approximately 332,000 acre-feet of water. Throughout the remainder of the LBNRD, identified as areas of Unit 3 on Map 2.2.13., the aquifers that exist are thin, generally less than 10 feet, or are absent altogether. Although these areas are estimated to contain approximately 110,000 acre feet of water, productive wells are hard to find and the area is dominated by low capacity domestic and livestock wells. A few wells of this type are drilled into the Niobrara chalk rock formation in Nuckolls County. In some locations of Unit 3, water of the quantity and quality necessary to sustain reliable domestic supplies, is absent entirely. Thus, areas of eastern Thayer and Jefferson Counties are served by rural water delivery system which obtains its supply from the City of Fairbury; that water is obtained from wells and springs located in Unit 2. Through the hydrogeologic study process, the LBNRD requested that the consultants develop a map which would depict the areas of the District where the probability of successful development of high-capacity water wells was best and the locations where some qualitative risk for developing wells existed. The map included five mapping layers, or input datasets, including transmissivity, specific yield, thickness of saturated sands, water level change from spring 2000 to spring 2007 (showing impacts of a drought period) and recharge as a percent of total precipitation. Transmissivity, specific yield and saturated thickness were weighted at 25% each within the model cell while water level change and recharge were weighted at 12.5% each.
October 1, 2017
11
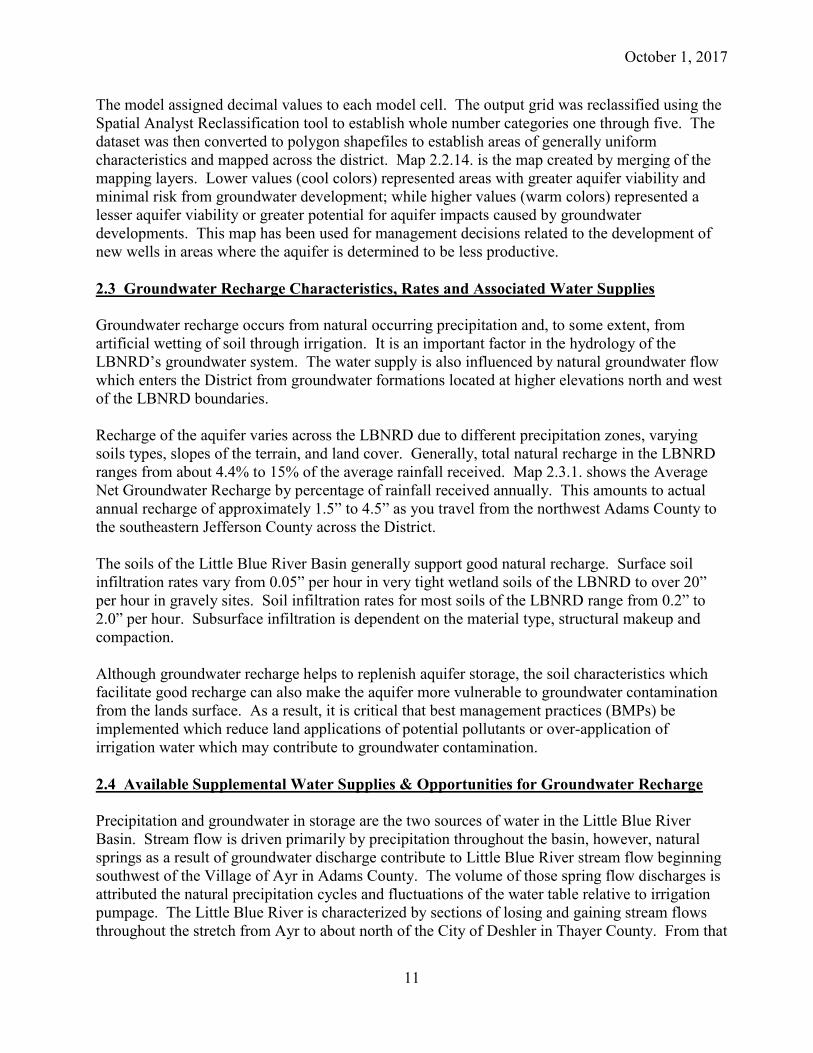
The model assigned decimal values to each model cell. The output grid was reclassified using the Spatial Analyst Reclassification tool to establish whole number categories one through five. The dataset was then converted to polygon shapefiles to establish areas of generally uniform characteristics and mapped across the district. Map 2.2.14. is the map created by merging of the mapping layers. Lower values (cool colors) represented areas with greater aquifer viability and minimal risk from groundwater development; while higher values (warm colors) represented a lesser aquifer viability or greater potential for aquifer impacts caused by groundwater developments. This map has been used for management decisions related to the development of new wells in areas where the aquifer is determined to be less productive. 2.3 Groundwater Recharge Characteristics, Rates and Associated Water Supplies Groundwater recharge occurs from natural occurring precipitation and, to some extent, from artificial wetting of soil through irrigation. It is an important factor in the hydrology of the LBNRD’s groundwater system. The water supply is also influenced by natural groundwater flow which enters the District from groundwater formations located at higher elevations north and west of the LBNRD boundaries. Recharge of the aquifer varies across the LBNRD due to different precipitation zones, varying soils types, slopes of the terrain, and land cover. Generally, total natural recharge in the LBNRD ranges from about 4.4% to 15% of the average rainfall received. Map 2.3.1. shows the Average Net Groundwater Recharge by percentage of rainfall received annually. This amounts to actual annual recharge of approximately 1.5” to 4.5” as you travel from the northwest Adams County to the southeastern Jefferson County across the District. The soils of the Little Blue River Basin generally support good natural recharge. Surface soil infiltration rates vary from 0.05” per hour in very tight wetland soils of the LBNRD to over 20” per hour in gravely sites. Soil infiltration rates for most soils of the LBNRD range from 0.2” to 2.0” per hour. Subsurface infiltration is dependent on the material type, structural makeup and compaction. Although groundwater recharge helps to replenish aquifer storage, the soil characteristics which facilitate good recharge can also make the aquifer more vulnerable to groundwater contamination from the lands surface. As a result, it is critical that best management practices (BMPs) be implemented which reduce land applications of potential pollutants or over-application of irrigation water which may contribute to groundwater contamination. 2.4 Available Supplemental Water Supplies & Opportunities for Groundwater Recharge Precipitation and groundwater in storage are the two sources of water in the Little Blue River Basin. Stream flow is driven primarily by precipitation throughout the basin, however, natural springs as a result of groundwater discharge contribute to Little Blue River stream flow beginning southwest of the Village of Ayr in Adams County. The volume of those spring flow discharges is attributed the natural precipitation cycles and fluctuations of the water table relative to irrigation pumpage. The Little Blue River is characterized by sections of losing and gaining stream flows throughout the stretch from Ayr to about north of the City of Deshler in Thayer County. From that
October 1, 2017
12
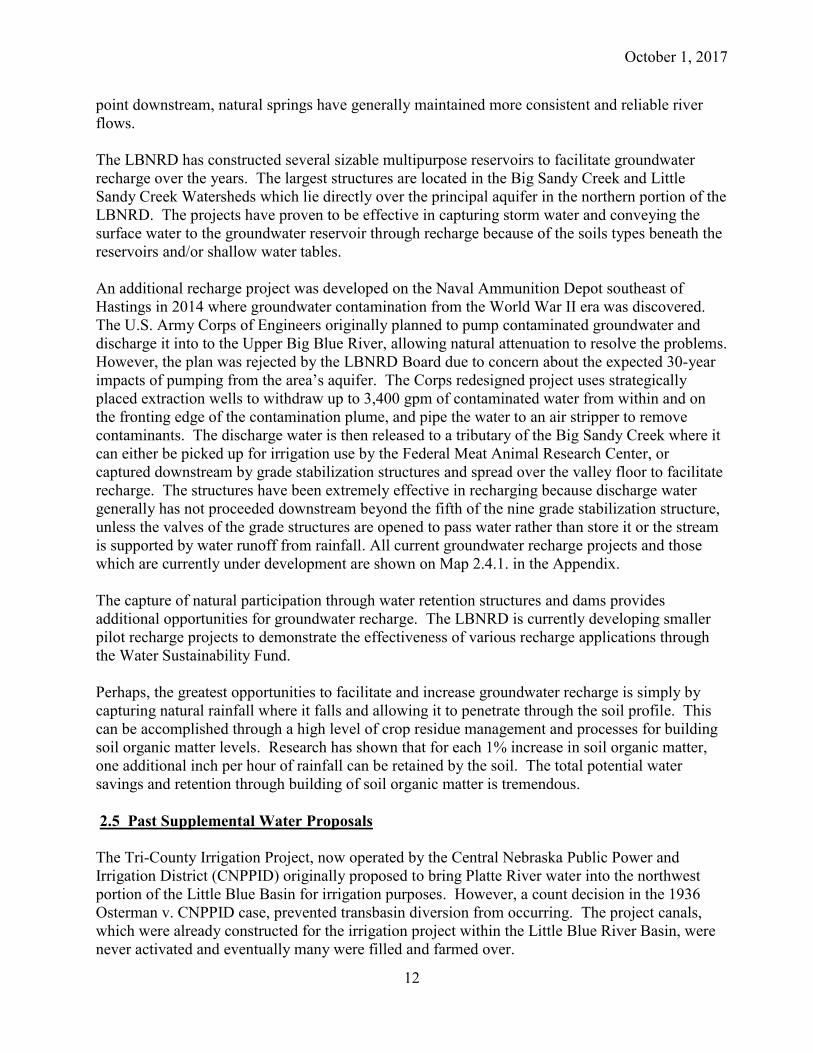
point downstream, natural springs have generally maintained more consistent and reliable river flows. The LBNRD has constructed several sizable multipurpose reservoirs to facilitate groundwater recharge over the years. The largest structures are located in the Big Sandy Creek and Little Sandy Creek Watersheds which lie directly over the principal aquifer in the northern portion of the LBNRD. The projects have proven to be effective in capturing storm water and conveying the surface water to the groundwater reservoir through recharge because of the soils types beneath the reservoirs and/or shallow water tables. An additional recharge project was developed on the Naval Ammunition Depot southeast of Hastings in 2014 where groundwater contamination from the World War II era was discovered. The U.S. Army Corps of Engineers originally planned to pump contaminated groundwater and discharge it into to the Upper Big Blue River, allowing natural attenuation to resolve the problems. However, the plan was rejected by the LBNRD Board due to concern about the expected 30-year impacts of pumping from the area’s aquifer. The Corps redesigned project uses strategically placed extraction wells to withdraw up to 3,400 gpm of contaminated water from within and on the fronting edge of the contamination plume, and pipe the water to an air stripper to remove contaminants. The discharge water is then released to a tributary of the Big Sandy Creek where it can either be picked up for irrigation use by the Federal Meat Animal Research Center, or captured downstream by grade stabilization structures and spread over the valley floor to facilitate recharge. The structures have been extremely effective in recharging because discharge water generally has not proceeded downstream beyond the fifth of the nine grade stabilization structure, unless the valves of the grade structures are opened to pass water rather than store it or the stream is supported by water runoff from rainfall. All current groundwater recharge projects and those which are currently under development are shown on Map 2.4.1. in the Appendix. The capture of natural participation through water retention structures and dams provides additional opportunities for groundwater recharge. The LBNRD is currently developing smaller pilot recharge projects to demonstrate the effectiveness of various recharge applications through the Water Sustainability Fund. Perhaps, the greatest opportunities to facilitate and increase groundwater recharge is simply by capturing natural rainfall where it falls and allowing it to penetrate through the soil profile. This can be accomplished through a high level of crop residue management and processes for building soil organic matter levels. Research has shown that for each 1% increase in soil organic matter, one additional inch per hour of rainfall can be retained by the soil. The total potential water savings and retention through building of soil organic matter is tremendous. 2.5 Past Supplemental Water Proposals The Tri-County Irrigation Project, now operated by the Central Nebraska Public Power and Irrigation District (CNPPID) originally proposed to bring Platte River water into the northwest portion of the Little Blue Basin for irrigation purposes. However, a count decision in the 1936 Osterman v. CNPPID case, prevented transbasin diversion from occurring. The project canals, which were already constructed for the irrigation project within the Little Blue River Basin, were never activated and eventually many were filled and farmed over.
October 1, 2017
13
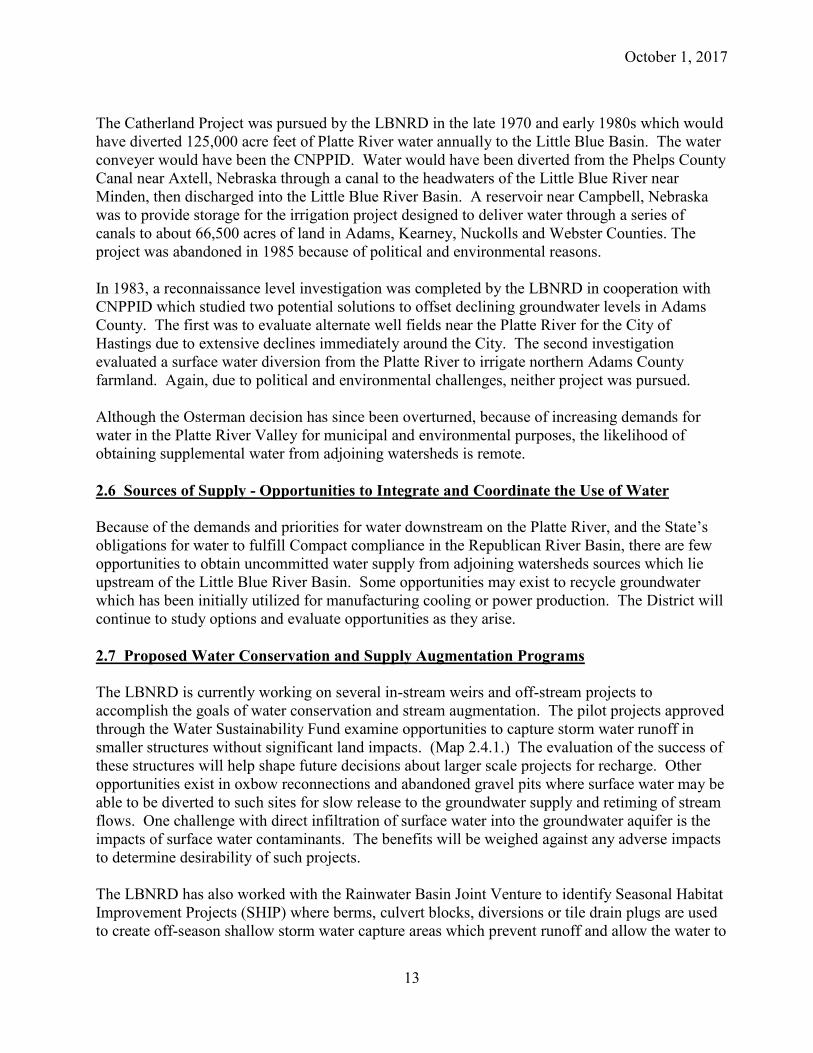
The Catherland Project was pursued by the LBNRD in the late 1970 and early 1980s which would have diverted 125,000 acre feet of Platte River water annually to the Little Blue Basin. The water conveyer would have been the CNPPID. Water would have been diverted from the Phelps County Canal near Axtell, Nebraska through a canal to the headwaters of the Little Blue River near Minden, then discharged into the Little Blue River Basin. A reservoir near Campbell, Nebraska was to provide storage for the irrigation project designed to deliver water through a series of canals to about 66,500 acres of land in Adams, Kearney, Nuckolls and Webster Counties. The project was abandoned in 1985 because of political and environmental reasons. In 1983, a reconnaissance level investigation was completed by the LBNRD in cooperation with CNPPID which studied two potential solutions to offset declining groundwater levels in Adams County. The first was to evaluate alternate well fields near the Platte River for the City of Hastings due to extensive declines immediately around the City. The second investigation evaluated a surface water diversion from the Platte River to irrigate northern Adams County farmland. Again, due to political and environmental challenges, neither project was pursued. Although the Osterman decision has since been overturned, because of increasing demands for water in the Platte River Valley for municipal and environmental purposes, the likelihood of obtaining supplemental water from adjoining watersheds is remote. 2.6 Sources of Supply - Opportunities to Integrate and Coordinate the Use of Water Because of the demands and priorities for water downstream on the Platte River, and the State’s obligations for water to fulfill Compact compliance in the Republican River Basin, there are few opportunities to obtain uncommitted water supply from adjoining watersheds sources which lie upstream of the Little Blue River Basin. Some opportunities may exist to recycle groundwater which has been initially utilized for manufacturing cooling or power production. The District will continue to study options and evaluate opportunities as they arise. 2.7 Proposed Water Conservation and Supply Augmentation Programs The LBNRD is currently working on several in-stream weirs and off-stream projects to accomplish the goals of water conservation and stream augmentation. The pilot projects approved through the Water Sustainability Fund examine opportunities to capture storm water runoff in smaller structures without significant land impacts. (Map 2.4.1.) The evaluation of the success of these structures will help shape future decisions about larger scale projects for recharge. Other opportunities exist in oxbow reconnections and abandoned gravel pits where surface water may be able to be diverted to such sites for slow release to the groundwater supply and retiming of stream flows. One challenge with direct infiltration of surface water into the groundwater aquifer is the impacts of surface water contaminants. The benefits will be weighed against any adverse impacts to determine desirability of such projects. The LBNRD has also worked with the Rainwater Basin Joint Venture to identify Seasonal Habitat Improvement Projects (SHIP) where berms, culvert blocks, diversions or tile drain plugs are used to create off-season shallow storm water capture areas which prevent runoff and allow the water to
October 1, 2017
14
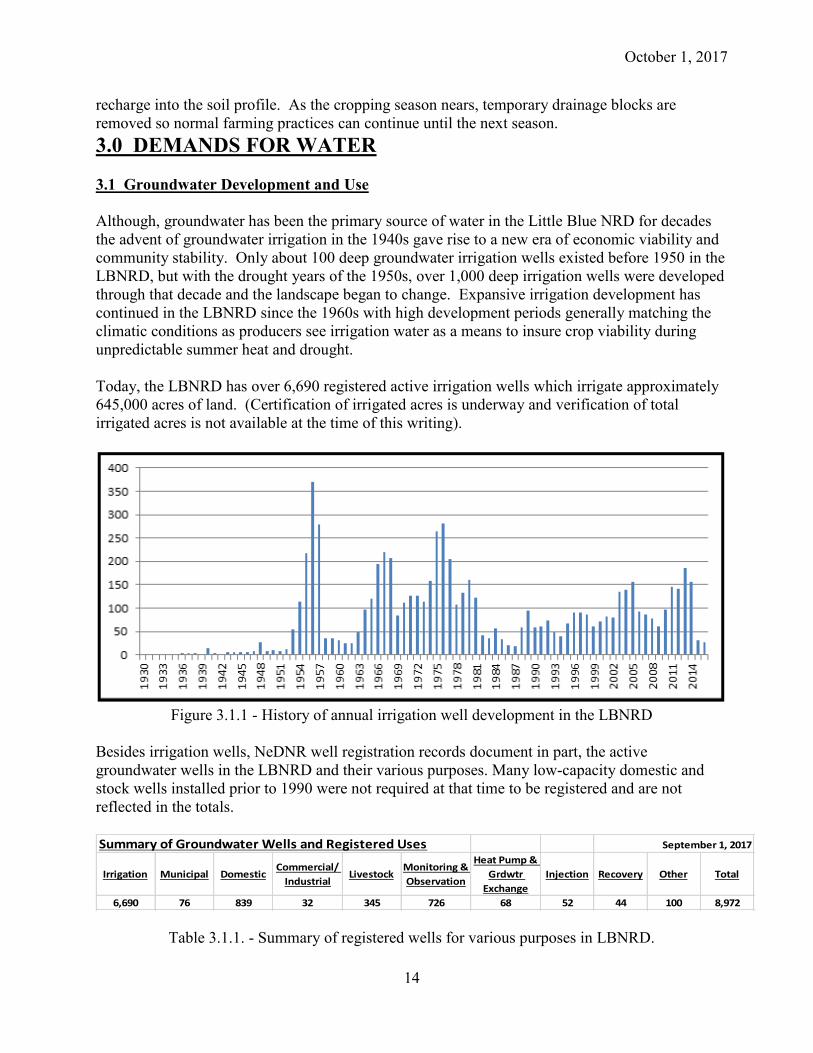
recharge into the soil profile. As the cropping season nears, temporary drainage blocks are removed so normal farming practices can continue until the next season. 3.0 DEMANDS FOR WATER 3.1 Groundwater Development and Use Although, groundwater has been the primary source of water in the Little Blue NRD for decades the advent of groundwater irrigation in the 1940s gave rise to a new era of economic viability and community stability. Only about 100 deep groundwater irrigation wells existed before 1950 in the LBNRD, but with the drought years of the 1950s, over 1,000 deep irrigation wells were developed through that decade and the landscape began to change. Expansive irrigation development has continued in the LBNRD since the 1960s with high development periods generally matching the climatic conditions as producers see irrigation water as a means to insure crop viability during unpredictable summer heat and drought. Today, the LBNRD has over 6,690 registered active irrigation wells which irrigate approximately 645,000 acres of land. (Certification of irrigated acres is underway and verification of total irrigated acres is not available at the time of this writing).
Figure 3.1.1 - History of annual irrigation well development in the LBNRD
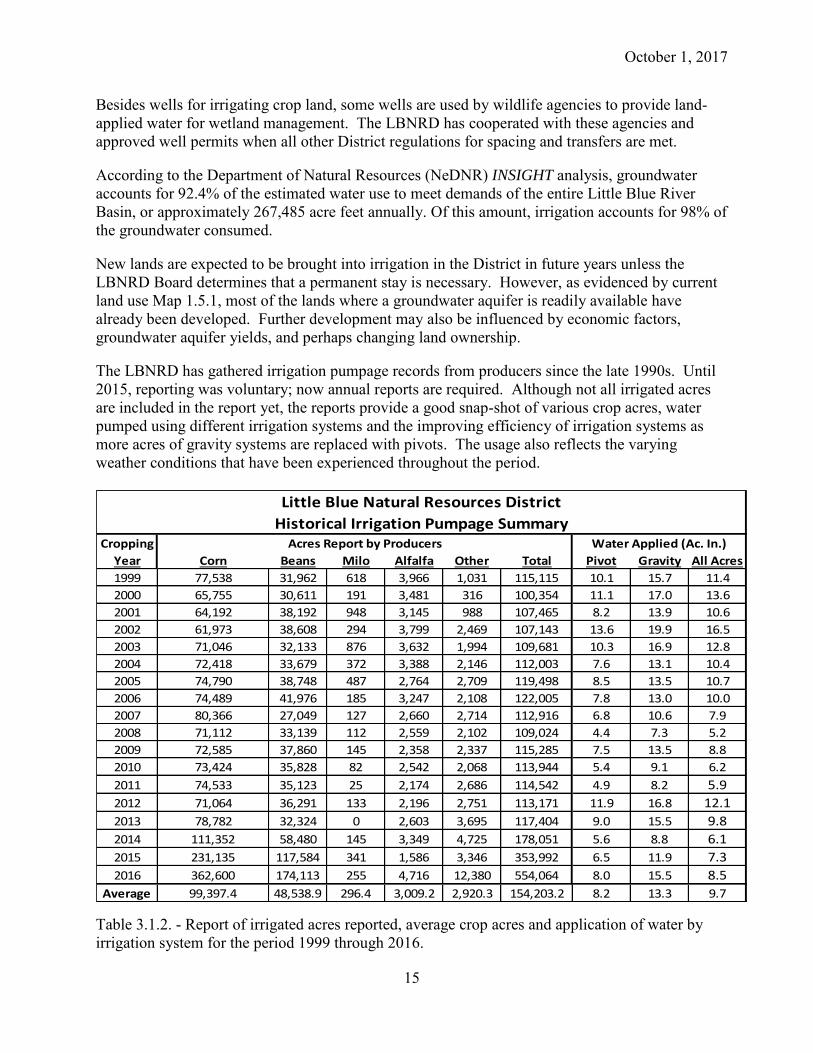
Besides irrigation wells, NeDNR well registration records document in part, the active groundwater wells in the LBNRD and their various purposes. Many low-capacity domestic and stock wells installed prior to 1990 were not required at that time to be registered and are not reflected in the totals. Summary of Groundwater Wells and Registered Uses
Irrigation Municipal DomesticCommercial/
IndustrialLivestock
Monitoring &
Observation
Heat Pump &
Grdwtr
Exchange
Injection Recovery Other Total
6,690 76 839 32 345 726 68 52 44 100 8,972
September 1, 2017
Table 3.1.1. - Summary of registered wells for various purposes in LBNRD.
October 1, 2017
15
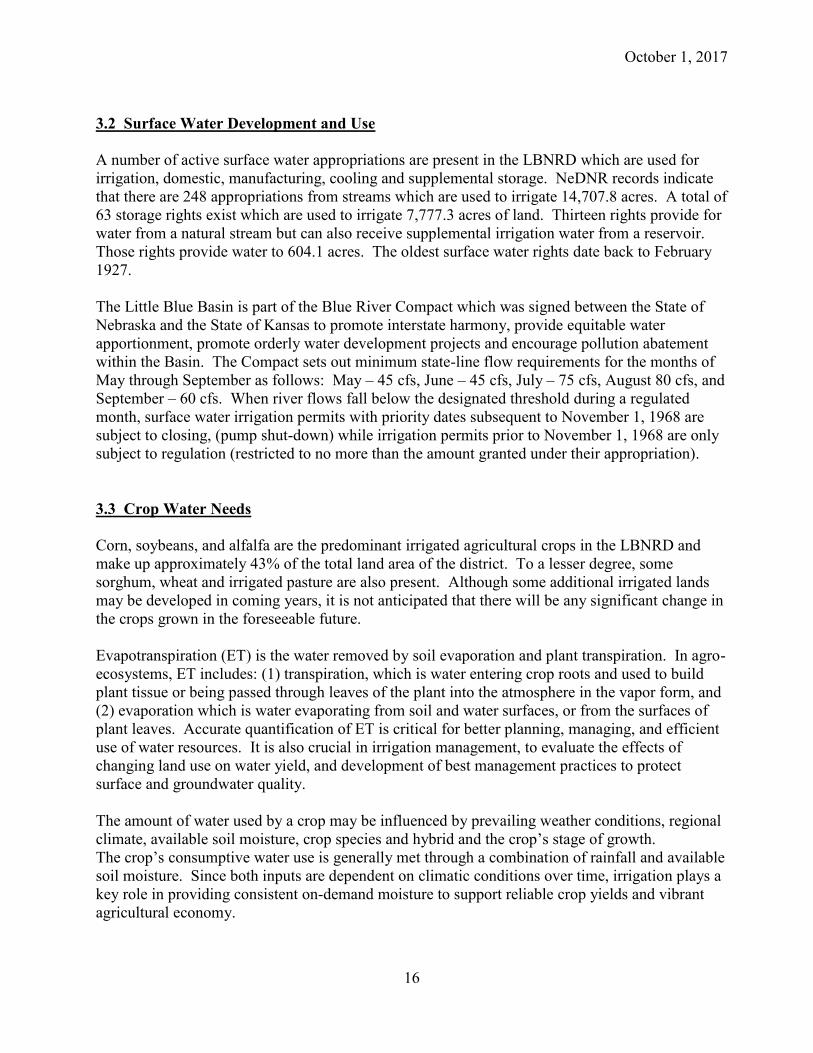
Besides wells for irrigating crop land, some wells are used by wildlife agencies to provide land-applied water for wetland management. The LBNRD has cooperated with these agencies and approved well permits when all other District regulations for spacing and transfers are met. According to the Department of Natural Resources (NeDNR) INSIGHT analysis, groundwater accounts for 92.4% of the estimated water use to meet demands of the entire Little Blue River Basin, or approximately 267,485 acre feet annually. Of this amount, irrigation accounts for 98% of the groundwater consumed. New lands are expected to be brought into irrigation in the District in future years unless the LBNRD Board determines that a permanent stay is necessary. However, as evidenced by current land use Map 1.5.1, most of the lands where a groundwater aquifer is readily available have already been developed. Further development may also be influenced by economic factors, groundwater aquifer yields, and perhaps changing land ownership. The LBNRD has gathered irrigation pumpage records from producers since the late 1990s. Until 2015, reporting was voluntary; now annual reports are required. Although not all irrigated acres are included in the report yet, the reports provide a good snap-shot of various crop acres, water pumped using different irrigation systems and the improving efficiency of irrigation systems as more acres of gravity systems are replaced with pivots. The usage also reflects the varying weather conditions that have been experienced throughout the period.
Cropping
Year Corn Beans Milo Alfalfa Other Total Pivot Gravity All Acres
1999 77,538 31,962 618 3,966 1,031 115,115 10.1 15.7 11.4
2000 65,755 30,611 191 3,481 316 100,354 11.1 17.0 13.6
2001 64,192 38,192 948 3,145 988 107,465 8.2 13.9 10.6
2002 61,973 38,608 294 3,799 2,469 107,143 13.6 19.9 16.5
2003 71,046 32,133 876 3,632 1,994 109,681 10.3 16.9 12.8
2004 72,418 33,679 372 3,388 2,146 112,003 7.6 13.1 10.4
2005 74,790 38,748 487 2,764 2,709 119,498 8.5 13.5 10.7
2006 74,489 41,976 185 3,247 2,108 122,005 7.8 13.0 10.0
2007 80,366 27,049 127 2,660 2,714 112,916 6.8 10.6 7.9
2008 71,112 33,139 112 2,559 2,102 109,024 4.4 7.3 5.2
2009 72,585 37,860 145 2,358 2,337 115,285 7.5 13.5 8.8
2010 73,424 35,828 82 2,542 2,068 113,944 5.4 9.1 6.2
2011 74,533 35,123 25 2,174 2,686 114,542 4.9 8.2 5.9
2012 71,064 36,291 133 2,196 2,751 113,171 11.9 16.8 12.1
2013 78,782 32,324 0 2,603 3,695 117,404 9.0 15.5 9.8
2014 111,352 58,480 145 3,349 4,725 178,051 5.6 8.8 6.1
2015 231,135 117,584 341 1,586 3,346 353,992 6.5 11.9 7.3
2016 362,600 174,113 255 4,716 12,380 554,064 8.0 15.5 8.5
Average 99,397.4 48,538.9 296.4 3,009.2 2,920.3 154,203.2 8.2 13.3 9.7
Little Blue Natural Resources District
Historical Irrigation Pumpage SummaryAcres Report by Producers Water Applied (Ac. In.)
Table 3.1.2. - Report of irrigated acres reported, average crop acres and application of water by irrigation system for the period 1999 through 2016.
October 1, 2017
16
3.2 Surface Water Development and Use A number of active surface water appropriations are present in the LBNRD which are used for irrigation, domestic, manufacturing, cooling and supplemental storage. NeDNR records indicate that there are 248 appropriations from streams which are used to irrigate 14,707.8 acres. A total of 63 storage rights exist which are used to irrigate 7,777.3 acres of land. Thirteen rights provide for water from a natural stream but can also receive supplemental irrigation water from a reservoir. Those rights provide water to 604.1 acres. The oldest surface water rights date back to February 1927. The Little Blue Basin is part of the Blue River Compact which was signed between the State of Nebraska and the State of Kansas to promote interstate harmony, provide equitable water apportionment, promote orderly water development projects and encourage pollution abatement within the Basin. The Compact sets out minimum state-line flow requirements for the months of May through September as follows: May – 45 cfs, June – 45 cfs, July – 75 cfs, August 80 cfs, and September – 60 cfs. When river flows fall below the designated threshold during a regulated month, surface water irrigation permits with priority dates subsequent to November 1, 1968 are subject to closing, (pump shut-down) while irrigation permits prior to November 1, 1968 are only subject to regulation (restricted to no more than the amount granted under their appropriation). 3.3 Crop Water Needs Corn, soybeans, and alfalfa are the predominant irrigated agricultural crops in the LBNRD and make up approximately 43% of the total land area of the district. To a lesser degree, some sorghum, wheat and irrigated pasture are also present. Although some additional irrigated lands may be developed in coming years, it is not anticipated that there will be any significant change in the crops grown in the foreseeable future. Evapotranspiration (ET) is the water removed by soil evaporation and plant transpiration. In agro-ecosystems, ET includes: (1) transpiration, which is water entering crop roots and used to build plant tissue or being passed through leaves of the plant into the atmosphere in the vapor form, and (2) evaporation which is water evaporating from soil and water surfaces, or from the surfaces of plant leaves. Accurate quantification of ET is critical for better planning, managing, and efficient use of water resources. It is also crucial in irrigation management, to evaluate the effects of changing land use on water yield, and development of best management practices to protect surface and groundwater quality. The amount of water used by a crop may be influenced by prevailing weather conditions, regional climate, available soil moisture, crop species and hybrid and the crop’s stage of growth. The crop’s consumptive water use is generally met through a combination of rainfall and available soil moisture. Since both inputs are dependent on climatic conditions over time, irrigation plays a key role in providing consistent on-demand moisture to support reliable crop yields and vibrant agricultural economy.
October 1, 2017
17
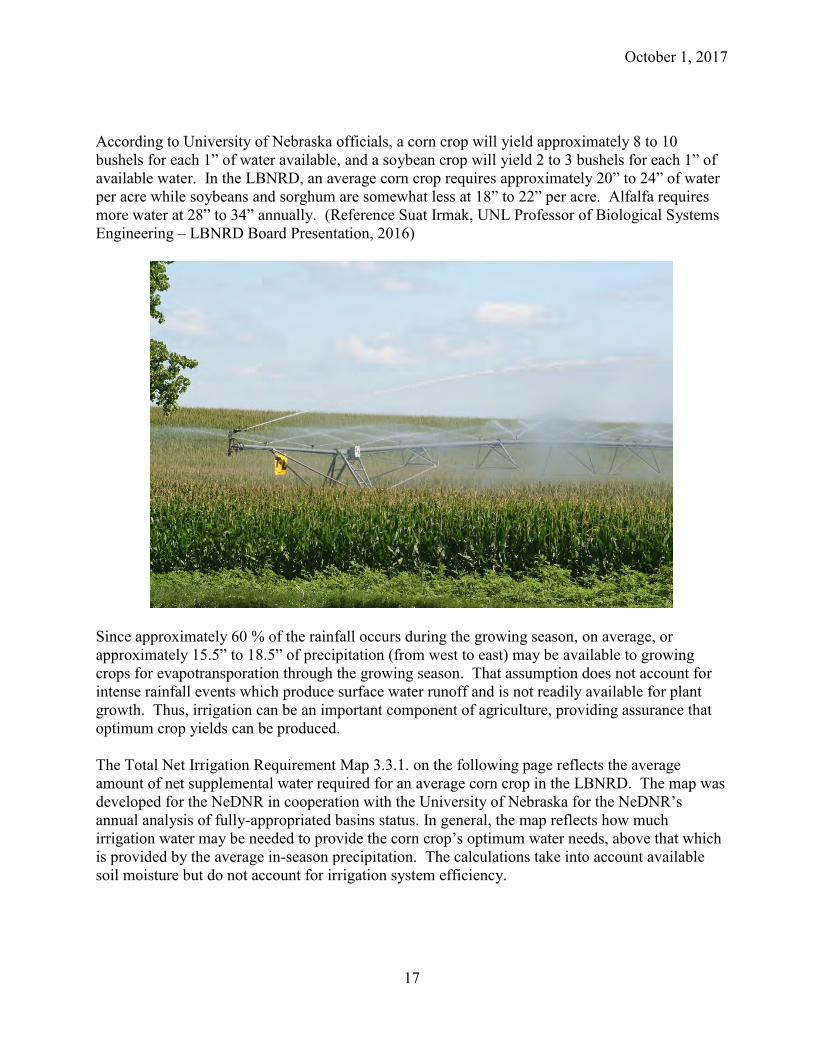
According to University of Nebraska officials, a corn crop will yield approximately 8 to 10 bushels for each 1” of water available, and a soybean crop will yield 2 to 3 bushels for each 1” of available water. In the LBNRD, an average corn crop requires approximately 20” to 24” of water per acre while soybeans and sorghum are somewhat less at 18” to 22” per acre. Alfalfa requires more water at 28” to 34” annually. (Reference Suat Irmak, UNL Professor of Biological Systems Engineering – LBNRD Board Presentation, 2016)
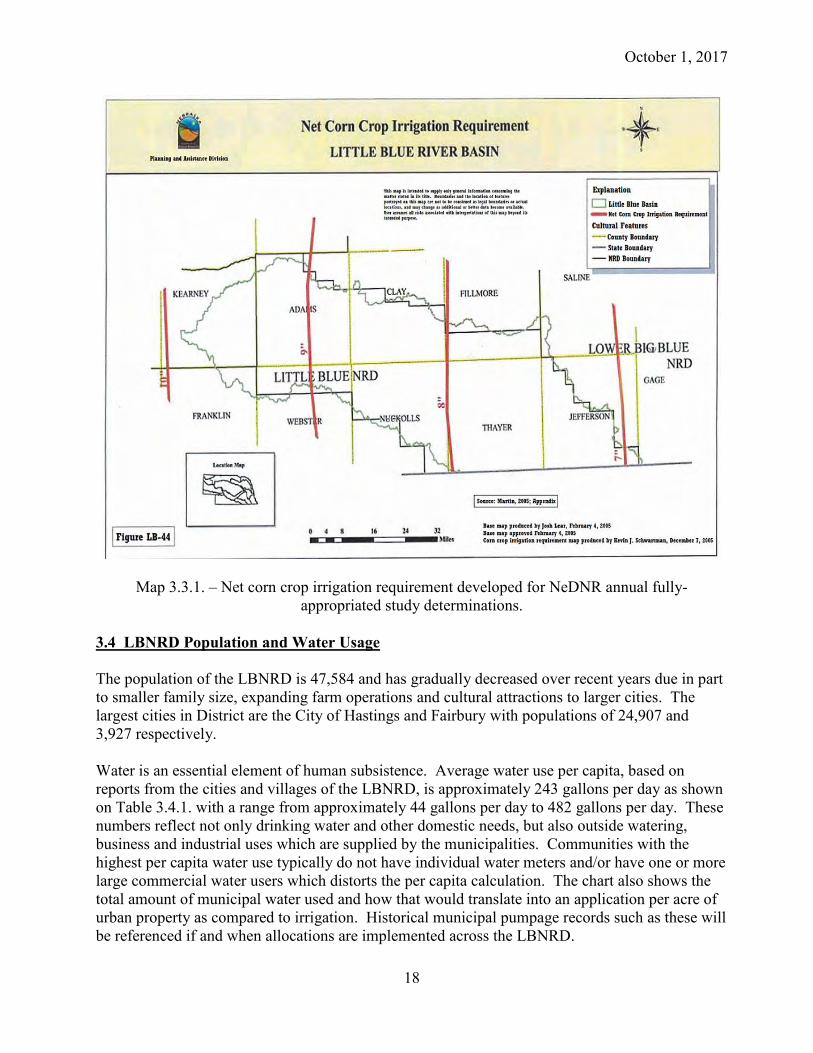
Since approximately 60 % of the rainfall occurs during the growing season, on average, or approximately 15.5” to 18.5” of precipitation (from west to east) may be available to growing crops for evapotransporation through the growing season. That assumption does not account for intense rainfall events which produce surface water runoff and is not readily available for plant growth. Thus, irrigation can be an important component of agriculture, providing assurance that optimum crop yields can be produced. The Total Net Irrigation Requirement Map 3.3.1. on the following page reflects the average amount of net supplemental water required for an average corn crop in the LBNRD. The map was developed for the NeDNR in cooperation with the University of Nebraska for the NeDNR’s annual analysis of fully-appropriated basins status. In general, the map reflects how much irrigation water may be needed to provide the corn crop’s optimum water needs, above that which is provided by the average in-season precipitation. The calculations take into account available soil moisture but do not account for irrigation system efficiency.
October 1, 2017
18
Map 3.3.1. – Net corn crop irrigation requirement developed for NeDNR annual fully-appropriated study determinations.
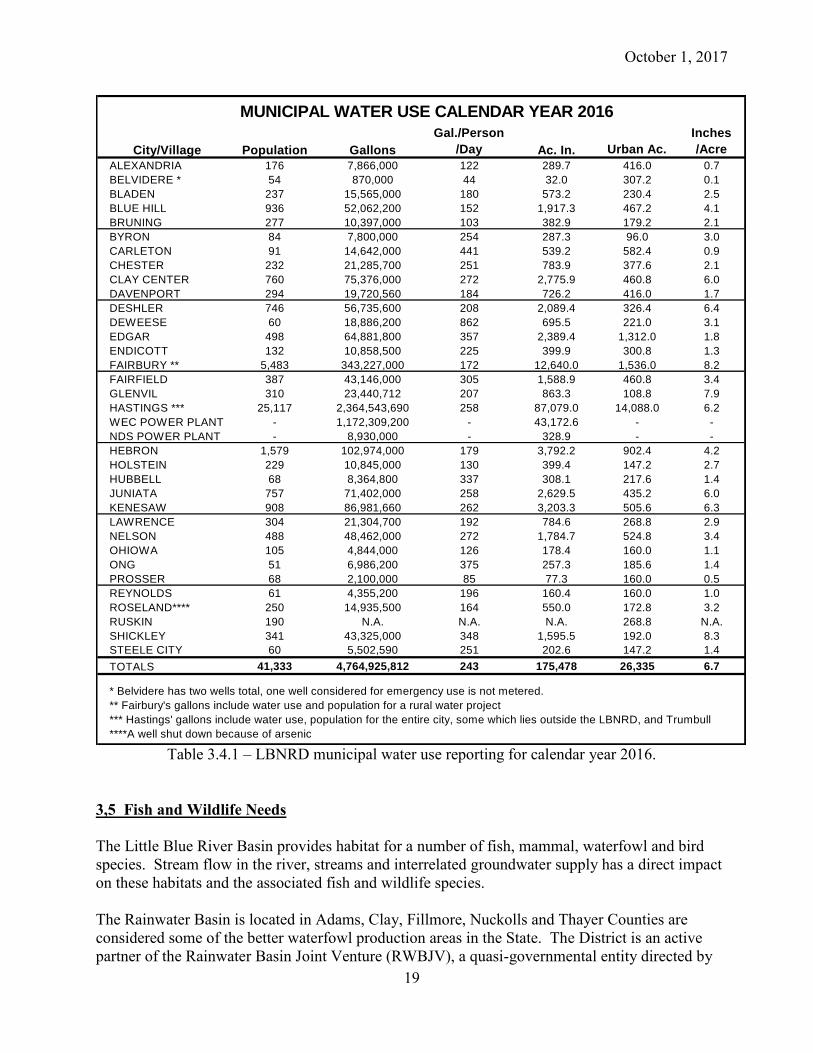
3.4 LBNRD Population and Water Usage The population of the LBNRD is 47,584 and has gradually decreased over recent years due in part to smaller family size, expanding farm operations and cultural attractions to larger cities. The largest cities in District are the City of Hastings and Fairbury with populations of 24,907 and 3,927 respectively. Water is an essential element of human subsistence. Average water use per capita, based on reports from the cities and villages of the LBNRD, is approximately 243 gallons per day as shown on Table 3.4.1. with a range from approximately 44 gallons per day to 482 gallons per day. These numbers reflect not only drinking water and other domestic needs, but also outside watering, business and industrial uses which are supplied by the municipalities. Communities with the highest per capita water use typically do not have individual water meters and/or have one or more large commercial water users which distorts the per capita calculation. The chart also shows the total amount of municipal water used and how that would translate into an application per acre of urban property as compared to irrigation. Historical municipal pumpage records such as these will be referenced if and when allocations are implemented across the LBNRD.
October 1, 2017
19
City/Village Population Gallons
Gal./Person
/Day Ac. In. Urban Ac.
Inches
/Acre
ALEXANDRIA 176 7,866,000 122 289.7 416.0 0.7
BELVIDERE * 54 870,000 44 32.0 307.2 0.1
BLADEN 237 15,565,000 180 573.2 230.4 2.5
BLUE HILL 936 52,062,200 152 1,917.3 467.2 4.1
BRUNING 277 10,397,000 103 382.9 179.2 2.1
BYRON 84 7,800,000 254 287.3 96.0 3.0
CARLETON 91 14,642,000 441 539.2 582.4 0.9
CHESTER 232 21,285,700 251 783.9 377.6 2.1
CLAY CENTER 760 75,376,000 272 2,775.9 460.8 6.0
DAVENPORT 294 19,720,560 184 726.2 416.0 1.7
DESHLER 746 56,735,600 208 2,089.4 326.4 6.4
DEWEESE 60 18,886,200 862 695.5 221.0 3.1
EDGAR 498 64,881,800 357 2,389.4 1,312.0 1.8
ENDICOTT 132 10,858,500 225 399.9 300.8 1.3
FAIRBURY ** 5,483 343,227,000 172 12,640.0 1,536.0 8.2
FAIRFIELD 387 43,146,000 305 1,588.9 460.8 3.4
GLENVIL 310 23,440,712 207 863.3 108.8 7.9
HASTINGS *** 25,117 2,364,543,690 258 87,079.0 14,088.0 6.2
WEC POWER PLANT - 1,172,309,200 - 43,172.6 - -
NDS POWER PLANT - 8,930,000 - 328.9 - -
HEBRON 1,579 102,974,000 179 3,792.2 902.4 4.2
HOLSTEIN 229 10,845,000 130 399.4 147.2 2.7
HUBBELL 68 8,364,800 337 308.1 217.6 1.4
JUNIATA 757 71,402,000 258 2,629.5 435.2 6.0
KENESAW 908 86,981,660 262 3,203.3 505.6 6.3
LAWRENCE 304 21,304,700 192 784.6 268.8 2.9
NELSON 488 48,462,000 272 1,784.7 524.8 3.4
OHIOWA 105 4,844,000 126 178.4 160.0 1.1
ONG 51 6,986,200 375 257.3 185.6 1.4
PROSSER 68 2,100,000 85 77.3 160.0 0.5
REYNOLDS 61 4,355,200 196 160.4 160.0 1.0
ROSELAND**** 250 14,935,500 164 550.0 172.8 3.2
RUSKIN 190 N.A. N.A. N.A. 268.8 N.A.
SHICKLEY 341 43,325,000 348 1,595.5 192.0 8.3
STEELE CITY 60 5,502,590 251 202.6 147.2 1.4
TOTALS 41,333 4,764,925,812 243 175,478 26,335 6.7
* Belvidere has two wells total, one well considered for emergency use is not metered.
** Fairbury's gallons include water use and population for a rural water project
*** Hastings' gallons include water use, population for the entire city, some which lies outside the LBNRD, and Trumbull
****A well shut down because of arsenic
MUNICIPAL WATER USE CALENDAR YEAR 2016
Table 3.4.1 – LBNRD municipal water use reporting for calendar year 2016.
3,5 Fish and Wildlife Needs The Little Blue River Basin provides habitat for a number of fish, mammal, waterfowl and bird species. Stream flow in the river, streams and interrelated groundwater supply has a direct impact on these habitats and the associated fish and wildlife species. The Rainwater Basin is located in Adams, Clay, Fillmore, Nuckolls and Thayer Counties are considered some of the better waterfowl production areas in the State. The District is an active partner of the Rainwater Basin Joint Venture (RWBJV), a quasi-governmental entity directed by
October 1, 2017
20
members of governmental agencies, conservation organizations, businessmen, and agricultural producers. The RWBJV mission is to achieve wetland and upland habitat conservation through cooperation and sound scientific processes. The LBNRD has been instrumental in sponsoring several habitat grants through the Nebraska Environmental Trust for efforts which provide wetland restoration and enhancement. The most recent effort entitled Puddles Under the Pivots improved water management while supporting the local agricultural landscape. The project provides opportunities to modify center pivots which previously were prevented from crossing wetland areas. The program provides a variety of pivot modifications including moving the pivot point, integration of track systems, and/or low pressure tires, which allowed the pivots to cross existing wetlands, thus limiting any impact to the restored wetlands, improving pivot efficiency and supporting water conservation. The LBNRD also currently holds a conservation easement for a wetland complex in Nuckolls County which provides approximately 15 acres or shallow water storage. Both the U.S. Fish and Wildlife Service and Nebraska Game and Parks Commission own and/or manage a number of tracts containing wetland complexes within the LBNRD. Currently, seventeen of the twenty seven Wildlife Management Areas or Wildlife Production Areas in the District are equipped with irrigation motors and pump groundwater in critical migration times to provide habitat for migrating waterfowl and shorebirds. These areas account for 3,932 acres of hydric soils and the average annual pumping on these wetland basins totals 1,350 acre feet. Several endangered species are listed within the counties of the LBNRD and include the Whooping Crane, Interior Least Tern, Piping Plover, and the Massasauga Rattlesnake in the eastern portion of the District. The LBNRD Board is aware of the impacts that groundwater uses may have on fish and wildlife habitats and is committed to the conservation of water resources in efforts to benefit all species. 3,6 Existing Sub-irrigated Uses Very few areas of the Little Blue NRD, if any, are subject to sub-irrigated conditions. Where such conditions do exist they are found only on the first bottom valley floor of the Little Blue River or major perennial streams where marshy conditions may exist. 3.7 Relative Economic Value of Different Proposed or Existing Uses of Groundwater Groundwater accounts for 98% of all water used for domestic water supply, industry, manufacturing, and agriculture in the LBNRD. It is the economic lifeblood of the District. Fortunately, many areas of the District are blessed with an excellent supply of water of a suitable quality to meet those demands. The economic value of the water is very difficult to measure in dollars. However, estimates can be made by specific uses or purposes for which water is used. As an example, according to Farm Services Agency reports, the Thayer County crop yield average for a seven-year period (2009 – 2015) was 205 bushels for irrigated corn and 121 bushels for rain-fed corn, while soybeans for the period were 63.3 and 46 bushels respectively. Nebraska Agricultural Statistics reported 101,000
October 1, 2017
21
irrigated corn acres, and 53,100 rain-fed corn acres in Thayer County in 2015. The number of soybeans acres of Thayer County was 63,700 irrigated and 37,600 rain-fed acres respectively. Based on the numbers provided above, and an estimated price of $3.25 for corn and $9.00 for soybeans, the value of those two crops grown in Thayer County, if all rain-fed, would be just over $102.5 million. (Cash grain prices obtained from www.agweb.com/markets. – Note: cash markets fluctuate daily.) The economic value of the two crops based on the current proportion of dry and irrigated corn and soybeans acres is approximately $140 million, or a difference of approximately $37.5 million. That doesn’t account for the additional economic activity created by irrigated agriculture which would include additional fertilizer, seed, fuel, supplies, equipment, labor, etc. that contribute to the local economy. The difference in value between irrigated and rain-fed cropland is also significant. In Thayer County, the highest irrigated lands assessed value for 2017 is $7,200 while the highest rain-fed cropland assessed value is $4,550. In terms of real value for those tracts, and based on the State’s 72% actual/assessed allowable valuation, the anticipated cash price difference between the highest irrigated cropland verses rain-fed cropland values would be $3,680 difference. The value of irrigation, when considering only irrigated land values in the seven counties in the LBNRD, would be significant. These values play an important role in not only land sales but also the impact on local property taxes which support schools and other local governments. The value of water for domestic, municipal and industrial uses is also hard to calculate but these uses contribute to productivity and the general prosperity of the communities and quality of life in the District. Additional evidence of the value of water can be attested to in the southeast part of the LBNRD where the Little Blue Public Water Systems were constructed as early as 1975, 1978 and 1998 to mitigate a poor quantity and quality water in that region of the District. Because rural water became available to areas with limited supply, it provided opportunity for modern rural farmsteads, better livestock production and even business growth and expansion. All these factors demonstrate the tremendous value that groundwater provides in a thriving local economy. As competing water interests continue to grow, the proper management and development of our water resources is critical to supply water uses and meet the various groundwater demands. 4.0 MONITORING 4.1 Current Groundwater Quantity Data Collection The District has a long history of groundwater level monitoring extending back to 1974. Additional groundwater level data was collected before 1974 by the Groundwater Management districts in Clay and Fillmore Counties, and by the Conservation and Survey Division of UNL. The District’s observation network has expanded from 61 wells in 1974 to over 330 wells in 2017. Water level readings are made each spring and fall using a chalked steel tape. Only spring water levels are used for management decisions because that gives the water table an opportunity to stabilize again following the irrigation pumpage season.
October 1, 2017
22
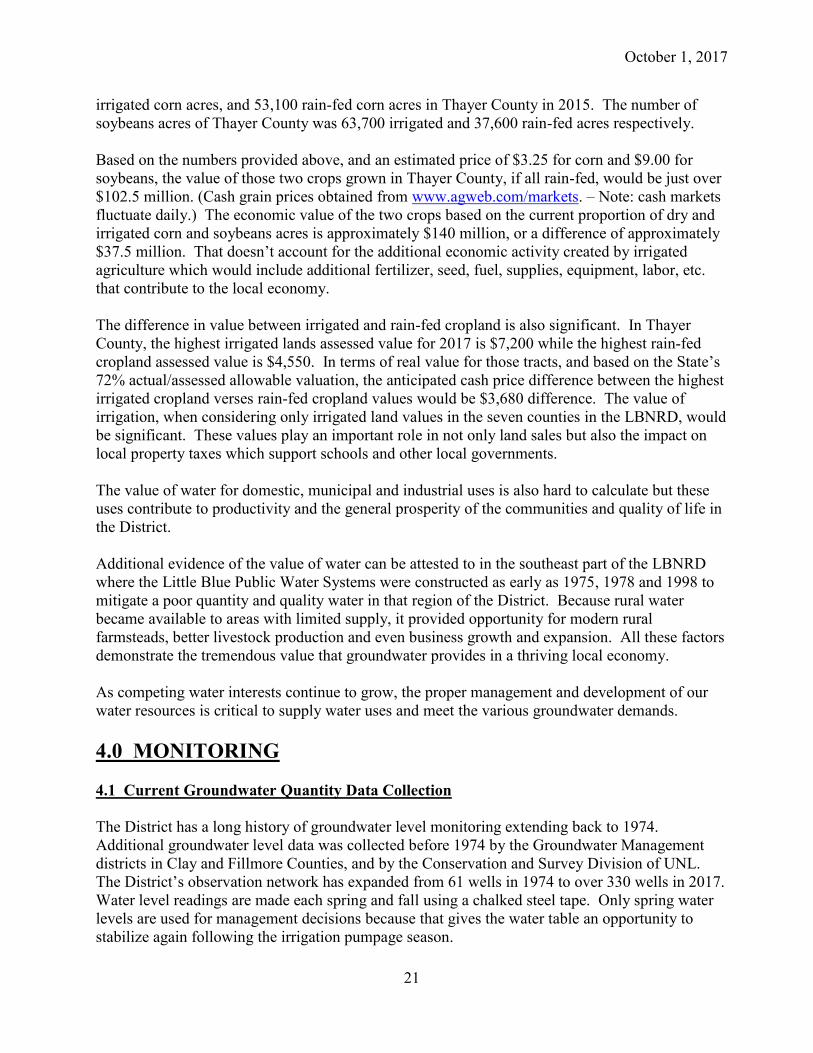
The LBNRD also installed 50 dedicated observation wells in 2010 which are equipped with continuous data loggers and provide daily water level readings. These dedicated wells have been instrumental in reflecting the daily and seasonal variations of water levels across the LBNRD, in differing geologic settings. Map 4.1.1. below shows the distribution of wells in the District’s observation network, including both irrigation wells and dedicated observation wells.
Map 4.1.1. – Graphic of distribution of dedicated and bi-annual water level observation sites.
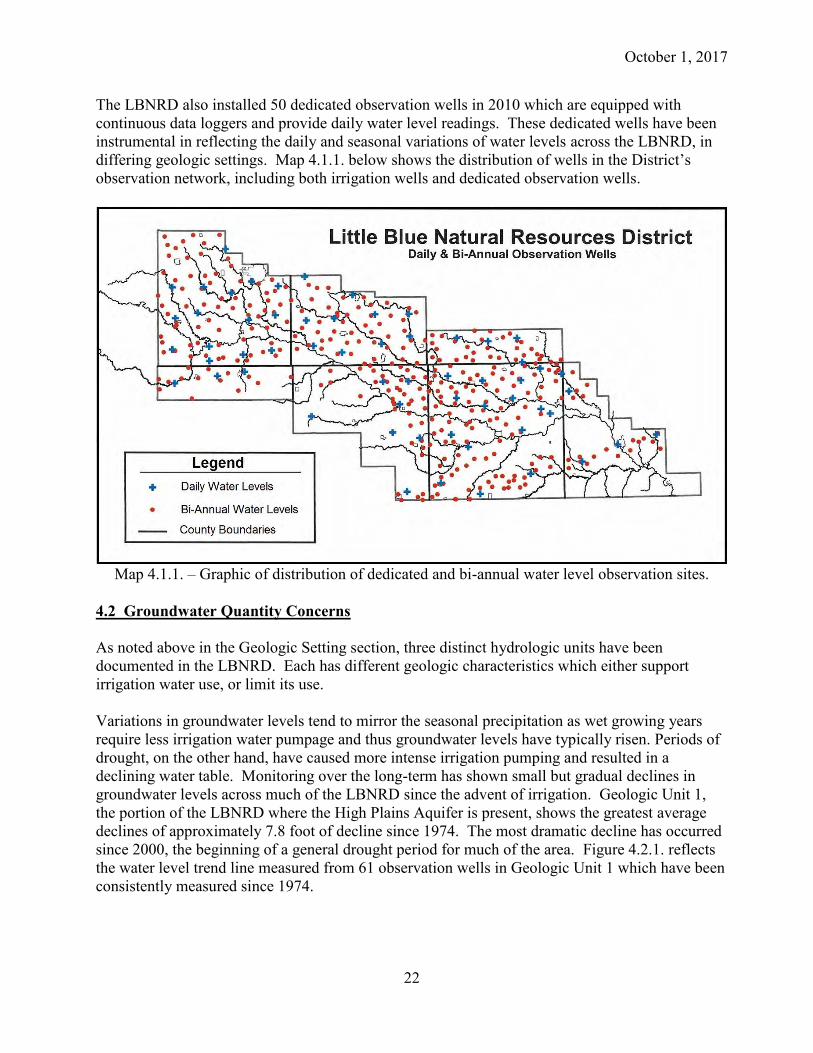
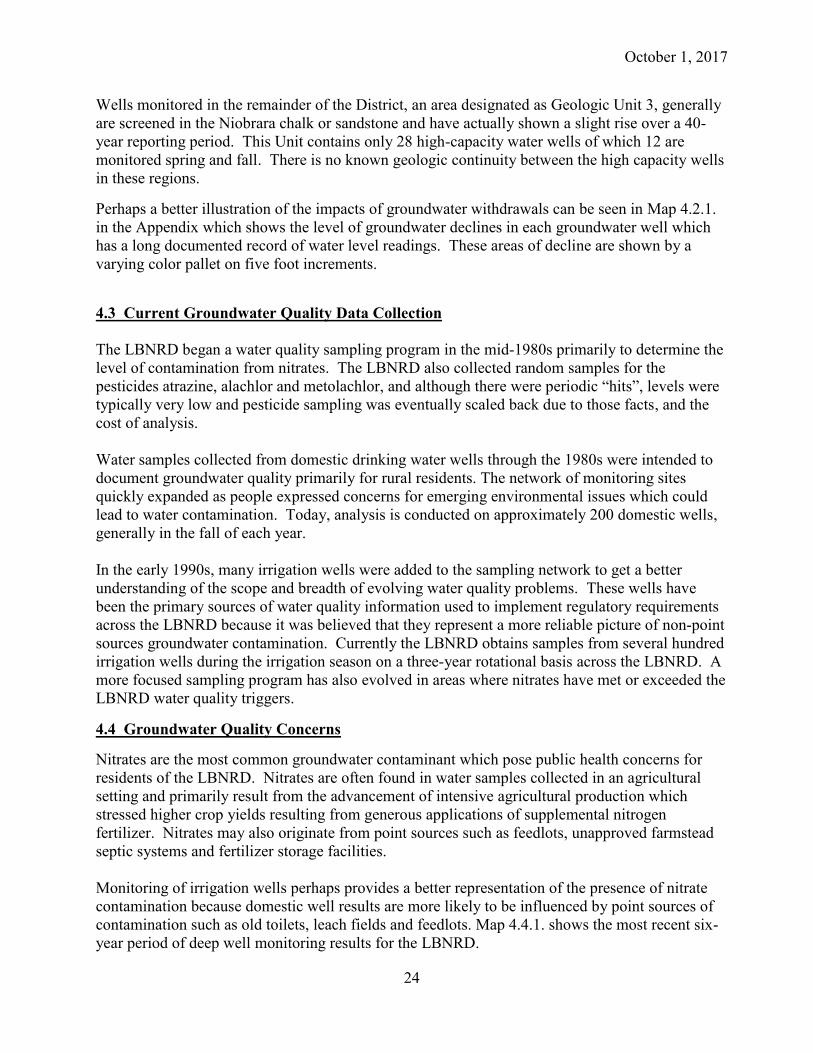
4.2 Groundwater Quantity Concerns As noted above in the Geologic Setting section, three distinct hydrologic units have been documented in the LBNRD. Each has different geologic characteristics which either support irrigation water use, or limit its use. Variations in groundwater levels tend to mirror the seasonal precipitation as wet growing years require less irrigation water pumpage and thus groundwater levels have typically risen. Periods of drought, on the other hand, have caused more intense irrigation pumping and resulted in a declining water table. Monitoring over the long-term has shown small but gradual declines in groundwater levels across much of the LBNRD since the advent of irrigation. Geologic Unit 1, the portion of the LBNRD where the High Plains Aquifer is present, shows the greatest average declines of approximately 7.8 foot of decline since 1974. The most dramatic decline has occurred since 2000, the beginning of a general drought period for much of the area. Figure 4.2.1. reflects the water level trend line measured from 61 observation wells in Geologic Unit 1 which have been consistently measured since 1974.
October 1, 2017
23
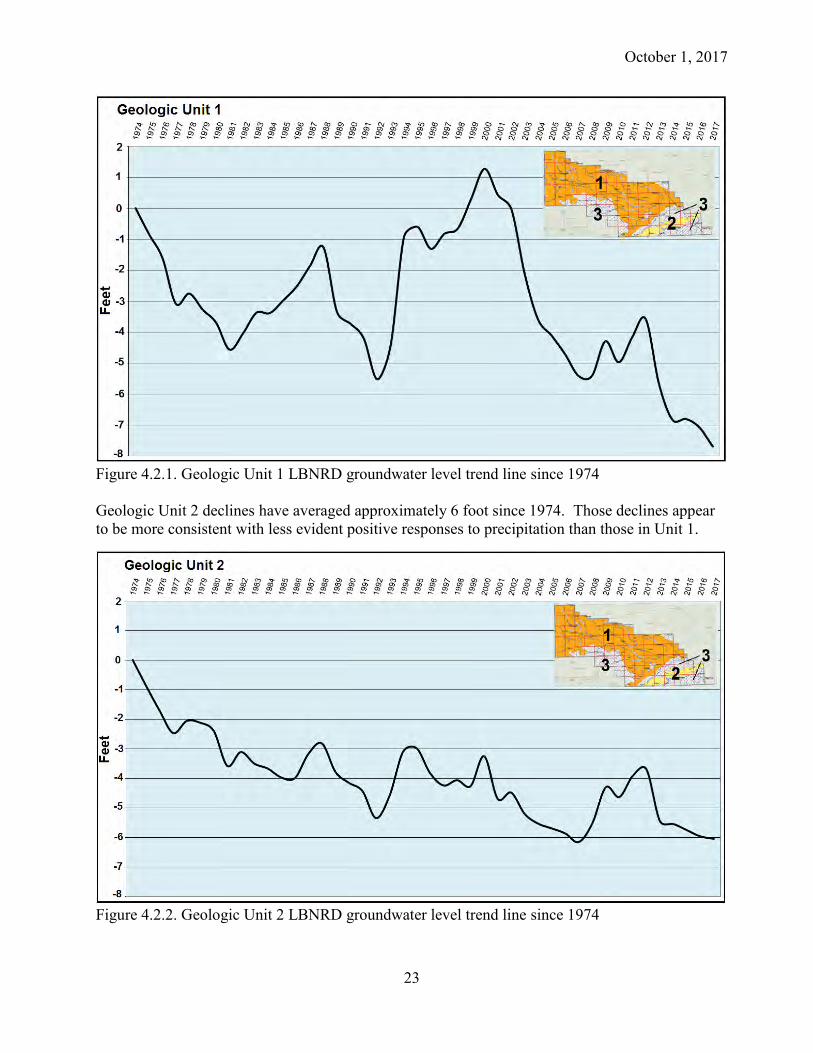
Figure 4.2.1. Geologic Unit 1 LBNRD groundwater level trend line since 1974 Geologic Unit 2 declines have averaged approximately 6 foot since 1974. Those declines appear to be more consistent with less evident positive responses to precipitation than those in Unit 1.
Figure 4.2.2. Geologic Unit 2 LBNRD groundwater level trend line since 1974
October 1, 2017
24
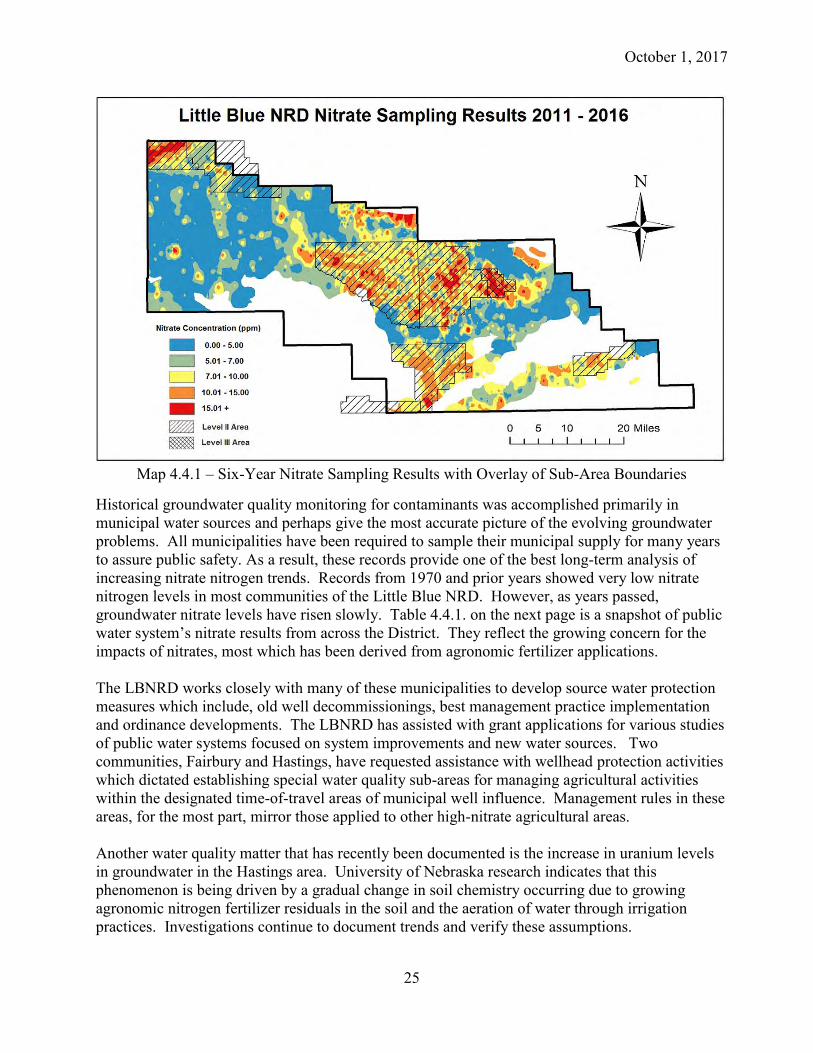
Wells monitored in the remainder of the District, an area designated as Geologic Unit 3, generally are screened in the Niobrara chalk or sandstone and have actually shown a slight rise over a 40-year reporting period. This Unit contains only 28 high-capacity water wells of which 12 are monitored spring and fall. There is no known geologic continuity between the high capacity wells in these regions. Perhaps a better illustration of the impacts of groundwater withdrawals can be seen in Map 4.2.1. in the Appendix which shows the level of groundwater declines in each groundwater well which has a long documented record of water level readings. These areas of decline are shown by a varying color pallet on five foot increments. 4.3 Current Groundwater Quality Data Collection The LBNRD began a water quality sampling program in the mid-1980s primarily to determine the level of contamination from nitrates. The LBNRD also collected random samples for the pesticides atrazine, alachlor and metolachlor, and although there were periodic “hits”, levels were typically very low and pesticide sampling was eventually scaled back due to those facts, and the cost of analysis. Water samples collected from domestic drinking water wells through the 1980s were intended to document groundwater quality primarily for rural residents. The network of monitoring sites quickly expanded as people expressed concerns for emerging environmental issues which could lead to water contamination. Today, analysis is conducted on approximately 200 domestic wells, generally in the fall of each year. In the early 1990s, many irrigation wells were added to the sampling network to get a better understanding of the scope and breadth of evolving water quality problems. These wells have been the primary sources of water quality information used to implement regulatory requirements across the LBNRD because it was believed that they represent a more reliable picture of non-point sources groundwater contamination. Currently the LBNRD obtains samples from several hundred irrigation wells during the irrigation season on a three-year rotational basis across the LBNRD. A more focused sampling program has also evolved in areas where nitrates have met or exceeded the LBNRD water quality triggers. 4.4 Groundwater Quality Concerns Nitrates are the most common groundwater contaminant which pose public health concerns for residents of the LBNRD. Nitrates are often found in water samples collected in an agricultural setting and primarily result from the advancement of intensive agricultural production which stressed higher crop yields resulting from generous applications of supplemental nitrogen fertilizer. Nitrates may also originate from point sources such as feedlots, unapproved farmstead septic systems and fertilizer storage facilities. Monitoring of irrigation wells perhaps provides a better representation of the presence of nitrate contamination because domestic well results are more likely to be influenced by point sources of contamination such as old toilets, leach fields and feedlots. Map 4.4.1. shows the most recent six-year period of deep well monitoring results for the LBNRD.
October 1, 2017
25
Map 4.4.1 – Six-Year Nitrate Sampling Results with Overlay of Sub-Area Boundaries
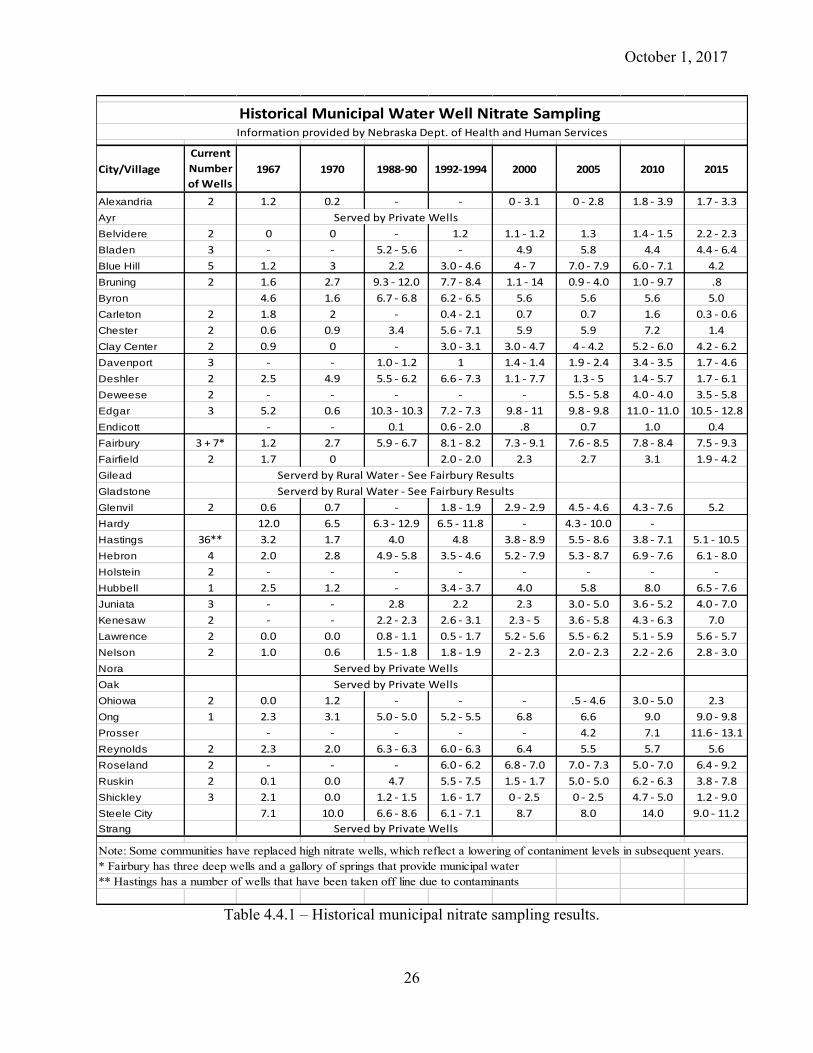
Historical groundwater quality monitoring for contaminants was accomplished primarily in municipal water sources and perhaps give the most accurate picture of the evolving groundwater problems. All municipalities have been required to sample their municipal supply for many years to assure public safety. As a result, these records provide one of the best long-term analysis of increasing nitrate nitrogen trends. Records from 1970 and prior years showed very low nitrate nitrogen levels in most communities of the Little Blue NRD. However, as years passed, groundwater nitrate levels have risen slowly. Table 4.4.1. on the next page is a snapshot of public water system’s nitrate results from across the District. They reflect the growing concern for the impacts of nitrates, most which has been derived from agronomic fertilizer applications. The LBNRD works closely with many of these municipalities to develop source water protection measures which include, old well decommissionings, best management practice implementation and ordinance developments. The LBNRD has assisted with grant applications for various studies of public water systems focused on system improvements and new water sources. Two communities, Fairbury and Hastings, have requested assistance with wellhead protection activities which dictated establishing special water quality sub-areas for managing agricultural activities within the designated time-of-travel areas of municipal well influence. Management rules in these areas, for the most part, mirror those applied to other high-nitrate agricultural areas. Another water quality matter that has recently been documented is the increase in uranium levels in groundwater in the Hastings area. University of Nebraska research indicates that this phenomenon is being driven by a gradual change in soil chemistry occurring due to growing agronomic nitrogen fertilizer residuals in the soil and the aeration of water through irrigation practices. Investigations continue to document trends and verify these assumptions.
October 1, 2017
26
City/Village
Current
Number
of Wells
1967 1970 1988-90 1992-1994 2000 2005 2010 2015
Alexandria 2 1.2 0.2 - - 0 - 3.1 0 - 2.8 1.8 - 3.9 1.7 - 3.3
Ayr Served by Private Wells
Belvidere 2 0 0 - 1.2 1.1 - 1.2 1.3 1.4 - 1.5 2.2 - 2.3
Bladen 3 - - 5.2 - 5.6 - 4.9 5.8 4.4 4.4 - 6.4
Blue Hill 5 1.2 3 2.2 3.0 - 4.6 4 - 7 7.0 - 7.9 6.0 - 7.1 4.2
Bruning 2 1.6 2.7 9.3 - 12.0 7.7 - 8.4 1.1 - 14 0.9 - 4.0 1.0 - 9.7 .8
Byron 4.6 1.6 6.7 - 6.8 6.2 - 6.5 5.6 5.6 5.6 5.0
Carleton 2 1.8 2 - 0.4 - 2.1 0.7 0.7 1.6 0.3 - 0.6
Chester 2 0.6 0.9 3.4 5.6 - 7.1 5.9 5.9 7.2 1.4
Clay Center 2 0.9 0 - 3.0 - 3.1 3.0 - 4.7 4 - 4.2 5.2 - 6.0 4.2 - 6.2
Davenport 3 - - 1.0 - 1.2 1 1.4 - 1.4 1.9 - 2.4 3.4 - 3.5 1.7 - 4.6
Deshler 2 2.5 4.9 5.5 - 6.2 6.6 - 7.3 1.1 - 7.7 1.3 - 5 1.4 - 5.7 1.7 - 6.1
Deweese 2 - - - - - 5.5 - 5.8 4.0 - 4.0 3.5 - 5.8
Edgar 3 5.2 0.6 10.3 - 10.3 7.2 - 7.3 9.8 - 11 9.8 - 9.8 11.0 - 11.0 10.5 - 12.8
Endicott - - 0.1 0.6 - 2.0 .8 0.7 1.0 0.4
Fairbury 3 + 7* 1.2 2.7 5.9 - 6.7 8.1 - 8.2 7.3 - 9.1 7.6 - 8.5 7.8 - 8.4 7.5 - 9.3
Fairfield 2 1.7 0 2.0 - 2.0 2.3 2.7 3.1 1.9 - 4.2
Gilead Serverd by Rural Water - See Fairbury Results
Gladstone Serverd by Rural Water - See Fairbury Results
Glenvil 2 0.6 0.7 - 1.8 - 1.9 2.9 - 2.9 4.5 - 4.6 4.3 - 7.6 5.2
Hardy 12.0 6.5 6.3 - 12.9 6.5 - 11.8 - 4.3 - 10.0 -
Hastings 36** 3.2 1.7 4.0 4.8 3.8 - 8.9 5.5 - 8.6 3.8 - 7.1 5.1 - 10.5
Hebron 4 2.0 2.8 4.9 - 5.8 3.5 - 4.6 5.2 - 7.9 5.3 - 8.7 6.9 - 7.6 6.1 - 8.0
Holstein 2 - - - - - - - -
Hubbell 1 2.5 1.2 - 3.4 - 3.7 4.0 5.8 8.0 6.5 - 7.6
Juniata 3 - - 2.8 2.2 2.3 3.0 - 5.0 3.6 - 5.2 4.0 - 7.0
Kenesaw 2 - - 2.2 - 2.3 2.6 - 3.1 2.3 - 5 3.6 - 5.8 4.3 - 6.3 7.0
Lawrence 2 0.0 0.0 0.8 - 1.1 0.5 - 1.7 5.2 - 5.6 5.5 - 6.2 5.1 - 5.9 5.6 - 5.7
Nelson 2 1.0 0.6 1.5 - 1.8 1.8 - 1.9 2 - 2.3 2.0 - 2.3 2.2 - 2.6 2.8 - 3.0
Nora Served by Private Wells
Oak Served by Private Wells
Ohiowa 2 0.0 1.2 - - - .5 - 4.6 3.0 - 5.0 2.3
Ong 1 2.3 3.1 5.0 - 5.0 5.2 - 5.5 6.8 6.6 9.0 9.0 - 9.8
Prosser - - - - - 4.2 7.1 11.6 - 13.1
Reynolds 2 2.3 2.0 6.3 - 6.3 6.0 - 6.3 6.4 5.5 5.7 5.6
Roseland 2 - - - 6.0 - 6.2 6.8 - 7.0 7.0 - 7.3 5.0 - 7.0 6.4 - 9.2
Ruskin 2 0.1 0.0 4.7 5.5 - 7.5 1.5 - 1.7 5.0 - 5.0 6.2 - 6.3 3.8 - 7.8
Shickley 3 2.1 0.0 1.2 - 1.5 1.6 - 1.7 0 - 2.5 0 - 2.5 4.7 - 5.0 1.2 - 9.0
Steele City 7.1 10.0 6.6 - 8.6 6.1 - 7.1 8.7 8.0 14.0 9.0 - 11.2
Strang Served by Private Wells
Note: Some communities have replaced high nitrate wells, which reflect a lowering of contaniment levels in subsequent years.* Fairbury has three deep wells and a gallory of springs that provide municipal water** Hastings has a number of wells that have been taken off line due to contaminants
Historical Municipal Water Well Nitrate Sampling Information provided by Nebraska Dept. of Health and Human Services
Table 4.4.1 – Historical municipal nitrate sampling results.
October 1, 2017
27
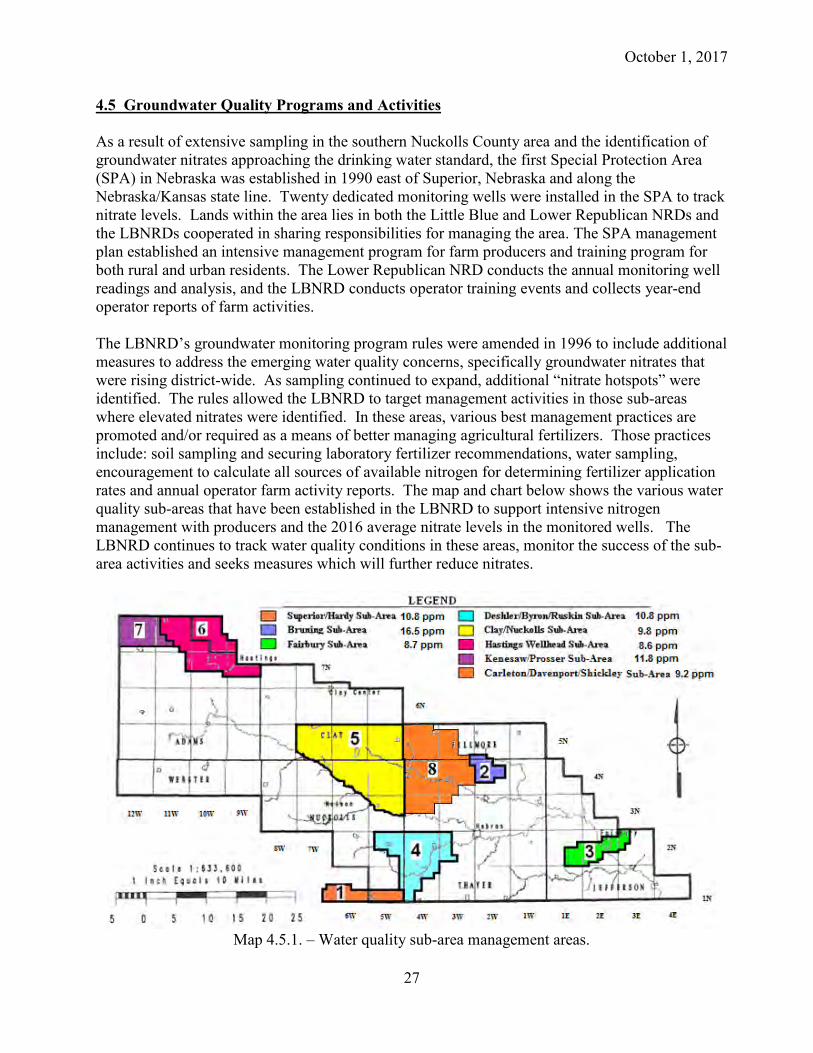
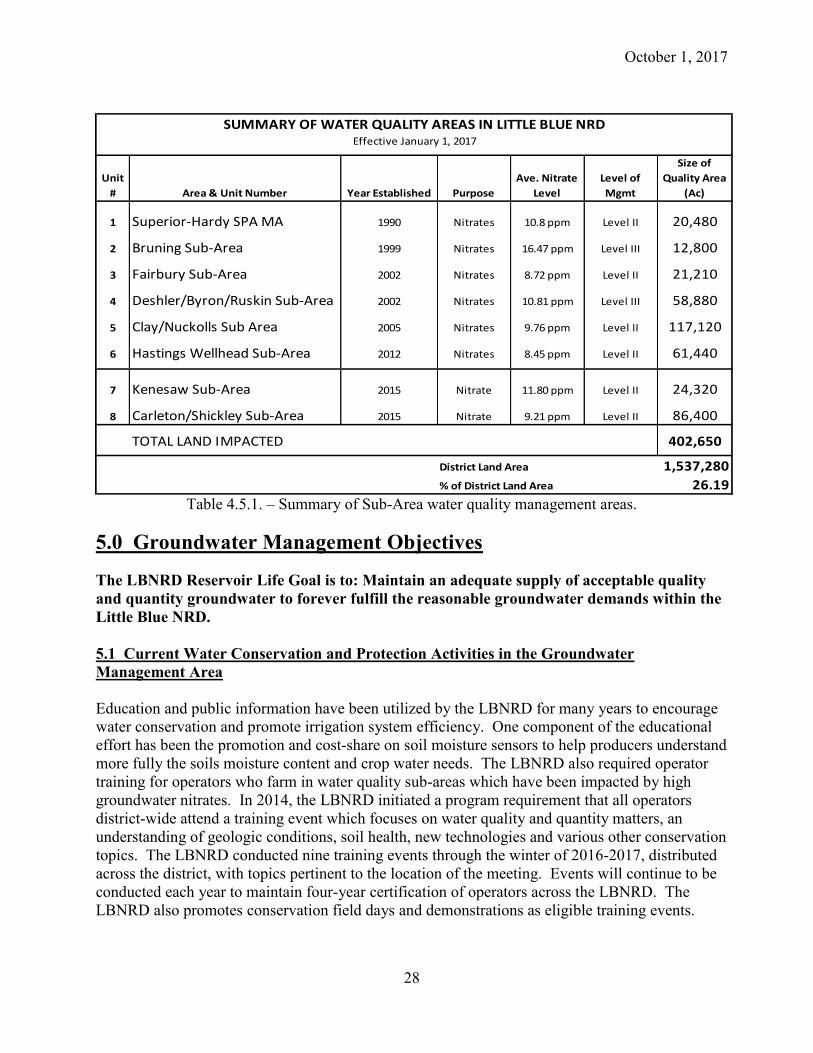
4.5 Groundwater Quality Programs and Activities As a result of extensive sampling in the southern Nuckolls County area and the identification of groundwater nitrates approaching the drinking water standard, the first Special Protection Area (SPA) in Nebraska was established in 1990 east of Superior, Nebraska and along the Nebraska/Kansas state line. Twenty dedicated monitoring wells were installed in the SPA to track nitrate levels. Lands within the area lies in both the Little Blue and Lower Republican NRDs and the LBNRDs cooperated in sharing responsibilities for managing the area. The SPA management plan established an intensive management program for farm producers and training program for both rural and urban residents. The Lower Republican NRD conducts the annual monitoring well readings and analysis, and the LBNRD conducts operator training events and collects year-end operator reports of farm activities. The LBNRD’s groundwater monitoring program rules were amended in 1996 to include additional measures to address the emerging water quality concerns, specifically groundwater nitrates that were rising district-wide. As sampling continued to expand, additional “nitrate hotspots” were identified. The rules allowed the LBNRD to target management activities in those sub-areas where elevated nitrates were identified. In these areas, various best management practices are promoted and/or required as a means of better managing agricultural fertilizers. Those practices include: soil sampling and securing laboratory fertilizer recommendations, water sampling, encouragement to calculate all sources of available nitrogen for determining fertilizer application rates and annual operator farm activity reports. The map and chart below shows the various water quality sub-areas that have been established in the LBNRD to support intensive nitrogen management with producers and the 2016 average nitrate levels in the monitored wells. The LBNRD continues to track water quality conditions in these areas, monitor the success of the sub-area activities and seeks measures which will further reduce nitrates.
Map 4.5.1. – Water quality sub-area management areas.
October 1, 2017
28
Unit
# Area & Unit Number Year Established Purpose
Ave. Nitrate
Level
Level of
Mgmt
Size of
Quality Area
(Ac)
1 Superior-Hardy SPA MA 1990 Nitrates 10.8 ppm Level II 20,480
2 Bruning Sub-Area 1999 Nitrates 16.47 ppm Level III 12,800
3 Fairbury Sub-Area 2002 Nitrates 8.72 ppm Level II 21,210
4 Deshler/Byron/Ruskin Sub-Area 2002 Nitrates 10.81 ppm Level III 58,880
5 Clay/Nuckolls Sub Area 2005 Nitrates 9.76 ppm Level II 117,120
6 Hastings Wellhead Sub-Area 2012 Nitrates 8.45 ppm Level II 61,440
7 Kenesaw Sub-Area 2015 Nitrate 11.80 ppm Level II 24,320
8 Carleton/Shickley Sub-Area 2015 Nitrate 9.21 ppm Level II 86,400
TOTAL LAND IMPACTED 402,650
1,537,280
26.19
District Land Area
% of District Land Area
SUMMARY OF WATER QUALITY AREAS IN LITTLE BLUE NRDEffective January 1, 2017
Table 4.5.1. – Summary of Sub-Area water quality management areas.
5.0 Groundwater Management Objectives
The LBNRD Reservoir Life Goal is to: Maintain an adequate supply of acceptable quality and quantity groundwater to forever fulfill the reasonable groundwater demands within the Little Blue NRD. 5.1 Current Water Conservation and Protection Activities in the Groundwater Management Area Education and public information have been utilized by the LBNRD for many years to encourage water conservation and promote irrigation system efficiency. One component of the educational effort has been the promotion and cost-share on soil moisture sensors to help producers understand more fully the soils moisture content and crop water needs. The LBNRD also required operator training for operators who farm in water quality sub-areas which have been impacted by high groundwater nitrates. In 2014, the LBNRD initiated a program requirement that all operators district-wide attend a training event which focuses on water quality and quantity matters, an understanding of geologic conditions, soil health, new technologies and various other conservation topics. The LBNRD conducted nine training events through the winter of 2016-2017, distributed across the district, with topics pertinent to the location of the meeting. Events will continue to be conducted each year to maintain four-year certification of operators across the LBNRD. The LBNRD also promotes conservation field days and demonstrations as eligible training events.
October 1, 2017
29
Cost-share assistance has been provided by the LBNRD for many years for soil and water conservation measures, water quality practices, irrigation management practices and other resources protection measures. Specific to water resources cost share have been water quality practices, soil moisture measuring devices, efficient water saving components for center pivots such as drop nozzles and variable speed control systems, and other new technologies. The LBNRD has worked with nearly every public water suppliers (cities and villages) in the district in developing wellhead protection areas and provided guidance when requested for preparation of ordinances necessary to assure safe and sustainable water supplies. Many regulatory measures authorized in Neb. Rev. Stat. § 46-739 are currently being implemented in the LBNRD, some which address specifically groundwater quality conditions, some addressing groundwater quantity conditions and some which have benefits for both quality and quantity. One District-wide control is the requirement that a permit must be obtained from the LBNRD before the construction of any high-capacity water well in the LBNRD. Another is the prohibition of the application of anhydrous ammonia fertilizers prior to November 1st to prevent off-season leaching of nitrogen fertilizers. Other authorized measures being implemented at the time of this planning document include:
• Well spacing requirements more stringent than those required by the State: o Current well spacing is 1,000 feet between all new high capacity water wells,
except in those areas identified as “very high risk” areas where the spacing is 1,250’. Domestic wells are given a 500’ spacing protection;
• Required installation of devices for measuring groundwater withdrawals from water wells: o All high capacity irrigation wells are required to have an operable flow meter
installed by March 31, 2017 to help water users have a better understanding of their water use;
• Limit or prevent the expansion of irrigated acres or otherwise limit or prevent increases in the consumptive use of groundwater withdrawals from water wells used for irrigation or other beneficial purposes:
o Unit 2, a paleovalley aquifer from Chester to Fairbury was closed to the expansion of irrigated acres in 2006; (Map 5.1.1.)
• Required use of best management practices: o Fertilizer application timing restrictions exist throughout the LBNRD for water
quality management; • Required analysis of water and deep soils for fertilizer content:
o soil sampling and water sampling requirements in water quality management sub-areas;
• Mandatory educational requirements: o Farm operator training events which focus on groundwater quality, groundwater
quantity, geology, soil conservation, soil health and current rules; • Required water quality monitoring and reporting of results for wells in water quality
management areas: o Operator reporting required for fields in water quality sub-areas. Such reporting
requires yield goals, soil sample fertility results and laboratory recommendations, actual fertilizer applied, yields, water nitrates and water applied;
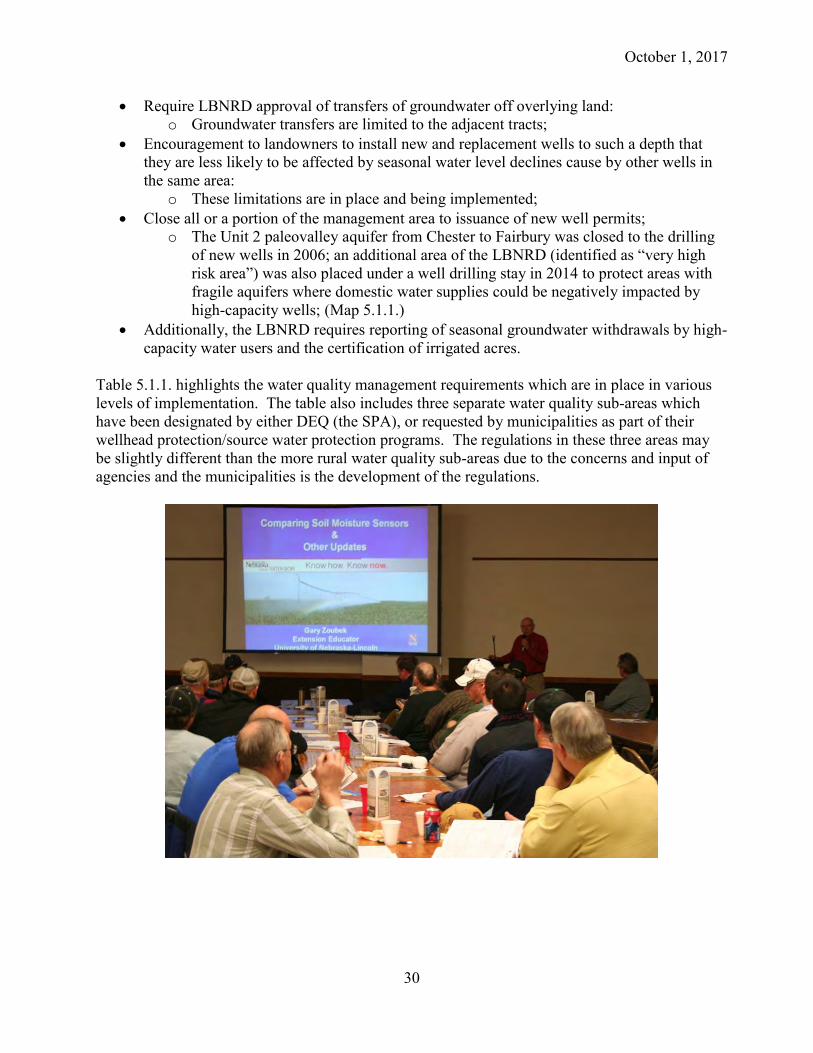
October 1, 2017
30
• Require LBNRD approval of transfers of groundwater off overlying land: o Groundwater transfers are limited to the adjacent tracts;
• Encouragement to landowners to install new and replacement wells to such a depth that they are less likely to be affected by seasonal water level declines cause by other wells in the same area:
o These limitations are in place and being implemented; • Close all or a portion of the management area to issuance of new well permits;
o The Unit 2 paleovalley aquifer from Chester to Fairbury was closed to the drilling of new wells in 2006; an additional area of the LBNRD (identified as “very high risk area”) was also placed under a well drilling stay in 2014 to protect areas with fragile aquifers where domestic water supplies could be negatively impacted by high-capacity wells; (Map 5.1.1.)
• Additionally, the LBNRD requires reporting of seasonal groundwater withdrawals by high-capacity water users and the certification of irrigated acres.
Table 5.1.1. highlights the water quality management requirements which are in place in various levels of implementation. The table also includes three separate water quality sub-areas which have been designated by either DEQ (the SPA), or requested by municipalities as part of their wellhead protection/source water protection programs. The regulations in these three areas may be slightly different than the more rural water quality sub-areas due to the concerns and input of agencies and the municipalities is the development of the regulations.
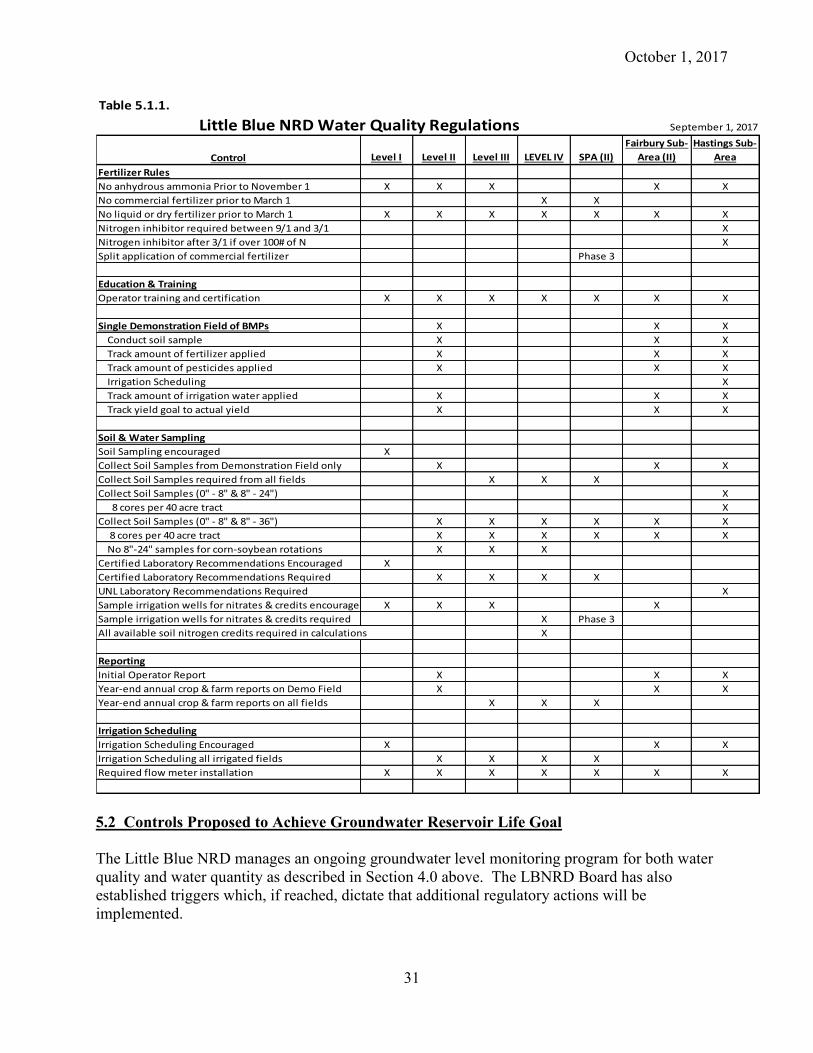
October 1, 2017
31
Table 5.1.1.
Control Level I Level II Level III LEVEL IV SPA (II)
Fairbury Sub-
Area (II)
Hastings Sub-
Area
Fertilizer Rules
No anhydrous ammonia Prior to November 1 X X X X X
No commercial fertilizer prior to March 1 X X
No liquid or dry fertilizer prior to March 1 X X X X X X X
Nitrogen inhibitor required between 9/1 and 3/1 X
Nitrogen inhibitor after 3/1 if over 100# of N X
Split application of commercial fertilizer Phase 3
Education & Training
Operator training and certification X X X X X X X
Single Demonstration Field of BMPs X X X
Conduct soil sample X X X
Track amount of fertilizer applied X X X
Track amount of pesticides applied X X X
Irrigation Scheduling X
Track amount of irrigation water applied X X X
Track yield goal to actual yield X X X
Soil & Water Sampling
Soil Sampling encouraged X
Collect Soil Samples from Demonstration Field only X X X
Collect Soil Samples required from all fields X X X
Collect Soil Samples (0" - 8" & 8" - 24") X
8 cores per 40 acre tract X
Collect Soil Samples (0" - 8" & 8" - 36") X X X X X X
8 cores per 40 acre tract X X X X X X
No 8"-24" samples for corn-soybean rotations X X X
Certified Laboratory Recommendations Encouraged X
Certified Laboratory Recommendations Required X X X X
UNL Laboratory Recommendations Required X
Sample irrigation wells for nitrates & credits encouraged X X X X
Sample irrigation wells for nitrates & credits required X Phase 3
All available soil nitrogen credits required in calculations X
Reporting
Initial Operator Report X X X
Year-end annual crop & farm reports on Demo Field X X X
Year-end annual crop & farm reports on all fields X X X
Irrigation Scheduling
Irrigation Scheduling Encouraged X X X
Irrigation Scheduling all irrigated fields X X X X
Required flow meter installation X X X X X X X
September 1, 2017Little Blue NRD Water Quality Regulations
5.2 Controls Proposed to Achieve Groundwater Reservoir Life Goal The Little Blue NRD manages an ongoing groundwater level monitoring program for both water quality and water quantity as described in Section 4.0 above. The LBNRD Board has also established triggers which, if reached, dictate that additional regulatory actions will be implemented.
October 1, 2017
32
Several areas of the LBNRD have met water quality triggers and are now in designated water quality sub-areas for intense management. Specific management actions are applied according to the threshold of trigger achieved. The following describes the triggers where management actions are progressively applied, and actions to be taken beyond those controls in place currently. 5.2.1 Groundwater Quality Triggers and Actions: The following water quality triggers will continue to be implemented: Contaminant Thresholds
• Level I Triggers - Entire LBNRD is in Level I • Level II Triggers - 60% of MCL (6.0 ppm for Nitrates) • Level III Triggers - 80% of MCL (8.0 ppm for Nitrates) • Level IV Triggers - 100% of MCL (10.0 ppm for Nitrates)
If the LBNRD’s well sampling activities indicate that the average groundwater contaminant levels in 5 or more sampled wells have surpassed the trigger threshold listed above and require further action, and for which a reasonable boundary containing at least 16 square miles can be drawn, a new sub-area will be formed to address those contaminants. The LBNRD may also expand a sub-area to include adjacent lands, without regard to the minimum size criteria, when monitoring evidence dictates such actions are necessary. The LBNRD Board will continue to implement the controls in place at this time, and use any appropriate controls from the list of currently utilized and listed above, or any combination of the additional statutory authorities available to the District in Section 46-739 to address evolving problems, as deemed appropriate. Wellhead protection areas have been delineated for all communities in the Little Blue NRD. If a community experiences rising contaminant levels which pose a threat to their water supply, the community can request the NRD’s assistance in protecting their municipal supply, without regard to the trigger level reached or the size of the management sub-area. Water quality controls which may be implemented generally mirror those available in other water quality sub-areas. However, one objective in the next writing of the District’s rules and regulations is to bring more uniformity to the requirements between the specified levels of water qualitycontrol and those requirements of the separately designated sub-areas. For example, currently the required depth for soil sample collection in the sub-areas is inconsistent. The District intends to seek consistency and uniformity within these controls for ease in management and the reduction of confusion among cooperators. 5.2.2 Groundwater Quantity Triggers and Actions: The LBNRD has developed a management strategy and rules and regulations which focus on 1) building farm operator awareness of water pumped from the aquifer, and 2) understanding soil moisture conditions and actual crop water needs to promote and implement irrigation efficiency. The LBNRD is also establishing a baseline year and acceptable water level decline for determining subsequent controls for water management. This trigger is a key component of this edition of the Groundwater Management Plan re-write and will provide a more proactive approach to groundwater management and protection.
October 1, 2017
33
When the LBNRD’s groundwater monitoring activities indicate that the average spring water level has declined one (1) foot or more below the established 2016 spring groundwater level (baseline), besides implementing the controls currently in place, the LBNRD Board will initiate the allocation of groundwater to water users, and any other control or combination of controls from the statutory authorities available to the LBNRD in Section 46-739 to address evolving problems, as deemed appropriate. This new trigger replaces the triggers in the previous plan which were more reactive and were based on the declines of a percentage of the aquifer for designated hydrologic units before allocation would be considered. If groundwater allocations are implemented as a necessary control, such allocations may vary based on different irrigation distribution systems, or varying climatic, hydrologic, geologic or soil conditions. Allocations will specify the total number of acre inches of water apportioned per irrigated acre per year or multi-year time frame, and such allocation program will be evaluated no more often than every five years. Rules may also vary based on different hydrologic relationships between ground water and surface water. The LBNRD Board will further determine if the relaxation of controls is warranted based on water levels rises. Further, if the then current water management activities are deemed insufficient to reduce the impacts of pumping groundwater, causing insufficient supplies, the loss of well productivity, or conflicts between groundwater users in the same aquifer, additional controls may be implemented. Those additional controls and authorities may include:
• Wider well spacing requirements; • A stay on new well drilling and/or expansion of irrigated acres; • A system of rotation of use of groundwater; • A reduction of irrigated acres; and • Other reasonable rules and regulations as are necessary to carry out the purposes of the
Groundwater Management Area. The LBNRD reserves the authority to spell out specific and appropriate controls through the District’s Rules and Regulations for implementation of the Groundwater Management and Protection Act. In the implementation of any control, the LBNRD will consider new irrigation development, additional groundwater uses, new data or information that was not previously available or other factors as the LBNRD Board believes are warranted. 5.3 Integrated Water Management Objectives The LBNRD Board of Directors recognizes that a portion of the Little Blue NRD has hydrologically connected ground and surface water. Therefore, the LBNRD is currently developing a Voluntary Integrated Water Management Plan which will be completed by late 2018. The rules adopted as a part of the Integrated Water Management Plan shall function in harmony with this Groundwater Management Plan.
October 1, 2017
34
6.0 References
Little Blue River Basin Water Management Plan; May 2016, A long-range implement strategy for managing surface and groundwater for water quality and quantity.
Little Blue NRD Hydro-Geology Study, July 14, 2011, A compilation of hydrogeologic information and preparation of maps to document the characteristics of the LBNRD.
Geochemical Evolution of Ground Water in the Great Plains (Dakota) Aquifer of Nebraska: Implications for the Management of a Regional Aquifer System; David C. Gosselin / F. Edwin Harvey / Carol D. Frost 1-1-2001
Nebraska Agricultural Statistics; 2015, Quick Facts - Cropland acres in Thayer County
Nebraska Department of Health and Human Services; Listing of Municipal Nitrate Readings – 2004 - 2015
Nebraska Department of Natural Resources; INSIGHT Website. January 2017, Analysis of hydrologically connected ground and surface water of the Little Blue NRD.
NRCS NE T.G. Notice 633. Nebraska NRCS List of Threatened and Endangered Species by County. November 2011
Thayer County Farm Service Agency; Crop yields (2009 – 2015)
United States Department of Agriculture; Web Soil Survey, https://websoilsurvey.nrcs.usda.gov/
University of Nebraska Conservation and Survey Division; Land Use Map
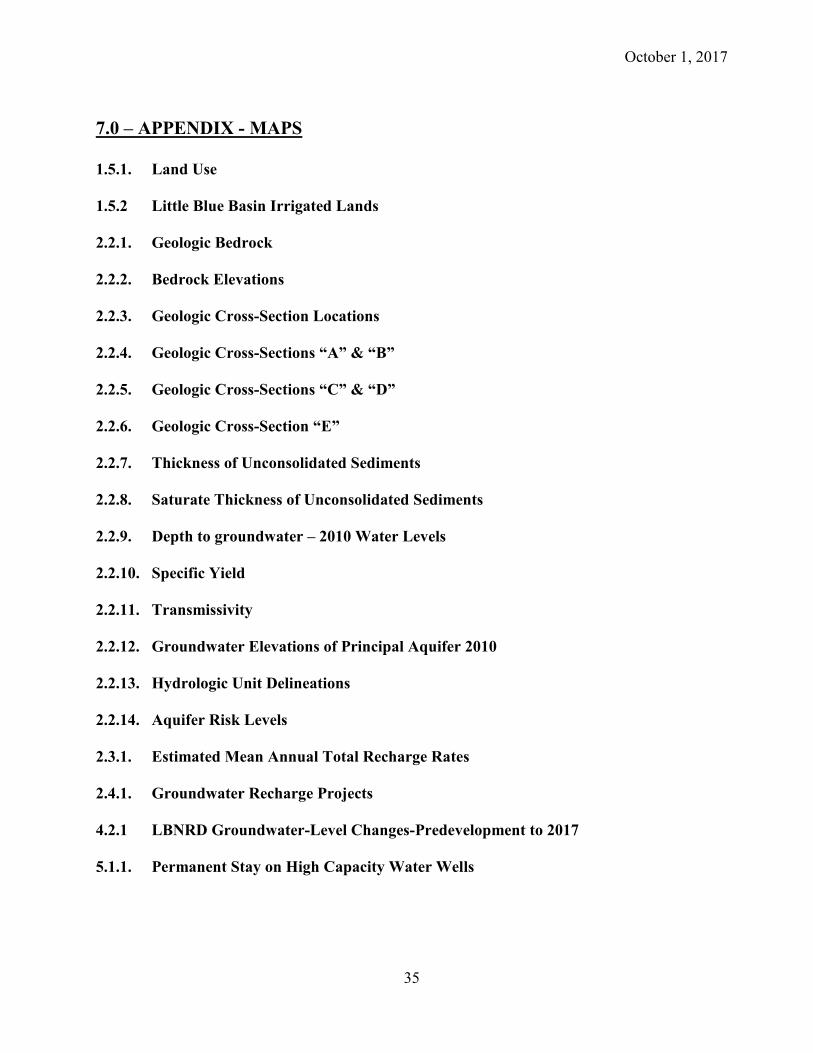
October 1, 2017
35
7.0 – APPENDIX - MAPS 1.5.1. Land Use 1.5.2 Little Blue Basin Irrigated Lands 2.2.1. Geologic Bedrock 2.2.2. Bedrock Elevations 2.2.3. Geologic Cross-Section Locations 2.2.4. Geologic Cross-Sections “A” & “B” 2.2.5. Geologic Cross-Sections “C” & “D” 2.2.6. Geologic Cross-Section “E” 2.2.7. Thickness of Unconsolidated Sediments 2.2.8. Saturate Thickness of Unconsolidated Sediments 2.2.9. Depth to groundwater – 2010 Water Levels 2.2.10. Specific Yield 2.2.11. Transmissivity 2.2.12. Groundwater Elevations of Principal Aquifer 2010 2.2.13. Hydrologic Unit Delineations 2.2.14. Aquifer Risk Levels 2.3.1. Estimated Mean Annual Total Recharge Rates 2.4.1. Groundwater Recharge Projects 4.2.1 LBNRD Groundwater-Level Changes-Predevelopment to 2017 5.1.1. Permanent Stay on High Capacity Water Wells
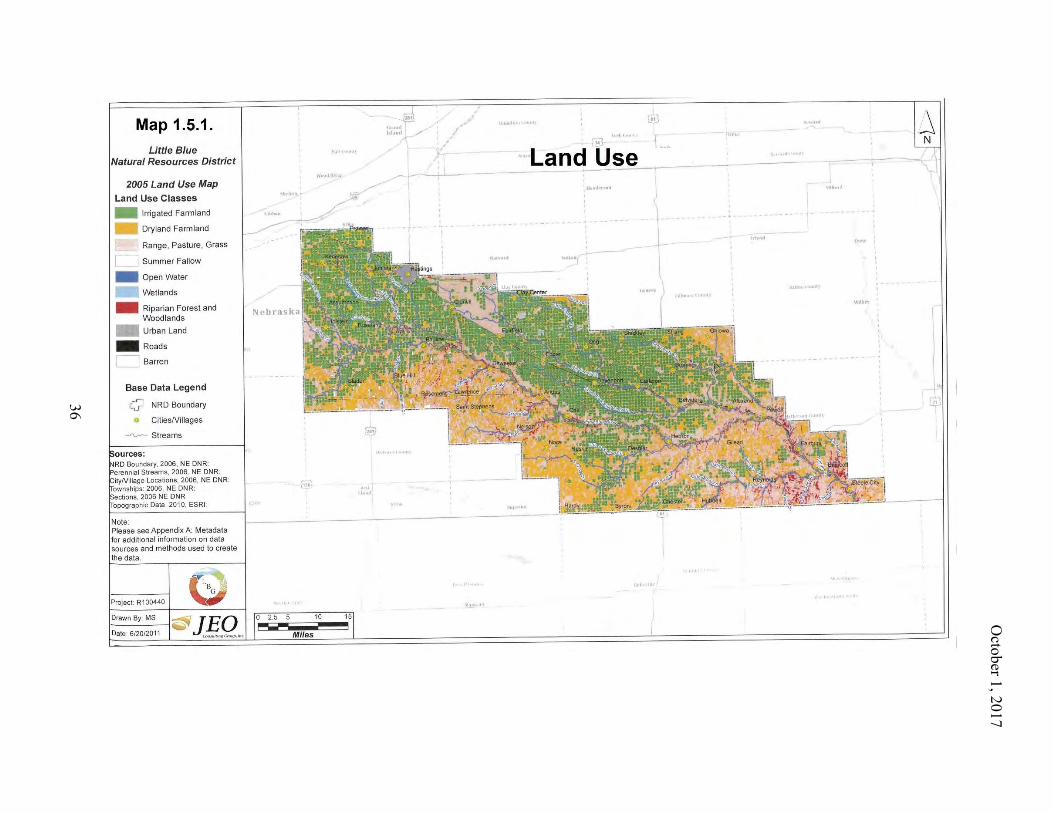
October 1, 2017
36
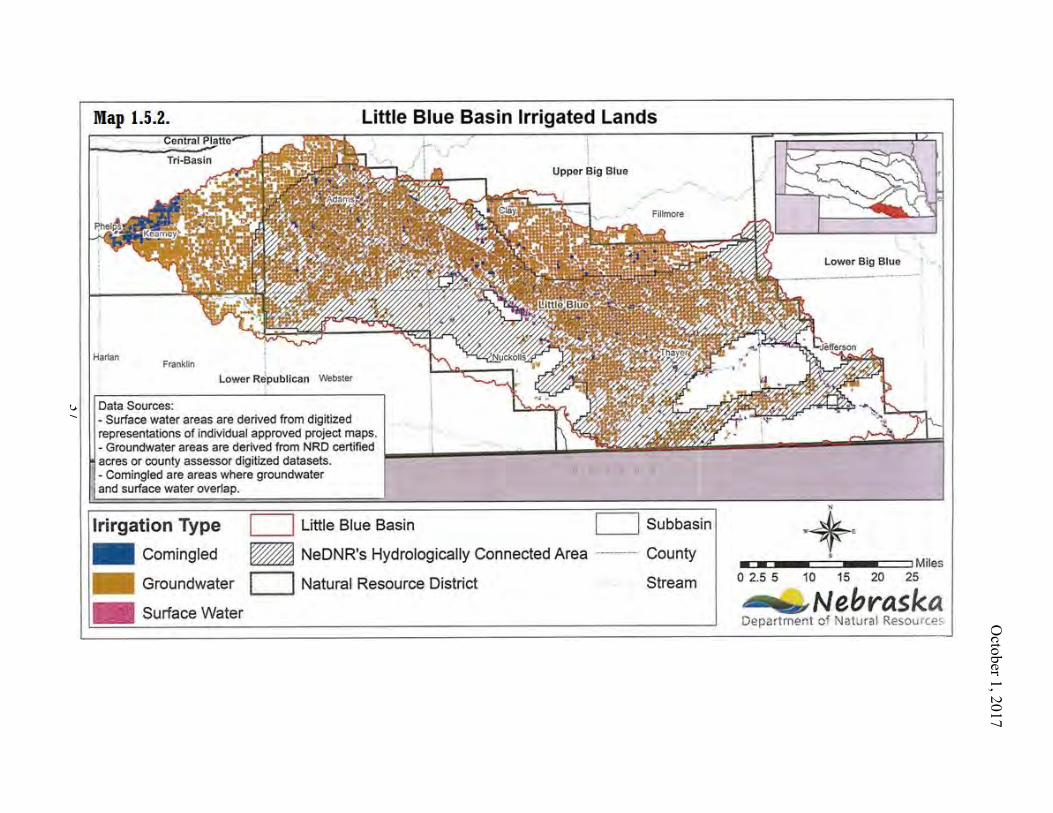
October 1, 2017
37
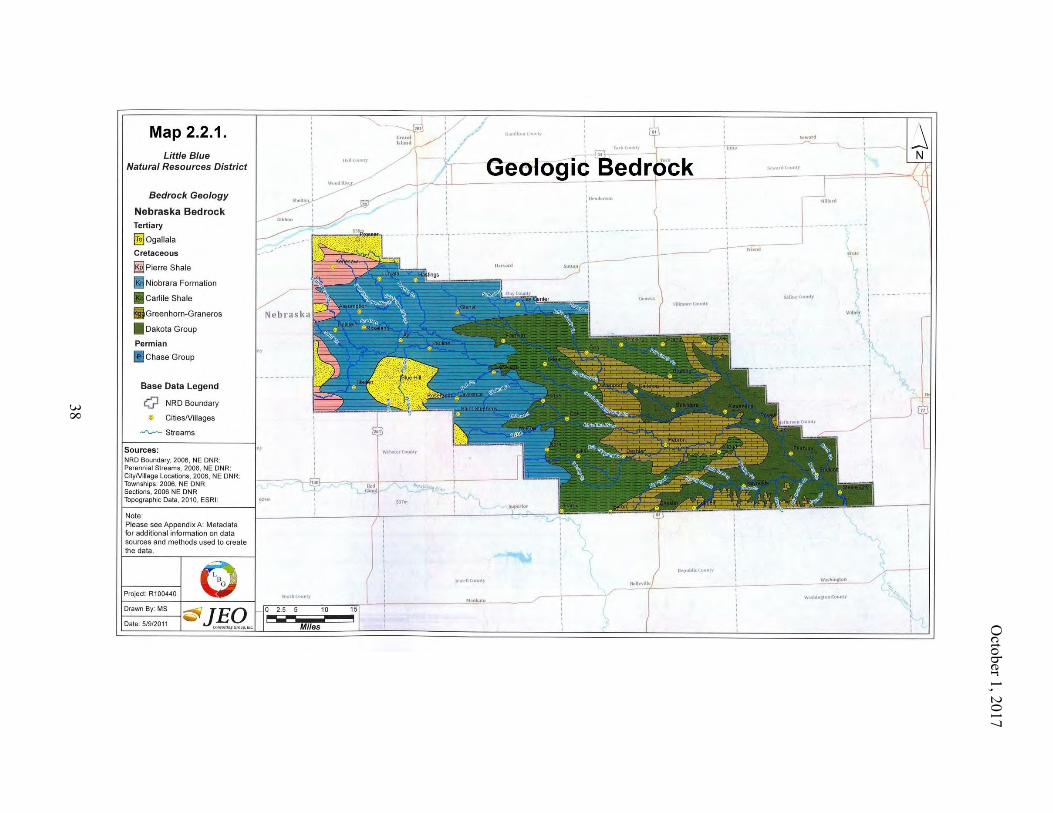
October 1, 2017
38
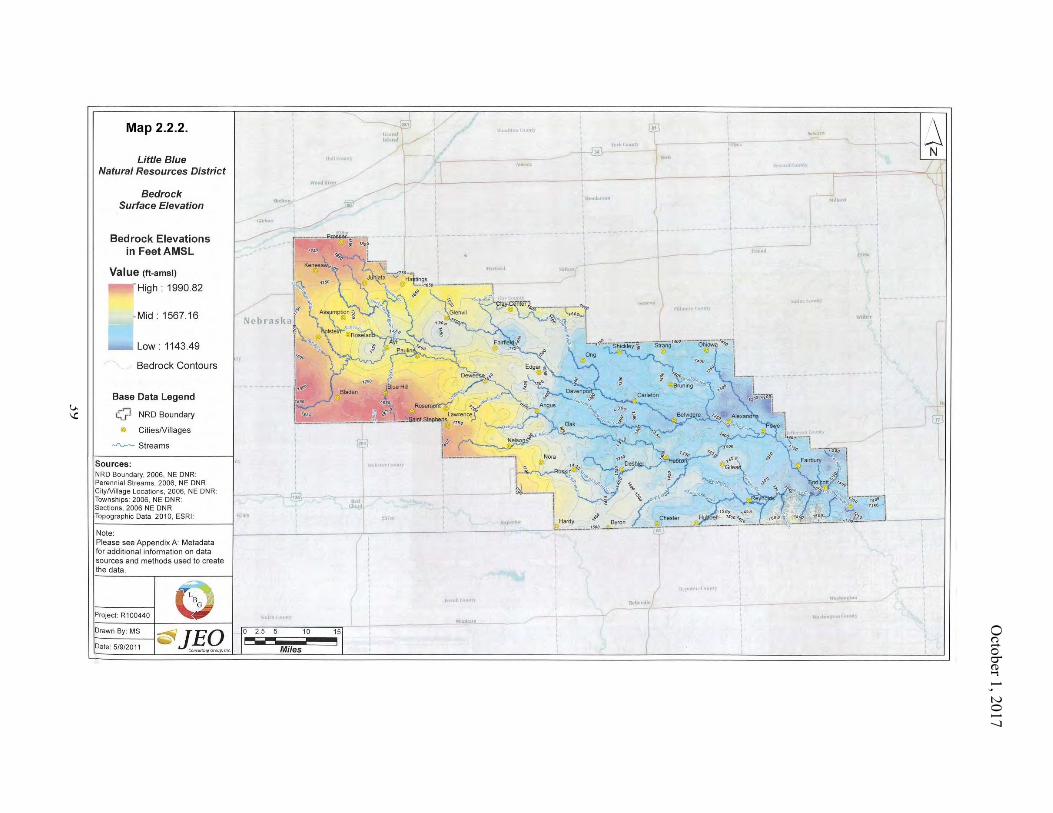
October 1, 2017
39
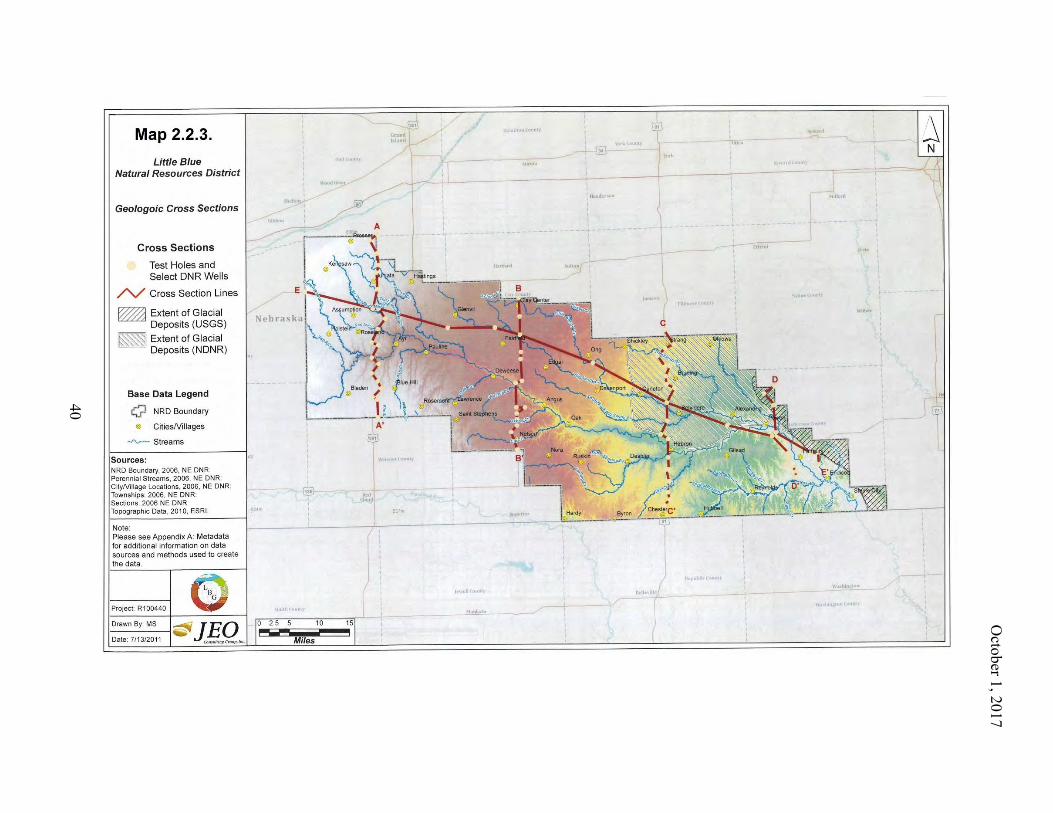
October 1, 2017
40
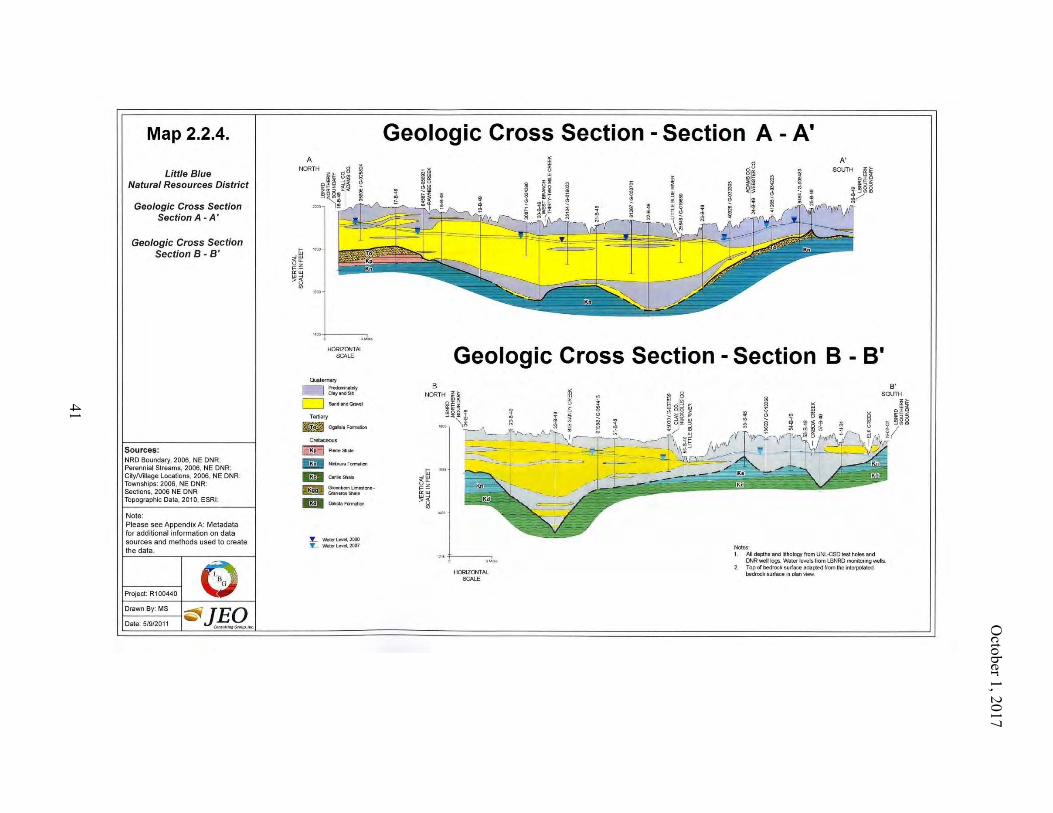
October 1, 2017
41
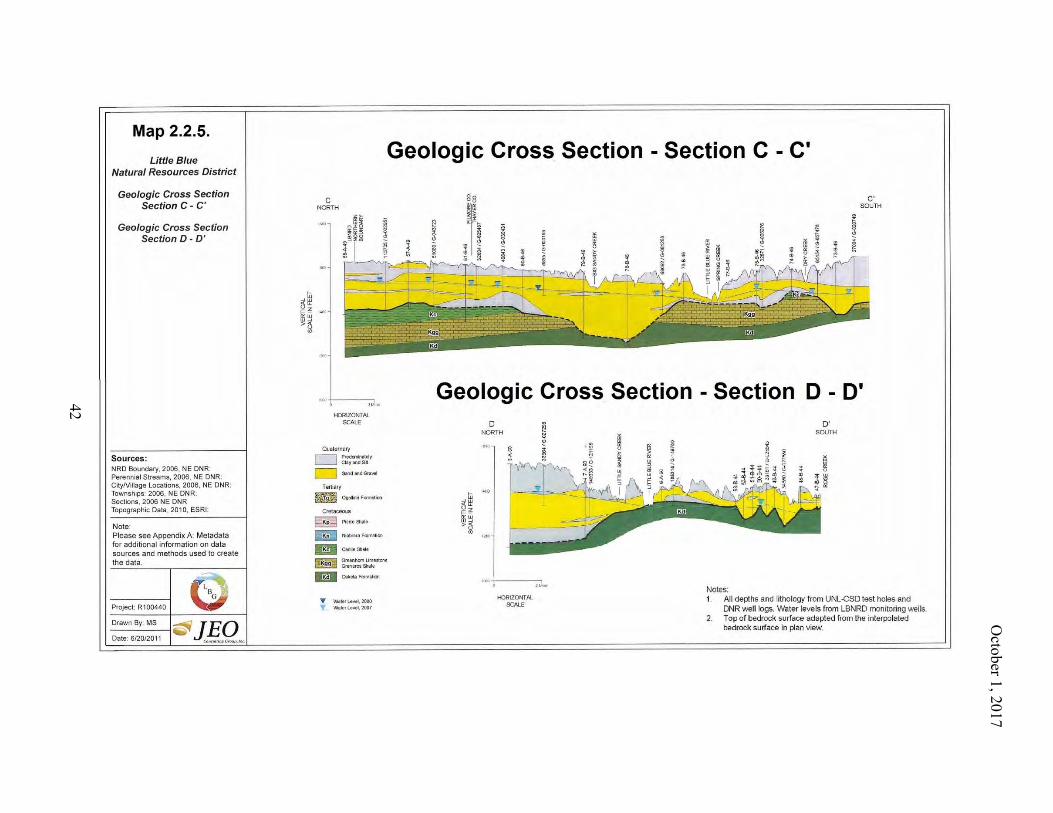
October 1, 2017
42
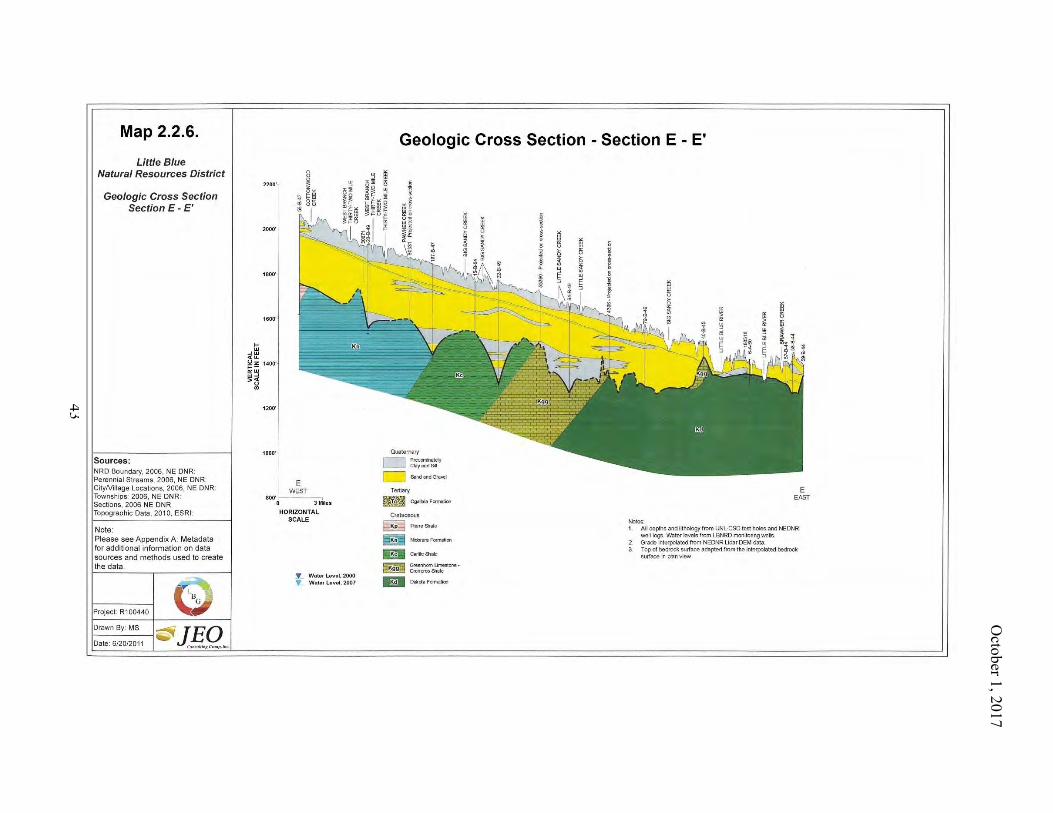
October 1, 2017
43
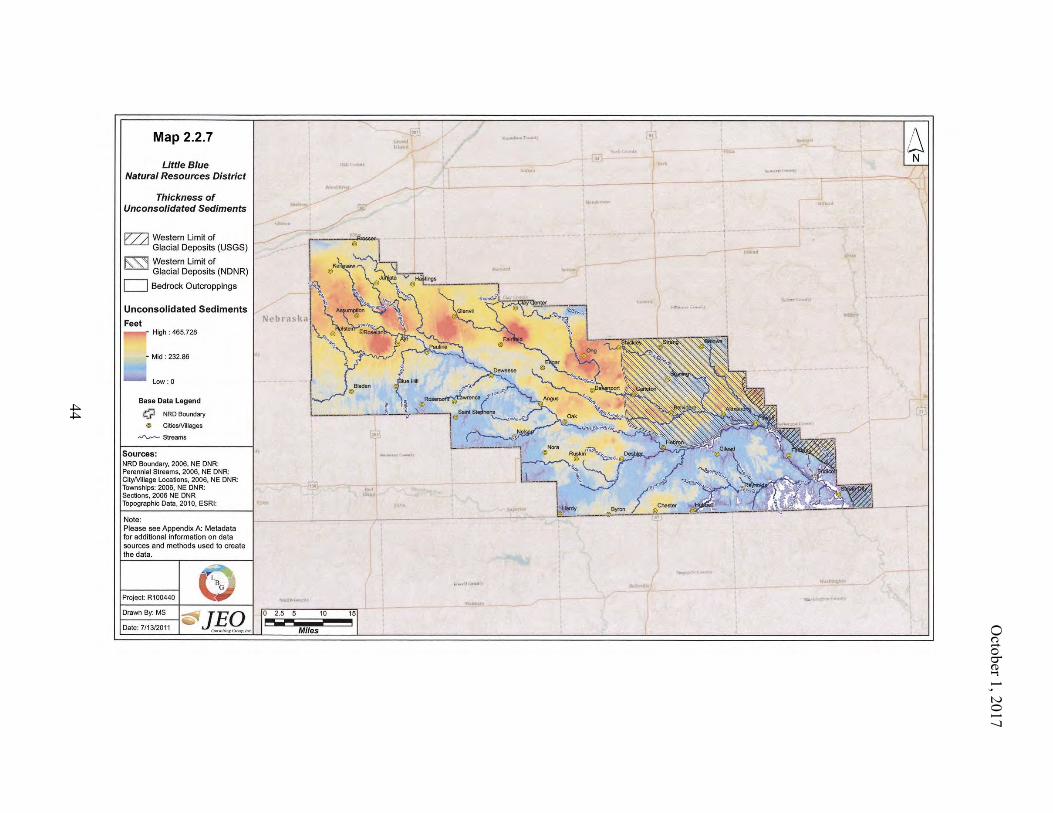
October 1, 2017
44
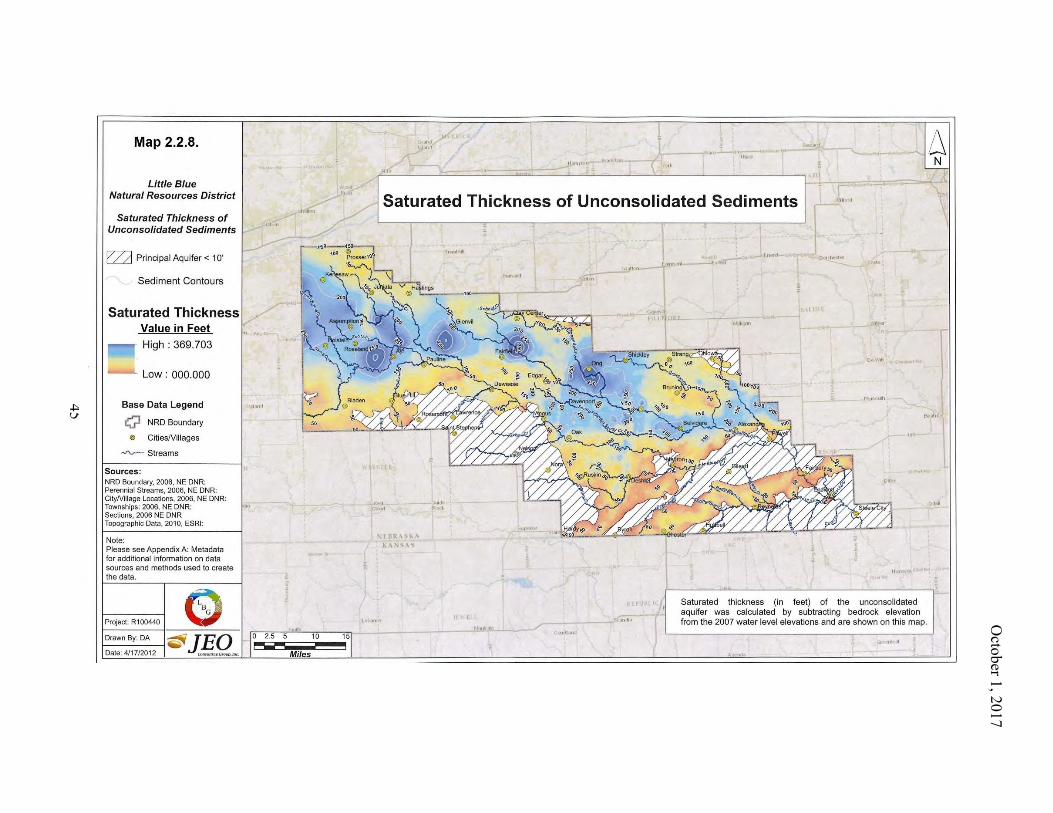
October 1, 2017
45
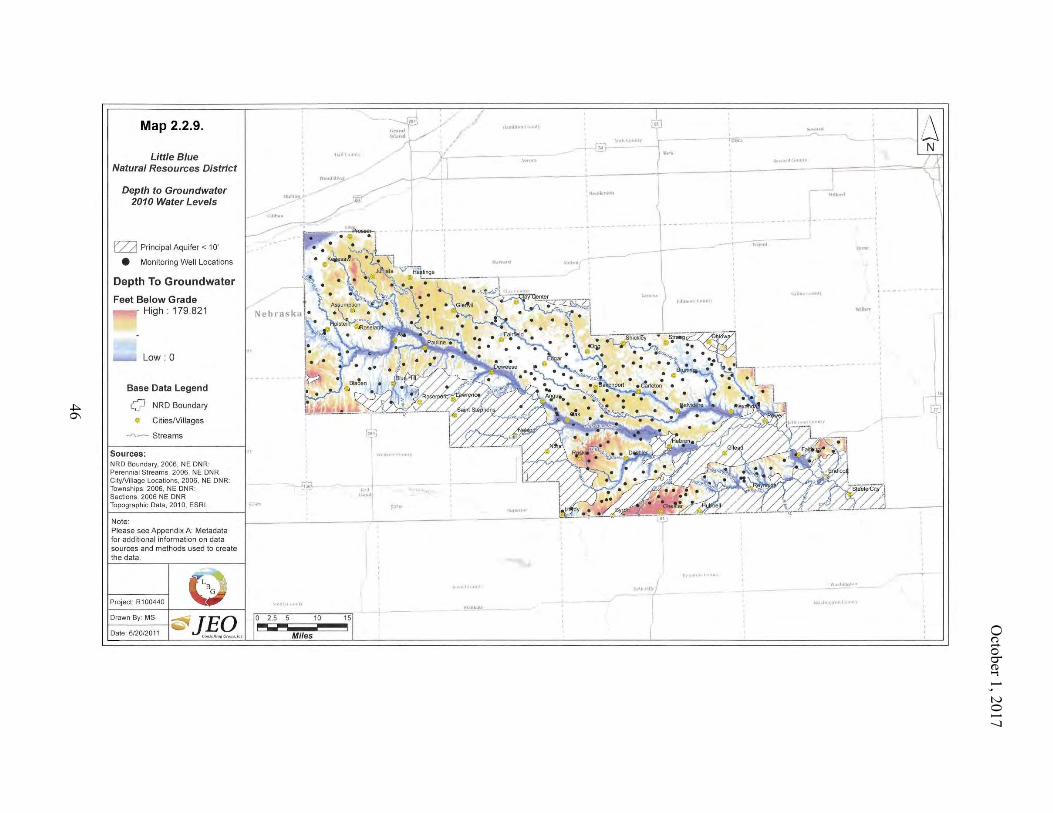
October 1, 2017
46
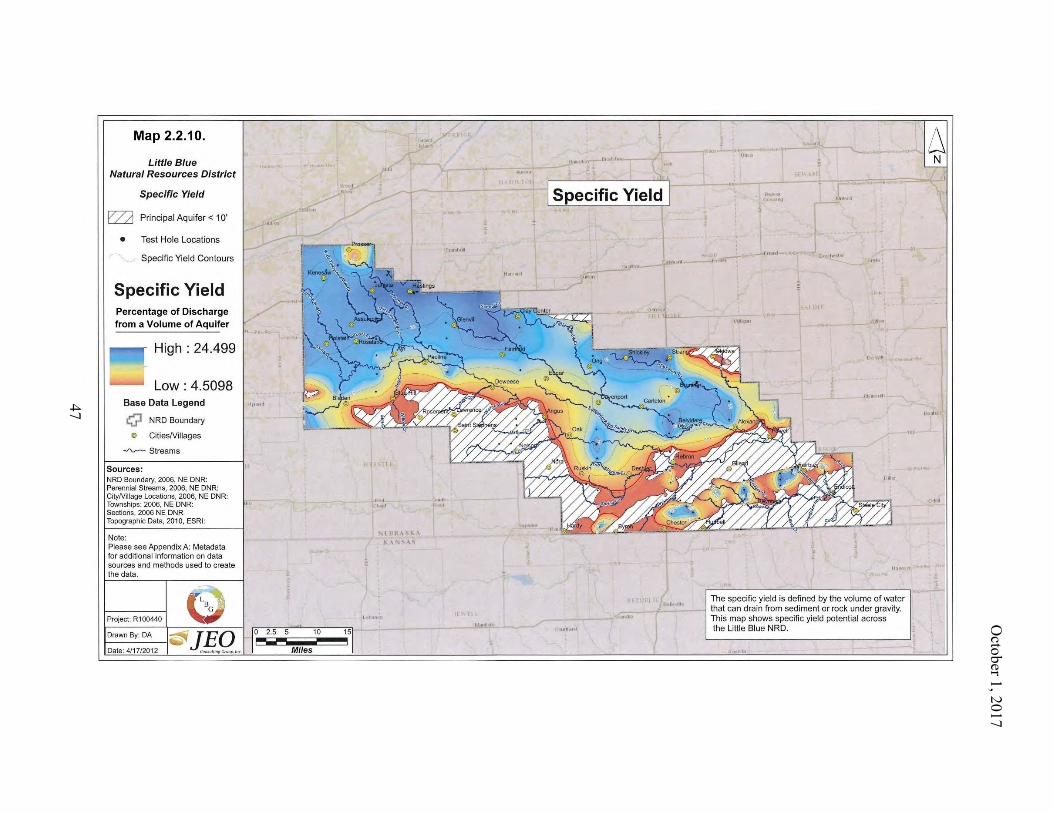
October 1, 2017
47
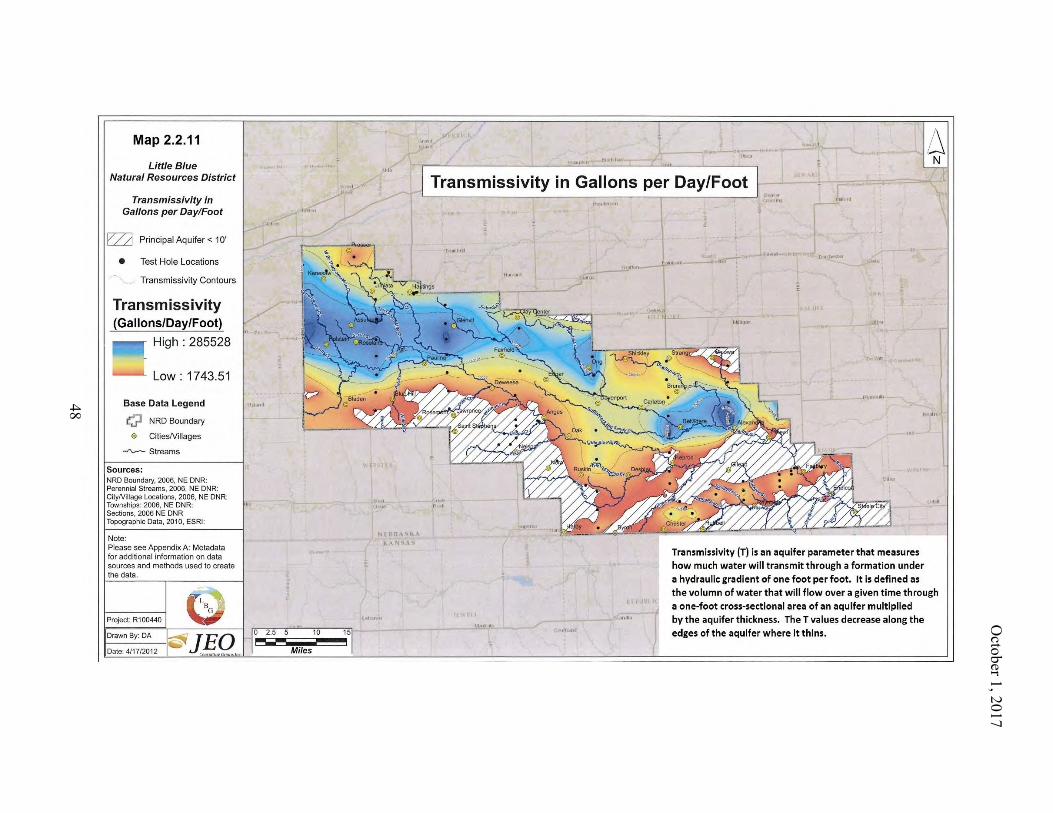
October 1, 2017
48
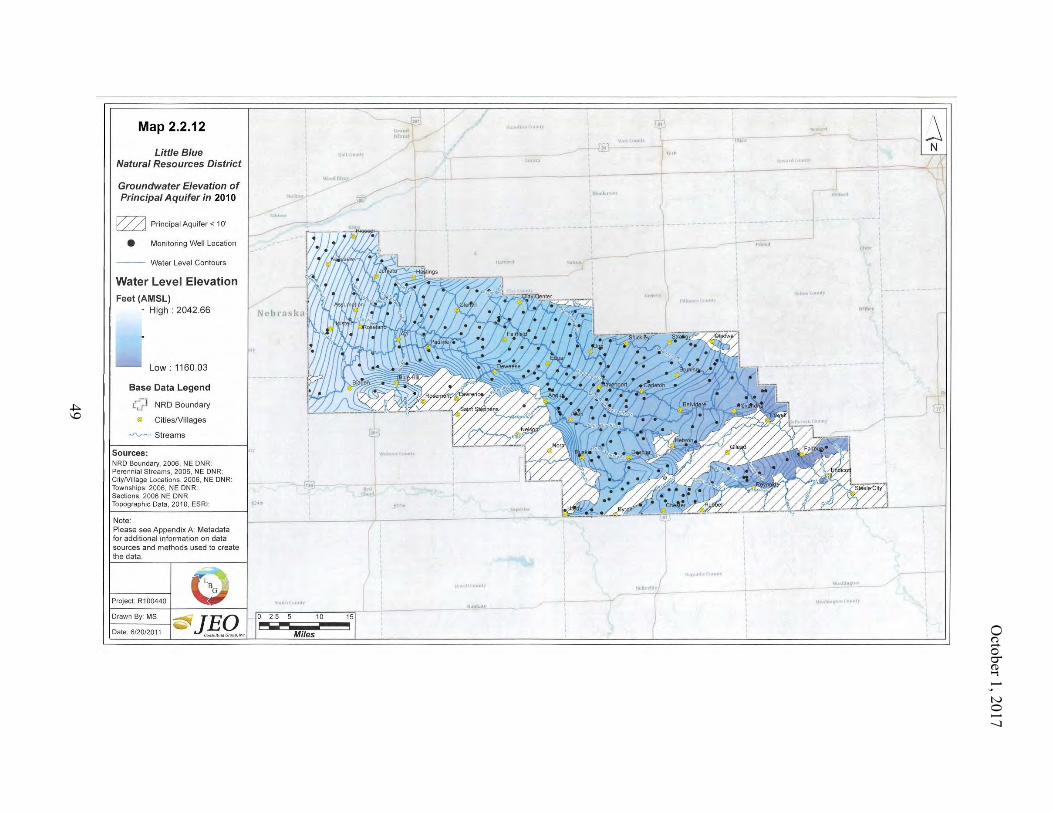
October 1, 2017
49
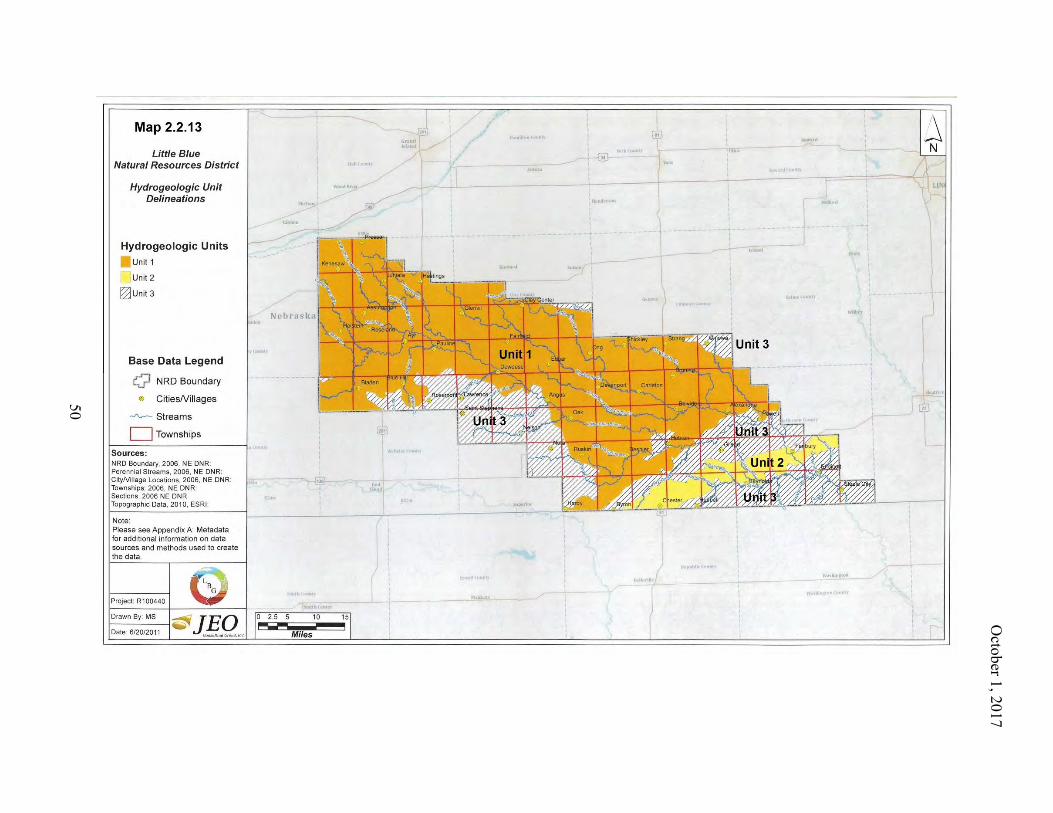
October 1, 2017
50
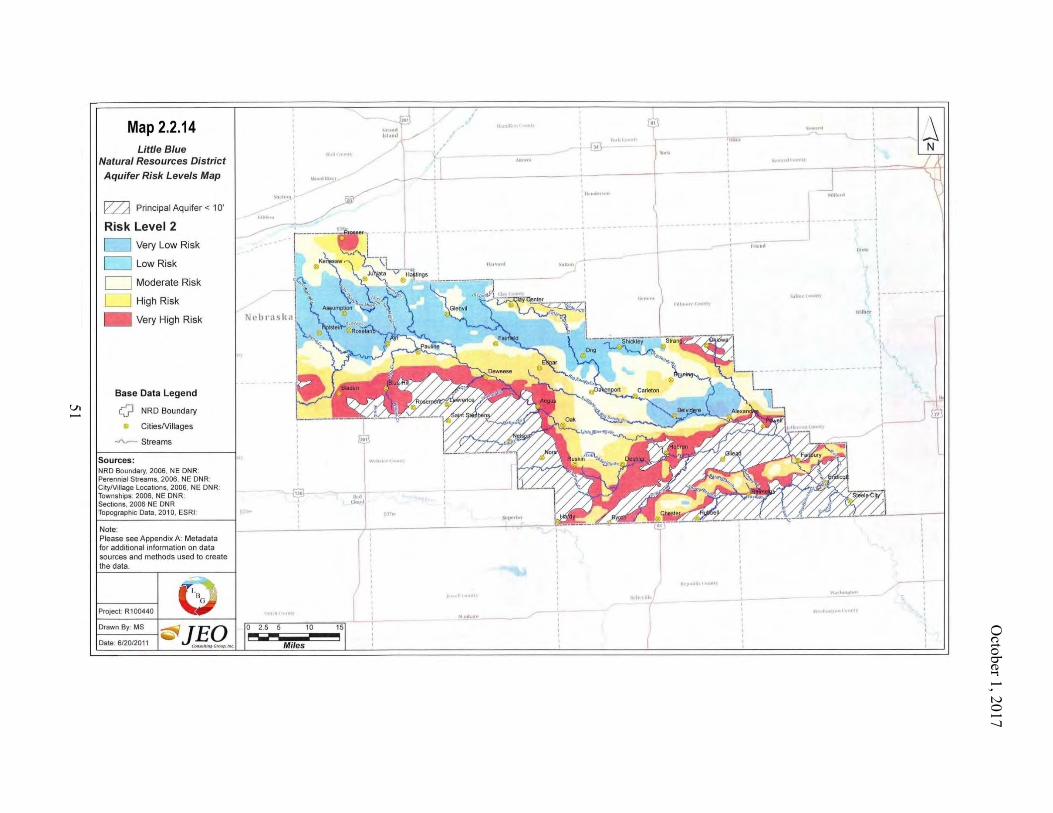
October 1, 2017
51
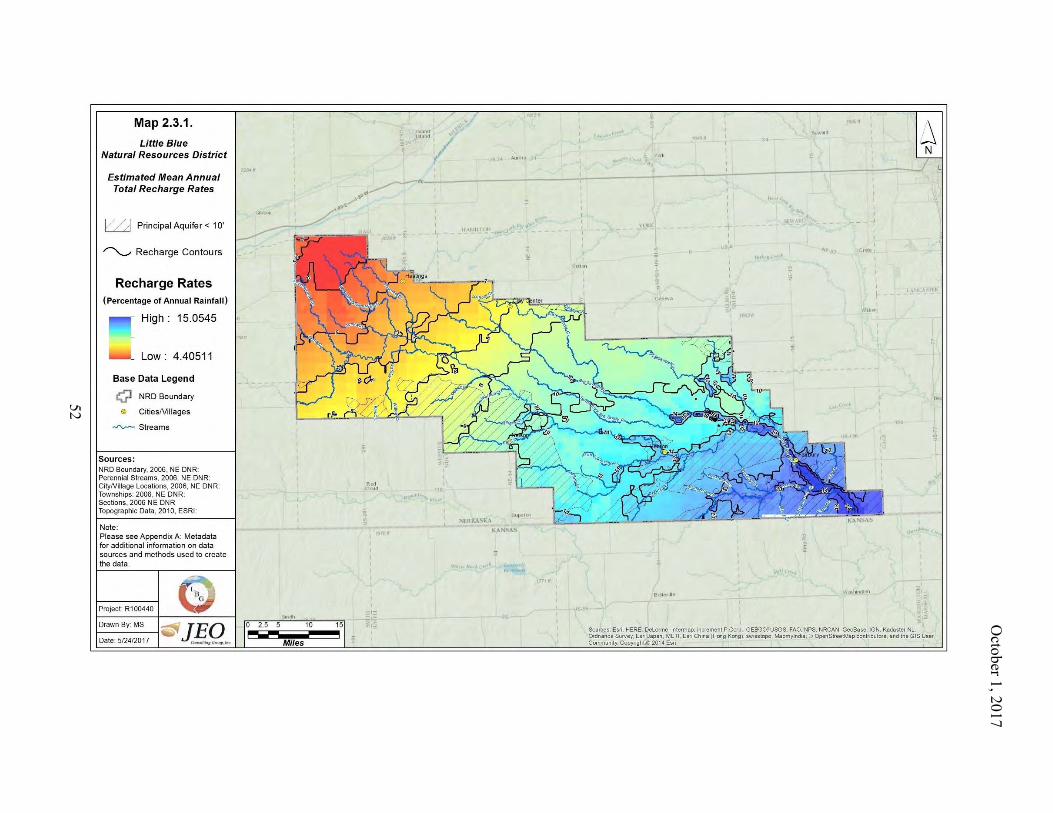
October 1, 2017
52
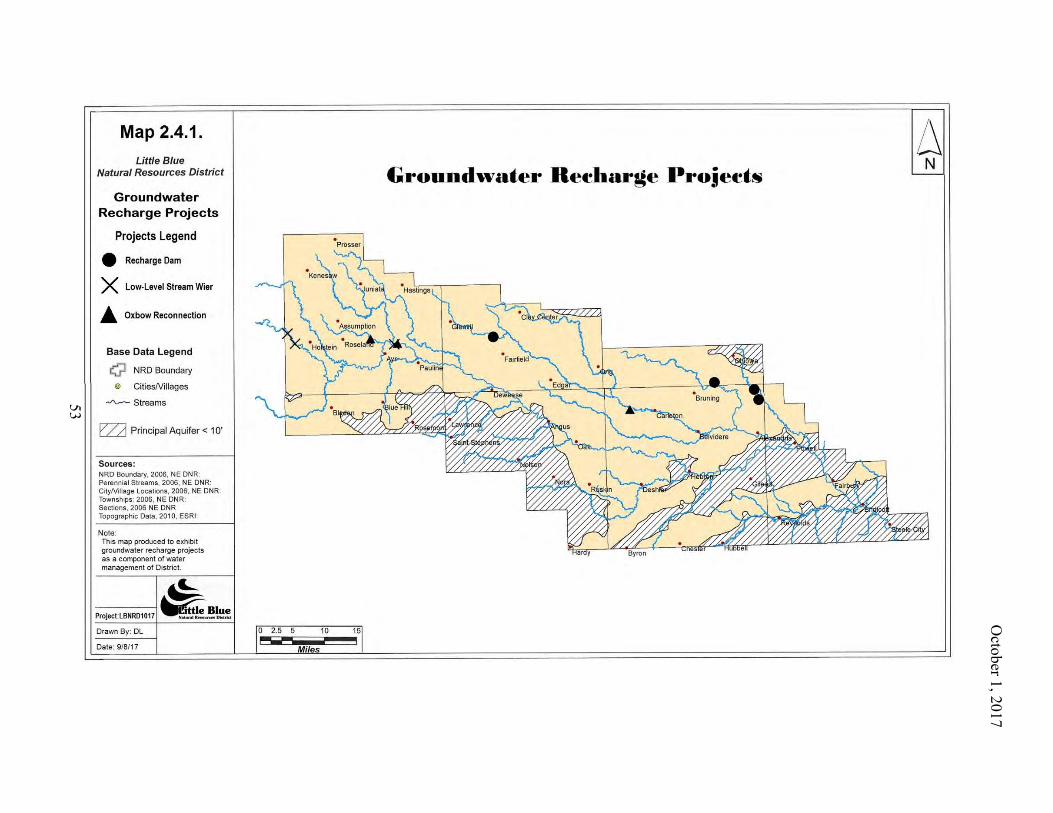
October 1, 2017
53
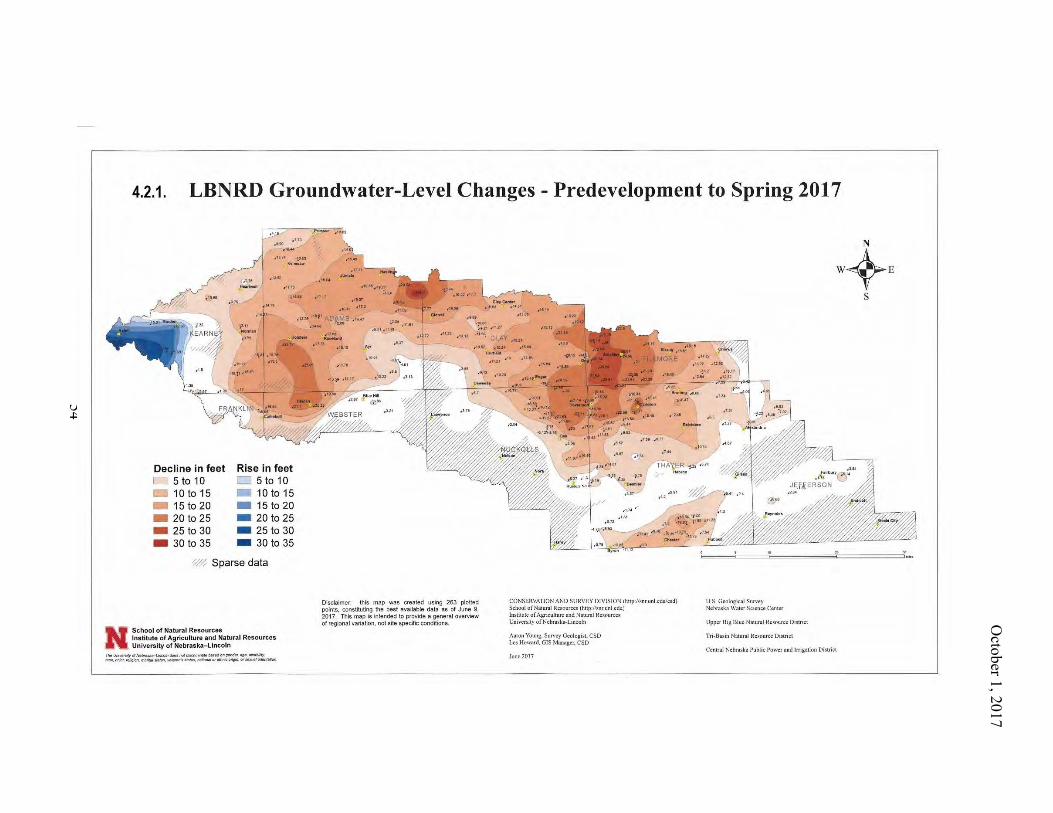
October 1, 2017
54
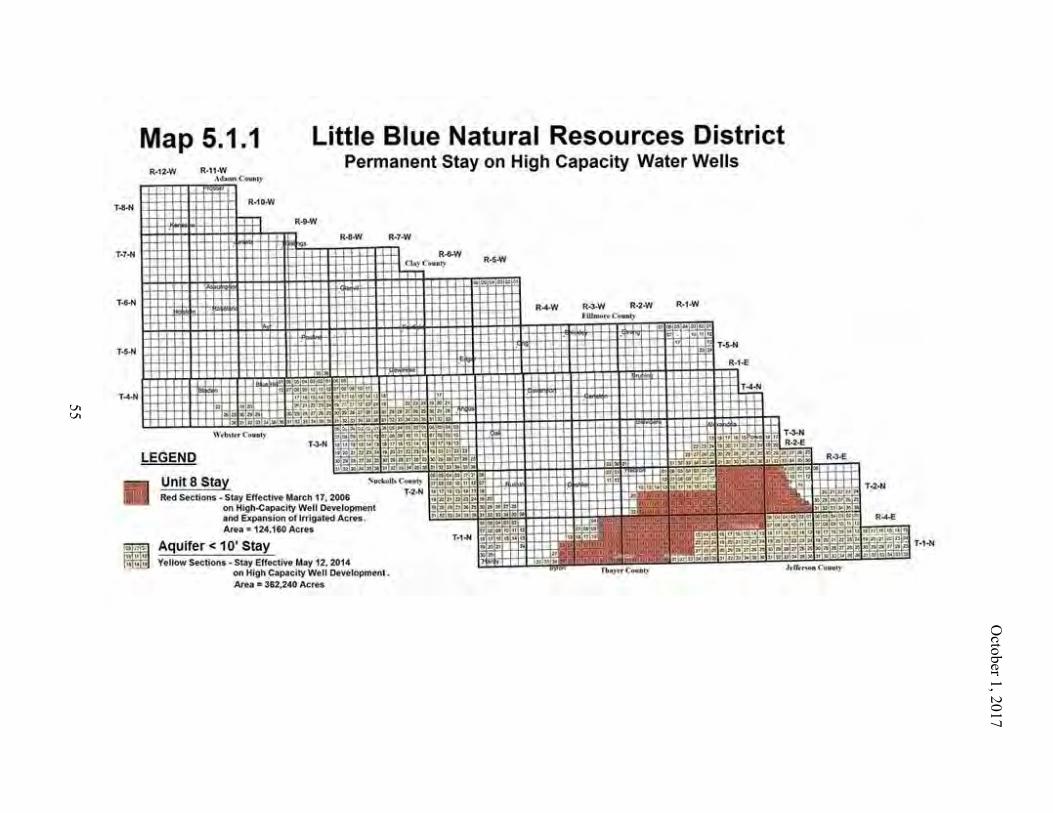
October 1, 2017
55