Embed Size (px)
Citation preview
ERD
C/CR
REL
TR
-11
-15
Guidance for Soil Sampling of Energetics and Metals
Col
d R
egio
ns
Res
earc
h
and
En
gin
eeri
ng
Lab
orat
ory
Susan Taylor, Thomas F. Jenkins, Susan Bigl, Alan D. Hewitt, Marianne E. Walsh and Michael R. Walsh
October 2011
Approved for public release; distribution is unlimited.

DEDICATION: We dedicate this report to our late colleague Alan Hewitt. He worked tirelessly to develop sampling methods and protocols for evaluating energetic residues on military training ranges. He also passionately shared what he had learned with audiences large and small. This document would not have been possible without his research contributions. We miss you Alan.
ERDC/CRREL TR-11-15 October 2011
Guidance for Soil Sampling of Energetics and Metals
Susan Taylor, Thomas F. Jenkins, Susan Bigl, Alan D. Hewitt, Marianne E. Walsh and Michael R. Walsh
Cold regions Research and Engineering Laboratory U.S. Army Engineer Research and Development Center 72 Lyme Road Hanover, NH 03755
Final report
Approved for public release; distribution is unlimited.
Prepared for U.S. Army Environmental Command

ERDC/CRREL TR-11-15 ii
Abstract: Information is presented on how to collect and process soil samples to quantify ex-plosives, propellants and metals from training range soils. This document outlines how to esti-mate the average concentration of energetic compounds and metals in soils and determine the error in the estimated concentration.
DISCLAIMER: The contents of this report are not to be used for advertising, publication, or promotional purposes. Citation of trade names does not constitute an official endorsement or approval of the use of such commercial products. All product names and trademarks cited are the property of their respective owners. The findings of this report are not to be construed as an official Department of the Army position unless so designated by other authorized documents. DESTROY THIS REPORT WHEN NO LONGER NEEDED. DO NOT RETURN IT TO THE ORIGINATOR.
ERDC/CRREL TR-11-15 iii
Table of Contents
Preface ....................................................................................................................................................ix
Acronyms ................................................................................................................................................. x
Unit Conversion Factors ..................................................................................................................... xiii
1 Introduction ..................................................................................................................................... 1
2 Data Quality Objectives ................................................................................................................. 4
2.1 Systematic planning and data quality objectives ........................................................ 4 2.2 Formulating a conceptual site model ........................................................................... 5
3 Residue Deposition ........................................................................................................................ 9
3.1 Propellants ..................................................................................................................... 9 3.2 High explosives ............................................................................................................ 12 3.3 Metals .......................................................................................................................... 16
4 Fate and Transport ....................................................................................................................... 18
4.1 Propellants ................................................................................................................... 18 4.2 High explosives ............................................................................................................ 18 4.3 Metals .......................................................................................................................... 19 4.4 Summary ...................................................................................................................... 20
5 Soil Sampling Methods ................................................................................................................ 22
5.1 Background .................................................................................................................. 22 5.2 Discrete sampling ........................................................................................................ 22 5.3 Multi-increment sampling ........................................................................................... 23 5.4 Comparison of multi-increment with “box” and “wheel” samples ............................ 27 5.5 Recommendations ...................................................................................................... 28
6 Sampling Strategies ..................................................................................................................... 29
6.1 Decision units .............................................................................................................. 29 6.1.1 Decision units for risk-based soil screening levels ..................................................... 31
6.1.2 Decision units to assess human health and ecological risk ...................................... 32
6.1.3 Decision units for comparison to SSLs protective of groundwater ........................... 33
6.1.4 Decision units to determine background concentrations .......................................... 33 6.2 Quality of the data—relative standard deviation (%RSD) ........................................... 34 6.3 Sampling designs ........................................................................................................ 36
6.3.1 A hypothetical example ................................................................................................ 37
6.3.2 Sampling a small arms range for metals and propellants ........................................ 41
7 A Practical Guide to Sampling .................................................................................................... 46
ERDC/CRREL TR-11-15 iv
7.1 Safety considerations .................................................................................................. 46 7.2 Sampling tools ............................................................................................................. 46 7.3 Determining sample size and number of increments required ................................ 48 7.4 Multi-increment collection design .............................................................................. 50 7.5 Setting up the decision unit ........................................................................................ 51 7.6 Collecting the sample .................................................................................................. 52 7.7 Additional considerations for irregularly shaped areas ............................................. 54 7.8 Collecting samples around ruptured rounds .............................................................. 55 7.9 How to deal with vegetation in a sample ................................................................... 55 7.10 Subsurface sampling .................................................................................................. 56
8 How to Process Soil Samples...................................................................................................... 58
8.1 General discussion of why samples need to be processed ...................................... 58 8.2 Specific guidance on how to process a soil sample .................................................. 59
8.2.1 Storing before processing ............................................................................................ 63
8.2.2 Air-drying ....................................................................................................................... 63
8.2.3 Sieving .......................................................................................................................... 63
8.2.4 Machine grinding ......................................................................................................... 64
8.2.5 Subsampling ................................................................................................................. 65
8.2.6 Cleanup ......................................................................................................................... 65 8.3 Specific sample processing for metals ....................................................................... 66 8.4 Processing for PAHs, perchlorate, WP ........................................................................ 68
9 Quality Assurance/Quality Control ............................................................................................. 70
10 Requirements for Contract Laboratories ................................................................................... 73
11 Summary ....................................................................................................................................... 75
11.1 Representative samples are the key to environment characterization ................ 75 11.2 Subdivide the site into decision units, based on previous and intended future use ............................................................................................................................... 75 11.3 Sample soils within a decision unit for explosives, propellants, and metals .................................................................................................................................. 76 11.4 Process and subsample the soil samples to quantify their MC concentrations ........................................................................................................................ 76 11.5 Quantify the uncertainty associated with the average concentration .................. 76 11.6 Desired result .......................................................................................................... 76
References ............................................................................................................................................ 78
Glossary ................................................................................................................................................. 86
Appendix A: Data Quality Objectives—7-Step Process .................................................................... 89
Appendix B: Soil Sampling Field Kit .................................................................................................. 92
Appendix C: Supplies and Equipment needed for Sample Processing ......................................... 94
Appendix D. Field Screening/Field Analysis Techniques ................................................................ 97

ERDC/CRREL TR-11-15 v
Appendix E. Collecting Samples Using the Non-GPS Method ..................................................... 103
Report Documentation Page
ERDC/CRREL TR-11-15 vi
List of Figures and Tables
Figures
Figure 2.1 Flow chart overview of systematic planning for remedial investigation.............................. 5
Figure 2.2. Detonation of white phosphorus smoke rounds deposit millimeter-sized pieces of WP in shallow ponds. ..................................................................................................................... 7
Figure 3.1. Multi-perforated M1 propellant used to fire the 105-mm howitzer rounds, fiber residues, and reactant for 2,4-DNT ................................................................................................ 10
Figure 3.2. Unfired and fired M45 propellant........................................................................................ 12
Figure 3.3. Unfired and fired M9 propellant used for the 81-mm illumination mortars. .................. 12
Figure 3.4. Comp B pieces from a single partial detonation................................................................ 14
Figure 3.5. Concentration of tungsten (mg/kg of soil) in surface soils at Bravo Range, Massachusetts Military Reservation .............................................................................................. 16
Figure 4.1. Predicted dissolution rate and particle lifespan versus the initial mass of a TNT or Tritonal particle. ............................................................................................................................ 19
Figure 5.1. How to collect multiple 100-increment samples using a systematic-random sampling design. ............................................................................................................................... 23
Figure 5.2. Histogram and statistical metrics for 100 discrete and ten 100-increment samples collected to estimate the mean concentration of NG within a 30-m × 30-m area at a multipurpose firing position ............................................................................................ 26
Figure 5.3. Two conventional sampling designs evaluated. ................................................................. 27
Figure 6.1. 684-acre site showing area on which houses will be built. .............................................. 38
Figure 6.2. Hypothetical housing development showing lots, houses and roads. ............................. 38
Figure 6.3. Area divided up into 666 decision units, 59 of which will be sampled using multi-increment samples. ................................................................................................................ 39
Figure 6.4. Stratified sampling approach. ............................................................................................. 40
Figure 6.5. Air photo of the Farragut firing range .................................................................................. 42
Figure 7.1. CRREL coring device ............................................................................................................. 48
Figure 7-2. Random systematic sampling pattern for collecting two 100-increment samples in a square decision unit. ................................................................................................. 50
ERDC/CRREL TR-11-15 vii
Figure 7.3. Pattern of random systematic sampling for collecting two 50-increment samples in an uneven-shaped decision unit, located within the solid black line. ...................... 51
Figure 7.4. Random systematic collection pattern for a 56-increment sample in a 10- x 10-m square decision unit. ................................................................................................................... 52
Figure 7.5. Two-person team collecting a multi-increment sample. .................................................... 53
Figure 7.6. Normalized concentration profiles for TNT and RDX ........................................................ 56
Figure 7.7. How increments from equivalent depth intervals are combined into a multi-increment sub-surface sample. ...................................................................................................... 57
Figure 8.1. Steps needed to determine the average concentration of energetic compounds and metals in several tons of soil using a few grams of soil. .................................. 59
Figure 8.2 How to process a soil sample. .............................................................................................. 63
Figure 11.1. Summary for how to collect, subsample, and analyze multi-increment samples for explosives, propellants and metals. .......................................................................... 77
Tables
Table 3.0. List of energetic chemicals found in military explosives and propellants. .......................... 9
Table 3.1. Mass of NG or 2,4-DNT deposited at firing points per round fired for various weapon systems. .............................................................................................................................. 11
Table 3.2. Mass of explosives residue deposited from high-order live fire detonations of Composition B-filled rounds. ............................................................................................................ 13
Table 3.3. Mass of explosives residue deposited from low-order detonation tests ........................... 13
Table 3.4 Mass of RDX deposited from blow-in-place of military munitions using C4 demolition explosive. ........................................................................................................................ 14
Table 4.2. Analytes quantified in Method 8330B ................................................................................. 21
Table 5.1. Variability of soil concentrations among 100 discrete samples collected within 10- × 10-m grids at various training range impact areas ............................................................. 23
Table 5.2. Variability of soil concentrations among multi-increment samples collected from grids at different ranges. ......................................................................................................... 24
Table 5.3. Mean metal concentrations obtained using different sampling methods. ...................... 26
Table 5.4. Concentration of TNT in soil samples from Holloman AFB, NM bombing range impact area, comparison of different sample collection strategies ............................................ 28
Table 5.5. Concentration of NG in soil samples from antitank rocket firing range at Ft. Lewis, WA; comparison of different sample collection strategies ................................................ 28
ERDC/CRREL TR-11-15 viii
Table 6.1. Number of decision units required to achieve a specified confidence level .................... 37
Table 6.2. Concentrations of metal and energetic compounds in Farragut Range MI samples. ............................................................................................................................................ 44
Table 6.3. Metals in Ottawa sand ........................................................................................................... 45
Table 7.1. Number of increments collected using different coring device diameters to obtain a given sample mass. ........................................................................................................... 49
ERDC/CRREL TR-11-15 ix
Preface
This report summarizes research on how best to sample and analyze soils for explosives and metals. It was conducted for the Military Munition Re-sponse Program and is not official Army guidance.
The work was performed by Dr. Susan Taylor (Biogeochemical Sciences Branch, Terry Sobecki, Chief), Dr. Thomas F. Jenkins (ERDC contractor), Susan Bigl (Biogeochemical Sciences Branch), Alan D. Hewitt (deceased), Marianne E. Walsh (Biogeochemical Sciences Branch), and Michael R. Walsh (Engineering Resources Branch, Thomas Tantillo, Chief), U.S. Ar-my Engineer Research and Development Center−Cold Regions Research and Engineering Laboratory (ERDC-CRREL). At the time of publication, Dr. Justin Berman was Chief of the Research and Engineering Division. The Deputy Director of ERDC-CRREL was Dr. Lance Hansen and the Di-rector was Dr. Robert Davis.
COL Kevin J. Wilson was the Commander and Executive Director of ERDC, and Dr. Jeffery P. Holland was the Director.

ERDC/CRREL TR-11-15 x
Acronyms
2-Am-DNT 2-amino-4,6-dinitrotoluene
4-Am-DNT 4-amino-2,6-dinitrotoluene
2,4-DNT 2,4-dinitrotoluene
AFB Air Force Base
ASTM American Standard and Testing Materials
BIP Blow-In-Place
CERCLA Comprehensive Environmental Response, Compensation, & Liability Act
CRREL USACE Cold Regions Research and Engineering Laboratory
CSM Conceptual Site Model
DERP Defense Environmental Restoration Program
DoD Department of Defense
DQO Data Quality Objective
EM Engineering Manual
EOD Explosive Ordnance Disposal
EPA United States Environmental Protection Agency
EOD Explosive ordnance disposal
ERDC Engineer Research and Development Center
ESTCP Environmental Security Technology Certification Program
GIS Geographic Information System
GPS Global Positioning System
HDOH Hawai’i Department of Health
HE High Explosive
HEPA High Efficiency Particulate Air
H6 RDX, TNT, aluminum
HMX Octahydro-1,3,5,7-tetranitro-1,3,5,7-tetrazocine

ERDC/CRREL TR-11-15 xi
HPLC High Performance Liquid Chromatography
ICP-OES Inductively Coupled Plasma-Optical Emission Spectroscopy
ICP-MS Inductively Coupled Plasma-Mass Spectrometry
IS Incremental Sampling
ITRC Interstate Technology and Regulatory Council
LAW Light Anti-armor Weapon
MC Munition Constituents
MEC Munitions and Explosives of Concern
MIS Multi-Increment Sampling
MS/MSD Matrix Spike / Matrix Spike Duplicate
MMRP Military Munitions Response Program
NC Nitrocellulose
NG Nitroglycerin
NQ Nitroguanidine
OB/OD Open Burning / Open Detonation
PAH Polycyclic Aromatic Hydrocarbon
PE Performance Evaluation
QA Quality Assurance
QC Quality Control
RCRA Resource Conservation and Recovery Act
RDX Hexahydro-1,3,5-trinitro-1,3,5-triazine
RI Remedial Investigation
RSD Relative Standard Deviation
QA/QC Quality Assurance/Quality Control
SERDP Strategic Environmental Research and Development Program
SI Site Investigation
SSL Soil Screening Level

ERDC/CRREL TR-11-15 xii
SW Solid Waste
Tetryl Methyl-2,4,6-trinitrophenyl nitramine
TNB 1,3,5-trinitrobenzene
TNT 2,4,6-trinitrotoluene
TPP Technical project planning
UCL Upper Confidence Limit
UXO Unexploded Ordnance
USACE U.S. Army Corps of Engineers
USAEC U.S. Army Environmental Command
USEPA U.S. Environmental Protection Agency
USGS United States Geological Survey
VSP Visual Sampling Plan
WP White Phosphorus
XRF X-Ray Florescence Spectrometer
ERDC/CRREL TR-11-15 xiii
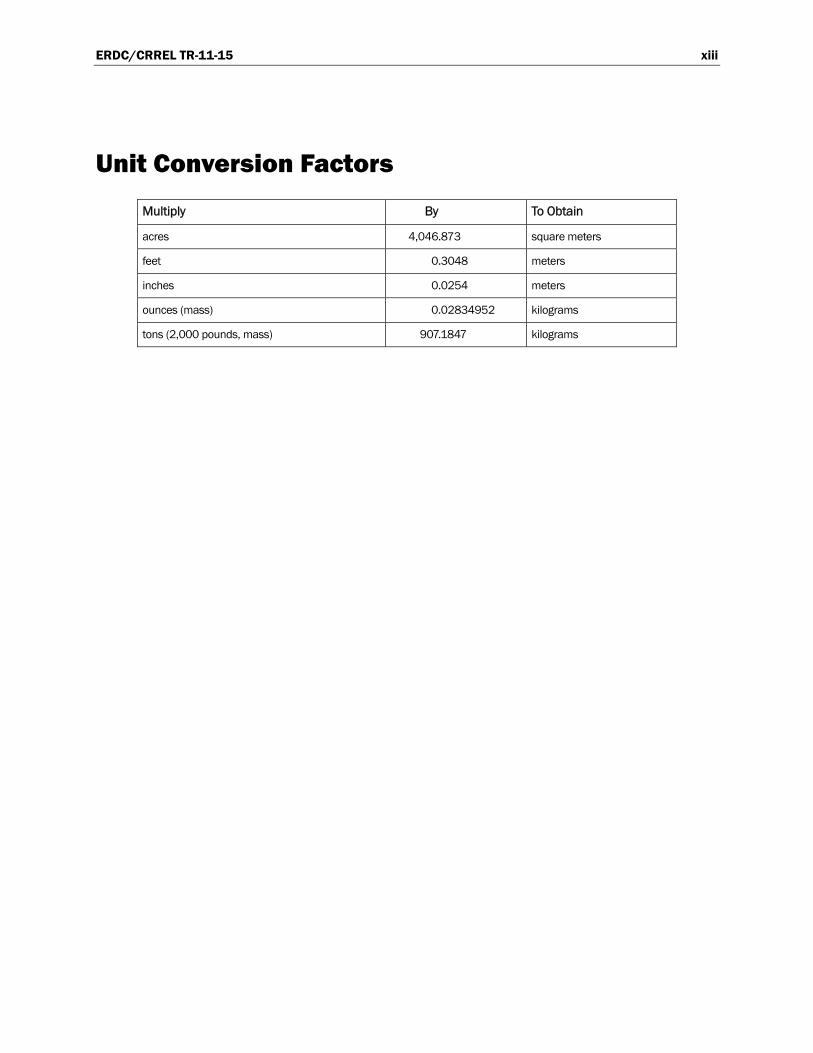
Unit Conversion Factors
Multiply By To Obtain
acres 4,046.873 square meters
feet 0.3048 meters
inches 0.0254 meters
ounces (mass) 0.02834952 kilograms
tons (2,000 pounds, mass) 907.1847 kilograms

ERDC/CRREL TR-11-15 1
1 Introduction
The goal of the Defense Environmental Restoration Program (DERP) is to restore environments impacted by military training. In 2001 the Military Munitions Response Program (MMRP) was established under the DERP to manage the environmental, health, and safety issues associated with unexploded ordnance (UXO), discarded military munitions, and muni-tions constituents (MC) on non-operational ranges located on active in-stallations, on bases slated for realignment or closure, and formerly used defense sites. Under the MMRP, the Department of Defense (DoD) is re-quired to: 1) inventory non-operational ranges that contain or are suspect-ed to contain munitions-related material released before September 2002; 2) identify, characterize, track, and report data on MMRP sites and clean-up activities; and 3) develop a process to prioritize site cleanup and esti-mate costs.
The Army completed their inventory of non-operational ranges in 2003 and began Site Inspections (SI) of these MMRP sites. Based on the site in-spection findings, some ranges may require a Remedial Investigation (RI). RIs for MMRP sites often try to determine if energetic residues are a risk to ground and surface waters, humans, or other ecological receptors. The RIs may require additional characterization, long term monitoring, con-taminant removal, or treatment of munition constituents at the site. These risk-based assessments provide a better understanding of the problem and result in scientifically defensible decisions about remediation unlike those based on “background” or “non-detectable” benchmarks (ITRC 2008).
The requirement to clean up hazardous materials released to the environ-ment is guided by two major statutes: the 1980 Comprehensive Environ-mental Response, Compensation, and Liability Act (CERCLA), as amended under the Superfund Amendments and Reauthorization Act (1986), and the 1976 Resource Conservation and Recovery Act (RCRA), as amended by the Hazardous and Solid Waste Amendments (1984). Cleanup and correc-tive actions under either program are taken if an unacceptable risk to hu-man health or the environment, or both, is present. Risk is determined on the basis of guidelines set forth within a given state or agency regulatory program (ITRC 2008).
ERDC/CRREL TR-11-15 2
For energetic residues the EPA Regions 3, 6, and 9 soil screening levels are often used in risk assessments for direct contact exposure pathways and for migration to groundwater (USEPA 2009). However, states can chose more stringent values or specific values can be established for a given eco-logical receptor. Moreover, state or program regulations may specify not only the area, but the depth, to which the soil needs to be sampled for en-ergetic compounds. Therefore, specific state regulations pertaining to a site need to be incorporated into the sampling design so that the results can meet state risk assessment and management criteria.
Depending on how the site was used, the energetic residues and metals may be localized or wide spread, they may be concentrated at the surface, or may have been buried or redistributed if the site was graded or physi-cally altered. For this reason, the physical site history can help identify the most likely locations for the MC. Wide area assessments can be very useful if the site is large and activities took place in multiple locations. Samples should be collected from the areas most likely to be contaminated, as well as from the entire area specified for the risk assessment and subsequent risk management.
Once you have clearly defined the goal of soil sampling and the data quali-ty objectives, this manual gives guidance on how to collect and process soil samples to quantify energetic compounds (explosive and propellant com-pounds) and metals. With some modifications, particularly to aspects of sample handling and processing, this approach can and has been used for organics and other contaminants, although these are not specifically ad-dressed in this document.
This guidance document is not comprehensive. Many of the studies used to develop these guidelines were conducted at active firing ranges. Conse-quently, the mass loading of energetics were measured from the most commonly used munitions and weapon systems and formulations used in the past, such as picric acid, ammonium picrate, or tetryl, were not en-countered. Not covered in this document is how to sample water for ener-getic compounds and metals. These topics all are important to the MMRP program and will likely be covered in a future document. How to handle UXO or discarded military munitions is outside the scope of this document and guidance for these activities is found in the U.S. Army Munitions Re-sponse Remedial Investigation/Feasibility Guidance for Munition Re-sponse Areas (2008).

ERDC/CRREL TR-11-15 3
The sections in this document follow the site characterization process. Sec-tion 2 describes the procedure for establishing risk-based data quality ob-jectives and a conceptual site model. Sections 3 and 4 give background in-formation on how residues are deposited and their fate and transport specific to MMRP sites. Section 5 describes different soil sampling meth-ods, and Section 6 gives examples of different types of decision units and sampling strategies. Sections 7 and 8 provide practical information on how to collect and process multi-increment samples and Section 9 discusses Quality Assurance/Quality Control (QA/QC). The document ends with ad-ditional requirements for contract laboratories (Section 10), a summary (Section 11), and references.
We hope this document will help the reader develop sound protocols for sampling soils at non-operational ranges. Many of the concepts put forth in the USACE Interim Guidance (USACE 2009) were incorporated into this document. Information on topics discussed in this document, from the basics of sampling theory to specific case studies, can also be found in journals and government research reports, such as those posted by SERDP, ESTCP, and ERDC on their web sites.
ERDC/CRREL TR-11-15 4
2 Data Quality Objectives
2.1 Systematic planning and data quality objectives
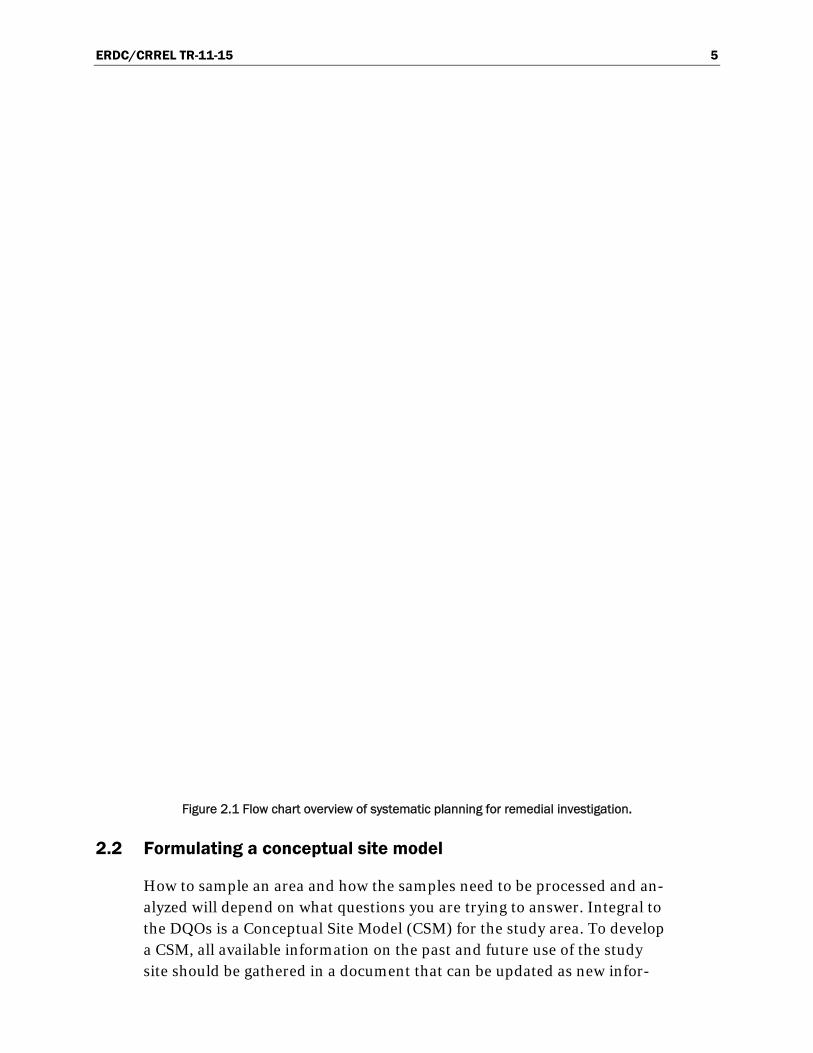
Systematic planning determines the type and amount of data to be collect-ed, the locations to be sampled, and the field and laboratory methods that will be used. A sampling design must be tailored specifically to support the intended end use of the data (e.g., Fig. 2.1). Without systematic planning, the likelihood that data will meet project objectives is low.
Systematic planning starts by formulating project-specific Data Quality Objectives (DQOs) sufficiently explicit that criteria for meeting them are unequivocal and measurable. EM 200-1-2 Technical Project Planning (TPP) Process (USACE 1998) is the USACE guidance for conducting sys-tematic planning. The TPP process was developed to provide comprehen-sive planning guidance to ensure effective and efficient progress to site closeout within all project constraints. EM 200-1-2 describes the TPP pro-cess for identifying project objectives, identifying data required to meet those objectives, and designing data collection programs. The preparation of DQO statements is a culmination of the TPP activities.
The TPP process brings together a team to identify the current project and to document both short- and long-term project objectives for the work at a site (site closeout). The team evaluates if additional data are needed to sat-isfy the project objectives and to identify the appropriate sampling and analysis methods to collect the data needed. The TPP team then finalizes a data collection program that best meets the customer’s short- and long-term needs within all project and site constraints.
Guidance similar to that in EM 200-1-2 for preparing DQOs is provided in the EPA’s DQO Process, a seven-step strategic planning process discussed in Guidance on Systematic Planning Using the Data Quality Objectives Process (USEPA 2006a), in Standard Practice for Generation of Envi-ronmental Data Related to Waste Management Activities: Development of Data Quality Objectives (ASTM 2006). EM 200-1-2 provides a “cross-walk” to the EPA’s 7-step process in an appendix and on the DQO home page http://www.qe3c.com/dqo/index.html.
ERDC/CRREL TR-11-15 5
Figure 2.1 Flow chart overview of systematic planning for remedial investigation.
2.2 Formulating a conceptual site model
How to sample an area and how the samples need to be processed and an-alyzed will depend on what questions you are trying to answer. Integral to the DQOs is a Conceptual Site Model (CSM) for the study area. To develop a CSM, all available information on the past and future use of the study site should be gathered in a document that can be updated as new infor-
ERDC/CRREL TR-11-15 6
mation becomes available. In the case of soil sampling, any information on how and where the energetic compounds and metals were released, their physical form, and soil factors or climatic variables that affect their fate should be compiled. Once this information has been collected, the follow-ing questions would help determine your DQOs.
1. What munition constituents (MC) were released?
• High explosives (HE). • Propellants. • Metals. • White phosphorus (WP). • Combination of the above.
2. Which potential environmental hazard are you concerned about?
• Explosive hazard. • Human exposure (dermal, inhalation, ingestion). • Contaminants leaching to groundwater. • Contamination of surface waters. • Ecotoxicity. • Combination of the above.
3. How was the site used in the past and how will it be used in the future?
• Was it a firing point, impact area, demolition range? • Has the surface been altered or materials moved? • Will it be a new range, a residential area, an industrial site? • Is it currently privately owned? • What is the current or planned land use?
Answers to these questions, the agreed upon DQOs, and the CSM drive the environmental sampling and analysis plan to produce data (e.g., remedial design, human health, or groundwater risk assessment). The DQO process is outlined by the EPA (USEPA 2006a) and by the ASTM (2006). This sev-en-step process is summarized in Appendix A.
As an example, we describe WP contamination at Eagle River Flats, a wet-land impact area in Alaska. Here, dabbling ducks were dying from an un-known cause and investigations were conducted to see if the cause was
ERDC/CRREL TR-11-15 7
munitions related. The sediments were analyzed for high explosives and propellant compounds with negative results. However, a sediment sample that produced a white vapor suggested the presence of white phosphorus, which was confirmed by chemical analyses (Racine et al. 1992).
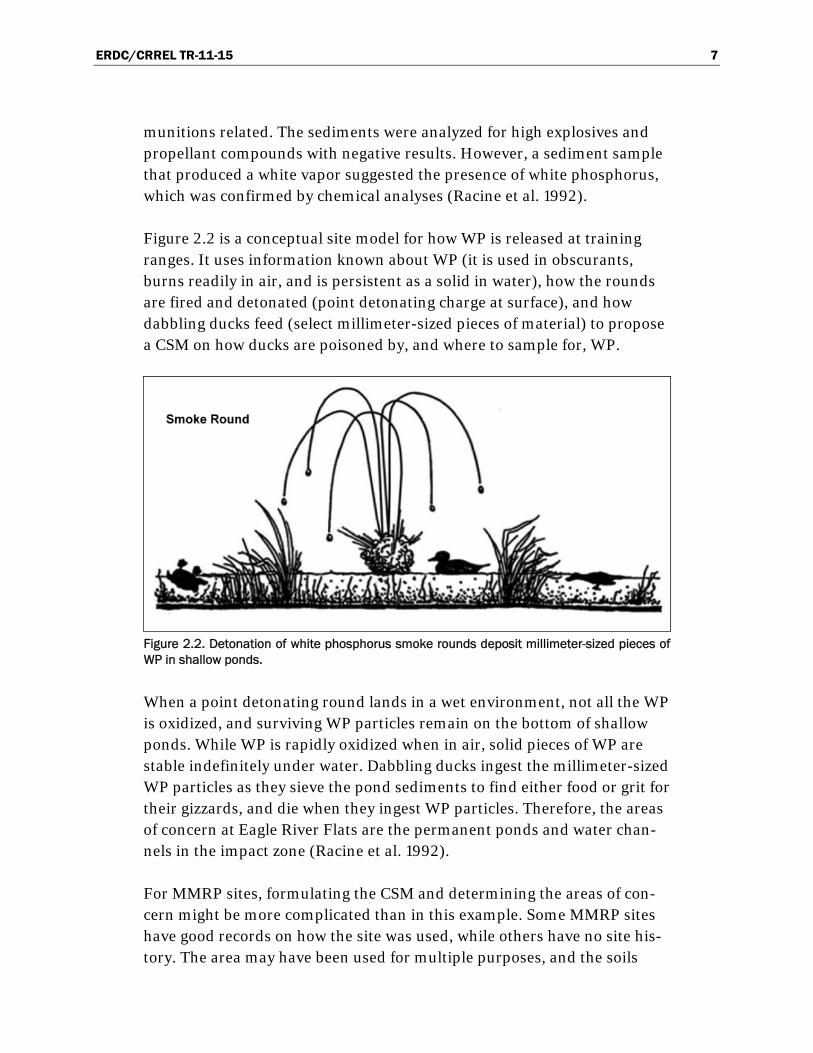
Figure 2.2 is a conceptual site model for how WP is released at training ranges. It uses information known about WP (it is used in obscurants, burns readily in air, and is persistent as a solid in water), how the rounds are fired and detonated (point detonating charge at surface), and how dabbling ducks feed (select millimeter-sized pieces of material) to propose a CSM on how ducks are poisoned by, and where to sample for, WP.
Figure 2.2. Detonation of white phosphorus smoke rounds deposit millimeter-sized pieces of WP in shallow ponds.
When a point detonating round lands in a wet environment, not all the WP is oxidized, and surviving WP particles remain on the bottom of shallow ponds. While WP is rapidly oxidized when in air, solid pieces of WP are stable indefinitely under water. Dabbling ducks ingest the millimeter-sized WP particles as they sieve the pond sediments to find either food or grit for their gizzards, and die when they ingest WP particles. Therefore, the areas of concern at Eagle River Flats are the permanent ponds and water chan-nels in the impact zone (Racine et al. 1992).
For MMRP sites, formulating the CSM and determining the areas of con-cern might be more complicated than in this example. Some MMRP sites have good records on how the site was used, while others have no site his-tory. The area may have been used for multiple purposes, and the soils
ERDC/CRREL TR-11-15 8
may have been disturbed or redistributed. Also, multiple contaminants may be present, each with their own mode of deposition and, hence, dis-tribution, making it difficult to select a single sampling strategy that will determine a reliable mean concentration for all the contaminants.
Current ownership of MMRP sites can complicate rights of entry; some are owned by the federal government, some by the state, and some by private individuals. Sites may have specific development plans, whereas the future use of other sites may be unknown. Sites may have already been developed and the different land uses need to be matched with the risk about which you are concerned. For example, an area may have a housing development (sample for human exposure) with adjacent land used for pasture (sample for risk to groundwater). The receptors of interest for those two land uses are very different, leading to different risk drivers and sampling plans.
MMRP sites are all different. In some cases a clear goal exists, while in others, people want to know if explosives or metals are present in the soils and where they are located—“nature and extent.” How to sample for na-ture and extent is tricky, as land use may not be specified, making it diffi-cult to formulate DQOs. The more information you can obtain about the site, and how it was used, the easier it will be to determine how the site should be sampled to determine if MC still remains on the site at concen-trations posing an unacceptable risk to your receptors. Figure A.1 (Appen-dix A) shows the most common types of ranges and the residues likely to be present. In Section 6 we give a hypothetical example and describe how to approach some of these problems.
ERDC/CRREL TR-11-15 9
3 Residue Deposition
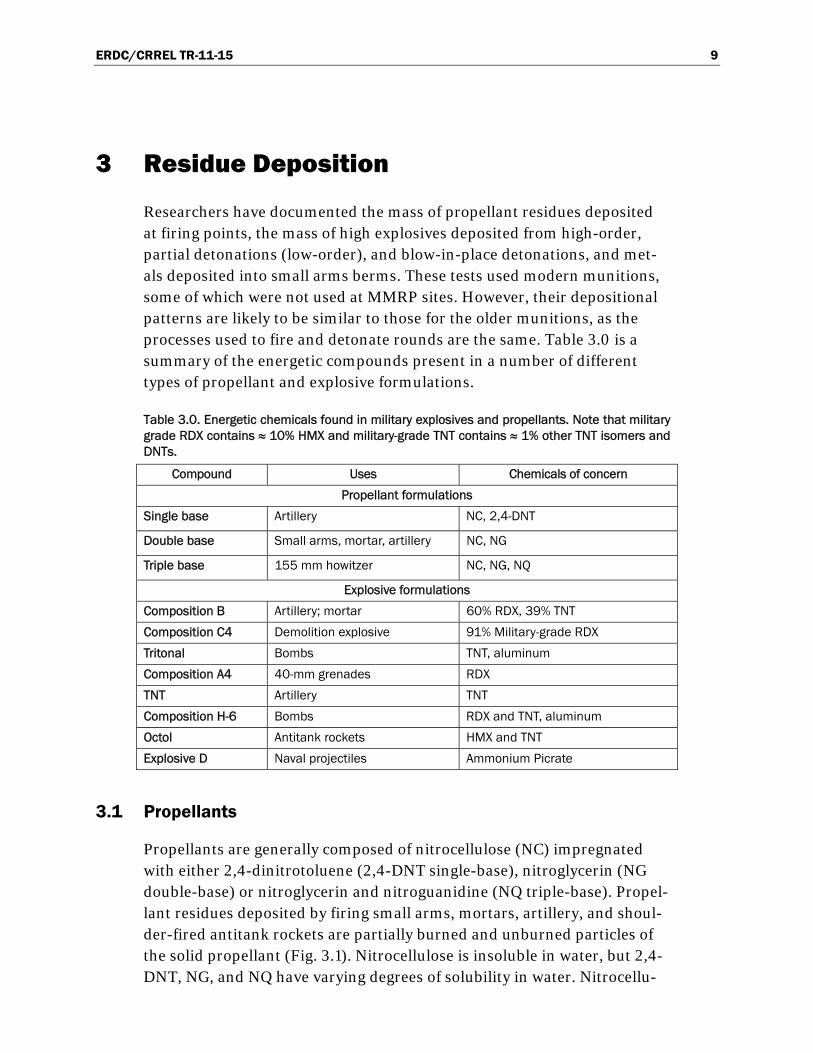
Researchers have documented the mass of propellant residues deposited at firing points, the mass of high explosives deposited from high-order, partial detonations (low-order), and blow-in-place detonations, and met-als deposited into small arms berms. These tests used modern munitions, some of which were not used at MMRP sites. However, their depositional patterns are likely to be similar to those for the older munitions, as the processes used to fire and detonate rounds are the same. Table 3.0 is a summary of the energetic compounds present in a number of different types of propellant and explosive formulations.
Table 3.0. Energetic chemicals found in military explosives and propellants. Note that military grade RDX contains ≈ 10% HMX and military-grade TNT contains ≈ 1% other TNT isomers and DNTs.
Compound Uses Chemicals of concern
Propellant formulations
Single base Artillery NC, 2,4-DNT
Double base Small arms, mortar, artillery NC, NG
Triple base 155 mm howitzer NC, NG, NQ
Explosive formulations
Composition B Artillery; mortar 60% RDX, 39% TNT
Composition C4 Demolition explosive 91% Military-grade RDX
Tritonal Bombs TNT, aluminum
Composition A4 40-mm grenades RDX
TNT Artillery TNT
Composition H-6 Bombs RDX and TNT, aluminum
Octol Antitank rockets HMX and TNT
Explosive D Naval projectiles Ammonium Picrate
3.1 Propellants
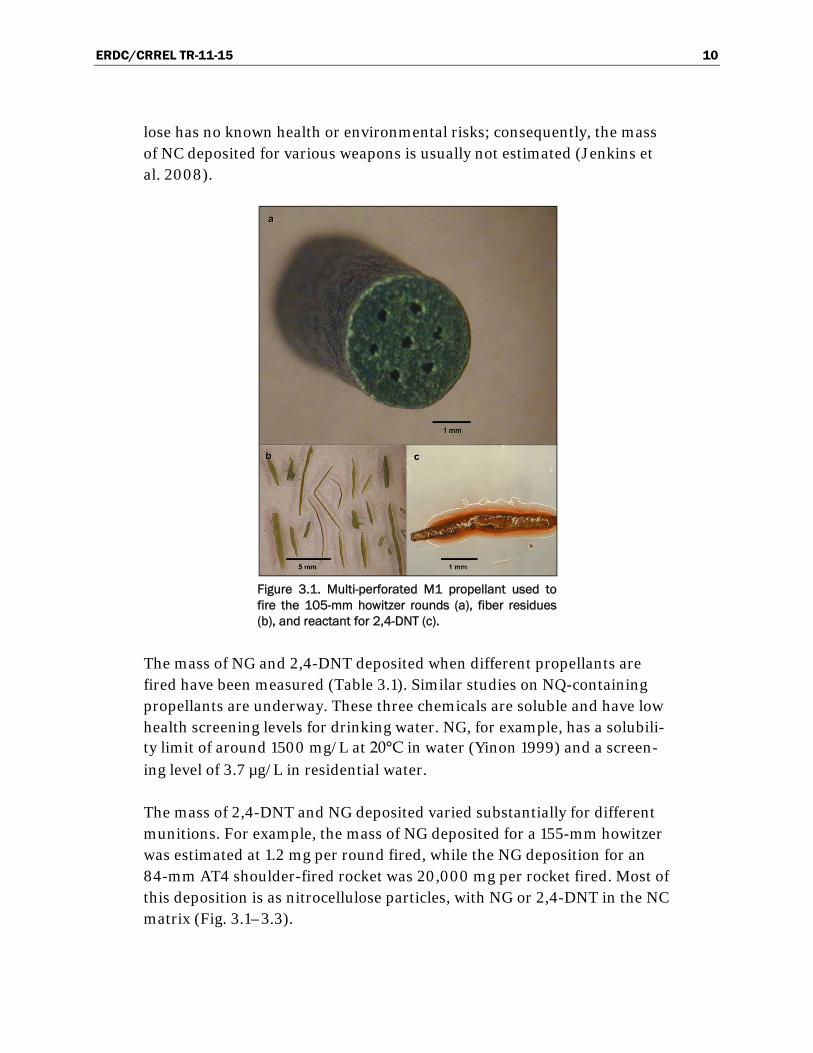
Propellants are generally composed of nitrocellulose (NC) impregnated with either 2,4-dinitrotoluene (2,4-DNT single-base), nitroglycerin (NG double-base) or nitroglycerin and nitroguanidine (NQ triple-base). Propel-lant residues deposited by firing small arms, mortars, artillery, and shoul-der-fired antitank rockets are partially burned and unburned particles of the solid propellant (Fig. 3.1). Nitrocellulose is insoluble in water, but 2,4-DNT, NG, and NQ have varying degrees of solubility in water. Nitrocellu-
ERDC/CRREL TR-11-15 10
lose has no known health or environmental risks; consequently, the mass of NC deposited for various weapons is usually not estimated (Jenkins et al. 2008).
Figure 3.1. Multi-perforated M1 propellant used to fire the 105-mm howitzer rounds (a), fiber residues (b), and reactant for 2,4-DNT (c).
The mass of NG and 2,4-DNT deposited when different propellants are fired have been measured (Table 3.1). Similar studies on NQ-containing propellants are underway. These three chemicals are soluble and have low health screening levels for drinking water. NG, for example, has a solubili-ty limit of around 1500 mg/L at 20°C in water (Yinon 1999) and a screen-ing level of 3.7 µg/L in residential water.
The mass of 2,4-DNT and NG deposited varied substantially for different munitions. For example, the mass of NG deposited for a 155-mm howitzer was estimated at 1.2 mg per round fired, while the NG deposition for an 84-mm AT4 shoulder-fired rocket was 20,000 mg per rocket fired. Most of this deposition is as nitrocellulose particles, with NG or 2,4-DNT in the NC matrix (Fig. 3.1–3.3).
ERDC/CRREL TR-11-15 11
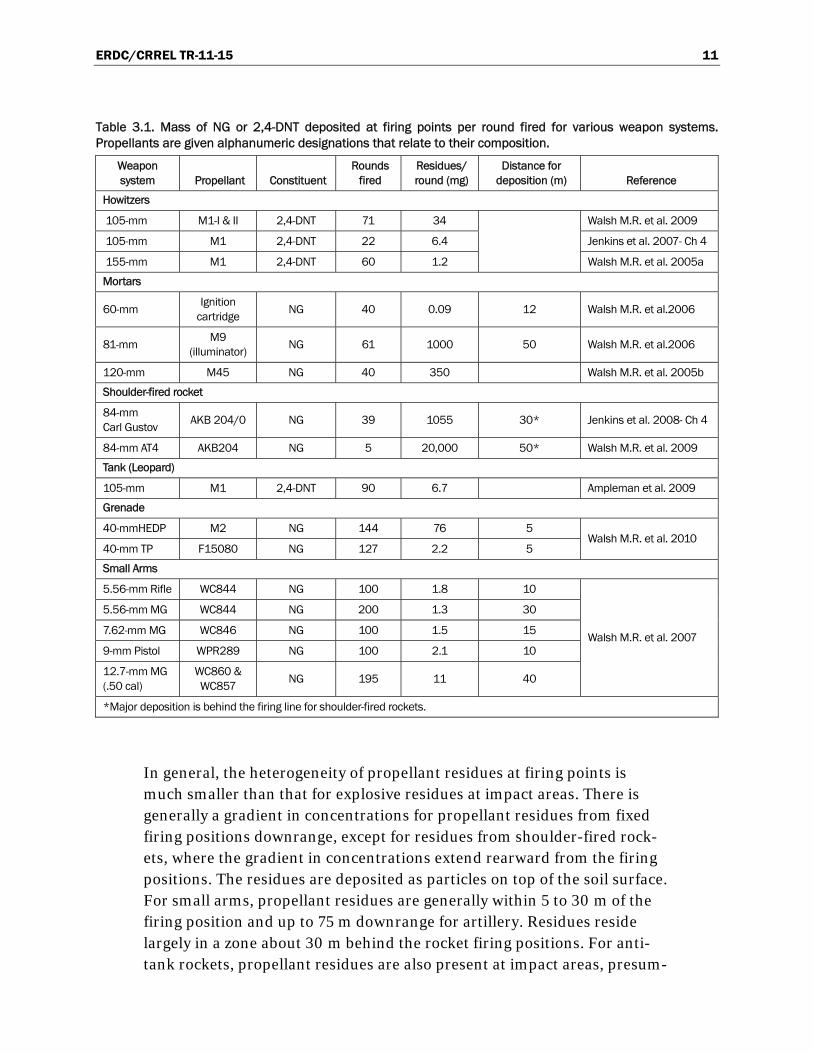
Table 3.1. Mass of NG or 2,4-DNT deposited at firing points per round fired for various weapon systems. Propellants are given alphanumeric designations that relate to their composition.
Weapon system Propellant Constituent
Rounds fired
Residues/ round (mg)
Distance for deposition (m) Reference
Howitzers
105-mm M1-I & II 2,4-DNT 71 34 Walsh M.R. et al. 2009
105-mm M1 2,4-DNT 22 6.4 Jenkins et al. 2007- Ch 4
155-mm M1 2,4-DNT 60 1.2 Walsh M.R. et al. 2005a
Mortars
60-mm Ignition
cartridge NG 40 0.09 12 Walsh M.R. et al.2006
81-mm M9
(illuminator) NG 61 1000 50 Walsh M.R. et al.2006
120-mm M45 NG 40 350 Walsh M.R. et al. 2005b
Shoulder-fired rocket
84-mm Carl Gustov
AKB 204/0 NG 39 1055 30* Jenkins et al. 2008- Ch 4
84-mm AT4 AKB204 NG 5 20,000 50* Walsh M.R. et al. 2009
Tank (Leopard)
105-mm M1 2,4-DNT 90 6.7 Ampleman et al. 2009
Grenade
40-mmHEDP M2 NG 144 76 5 Walsh M.R. et al. 2010
40-mm TP F15080 NG 127 2.2 5
Small Arms
5.56-mm Rifle WC844 NG 100 1.8 10
Walsh M.R. et al. 2007
5.56-mm MG WC844 NG 200 1.3 30
7.62-mm MG WC846 NG 100 1.5 15
9-mm Pistol WPR289 NG 100 2.1 10
12.7-mm MG (.50 cal)
WC860 & WC857
NG 195 11 40
*Major deposition is behind the firing line for shoulder-fired rockets.
In general, the heterogeneity of propellant residues at firing points is much smaller than that for explosive residues at impact areas. There is generally a gradient in concentrations for propellant residues from fixed firing positions downrange, except for residues from shoulder-fired rock-ets, where the gradient in concentrations extend rearward from the firing positions. The residues are deposited as particles on top of the soil surface. For small arms, propellant residues are generally within 5 to 30 m of the firing position and up to 75 m downrange for artillery. Residues reside largely in a zone about 30 m behind the rocket firing positions. For anti-tank rockets, propellant residues are also present at impact areas, presum-
ERDC/CRREL TR-11-15 12
ably because all the propellant has not been expended before the rocket hits the target. Often pieces of propellant are visible on the surface.
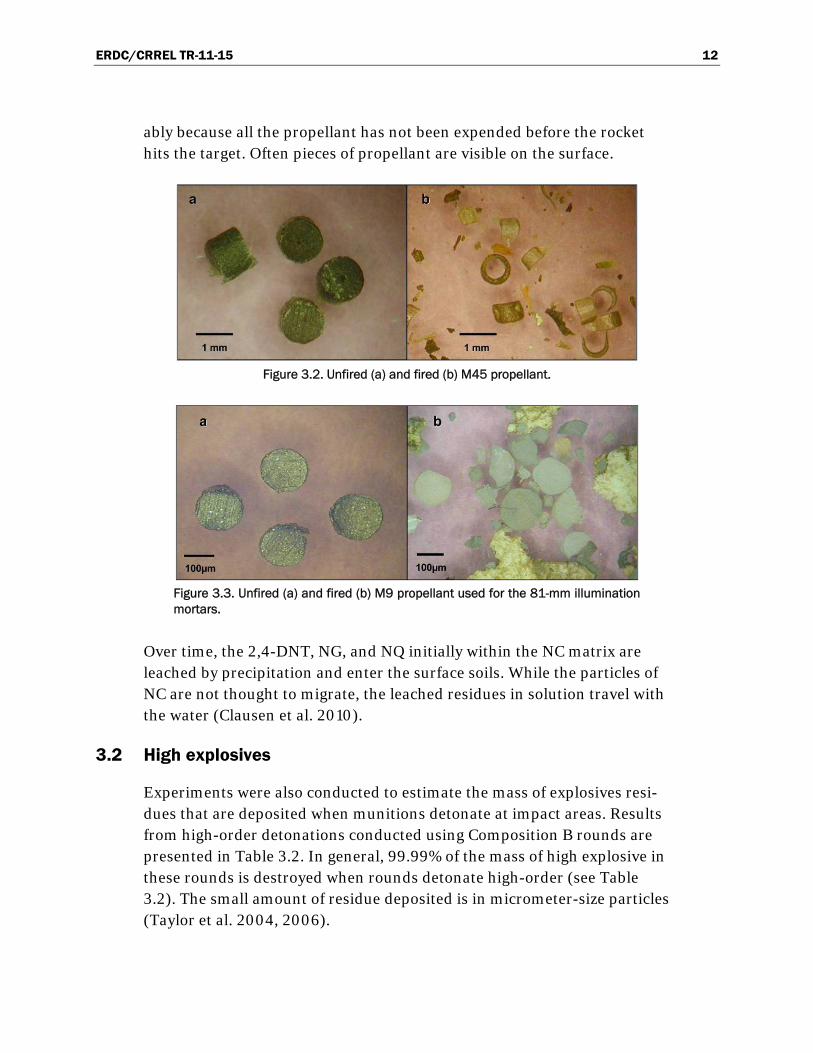
Figure 3.2. Unfired (a) and fired (b) M45 propellant.
Figure 3.3. Unfired (a) and fired (b) M9 propellant used for the 81-mm illumination mortars.
Over time, the 2,4-DNT, NG, and NQ initially within the NC matrix are leached by precipitation and enter the surface soils. While the particles of NC are not thought to migrate, the leached residues in solution travel with the water (Clausen et al. 2010).
3.2 High explosives
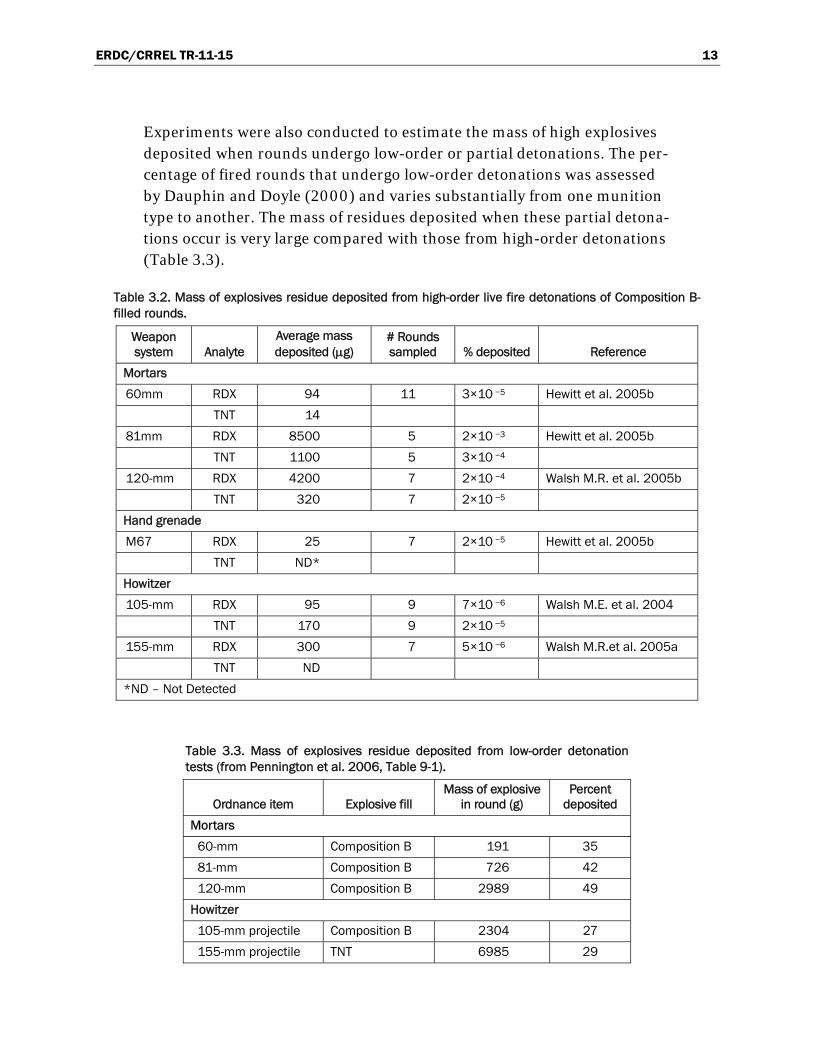
Experiments were also conducted to estimate the mass of explosives resi-dues that are deposited when munitions detonate at impact areas. Results from high-order detonations conducted using Composition B rounds are presented in Table 3.2. In general, 99.99% of the mass of high explosive in these rounds is destroyed when rounds detonate high-order (see Table 3.2). The small amount of residue deposited is in micrometer-size particles (Taylor et al. 2004, 2006).
ERDC/CRREL TR-11-15 13
Experiments were also conducted to estimate the mass of high explosives deposited when rounds undergo low-order or partial detonations. The per-centage of fired rounds that undergo low-order detonations was assessed by Dauphin and Doyle (2000) and varies substantially from one munition type to another. The mass of residues deposited when these partial detona-tions occur is very large compared with those from high-order detonations (Table 3.3).
Table 3.2. Mass of explosives residue deposited from high-order live fire detonations of Composition B-filled rounds.
Weapon system Analyte
Average mass deposited (g)
# Rounds sampled % deposited Reference
Mortars
60mm RDX 94 11 3×10 −5 Hewitt et al. 2005b
TNT 14
81mm RDX 8500 5 2×10 −3 Hewitt et al. 2005b
TNT 1100 5 3×10 −4
120-mm RDX 4200 7 2×10 −4 Walsh M.R. et al. 2005b
TNT 320 7 2×10 −5
Hand grenade
M67 RDX 25 7 2×10 −5 Hewitt et al. 2005b
TNT ND*
Howitzer
105-mm RDX 95 9 7×10 −6 Walsh M.E. et al. 2004
TNT 170 9 2×10 −5
155-mm RDX 300 7 5×10 −6 Walsh M.R.et al. 2005a
TNT ND
*ND – Not Detected
Table 3.3. Mass of explosives residue deposited from low-order detonation tests (from Pennington et al. 2006, Table 9-1).
Ordnance item Explosive fill Mass of explosive
in round (g) Percent
deposited
Mortars
60-mm Composition B 191 35
81-mm Composition B 726 42
120-mm Composition B 2989 49
Howitzer
105-mm projectile Composition B 2304 27
155-mm projectile TNT 6985 29
ERDC/CRREL TR-11-15 14
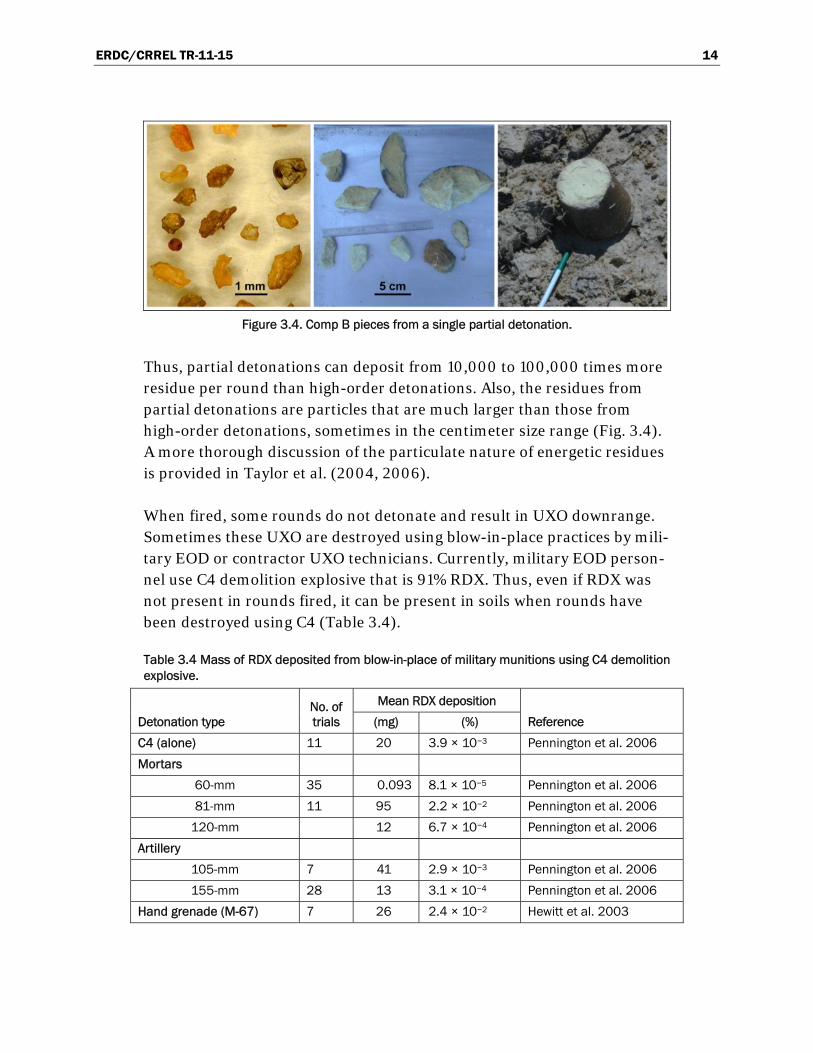
Figure 3.4. Comp B pieces from a single partial detonation.
Thus, partial detonations can deposit from 10,000 to 100,000 times more residue per round than high-order detonations. Also, the residues from partial detonations are particles that are much larger than those from high-order detonations, sometimes in the centimeter size range (Fig. 3.4). A more thorough discussion of the particulate nature of energetic residues is provided in Taylor et al. (2004, 2006).
When fired, some rounds do not detonate and result in UXO downrange. Sometimes these UXO are destroyed using blow-in-place practices by mili-tary EOD or contractor UXO technicians. Currently, military EOD person-nel use C4 demolition explosive that is 91% RDX. Thus, even if RDX was not present in rounds fired, it can be present in soils when rounds have been destroyed using C4 (Table 3.4).
Table 3.4 Mass of RDX deposited from blow-in-place of military munitions using C4 demolition explosive.
Detonation type No. of trials
Mean RDX deposition
Reference (mg) (%)
C4 (alone) 11 20 3.9 × 10⁻³ Pennington et al. 2006
Mortars
60-mm 35 0.093 8.1 × 10⁻⁵ Pennington et al. 2006
81-mm 11 95 2.2 × 10⁻² Pennington et al. 2006
120-mm 12 6.7 × 10⁻⁴ Pennington et al. 2006
Artillery
105-mm 7 41 2.9 × 10⁻³ Pennington et al. 2006
155-mm 28 13 3.1 × 10⁻⁴ Pennington et al. 2006
Hand grenade (M-67) 7 26 2.4 × 10⁻² Hewitt et al. 2003
ERDC/CRREL TR-11-15 15
In general, the masses of residues deposited from high-order, blow-in-place operations are slightly higher than high-order detonations. Some-times, however, blow-in-place detonations result in a partial detonation and the residue deposited from this event is much greater, as discussed above.
For impact areas, the largest mass of explosives is deposited by partial detonations (low-order), UXO ruptured from other live-fire detonations, or blow-in-place activities designed to destroy UXO. These residues are not widely distributed and produce a localized zone of high concentra-tions. The resulting distribution of residues at impact areas is described as one of distributed point sources. Because these concentrations come from individual events, the concentrations across the impact area are not corre-lated. The short-range heterogeneity of explosives residues is very large, making it difficult to detect any gradient in concentration. Unlike propel-lants, it is difficult to estimate the mass of HE deposited at an impact area even if the number and type of rounds fired are known. This is because the largest HE mass comes from partial detonations and the number of these occurrences is poorly known. The values provided by Dauphin and Doyle (2000) can be used as a guide, but the actual amount of residues deposited needs to be determined by sampling.
At antitank ranges, the distance from firing position to target is only a few hundred meters and, hence, most rounds detonate, or rupture, within a small distance of targets. The gradient in residue concentrations is evident with the highest concentrations present next to targets (Thiboutot et al. 1998). For artillery targets, the concentrations of residues are much lower than for antitank rocket targets, and there is no concentration gradient ev-ident as a function of distance away from these targets. The reason is the much greater distance between firing positions and targets, which results in some detonations being far from targets. This same situation is true for mortar targets that often are used for both artillery and mortar practice.
Deposition patterns for energetic residues and how to sample for these on different types of ranges are presented by Hewitt et al. (2007a,b). Howev-er, other types of analytes (e.g., metals) may have different depositional patterns or fate and transport characteristics that would need to be con-sidered for determining their likely spatial distribution.
ERDC/CRREL TR-11-15 16
3.3 Metals
Metals are deposited onto range soils by a variety of processes. High-order detonations of projectiles disperse small metal fragments, generally steel, to various distances, depending on the fragmentation radius of the round. Partial detonations scatter larger fragments of the round body, while UXO leave the entire casing in or on the soil. Luckily, iron, the most commonly deposited metal, is ubiquitous in the environment and of little concern. These rounds do contain other metals in their primers and fuses but the quantities of these metals are small. Analyses of impact area soils at Mas-sachusetts Military Reservation found only elevated iron, manganese (an alloying element of steel), and aluminum concentrations (Clausen et al. 2004).
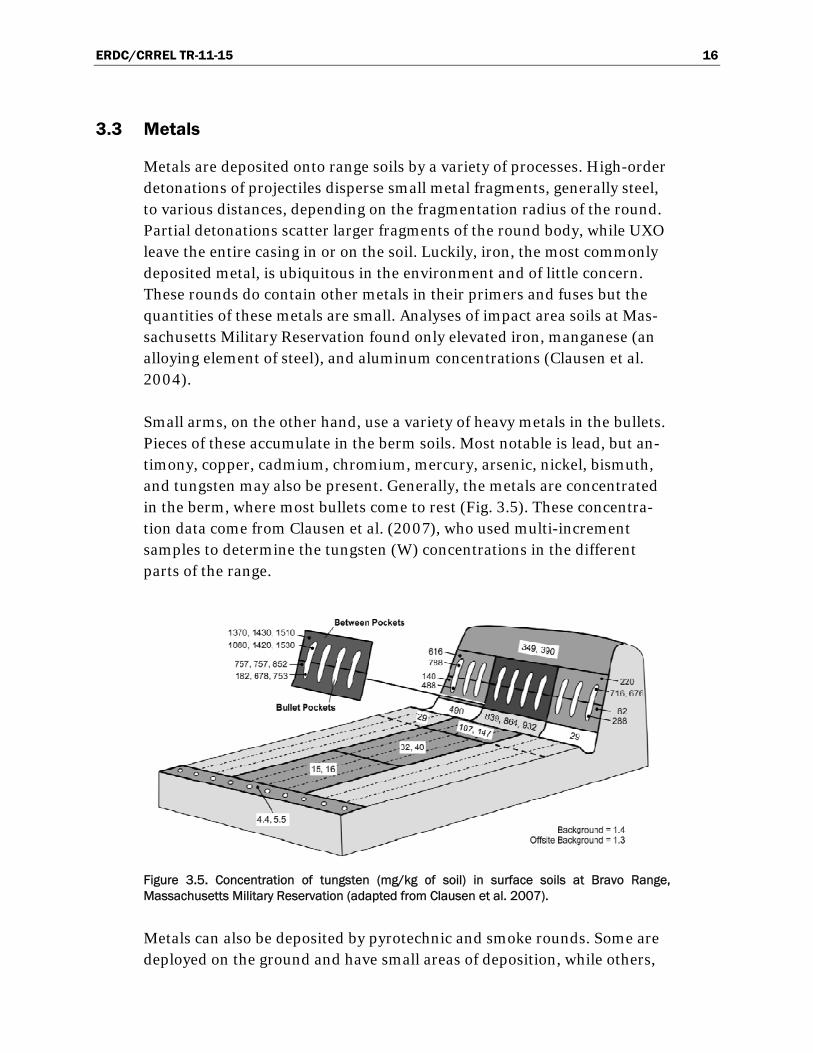
Small arms, on the other hand, use a variety of heavy metals in the bullets. Pieces of these accumulate in the berm soils. Most notable is lead, but an-timony, copper, cadmium, chromium, mercury, arsenic, nickel, bismuth, and tungsten may also be present. Generally, the metals are concentrated in the berm, where most bullets come to rest (Fig. 3.5). These concentra-tion data come from Clausen et al. (2007), who used multi-increment samples to determine the tungsten (W) concentrations in the different parts of the range.
Figure 3.5. Concentration of tungsten (mg/kg of soil) in surface soils at Bravo Range, Massachusetts Military Reservation (adapted from Clausen et al. 2007).
Metals can also be deposited by pyrotechnic and smoke rounds. Some are deployed on the ground and have small areas of deposition, while others,

ERDC/CRREL TR-11-15 17
such as the illumination flares, are fired into the air where they burn at al-titude and disperse their metals over large areas. Pyrotechnics can contain barium, antimony, strontium, copper, magnesium, manganese, chromium, and lead. Unlike high explosive and propellant compounds, metals are naturally occurring in the environment so their background concentra-tions need to be measured.
ERDC/CRREL TR-11-15 18
4 Fate and Transport
4.1 Propellants
The NC in propellants is virtually insoluble and survives for long periods of time in soil or in water—intact NC matrices have been found washing ashore after 50 years in seawater. However, the modifiers and stabilizers initially present within the NC matrices will leach out of these residues in-to the soil, where various processes can transform or mineralize them, de-pending on the specific compounds.
Dissolution drip tests on both fired residues and unfired propellant grains show that 2,4-DNT, NG, and NQ leach slowly from the NC matrix. For ex-ample, the percent mass loss curves for the double-base propellants, M9, AT-4, and small arms show that they lose the largest fraction of their NG in the first few weeks. After that time the loss rate slows down and may be diffusion driven. The amount of NG originally present in the propellant also affects the amount of NG lost. The M9 and AT-4 rocket propellants both contain about 40% NG and lose a larger fraction of their original NG than do the small arms propellants that contain about 10% NG. Data on fired propellant residues show that they lose a smaller percentage than the unfired grains (Taylor et al. in review).
4.2 High explosives
A few studies have measured the persistence of HE in the field. Radtke et al. (2002) sampled surface soils at an explosives testing area that had not been used for 50 years and found that millimeter-sized pieces remained, while smaller particles had dissolved. In a different study, powdered ex-plosives were mixed in with soils at Los Alamos National Laboratory, NM (Dubois and Baytos 1991). After 20 years, RDX, HMX, and PETN were found to persist, while explosives containing TNT, barium nitrate, or boric acid had dramatically decreased in the soils. Los Alamos has a low yearly rainfall that averaged 47.5 cm/year between 1971 and 2000. In a different study, M.E. Walsh et al (2009) documented the total disaggregation, over a 3-year period, of Composition B chunks scattered by partial detonations in an Alaskan salt marsh.
ERDC/CRREL TR-11-15 19
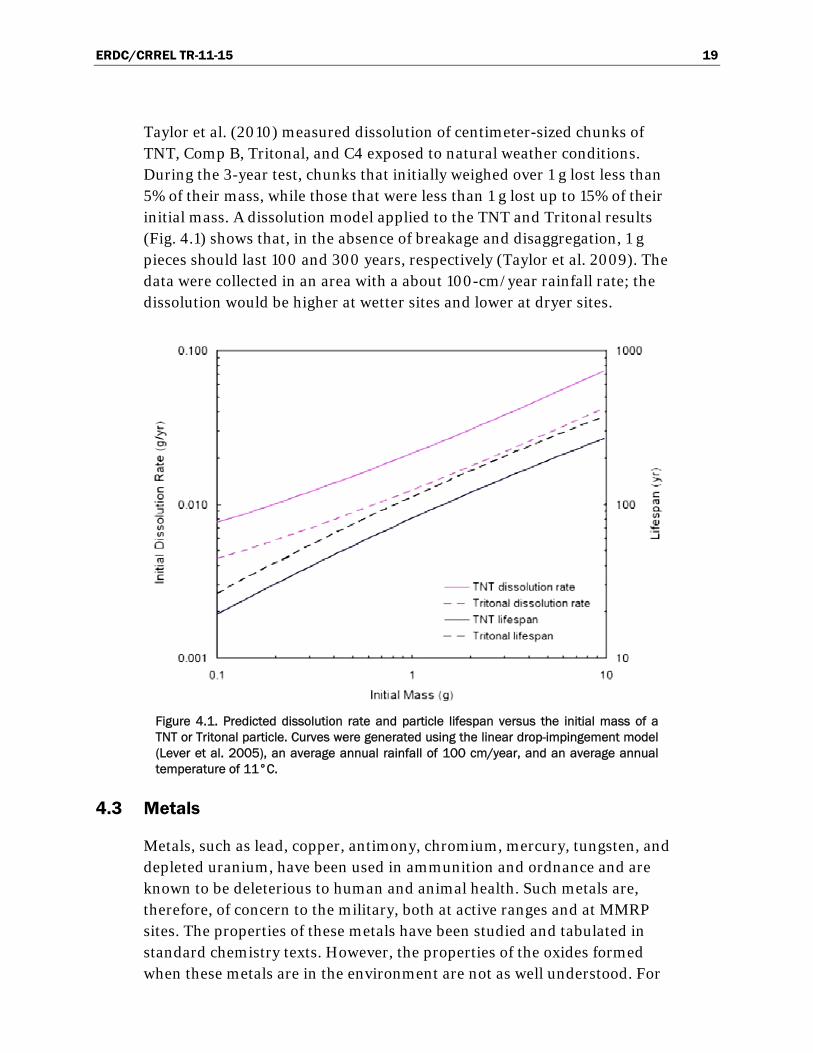
Taylor et al. (2010) measured dissolution of centimeter-sized chunks of TNT, Comp B, Tritonal, and C4 exposed to natural weather conditions. During the 3-year test, chunks that initially weighed over 1 g lost less than 5% of their mass, while those that were less than 1 g lost up to 15% of their initial mass. A dissolution model applied to the TNT and Tritonal results (Fig. 4.1) shows that, in the absence of breakage and disaggregation, 1 g pieces should last 100 and 300 years, respectively (Taylor et al. 2009). The data were collected in an area with a about 100-cm/year rainfall rate; the dissolution would be higher at wetter sites and lower at dryer sites.
Figure 4.1. Predicted dissolution rate and particle lifespan versus the initial mass of a TNT or Tritonal particle. Curves were generated using the linear drop-impingement model (Lever et al. 2005), an average annual rainfall of 100 cm/year, and an average annual temperature of 11°C.
4.3 Metals
Metals, such as lead, copper, antimony, chromium, mercury, tungsten, and depleted uranium, have been used in ammunition and ordnance and are known to be deleterious to human and animal health. Such metals are, therefore, of concern to the military, both at active ranges and at MMRP sites. The properties of these metals have been studied and tabulated in standard chemistry texts. However, the properties of the oxides formed when these metals are in the environment are not as well understood. For
ERDC/CRREL TR-11-15 20
example, W metal is not soluble, but when ground and sintered with nylon to replace Pb bullets, it oxidizes readily and its oxide is soluble. Also mul-tiple oxidation states are possible for some of these metals, and the oxida-tion state often determines the behavior and toxicity of the metal oxide. For example Cr+3 is a micronutrient needed for human metabolism, whereas Cr+6 is toxic and carcinogenic.
4.4 Summary
Ranges investigated under the MMRP have been inactive for different amounts of time. The longer the time, the longer the residues have been subjected to environmental weathering processes. HE particles will likely remain at arid MMRP sites. The presence of particles will increase the het-erogeneity of the soils with respect to HE, and will also increase the num-ber of samples needed to detect them in the soil.
Dissolution and aqueous transport are thought to be the major mechanism for transporting energetic compounds off of the range. Groundwater is thought to be the major pathway. Although transport of energetic particles by wind or by surface water is possible, wind cannot entrain and move mil-limeter-sized particles for long distances, surface water usually covers only a small area of the range, and most rainfall percolates directly into the soil (Buttle 1994). Monitoring wells installed at impact areas have shown the presence of energetic compounds in groundwater (e.g., Martel et al. 2009).
We think that all of these compounds biotransform and biodegrade once they are in solution. During transit through the vadose zone, the energetic compounds can interact with soil in a variety of ways: they can reversibly or irreversibly bind to soil, and break down chemically or biologically while in solution. Research has found RDX to be persistent and mobile in comparison with TNT, which photo-degrades rapidly and is aerobically bio-transformed to the amino DNT compounds (2-Am-DNT and 4-Am-DNT). The amino DNT compounds can be detected in soils after TNT is no longer present. HMX is also persistent, but because it has such a low solu-bility, it is seldom found in waters. NG appears to break down more rapid-ly than 2,4-DNT.
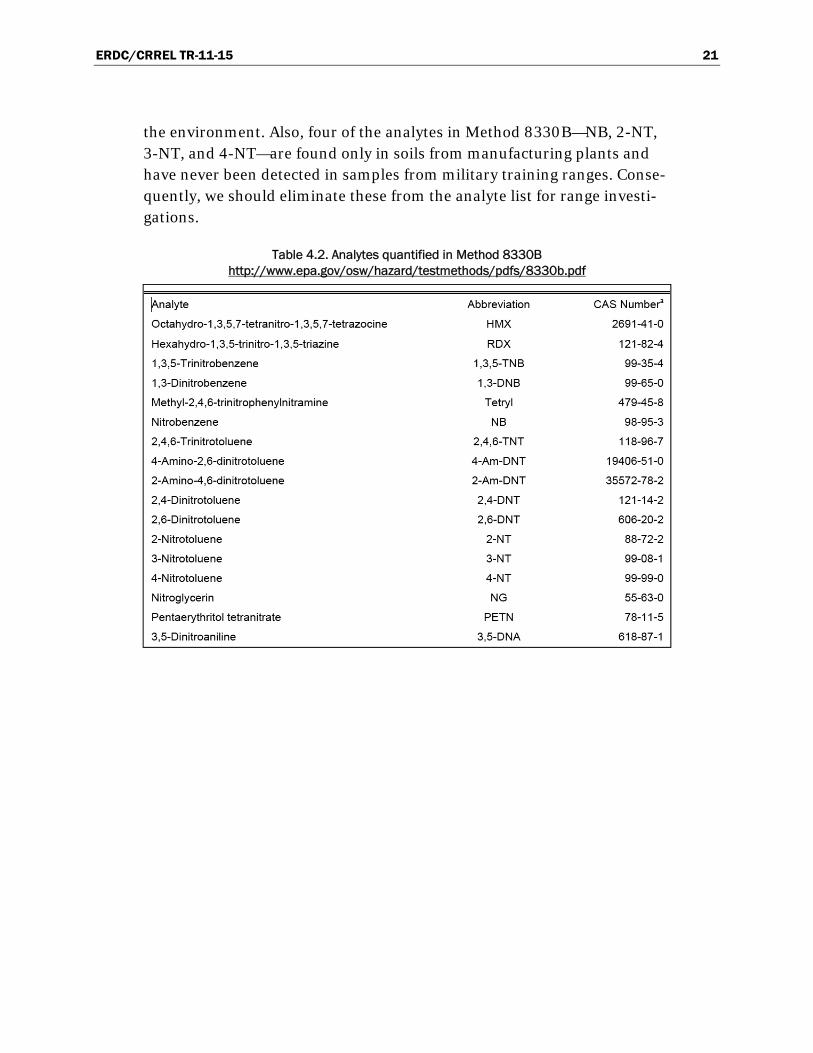
It is important to note that Method 8330B (USEPA 2006b) quantifies only the analytes listed in Table 4.2 and that there are other compounds, formed by photo-degradation, biotransformation, or biodegradation, that are unknown at this time but might be deleterious for human health and
ERDC/CRREL TR-11-15 21
the environment. Also, four of the analytes in Method 8330B—NB, 2-NT, 3-NT, and 4-NT—are found only in soils from manufacturing plants and have never been detected in samples from military training ranges. Conse-quently, we should eliminate these from the analyte list for range investi-gations.
Table 4.2. Analytes quantified in Method 8330B http://www.epa.gov/osw/hazard/testmethods/pdfs/8330b.pdf
ERDC/CRREL TR-11-15 22
5 Soil Sampling Methods
5.1 Background
Representative sampling should be a major objective of any sampling plan (USEPA 2002, 2003b). To obtain soil samples that represent the constitu-ents in the area being sampled, your sampling strategy must address the heterogeneity in composition and distribution of the constituents of con-cern. Compositional heterogeneity is attributable to not all soil-sized parti-cles within the population having the same concentration of target analytes. This heterogeneity is large when the target analytes are present as discrete particles, as is the case for energetic residues and metals. The error caused by compositional heterogeneity is inversely related to the sample mass (Pitard 1993; Gy 1998). Distributional heterogeneity comes from contaminant particles being unevenly scattered across the decision unit, sometimes with a systematic component as well as a short-range random component. The error associated with distributional heterogeneity is inversely related to the number of individual increments collected with-in the decision unit to build the sample. Soils are inherently heterogene-ous, containing alumino-silicate minerals in various size classes (sands, silts, clays), and decaying organic matter from plants and animals. When contaminants are present within the soil matrix, this further complicates an already very heterogeneous material.
5.2 Discrete sampling
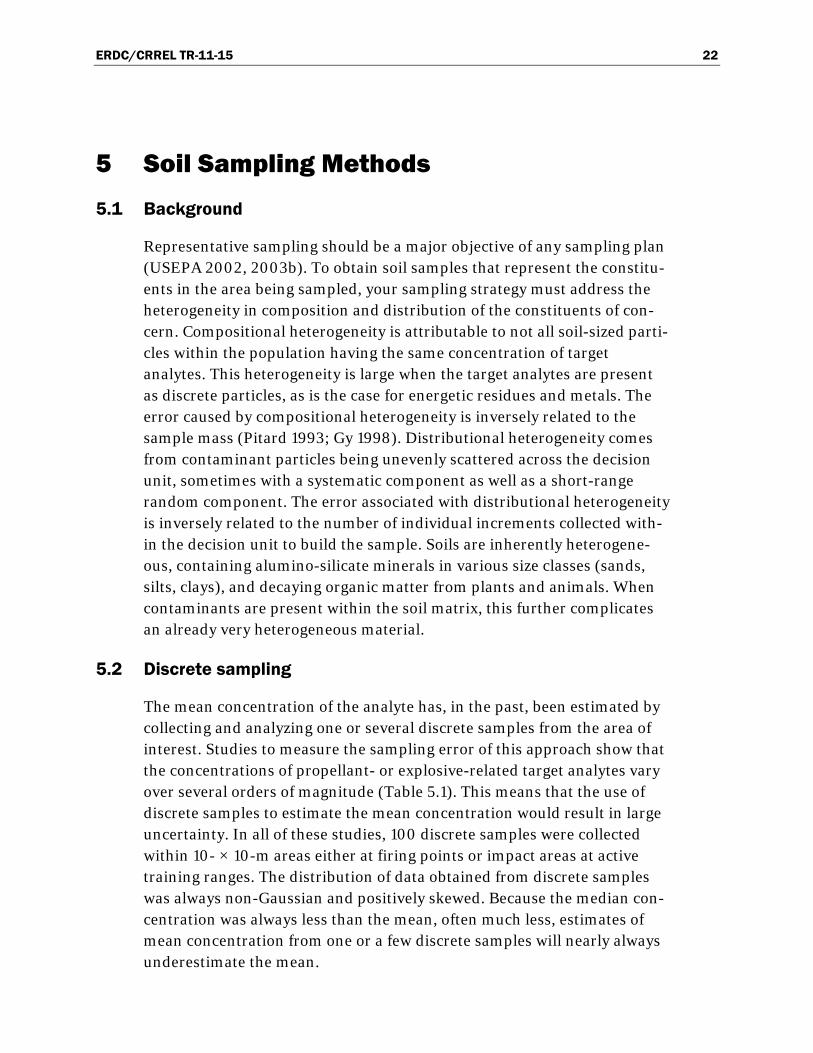
The mean concentration of the analyte has, in the past, been estimated by collecting and analyzing one or several discrete samples from the area of interest. Studies to measure the sampling error of this approach show that the concentrations of propellant- or explosive-related target analytes vary over several orders of magnitude (Table 5.1). This means that the use of discrete samples to estimate the mean concentration would result in large uncertainty. In all of these studies, 100 discrete samples were collected within 10- × 10-m areas either at firing points or impact areas at active training ranges. The distribution of data obtained from discrete samples was always non-Gaussian and positively skewed. Because the median con-centration was always less than the mean, often much less, estimates of mean concentration from one or a few discrete samples will nearly always underestimate the mean.
ERDC/CRREL TR-11-15 23
Table 5.1. Variability of soil concentrations among 100 discrete samples collected within 10- × 10-m grids at various training range impact areas
Concentration (mg/kg)
Installation Area* Range type Analyte Max Min Median Mean Std dev.
Donnelly Training Area (AK)1 FP Artillery 2,4-DNT 6.38 0.0007 0.65 1.06 1.17
CFB-Valcartier (QC)2 FP Antitank rocket NG 2.94 0.02 0.281 0.451 0.494
CFB-Valcartier (QC)2 IA Antitank rocket HMX 1150 5.8 197 292 290
Holloman AFB (NM)3 IA Bombing TNT 778 0.15 6.36 31.8 87.0
Ft. Polk (LA)4 IA Mortar RDX 2390 0.037 1.7 71.5 315
Cold Lake (AB)5 IA Bombing TNT 289 0.38 6.57 16.2 32.3
Ft. Richardson (AK)6 IA Artillery RDX 172 <0.04 <0.04 5.46 24.8
Ft. Richardson (AK)7 IA Mortar RDX 4450 <0.04 <0.04 **
* Firing point (FP) or Impact Area (IA). 1 M.E. Walsh et al. 2004, 2 Jenkins et al, 2004b, 3 Jenkins et al. 2006b, 4 Jenkins et al, 2004a, 5 Ampleman et al. 2003, 6 M.E. Walsh et al. 2007. 7 Hewitt et al. 2009 (Note: results from 200 discrete samples). ** Not computed
5.3 Multi-increment sampling
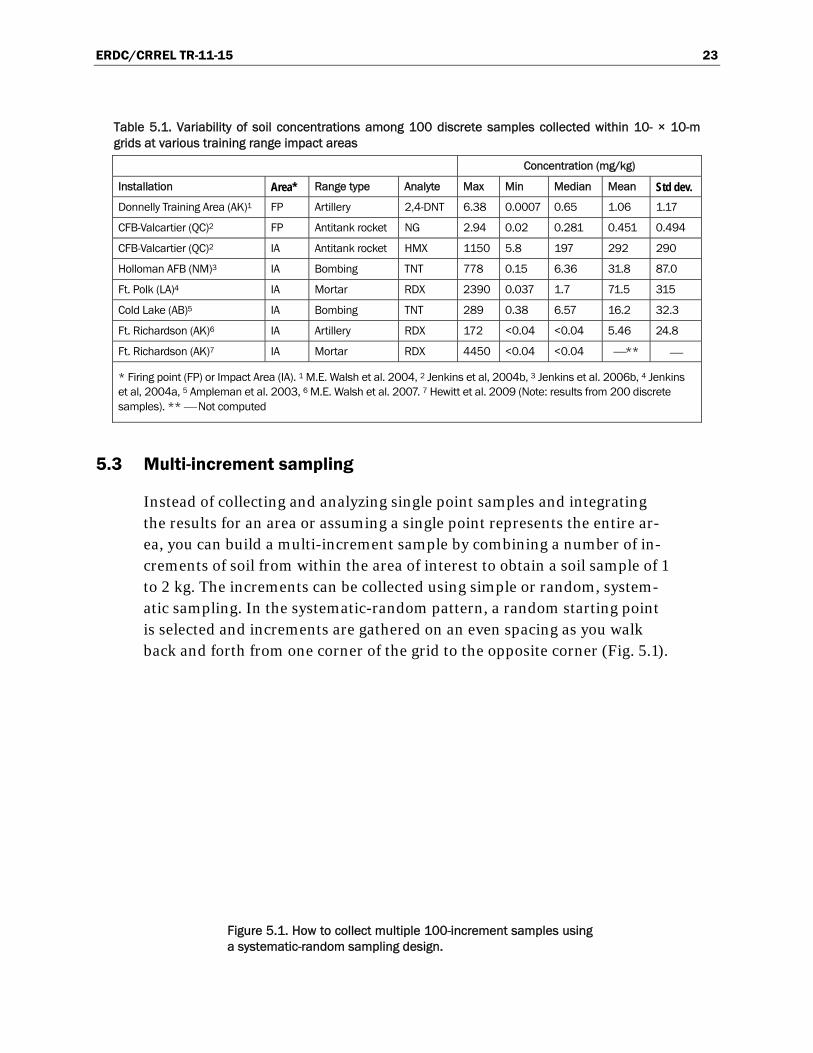
Instead of collecting and analyzing single point samples and integrating the results for an area or assuming a single point represents the entire ar-ea, you can build a multi-increment sample by combining a number of in-crements of soil from within the area of interest to obtain a soil sample of 1 to 2 kg. The increments can be collected using simple or random, system-atic sampling. In the systematic-random pattern, a random starting point is selected and increments are gathered on an even spacing as you walk back and forth from one corner of the grid to the opposite corner (Fig. 5.1).
Figure 5.1. How to collect multiple 100-increment samples using a systematic-random sampling design.
ERDC/CRREL TR-11-15 24
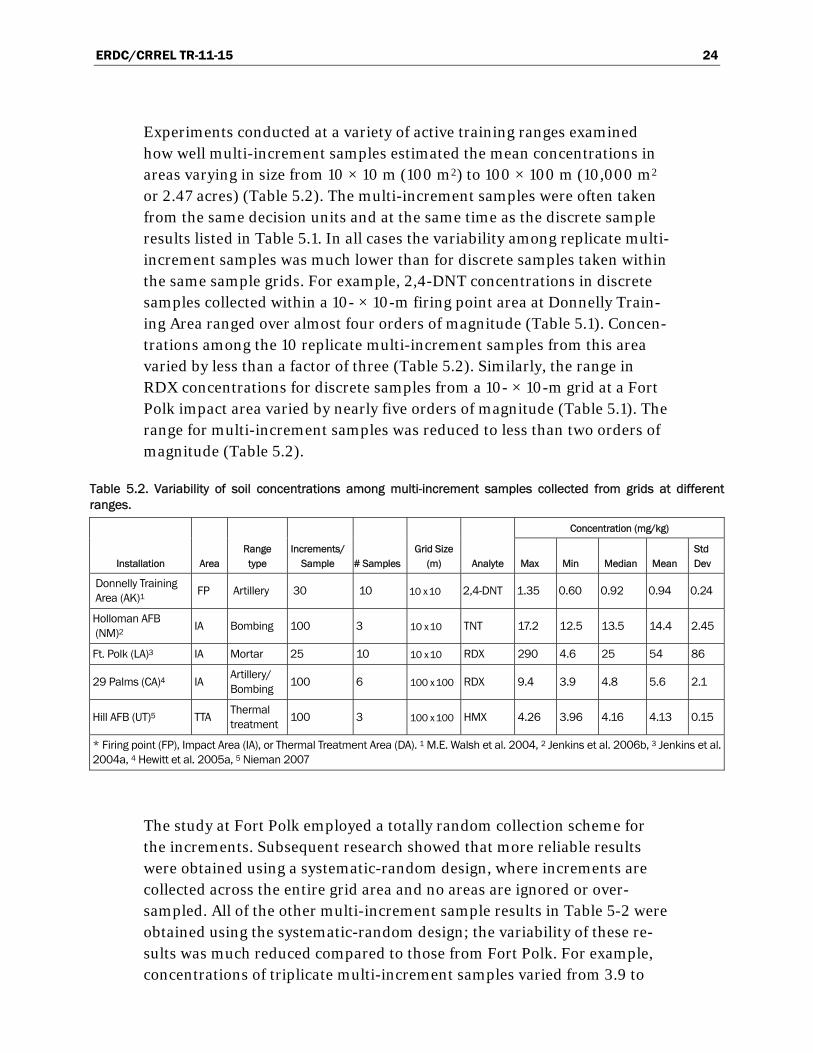
Experiments conducted at a variety of active training ranges examined how well multi-increment samples estimated the mean concentrations in areas varying in size from 10 × 10 m (100 m2) to 100 × 100 m (10,000 m2 or 2.47 acres) (Table 5.2). The multi-increment samples were often taken from the same decision units and at the same time as the discrete sample results listed in Table 5.1. In all cases the variability among replicate multi-increment samples was much lower than for discrete samples taken within the same sample grids. For example, 2,4-DNT concentrations in discrete samples collected within a 10- × 10-m firing point area at Donnelly Train-ing Area ranged over almost four orders of magnitude (Table 5.1). Concen-trations among the 10 replicate multi-increment samples from this area varied by less than a factor of three (Table 5.2). Similarly, the range in RDX concentrations for discrete samples from a 10- × 10-m grid at a Fort Polk impact area varied by nearly five orders of magnitude (Table 5.1). The range for multi-increment samples was reduced to less than two orders of magnitude (Table 5.2).
Table 5.2. Variability of soil concentrations among multi-increment samples collected from grids at different ranges.
Installation Area Range type
Increments/Sample # Samples
Grid Size (m) Analyte
Concentration (mg/kg)
Max Min Median Mean Std Dev
Donnelly Training Area (AK)1
FP Artillery 30 10 10 x 10 2,4-DNT 1.35 0.60 0.92 0.94 0.24
Holloman AFB (NM)2
IA Bombing 100 3 10 x 10 TNT 17.2 12.5 13.5 14.4 2.45
Ft. Polk (LA)3 IA Mortar 25 10 10 x 10 RDX 290 4.6 25 54 86
29 Palms (CA)4 IA Artillery/ Bombing
100 6 100 x 100 RDX 9.4 3.9 4.8 5.6 2.1
Hill AFB (UT)5 TTA Thermal treatment
100 3 100 x 100 HMX 4.26 3.96 4.16 4.13 0.15
* Firing point (FP), Impact Area (IA), or Thermal Treatment Area (DA). 1 M.E. Walsh et al. 2004, 2 Jenkins et al. 2006b, 3 Jenkins et al. 2004a, 4 Hewitt et al. 2005a, 5 Nieman 2007
The study at Fort Polk employed a totally random collection scheme for the increments. Subsequent research showed that more reliable results were obtained using a systematic-random design, where increments are collected across the entire grid area and no areas are ignored or over-sampled. All of the other multi-increment sample results in Table 5-2 were obtained using the systematic-random design; the variability of these re-sults was much reduced compared to those from Fort Polk. For example, concentrations of triplicate multi-increment samples varied from 3.9 to
ERDC/CRREL TR-11-15 25
9.4 mg/kg for RDX for soil samples from an impact area at 29 Palms, CA (Hewitt et al. 2005a) and from 3.96 to 4.26 mg/kg for HMX for samples from a thermal treatment area at Hill AFB (Nieman 2007). These results indicate that multi-increment samples should be collected using a system-atic-random pattern rather than a totally random pattern that sometimes over- or under-represents the concentration within various areas of the grid. Furthermore, a systematic-random approach ensures that incre-ments are collected from the entire decision unit, thereby minimizing sampling bias.
Multi-increment samples provide more reproducible estimates of mean concentrations within grids at firing point and impact areas than do dis-crete samples. The reproducibility is measured by the percent relative standard deviation (%RSD) of samples
%RSD = 100(s / x)
where s = standard deviation (from variability of replicate multi-
increment results) x = sample mean (mean of replicate multi-increment results).
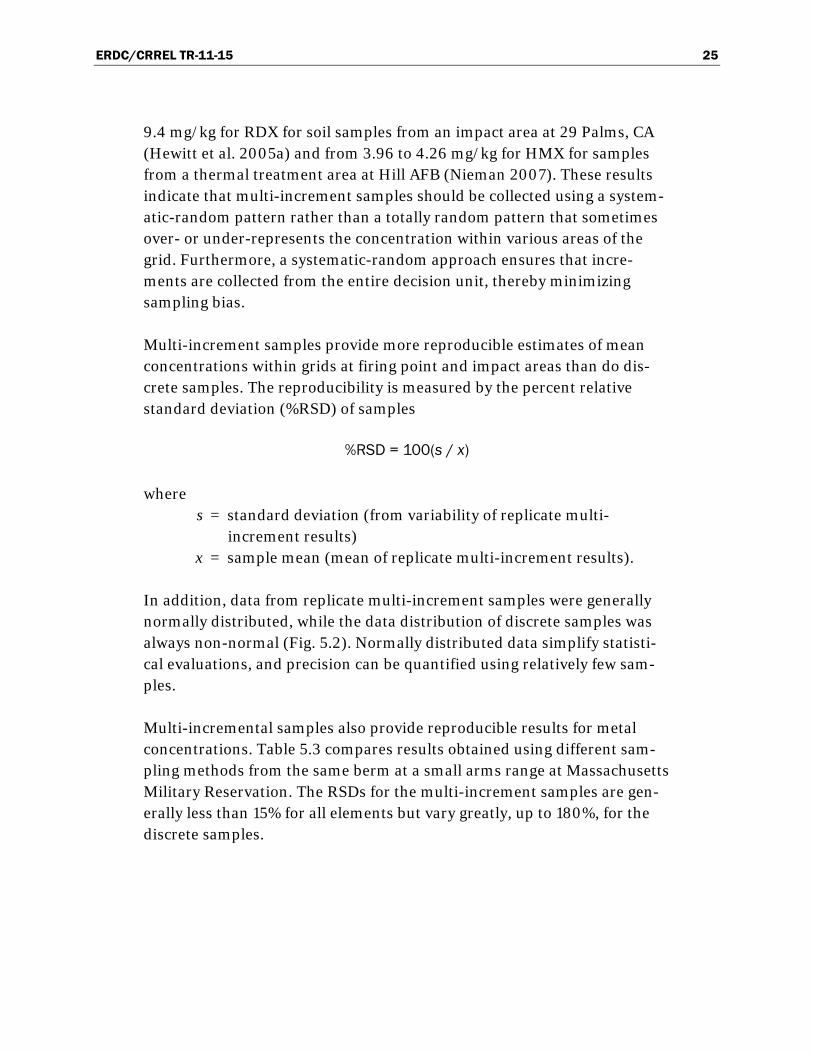
In addition, data from replicate multi-increment samples were generally normally distributed, while the data distribution of discrete samples was always non-normal (Fig. 5.2). Normally distributed data simplify statisti-cal evaluations, and precision can be quantified using relatively few sam-ples.
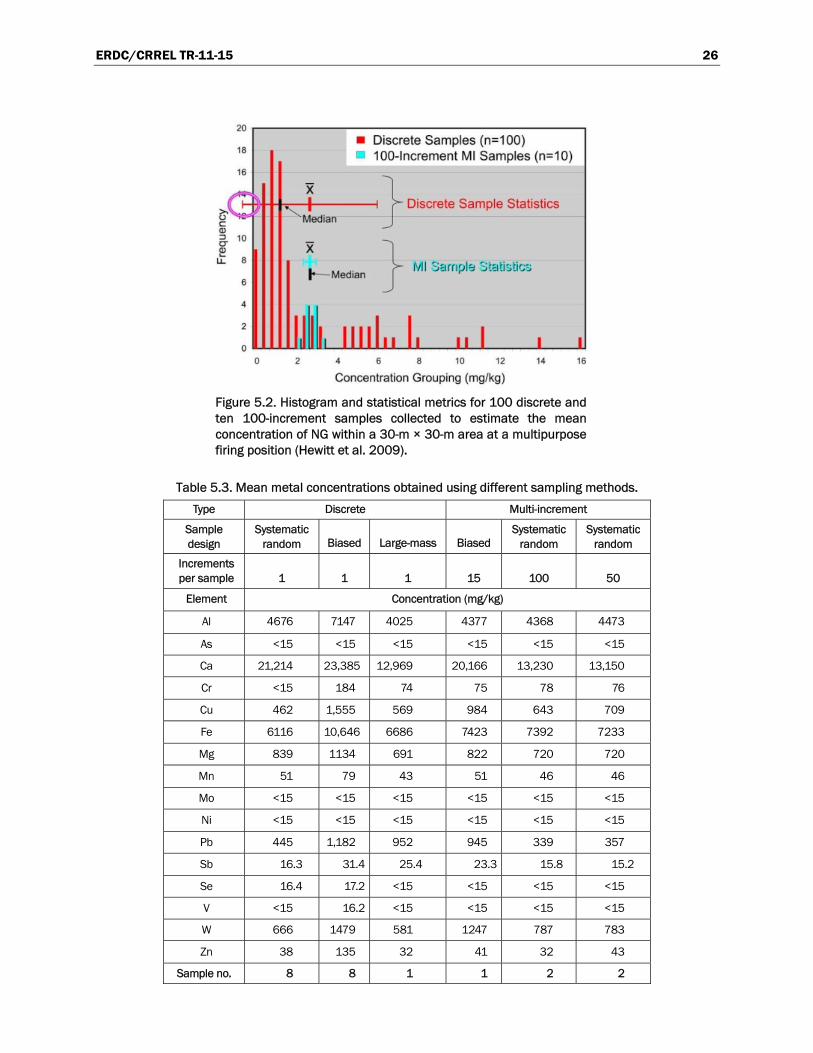
Multi-incremental samples also provide reproducible results for metal concentrations. Table 5.3 compares results obtained using different sam-pling methods from the same berm at a small arms range at Massachusetts Military Reservation. The RSDs for the multi-increment samples are gen-erally less than 15% for all elements but vary greatly, up to 180%, for the discrete samples.
ERDC/CRREL TR-11-15 26
Figure 5.2. Histogram and statistical metrics for 100 discrete and ten 100-increment samples collected to estimate the mean concentration of NG within a 30-m × 30-m area at a multipurpose firing position (Hewitt et al. 2009).
Table 5.3. Mean metal concentrations obtained using different sampling methods.
Type Discrete Multi-increment
Sample design
Systematic random Biased Large-mass Biased
Systematic random
Systematic random
Increments per sample 1 1 1 15 100 50
Element Concentration (mg/kg)
Al 4676 7147 4025 4377 4368 4473
As <15 <15 <15 <15 <15 <15
Ca 21,214 23,385 12,969 20,166 13,230 13,150
Cr <15 184 74 75 78 76
Cu 462 1,555 569 984 643 709
Fe 6116 10,646 6686 7423 7392 7233
Mg 839 1134 691 822 720 720
Mn 51 79 43 51 46 46
Mo <15 <15 <15 <15 <15 <15
Ni <15 <15 <15 <15 <15 <15
Pb 445 1,182 952 945 339 357
Sb 16.3 31.4 25.4 23.3 15.8 15.2
Se 16.4 17.2 <15 <15 <15 <15
V <15 16.2 <15 <15 <15 <15
W 666 1479 581 1247 787 783
Zn 38 135 32 41 32 43
Sample no. 8 8 1 1 2 2
ERDC/CRREL TR-11-15 27
5.4 Comparison of multi-increment with “box” and “wheel” samples
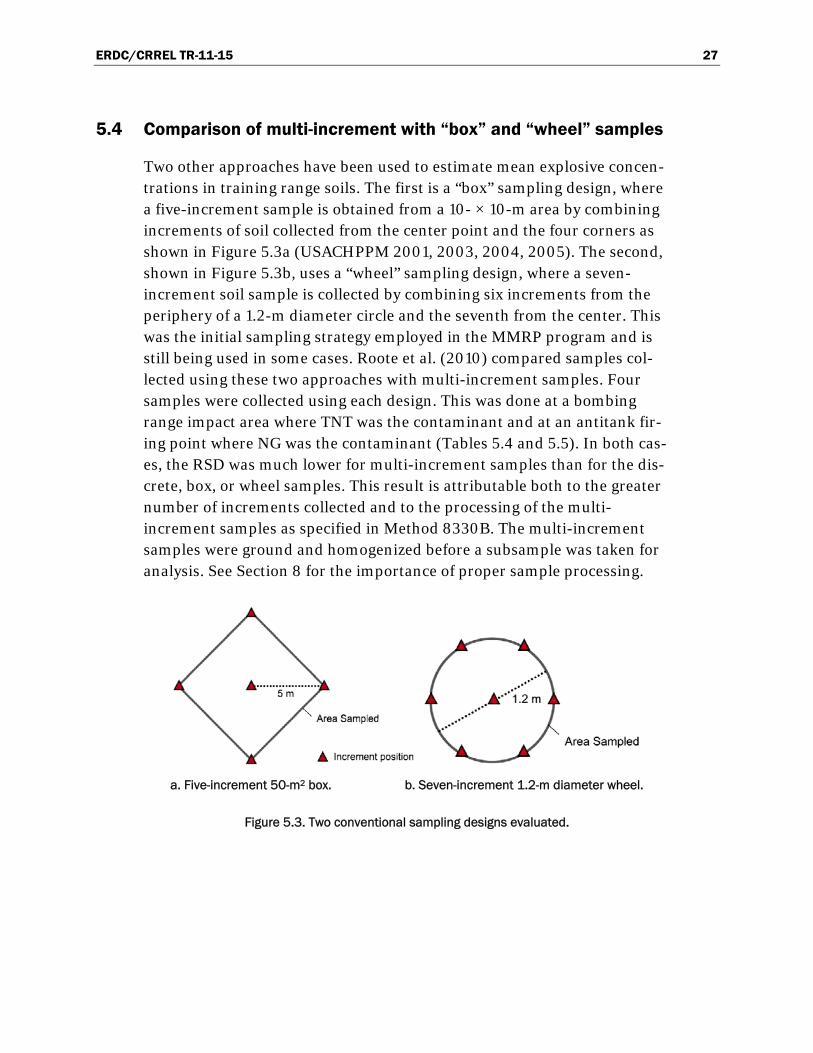
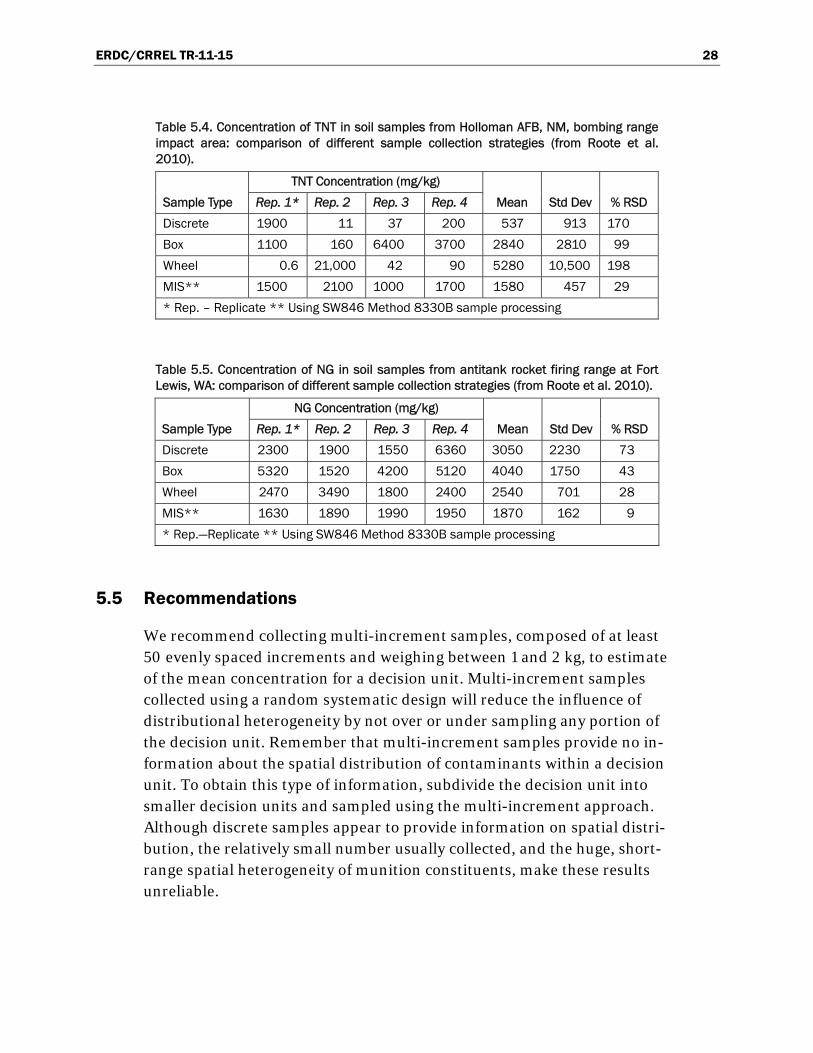
Two other approaches have been used to estimate mean explosive concen-trations in training range soils. The first is a “box” sampling design, where a five-increment sample is obtained from a 10- × 10-m area by combining increments of soil collected from the center point and the four corners as shown in Figure 5.3a (USACHPPM 2001, 2003, 2004, 2005). The second, shown in Figure 5.3b, uses a “wheel” sampling design, where a seven-increment soil sample is collected by combining six increments from the periphery of a 1.2-m diameter circle and the seventh from the center. This was the initial sampling strategy employed in the MMRP program and is still being used in some cases. Roote et al. (2010) compared samples col-lected using these two approaches with multi-increment samples. Four samples were collected using each design. This was done at a bombing range impact area where TNT was the contaminant and at an antitank fir-ing point where NG was the contaminant (Tables 5.4 and 5.5). In both cas-es, the RSD was much lower for multi-increment samples than for the dis-crete, box, or wheel samples. This result is attributable both to the greater number of increments collected and to the processing of the multi-increment samples as specified in Method 8330B. The multi-increment samples were ground and homogenized before a subsample was taken for analysis. See Section 8 for the importance of proper sample processing.
a. Five-increment 50-m2 box. b. Seven-increment 1.2-m diameter wheel.
Figure 5.3. Two conventional sampling designs evaluated.
ERDC/CRREL TR-11-15 28
Table 5.4. Concentration of TNT in soil samples from Holloman AFB, NM, bombing range impact area: comparison of different sample collection strategies (from Roote et al. 2010).
Sample Type
TNT Concentration (mg/kg)
Mean Std Dev % RSD Rep. 1* Rep. 2 Rep. 3 Rep. 4
Discrete 1900 11 37 200 537 913 170
Box 1100 160 6400 3700 2840 2810 99
Wheel 0.6 21,000 42 90 5280 10,500 198
MIS** 1500 2100 1000 1700 1580 457 29
* Rep. – Replicate ** Using SW846 Method 8330B sample processing
Table 5.5. Concentration of NG in soil samples from antitank rocket firing range at Fort Lewis, WA: comparison of different sample collection strategies (from Roote et al. 2010).
Sample Type
NG Concentration (mg/kg)
Mean Std Dev % RSD Rep. 1* Rep. 2 Rep. 3 Rep. 4
Discrete 2300 1900 1550 6360 3050 2230 73
Box 5320 1520 4200 5120 4040 1750 43
Wheel 2470 3490 1800 2400 2540 701 28
MIS** 1630 1890 1990 1950 1870 162 9
* Rep.—Replicate ** Using SW846 Method 8330B sample processing
5.5 Recommendations
We recommend collecting multi-increment samples, composed of at least 50 evenly spaced increments and weighing between 1 and 2 kg, to estimate of the mean concentration for a decision unit. Multi-increment samples collected using a random systematic design will reduce the influence of distributional heterogeneity by not over or under sampling any portion of the decision unit. Remember that multi-increment samples provide no in-formation about the spatial distribution of contaminants within a decision unit. To obtain this type of information, subdivide the decision unit into smaller decision units and sampled using the multi-increment approach. Although discrete samples appear to provide information on spatial distri-bution, the relatively small number usually collected, and the huge, short-range spatial heterogeneity of munition constituents, make these results unreliable.
ERDC/CRREL TR-11-15 29
6 Sampling Strategies
The sampling strategy should be based on the project objectives or DQOs. Sampling strategy involves both how to divide your range into manageable decision units and then how to sample these. If you know how the site was used or how it is going to be used, the area can be divided up into decision units based on this information (stratified). Samples (or increments) with-in decision units can be collected non-probabilistically (sometimes called judgmental, biased, or targeted sampling), and probabilistically. Non-probabilistic sampling relies on the subjective, professional judgment of the sampler to select appropriate sampling locations and does not allow the level of confidence (uncertainty) of the investigation to be accurately quantified. In addition, judgmental sampling limits the inferences that can be made about the units sampled, and extrapolation from those units to the overall population from which the units were collected is subject to unknown selection bias (USEPA 2002, QA/G-5S).
Therefore, samples (or increments) within decision units should be ob-tained probabilistically by collecting them at predetermined locations us-ing a random starting point obtained from a random number generator.
The data needed to perform an SI may differ significantly from the data needed for an RI. The statistical confidence level required to support pro-ject decisions will dictate the sampling design and the number of samples that need to be taken.
6.1 Decision units
A decision unit is the specific area that is represented by a single multi-increment sample (Ramsey and Hewitt 2005; HDOH 2008; ADEC 2009). The sample collected from the decision unit is the smallest volume of soil for which a concentration value will be obtained, and the basic unit about which a decision or conclusion based on an analytical result can be made. Although decision units for surface soil often are discussed only in terms of area, the vertical dimension (sample depth or thickness) must be speci-fied. A decision unit is, therefore, inherently three dimensional.
The depth of surface soil required can be different among regulatory agen-cies, or for different sampling objectives. For human health risk assess-
ERDC/CRREL TR-11-15 30
ment, surface soil is often defined as the top 15 cm (6 in.), the top 30 cm (12 in.), or sometimes the top 60 cm (24 in.). It can be even deeper for some ecological receptors or exposure scenarios. Note that as most of the contaminants for MC are on the surface. Increment depths more 2 cm like-ly decrease the sample concentration.
Decision units should be site-specific and project-specific. They should be of a size that is relevant to the end use of the data. An individual decision unit should encompass an area having similar characteristics throughout; for example, a decision unit set up to investigate a release area should not combine areas known to have high and low levels of contamination (USEPA 1996b, Section 4.1.4). However, if the objective is to determine exposure risk (i.e., if the result is to be compared to risk-based soil screen-ing values), a single decision unit should encompass areas that are equally used by potential receptors.
Decision units can be of any shape that will best meet sampling objec-tives—rectangular, circular, concentric rings, radial wedges, irregular shapes, etc. In some instances, a decision unit circumscribing a feature (e.g., a building) may be appropriate. Where practical, a rectangular-shaped decision unit is recommended for ease of sampling.
The size of a decision unit is dictated by project objectives and can be any size (USEPA 2006a, Section 4.2). Decision units 100 × 100 m (10,000 m2 or 2.47 acres) have successfully been used to map explosive residues on active firing ranges (e.g., Hewitt et al. 2005a). M.R. Walsh et al. (2008) used larger decision units, 200 × 200 m, to determine mean soil concen-trations in an impact area. For larger decision units, the sample mass needed to characterize the area can be large, making the sample unwieldy to transport and process. For example, one hundred 20-g increments would yield a 2-kg multi-increment sample. If this sample were taken from a 100- × 100-m area, one increment would be collected from each 10- × 10-m (100-m2) cell. If this sample were taken from a 1000- × 1000-m area, 1 km2, one increment would be collected from each 100- × 100-m (10,000 m2) cell. If only 100 increments are to be collected, as the size of the deci-sion unit increases, the distance between increments will increase. If you want to be able to detect a single event, such as a partial detonation or a ruptured round that contaminates an area smaller than your increment spacing, you need to decrease the spacing between increments, which means increasing the mass and the number of increments collected.
ERDC/CRREL TR-11-15 31
For very large ranges, it may be appropriate to use a phased approach, starting with decision units larger than those that would be needed for a definitive risk-based decision or remedial design before committing to a full-scale, detailed investigation. This approach is described in the Hawaii Department of Health technical guidance as “investigating at the neigh-borhood scale” (HDOH 2008, Section 3.4.2.1). A reconnaissance of the large areas required by the sampling team also helps find smaller features (e.g., low-order detonations, etc.) that should be sampled in more detail.
Practical limitations and unforeseen field conditions may require modify-ing the decision unit areas defined during planning. For example, areas may have limited or difficult access, or be entirely inaccessible for a variety of reasons, such as pavement, buildings, exposed bedrock surface without soil, or denied right-of-entry. Areas that cannot be sampled, but that would otherwise have been part of a decision unit, should be excluded from the final decision unit. Changes in decision unit areas should be de-scribed and justified in reports.
Site-specific work plans should state the rationale for the size of the deci-sion units and how their mean concentrations relate to the criteria that will be used to evaluate the results. Decision units designed to meet one objective may or may not be appropriate for a different site, different analyte, or for different project objectives or data end uses. Deficiencies in systematic planning become starkly evident if decision units are inappro-priate to meet the intended end use of the data.
6.1.1 Decision units for risk-based soil screening levels
Risk-based soil screening levels (SSL) come from average or upper percen-tile exposure factors and durations. They are optimally applied across a specific area—the exposure unit. We assume that a receptor is exposed equally to all parts of an exposure unit. The mean soil contaminant con-centration across the exposure unit best represents the potential exposure of a receptor to site contaminants over a long period.
If the multi-increment sample concentrations are to be compared directly to SSLs for direct exposure, decision units should be about the same size as the exposure unit upon which the SSL is based (USEPA 1996b). If the mean concentration for a decision unit is very close to the action level, col-lecting many multi-increment samples will help quantify the uncertainty

ERDC/CRREL TR-11-15 32
and help determine how well the mean concentration of the decision unit is known and how likely it is to be above the action level.
Many times default risk-based values used for site screening are based on residential exposures. In these cases, the area of exposure is assumed to be a suburban residential lot size, typically about one quarter to one half acre (USEPA 1996a; USEPA 1996b, Section 4.1.4; USEPA 2009). Exposure units for industrial based screening levels might be applicable to larger ar-eas.
6.1.2 Decision units to assess human health and ecological risk
The highest detection of a given chemical in an area often has been used for risk screening. If MI samples are collected from the areas most likely to contain high concentrations of contaminants, you minimize the possibility of underestimating the soil concentrations and, hence, underestimating the risk to people or other creatures. Multi-increment samples allow you to obtain average concentrations that represent realistic exposure concentra-tions using relatively few samples.
For baseline human health risk assessments at the RI stage, it is necessary to define the nature and extent of contamination, and to establish expo-sure point concentrations. Average concentration is most representative of the concentration that would be encountered at a site, over time (USEPA 1992a). Per USEPA (1989b), the exposure point concentrations should be based on a 95% upper confidence level (UCL) to ensure that the mean is not underestimated. If a project requires a 95% UCL, three to five MIS from a decision unit can be used to quantify the uncertainty of the esti-mated mean concentration and calculate the 95 % UCL. Using MIS, you can calculate a 95% UCL for both human health and baseline ecological risk assessment. Typically, however, the size and depth of the decision units required will be different for human and ecological risk.
A baseline ecological risk assessment will establish the resources that re-quire protection and help determine appropriate decision unit sizes (U.S. Army BTAG 2002). Home range size, feeding and nesting patterns, and burrowing activities should all be considered in establishing appropriate decision units. Decision units for assessing ecological risk may be areas of preferred habitat within a site. Management goals will dictate which areas need to be sampled, and which do not (U.S. Army BTAG 2005).
ERDC/CRREL TR-11-15 33
6.1.3 Decision units for comparison to SSLs protective of groundwater
SSLs developed for protecting groundwater from contaminants leaching from soil are model-based, mean contaminant concentrations. Among the required model input parameters is a defined source volume of soil. Soil concentrations deemed protective of groundwater may be site-specific or default values, such as those published in the EPA Regional Screening Level tables and by many state regulatory agencies. The models assume that contamination is uniformly distributed throughout the source area. The source areas upon which different default screening levels are based typically range from an area of 0.5 acre to as many as 30 acres or more (e.g., Texas Tier 1 Residential Soil to Groundwater Protective Concentra-tion Level). If MI sample concentrations are to be compared directly to SSLs for evaluating the threat of leaching to groundwater, the decision unit size should consider the volume of soil upon which the SSL mean concentration value is based. A default 0.5-acre source is used to calculate the generic USEPA SSLs protective of groundwater (USEPA 1996b, Sec-tion 1.3.4) and in the absence of other sound rationale, a decision unit size of 0.5 acre would be reasonable.
6.1.4 Decision units to determine background concentrations
Mean background concentrations are required if the analytes being stud-ied are naturally occurring (e.g., metals) or have been deposited by pro-cesses unrelated to military activity. Multi-increment sampling is well suited to determining site-specific mean background concentrations. Pub-lished regional background data do not represent specific locations and should not be used as background concentrations.
Site-specific mean background concentrations are a baseline to which all other site data will be compared. Unlike regulatory or risk-based concen-tration criteria that are precisely defined by a single number, measured mean background concentrations have some degree of uncertainty. Be-cause background mean concentrations are going to be statistically com-pared with the mean concentrations from decision units at the site, the un-certainty in background concentrations needs to be small and well defined to provide confidence in decisions made using the site data. Large uncer-tainty in background concentrations attributable to inadequate sampling, or a lack of QC replicate samples, needlessly increases uncertainty. Be-cause of the importance of having good site-specific background concen-trations, we recommend sampling background decision units in triplicate.
ERDC/CRREL TR-11-15 34
Ideally, a background decision unit should be of the same size and have the same increment density as the decision units to which it will be com-pared. It is crucial that the background area be the same soil type. The ac-ceptable degree of uncertainty in the background values should be explicit-ly discussed and documented during the DQO process.
6.2 Quality of the data—relative standard deviation (%RSD)
The concentrations of replicate multi-increment samples from a decision unit tend to have low variance and normal distributions, properties not true of data sets collected using discrete samples.
As a rule of thumb, if the %RSD (variance) determined from three to five MIS replicates from the same decision unit is less than 30%, the sampling design and execution are likely to be adequate. Hewitt et al. (2008) sug-gest that if the %RSD is less than or equal to 30%, you could assume a normal distribution and thus calculate meaningful UCLs. Although a less than 30% RSD cannot conclusively demonstrate that a distribution is normal, a larger %RSD would suggest deviations from normality and indi-cate that the field sampling design or laboratory processing, or both, were not adequate to control for the effects of heterogeneity in both distribution or composition. Large uncertainty is more likely to result from collecting a sample with an insufficient number of increments or low sample mass than from laboratory analytical variability. Hawaii Department of Health (HDOH 2008, Section 4.2.5.1) is accepting 35% RSD, based on three multi-increment field replicate samples in their guidance, while the Alaska Department of Environmental Conservation requires that the %RSD be 30% or less (ADEC 2009). Note that at very low concentrations (i.e., at or near method reporting limits), %RSD increases, even though absolute dif-ferences in results may be small.
If there are a number of similar decision units (e.g., areas affected by simi-lar activities in the CSM), collecting three multi-increment samples from a subset of the decision units can be used to make inferences about the pre-cision of results for the other decision units from which only one multi-increment sample was collected. The Hawaii technical guidance for incre-mental sampling (HDOH 2008, Section 3.7.2) suggests that, for QC, at least three multi-increment samples be analyzed for 10% of the decision units, including one triplicate of each type of matrix for metals (i.e., soil type).
ERDC/CRREL TR-11-15 35
If multi-increment samples give an estimated mean concentration that is many times greater than or less than an action level or screening value, the data may still be usable even if the %RSD is larger than 30%, as the uncer-tainty will not alter the decision. By the same reasoning, if an estimated mean concentration is close to an action level, a greater degree of precision is needed. Note also that statistical analyses of very large simulated data sets for which the true mean is known show that, for a small number of replicate multi-increment samples, the %RSD will not necessarily cover the true population mean (e.g., 95% of the time for the 95% Upper Confi-dence Limit [UCL]) (ITRC, in preparation).
Soil concentrations are often compared to regulatory values using the 95% UCL of the mean. USEPA (2002) gives examples on how to calculate the 95% UCLs. For normally distributed data, you can use the Student t test to determine the 95% UCL
UCL1− = X+ t , n−1 s/n1/2
where X = sample mean = tolerance for Type I error S = sample standard deviation N = number of samples.
When the distribution is unknown, the Chebyshev UCL is more appropri-ate:
(1−) 100%UCL = X+(1/1/2)(s/n1/2)
Computer simulations suggest that the number of samples, multiplied by the number of increments per sample, should be about 250 to 300 to es-timate the 95% UCL (ITRC, in preparation). Thus, if 50 increments were taken per sample, at least five multi-increment samples would be needed.
ERDC/CRREL TR-11-15 36
6.3 Sampling designs
Information about the site can be used to determine where to locate deci-sion units. This subdivision of the site is particularly important if the area is large and only a small portion can be sampled. For example, based on historical information, a site may be stratified into three types of areas (USEPA 1996b): 1) areas likely to be contaminated; 2) areas suspected of being contaminated; and 3) areas unlikely to be contaminated. You could elect to sample areas thought to be contaminated and use the results from these areas to make future decisions, including the need for more sam-pling.
However, if no information is available about the area, a probabilistic ap-proach can be taken to determining the location of the decision units. Di-vide the area into decision units of a size relevant to the end use of the data and then use Table 6.1 to determine how many of these decision units must be sampled to achieve a specified confidence level that the un-sampled decision units will be below an action level. For example, if you sampled 59 decision units and none of them exceeded the action level (considered “clean”), then there is a 95% chance that all the other decision units in that area are “clean.” If, however, three of those decision units had concentrations above the action level, additional decision units would need to be sampled to have the same level of confidence (from Table 6.1 we see that 154 decision units with only three decision units exceeding the ac-tion level gives you 95% confidence). Remember that a 95% confidence level indicates that up to 5% of decision units could have a mean concen-tration greater than the action level. If you wanted to be 99% confident you would need 90 decision units with concentrations all below the action level, or 130 decision units, if one had a concentration above the action level.
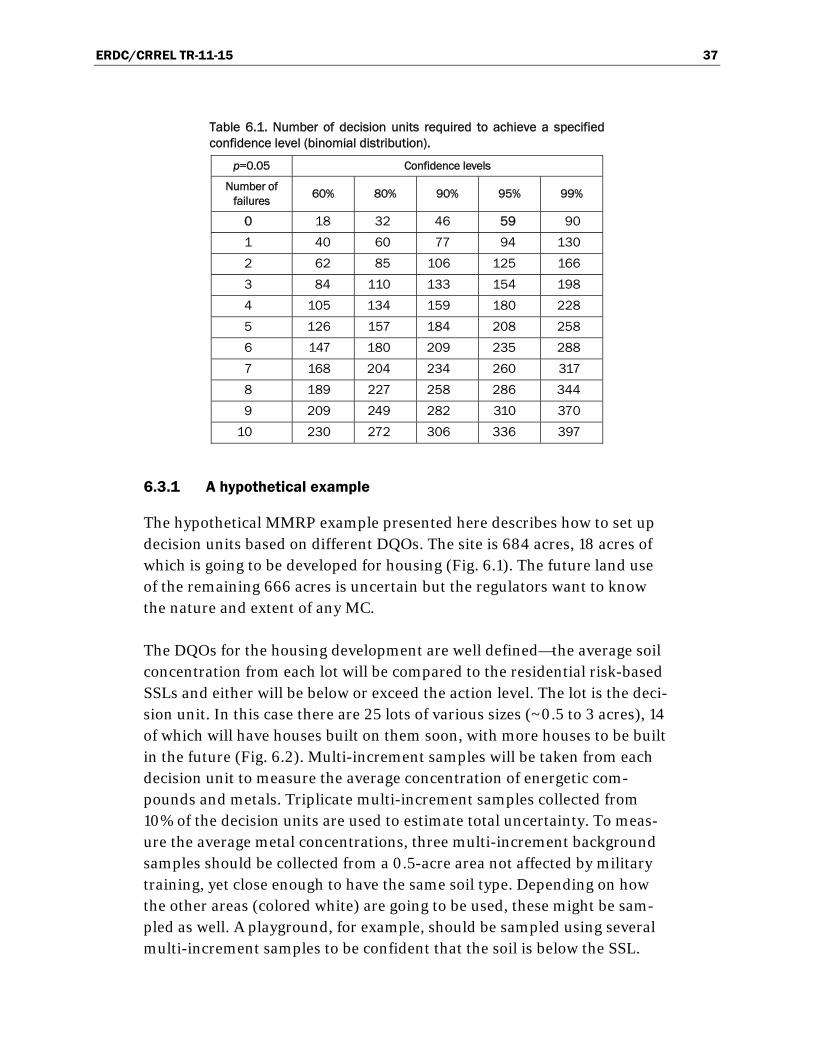
ERDC/CRREL TR-11-15 37
Table 6.1. Number of decision units required to achieve a specified confidence level (binomial distribution).
p=0.05 Confidence levels
Number of failures
60% 80% 90% 95% 99%
0 18 32 46 59 90
1 40 60 77 94 130
2 62 85 106 125 166
3 84 110 133 154 198
4 105 134 159 180 228
5 126 157 184 208 258
6 147 180 209 235 288
7 168 204 234 260 317
8 189 227 258 286 344
9 209 249 282 310 370
10 230 272 306 336 397
6.3.1 A hypothetical example
The hypothetical MMRP example presented here describes how to set up decision units based on different DQOs. The site is 684 acres, 18 acres of which is going to be developed for housing (Fig. 6.1). The future land use of the remaining 666 acres is uncertain but the regulators want to know the nature and extent of any MC.
The DQOs for the housing development are well defined—the average soil concentration from each lot will be compared to the residential risk-based SSLs and either will be below or exceed the action level. The lot is the deci-sion unit. In this case there are 25 lots of various sizes (~0.5 to 3 acres), 14 of which will have houses built on them soon, with more houses to be built in the future (Fig. 6.2). Multi-increment samples will be taken from each decision unit to measure the average concentration of energetic com-pounds and metals. Triplicate multi-increment samples collected from 10% of the decision units are used to estimate total uncertainty. To meas-ure the average metal concentrations, three multi-increment background samples should be collected from a 0.5-acre area not affected by military training, yet close enough to have the same soil type. Depending on how the other areas (colored white) are going to be used, these might be sam-pled as well. A playground, for example, should be sampled using several multi-increment samples to be confident that the soil is below the SSL.
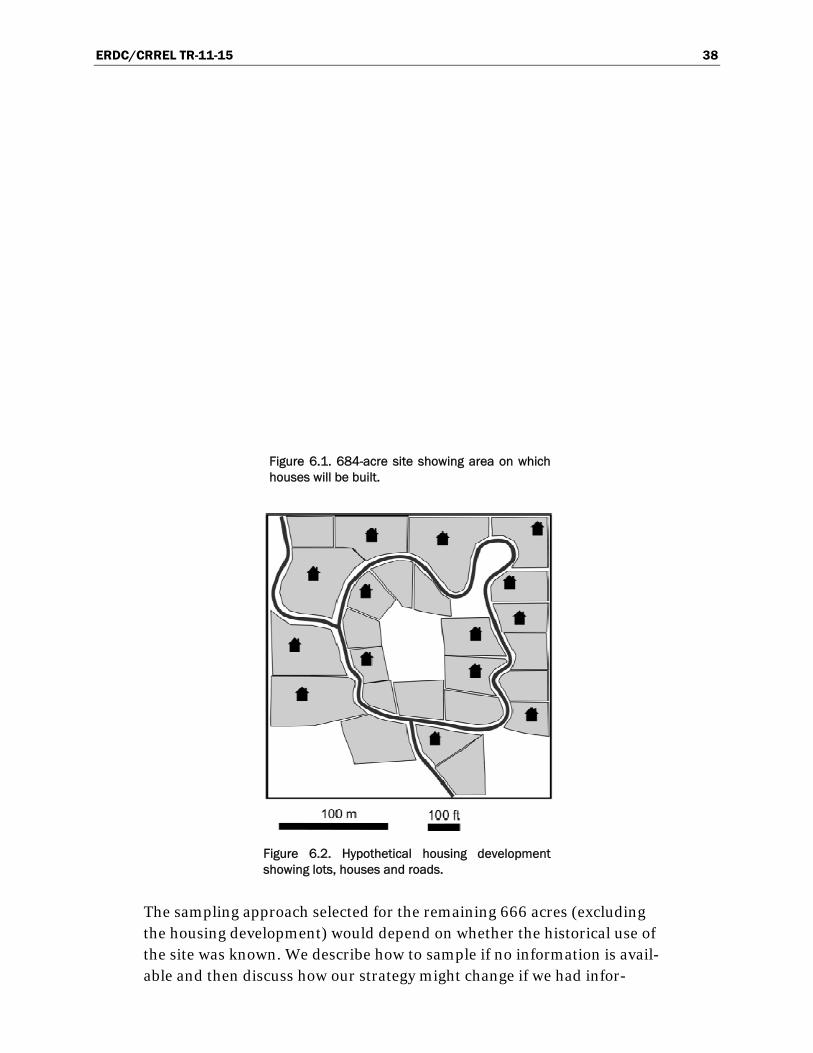
ERDC/CRREL TR-11-15 38
Figure 6.1. 684-acre site showing area on which houses will be built.
Figure 6.2. Hypothetical housing development showing lots, houses and roads.
The sampling approach selected for the remaining 666 acres (excluding the housing development) would depend on whether the historical use of the site was known. We describe how to sample if no information is avail-able and then discuss how our strategy might change if we had infor-
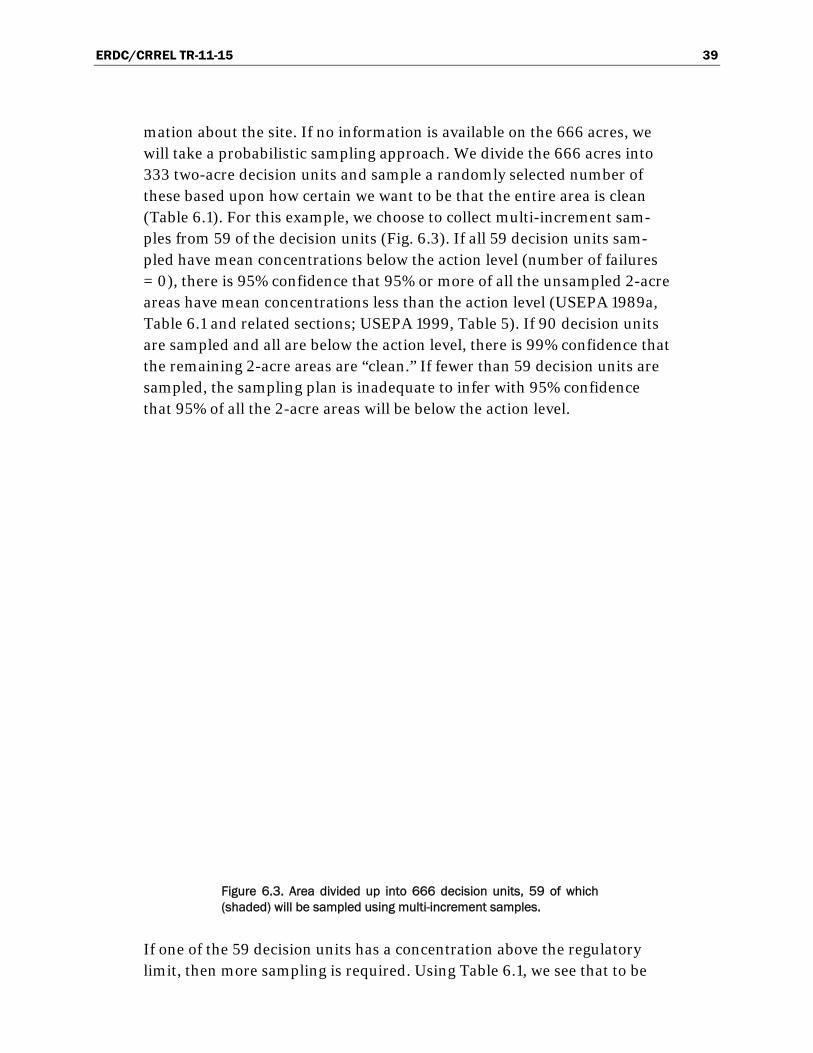
ERDC/CRREL TR-11-15 39
mation about the site. If no information is available on the 666 acres, we will take a probabilistic sampling approach. We divide the 666 acres into 333 two-acre decision units and sample a randomly selected number of these based upon how certain we want to be that the entire area is clean (Table 6.1). For this example, we choose to collect multi-increment sam-ples from 59 of the decision units (Fig. 6.3). If all 59 decision units sam-pled have mean concentrations below the action level (number of failures = 0), there is 95% confidence that 95% or more of all the unsampled 2-acre areas have mean concentrations less than the action level (USEPA 1989a, Table 6.1 and related sections; USEPA 1999, Table 5). If 90 decision units are sampled and all are below the action level, there is 99% confidence that the remaining 2-acre areas are “clean.” If fewer than 59 decision units are sampled, the sampling plan is inadequate to infer with 95% confidence that 95% of all the 2-acre areas will be below the action level.
Figure 6.3. Area divided up into 666 decision units, 59 of which (shaded) will be sampled using multi-increment samples.
If one of the 59 decision units has a concentration above the regulatory limit, then more sampling is required. Using Table 6.1, we see that to be
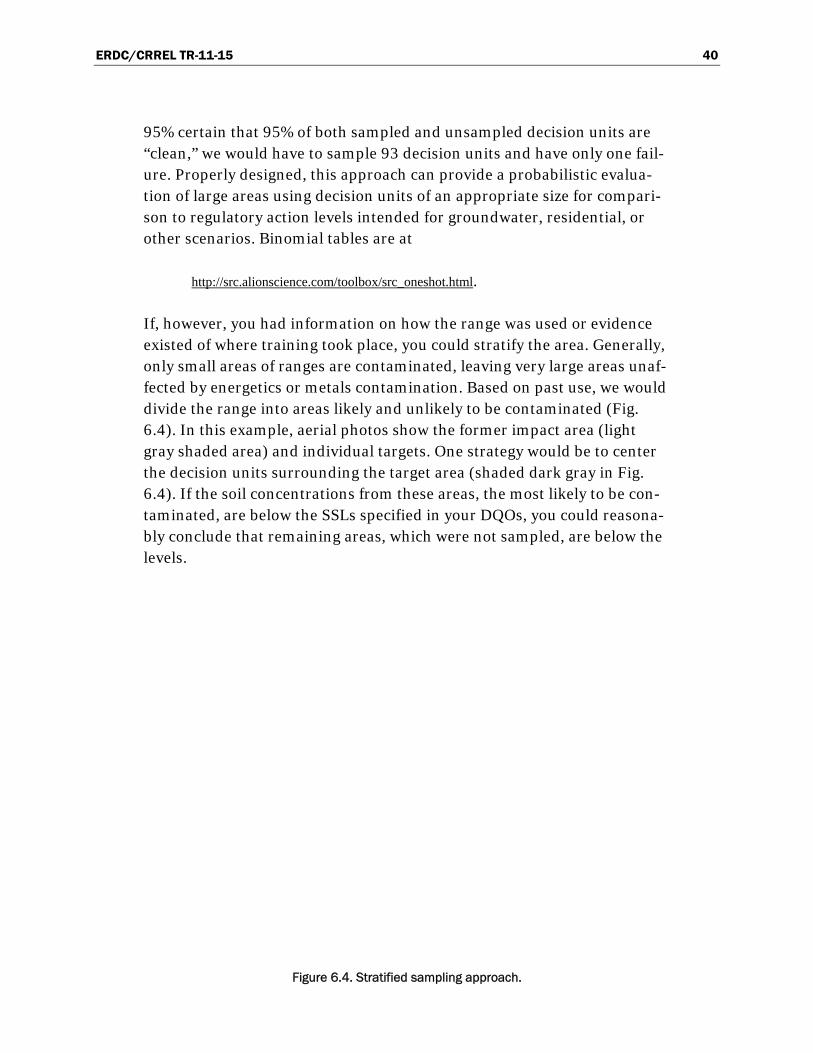
ERDC/CRREL TR-11-15 40
95% certain that 95% of both sampled and unsampled decision units are “clean,” we would have to sample 93 decision units and have only one fail-ure. Properly designed, this approach can provide a probabilistic evalua-tion of large areas using decision units of an appropriate size for compari-son to regulatory action levels intended for groundwater, residential, or other scenarios. Binomial tables are at
http://src.alionscience.com/toolbox/src_oneshot.html.
If, however, you had information on how the range was used or evidence existed of where training took place, you could stratify the area. Generally, only small areas of ranges are contaminated, leaving very large areas unaf-fected by energetics or metals contamination. Based on past use, we would divide the range into areas likely and unlikely to be contaminated (Fig. 6.4). In this example, aerial photos show the former impact area (light gray shaded area) and individual targets. One strategy would be to center the decision units surrounding the target area (shaded dark gray in Fig. 6.4). If the soil concentrations from these areas, the most likely to be con-taminated, are below the SSLs specified in your DQOs, you could reasona-bly conclude that remaining areas, which were not sampled, are below the levels.
Figure 6.4. Stratified sampling approach.
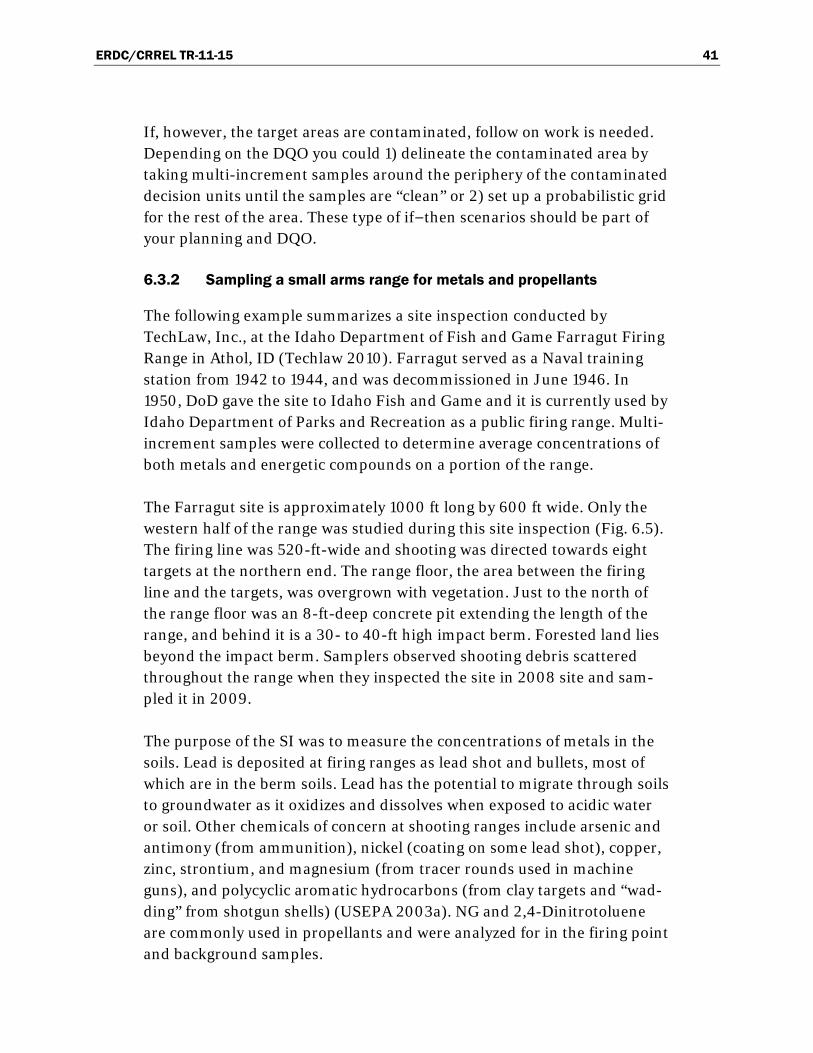
ERDC/CRREL TR-11-15 41
If, however, the target areas are contaminated, follow on work is needed. Depending on the DQO you could 1) delineate the contaminated area by taking multi-increment samples around the periphery of the contaminated decision units until the samples are “clean” or 2) set up a probabilistic grid for the rest of the area. These type of if−then scenarios should be part of your planning and DQO.
6.3.2 Sampling a small arms range for metals and propellants
The following example summarizes a site inspection conducted by TechLaw, Inc., at the Idaho Department of Fish and Game Farragut Firing Range in Athol, ID (Techlaw 2010). Farragut served as a Naval training station from 1942 to 1944, and was decommissioned in June 1946. In 1950, DoD gave the site to Idaho Fish and Game and it is currently used by Idaho Department of Parks and Recreation as a public firing range. Multi-increment samples were collected to determine average concentrations of both metals and energetic compounds on a portion of the range.
The Farragut site is approximately 1000 ft long by 600 ft wide. Only the western half of the range was studied during this site inspection (Fig. 6.5). The firing line was 520-ft-wide and shooting was directed towards eight targets at the northern end. The range floor, the area between the firing line and the targets, was overgrown with vegetation. Just to the north of the range floor was an 8-ft-deep concrete pit extending the length of the range, and behind it is a 30- to 40-ft high impact berm. Forested land lies beyond the impact berm. Samplers observed shooting debris scattered throughout the range when they inspected the site in 2008 site and sam-pled it in 2009.
The purpose of the SI was to measure the concentrations of metals in the soils. Lead is deposited at firing ranges as lead shot and bullets, most of which are in the berm soils. Lead has the potential to migrate through soils to groundwater as it oxidizes and dissolves when exposed to acidic water or soil. Other chemicals of concern at shooting ranges include arsenic and antimony (from ammunition), nickel (coating on some lead shot), copper, zinc, strontium, and magnesium (from tracer rounds used in machine guns), and polycyclic aromatic hydrocarbons (from clay targets and “wad-ding” from shotgun shells) (USEPA 2003a). NG and 2,4-Dinitrotoluene are commonly used in propellants and were analyzed for in the firing point and background samples.
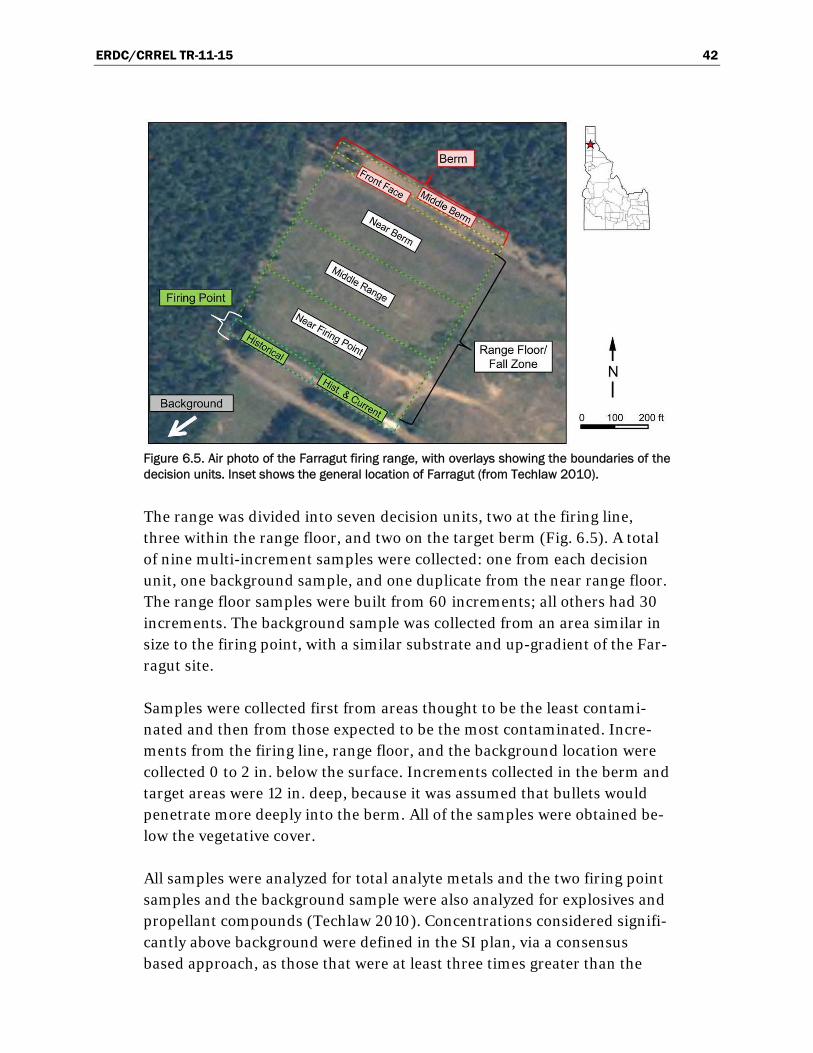
ERDC/CRREL TR-11-15 42
Figure 6.5. Air photo of the Farragut firing range, with overlays showing the boundaries of the decision units. Inset shows the general location of Farragut (from Techlaw 2010).
The range was divided into seven decision units, two at the firing line, three within the range floor, and two on the target berm (Fig. 6.5). A total of nine multi-increment samples were collected: one from each decision unit, one background sample, and one duplicate from the near range floor. The range floor samples were built from 60 increments; all others had 30 increments. The background sample was collected from an area similar in size to the firing point, with a similar substrate and up-gradient of the Far-ragut site.
Samples were collected first from areas thought to be the least contami-nated and then from those expected to be the most contaminated. Incre-ments from the firing line, range floor, and the background location were collected 0 to 2 in. below the surface. Increments collected in the berm and target areas were 12 in. deep, because it was assumed that bullets would penetrate more deeply into the berm. All of the samples were obtained be-low the vegetative cover.
All samples were analyzed for total analyte metals and the two firing point samples and the background sample were also analyzed for explosives and propellant compounds (Techlaw 2010). Concentrations considered signifi-cantly above background were defined in the SI plan, via a consensus based approach, as those that were at least three times greater than the
ERDC/CRREL TR-11-15 43
background concentration when the background concentration equaled or exceeded the detection limit.
Analyses of the background sample detected all 13 analyte metals but no energetic compounds (Table 6.2). The range samples had elevated concen-trations of lead, copper, and antimony, with the highest concentrations in the berm soils and decreasing concentrations towards the firing point. The berm face was also found to have elevated cadmium; arsenic was found at the active firing point, on the range floor, and in the berm face. Of the suite of targeted energetics compounds (17 analytes in Method 8330B), only ni-troglycerin and 2,4-DNT were detected. These two compounds are used in propellants and were found only at the firing points.
TechLaw collected a second multi-increment sample from the range floor nearest the firing points to estimate the overall error from collecting, pro-cessing, subsampling, and analyzing these samples. Comparison of the concentrations obtained from these two multi-increment samples show excellent agreement, indicating that multi-increment samples worked well for estimating the concentrations of metals in these soils.
Lastly, TechLaw estimated both the carryover from one sample to the next and the metals introduced by the grinding process when using metallic grinding equipment. Ottawa Sand was ground in the same equipment used to pulverize the range samples. Table 6.3 shows the elemental concentra-tion of Ottawa sand compared to Ottawa sand ground after a highly con-taminated sample and after a background sample.
Also listed is the metal composition of the metal grinding bowl. The results show increases in the concentrations of chromium, copper, manganese, and lead in the Ottawa sand. For lead, grinding introduced approximately 4.7 mg/kg into the sand, about one quarter the background level of 20.5 mg/kg, and a value an order of magnitude lower than any of the lead con-centrations in the samples. Although these additions could be significant for trace metal work, they are unlikely to be important for contaminated range soils.
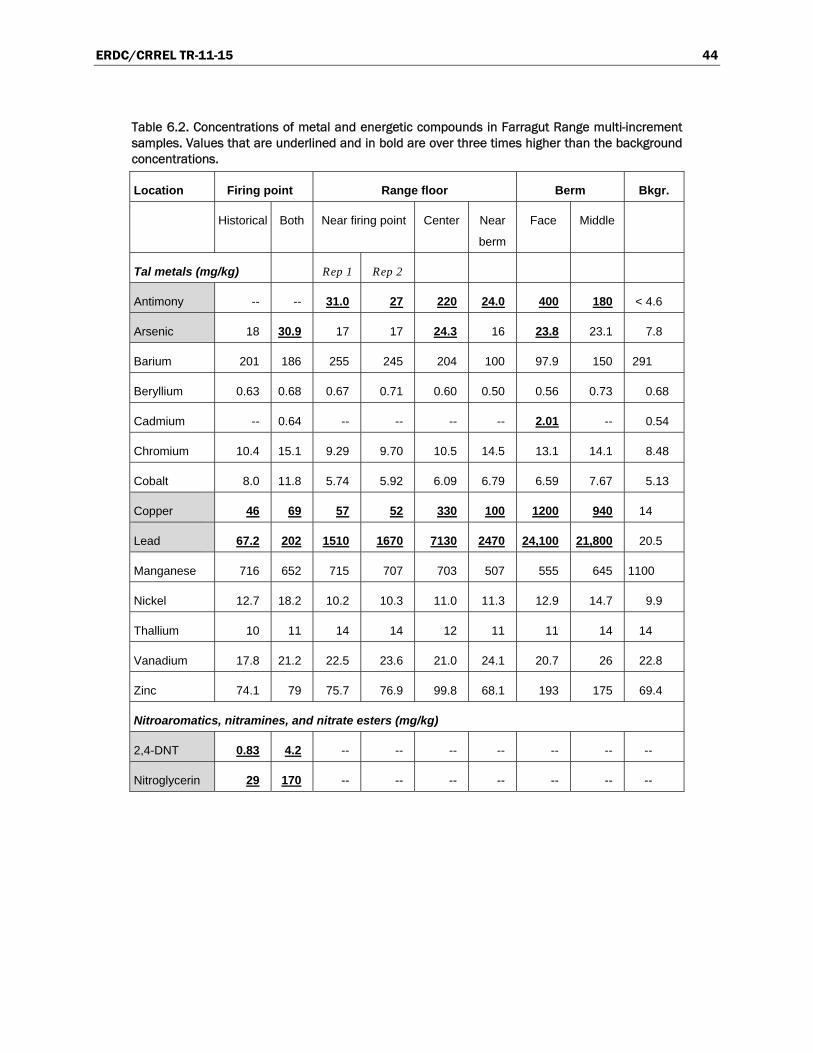
ERDC/CRREL TR-11-15 44
Table 6.2. Concentrations of metal and energetic compounds in Farragut Range multi-increment samples. Values that are underlined and in bold are over three times higher than the background concentrations.
Location Firing point Range floor Berm Bkgr.
Historical Both Near firing point Center Near
berm
Face Middle
Tal metals (mg/kg) Rep 1 Rep 2
Antimony -- -- 31.0 27 220 24.0 400 180 < 4.6
Arsenic 18 30.9 17 17 24.3 16 23.8 23.1 7.8
Barium 201 186 255 245 204 100 97.9 150 291
Beryllium 0.63 0.68 0.67 0.71 0.60 0.50 0.56 0.73 0.68
Cadmium -- 0.64 -- -- -- -- 2.01 -- 0.54
Chromium 10.4 15.1 9.29 9.70 10.5 14.5 13.1 14.1 8.48
Cobalt 8.0 11.8 5.74 5.92 6.09 6.79 6.59 7.67 5.13
Copper 46 69 57 52 330 100 1200 940 14
Lead 67.2 202 1510 1670 7130 2470 24,100 21,800 20.5
Manganese 716 652 715 707 703 507 555 645 1100
Nickel 12.7 18.2 10.2 10.3 11.0 11.3 12.9 14.7 9.9
Thallium 10 11 14 14 12 11 11 14 14
Vanadium 17.8 21.2 22.5 23.6 21.0 24.1 20.7 26 22.8
Zinc 74.1 79 75.7 76.9 99.8 68.1 193 175 69.4
Nitroaromatics, nitramines, and nitrate esters (mg/kg)
2,4-DNT 0.83 4.2 -- -- -- -- -- -- --
Nitroglycerin 29 170 -- -- -- -- -- -- --
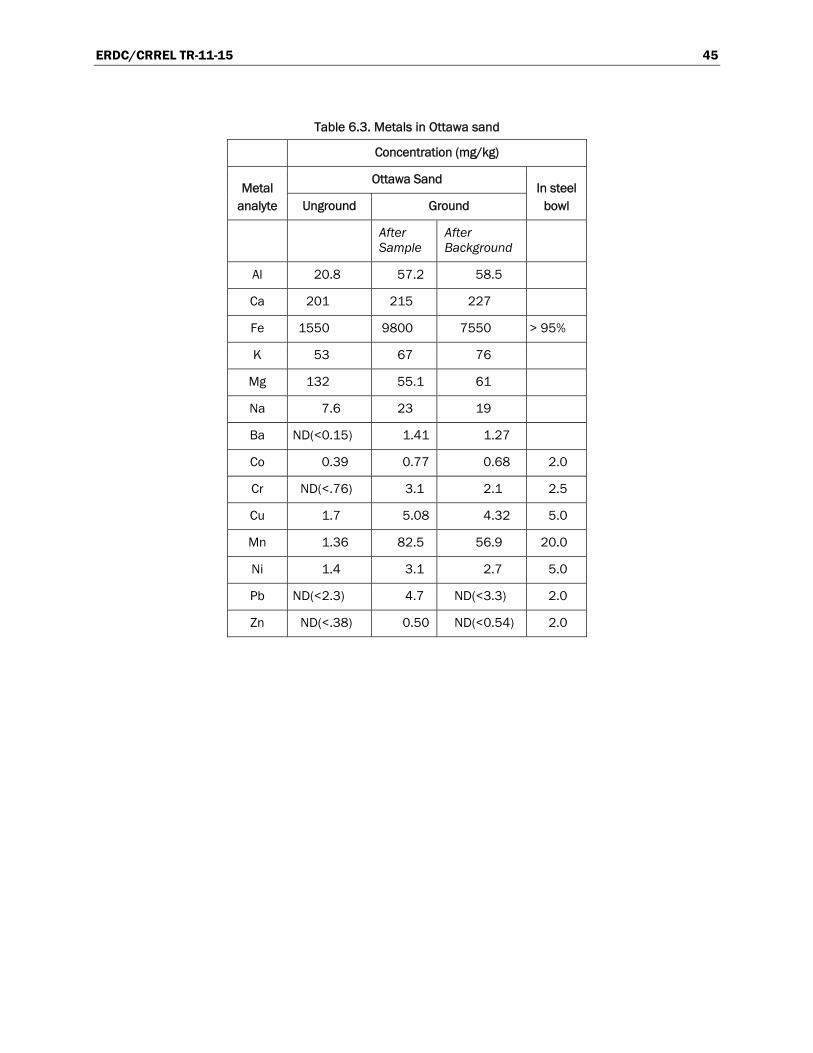
ERDC/CRREL TR-11-15 45
Table 6.3. Metals in Ottawa sand
Concentration (mg/kg)
Metal analyte
Ottawa Sand In steel
bowl Unground Ground
After Sample
After Background
Al 20.8 57.2 58.5
Ca 201 215 227
Fe 1550 9800 7550 > 95%
K 53 67 76
Mg 132 55.1 61
Na 7.6 23 19
Ba ND(<0.15) 1.41 1.27
Co 0.39 0.77 0.68 2.0
Cr ND(<.76) 3.1 2.1 2.5
Cu 1.7 5.08 4.32 5.0
Mn 1.36 82.5 56.9 20.0
Ni 1.4 3.1 2.7 5.0
Pb ND(<2.3) 4.7 ND(<3.3) 2.0
Zn ND(<.38) 0.50 ND(<0.54) 2.0
ERDC/CRREL TR-11-15 46
7 A Practical Guide to Sampling
7.1 Safety considerations
In areas where UXO, discarded military munitions, or materials potential-ly presenting an explosive hazard are present or may exist, field activities are supervised by military EOD personnel or qualified UXO technicians. The on-site UXO technician will conduct a surface access survey and a subsurface survey for anomalies before any type of activity, including foot and vehicular traffic. Procedures for these measures should be described in the contractor’s site-specific work plan and modified in their site-specific plans as required.
Although uncommon, soils containing high levels of energetic compounds, exceeding 100,000 mg/kg (10%), can be present near ruptured munitions or partial detonations (low-order) on ranges, in disposal areas such as OB/OD sites, and near burial pits or at manufacturing facilities. In these areas, pieces of explosives are often seen on the ground. TNT is yellow but turns reddish brown when exposed to sunlight and often has a reddish ha-lo on the soil surrounding the solids. RDX is white to light yellow but does not photo-degrade to form red compounds. Consequently, Comp B is less highly colored than TNT as it only has about 40% TNT in this formulation. Pieces of C4 explosive are found where blow-in-place of UXO or demoli-tion training have occurred. Pieces of C4 are white. Visible or otherwise identifiable pieces of explosive compounds should not be incorporated in-to the soil samples as they might detonate or deflagrate. The EXPRAY Kit (Plexus Scientific, Silver Springs, MD) or EPA Methods 8515 and 8510 (USEPA 1996c, 2000) can be used to screen suspected explosive materials or high concentration soils before sampling and shipping soil samples off site (Appendix D).
7.2 Sampling tools
An unbiased sampling scheme must be developed and carefully followed to uniformly sample the volume of soil within the boundaries of the decision unit. The fundamental requirements for increment collection are:
• An unbiased pattern throughout the entire decision unit. • Complete and uniform sampling across the specified depth interval.
ERDC/CRREL TR-11-15 47
• Uniform size and mass of increments.
A sampling methodology is considered unbiased if all of the particles in the decision unit have the same probability of being included in the sample (Gy 1998). The desired sample is one that is representative of the popula-tion in terms of particle type, size, and proportion, and the volume of soil in each increment should be constant.
Coring devices that assure a uniform diameter core through the entire sampled interval are preferred for increment collection. Most devices such as a garden trowel or hand auger do not control the amount of material per increment or ensure representative proportions of material from throughout a specific depth interval. These devices are likely to introduce bias into the sampling, particularly when more than one sampler is used. Although their use may be unavoidable for coarse, gravelly soils, such tools are not recommended (Pitard 1993).
A variety of hand-operated coring devices designed for surface sampling (e.g., less than 6-in. depth) are widely available from a various vendors. A “pogo-stick” coring device designed by CRREL has a choice of core diame-ters (Fig. 7.1). This type of sampler is available by contacting EnviroStat, Inc. (www.envirostat.org). Where suitable cohesive soils are present, a coring de-vice makes it easier and faster to collect uniform, representative incre-ments from a consistent depth interval. For highly compacted or cemented soils, split barrel samplers with a drive shoe can be driven manually using a slide hammer or used with a direct push drill rig. They may work well for deeper samples. Graduated plunger devices or coring devices such as an Encore sampler will provide a consistent volume for obtaining increments from conventional deeper cores (e.g., split barrel, Shelby tube, etc.). Adjust the diameter of the cores to obtain a total dry weight (without moisture) sample mass of 1 to 2 kg for the given number of increments. In the case of the CRREL corer, the tip is made of stainless steel. Although stainless steel does not react with most analytes, it is not hard and will deform when you are sampling coarse soils or encountering rocks. Keep the tip of the sam-pling tool sharp.
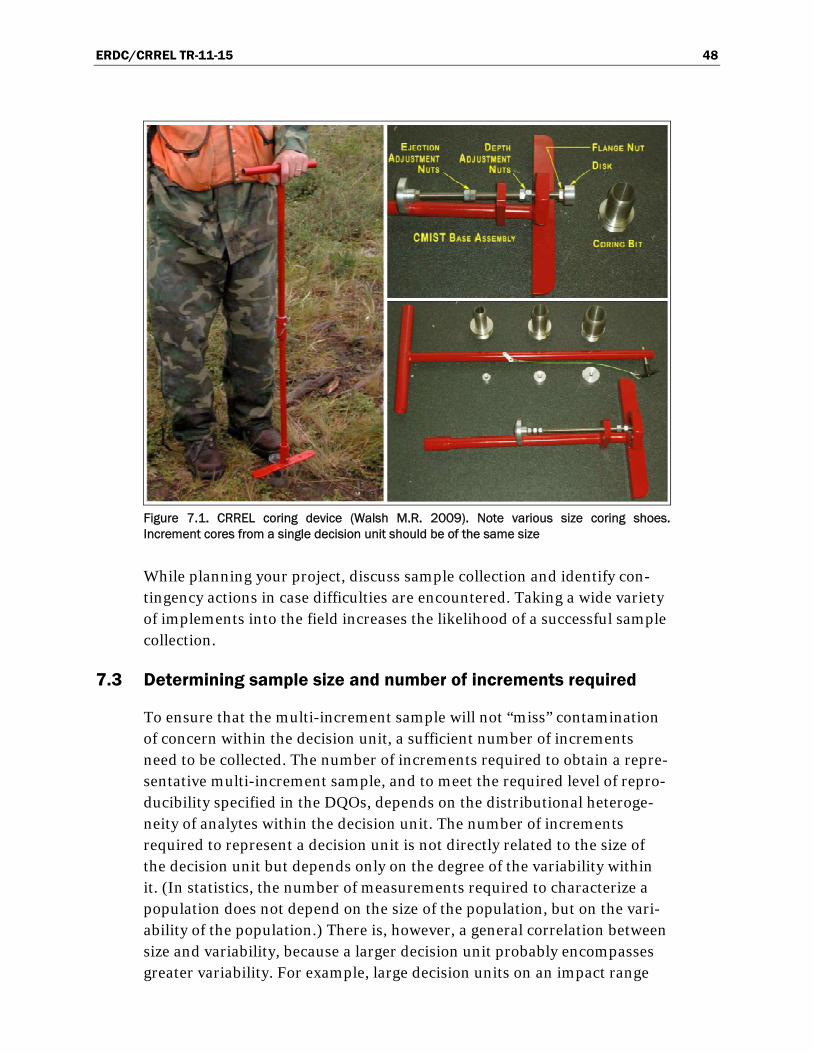
ERDC/CRREL TR-11-15 48
Figure 7.1. CRREL coring device (Walsh M.R. 2009). Note various size coring shoes. Increment cores from a single decision unit should be of the same size
While planning your project, discuss sample collection and identify con-tingency actions in case difficulties are encountered. Taking a wide variety of implements into the field increases the likelihood of a successful sample collection.
7.3 Determining sample size and number of increments required
To ensure that the multi-increment sample will not “miss” contamination of concern within the decision unit, a sufficient number of increments need to be collected. The number of increments required to obtain a repre-sentative multi-increment sample, and to meet the required level of repro-ducibility specified in the DQOs, depends on the distributional heteroge-neity of analytes within the decision unit. The number of increments required to represent a decision unit is not directly related to the size of the decision unit but depends only on the degree of the variability within it. (In statistics, the number of measurements required to characterize a population does not depend on the size of the population, but on the vari-ability of the population.) There is, however, a general correlation between size and variability, because a larger decision unit probably encompasses greater variability. For example, large decision units on an impact range
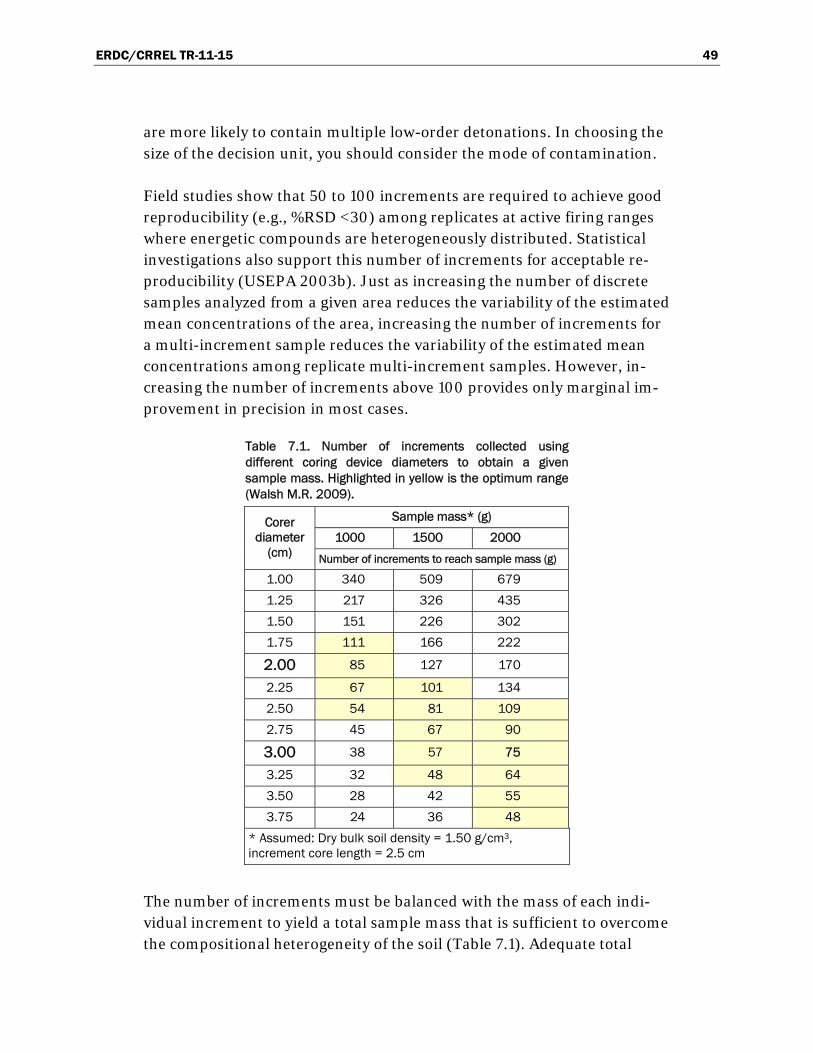
ERDC/CRREL TR-11-15 49
are more likely to contain multiple low-order detonations. In choosing the size of the decision unit, you should consider the mode of contamination.
Field studies show that 50 to 100 increments are required to achieve good reproducibility (e.g., %RSD <30) among replicates at active firing ranges where energetic compounds are heterogeneously distributed. Statistical investigations also support this number of increments for acceptable re-producibility (USEPA 2003b). Just as increasing the number of discrete samples analyzed from a given area reduces the variability of the estimated mean concentrations of the area, increasing the number of increments for a multi-increment sample reduces the variability of the estimated mean concentrations among replicate multi-increment samples. However, in-creasing the number of increments above 100 provides only marginal im-provement in precision in most cases.
Table 7.1. Number of increments collected using different coring device diameters to obtain a given sample mass. Highlighted in yellow is the optimum range (Walsh M.R. 2009).
Corer diameter
(cm)
Sample mass* (g)
1000 1500 2000
Number of increments to reach sample mass (g)
1.00 340 509 679
1.25 217 326 435
1.50 151 226 302
1.75 111 166 222
2.00 85 127 170
2.25 67 101 134
2.50 54 81 109
2.75 45 67 90
3.00 38 57 75
3.25 32 48 64
3.50 28 42 55
3.75 24 36 48
* Assumed: Dry bulk soil density = 1.50 g/cm3, increment core length = 2.5 cm
The number of increments must be balanced with the mass of each indi-vidual increment to yield a total sample mass that is sufficient to overcome the compositional heterogeneity of the soil (Table 7.1). Adequate total
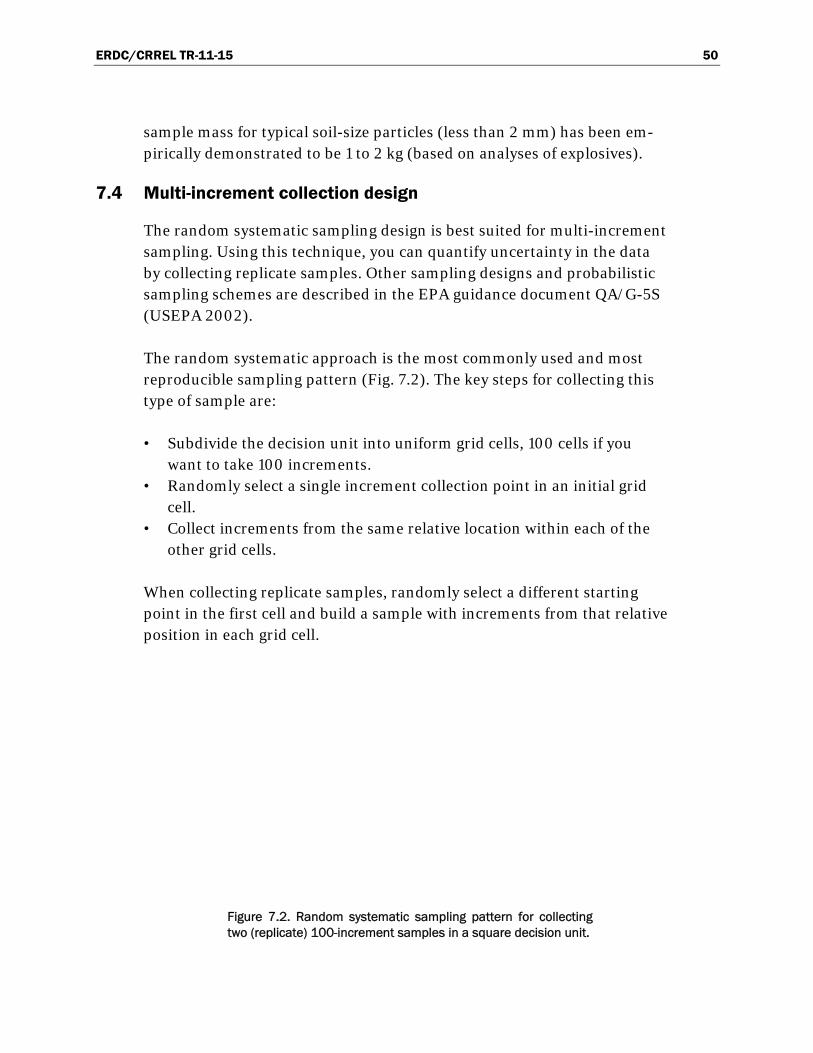
ERDC/CRREL TR-11-15 50
sample mass for typical soil-size particles (less than 2 mm) has been em-pirically demonstrated to be 1 to 2 kg (based on analyses of explosives).
7.4 Multi-increment collection design
The random systematic sampling design is best suited for multi-increment sampling. Using this technique, you can quantify uncertainty in the data by collecting replicate samples. Other sampling designs and probabilistic sampling schemes are described in the EPA guidance document QA/G-5S (USEPA 2002).
The random systematic approach is the most commonly used and most reproducible sampling pattern (Fig. 7.2). The key steps for collecting this type of sample are:
• Subdivide the decision unit into uniform grid cells, 100 cells if you want to take 100 increments.
• Randomly select a single increment collection point in an initial grid cell.
• Collect increments from the same relative location within each of the other grid cells.
When collecting replicate samples, randomly select a different starting point in the first cell and build a sample with increments from that relative position in each grid cell.
Figure 7.2. Random systematic sampling pattern for collecting two (replicate) 100-increment samples in a square decision unit.
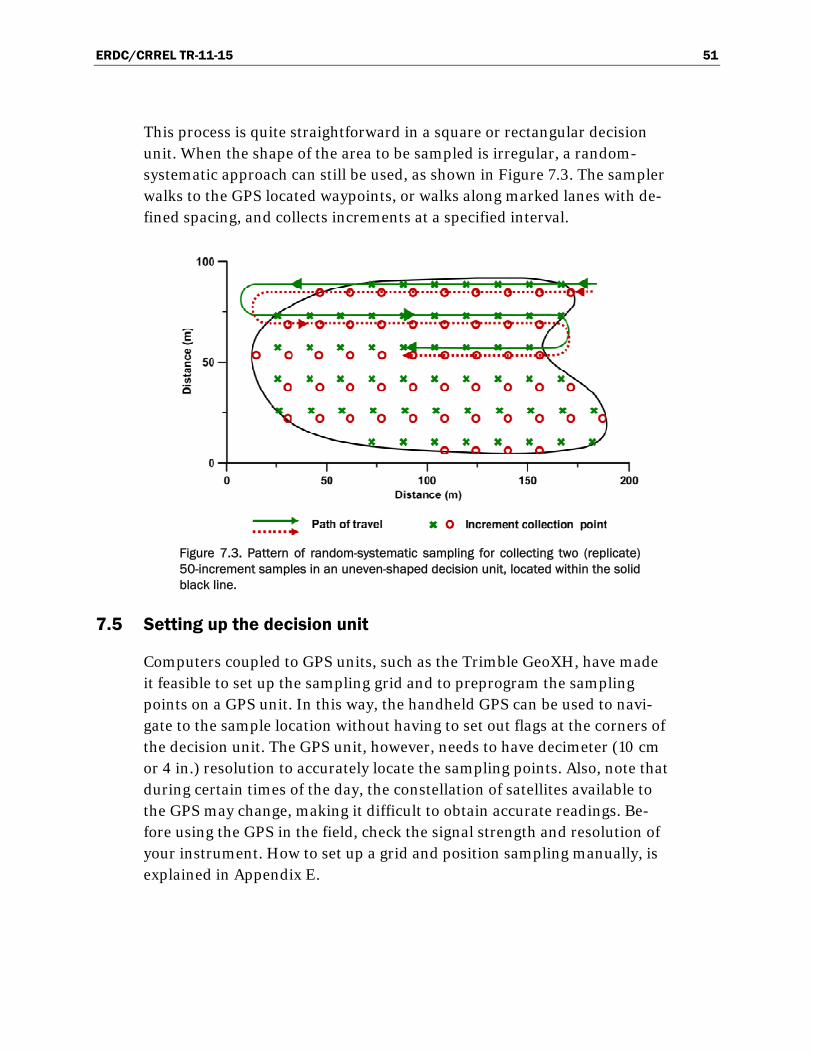
ERDC/CRREL TR-11-15 51
This process is quite straightforward in a square or rectangular decision unit. When the shape of the area to be sampled is irregular, a random-systematic approach can still be used, as shown in Figure 7.3. The sampler walks to the GPS located waypoints, or walks along marked lanes with de-fined spacing, and collects increments at a specified interval.
Figure 7.3. Pattern of random-systematic sampling for collecting two (replicate) 50-increment samples in an uneven-shaped decision unit, located within the solid black line.
7.5 Setting up the decision unit
Computers coupled to GPS units, such as the Trimble GeoXH, have made it feasible to set up the sampling grid and to preprogram the sampling points on a GPS unit. In this way, the handheld GPS can be used to navi-gate to the sample location without having to set out flags at the corners of the decision unit. The GPS unit, however, needs to have decimeter (10 cm or 4 in.) resolution to accurately locate the sampling points. Also, note that during certain times of the day, the constellation of satellites available to the GPS may change, making it difficult to obtain accurate readings. Be-fore using the GPS in the field, check the signal strength and resolution of your instrument. How to set up a grid and position sampling manually, is explained in Appendix E.
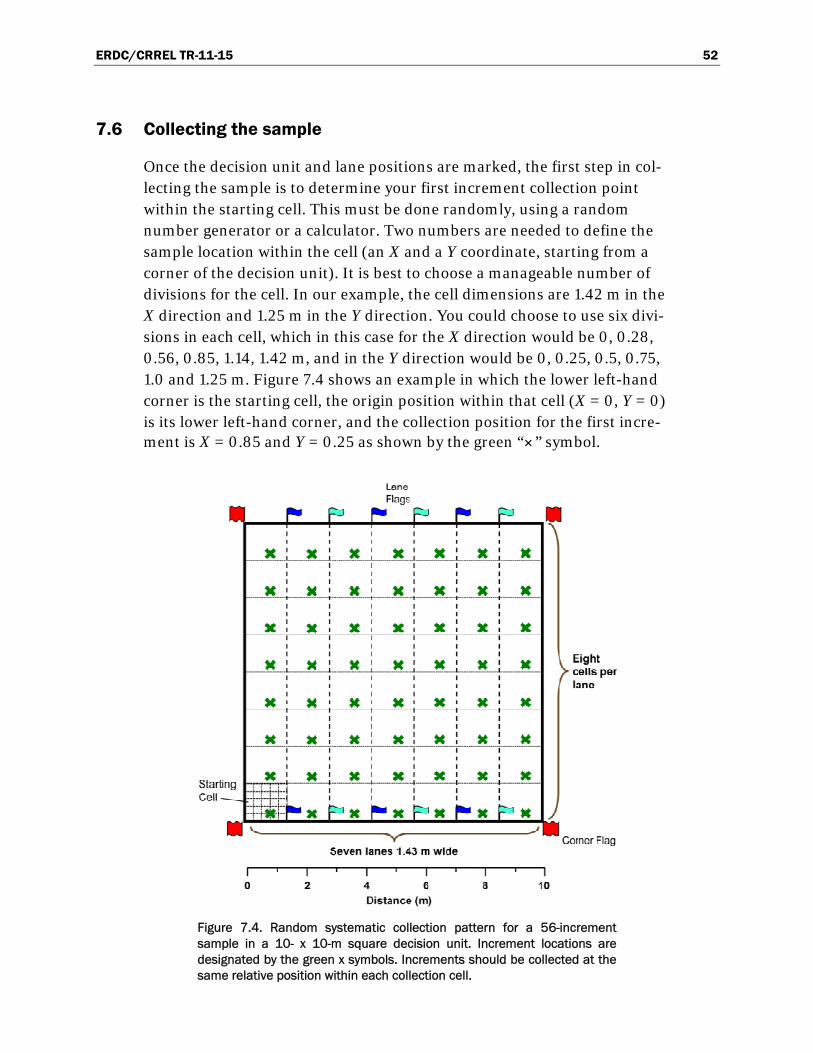
ERDC/CRREL TR-11-15 52
7.6 Collecting the sample
Once the decision unit and lane positions are marked, the first step in col-lecting the sample is to determine your first increment collection point within the starting cell. This must be done randomly, using a random number generator or a calculator. Two numbers are needed to define the sample location within the cell (an X and a Y coordinate, starting from a corner of the decision unit). It is best to choose a manageable number of divisions for the cell. In our example, the cell dimensions are 1.42 m in the X direction and 1.25 m in the Y direction. You could choose to use six divi-sions in each cell, which in this case for the X direction would be 0, 0.28, 0.56, 0.85, 1.14, 1.42 m, and in the Y direction would be 0, 0.25, 0.5, 0.75, 1.0 and 1.25 m. Figure 7.4 shows an example in which the lower left-hand corner is the starting cell, the origin position within that cell (X = 0, Y = 0) is its lower left-hand corner, and the collection position for the first incre-ment is X = 0.85 and Y = 0.25 as shown by the green “×” symbol.
Figure 7.4. Random systematic collection pattern for a 56-increment sample in a 10- x 10-m square decision unit. Increment locations are designated by the green x symbols. Increments should be collected at the same relative position within each collection cell.
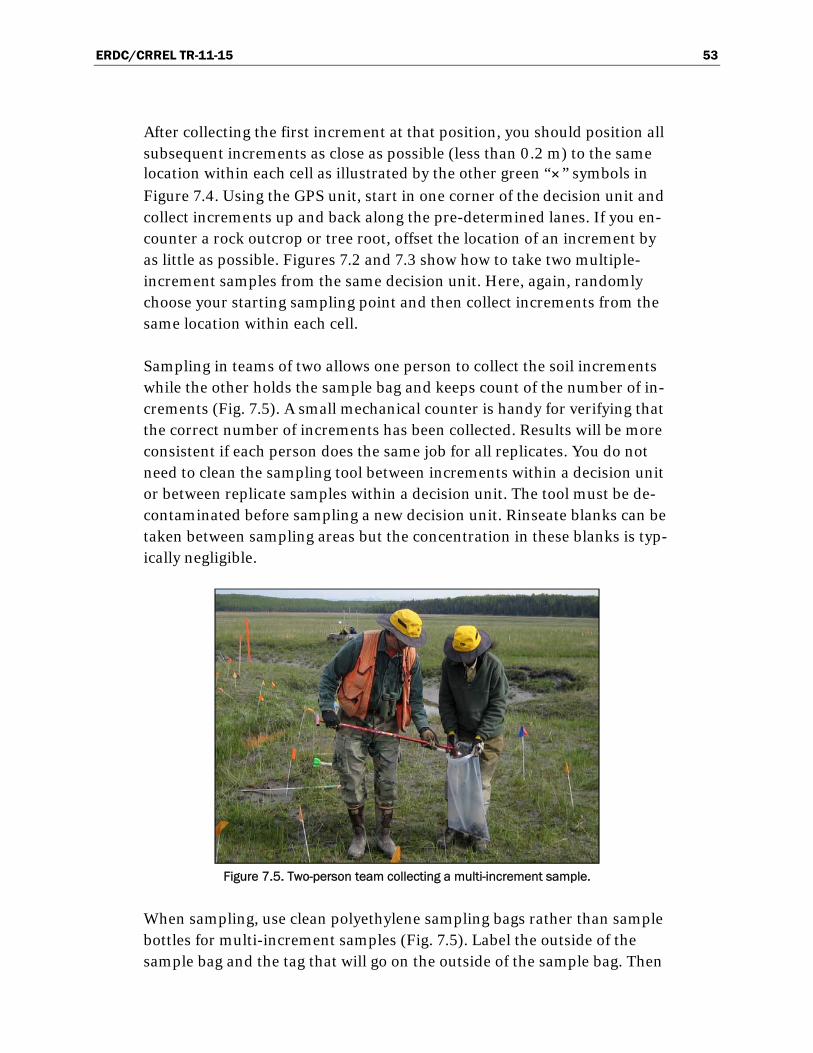
ERDC/CRREL TR-11-15 53
After collecting the first increment at that position, you should position all subsequent increments as close as possible (less than 0.2 m) to the same location within each cell as illustrated by the other green “×” symbols in
Figure 7.4. Using the GPS unit, start in one corner of the decision unit and collect increments up and back along the pre-determined lanes. If you en-counter a rock outcrop or tree root, offset the location of an increment by as little as possible. Figures 7.2 and 7.3 show how to take two multiple-increment samples from the same decision unit. Here, again, randomly choose your starting sampling point and then collect increments from the same location within each cell.
Sampling in teams of two allows one person to collect the soil increments while the other holds the sample bag and keeps count of the number of in-crements (Fig. 7.5). A small mechanical counter is handy for verifying that the correct number of increments has been collected. Results will be more consistent if each person does the same job for all replicates. You do not need to clean the sampling tool between increments within a decision unit or between replicate samples within a decision unit. The tool must be de-contaminated before sampling a new decision unit. Rinseate blanks can be taken between sampling areas but the concentration in these blanks is typ-ically negligible.
Figure 7.5. Two-person team collecting a multi-increment sample.
When sampling, use clean polyethylene sampling bags rather than sample bottles for multi-increment samples (Fig. 7.5). Label the outside of the sample bag and the tag that will go on the outside of the sample bag. Then
ERDC/CRREL TR-11-15 54
record the sample information (such as date, site, decision unit, number of increments, increment diameter and depth, replicate number, and name of sampler) in a logbook. Decide upon and document a labeling and number-ing scheme before going to the field. Double bag the sample after collect-ing to reduce cross-contamination during shipping and storage. Cable ties are excellent for sealing the bag and attaching the identification tag. Pho-tos are extremely helpful and provide visual documentation. A list of sam-pling supplies is in Appendix B.
Note that once the samples are collected in the field, it is tempting to split them and only send a small portion of each sample to the laboratory. DO NOT split the sample. Hewitt et al. (2009) studied the magnitude of field splitting error and found it to range from 4.7 to 120%, with a median value of 43.1%. Ship the entire 1- to 2-kg sample to the laboratory for processing and analysis. After laboratory processing, samples may be split using mul-ti-increment sampling techniques.
7.7 Additional considerations for irregularly shaped areas
To determine an appropriate spacing for collecting a sample from an une-venly shaped decision unit using a random systematic pattern (e.g., Fig. 7.3), first estimate the area to be sampled. A GIS or air photo may allow you to do this before arriving at the sampling site. If the area is measured on site, use a tape or rangefinder to divide the area into multiple small rec-tangles and triangular shaped units and determine their individual areas, then sum them to determine the total area, A. Next, determine the theoret-ical length, L, that a side would have if the equivalent area were a square by taking the square root of area A:
Then, find the increment spacing, S, using the same logic as presented in Section 7.5.2 for a square decision unit. This is done by dividing your theo-retical “side” length by the square root of the number of increments, N:
The next step would be to establish an appropriate number of lanes trav-ersing the long dimension of the decision unit and collecting increments at the spacing just determined. It is important to keep the increment spacing
AL
NLS
ERDC/CRREL TR-11-15 55
as even as possible throughout the space sampled. The exact number of increments is not as critical as obtaining the minimum number deter-mined by the DQOs. The method described above can also be used to de-termine sample spacing in rectangular shaped decision units.
7.8 Collecting samples around ruptured rounds
Because a partially detonated bomb, a dumpsite, a ruptured munition, or other ordnance item will have contaminant concentrations significantly higher than the other areas in a site, they should be sampled as separate decision units. The decision unit should encompass the area of any visible residue chunks and any surface discolorations. EOD personnel or UXO technicians should remove any chunk explosives (these should be weighed separately) so they are not inadvertently incorporated into the sample. To prevent cross contamination, samples collected where chunk residues were present should be double bagged and segregated from other samples during transportation, storage, and laboratory processing (USEPA 2006b, page A-13).
When ordnance disposal (blow-in-place) coincides with site characteriza-tion, pre- and post-detonation multi-increment samples can help establish if residual MC was there already or came from the blow-in-place opera-tion, or both (Pennington et al. 2008; USACE 2007). This is more likely at the RI stage during intrusive operations, and during removal and remedial actions.
7.9 How to deal with vegetation in a sample
Appendix A of Method 8330B recommends including surface vegetation and plant matter in samples from active ranges. At MMRP sites or other sites where surface vegetation clearly post-dates any contaminant release, vegetation in the sample should be removed during laboratory processing. Note that some types of vegetation, i.e., mosses, can be long-lived. Do not bias your samples trying to avoid vegetation.
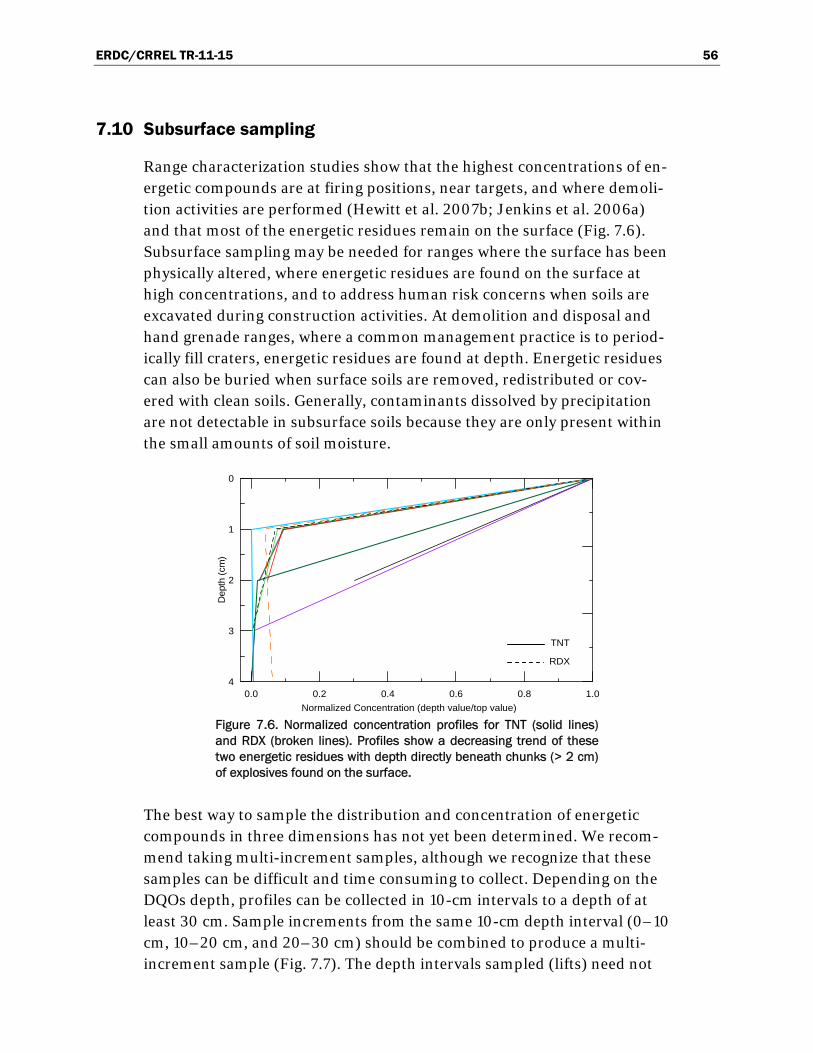
ERDC/CRREL TR-11-15 56
7.10 Subsurface sampling
Range characterization studies show that the highest concentrations of en-ergetic compounds are at firing positions, near targets, and where demoli-tion activities are performed (Hewitt et al. 2007b; Jenkins et al. 2006a) and that most of the energetic residues remain on the surface (Fig. 7.6). Subsurface sampling may be needed for ranges where the surface has been physically altered, where energetic residues are found on the surface at high concentrations, and to address human risk concerns when soils are excavated during construction activities. At demolition and disposal and hand grenade ranges, where a common management practice is to period-ically fill craters, energetic residues are found at depth. Energetic residues can also be buried when surface soils are removed, redistributed or cov-ered with clean soils. Generally, contaminants dissolved by precipitation are not detectable in subsurface soils because they are only present within the small amounts of soil moisture.
Figure 7.6. Normalized concentration profiles for TNT (solid lines) and RDX (broken lines). Profiles show a decreasing trend of these two energetic residues with depth directly beneath chunks (> 2 cm) of explosives found on the surface.
The best way to sample the distribution and concentration of energetic compounds in three dimensions has not yet been determined. We recom-mend taking multi-increment samples, although we recognize that these samples can be difficult and time consuming to collect. Depending on the DQOs depth, profiles can be collected in 10-cm intervals to a depth of at least 30 cm. Sample increments from the same 10-cm depth interval (0–10 cm, 10–20 cm, and 20–30 cm) should be combined to produce a multi-increment sample (Fig. 7.7). The depth intervals sampled (lifts) need not
4
3
2
1
0
Dept
h (
cm)
0.0 0.2 0.4 0.6 0.8 1.0
Normalized Concentration (depth value/top value)
TNT
RDX
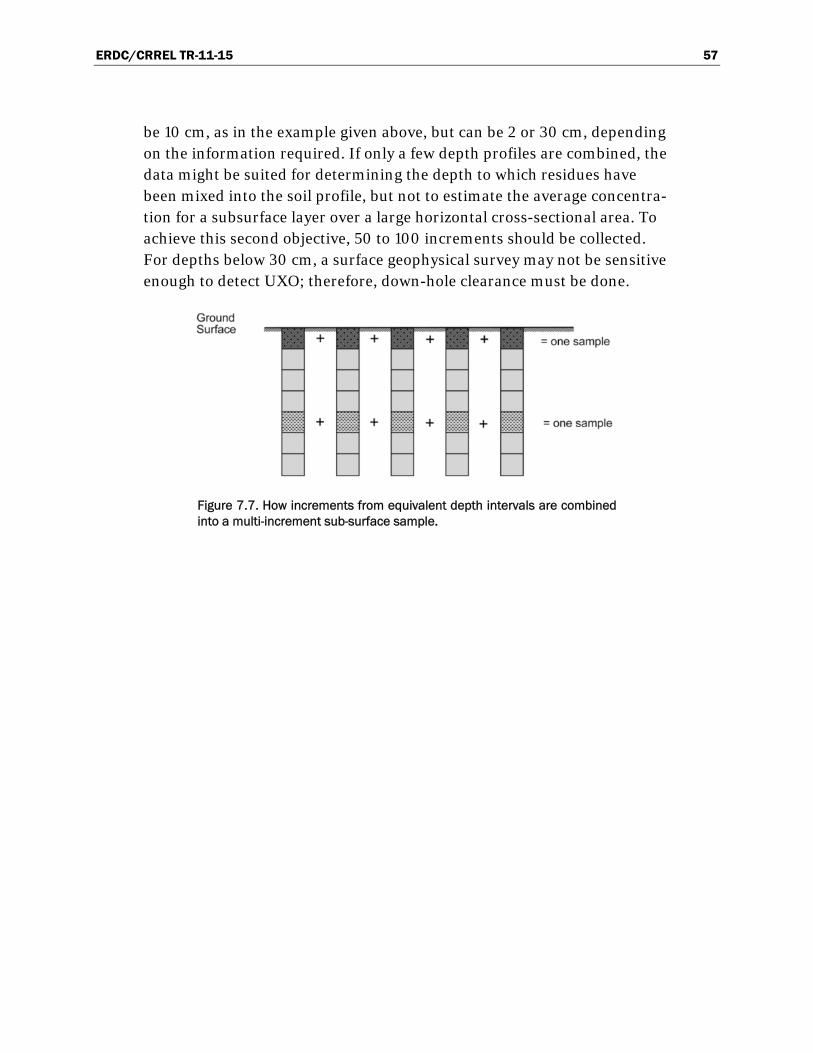
ERDC/CRREL TR-11-15 57
be 10 cm, as in the example given above, but can be 2 or 30 cm, depending on the information required. If only a few depth profiles are combined, the data might be suited for determining the depth to which residues have been mixed into the soil profile, but not to estimate the average concentra-tion for a subsurface layer over a large horizontal cross-sectional area. To achieve this second objective, 50 to 100 increments should be collected. For depths below 30 cm, a surface geophysical survey may not be sensitive enough to detect UXO; therefore, down-hole clearance must be done.
Figure 7.7. How increments from equivalent depth intervals are combined into a multi-increment sub-surface sample.
ERDC/CRREL TR-11-15 58
8 How to Process Soil Samples
8.1 General discussion of why samples need to be processed
In most cases, the multi-increment sample will contain very few explosive, propellant, or metal particles compared to the total number of particles in the soil matrix. For example, if the multi-increment sample contains one energetic particle in each 100 g of soil, a typical analytical subsample (a few grams) will not represent the proportion of energetic particles in the field sample. Most of the subsamples will have very low concentrations, but some subsamples will have much, much higher concentrations than the multi-increment sample. Fortunately, the physical properties of most energetic compounds and metals (i.e., low vapor pressure) permit grinding the soil sample so that a small subsample (10 g) can represent the much larger multi-increment sample (more than 1000 g).
The processing involves the following steps: air-drying, sieving, and ma-chine grinding until all the particles in the multi-increment sample are very fine (less than 75 µm). Grinding fractures the energetic and metal particles into many smaller particles, enabling a small (e.g., 10-g) soil sub-sample to adequately represent the entire multi-increment sample. The goal of this process is to adequately represent the several tons of soil in the decision unit by the few grams of soil that are extracted (energetics) or di-gested (metals) and analyzed by chromatography or Inductively Coupled Plasma Spectrometry (ICP) (Fig. 8.1). Our goal is to use the smallest sub-sample from the multi-increment sample that will contain all the constitu-ents in the same proportion as the soil in the decision unit. A small sub-sample also requires less volume of solvent or acid and minimizes the cost of buying and disposing of these chemicals.
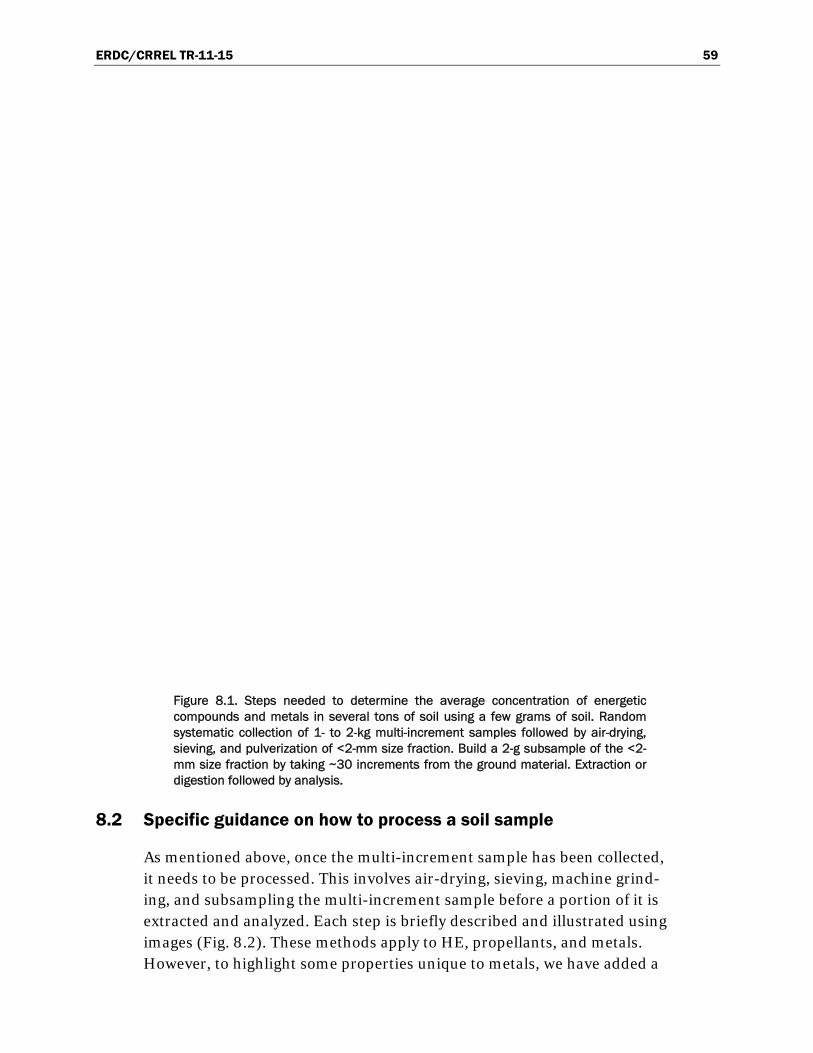
ERDC/CRREL TR-11-15 59
Figure 8.1. Steps needed to determine the average concentration of energetic compounds and metals in several tons of soil using a few grams of soil. Random systematic collection of 1- to 2-kg multi-increment samples followed by air-drying, sieving, and pulverization of <2-mm size fraction. Build a 2-g subsample of the <2-mm size fraction by taking ~30 increments from the ground material. Extraction or digestion followed by analysis.
8.2 Specific guidance on how to process a soil sample
As mentioned above, once the multi-increment sample has been collected, it needs to be processed. This involves air-drying, sieving, machine grind-ing, and subsampling the multi-increment sample before a portion of it is extracted and analyzed. Each step is briefly described and illustrated using images (Fig. 8.2). These methods apply to HE, propellants, and metals. However, to highlight some properties unique to metals, we have added a
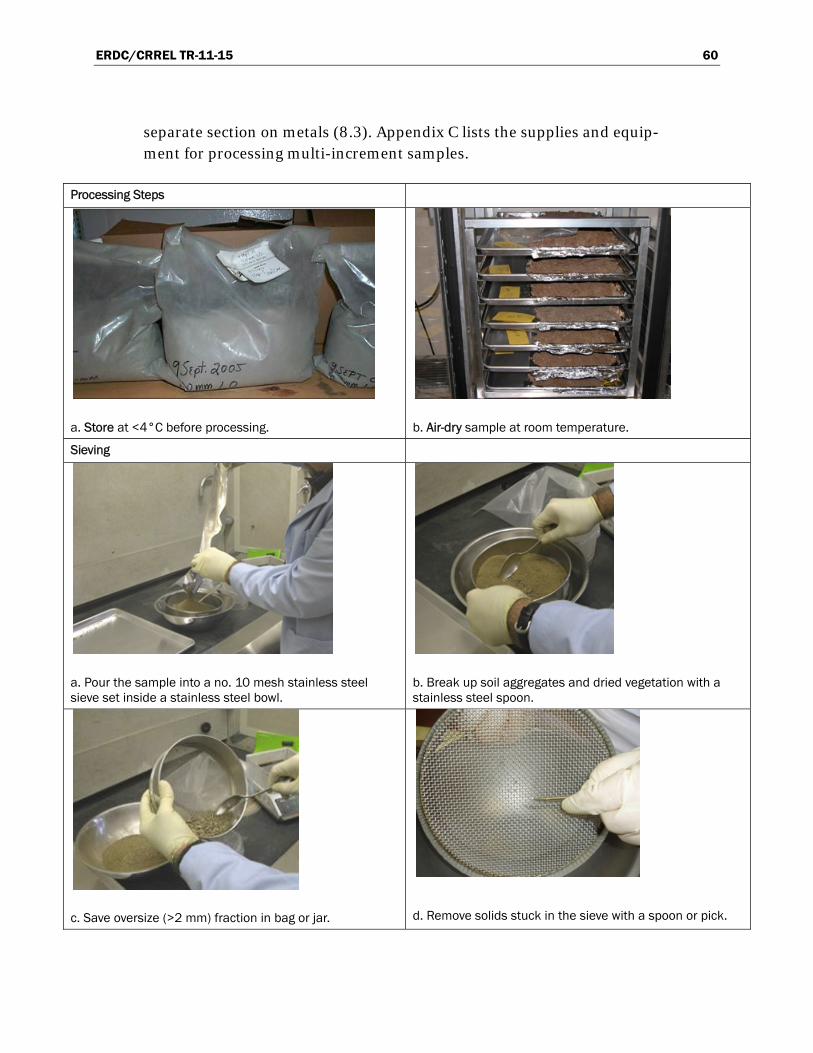
ERDC/CRREL TR-11-15 60
separate section on metals (8.3). Appendix C lists the supplies and equip-ment for processing multi-increment samples.
Processing Steps
a. Store at <4°C before processing.
b. Air-dry sample at room temperature.
Sieving
a. Pour the sample into a no. 10 mesh stainless steel sieve set inside a stainless steel bowl.
b. Break up soil aggregates and dried vegetation with a stainless steel spoon.
c. Save oversize (>2 mm) fraction in bag or jar.
d. Remove solids stuck in the sieve with a spoon or pick.
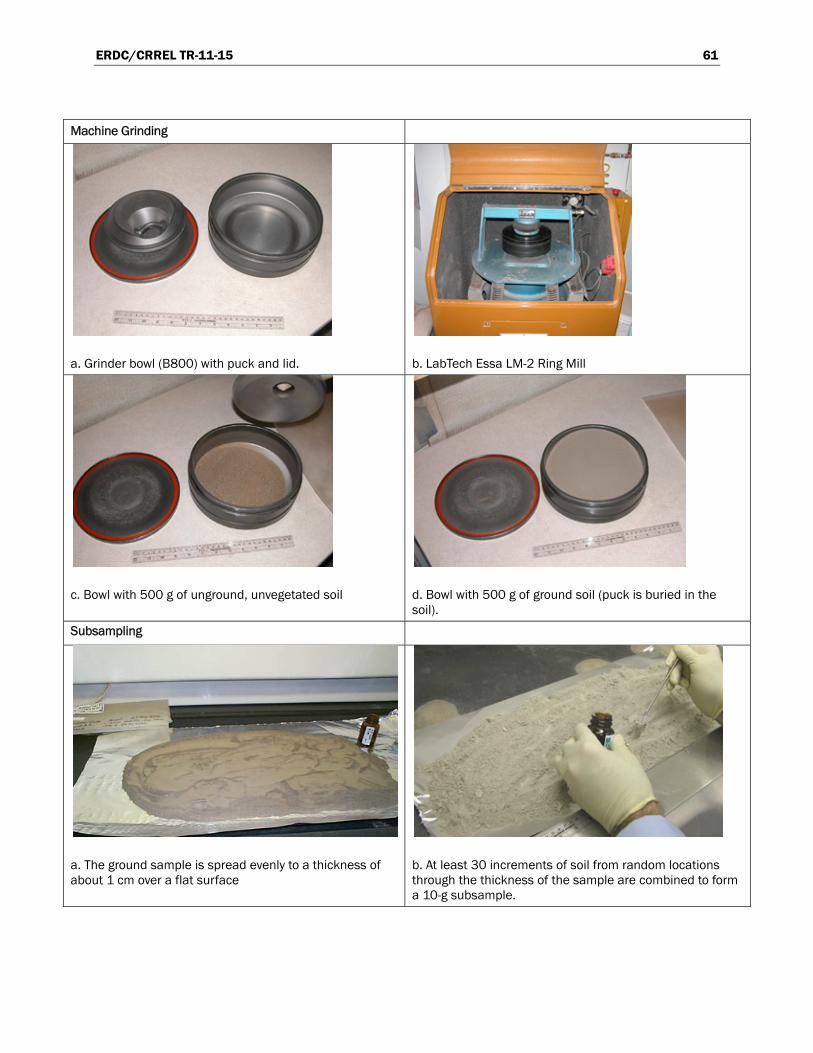
ERDC/CRREL TR-11-15 61
Machine Grinding
a. Grinder bowl (B800) with puck and lid.
b. LabTech Essa LM-2 Ring Mill
c. Bowl with 500 g of unground, unvegetated soil
d. Bowl with 500 g of ground soil (puck is buried in the soil).
Subsampling
a. The ground sample is spread evenly to a thickness of about 1 cm over a flat surface
b. At least 30 increments of soil from random locations through the thickness of the sample are combined to form a 10-g subsample.
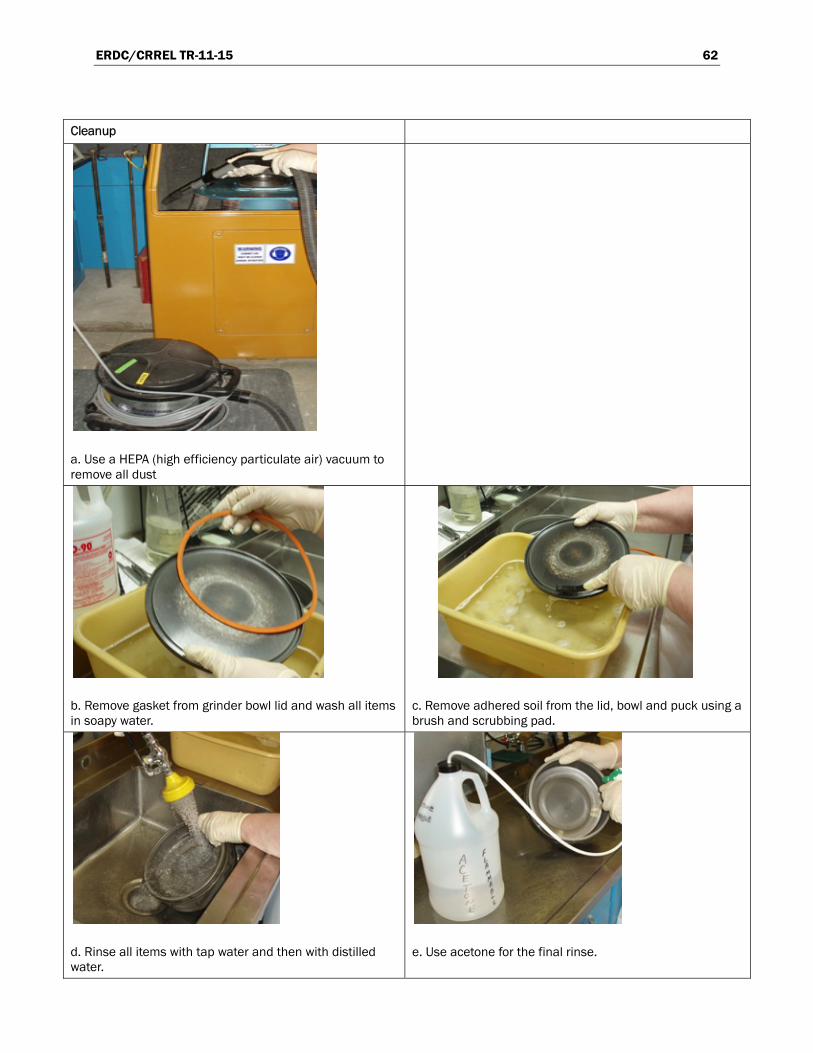
ERDC/CRREL TR-11-15 62
Cleanup
a. Use a HEPA (high efficiency particulate air) vacuum to remove all dust
b. Remove gasket from grinder bowl lid and wash all items in soapy water.
c. Remove adhered soil from the lid, bowl and puck using a brush and scrubbing pad.
d. Rinse all items with tap water and then with distilled water.
e. Use acetone for the final rinse.
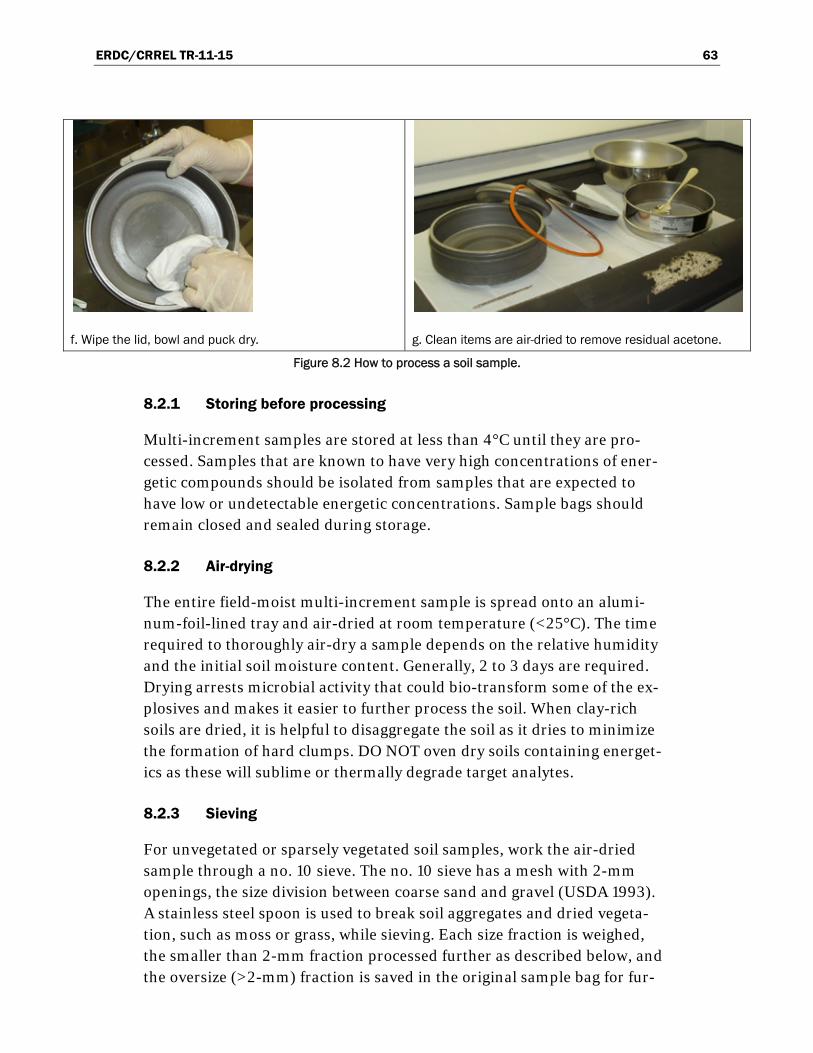
ERDC/CRREL TR-11-15 63
f. Wipe the lid, bowl and puck dry. g. Clean items are air-dried to remove residual acetone.
Figure 8.2 How to process a soil sample.
8.2.1 Storing before processing
Multi-increment samples are stored at less than 4°C until they are pro-cessed. Samples that are known to have very high concentrations of ener-getic compounds should be isolated from samples that are expected to have low or undetectable energetic concentrations. Sample bags should remain closed and sealed during storage.
8.2.2 Air-drying
The entire field-moist multi-increment sample is spread onto an alumi-num-foil-lined tray and air-dried at room temperature (<25°C). The time required to thoroughly air-dry a sample depends on the relative humidity and the initial soil moisture content. Generally, 2 to 3 days are required. Drying arrests microbial activity that could bio-transform some of the ex-plosives and makes it easier to further process the soil. When clay-rich soils are dried, it is helpful to disaggregate the soil as it dries to minimize the formation of hard clumps. DO NOT oven dry soils containing energet-ics as these will sublime or thermally degrade target analytes.
8.2.3 Sieving
For unvegetated or sparsely vegetated soil samples, work the air-dried sample through a no. 10 sieve. The no. 10 sieve has a mesh with 2-mm openings, the size division between coarse sand and gravel (USDA 1993). A stainless steel spoon is used to break soil aggregates and dried vegeta-tion, such as moss or grass, while sieving. Each size fraction is weighed, the smaller than 2-mm fraction processed further as described below, and the oversize (>2-mm) fraction is saved in the original sample bag for fur-
ERDC/CRREL TR-11-15 64
ther study. Sieving should be done in an exhaust hood to control dust. Sieving ensures that HE pieces are smaller than the critical diameter need-ed for detonation and is, therefore, a safety step in this process. Also note that sieving an unground sample through sieves finer than 2 mm is never appropriate for high explosives or propellants, as much of the mass of the energetic analytes is in particles greater than 0.59 mm (30-mesh sieve) (M.E. Walsh et al. 2007).
8.2.4 Machine grinding
The preferred method of grinding soil samples for energetics and metals uses a ring-mill (also called a puck mill) grinder that works for crystalline explosives, propellants, and metals. The following is a procedure using this type of grinder.
The less than 2-mm fraction is ground in 500-g or smaller portions in a LabTech Essa LM2 (LabTech Essa Pty. Ltd., Bassendean, WA, Australia) ring-mill grinder equipped with 800-cm3 bowls.* Soils from impact areas that contain only high explosive residues (i.e., HMX, RDX, TNT) are ground for 60−90 seconds. Soils from ranges that contain propellant resi-dues (i.e., firing points, disposal areas, rocket impact ranges) are ground for five 60-second periods, with a 5-minute cooling time between each grind. The extra grinding time is needed to pulverize the propellant fibers, because these are mainly composed of nitrocellulose, a wood-like sub-stance, and the cooling times are to avoid overheating and volatilizing the energetics. For metals the 5-minute grind times used for propellants have also been found to be effective.
Grinding reduces the particle size of the coarse soil to the texture of flour (less than 75 μm). The ground multi-increment sample should appear and feel uniform when portions of the ground soil are pinched and rolled be-tween the thumb and index finger. There should be no unground grains or fibers. If needed, the soil should be ground for an additional 60 to 90 se-conds.
The following are tips for effective grinding:
* http://www.essaaustralasia.com/EssaProductsCatalogue.aspx?PG=SP
ERDC/CRREL TR-11-15 65
• The grinding bowl should not be overfilled. The puck needs to move freely in the bowl to pulverize the sample. Conversely, no less than 120 g of soil should be ground to prevent excess wear of the grinding bowl.
• For sparsely or unvegetated soils, no more than 500 g and no less than 200 g of material should be ground in an 800-cm3 bowl. Preferably, the mass of soil in each 800-cm3 bowl should be between 300 and 500 g.
• Samples that have lots of vegetation (highly organic) have low bulk density and 500 g would overfill an 800-cm3 bowl. The grinding bowl should be no more than one-third full.
• If the ground soil adheres to the sides of the grinding bowl (caking), the soil has not been sufficiently air-dried and it will not be uniformly ground. The sample should be air-dried for at least one more day and reground.
• For samples that need to be ground for five 60-second intervals, using multiple grinding bowls will increase efficiency. For example, the un-ground multi-increment sample can be divided among three grinding bowls that are sequentially cycled through the grinder and the sample recombined before subsampling.
8.2.5 Subsampling
The entire ground sample is spread evenly and about 1 cm thick over a sheet of aluminum foil in an exhaust hood. A spatula is used to obtain in-crements of soil through the thickness of the sample. At least 30 incre-ments from random locations are combined to build a 10-g subsample. Add the subsample increments to a glass vial and store the vial in a cool (less than 4°C) location until extracted.
8.2.6 Cleanup
To avoid cross contamination between high and low concentration sam-ples, all surfaces must be thoroughly cleaned between samples. Cleaning procedures are as follows:
• Any dust in the work area is removed using a HEPA (high efficiency particulate air) vacuum cleaner. All work surfaces are wiped with hot water, sprayed or wiped down with acetone, then wiped dry.
• Particles that are trapped in the sieve can be pushed out with the stain-less steel spoon or a small pick.
ERDC/CRREL TR-11-15 66
• The stainless steel bowl, sieve, spoon, grinding bowl, puck, lid, and any other items that come in contact with the sample are washed in a sink filled with hot soapy water. The rubber gasket must be removed from the lid for through cleaning. A scrub pad (3M) is needed to remove all trapped soil particles. All items are rinsed with hot water followed by deionized water and placed on a clean surface in an exhaust hood. Each item is sprayed with acetone in the hood and wiped with clean paper wipes. The rubber gasket in the bowl lid is then replaced.
8.3 Specific sample processing for metals
Depending on how the metal was deposited, it might be quite uniformly distributed (arsenic sprayed as a herbicide) or heterogeneously distributed (metal fragments ranging in size from micrometers to centimeters). De-pending on the DQOs, one might want to measure: 1) the total mass of a metal or group of metals deposited on an area; 2) only that portion of the metal that is in the smaller than 2-mm size fraction; or 3) small particles that might be an inhalation hazard. If the presence or absence of a metal in the soil or an order-of-magnitude estimate of high concentrations is all that is required, analyzing a ground multi-increment sample with an X-Ray Florescence Spectrometer (XRF) may be sufficient. If soil metal con-centrations are needed, then multi-increment soil samples need to be pro-cessed, extracted, and analyzed in the lab.
For estimating the total mass of a metal in a multi-increment sample, one needs the mass of metal in the smaller than 2-mm size fraction, and a good estimate of the metal concentration in the larger than 2-mm size fraction. Copper bullet casing and lead bullet fragments can be found in the over-sized fraction (more than 2 mm) of a multi-increment sample. The mass of these pieces needs to be added to that found in the smaller than 2-mm size fraction. To do this, separate the metal fragments from the oversized frac-tion by hand, mechanically, or by density, check their compositions, and weigh them. This process is often not as dire as it sounds because the met-al fragments are recognizable and can be matched to a specific bullet whose composition is known. Nevertheless, if the total mass of a metal is needed, it is important to weigh the smaller than 2-mm size fraction, as larger fragments are likely to represent most of the metal mass deposited.
To measure the metal concentration in the smaller than 2-mm size frac-tion, two issues need to be considered: does some of the metal remain in the bowl and cause cross contamination and does grinding introduce met-
ERDC/CRREL TR-11-15 67
als of interest into your sample? First, if the MC metals are in elemental form (e.g., lead, copper, tin), they may be malleable and a significant por-tion might smear on the inside of the grinding bowl. In this case clean quartz sand should be ground and analyzed after the metal-containing sample is ground to ensure that any metal smeared onto the grinding sur-face is accounted for (e.g., Table 6.3). Generally, however, the amount of metal present is small relative to the number of soil grains and the metal does not remain in the bowl.
Second, because most commercial crushing or grinding equipment has working surfaces composed of metal alloys containing iron, chromium, tungsten (carbide), etc., they can contribute metal to the sample during processing. This added metal may be important for environmental sam-ples if the metals contained in the grinding equipment are analytes of in-terest (the metal composition of standard steel and chrome grinding bowls used by the Essa ring mill are listed in Appendix C). Either the amount of metal introduced needs to be estimated by grinding and analyzing clean quartz samples (e.g. Table 6.2), or agate or ceramic grinding bowls should be used. Several different pulverization devices use ceramic or agate grind-ing surfaces. These surfaces do not contribute appreciable quantities of heavy metals to the sample. Bico Inc. makes a horizontal and a vertical ce-ramic disk pulverizer. Both systems can grind large samples of 1- to 2-kg mass within a couple of minutes. Cross contamination can be minimized by using compressed air to clean the grinding surfaces and grinding a blank soil between samples. A rinsing step could also be added.
If the end use of the data is to assess risk of inhalation, the amount of met-al contained in larger particles is immaterial compared to the metal con-tained in the fine (less than 0.25 mm) fractions (USEPA 2000, 2003a; ITRC 2008). Using a finer mesh sieve (e.g., 0.25 rather than 2 mm) before subsampling will improve precision and reproducibility and may meet da-ta quality requirements without grinding.
Generally, however, reducing particle size by grinding is just as important for samples being analyzed for metals as it is for those containing explo-sives and propellants. Metal particles must be sufficiently small to ensure that they are uniformly represented in the small mass of the subsamples that will be analyzed. Because the mass of the subsample is small, the size of its constituent particles also must be reduced to control sampling error. If particle size is not reduced, sampling error and variability will increase.
ERDC/CRREL TR-11-15 68
Therefore, the sample needs to be ground before subsampling. For exam-ple, lead in two unground multi-increment samples from small arms firing ranges may have unacceptably large variability (>100% RSD), even after air-drying, sieving through a no. 10 sieve (less than 2 mm), and subsam-pling using a sectorial splitter. The large variability for lead may be at-tributable to particles of lead 1 to 2 mm in diameter being present in only some of the splits (i.e., the compositional heterogeneity has not been ade-quately addressed).
Studies on metal concentrations using multi-increment samples of uncon-taminated natural soils show that grinding greatly improves reproducibil-ity (precision), but imparts a small (usually negligible) increase in median metals concentrations (Felt et al. 2008). Generally, the reduction in total measurement uncertainty (error) compensates for the slight positive bias by improving the overall accuracy of the measurements.
Mechanical crushing and grinding procedures have long been used in tra-ditional geochemical studies and by the mining industry to obtain metal concentrations. These techniques can be readily adapted to MC metals. Laboratory protocols for processing multi-increment samples for metals are the subject of current research. Nonetheless, bearing in mind the po-tential effects discussed above, multi-increment samples can be collected and analyzed for metals.
8.4 Processing for PAHs, perchlorate, WP
There are no published procedures specific to the laboratory processing of multi-increment samples for Polycyclic Aromatic Hydrocarbons (PAHs). Collection and laboratory processing of samples per Method 8330B is rec-ommended. Methods SW3540 and SW3550 require extraction of 10 and 30 g of soil, respectively, so increasing the analytical method aliquot size is unnecessary.
There are no published procedures specifically for laboratory processing of multi-increment samples for perchlorate. Collecting and laboratory pro-cessing of samples per Method 8330B is recommended and Methods 6850 and 6860 for analyses. However, instead of extracting 1 g of soil in 10 mL of reagent water, we recommend that a minimum of 10 g be used as is done for all propellants and explosives in Method 8330B. Multi-increment sampling and sample processing has been conducted successfully at Hill
ERDC/CRREL TR-11-15 69
AFB to obtain reproducible ammonium perchlorate concentrations for de-cision units at a large missile demolition area (Neiman 2007).
Walsh M.E et al. (1997) used multi-increment samples to find areas within a large salt marsh that contained particles of WP large enough to poison and kill waterfowl. WP, like many of the contaminants discussed, is depos-ited as discrete particles and shows extreme heterogeneity in the sedi-ments. Unlike energetic compounds and metals, WP will sublime and oxi-dize if exposed to air. Therefore, soil and sediment samples cannot be air-dried and ground without major loss of WP. To estimate WP concentra-tions without drying and grinding, these researchers mixed the multi-increment samples with water and analyzed the water using Method SW7580. They found that the concentration in the water is correlated with the WP mass and that a sample whose water had high WP levels invariably contained WP particles. Samples with high WP concentrations helped lo-cate areas that contained WP particles and by sieving the samples they measured the size of the WP particles available to waterfowl. To determine the concentration of the sample, the entire sample would have to be ex-tracted, as it cannot be representatively subsampled.
ERDC/CRREL TR-11-15 70
9 Quality Assurance/Quality Control
The reproducibility of multi-increment field samples should be subject to quality control (QC) requirements similar to those traditionally required to demonstrate laboratory analytical reproducibility. Field replicates provide a measure of the variability or “total error” of the data set (field sampling error + laboratory sample processing error + subsampling error + labora-tory analytical error). Note that field replicates for multi-increment sam-ples are not field splits; they are independently collected, multi-increment samples from the same decision unit. Similar concentrations among multi-increment samples taken from the same decision unit indicate that data are scientifically defensible and representative (USEPA 2006b, Method 8330B), and the only means by which confidence can be quantified.
If evidence for representativeness is not presented, then the data cannot be characterized as effective for project decision making. (Crumbling 2001, 2002)
Required levels of precision or confidence for the mean concentrations and other statistical parameters should be identified in the systematic planning process. The degree of precision needed to support the decision, expressed as %RSD of samples from a decision unit, should be specified as part of the DQOs (see Section 5.3). The sampling and analysis plan should provide for enough replicate QC sampling to obtain the required precision in all facets of sampling and analysis.
As a general rule, we recommend collecting triplicate multi-increment samples from 10% of the decision units, including at least one triplicate of each type of matrix for metals (i.e., soil type). For investigations where high precision is not required (e.g., simply demonstrating presence of a contaminant for an SI), a single multi-increment sample for most decision units may be sufficient, with QC triplicates taken from only one or two de-cision units at the site to assess the adequacy of the sampling design. Where more precision is necessary, for example where values are antici-pated to be close to an action level in an RI, triplicate samples should be a default minimum and, if needed to define the uncertainty, up to 10 or more multi-increment samples should be collected from a decision unit.
ERDC/CRREL TR-11-15 71
Background samples used to determine concentrations of analytes unre-lated to the site activities should be sampled at least in triplicate.
Some portion of the multi-increment samples should be subsampled and analyzed in triplicate to demonstrate that laboratory subsampling proce-dures are adequate to control both compositional and distributional heter-ogeneity. The %RSD for laboratory triplicates typically should be less than 15%. However, as with the suggested %RSD of 30 to 35% for field repli-cates (which reflect total error), this 15% RSD for laboratory reproducibil-ity is a function of analyte concentration as well as adequate processing. Whether it is appropriate for a specific data set depends on the precision required to meet DQOs and how close to a decision limit a concentration result might be. Because %RSD is a relative measure, it tends to become larger for concentrations near the analytical quantitation limit.
The replicate laboratory analyses should use multi-increment samples that are expected to contain contaminant concentrations near the chosen ac-tion level or below this value but above detection. This will provide the most demanding test of reproducibility while minimizing the chance of non-detect results that would be of little value in evaluating data quality.
Laboratory control samples and Matrix Spike/Matrix Spike Duplicate (MS/MSD) samples spiked before grinding require a relatively large amount of standard. It is not practical to add surrogates or target analyte spikes to 1- to 2-kg samples. However, reference materials for Perfor-mance Evaluation for explosives are now commercially available. See the Environmental Data Quality Working Group white paper Guide for Im-plementing EPA SW 846 Method 8330B (USDoD EDQW 2008) for fur-ther discussion of laboratory QC. The DoD Quality Systems Manual Ver-sion 4.1 (USDoD EDQW 2009) also has laboratory QC requirements for analysis of explosives by Method 8330B. Laboratory QC requirements should be discussed with laboratory personnel during project planning.
The following are additional QC samples that should be prepared with each batch of field multi-increment samples.
• Grinding Blank: A blank sand sample (500 g) is machine ground after every batch of samples. For large batches, a blank should be ground af-ter every 20 field samples. This blank sample is subsampled and ana-lyzed to ensure that the cleaning process is sufficient to prevent cross-
ERDC/CRREL TR-11-15 72
contamination. For multi-increment samples analyzed for metals, grind blanks to assess the metals introduced by the grinding equipment as well as by cross-contamination.
• Performance Evaluation Sample: A sample fortified with known con-centrations of nitroaromatics and nitramines, such as the custom standard available from Environmental Resource Associates (ERA), should be ground and subsampled after every 100 batches.
• Subsampling Variance: For every 10th multi-increment sample, tripli-cate subsamples are taken for analysis to ensure that the subsampling variance is within data quality objectives.
ERDC/CRREL TR-11-15 73
10 Requirements for Contract Laboratories
The large mass of the field sample, laboratory space for drying, suitable grinding equipment, representative subsampling procedures, decontami-nation, and dust control measures are some of the challenges faced by the laboratory in implementing 8330B. However, sampling decision units in a manner that will provide scientifically defensible data when scrutinized by the regulatory process and the courts demands that these challenges be met. The laboratory’s equipment, procedures (including decontamina-tion), and accreditation need to be adequate for project requirements.
Laboratories should comply with the DoD Quality Systems Manual through the DoD Environmental Laboratory Accreditation Program and with the standard operating procedures given in the EPA Guidance for Ob-taining Representative Laboratory Analytical Subsamples from Particu-late Laboratory Samples (USEPA 2003b). Assessment by the DoD Envi-ronmental Laboratory Accreditation Program according to the DoD Quality Systems Manual version 4.1 (US DoD EDQW 2009) will cover la-boratory procedures for multi-increment sampling for explosives analysis. Laboratories analyzing for compounds other than explosives should be as-sessed and approved for multi-increment sample processing in accordance with USACE Incremental Sampling (IS)-based laboratory requirements for the analysis of explosives (Method 8330B) and Metals in Solid Matrices (USACE 2009). ASTM D6323 Standard Guide for Laboratory Subsam-pling of Media Related to Waste Management Activities (ASTM 2003) gives guidance on sample splitting, particle size reduction, and the mass of subsample necessary to reduce the fundamental error to less than 15%.
Method 8330B for energetic compounds (propellant and explosives) re-quires that the entire 1- to 2-kg sample be air dried, then sieved to remove particles larger than 2 mm, which are not defined as soil. In addition it en-sures that all particles of explosives that could potentially be present dur-ing grinding are below the critical diameter for propagation of a detona-tion. A smaller sieve size (recommended in the original Method 8330) should not be used for training range soils because a substantial portion of the energetic residues would be removed by sieving (M.R. Walsh et al. 2007). Soils should be thoroughly disaggregated before sieving in the la-boratory to ensure that all soil-size particles pass through the sieve. The
ERDC/CRREL TR-11-15 74
entire sieved sample is then ground to reduce particle size further, typical-ly to an average particle size of less than 75 µm (very fine sand and small-er). The smaller the particles are, the lower is the variability between sub-samples from a given mass of sample (USEPA 1992b). From the processed multi-increment sample, take at least 20 increments in an unbiased man-ner and composite these until a sufficient sample mass is obtained for ex-traction and analysis. This is particularly important if the soil sample was ground in more than one batch.
Method 8330B recommends processing 10 g of soil for solvent extraction and analysis, rather than the 1 to 2 g typically analyzed by other methods. Grinding is needed to improve precision to acceptable levels for explosives, propellants and metals samples (M.E Walsh et al. 2005).
Multi-increment samples collected in locations where both metals and en-ergetic compounds are distributed (i.e., firing points, direct line-of-sight targets, demolition ranges) can be processed similarly. Just remember that a background soil sample should be collected and analyzed to determine the metal background concentrations. If good records are available, you can analyze for the metals known to be constituents of the munitions fired. Alternatively, the sample can be analyzed for the entire EPA Method 6010 inorganic list, and then exclude those metals that are at or below back-ground levels.
ERDC/CRREL TR-11-15 75
11 Summary
A broad range of considerations must be taken into account to develop and implement a sound multi-increment sampling plan for the MMRP. Many of these considerations will be site-specific and depend on the sampling objectives and analytes of interest: there are no “cookie-cutter” templates. However, with clear data quality objectives and a good multi-increment sampling plan, the average concentration of high explosives, propellants, and metals can be determined for a decision unit by following this guid-ance document. An advantage of multi-increment sampling is that the samplers walk the entire decision unit, giving them an opportunity to see debris that would indicate the presence of a partial detonation or other contaminating event. Remember that sampling error is the largest source of error in obtaining contaminant concentrations on military ranges (Jen-kins et al. 1997a,b, 1999). Sampling error is orders of magnitude larger than laboratory analytical error. Unfortunately, many environmental pro-grams have ignored the need to collect representative samples from areas they want to characterize. Figure 11.1 and the highlights below summarize the main points you need to keep in mind.
11.1 Representative samples are the key to environment characterization
Determine how many replicates you need to show that the measured mean concentrations are within desired uncertainty levels. When in doubt, the number of samples and the number of increments collected to build each multi-increment sample should be maximized rather than minimized. Lack of the appropriate type and number of samples cannot be compen-sated for in the laboratory.
11.2 Subdivide the site into decision units, based on previous and intended future use
The number and size of decision units is a judgment call based on the con-ceptual site model and the decision to be made (purpose of the sampling). Decision units, in theory, can be any size.
ERDC/CRREL TR-11-15 76
11.3 Sample soils within a decision unit for explosives, propellants, and metals
Our studies indicate that a 1- to 2-kg sample, composed of at least 50 in-crements, is necessary to reliably estimate the mean concentration of analytes of interest within a decision unit. We often collect 100 increments if the decision unit is large or is being studied in depth. Collect three multi-increment samples from each decision unit whenever possible.
11.4 Process and subsample the soil samples to quantify their MC concentrations
After sieving, either the entire field sample is pulverized and subsampled or the entire field sample should be extracted. If the sample is pulverized, triplicate subsamples should be collected periodically to assess the uncer-tainty associated with subsampling. The goal is to achieve a field sampling variance of less than 30% RSD and laboratory subsampling variance less than 15% RSD.
11.5 Quantify the uncertainty associated with the average concentration
Triplicate field samples can be used to assess the uncertainty in the aver-age concentration of energetic compounds and metals in soils.
11.6 Desired result
Proper sample collection and processing will allow you to characterize an area that may be up to 1 km2 using a 10-g subsample.
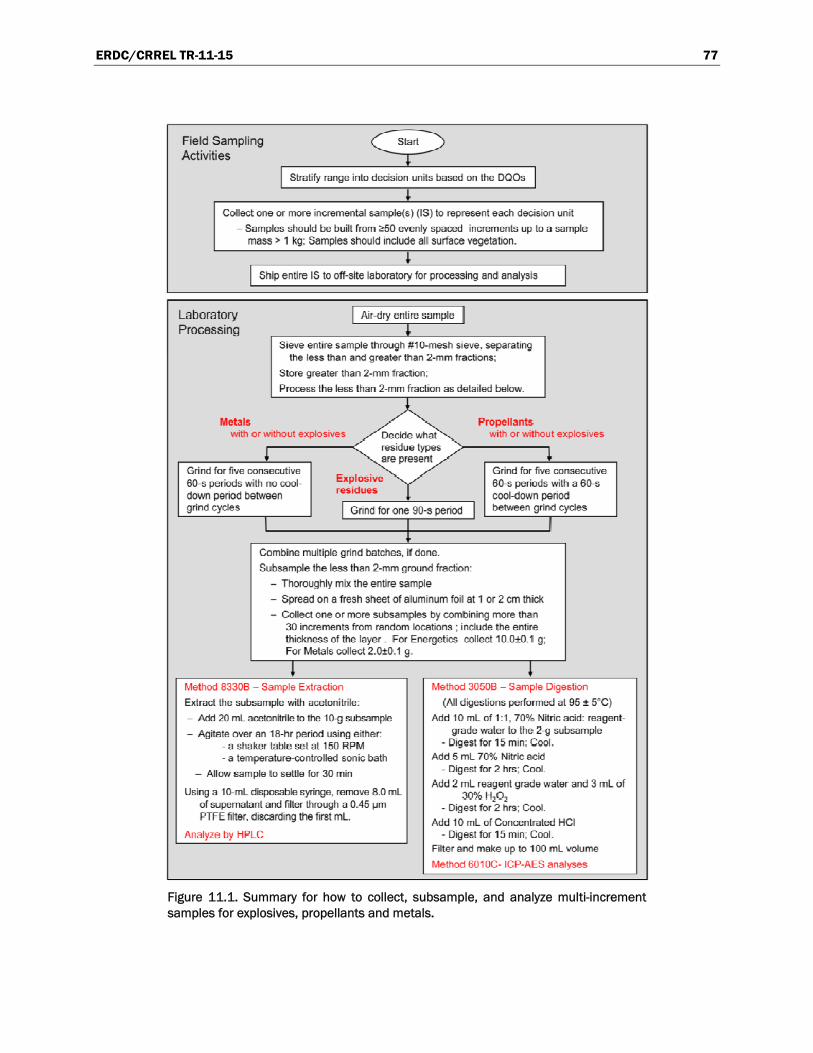
ERDC/CRREL TR-11-15 77
Figure 11.1. Summary for how to collect, subsample, and analyze multi-increment samples for explosives, propellants and metals.
Field Sampling ~ Activities
I Stratify range into decision units based on the DQOs I ~
Collect one or more incremental sample(s) (IS) to represent each decision unit
- Samples should be built from <:50 evenly spaced increments up to a sample mass > 1 kg; Samples should include all surface vegetation.
~ Ship entire IS to off-site laboratory for processing and analysis
Laboratory I Air-dry entire sample I Processing ~
Sieve entire sample through #10-mesh sieve. separating ihe less than and greater than 2-mm fractions;
Store greater than 2-mm fraction;
Process the less than 2-rnm fraction as detailed below .
.... ,. ~ Propellants with or without explosrves Dacide what with or Without explosives
residue types
I :~ ~
Grind for five consecutive E 1
. Grind for five consecutive 60-s periods with no cool- x~ osrve 60-s periods with a 60-s dOINn period between r1!!ittlues cool-down period grind cycles I Grind for one 90·s period I between grind cycles
I I ~
Combine multiple grind batches, if done.
Subsample the less !nan 2-mm ground fraction:
- Thoroughly mix the entire sample
- Spread em a fresh sheet of aluminum foill at 1 or 2 em thick
- Collect one or more subsamples by combining more than 30 increments from random locations ; include t he entire thickness of the layer . For Energetics collect 10.0±0.1 g: For Metals collect 2.0±0.1 g.
l l Method 83309- Sample Extraction Method 30508 -Sample Digestion
Extract the subsample with acetonitrile : (All digestions performed at 95 :t 5"C)
- Add 20 ml acetonitrile to the 10-g subsample Add 10 ml or 1:1, 70% Nitric acid: reagent-
- Agitate over an 18-hr period using either: grade water to the 2-g subsample
- a shaker table set at 150 RPM - Oigest for 1 ~ min; Cool.
-a temperature-controlled sonic bath Add 5 ml 70% Nitric acid
- Allow sample to settle for 30 min - Digest for 2 hrs; Cool.
Using a 10..ml disposable syringe, remove 8.0 ml Add 2 ml reagent grade water and 3 ml of
30% H202 of supernatant and filter throogh a 0.45 1-1m - Digest lor 2 hrs; Cool. PTFE filler, discarding the first ml. Add 1 () ml of Concentrated HCI
Analyze by HPLC ·Digest for 15 min: Cool. Filler and make up to 100 ml volume
Method 6010C- ICP-AES analyses
ERDC/CRREL TR-11-15 78
References
ADEC. 2009. Draft Guidance on Multi-increment Soil Sampling. Alaska Department of Environmental Conservation, Division of Spill Prevention and Response, Contaminated Sites Program, March 2009. http://www.dec.state.ak.us/SPAR/csp/guidance/multi_increment.pdf
Ampleman, G., S. Thiboutot, A. Marois, A. Gagnon, D. Gilbert, M.R. Walsh, M.E. Walsh, and P. Woods. 2009. Evaluation of the Propellant, Residues Emitted During 105-mm Leopard Tank Live Firing at CFB Valcartier, Canada. Defence R&D Canada-Valcartier, TR 2009-420. Val-Belair, PQ: Defence Research Establishment−Valcartier.
Ampleman, G., S. Thiboutot, J. Lewis, A. Marois, A. Gagnon, M. Gagnon, S. Jean, T. F. Jenkins, A. Hewitt, J. C. Pennington, and T. A Ranney. 2003. Evaluation of the contamination by explosives in soils, biomass and surface water at Cold Lake Air Weapons Range (CLAWR), Alberta, Phase I Report. DRDC-TR-2003-208. Val-Belair, PQ: Defence Research and Development Canada−Valcartier.
ASTM. 2003. Standard D6323 -98 Standard Guide for Laboratory Subsampling of Media Related to Waste Management Activities. West Conshohocken, PA: American Society for Testing and Materials International. Available through: http://www.astm.org/Standards/D6323.htm
ASTM. 2006. Standard D5792-02. Standard Practice for Generation of Environmental Data Related to Waste Management Activities: Development of Data Quality Objectives. West Conshohocken, PA: American Society for Testing and Materials International. Available through: http://www.astm.org/Standards/D5792.htm
Bjella, K. L. 2005. Pre-screening for explosives residues in soil prior to HPLC analysis utilizing Expray. ERDC/CRREL TN-05-2. http://www.crrel.usace.army.mil/techpub/CRREL_Reports/reports/TN05-2.pdf
BTAG. 2002. Selection of Assessment and Measurement Endpoints for Ecological Risk Assessment. U.S. Army Biological Technical Assistance Group. SFIM-AEC-ER-TR-2002018. http://aec.army.mil/usaec/cleanup/ecorisk02-0202.pdf
BTAG. 2005. Technical Document for Ecological Risk Assessment: Process for Developing Management Goals. U.S. Army Biological Technical Assistance Group. Aug. 2005. http://aec.army.mil/usaec/cleanup/ecorisk04-0805.pdf
Buttle, J. M. 1994. Isotope hydrograph separations and rapid delivery of prevent water from drainage basins. Progress in Physical Geography 18: 16–41.
Clausen, J. L., J. Robb, D. Curry, B. Gregson, and N. Korte. 2004. A case study of contaminants on military ranges: Camp Edwards, Massachusetts, USA. Environmental Pollution 129: 13–21.
ERDC/CRREL TR-11-15 79
Clausen, J. L., S. Taylor, S. L. Larson, A. J. Bednar, M. Ketterer, C. S. Griggs, D. J. Lambert, A. D. Hewitt, C. A. Ramsey, S. R. Bigl, R. N. Bailey, and N. M. Perron. 2007. Fate and transport of tungsten at Camp Edwards small arms ranges. U.S. Army Research and Development Center, TR-07-5.
Clausen, J., C. Scott, N. Mulherin, S. Bigl, G. Gooch, T. Douglas, I. Osgerby, and B. Palm. 2010. Adsorption/Desorption Measurements of Nitroglycerin and Dinitrotoluene in Camp Edwards Massachusetts Soil. ERDC/CRREL TR-10-1.
Crumbling, D. M. 2001. Applying the concept of effective data environmental analysis for contaminated sites. EPA 542-R-01-013, Washington, DC: U. S. Environmental Protection Agency. http://www.epa.gov/tio/download/char/effective_data.pdf
Crumbling, D. M. 2002. In search of representativeness: evolving the environmental data quality model. Quality Assurance 9: 179−190. http://cluin.org/download/char/dataquality/dcrumbling.pdf
Dauphin, L., and C. Doyle. 2000. Study of ammunition dud and low-order detonation rates. Aberdeen Proving Ground, MD: U.S. Army Environmental Center Report SFIM-ACE-ET-CR-200049.
DuBois, F. W., and J. F Baytos. 1991. Weathering of Explosives for Twenty Years. Los Alamos Report LA-11931.
Felt, D. R., A. J. Bednar, and T. Georgian. 2008. The effects of grinding methods on metals concentrations in soils. Talanta 77(1): 380 –387. http://dx.doi.org/10.1016/j.talanta.2008.06.039
Gy, P. 1998. Sampling for Analytical Purposes [translated by A.G. Royle]. West Sussex, England: John Wiley & Sons, Ltd. ISBN 0-471-97956-2, 153 p. http://www.wiley.com
HDOH. 2008. Technical Guidance Manual for the Implementation of the Hawai’i State Contingency Plan. Hawai’i Department of Health Interim Final, 12 November 2008. http://www.hawaiidoh.org/tgm.aspx?p=0402a.aspx
Hewitt A. D., S. R. Bigl, M. E.Walsh, and S. Brochu. 2007a. Processing of training range soils for the analysis of energetic compounds. ERDC/CRREL TR-07-15.
Hewitt A. D., T. F. Jenkins, M. E. Walsh, M. R. Walsh, S. R. Bigl, and C. A. Ramsey. 2007b. Protocols for Collection of Surface Soil Samples at Military Training and Testing Ranges for the Characterization of Energetic Munitions Constituents. ERDC-CRREL TR-07-10.
Hewitt, A. D., T. F. Jenkins, C. A. Ramsey, K. L. Bjella, T. A. Ranney, and N. M. Perron. 2005a. Estimating energetic residue loading on military artillery ranges: Large decision units. ERDC/CRREL TR-05-7. http://www.crrel.usace.army.mil/techpub/CRREL_Reports/reports/TR05-7.pdf
Hewitt, A. D., T. F. Jenkins, M. E. Walsh, M. R. Walsh, and S. Taylor. 2005b. RDX and TNT residues for live-fire and blow-in-place detonations. Chemosphere 61: 888–894.
ERDC/CRREL TR-11-15 80
Hewitt, A. D., T. F. Jenkins, M. E. Walsh, S. R. Bigl, and S. Brochu. 2009. Validation of Sampling Protocol and the Promulgation of Method Modifications for the Characterization of Energetic Residues on Military Testing and Training Ranges. ERDC/CRREL TR-09-6.
Hewitt, A. D., T. F. Jenkins, T. A. Ranney, J. A. Stark, M. E. Walsh, S. Taylor, M. R. Walsh, D. J. Lambert, N. M. Perron, N. H. Collins, and R. Karn. 2003. Estimates for explosives residue from the detonation of army munitions. ERDC/CRREL TR-03-16. http://www.crrel.usace.army.mil/techpub/CRREL_Reports/reports/TR03-16.pdf
ITRC. 2008. Use of Risk Assessment in Management of Contaminated Sites: An Overview. Interstate Technology and Regulatory Council Risk Assessment Resources Team. RISK-2. http://www.itrcweb.org/Documents/Risk_Docs/RISK2.pdf
Jenkins, T. F. 1990. Development of a Simplified Field Method for the Determination of TNT in Soil. CRREL Special Report 90-38.
Jenkins, T. F., A. D. Hewitt, C. A. Ramsey, K. L. Bjella, S. R. Bigl, and D. J. Lambert. 2006b. Sampling Studies at an Air Force Live-Fire Bombing Range Impact Area. ERDC/CRREL TR-06-2. http://www.crrel.usace.army.mil/techpub/CRREL_Reports/reports/TR06-2.pdf
Jenkins, T. F., A. D. Hewitt, C. L. Grant, S. Thiboutot, G. Ampleman, M. E. Walsh, T. A. Ranney, C. A. Ramsey, A. J. Palazzo, and J. C. Pennington. 2006a. Identity and distribution of residues of energetic compounds at army live-fire training ranges. Chemosphere 63: 1280–1290.
Jenkins, T. F., A. D. Hewitt, M. E. Walsh, T. A. Ranney, C. A. Ramsey, C. L. Grant, and K. L. Bjella. 2005. Representative sampling for energetic compounds at military training ranges. Environmental Forensics 6: 45–55.
Jenkins, T. F., A. D. Hewitt, T. A. Ranney, C. A. Ramsey, D. J. Lambert, K. L. Bjella, and N. M. Perron. 2004a. Sampling Strategies near a Low-Order Detonation and a Target at an Artillery Impact Area. ERDC/CRREL TR-04-14. http://www.crrel.usace.army.mil/techpub/CRREL_Reports/reports/TR04-14.pdf
Jenkins, T. F., and M. E. Walsh. 1992. Development of Field Screening Methods for TNT, 2,4-DNT and RDX in Soil. Talanta 39: 419−428.
Jenkins, T. F., C. L. Grant, G. S. Brar, P. G. Thorne, P. W. Schumacher, and T. A. Ranney. 1997a. Sampling error associated with collection and analysis of soil samples at TNT contaminated sites. Field Analytical Chemistry and Technology 1: 151–163.
Jenkins, T. F., C. L. Grant, M. E. Walsh, P. G. Thorne, S. Thiboutot, G. Ampleman, and T. A. Ranney. 1999. Coping with spatial heterogeneity effects on sampling and analysis at an HMX-contaminated antitank firing range. Field Analytical Chemistry and Technology 3(1): 19–28.
Jenkins, T. F., G. Ampleman, S. Thiboutot, S. Bigl, S. Taylor, M. R. Walsh, D. Faucher, R. Martel, I. Poulin, K. M. Dontsova, M. E. Walsh, S. Brochu, A. D. Hewitt, and others. 2008. Characterization and Fate of Gun and Rocket Propellant Residues on Testing and Training Ranges: Final Report. ERDC/CRREL TR-08-01.
ERDC/CRREL TR-11-15 81
Jenkins, T. F., J. C. Pennington, G. Ampleman, S. Thiboutot, M. R. Walsh, E. Diaz, K. M. Dontsova, A.D. Hewitt, M. E. Walsh, S. Bigl, S. Taylor, and others. 2007. Characterization and Fate of Gun and Rocket Propellant Residues on Testing and Training Ranges: Interim Report 1. ERDC TR-07-1.
Jenkins, T. F., M. E. Walsh, P. G. Thorne, S. Thiboutot, G. Ampleman, T. A. Ranney, and C. L. Grant. 1997b. Assessment of Sampling Error Associated with the Collection and Analysis of Soil Samples at a Firing Range Contaminated with HMX. CRREL Special Report 97-22. http://www.crrel.usace.army.mil/techpub/CRREL-Reports/reports/ SR97-22.pdf
Jenkins, T. F., T. A. Ranney, A. D. Hewitt, M. E. Walsh, and K. L. Bjella. 2004b. Representative Sampling for Energetic Compounds at an Antitank Firing Range. ERDC/CRREL TR-04-7. http://www.crrel.usace.army.mil/techpub/CRREL_Reports/reports/TR04-7.pdf
Lever J., S. Taylor, L. Perovich, K. Bjella, and B. Packer. 2005. Dissolution of Composition B residuals. Environmental Science and Technology. 39: 8803–8811.
Martel, R., M. Mailloux, U.Gabriel, R. Lefebvre, S. Thiboutot, and G.Ampleman. 2009. Behavior of energetic materials in groundwater and an anti-tank range. J. Enviro. Qual., Vol. 38, 75-92.
Nieman, K. 2007. Select Engineering Services, 75 CEG/CEVC, Hill Air Force Base, UT, Personal communication.
Pennington J. C., C. Hays, S. Yost, T. A. Crutcher, T. E. Berry, J. U. Clarke, and M. J. Bishop. 2008. Explosive residues from blow-in-place detonations of artillery munitions. Soil & Sediment Contamination 17: 163−180.
Pennington, J. C., T. F. Jenkins, G. Ampleman, S. Thiboutot, et al. 2006. Distribution and fate of energetics on DoD test and training ranges: Final report, ERDC TR-06-13.
Pitard, F. 1993. Pierre Gy’s Sampling Theory and Sampling Practice. 2nd Edition. Boca Raton, Florida: CRC Press.
Racine C. H., M. E. Walsh, C. M. Collins, D. J. Calkins, B. D.Roebuck, and L. Reitsma. 1992. Waterfowl Mortality in Eagle River Flats, Alaska: The Role of Munitions Residues. CRREL Report CR-92-5.
Radtke C. W., D. Gianotto, and F. F. Roberto. 2002. Effects of particulate explosives on estimating contamination at a historical explosives testing area. Chemosphere 46: 3–9.
Ramsey, C. A., and A. D. Hewitt. 2005. A methodology for assessing sample representativeness. Journal of Environmental Forensics 6: 71−76.
Roote D., C. Tomljanovic, and S. Bryant. 2010. Large-scale chemical characterization of contamination on military training ranges. National Defense Center for Energy and Environment. Draft final report available to DoD employees only.
ERDC/CRREL TR-11-15 82
Taylor S., A. Hewitt, J. Lever, C. Hayes, L. Perovich, P. Thorne, and C. Daghlian. 2004. TNT particle size distributions from detonated 155-mm howitzer rounds, Chemosphere 55: 357-367.
Taylor S., E. Campbell, L. Perovich, J. Lever, and J. Pennington. 2006. Characteristics of Composition B particles from blow-in-place detonations. Chemosphere 65: 1405−1413.
Taylor S., J. H. Lever, J. Fadden, N. Perron, and B. Packer. 2009. Outdoor weathering and dissolution of TNT and tritonal. Chemosphere 77: 1338−1345.
Taylor, S., C. Richardson, J. H. Lever, J. S. Pitt, S. Bigl, and N. Perron. in review. Dissolution of nitroglycerin from small arms propellants and their residues. Submitted to Chemosphere.
Taylor, S., J. Lever, M. E. Walsh, J. Fadden, N. Perron, S. Bigl, R. Spanggord, M. Curnow, and B. Packer. 2010. Dissolution Rate, Weathering Mechanics, and Friability of TNT, Comp B, Tritonal, and Octol. ERDC/CRREL TR-10-2.
Techlaw, Incorporated. 2010. Site Inspection Report Former Farragut Naval Training Center/Idaho Department of Fish and Game Farragut Firing Range, Athol, Kootenai County, Idaho TDD: 09-04-0014.
Thiboutot, S., G. Ampleman, A. Gagnon, A. Marois, T.F. Jenkins, M.E. Walsh, P.G. Thorne, and T.A. Ranney. 1998. Characterization of antitank firing ranges at CFB Valcartier, WATC Wainwright and CFAD Dundurn. Report DREV-R-9809. Val-Belair, PQ: Defence Research Establishment Valcartier.
USACE. 1998. Technical Project Planning (TPP) process. EM 200-1-2. Washington, DC: U.S. Army Corps of Engineers. http://140.194.76.129/publications/eng-manuals/em200-1-2/entire.pdf
USACE. 2003. Conceptual site models for Military Munitions Response Program (MMRP) and hazardous, toxic and radioactive waste (HTRW) projects. EM 1110-1-1200. Washington, DC: U.S. Army Corps of Engineers. http://140.194.76.129/publications/eng-manuals/em1110-1-1200/entire.pdf
USACE. 2007. Engineering and Design: Military Munitions Response Actions. EM 1110-1-4009. Chapter 10, Munitions Constituent (MC) Sampling, p. 10-1–10-22. Washington, DC: U.S. Army Corps of Engineers. http://140.194.76.129/publications/eng-manuals/em200-1-2/entire.pdf
USACE. 2009. Implementation of Incremental Sampling (IS) of Soil for the Military Munitions Response Program. Huntsville, AL: U.S. Army Corps of Engineers, Environmental and Munitions Center of Expertise. Interim Guidance 09-02. 20 July 2009.
USACHPPM. 2001. Training Range Site Characterization and Risk Screening, Camp Shelby, Mississippi, 7–23 September 1999. U.S. Army Center for Health Promotion and Preventive Medicine, Final Geohydrologic Study no. 38-EH-8879-99.

ERDC/CRREL TR-11-15 83
USACHPPM. 2003. Training Range Site Characterization and Risk Screening, Regional Range Study, Jefferson Proving Ground, Madison, Indiana, September 2002. U.S. Army Center for Health Promotion and Preventive Medicine, Project No. 38-EH-8220-03.
USACHPPM. 2004. Training Range Site Characterization and Risk Screening, Regional Range Study, Dona Ana Range, Fort Bliss, Texas, May 2000. U.S. Army Center for Health Promotion and Preventive Medicine, Geohydrologic Study No. 38-EH-6807-02.
USACHPPM. 2005. Training Range Site Characterization and Risk Assessment, Regional Range Study, Redleg Impact Area, Fort Polk, Louisiana, March 2005. U.S. Army Center for Health Promotion and Preventive Medicine, Project No. 38-EH-00M2-04.
USDA. 1993. Examination and Description of Soils. Chapter 3 in Soil Survey Manual. U.S. Department of Agriculture. ftp://ftp-fc.sc.egov.usda.gov/NSSC/
USDoD EDQW. 2009. DoD Quality Systems Manual for Environmental Laboratories, Version 4.1. U.S. Department of Defense. http://www.navylabs.navy.mil/QSM%20Version%204.1.pdf
USDoD. 2008. Environmental Data Quality Workgroup (EDQW). Guide for Implementing EPA SW-846 Method 8330B. http://aec.army.mil/usaec/cleanup/8330bguide.pdf
USEPA. 1989a. Methods of evaluating the attainment of cleanup standards, volume 1: soils and solid media. U.S. Environmental Protection Agency, Office of Policy, Planning, and Evaluation, EPA 230/02-89/042. http://www.clu-in.org/download/stats/vol1soils.pdf
USEPA. 1989b. Risk assessment guidance for Superfund, Volume I: Human health evaluation manual (Part A), NTIS PB90-155581, U.S. Environmental Protection Agency EPA-540/1-89-002. http://rais.ornl.gov/homepage/HHEMA.pdf
USEPA. 1992a. Supplemental guidance to RAGS: Calculating the concentration term. U.S. Environmental Protection Agency, Publication 9285.7-081, PB92-963373. http://www.deq.state.or.us/lq/pubs/forms/tanks/UCLsEPASupGuidance.pd
USEPA. 1992b. Preparation of soil sampling protocols: sampling techniques and strategies. U.S. Environmental Protection Agency, Office of Research and Development, EPA/600/R-92/128. http://www.epa.gov/OUST/cat/mason.pdf
USEPA. 1996a. Soil Screening Guidance: User’s Guide. U.S. Environmental Protection Agency, OSWER 9355.4-23. http://www.epa.gov/superfund/resources/soil/ssg496.pdf http://www.epa.gov/superfund/health/conmedia/soil/index.htm#user
USEPA. 1996b. Soil Screening Guidance: Technical Background Document. Section 4.1, Second Edition. U.S. Environmental Protection Agency, Office of Solid Waste and Emergency Response, EPA/540/R95/128. http://www.epa.gov/superfund/health/conmedia/soil/pdfs/part_4.pdf

ERDC/CRREL TR-11-15 84
USEPA. 1996c. Method 8515: Colorimetric screening method for trinitrotoluene (TNT) in soil. In Test Methods for Evaluating Solid Waste, Physical/Chemical Methods, Office of Solid Waste and Emergency Response. SW-846. U.S. Environmental Protection Agency.
USEPA. 1999. Issue Paper: Estimates of Sample Sizes Required for a Generator to Demonstrate a Waste Qualifies for Exemption under HWIR. Prepared for U.S. Environmental Protection Agency, Office of Solid Waste, by Science Applications International Corporation, 21 May 1999. http://www.epa.gov/osw/hazard/wastetypes/wasteid/hwirwste/pdf/ispapfnl.pdf
USEPA. 2000. Method 8510: Colorimetric screening procedure for RDX and HMX in soil. In Test Methods for Evaluating Solid Waste, Physical/Chemical Methods, Office of Solid Waste and Emergency Response. SW-846. U.S. Environmental Protection Agency.
USEPA. 2002. Guidance on Choosing a Sampling Design For Environmental Data Collection. EPA QA/G-5S. EPA/240/R-02/005. U.S. Environmental Protection Agency.
USEPA. 2003a. TRW Recommendations for Performing Human Health Risk Analysis on Small Arms Shooting Ranges. U.S. Environmental Protection Agency, OSWER 9285.7-37.
USEPA. 2003b. Guidance for Obtaining Representative Laboratory Analytical Subsamples for Particulate Laboratory Samples. EPA 600/R-03/027. U.S. Environmental Protection Agency.
USEPA. 2006a. Guidance on Systematic Planning using the Data Quality Objectives Process. EPA QA/G4. EPA/240/B-06/001. U.S. Environmental Protection Agency.
USEPA. 2006b. Method 8330B: Nitroaromatics, nitramines, nitrate esters by high performance liquid chromatography (HPLC). In Test Methods for Evaluating Solid Waste, Physical/Chemical Methods, Office of Solid Waste and Emergency Response. SW-846. U.S. Environmental Protection Agency.
USEPA. 2009. Regional Screening Levels for Chemical Contaminants at Superfund Sites. U.S. Environmental Protection Agency. http://www.epa.gov/reg3hwmd/risk/human/rb_concentration_table/Generic_Tables/index.htm
Walsh M. E, S. Taylor, A. D. Hewitt, M. R. Walsh, C. A. Ramsey, and C. M. Collins. 2009. Field observations of the persistence of Comp B explosives residues in a salt marsh impact area. Chemosphere 78: 467−473.
Walsh M. E., C. A. Ramsey, S. Taylor, A. D. Hewitt, K. Bjella, and C. M. Collins. 2007. Sub-subsampling variance for 2,4-DNT in firing point soils. Soil and Sediment Contamination: an International Journal 16: 459−472.
Walsh M. R., C. M. Collins, and A. D. Hewitt. 2008. Explosives Residues Resulting from the Blow-In-Place Detonation of 60-mm and 120-mm High Explosive Mortar Cartridges. ERDC/CRREL TR-08-19.
ERDC/CRREL TR-11-15 85
Walsh, M. E., and T. F. Jenkins. 1991. Development of a Field Screening Method for RDX in Soil. CRREL Special Report 91-7.
Walsh, M. E., C. A. Ramsey, C. M. Collins, A. D. Hewitt, M. R. Walsh, K. Bjella, D. Lambert, and N. Perron. 2005. Collection methods and laboratory processing of samples from Donnelly Training Area Firing Points Alaska 2003. ERDC/CRREL TR-05-6.
Walsh, M. E., C. M. Collins, A. D. Hewitt, M. R. Walsh, T. F. Jenkins, J. Stark, A. Gelvin, T. S. Douglas, N. Perron, D. Lambert, R. Bailey, and K. Myers. 2004. Range Characterization Studies at Donnelly Training Area, Alaska: 2001 and 2002. ERDC/CRREL TR-04-3.
Walsh, M. E., C. M. Collins, R. N. Bailey, and C. L. Grant. 1997. Composite Sampling of Sediments Contaminated with White Phosphorus. CRREL SR 97-30.
Walsh, M. R. 2009. User’s manual for the CRREL Multi-increment sampling tool. ERDC/CRREL Special Report SR-09-1.
Walsh, M. R., M. E. Walsh, and A. D. Hewitt. 2009. Energetic Residues from the Expedient Disposal of Artillery Propellants. ERDC/CRREL TR-09-8.
Walsh, M. R., M. E. Walsh, C. A. Ramsey, R. J. Rachow, J. E. Zufelt, C. M. Collins, A. B. Gelvin, N. M. Perron, and S. P. Saari. 2006. Energetic Residues from a 60-mm and 81-mm Live Fire Exercise. ERDC/CRREL TR-06-10.
Walsh, M. R., M. E. Walsh, C. M. Collins, S. P. Saari, J. E. Zufelt, A. B. Gelvin, and J. W. Hug. 2005b. Energetic Residues from Live-Fire Detonations of 120-mm Mortar Rounds. ERDC/CRREL TR-05-15.
Walsh, M. R., M. E. Walsh, J. W. Hug, S. R. Bigl, K. L.Foley, A. B. Gelvin, and N. M. Perron. 2010. Propellant Residues Deposition from Firing of 40-mm Grenades. ERDC/CRREL TR-10-10.
Walsh, M. R., M. E. Walsh, S. R. Bigl, N. M. Perron, D. J. Lambert, and A. D. Hewitt. 2007. Propellant Residues Deposition from Small Arms Munitions. ERDC/CRREL TR-07-17.
Walsh, M. R., S. Taylor, M. E. Walsh, S. Bigl, K. Bjella, T. Douglas, A. Gelvin, D. Lambert, N. Perron, and S. Saari. 2005a. Residues from Live Fire Detonations of 155-mm Howitzer Rounds. ERDC/CRREL TR-05-14.
Yinon, J. 1999. Forensic and environmental detection of explosives. Chichester, UK: John Wiley.
ERDC/CRREL TR-11-15 86
Glossary
Area of Concern: Within a site there can be one or more areas that are of particular concern given their history.
Bias: Systematic or persistent distortion of a measurement process that causes error in one direction (the expected sample measurement value dif-fers from the sample’s true value). USEPA QA/G-5S.
C4: A high explosive containing 91% RDX and 9% oil.
Composition B: Comp B is a high explosive containing 60% RDX, 39% TNT, 1% wax.
Concentration: Concentration can be expressed in a variety of ways parts per thousand (ppt), which is equivalent to mg/g, g/kg, or g/L; parts per million (ppm), which is equivalent to mg/kg or mg/L; parts per billion (ppb) which is equivalent to µg/kg or µg/L.
Conceptual Site Model: The CSM describes the relationship between the analytes of interest, their sources, release mechanisms, distribution, fate and transport, and possible exposure routes to potential receptors.
Decision Unit: A decision unit is an explicitly defined area for which an average concentration of contaminants released from past activities will be estimated. This information is used to decide whether or not the area re-quires remediation or institutional controls. A decision unit is three-dimensional (surface area and depth). The size and shape of the decision unit is based on the data quality objectives, how the area was previous used, and its intended future use (see Section 6.1).
Discrete Sample: A discrete sample is a grab sample; an aliquot of ma-terial collected for analytical testing at single time and location.
Dud: A munition containing explosives that was fired but did not deto-nate.
ERDC/CRREL TR-11-15 87
Energetic Residues: Energetic material residues are unreacted explo-sives and propellant compounds that remain after firing or detonation of munitions.
High-order Detonation: When projectiles reach the impact area and the explosive reaction goes to completion as designed, the round is said to have detonated high-order.
Method 8330B: This method revision “provides guidance for the collec-tion and processing of samples for characterization of secondary explosive and propellant residues in solid matrices, such as soils, solid wastes, and sediments obtained on military training ranges.” http://www.epa.gov/epaoswer/hazwaste/test/pdfs/8330b.pdf
Multi-increment Sample (MIS): A multi-increment sample is a type of composite sample that is built by collecting and combining many “incre-ments” (small portions of particulate material such as soils and sediments) in an unbiased manner from throughout a single Decision Unit. One must employ the tenants of Sampling Theory to determine the appropriate sam-ple mass, number of increments, and correct selection and use of sampling tools when collecting a multi-increment sample.
Octol: A high explosive composed of 70% HMX and 30% TNT.
Partial Detonation (low-order detonation): When a malfunction occurs so that the reaction is only partially completed, the round is said to have undergone a partial detonation or detonated low-order.
Profile Sample: Sample taken of the subsurface soil as a function of depth (sometimes referred to as a core sample).
Random−Systematic: A method in which the timing or location of samples is selected randomly. This randomly selected unit establishes the starting place of a systematic pattern (for example, every 3 days, every 5th unit, every unit at a node on a grid design) that is repeated throughout the population. (Systematic sampling EPA QA/G-5S.)
Systematic Grid Sampling: Square or rectangular grid with a random starting point (EPA Soil Screening Guidance).
ERDC/CRREL TR-11-15 88
Targeted Sampling: (Judgmental sampling—EPA QA/G-5S)—use of professional judgment to select sampling locations.
Tritonal: A high explosive composed of 80% TNT, 20% aluminum.
Wide-area Sample: Wide-area (> 10,000 m2 or 2.47 acres) sampling combines qualitative reconnaissance (e.g., visual inspection or some screening technology) and multi-increment sampling.
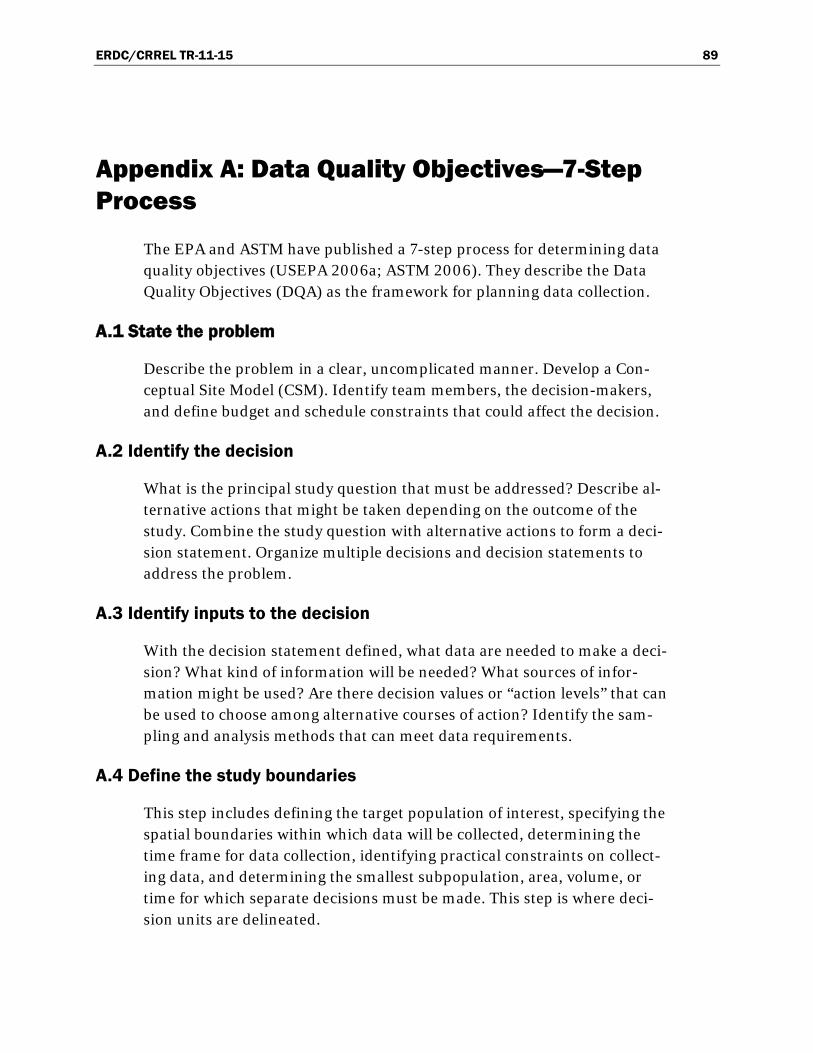
ERDC/CRREL TR-11-15 89
Appendix A: Data Quality Objectives—7-Step Process
The EPA and ASTM have published a 7-step process for determining data quality objectives (USEPA 2006a; ASTM 2006). They describe the Data Quality Objectives (DQA) as the framework for planning data collection.
A.1 State the problem
Describe the problem in a clear, uncomplicated manner. Develop a Con-ceptual Site Model (CSM). Identify team members, the decision-makers, and define budget and schedule constraints that could affect the decision.
A.2 Identify the decision
What is the principal study question that must be addressed? Describe al-ternative actions that might be taken depending on the outcome of the study. Combine the study question with alternative actions to form a deci-sion statement. Organize multiple decisions and decision statements to address the problem.
A.3 Identify inputs to the decision
With the decision statement defined, what data are needed to make a deci-sion? What kind of information will be needed? What sources of infor-mation might be used? Are there decision values or “action levels” that can be used to choose among alternative courses of action? Identify the sam-pling and analysis methods that can meet data requirements.
A.4 Define the study boundaries
This step includes defining the target population of interest, specifying the spatial boundaries within which data will be collected, determining the time frame for data collection, identifying practical constraints on collect-ing data, and determining the smallest subpopulation, area, volume, or time for which separate decisions must be made. This step is where deci-sion units are delineated.
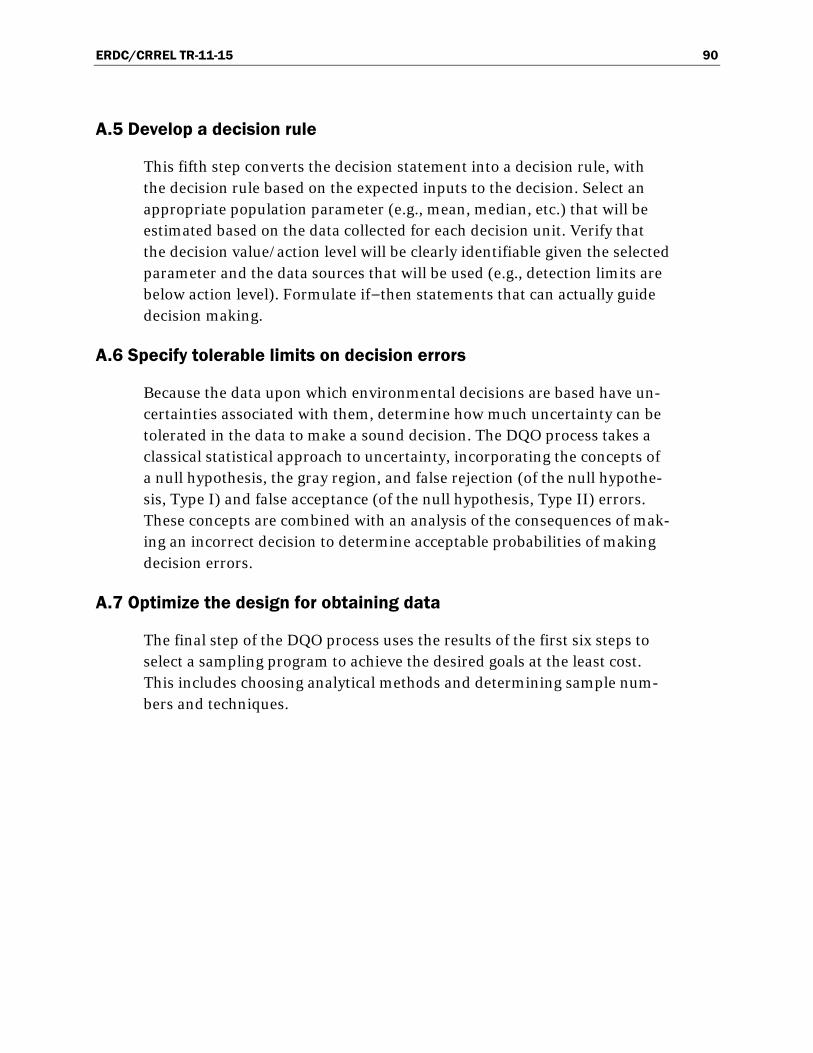
ERDC/CRREL TR-11-15 90
A.5 Develop a decision rule
This fifth step converts the decision statement into a decision rule, with the decision rule based on the expected inputs to the decision. Select an appropriate population parameter (e.g., mean, median, etc.) that will be estimated based on the data collected for each decision unit. Verify that the decision value/action level will be clearly identifiable given the selected parameter and the data sources that will be used (e.g., detection limits are below action level). Formulate if−then statements that can actually guide decision making.
A.6 Specify tolerable limits on decision errors
Because the data upon which environmental decisions are based have un-certainties associated with them, determine how much uncertainty can be tolerated in the data to make a sound decision. The DQO process takes a classical statistical approach to uncertainty, incorporating the concepts of a null hypothesis, the gray region, and false rejection (of the null hypothe-sis, Type I) and false acceptance (of the null hypothesis, Type II) errors. These concepts are combined with an analysis of the consequences of mak-ing an incorrect decision to determine acceptable probabilities of making decision errors.
A.7 Optimize the design for obtaining data
The final step of the DQO process uses the results of the first six steps to select a sampling program to achieve the desired goals at the least cost. This includes choosing analytical methods and determining sample num-bers and techniques.
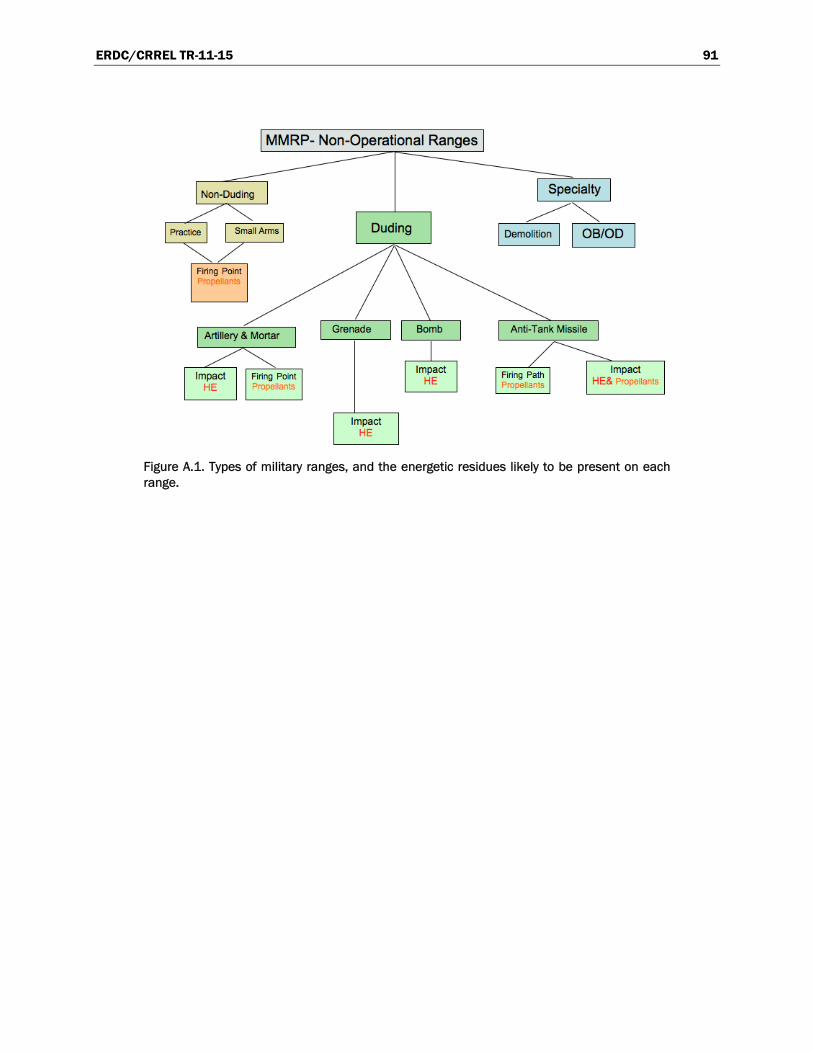
ERDC/CRREL TR-11-15 91
Figure A.1. Types of military ranges, and the energetic residues likely to be present on each range.
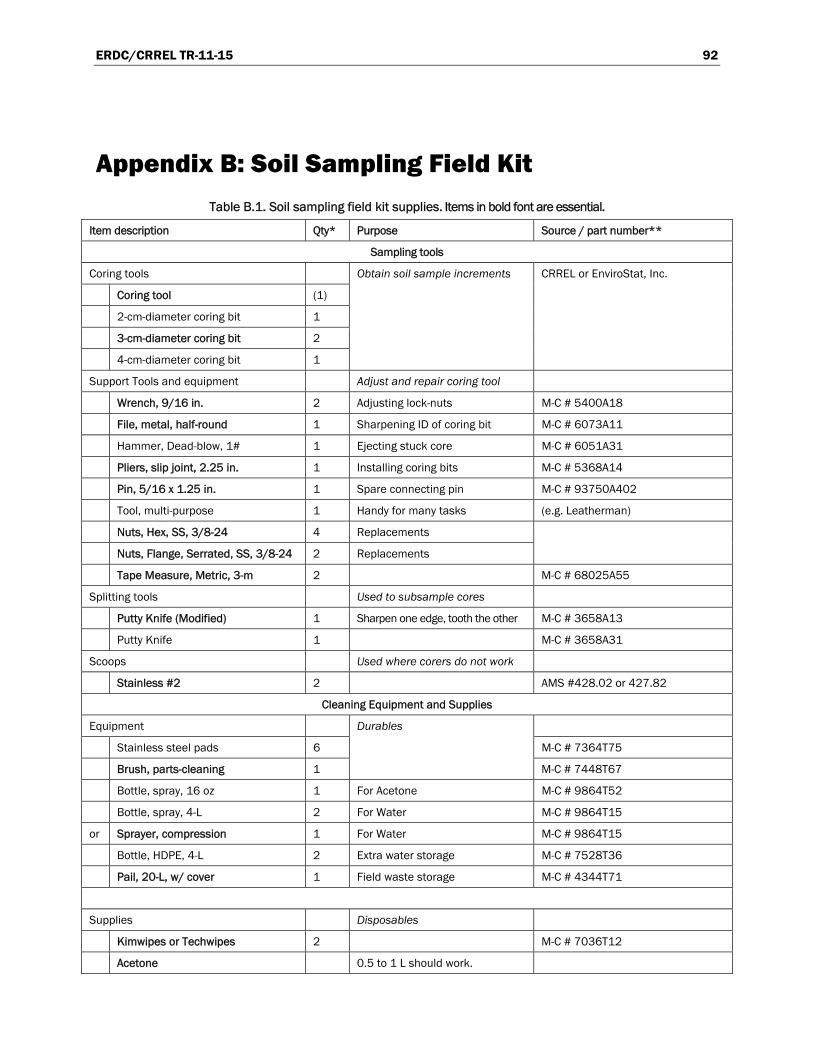
ERDC/CRREL TR-11-15 92
Appendix B: Soil Sampling Field Kit Table B.1. Soil sampling field kit supplies. Items in bold font are essential.
Item description Qty* Purpose Source / part number**
Sampling tools
Coring tools Obtain soil sample increments CRREL or EnviroStat, Inc.
Coring tool (1)
2-cm-diameter coring bit 1
3-cm-diameter coring bit 2
4-cm-diameter coring bit 1
Support Tools and equipment Adjust and repair coring tool
Wrench, 9/16 in. 2 Adjusting lock-nuts M-C # 5400A18
File, metal, half-round 1 Sharpening ID of coring bit M-C # 6073A11
Hammer, Dead-blow, 1# 1 Ejecting stuck core M-C # 6051A31
Pliers, slip joint, 2.25 in. 1 Installing coring bits M-C # 5368A14
Pin, 5/16 x 1.25 in. 1 Spare connecting pin M-C # 93750A402
Tool, multi-purpose 1 Handy for many tasks (e.g. Leatherman)
Nuts, Hex, SS, 3/8-24 4 Replacements
Nuts, Flange, Serrated, SS, 3/8-24 2 Replacements
Tape Measure, Metric, 3-m 2 M-C # 68025A55
Splitting tools Used to subsample cores
Putty Knife (Modified) 1 Sharpen one edge, tooth the other M-C # 3658A13
Putty Knife 1 M-C # 3658A31
Scoops Used where corers do not work
Stainless #2 2 AMS #428.02 or 427.82
Cleaning Equipment and Supplies
Equipment Durables
Stainless steel pads 6 M-C # 7364T75
Brush, parts-cleaning 1 M-C # 7448T67
Bottle, spray, 16 oz 1 For Acetone M-C # 9864T52
Bottle, spray, 4-L 2 For Water M-C # 9864T15
or Sprayer, compression 1 For Water M-C # 9864T15
Bottle, HDPE, 4-L 2 Extra water storage M-C # 7528T36
Pail, 20-L, w/ cover 1 Field waste storage M-C # 4344T71
Supplies Disposables
Kimwipes or Techwipes 2 M-C # 7036T12
Acetone 0.5 to 1 L should work.
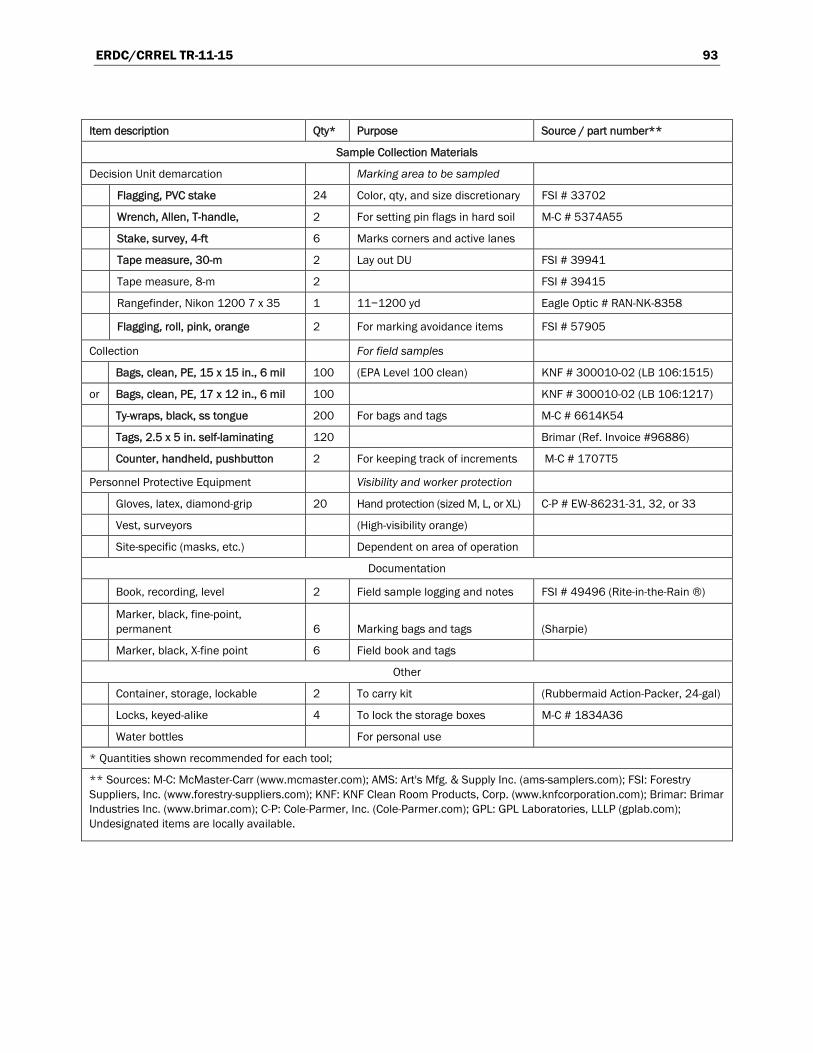
ERDC/CRREL TR-11-15 93
Item description Qty* Purpose Source / part number**
Sample Collection Materials
Decision Unit demarcation Marking area to be sampled
Flagging, PVC stake 24 Color, qty, and size discretionary FSI # 33702
Wrench, Allen, T-handle, 2 For setting pin flags in hard soil M-C # 5374A55
Stake, survey, 4-ft 6 Marks corners and active lanes
Tape measure, 30-m 2 Lay out DU FSI # 39941
Tape measure, 8-m 2 FSI # 39415
Rangefinder, Nikon 1200 7 x 35 1 11−1200 yd Eagle Optic # RAN-NK-8358
Flagging, roll, pink, orange 2 For marking avoidance items FSI # 57905
Collection For field samples
Bags, clean, PE, 15 x 15 in., 6 mil 100 (EPA Level 100 clean) KNF # 300010-02 (LB 106:1515)
or Bags, clean, PE, 17 x 12 in., 6 mil 100 KNF # 300010-02 (LB 106:1217)
Ty-wraps, black, ss tongue 200 For bags and tags M-C # 6614K54
Tags, 2.5 x 5 in. self-laminating 120 Brimar (Ref. Invoice #96886)
Counter, handheld, pushbutton 2 For keeping track of increments M-C # 1707T5
Personnel Protective Equipment Visibility and worker protection
Gloves, latex, diamond-grip 20 Hand protection (sized M, L, or XL) C-P # EW-86231-31, 32, or 33
Vest, surveyors (High-visibility orange)
Site-specific (masks, etc.) Dependent on area of operation
Documentation
Book, recording, level 2 Field sample logging and notes FSI # 49496 (Rite-in-the-Rain ®)
Marker, black, fine-point, permanent 6 Marking bags and tags (Sharpie)
Marker, black, X-fine point 6 Field book and tags
Other
Container, storage, lockable 2 To carry kit (Rubbermaid Action-Packer, 24-gal)
Locks, keyed-alike 4 To lock the storage boxes M-C # 1834A36
Water bottles For personal use
* Quantities shown recommended for each tool;
** Sources: M-C: McMaster-Carr (www.mcmaster.com); AMS: Art's Mfg. & Supply Inc. (ams-samplers.com); FSI: Forestry Suppliers, Inc. (www.forestry-suppliers.com); KNF: KNF Clean Room Products, Corp. (www.knfcorporation.com); Brimar: Brimar Industries Inc. (www.brimar.com); C-P: Cole-Parmer, Inc. (Cole-Parmer.com); GPL: GPL Laboratories, LLLP (gplab.com); Undesignated items are locally available.
ERDC/CRREL TR-11-15 94
Appendix C: Supplies and Equipment needed for Sample Processing C.1 Lab equipment
• Exhaust hood. • HEPA vacuum.
C.2 Air-drying
• Heavy-duty aluminum foil (wide). • Aluminum pans (bakery sheets) 17 ¾ × 25 ¾ × 1 1/8 in. • Baking pan racks.
C.3 Sieving
• No. 10 mesh stainless steel sieve (8-in. diameter). • Stainless steel spoon. • Stainless steel bowl (large enough to hold 8-in.-diameter sieve). • Nitrile gloves. • Bag or jar for oversize fraction. • Bag for ground sample.
C.4 Grinding
• Grinder (LabTech Essa LM2 or equivalent). • Grinding bowls—800-g capacity. • Grinding puck or disk. • Lid (with seal) for grinding bowls.
C.5 Subsampling
• Stainless steel spatulas. • 2-oz wide-mouth amber jars. • Scale (±0.01 g).
C.6 Cleaning
• Concentrated liquid cleaning solution (Micro 90). • Scrubbing pads (3M Scotch Brite, 4 × 6 in.). • Paper wipes (Kimwipes). • Stainless steel brush or picks.
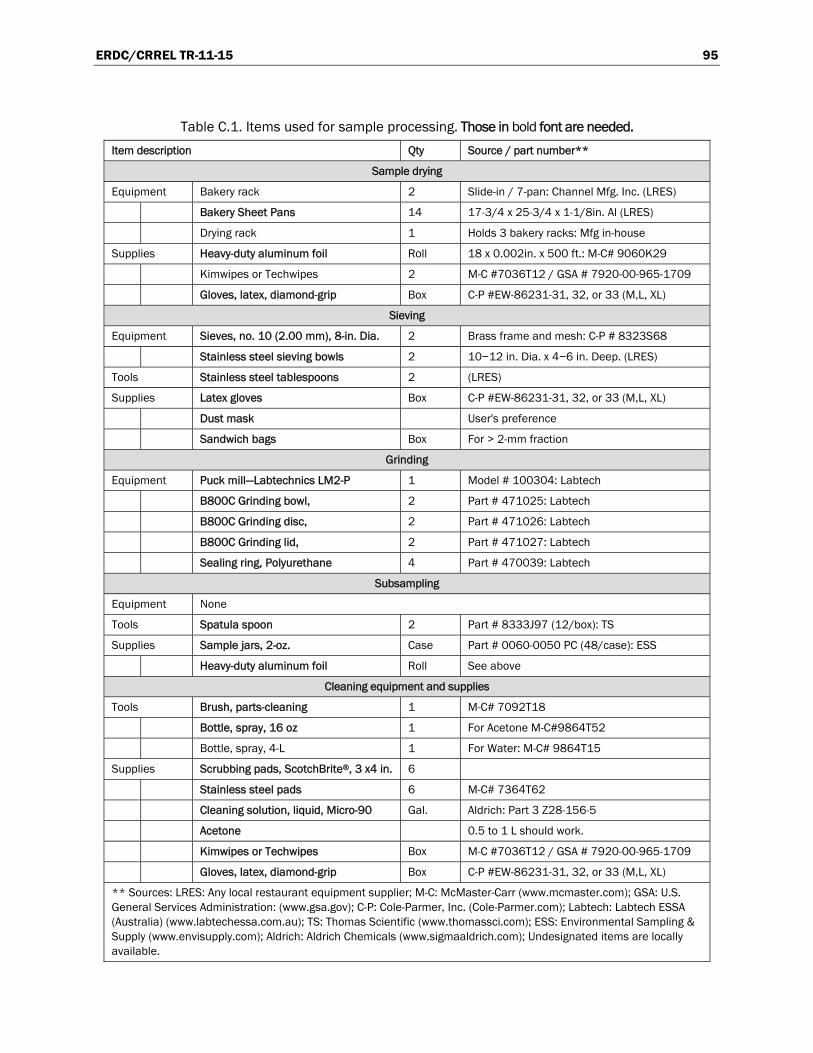
ERDC/CRREL TR-11-15 95
Table C.1. Items used for sample processing. Those in bold font are needed.
Item description Qty Source / part number**
Sample drying
Equipment Bakery rack 2 Slide-in / 7-pan: Channel Mfg. Inc. (LRES)
Bakery Sheet Pans 14 17-3/4 x 25-3/4 x 1-1/8in. Al (LRES)
Drying rack 1 Holds 3 bakery racks: Mfg in-house
Supplies Heavy-duty aluminum foil Roll 18 x 0.002in. x 500 ft.: M-C# 9060K29
Kimwipes or Techwipes 2 M-C #7036T12 / GSA # 7920-00-965-1709
Gloves, latex, diamond-grip Box C-P #EW-86231-31, 32, or 33 (M,L, XL)
Sieving
Equipment Sieves, no. 10 (2.00 mm), 8-in. Dia. 2 Brass frame and mesh: C-P # 8323S68
Stainless steel sieving bowls 2 10−12 in. Dia. x 4−6 in. Deep. (LRES)
Tools Stainless steel tablespoons 2 (LRES)
Supplies Latex gloves Box C-P #EW-86231-31, 32, or 33 (M,L, XL)
Dust mask User's preference
Sandwich bags Box For > 2-mm fraction
Grinding
Equipment Puck mill—Labtechnics LM2-P 1 Model # 100304: Labtech
B800C Grinding bowl, 2 Part # 471025: Labtech
B800C Grinding disc, 2 Part # 471026: Labtech
B800C Grinding lid, 2 Part # 471027: Labtech
Sealing ring, Polyurethane 4 Part # 470039: Labtech
Subsampling
Equipment None
Tools Spatula spoon 2 Part # 8333J97 (12/box): TS
Supplies Sample jars, 2-oz. Case Part # 0060-0050 PC (48/case): ESS
Heavy-duty aluminum foil Roll See above
Cleaning equipment and supplies
Tools Brush, parts-cleaning 1 M-C# 7092T18
Bottle, spray, 16 oz 1 For Acetone M-C#9864T52
Bottle, spray, 4-L 1 For Water: M-C# 9864T15
Supplies Scrubbing pads, ScotchBrite®, 3 x4 in. 6
Stainless steel pads 6 M-C# 7364T62
Cleaning solution, liquid, Micro-90 Gal. Aldrich: Part 3 Z28-156-5
Acetone 0.5 to 1 L should work.
Kimwipes or Techwipes Box M-C #7036T12 / GSA # 7920-00-965-1709
Gloves, latex, diamond-grip Box C-P #EW-86231-31, 32, or 33 (M,L, XL)
** Sources: LRES: Any local restaurant equipment supplier; M-C: McMaster-Carr (www.mcmaster.com); GSA: U.S. General Services Administration: (www.gsa.gov); C-P: Cole-Parmer, Inc. (Cole-Parmer.com); Labtech: Labtech ESSA (Australia) (www.labtechessa.com.au); TS: Thomas Scientific (www.thomassci.com); ESS: Environmental Sampling & Supply (www.envisupply.com); Aldrich: Aldrich Chemicals (www.sigmaaldrich.com); Undesignated items are locally available.
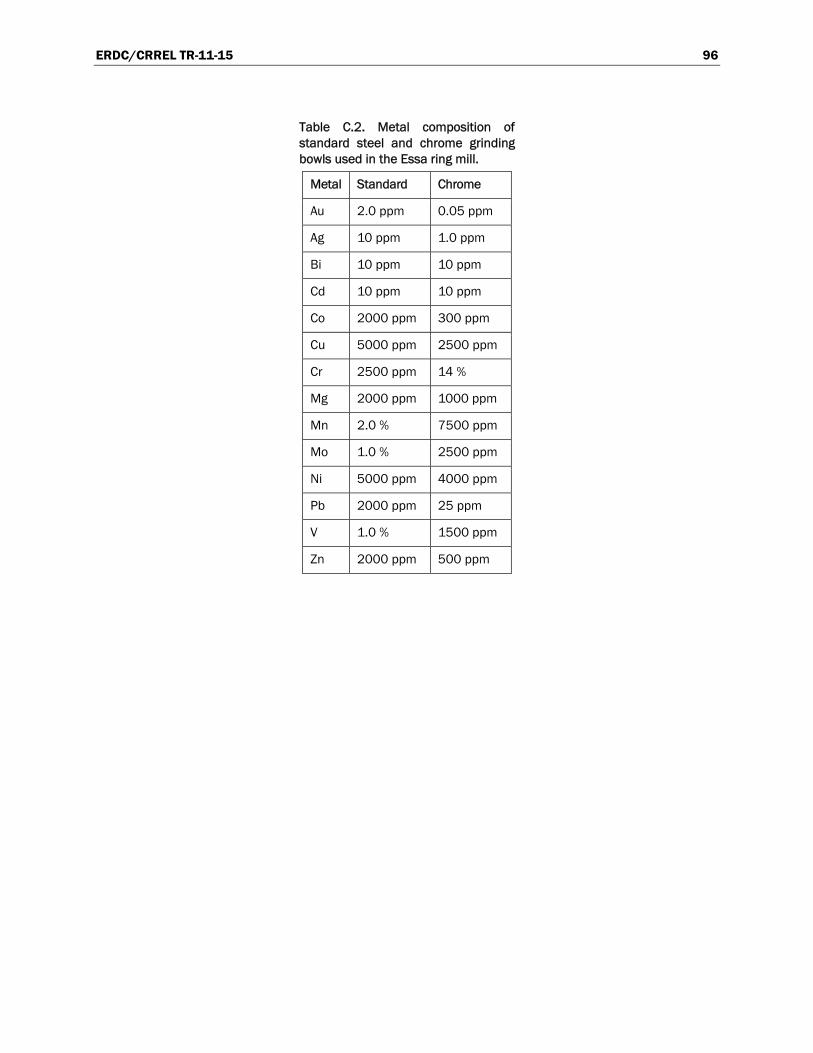
ERDC/CRREL TR-11-15 96
Table C.2. Metal composition of standard steel and chrome grinding bowls used in the Essa ring mill.
Metal Standard Chrome
Au 2.0 ppm 0.05 ppm
Ag 10 ppm 1.0 ppm
Bi 10 ppm 10 ppm
Cd 10 ppm 10 ppm
Co 2000 ppm 300 ppm
Cu 5000 ppm 2500 ppm
Cr 2500 ppm 14 %
Mg 2000 ppm 1000 ppm
Mn 2.0 % 7500 ppm
Mo 1.0 % 2500 ppm
Ni 5000 ppm 4000 ppm
Pb 2000 ppm 25 ppm
V 1.0 % 1500 ppm
Zn 2000 ppm 500 ppm
ERDC/CRREL TR-11-15 97
Appendix D. Field Screening/Field Analysis Techniques
During site characterization, it is often desirable to identify an unknown solid or obtain a quantitative analysis of a suspicious area of soil. Several field screening technologies exist that can reliably identify energetics or estimate their concentrations in soils. The most commonly employed methods are described below.
D.1. Determining if an unknown solid is an energetic compound
Partial (low-order) detonations or ruptured rounds can leave chunks of explosives on the ground. Experienced samplers, UXO technicians, and EOD personnel can often identify these materials visually. Sometimes, however, it is useful to analyze the solid in the field to determine whether it is an explosive and, in some cases, what type of explosive it is. The most often encountered solids at active ranges are TNT, Composition B, Tritonal, and C4.
The EXPRAY kit is the simplest and least expensive technique that qualita-tively identifies explosives. This kit was developed in Israel to identify let-ter bombs and it is distributed in the U.S. by a variety of vendors. The kit comes with three spray cans and some sticky papers (Fig. D.1). The three sprays are used sequentially: the first detects nitroaromatic compounds such as TNT, Tetryl, and 2,4-DNT; the second detects nitramines and ni-trate esters including RDX, HMX, NG, PETN, and NC; while the third tests for inorganic nitrates.
To conduct an analysis, the unknown solid is touched with the sticky pa-per, thereby collecting small particles of the material on the paper. The paper is sprayed with the first can and if a brown color develops, it is a positive test for nitroaromatics, usually TNT. A positive detection could mean that the solid is TNT, Composition B, or Tritonal (Bjella 2005).
To continue the screening, whether you had a positive test with can 1 or not, spray the paper with can 2. If a pinkish color results, the test is posi-tive for nitramines or nitrate esters. Note that the test for nitramines and nitrate esters using can 2 requires that can 1 be sprayed first because the
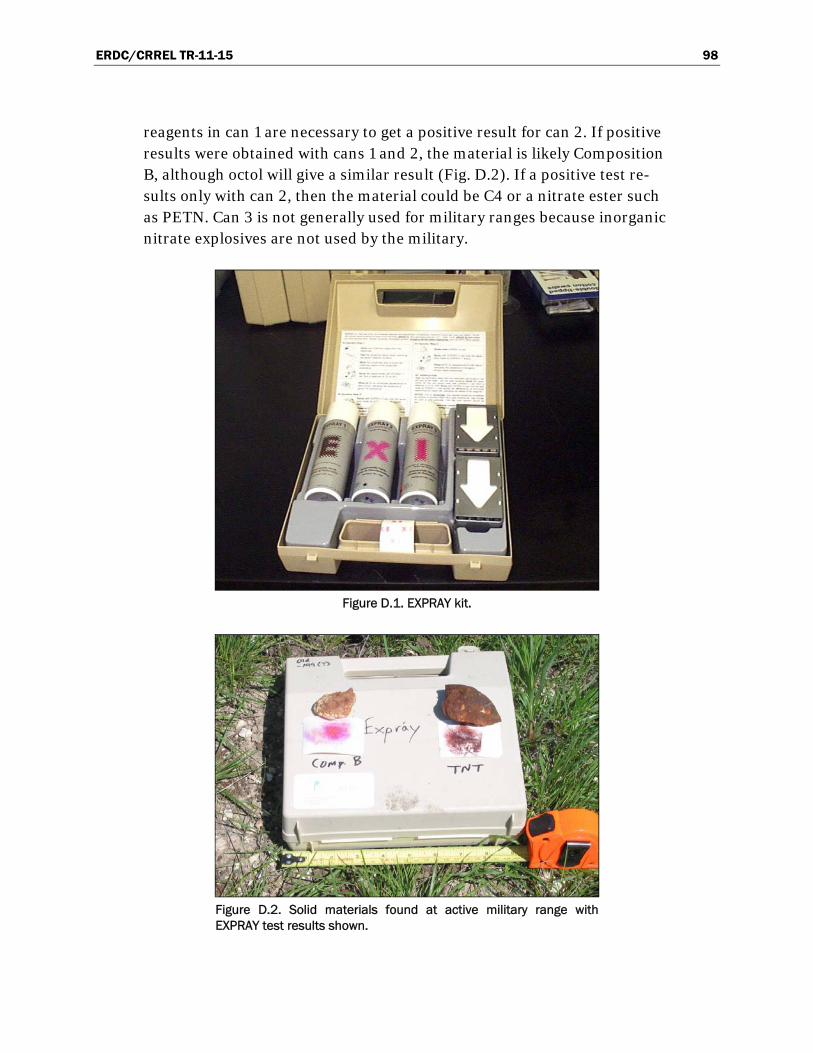
ERDC/CRREL TR-11-15 98
reagents in can 1 are necessary to get a positive result for can 2. If positive results were obtained with cans 1 and 2, the material is likely Composition B, although octol will give a similar result (Fig. D.2). If a positive test re-sults only with can 2, then the material could be C4 or a nitrate ester such as PETN. Can 3 is not generally used for military ranges because inorganic nitrate explosives are not used by the military.
Figure D.1. EXPRAY kit.
Figure D.2. Solid materials found at active military range with EXPRAY test results shown.
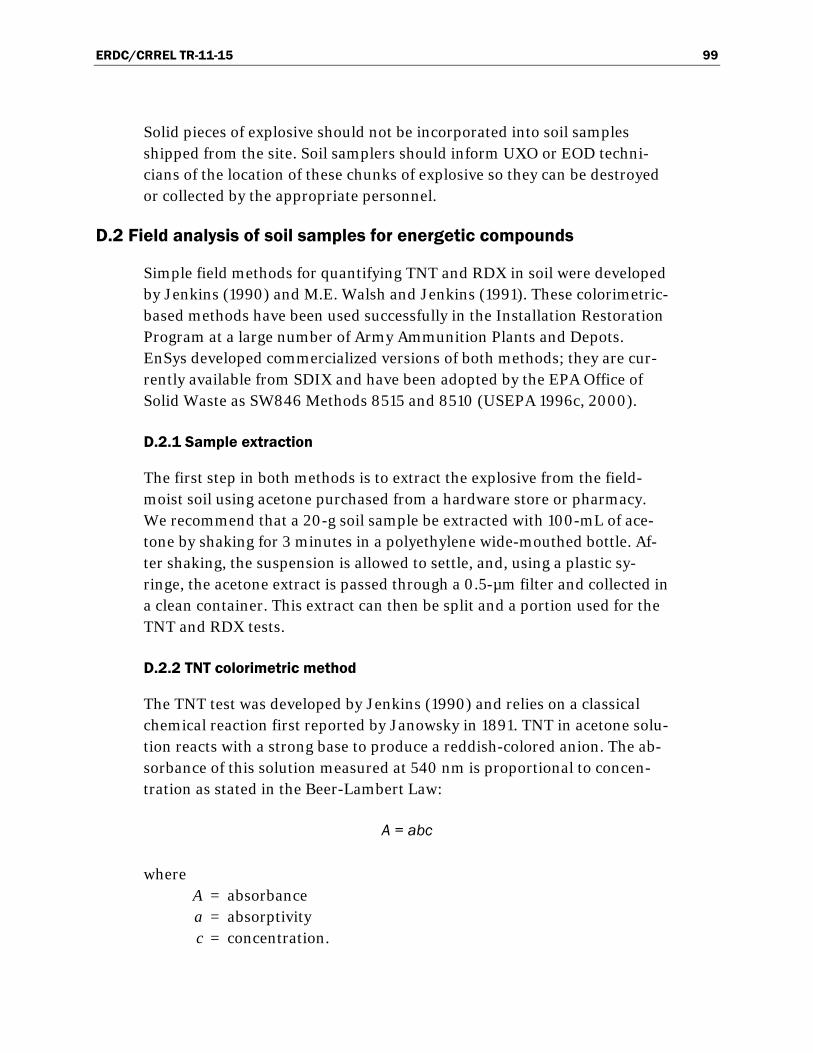
ERDC/CRREL TR-11-15 99
Solid pieces of explosive should not be incorporated into soil samples shipped from the site. Soil samplers should inform UXO or EOD techni-cians of the location of these chunks of explosive so they can be destroyed or collected by the appropriate personnel.
D.2 Field analysis of soil samples for energetic compounds
Simple field methods for quantifying TNT and RDX in soil were developed by Jenkins (1990) and M.E. Walsh and Jenkins (1991). These colorimetric-based methods have been used successfully in the Installation Restoration Program at a large number of Army Ammunition Plants and Depots. EnSys developed commercialized versions of both methods; they are cur-rently available from SDIX and have been adopted by the EPA Office of Solid Waste as SW846 Methods 8515 and 8510 (USEPA 1996c, 2000).
D.2.1 Sample extraction
The first step in both methods is to extract the explosive from the field-moist soil using acetone purchased from a hardware store or pharmacy. We recommend that a 20-g soil sample be extracted with 100-mL of ace-tone by shaking for 3 minutes in a polyethylene wide-mouthed bottle. Af-ter shaking, the suspension is allowed to settle, and, using a plastic sy-ringe, the acetone extract is passed through a 0.5-µm filter and collected in a clean container. This extract can then be split and a portion used for the TNT and RDX tests.
D.2.2 TNT colorimetric method
The TNT test was developed by Jenkins (1990) and relies on a classical chemical reaction first reported by Janowsky in 1891. TNT in acetone solu-tion reacts with a strong base to produce a reddish-colored anion. The ab-sorbance of this solution measured at 540 nm is proportional to concen-tration as stated in the Beer-Lambert Law:
A = abc
where A = absorbance a = absorptivity c = concentration.
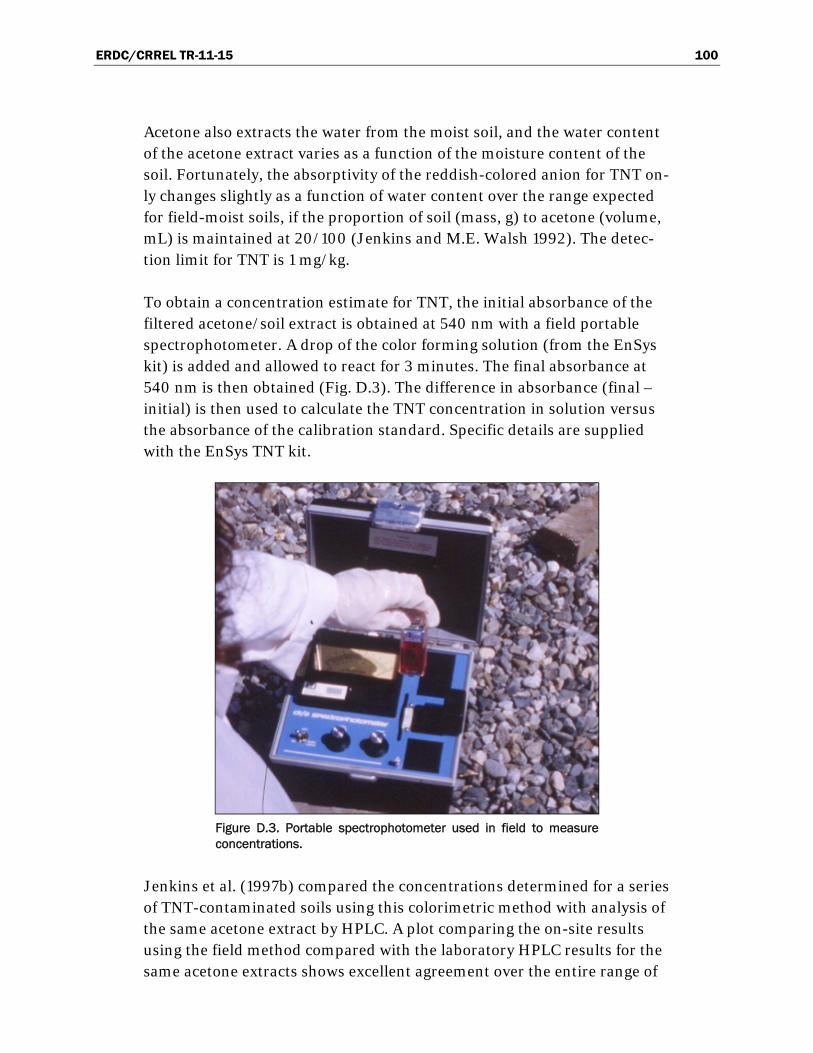
ERDC/CRREL TR-11-15 100
Acetone also extracts the water from the moist soil, and the water content of the acetone extract varies as a function of the moisture content of the soil. Fortunately, the absorptivity of the reddish-colored anion for TNT on-ly changes slightly as a function of water content over the range expected for field-moist soils, if the proportion of soil (mass, g) to acetone (volume, mL) is maintained at 20/100 (Jenkins and M.E. Walsh 1992). The detec-tion limit for TNT is 1 mg/kg.
To obtain a concentration estimate for TNT, the initial absorbance of the filtered acetone/soil extract is obtained at 540 nm with a field portable spectrophotometer. A drop of the color forming solution (from the EnSys kit) is added and allowed to react for 3 minutes. The final absorbance at 540 nm is then obtained (Fig. D.3). The difference in absorbance (final – initial) is then used to calculate the TNT concentration in solution versus the absorbance of the calibration standard. Specific details are supplied with the EnSys TNT kit.
Figure D.3. Portable spectrophotometer used in field to measure concentrations.
Jenkins et al. (1997b) compared the concentrations determined for a series of TNT-contaminated soils using this colorimetric method with analysis of the same acetone extract by HPLC. A plot comparing the on-site results using the field method compared with the laboratory HPLC results for the same acetone extracts shows excellent agreement over the entire range of
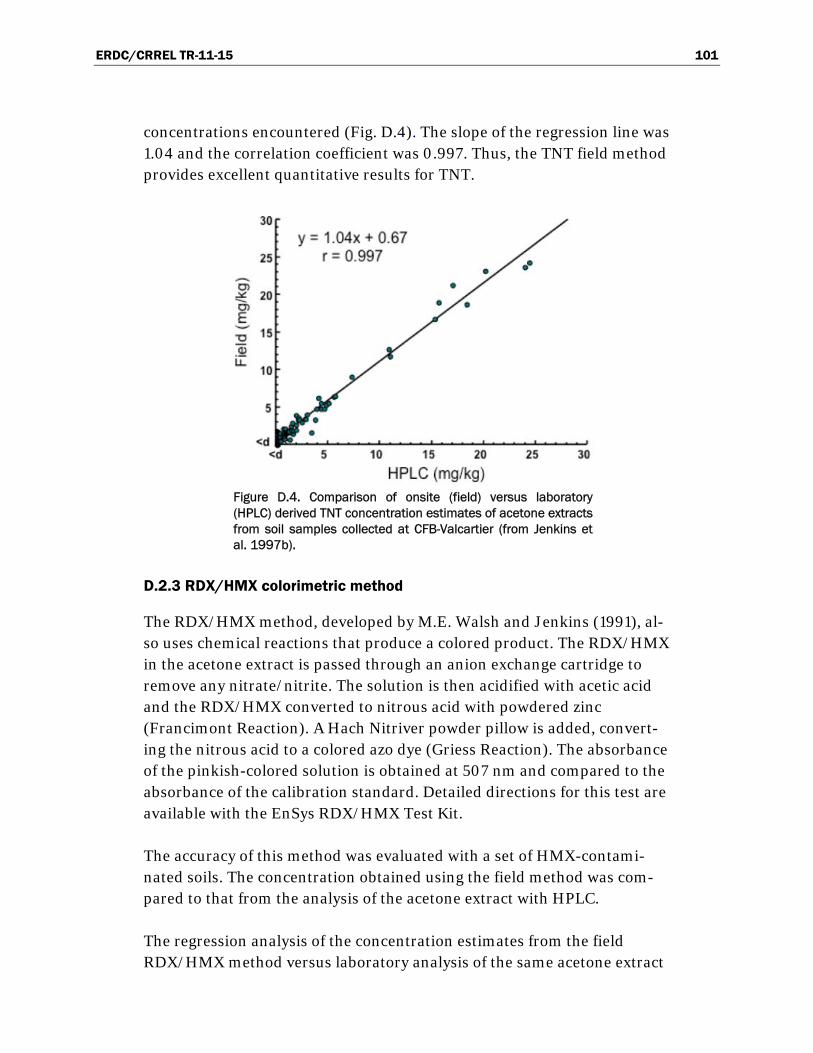
ERDC/CRREL TR-11-15 101
concentrations encountered (Fig. D.4). The slope of the regression line was 1.04 and the correlation coefficient was 0.997. Thus, the TNT field method provides excellent quantitative results for TNT.
Figure D.4. Comparison of onsite (field) versus laboratory (HPLC) derived TNT concentration estimates of acetone extracts from soil samples collected at CFB-Valcartier (from Jenkins et al. 1997b).
D.2.3 RDX/HMX colorimetric method
The RDX/HMX method, developed by M.E. Walsh and Jenkins (1991), al-so uses chemical reactions that produce a colored product. The RDX/HMX in the acetone extract is passed through an anion exchange cartridge to remove any nitrate/nitrite. The solution is then acidified with acetic acid and the RDX/HMX converted to nitrous acid with powdered zinc (Francimont Reaction). A Hach Nitriver powder pillow is added, convert-ing the nitrous acid to a colored azo dye (Griess Reaction). The absorbance of the pinkish-colored solution is obtained at 507 nm and compared to the absorbance of the calibration standard. Detailed directions for this test are available with the EnSys RDX/HMX Test Kit.
The accuracy of this method was evaluated with a set of HMX-contami-nated soils. The concentration obtained using the field method was com-pared to that from the analysis of the acetone extract with HPLC.
The regression analysis of the concentration estimates from the field RDX/HMX method versus laboratory analysis of the same acetone extract
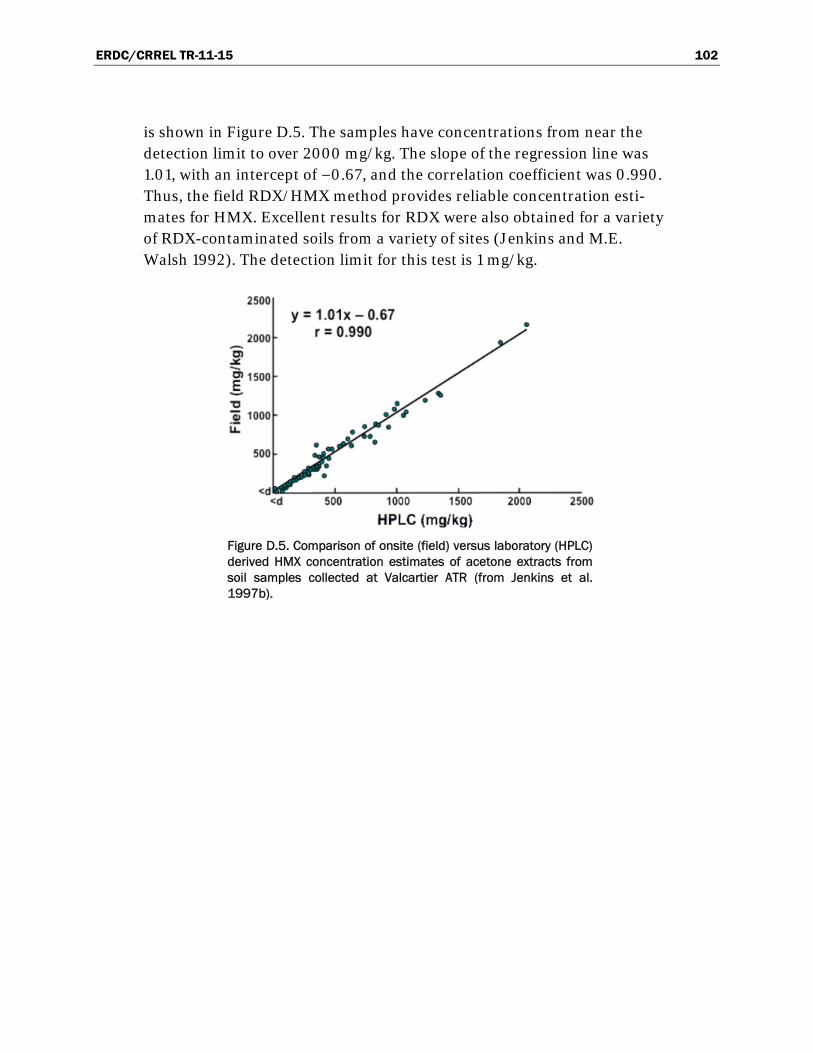
ERDC/CRREL TR-11-15 102
is shown in Figure D.5. The samples have concentrations from near the detection limit to over 2000 mg/kg. The slope of the regression line was 1.01, with an intercept of −0.67, and the correlation coefficient was 0.990. Thus, the field RDX/HMX method provides reliable concentration esti-mates for HMX. Excellent results for RDX were also obtained for a variety of RDX-contaminated soils from a variety of sites (Jenkins and M.E. Walsh 1992). The detection limit for this test is 1 mg/kg.
Figure D.5. Comparison of onsite (field) versus laboratory (HPLC) derived HMX concentration estimates of acetone extracts from soil samples collected at Valcartier ATR (from Jenkins et al. 1997b).
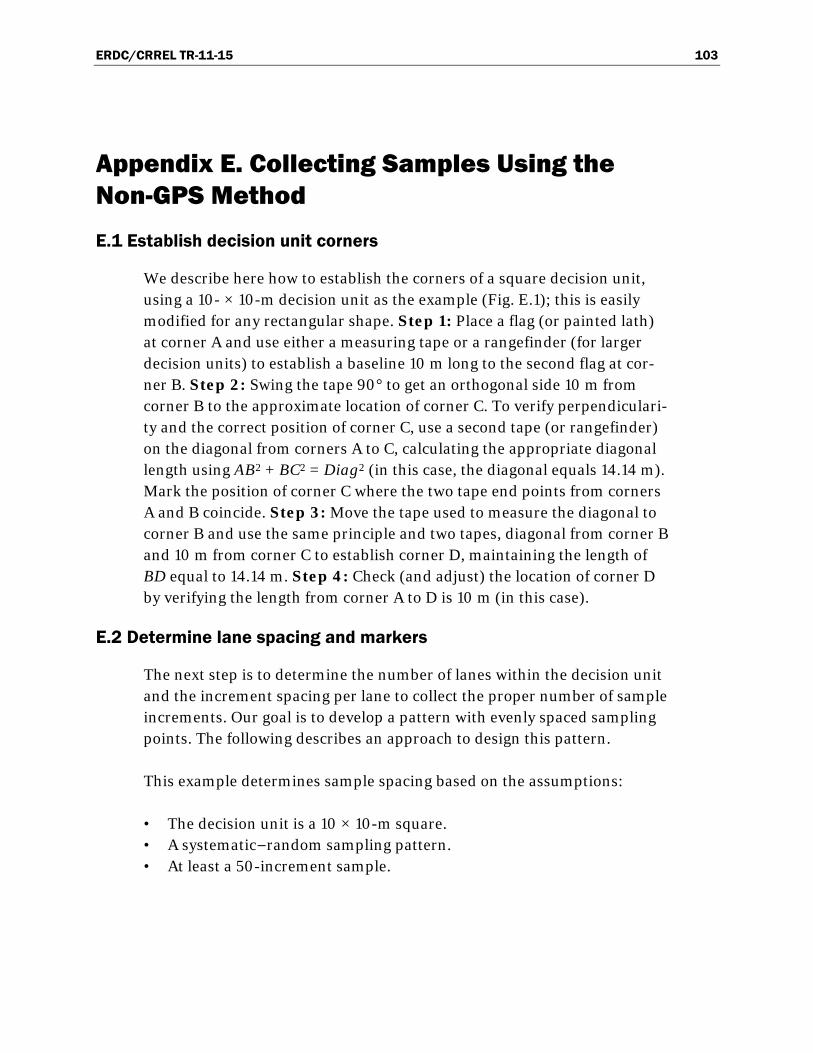
ERDC/CRREL TR-11-15 103
Appendix E. Collecting Samples Using the Non-GPS Method
E.1 Establish decision unit corners
We describe here how to establish the corners of a square decision unit, using a 10- × 10-m decision unit as the example (Fig. E.1); this is easily modified for any rectangular shape. Step 1: Place a flag (or painted lath) at corner A and use either a measuring tape or a rangefinder (for larger decision units) to establish a baseline 10 m long to the second flag at cor-ner B. Step 2: Swing the tape 90° to get an orthogonal side 10 m from corner B to the approximate location of corner C. To verify perpendiculari-ty and the correct position of corner C, use a second tape (or rangefinder) on the diagonal from corners A to C, calculating the appropriate diagonal length using AB2 + BC2 = Diag2 (in this case, the diagonal equals 14.14 m). Mark the position of corner C where the two tape end points from corners A and B coincide. Step 3: Move the tape used to measure the diagonal to corner B and use the same principle and two tapes, diagonal from corner B and 10 m from corner C to establish corner D, maintaining the length of BD equal to 14.14 m. Step 4: Check (and adjust) the location of corner D by verifying the length from corner A to D is 10 m (in this case).
E.2 Determine lane spacing and markers
The next step is to determine the number of lanes within the decision unit and the increment spacing per lane to collect the proper number of sample increments. Our goal is to develop a pattern with evenly spaced sampling points. The following describes an approach to design this pattern.
This example determines sample spacing based on the assumptions:
• The decision unit is a 10 × 10-m square. • A systematic−random sampling pattern. • At least a 50-increment sample.
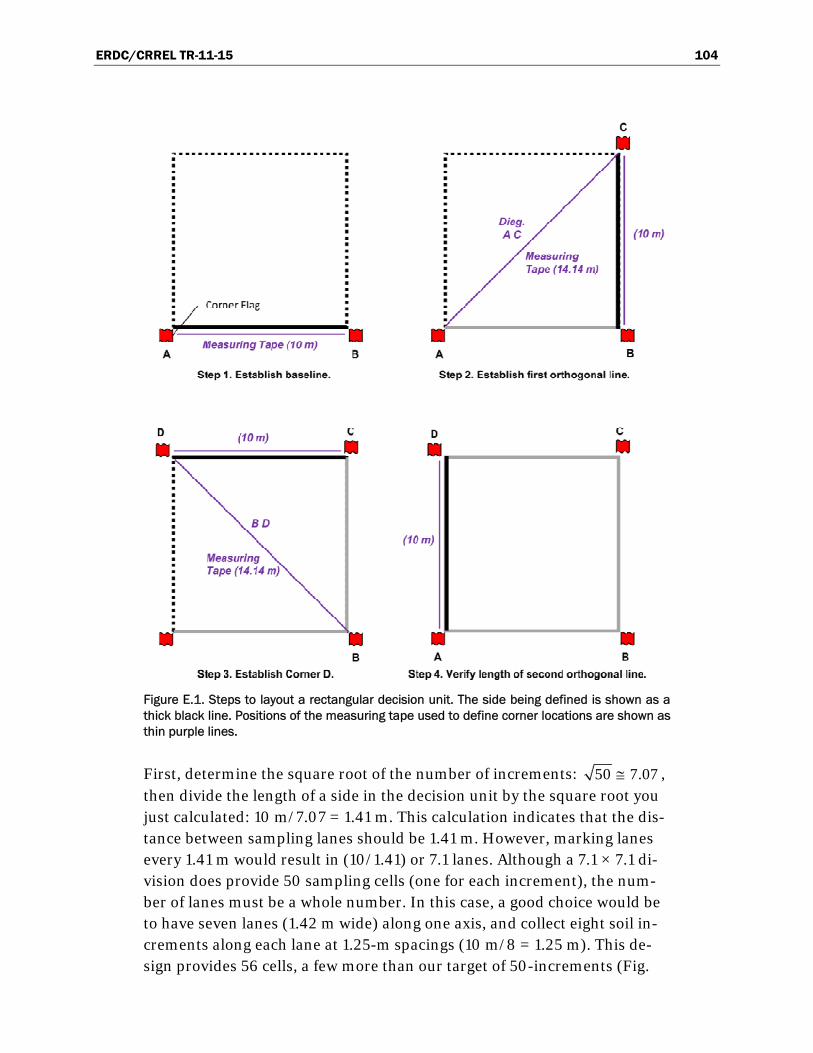
ERDC/CRREL TR-11-15 104
Figure E.1. Steps to layout a rectangular decision unit. The side being defined is shown as a thick black line. Positions of the measuring tape used to define corner locations are shown as thin purple lines.
First, determine the square root of the number of increments: , then divide the length of a side in the decision unit by the square root you just calculated: 10 m/7.07 = 1.41 m. This calculation indicates that the dis-tance between sampling lanes should be 1.41 m. However, marking lanes every 1.41 m would result in (10/1.41) or 7.1 lanes. Although a 7.1 × 7.1 di-vision does provide 50 sampling cells (one for each increment), the num-ber of lanes must be a whole number. In this case, a good choice would be to have seven lanes (1.42 m wide) along one axis, and collect eight soil in-crements along each lane at 1.25-m spacings (10 m/8 = 1.25 m). This de-sign provides 56 cells, a few more than our target of 50-increments (Fig.
50 7.07
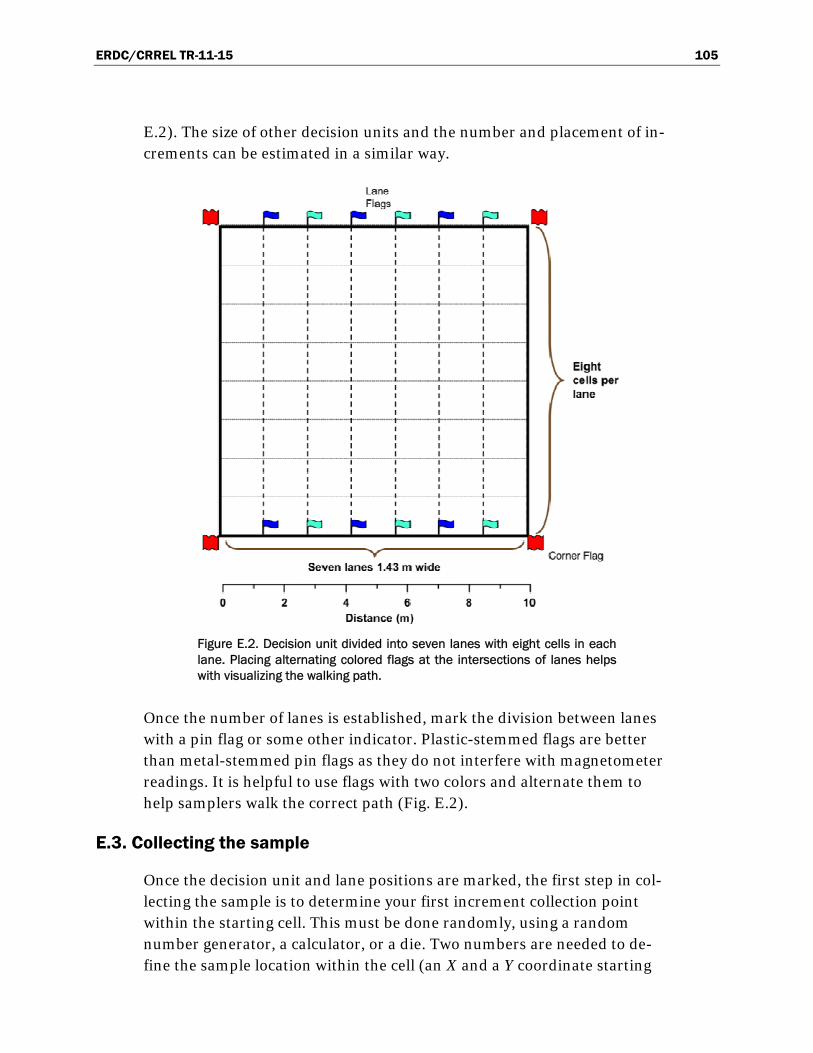
ERDC/CRREL TR-11-15 105
E.2). The size of other decision units and the number and placement of in-crements can be estimated in a similar way.
Figure E.2. Decision unit divided into seven lanes with eight cells in each lane. Placing alternating colored flags at the intersections of lanes helps with visualizing the walking path.
Once the number of lanes is established, mark the division between lanes with a pin flag or some other indicator. Plastic-stemmed flags are better than metal-stemmed pin flags as they do not interfere with magnetometer readings. It is helpful to use flags with two colors and alternate them to help samplers walk the correct path (Fig. E.2).
E.3. Collecting the sample
Once the decision unit and lane positions are marked, the first step in col-lecting the sample is to determine your first increment collection point within the starting cell. This must be done randomly, using a random number generator, a calculator, or a die. Two numbers are needed to de-fine the sample location within the cell (an X and a Y coordinate starting
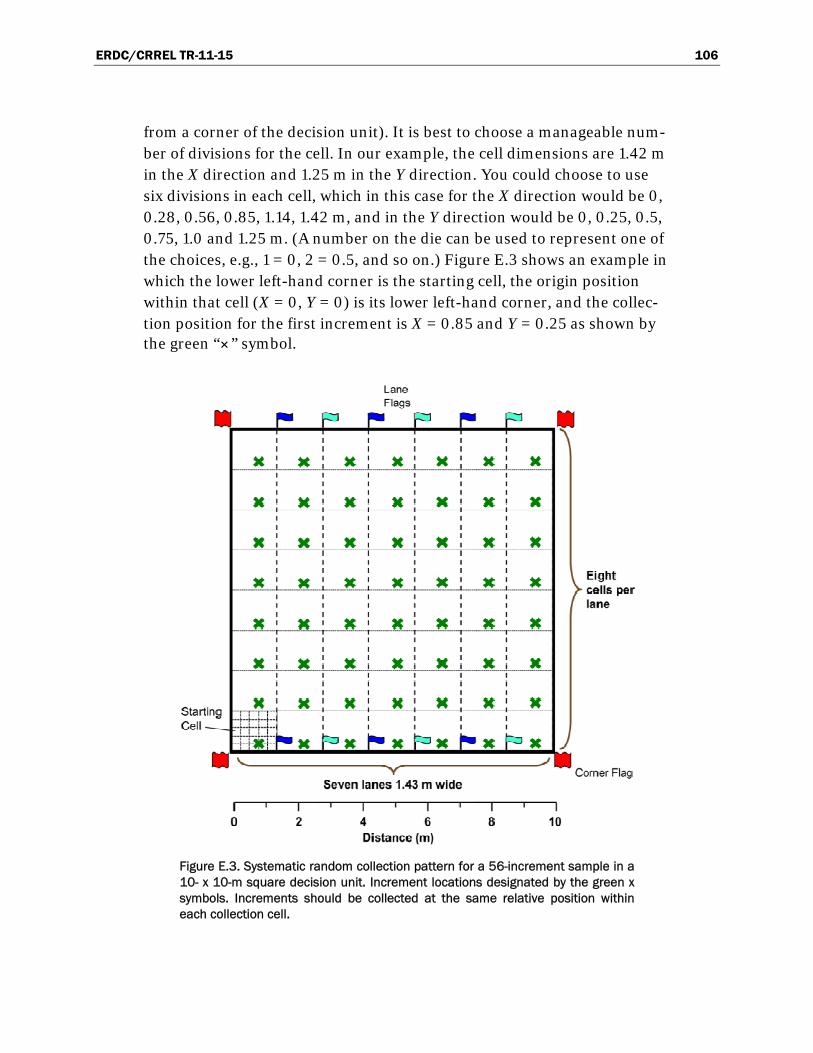
ERDC/CRREL TR-11-15 106
from a corner of the decision unit). It is best to choose a manageable num-ber of divisions for the cell. In our example, the cell dimensions are 1.42 m in the X direction and 1.25 m in the Y direction. You could choose to use six divisions in each cell, which in this case for the X direction would be 0, 0.28, 0.56, 0.85, 1.14, 1.42 m, and in the Y direction would be 0, 0.25, 0.5, 0.75, 1.0 and 1.25 m. (A number on the die can be used to represent one of the choices, e.g., 1 = 0, 2 = 0.5, and so on.) Figure E.3 shows an example in which the lower left-hand corner is the starting cell, the origin position within that cell (X = 0, Y = 0) is its lower left-hand corner, and the collec-tion position for the first increment is X = 0.85 and Y = 0.25 as shown by the green “×” symbol.
Figure E.3. Systematic random collection pattern for a 56-increment sample in a 10- x 10-m square decision unit. Increment locations designated by the green x symbols. Increments should be collected at the same relative position within each collection cell.
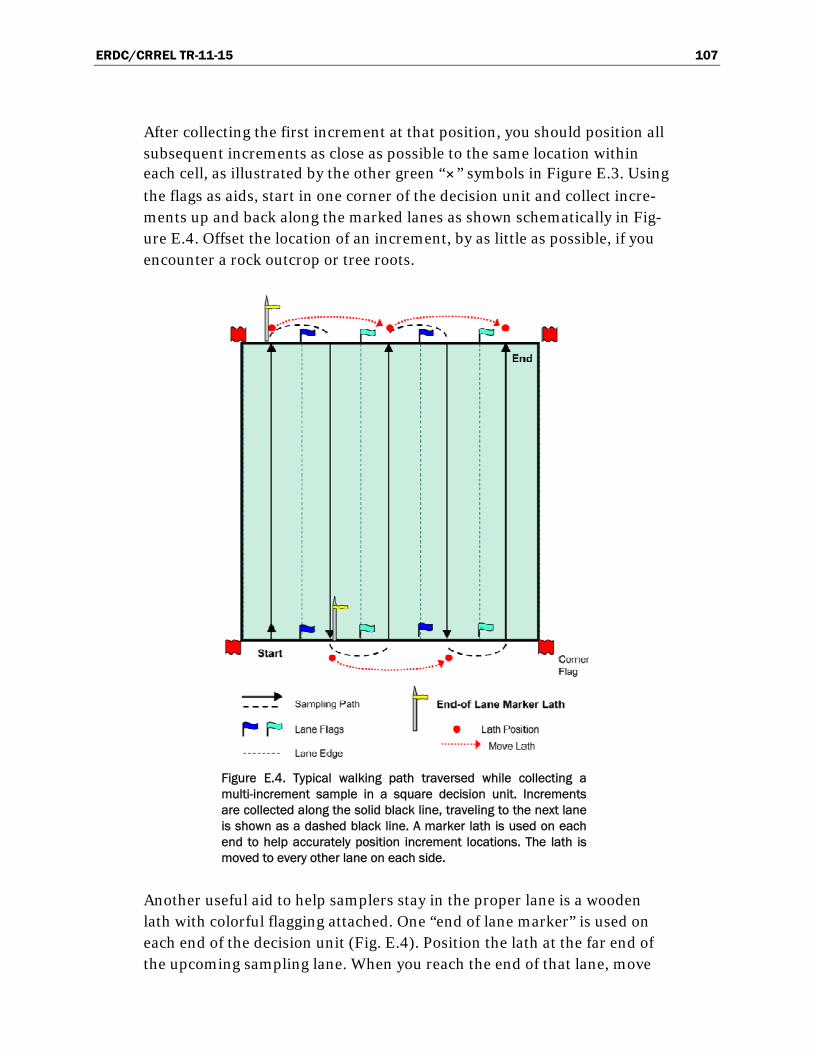
ERDC/CRREL TR-11-15 107
After collecting the first increment at that position, you should position all subsequent increments as close as possible to the same location within each cell, as illustrated by the other green “×” symbols in Figure E.3. Using
the flags as aids, start in one corner of the decision unit and collect incre-ments up and back along the marked lanes as shown schematically in Fig-ure E.4. Offset the location of an increment, by as little as possible, if you encounter a rock outcrop or tree roots.
Figure E.4. Typical walking path traversed while collecting a multi-increment sample in a square decision unit. Increments are collected along the solid black line, traveling to the next lane is shown as a dashed black line. A marker lath is used on each end to help accurately position increment locations. The lath is moved to every other lane on each side.
Another useful aid to help samplers stay in the proper lane is a wooden lath with colorful flagging attached. One “end of lane marker” is used on each end of the decision unit (Fig. E.4). Position the lath at the far end of the upcoming sampling lane. When you reach the end of that lane, move

ERDC/CRREL TR-11-15 108
the lath two lanes over before collecting down the adjacent lane, as shown in Figure E4. End of lane markers are especially helpful for sampling deci-sion units with uneven terrain or tall vegetation but we use them routinely as they save time and help the samplers follow their lane.
REPORT DOCUMENTATION PAGE Form Approved
OMB No. 0704-0188 Public reporting burden for this collection of information is estimated to average 1 hour per response, including the time for reviewing instructions, searching existing data sources, gathering and maintaining the data needed, and completing and reviewing this collection of information. Send comments regarding this burden estimate or any other aspect of this collection of information, including suggestions for reducing this burden to Department of Defense, Washington Headquarters Services, Directorate for Information Operations and Reports (0704-0188), 1215 Jefferson Davis Highway, Suite 1204, Arlington, VA 22202-4302. Respondents should be aware that notwithstanding any other provision of law, no person shall be subject to any penalty for failing to comply with a collection of information if it does not display a currently valid OMB control number. PLEASE DO NOT RETURN YOUR FORM TO THE ABOVE ADDRESS.
1. REPORT DATE (DD-MM-YYYY) October 2011
2. REPORT TYPE Technical Report
3. DATES COVERED (From - To)
4. TITLE AND SUBTITLE
Guidance for Soil Sampling for Energetics and Metals
5a. CONTRACT NUMBER
5b. GRANT NUMBER
5c. PROGRAM ELEMENT NUMBER
6. AUTHOR(S)
Susan Taylor, Thomas F. Jenkins, Susan Bigl, Alan D. Hewitt, Marianne E. Walsh and Michael R. Walsh
5d. PROJECT NUMBER
5e. TASK NUMBER
5f. WORK UNIT NUMBER
7. PERFORMING ORGANIZATION NAME(S) AND ADDRESS(ES) 8. PERFORMING ORGANIZATION REPORT NUMBER
Cold regions Research and Engineering Laboratory U.S. Army Engineer Research and Development Center 72 Lyme Road Hanover, NH 03755
ERDC/CRREL TR-11-15
9. SPONSORING / MONITORING AGENCY NAME(S) AND ADDRESS(ES) 10. SPONSOR/MONITOR’S ACRONYM(S)
U.S. Army Environmental Command
11. SPONSOR/MONITOR’S REPORT NUMBER(S)
12. DISTRIBUTION / AVAILABILITY STATEMENT Approved for public release; distribution is unlimited.
13. SUPPLEMENTARY NOTES
14. ABSTRACT
Information is presented on how to collect and process soil samples to quantify explosives, propellants and metals from training range soils. This document outlines how to estimate the average concentration of energetic compounds and metals in soils and determine the error in the estimated concentration.
15. SUBJECT TERMS
Energetic compounds Explosives
Metals pollution Process soil samples Propellants
Remedial investigation Soil sample collection UXO
16. SECURITY CLASSIFICATION OF: 17. LIMITATION OF ABSTRACT
18. NUMBER OF PAGES
19a. NAME OF RESPONSIBLE PERSON
a. REPORT
U
b. ABSTRACT
U
c. THIS PAGE
U none 124 19b. TELEPHONE NUMBER (include area code)
Standard Form 298 (Rev. 8-98)Prescribed by ANSI Std. 239.18