Embed Size (px)
Citation preview

1
HAILEY WOODSUrban Planning Portfolio
2 3
CONTACT INFORMATION 1212 W. Rex StreetMuncie, Indiana [email protected](502) 468-2030
EDUCATIONBachelors of Urban Planning and DevelopmentBall State UniversityHistoric Preservation Minor
SKILLSSoftware • ArcGIS• InDesign• Photoshop• MicrosoftOffice• Community Analyst by ESRI • SketchUP
Urban Planning • Conducting site analysis• Researching and analyzing
census data • Developing alternative
solutions • Writing initiatives, memos,
and reports• Creating goals and
objectives • Collaborating with
community members • Public Participation • Public Speaking
RELEvANT ExpERIENCE FloydCountyPlanningOfficeMay 2016-August 2016Planning Intern
• Contributed demographic research and analysis for updated comprehensive plan
• Designed document template using InDesign for the Comprehensive Plan
• Developed alternative site plans for a community center and baseball park
Bachelors of Urban Planning and Development Capstone ProjectAugust 2016-December 2016 PLAN 401 Field Studio
• Served on a team of students to create an Urban Redevelopment Plan for the City of Portland, Indiana
• Conducted surveys and interviews with residents
• Participated in 4 community meetings throughout the semester
JOB ExpERIENCE Chillers Microcreamery May 2011-August 2016 - Shift Manager Responsibilities include overseeing co-workers, customer service, handling complaints and solving problems, and training new employees
Emens Auditorium August 2014-Current - Ticket Sales Associate Responsibilities included interacting with the community, customer service, answering phones, and sales
REFERENCESDon LoppDirector of Planning and Operations(812) 948-4110 [email protected] Trevor YoungOwner of Chillers Microcreamery(812) [email protected]
Lisa Dunaway, AICP, LEED APInstructor of Urban Planning (765) 285-1906 [email protected]
Hailey Woods
4 5
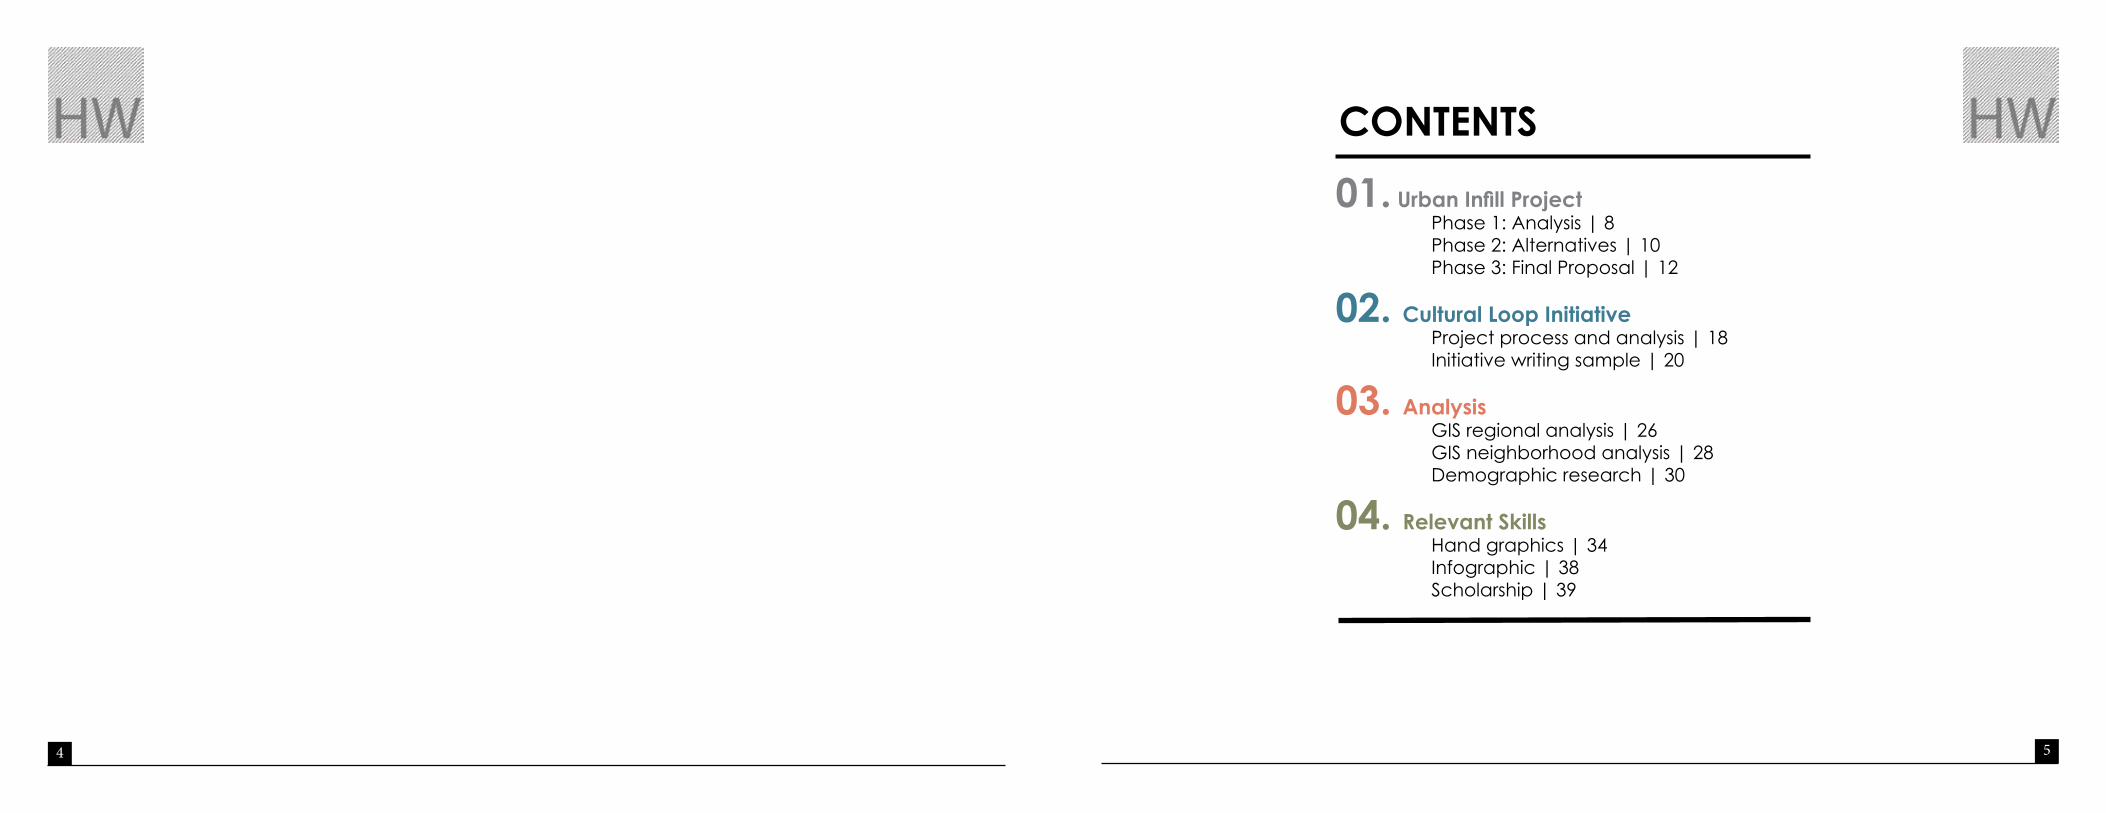
01. Urban Infill Project Phase 1: Analysis | 8 Phase 2: Alternatives | 10 Phase 3: Final Proposal | 12
02. Cultural Loop Initiative Project process and analysis | 18 Initiative writing sample | 20
03. Analysis GIS regional analysis | 26 GIS neighborhood analysis | 28 Demographic research | 30
04. Relevant Skills Hand graphics | 34 Infographic | 38 Scholarship | 39
CONTENTS
6
a
7
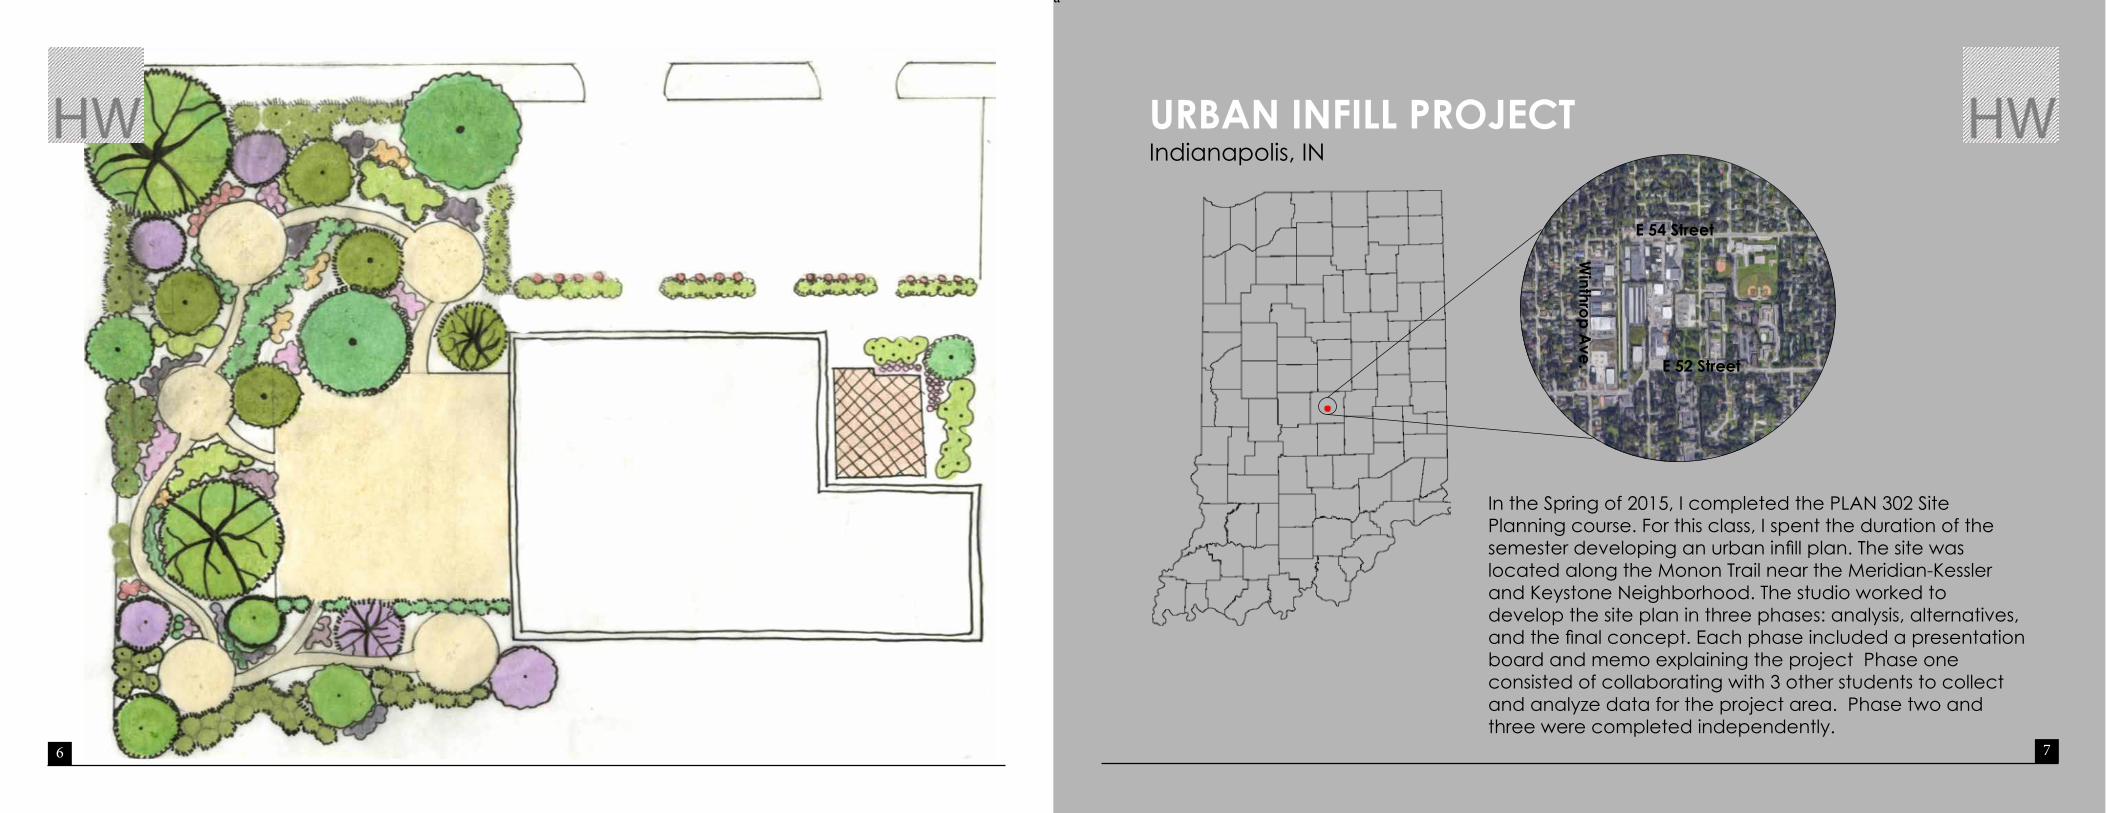
URBAN INFILL pROJECTIndianapolis, IN
In the Spring of 2015, I completed the PLAN 302 Site Planning course. For this class, I spent the duration of the semesterdevelopinganurbaninfillplan.Thesitewaslocated along the Monon Trail near the Meridian-Kessler and Keystone Neighborhood. The studio worked to develop the site plan in three phases: analysis, alternatives, andthefinalconcept.Eachphaseincludedapresentationboard and memo explaining the project Phase one consisted of collaborating with 3 other students to collect and analyze data for the project area. Phase two and three were completed independently.
E 54 Street
E 52 Street
Winthrop A
ve.

8 9
Site Planning + Monon Trail, Indianapolis
The main objective for the analysis phase was to understand the context of the site physically, socially, economically, and politically. As a part of phase one, I collborated with 3 other classmates in researching and analyzing the data that was collected. We conducted anaylsis on demographic data, landuse and parcel data, greenway connections, and structure surveys. Also, research on sun and wind factors along with water and drainage was completed and used for future design considerations. Due to space, much of the analysis conducted was left out of this portfolio in order to display a wider variety of skills.
Location map by Austin Lawrence
PHASE 1- ANALYSIS
Structure Survey Land Use Inventory

10 11
Units Sq. ft per unit
Total (Sq. ft) Parking
Apartment1Bedroom
200 600 120,000
Apartment2 Bedrooms
300 1,000 300,000
Apartment 3 Bedrooms
300 1,400 420,000
Townhouse2 Bedrooms
130 2,000 260,000
Total 1030 - 1,100,000 1030 Spaces
Commercial 447,423 900 Spaces
Units Sq. ft per unit
Total (Sq. ft) Parking
Apartment1Bedroom
200 600 120,000
Apartment2 Bedrooms
300 1,000 300,000
Apartment 3 Bedrooms
300 1,400 420,000
Townhouse2 Bedrooms
130 2,000 260,000
Total 1030 - 1,100,000 1030 Spaces
Commercial 447,423 900 Spaces
Units Sq. ft. per unit
Total (Sq. ft) Parking
Apartment1 Bedroom
1,400 600 84,000
Apartment 2 Bedroom
1,800 1,000 1,800,000
Apartment 3 Bedroom
1,000 1,400 1,400,000
Total 4,200 3,284,000 4,200 Spaces
Commercial 1,500,000 4,500 Spaces
OPTION 1- Low Density
OPTION 2- Middle Density
OPTION 3- High Density
Design Objectives:1. Address the trail with store front access2. Create pedestrian friendly environment 3. Focus retail and open space along Monon Trail
Design Objectives:1. Create a plaza to act as a central node2. Create a radiating order outward from the central plaza3. Generate pedestrian paths that provide access throughout the site and intersect at the central node
Design Objectives:1. Create pedestrian boulevard throughout the site2. Provide community garden and plaza to act as view corridors3. Provide shared courtyards for residential areas
PHASE 2- ALTERNATIVES

12 13
Units Sq. ft. per unit
Total(Sq. Ft.)
Parking
Apartment 1Bedroom
591 600 354,600
Apartment 2Bedrooms
664 900 597,600
Townhouse 2 Bedrooms
187 1200 224400
Zero Lot Line Homes
60 1,700 102,000
Total 1,502 1505Spaces
Commercial 362,000 800 Spaces
Monon Manor was designed around three objectives involving a pedestrian boulevard, a central plaza node, and enhancing walkability.ThefinalrecommendationforMononManoristocreate a multigenerational environment by providing various housing types in a low density setting.
PHASE 3- FINAL PROPOSAL
As a part of the assignment, I was asked to create a block typology and “stamp” the design through the site. The block detail includes mixed use features with retail space on the ground level with residential space above. Each corner is setback to create small public gathering spaces. Parking is accessed from an alley behind the structures.
This graphic correlates with the block typology. This provides a more detailed image of the corner gathering spaces. Store fronts are setback in order to invite visitors into the space. The small spaces will serve as a plaza with landscaping to act as a sound and safety buffer from passingtraffic.
BLOCK DETAIL
CORNER PLAZA
The last phase of the project focused of developing a central place, block typologies, and gateways. Development of place, along with the composition of space, activity and paths were the primary factors considered while composingthefinalplan.
14 15
CENTRAL GATHERING
SPACE
GATEWAYS
CO
NC
EPTU
AL
THIN
KIN
G
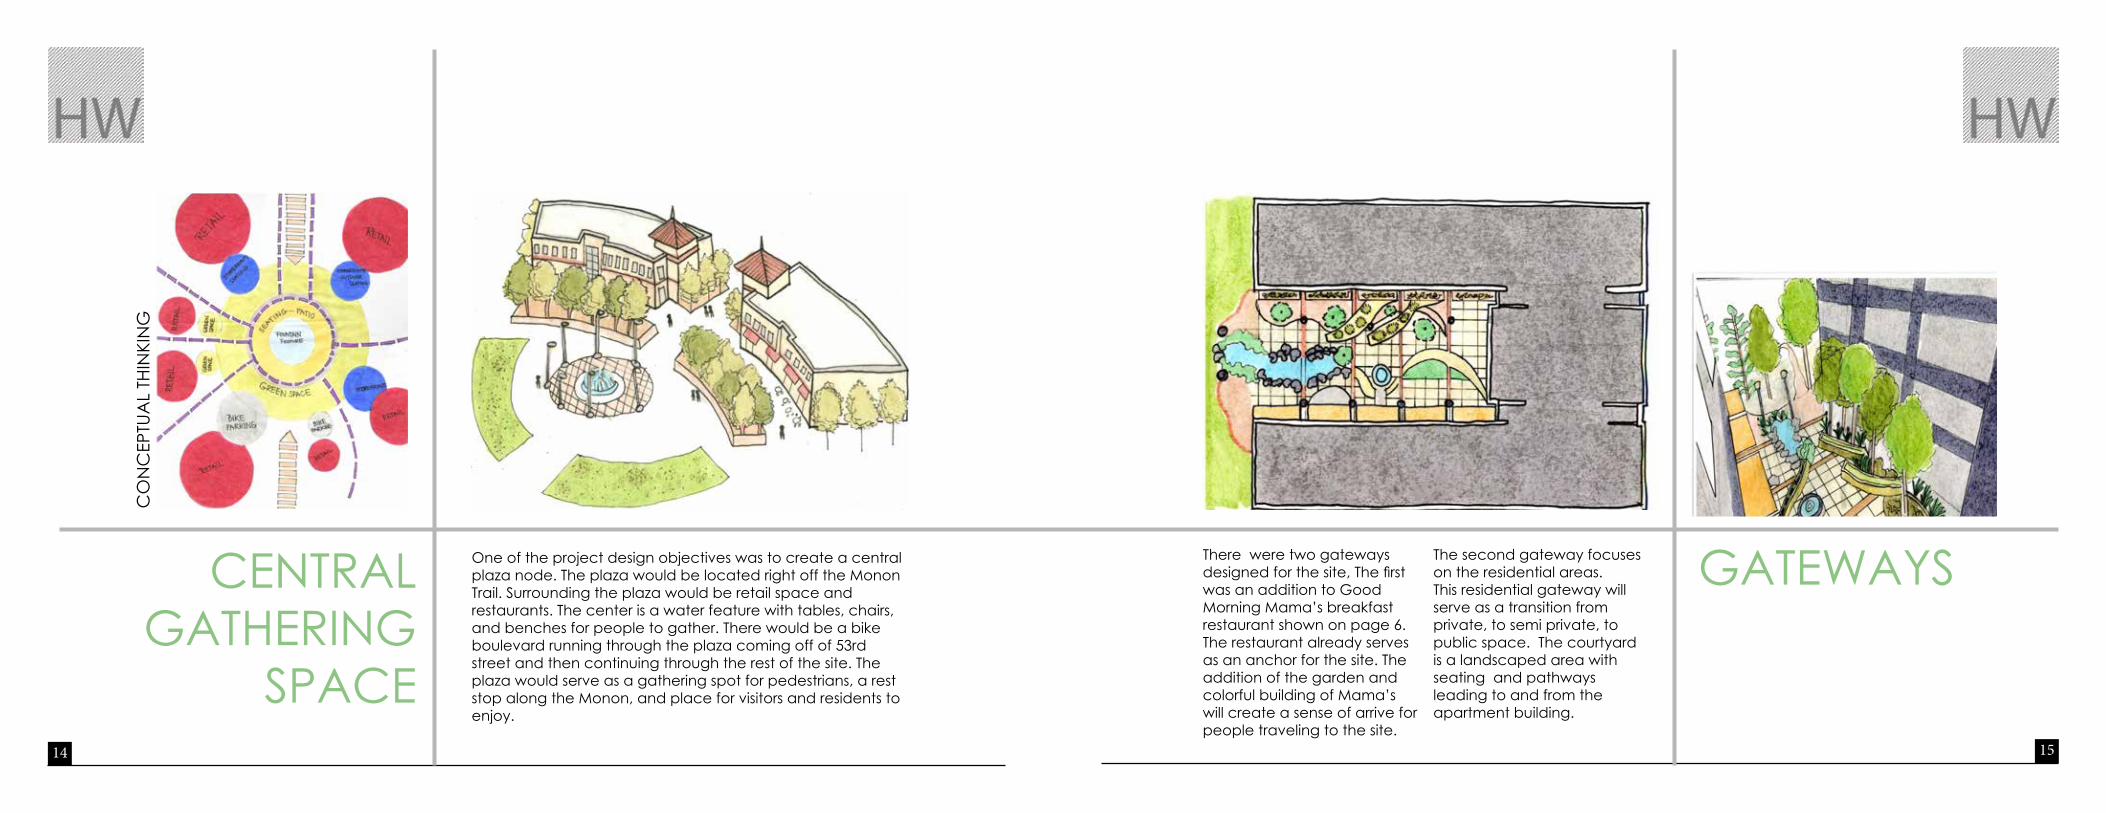
One of the project design objectives was to create a central plaza node. The plaza would be located right off the Monon Trail. Surrounding the plaza would be retail space and restaurants. The center is a water feature with tables, chairs, and benches for people to gather. There would be a bike boulevard running through the plaza coming off of 53rd street and then continuing through the rest of the site. The plaza would serve as a gathering spot for pedestrians, a rest stop along the Monon, and place for visitors and residents to enjoy.
There were two gateways designedforthesite,Thefirstwas an addition to Good Morning Mama’s breakfast restaurant shown on page 6. The restaurant already serves as an anchor for the site. The addition of the garden and colorful building of Mama’s will create a sense of arrive for people traveling to the site.
The second gateway focuses on the residential areas. This residential gateway will serve as a transition from private, to semi private, to public space. The courtyard is a landscaped area with seating and pathways leading to and from the apartment building.
16 17
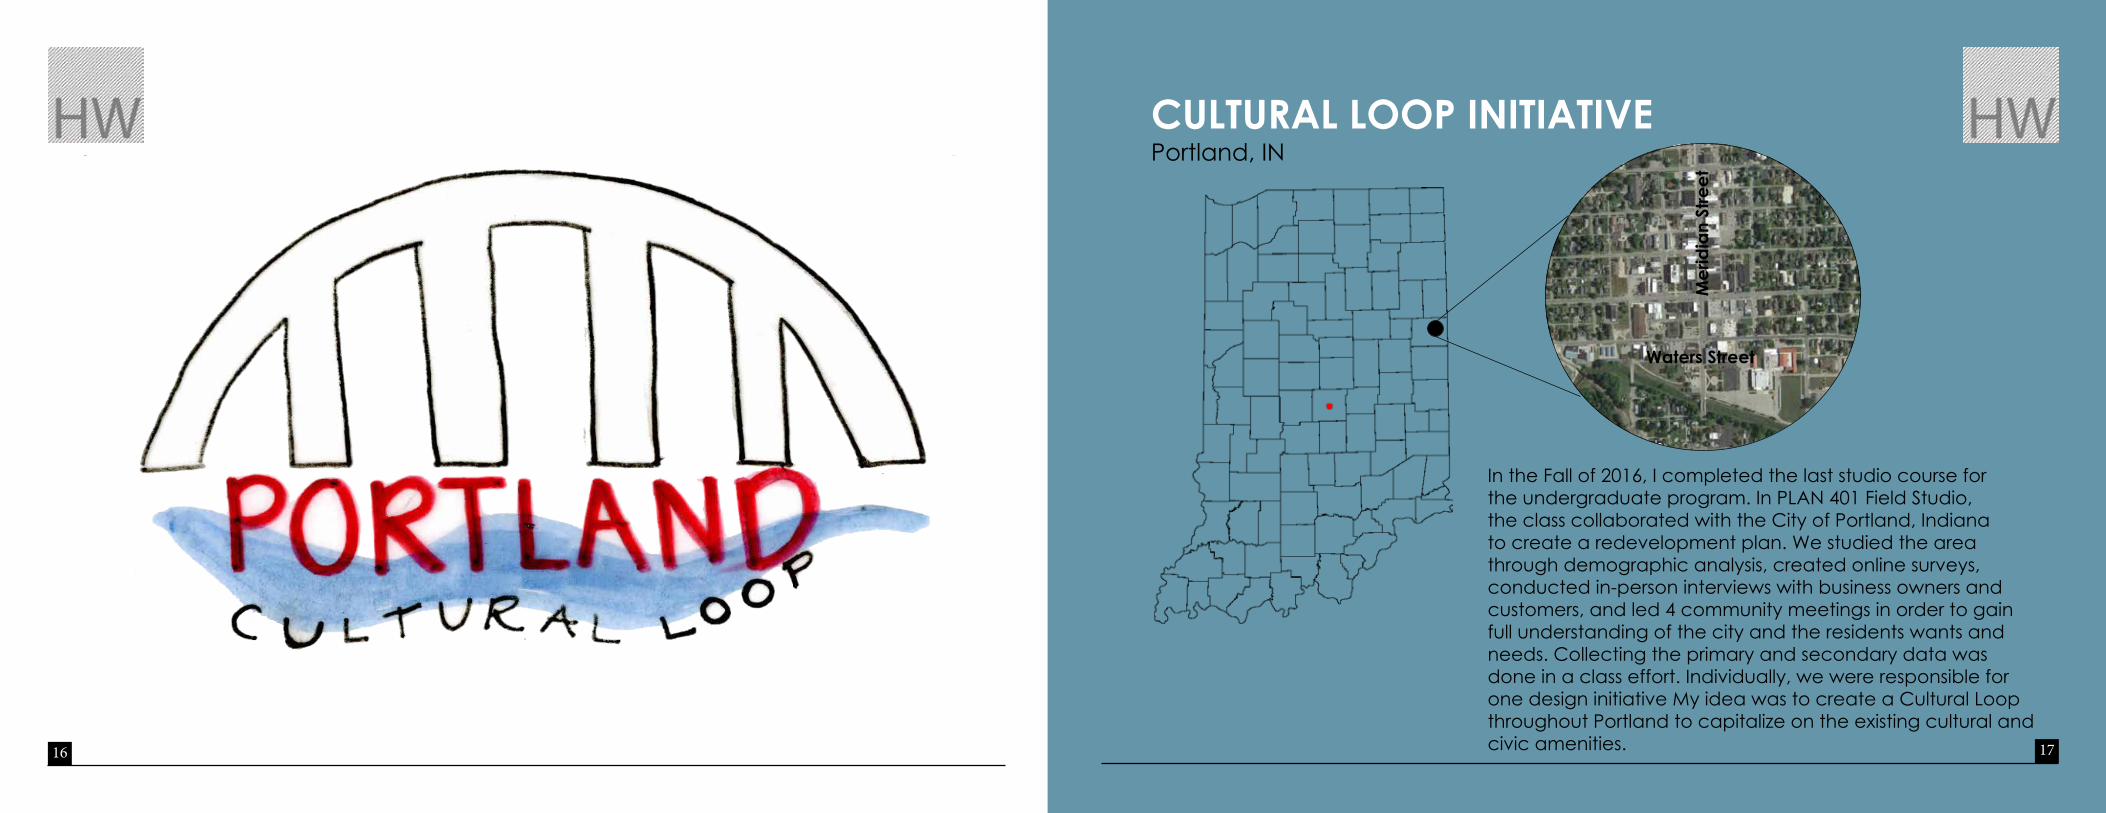
CULTURAL LOOp INITIATIvE Portland, IN
In the Fall of 2016, I completed the last studio course for the undergraduate program. In PLAN 401 Field Studio, the class collaborated with the City of Portland, Indiana to create a redevelopment plan. We studied the area through demographic analysis, created online surveys, conducted in-person interviews with business owners and customers, and led 4 community meetings in order to gain full understanding of the city and the residents wants and needs. Collecting the primary and secondary data was done in a class effort. Individually, we were responsible for one design initiative My idea was to create a Cultural Loop throughout Portland to capitalize on the existing cultural and civic amenities.
Mer
idia
n St
reet
Waters Street
1918
Popu
latio
n Tr
end
sIn
com
e an
d E
duc
atio
n Ra
ce a
nd W
orkf
orce
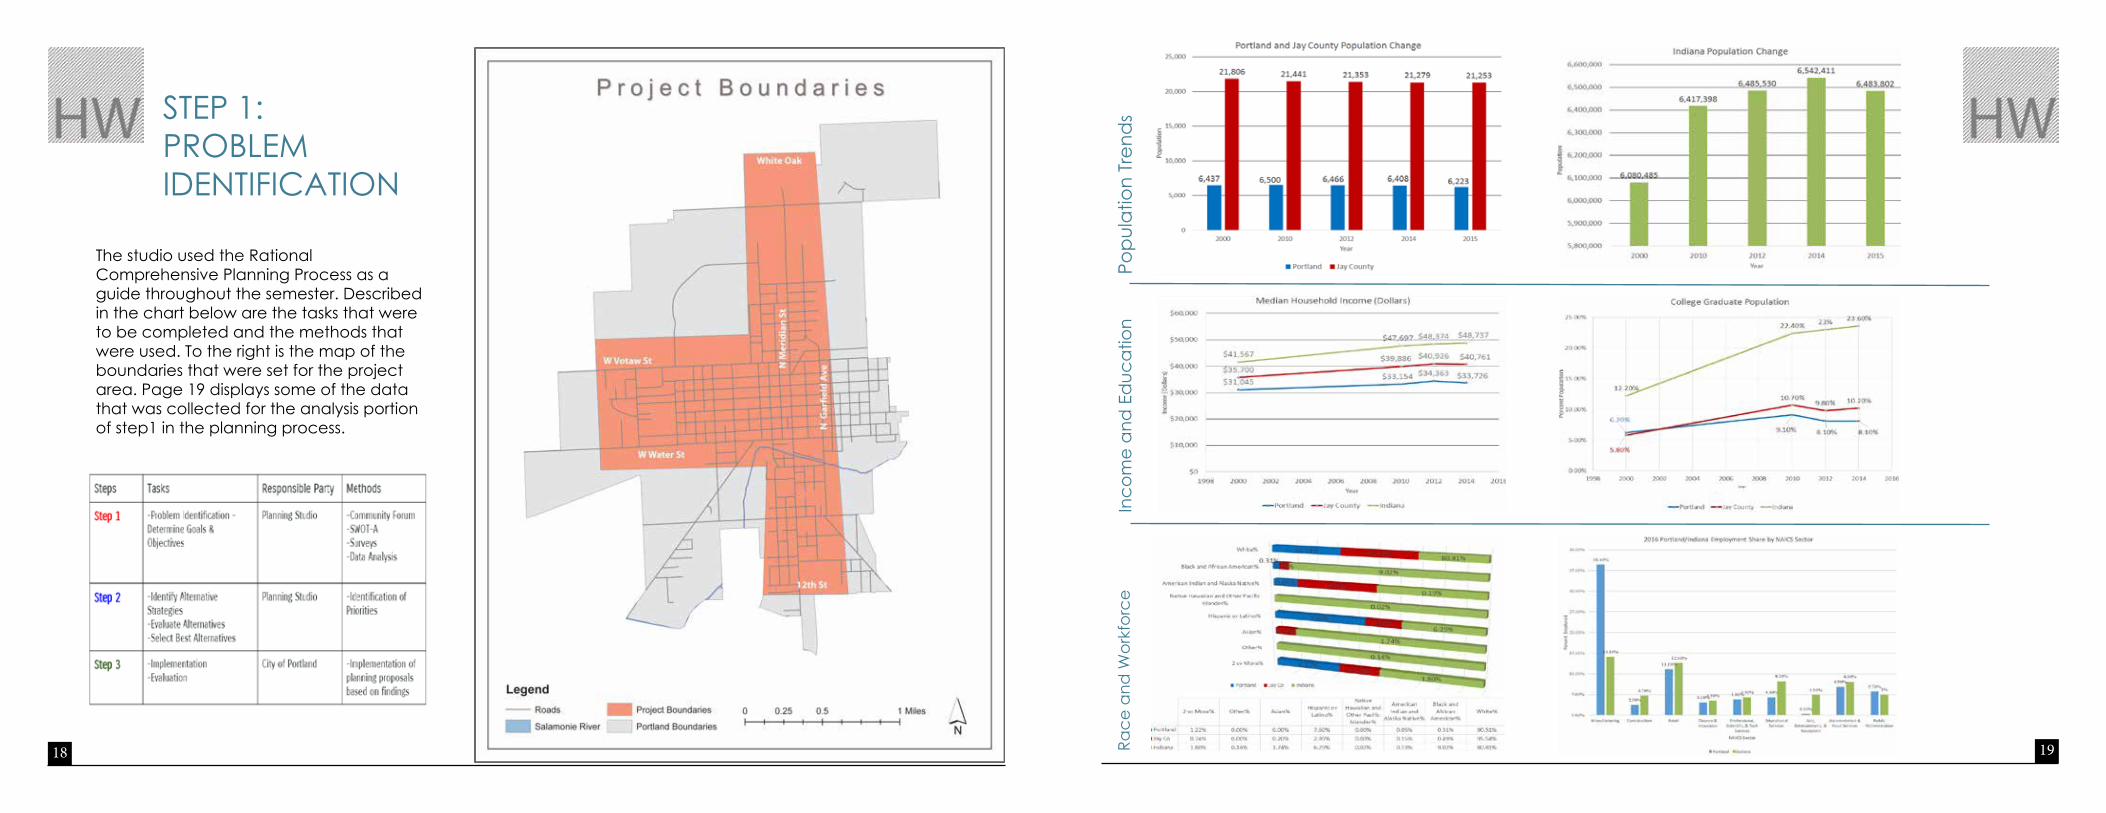
The studio used the Rational Comprehensive Planning Process as a guide throughout the semester. Described in the chart below are the tasks that were to be completed and the methods that were used. To the right is the map of the boundaries that were set for the project area. Page 19 displays some of the data that was collected for the analysis portion of step1 in the planning process.
STEP 1: PROBLEM IDENTIFICATION

20 21
The cultural loop strategy is created to guide Portland in the development of the loop. This strategy outlines potential locations and includes the path of the loop, theme and logo ideas, and funding/assistance resources. The purpose of the loop is to tell the story of Portland through visiting cultural and civic amenities, the use of public art, and educational signage.
Why this is important • Expanding upon these amenities will create
foottrafficinthedowntownwhichwillhavea positive effect on businesses in the area.
• This will provide an entertainment option, a learning opportunity, and establish destination points throughout the city.
• The cultural loop will create a theme for the downtown while establishing a sense of identity for the community
î
î
î
î
î
C i v i c a n d C u l t u r a l E l e m e n t s : P o r t l a n d , I N C i v i c a n d C u l t u r a l E l e m e n t s : P o r t l a n d , I N
Legendî Religious Centers
School
"g$ Police Station
Museum
Medical Care
Long Term Care
Æc Libraries
"' Hospitals Clinics
IC Hospitals
89:s Fire Station
"A& EMS
Road
Project Boundaries
Portland Boundaries
0 0.5 10.25 Miles
What this will involvePortland’s Cultural Loop will be a self-guided tour through the city. As shown above, participants will visit 13 ocations that are in close proximity to Meridian Street. The loop will display local art and signage giving an introduction of the history of Portland, Indiana.
STEP 2: CAPITALIZING ON ExISTING AMENITIES
22 23
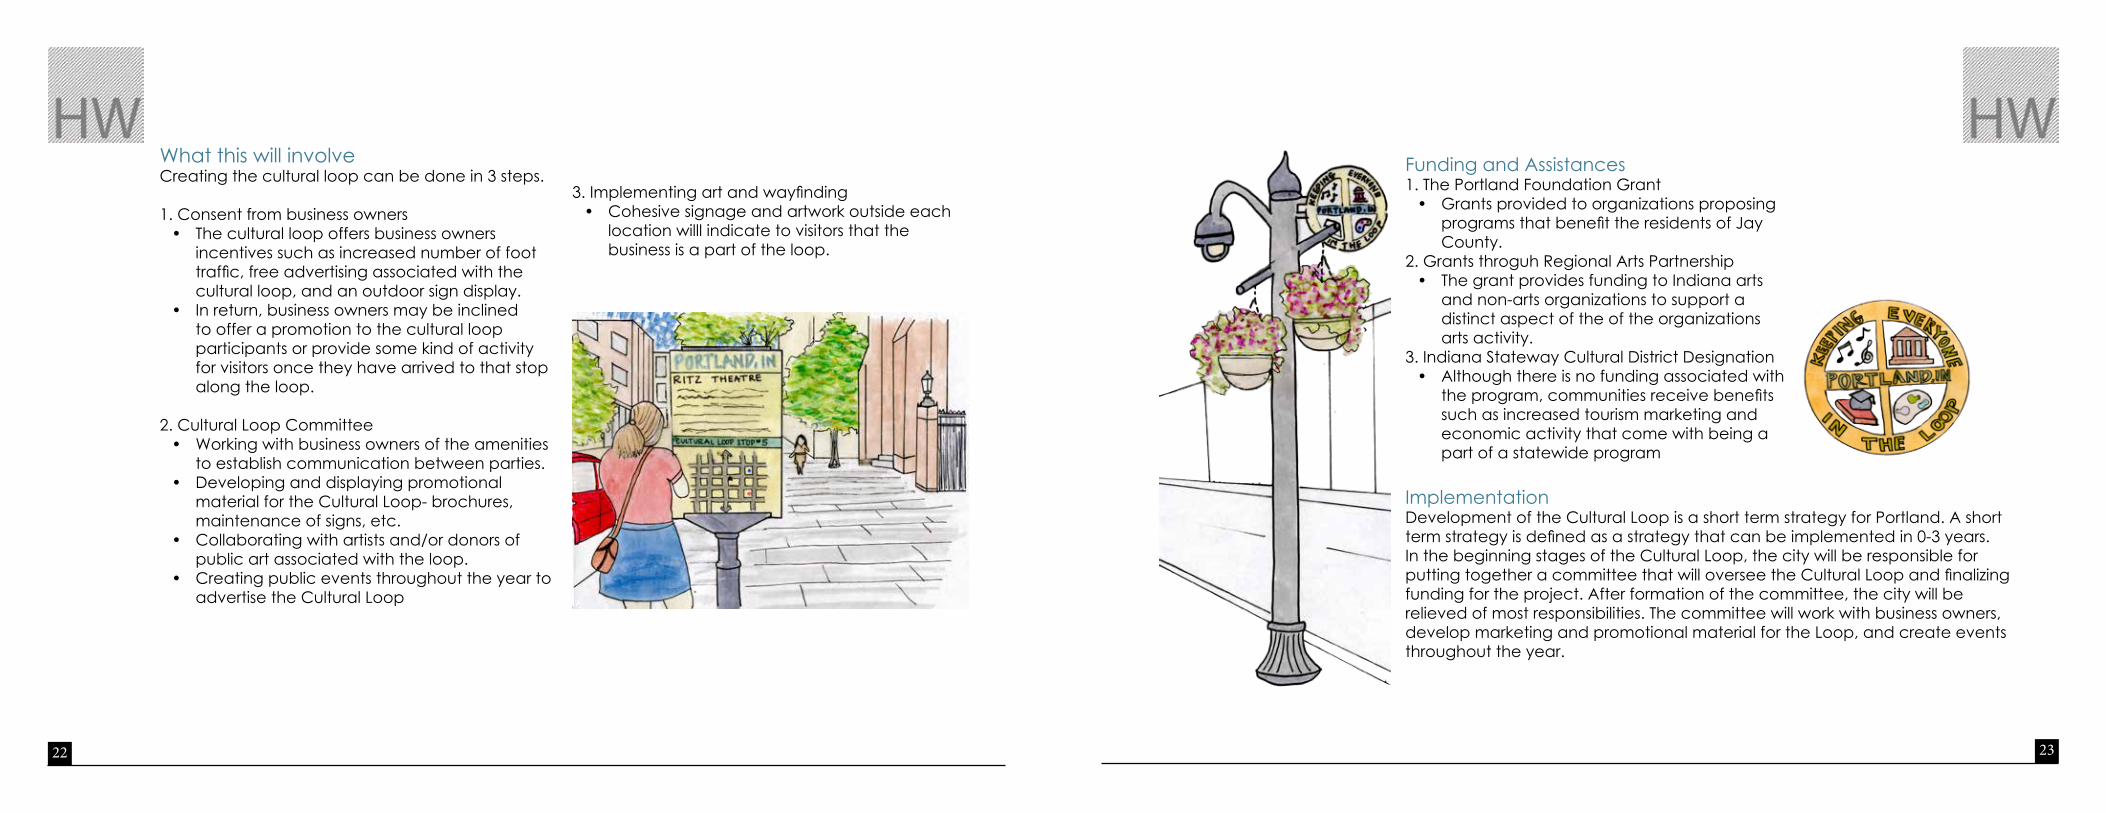
What this will involveCreating the cultural loop can be done in 3 steps.
1. Consent from business owners• The cultural loop offers business owners
incentives such as increased number of foot traffic,freeadvertisingassociatedwiththecultural loop, and an outdoor sign display.
• In return, business owners may be inclined to offer a promotion to the cultural loop participants or provide some kind of activity for visitors once they have arrived to that stop along the loop.
2. Cultural Loop Committee • Working with business owners of the amenities
to establish communication between parties. • Developing and displaying promotional
material for the Cultural Loop- brochures, maintenance of signs, etc.
• Collaborating with artists and/or donors of public art associated with the loop.
• Creating public events throughout the year to advertise the Cultural Loop
3.Implementingartandwayfinding• Cohesive signage and artwork outside each
location willl indicate to visitors that the business is a part of the loop.
ImplementationDevelopment of the Cultural Loop is a short term strategy for Portland. A short termstrategyisdefinedasastrategythatcanbeimplementedin0-3years.In the beginning stages of the Cultural Loop, the city will be responsible for puttingtogetheracommitteethatwilloverseetheCulturalLoopandfinalizingfunding for the project. After formation of the committee, the city will be relieved of most responsibilities. The committee will work with business owners, develop marketing and promotional material for the Loop, and create events throughout the year.
Funding and Assistances 1. The Portland Foundation Grant• Grants provided to organizations proposing
programsthatbenefittheresidentsofJayCounty.
2. Grants throguh Regional Arts Partnership • The grant provides funding to Indiana arts
and non-arts organizations to support a distinct aspect of the of the organizations arts activity.
3. Indiana Stateway Cultural District Designation • Although there is no funding associated with
theprogram,communitiesreceivebenefitssuch as increased tourism marketing and economic activity that come with being a part of a statewide program

19,23618,114 17,809 17,450
15,652
20,60222,106
23,526
48,50849,462 48,865
47,872
0
10,000
20,000
30,000
40,000
50,000
60,000
2000 Total 2010 Total 2015 Total 2020 Projection
Population Summary Comparison
New Castle Greenfield Henry County24 25
ANALYSIS Thissectionincludesworkfrommyfirstplanningstudio.InRegionalPlanning,IlearnedhowtouseArcGISforthefirsttime.Wecreatedmapsthat were used to analyze various characteristics of the project area. Also, this section includes another GIS map that was created for Neighborhood Planning. The map titled Encouraging Tenant/Owner Relationships and Engagements correlates with a written initiative. Lastly, sample work of demographic data is shown.

26 27
k
k
k
k
k
k
k
k
k
k
k
kk
k
kk
k
k
k
k
k
k
k
k
k
k
k
k
#
# #
n
n
n
n
nn
Praire Creek Reservoir
White River
Buck Creek
Mud Creek
Muncie
Fall Creek
Pipe Creek
Killbuck CreekIndian Creek
Duck Creek-Todd Ditch
Stony Creek-Headwaters
Killbuck Creek-Thruston Ditch
W a t e r Q u a l i t yW a t e r Q u a l i t yDelaware and Madison County
Hailey and AndresNovember 3, 2014 Regional Planning 203
Ball State University
Madison County
Delaware County
0 3 6 9 121.5Miles
Legendn Industrial Parks
# Water quality observatory stations
k Water quality statistics
1 (Least contaminate)
2
3
4 (Most contaminate)
Reservoir
Major Roads
The scale is rated 1-4, 1 is lowest and 4 is highest level of contaminantion. Each level is based on the amount of E. coli, algae, siltation, and ammonia.
®
PLAN203isthefirststudiothatstudentscompleteas an Urban Planning undergraduate. The studio is an introduction of ArcGIS through regional analysis. We studied Delaware and Madison County in Indiana. We demonstrated basic GIS skills by creating maps that represent the counties population density, water quality, and analysis of road ways and boundaries.
The Water Quality map was a part of a research paper completed with a partner. My responsibilities included creating the map and contributing with the paper. By creating this map we were able to infer that Buck Creek, south of Muncie, is the most contaminated waterway in the two counties. The second priority would be the level 3 contamination (Green) which includes Mud Creek, Pipe Creek, Indian Creek, and Falls Creek.
REGIONAL ANALYSIS +DELAWARE AND MADISON COUNTIES
D e l a w a r e a n d M a d i s o n C o u n t yD e l a w a r e a n d M a d i s o n C o u n t yP o p u l a t i o n D e n s i t y M a p P o p u l a t i o n D e n s i t y M a p
±0 1 2 3 40.5
Miles
Hailey Woods September 15, 2014
Regional Planning Studio 203Ball State University
Population Density- People per square mile
Population Density8- 290
304-580
623- 897
900- 2999
3004- 6117
D e l a w a r e a n d M a d i s o n C o u n t yD e l a w a r e a n d M a d i s o n C o u n t yA n a l y s i s M a p A n a l y s i s M a p
±0 3 6 9 121.5Miles
Hailey WoodsSeptember 14, 2014
Regional Planning Studio 203Ball State University
Analysis Legend Water Quality Stations
Railroad Systems
Major RoadsInterstate Highway
State Highway
US Highway
Corporate Boundaries
School_Districts 2013
28 29
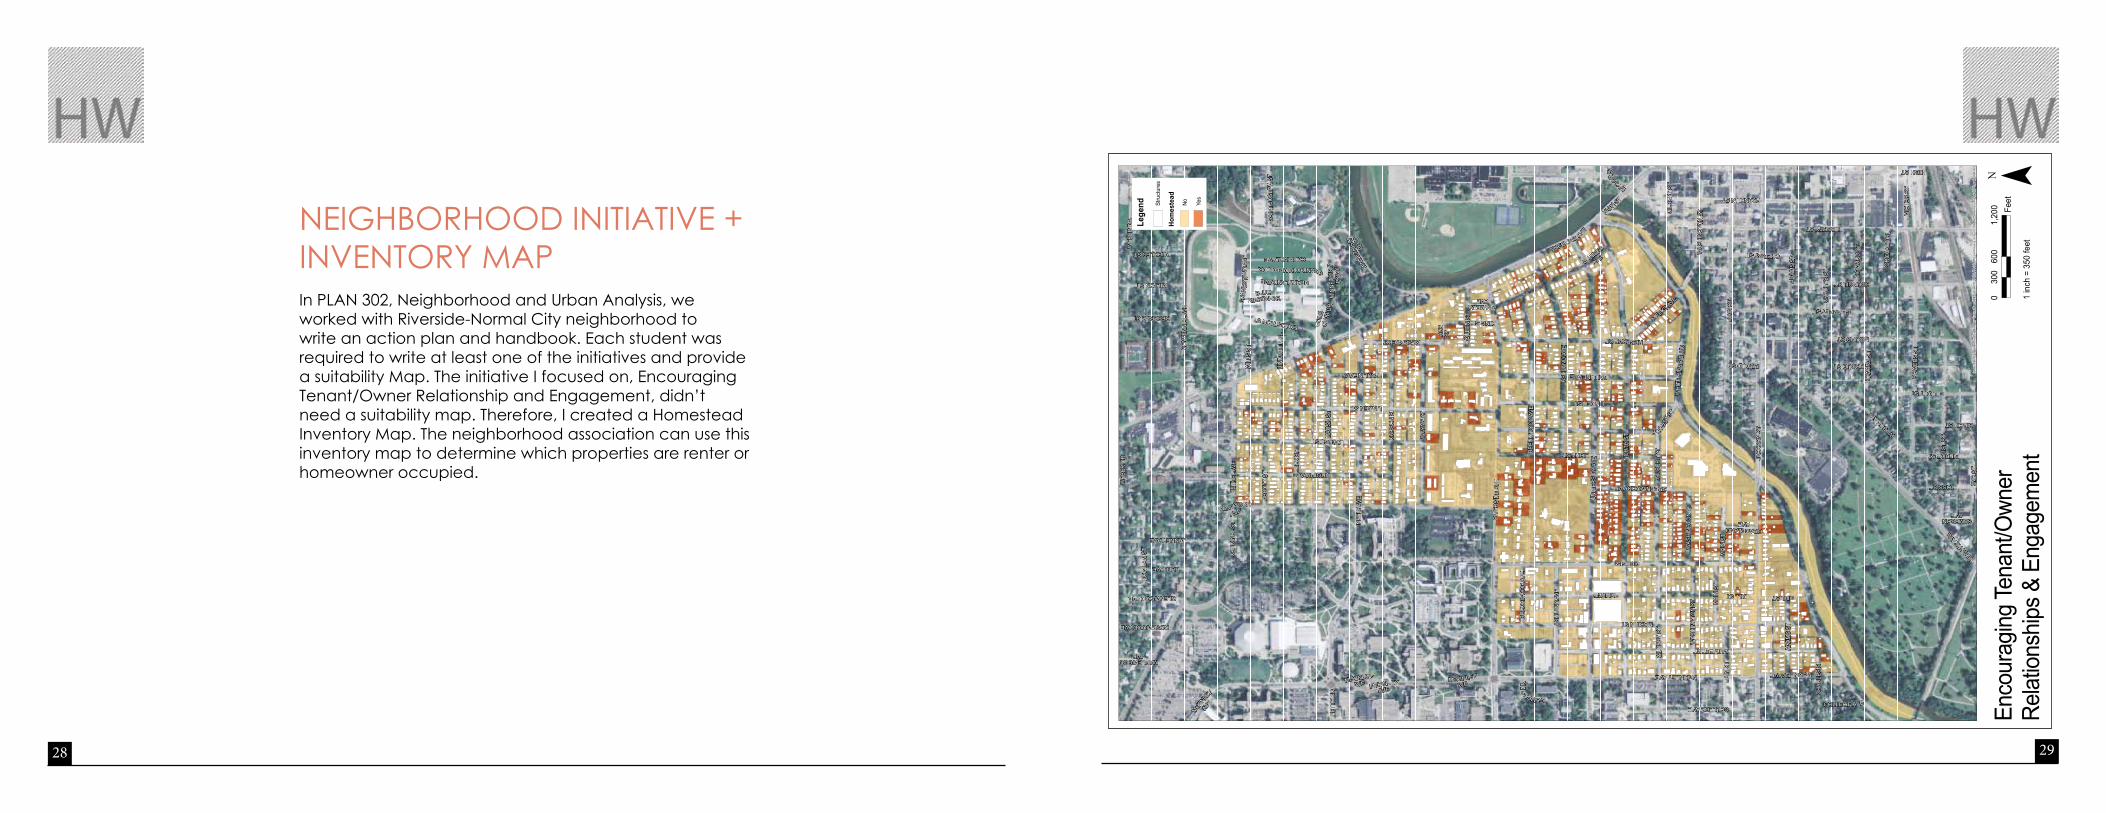
NEIGHBORHOOD INITIATIVE + INVENTORY MAP In PLAN 302, Neighborhood and Urban Analysis, we worked with Riverside-Normal City neighborhood to write an action plan and handbook. Each student was required to write at least one of the initiatives and provide a suitability Map. The initiative I focused on, Encouraging Tenant/Owner Relationship and Engagement, didn’t need a suitability map. Therefore, I created a Homestead Inventory Map. The neighborhood association can use this inventory map to determine which properties are renter or homeowner occupied.
McKINLEY
AVE
ELLIOTT ST
McKIN
LE
Y
AVE
MAI
N ST
RIV E
RSI D
EAV
E
DICKS ST
WAS
HING
TON
ST
MAI
N ST
EXPOSITION ST
CARNIVAL AVE
CHAR
LES
ST
ADAM
S ST
MILTON ST
GRA
NDST
AND
AVE
BUCKLES ST
BOW
MAN
ST
HIGH ST
CALVERT ST
GREENWOODAVE
COUNCIL ST
RESERVE ST QUE
EN S
T
ACE
ST
DILL ST
CENT
ENNI
AL A
VE
KING ST
DILL ST
MAI
N ST
ALAMEDAAVE
JANNEY AVE
BALL AVE
CHAR
LES
ST
GLENWOOD AVE
ROSEWOOD AVE
GIL
BERT
ST
ADAM
S ST
BETH
ELAV
E
GIL
BERT
ST
MAI
N ST
1ST
ST
LIND
WET
H PL
HOW
ARD
ST
BEEC
HWO
OD
AVE
MARTIN ST
ALAMEDA
AVE
POW
ERS
ST
CHERRY ST
GHARKEY ST
PIERCE ST
MOUND ST
BIRCH ST
JACK
SON
ST
ROSS ST
LIBERTY ST
McKINLEY AVE
ASHL
AND
AVE
UNIV
ERSI
TY A
VE
PROUD ST
LINDEN ST
HIGH ST
LOCUST ST
VIRGINIA AVE
NE W YORK
AVE
SAMPSONAVE
GIL
B ERT
ST
ASHL
AND
AVE
PAULINEAVEL OCU
STST
LINDEN ST
PAULINE AVE
LIGHT ST
PROUD ST
COLLEGE AVE
BEEC
HWO
OD
AVE
WEB
ER D
R
WAS
HING
TON
ST
2ND
ST
GRACELANDAVE
KILG
OREAVE
McKINLEY AVE
MAPLEWOODAVE
WYSORST
NEEL
Y AV
E
MAR
SH S
T
ABBO
TT S
T
REX
ST
CARS
ON
ST
WHEELING AVE
PETT
Y RD
DILL ST
ORC
HARD
PL
FRANKLIN ST
WIL
LS S
T
McKINLEYAVE
McKINLEYAVE
HEARTLAND AVE
BLUERIBBON DR
RESERVEST
MIN
NETR
ISTA
PKW
Y
HOW
ARD
ST
CARD
INAL
ST
COLLEGE AVE
VICT
OR
ST
RESERVE ST
CAMPUSDR
SAIN
T JO
SEPH
ST
WAY
NE S
T
MEEKS AVE
WAS
HING
TON
ST
G
RANDCHAMPIONDR
LIO
NSCL
UBD
R
WEB
ER D
R
WILSON AVE
NORT
H ST
WH I
TERI
VER
BLVD
MINNE
TRIS
TA
BLVD
Sour
ce: E
sri,
Digi
talG
lobe
, Geo
Eye,
Ear
thst
ar G
eogr
aphi
cs, C
NES/
Airb
us D
S, U
SDA,
USG
S, A
EX, G
etm
appi
ng, A
erog
rid, I
GN,
IGP,
swi
ssto
po, a
nd th
e G
IS U
ser C
omm
unity
Enco
urag
ing Te
nant
/Own
er
Relat
ionsh
ips &
Eng
agem
ent
¯0
600
1,20
030
0Fe
et
1 in
ch =
350
feet
Lege
nd Stru
ctur
es
Hom
este
ad
No Yes

30 31
7%filteringvacancy rate
In2000,Portlandhadavacancyrateof7.3%whichmeansthatthehousingmarketwasfilteringata good pace. Although by 2016, the rates had almost doubled to over 13%. If a vacancy rate is too high, there is more supply than demand in the market. Therefore, housing units are left vacant for long periods of time.
21.30%
18.70%
16.0% 15.50%14.90%
7.90%
4.30%
1.00%0.50%
9.10%
11.90%
10.10%
15.00%
21.40%
16.70%
12.00%
2.00% 1.80%
15.40%
13.90% 14.20%
17.10%17.60%
11.30%
8.20%
1.50%0.90%
13.30%
11.70% 11.40%
15.50%
19.00%
12.40%
11.10%
3.10%2.70%
0.00%
5.00%
10.00%
15.00%
20.00%
25.00%
<15,000 15,000-24,999 25,000-34,999 35,000-49,999 50,000-74,999 75,000-99,999 100,000-149,999 150,000-199,999 200,000+
Household Income Comparison
New Castle Greenfield Henry County Indiana
ThemostshockingfindingwiththisgraphwasthatNewCastlehasthehighestamountofhouseholdsmakinglessthan$15,000.Thisdemonstratesthattypeofpovertythecityisdealingwith.ForGreenfield,the majority of households (21.4%) are making between $50,000-74,000. This leads to the question aboutwhyGreenfieldisbetteroff.HenryCounty’sincomeisevenlyspreadfromthelowertomedianincome range. Indiana is a much largest reference area but the distribution seems parallel with the other geographic areas.

32 33
RELEvANT SKILLS
PresentingduringfieldtripweekinPittsburgh,PA Photo by: Lisa Dunaway
This section is a collection of graphics that were not shown in the other sections. In the Spring of 2016, I completed Lohren Deeg’s Charrette Graphics course which allowed me the opportunity to improve my graphic skills. Another type of graphic shown is an infographic. This is a creative way to visually show data or information. Lastly, the end of my junior year, I received an Outstanding Student Award from the College of Architecture and Planning, which included a scholarship for the following year.

34 35
HAND GRAPHICS
Above: Concept diagramming
Above:Wayfinding
Above: Graphic symbols
Above: Graphic symbols Displayed: Pine Tree Displayed: Deciduous Tree Displayed: Palm Trees
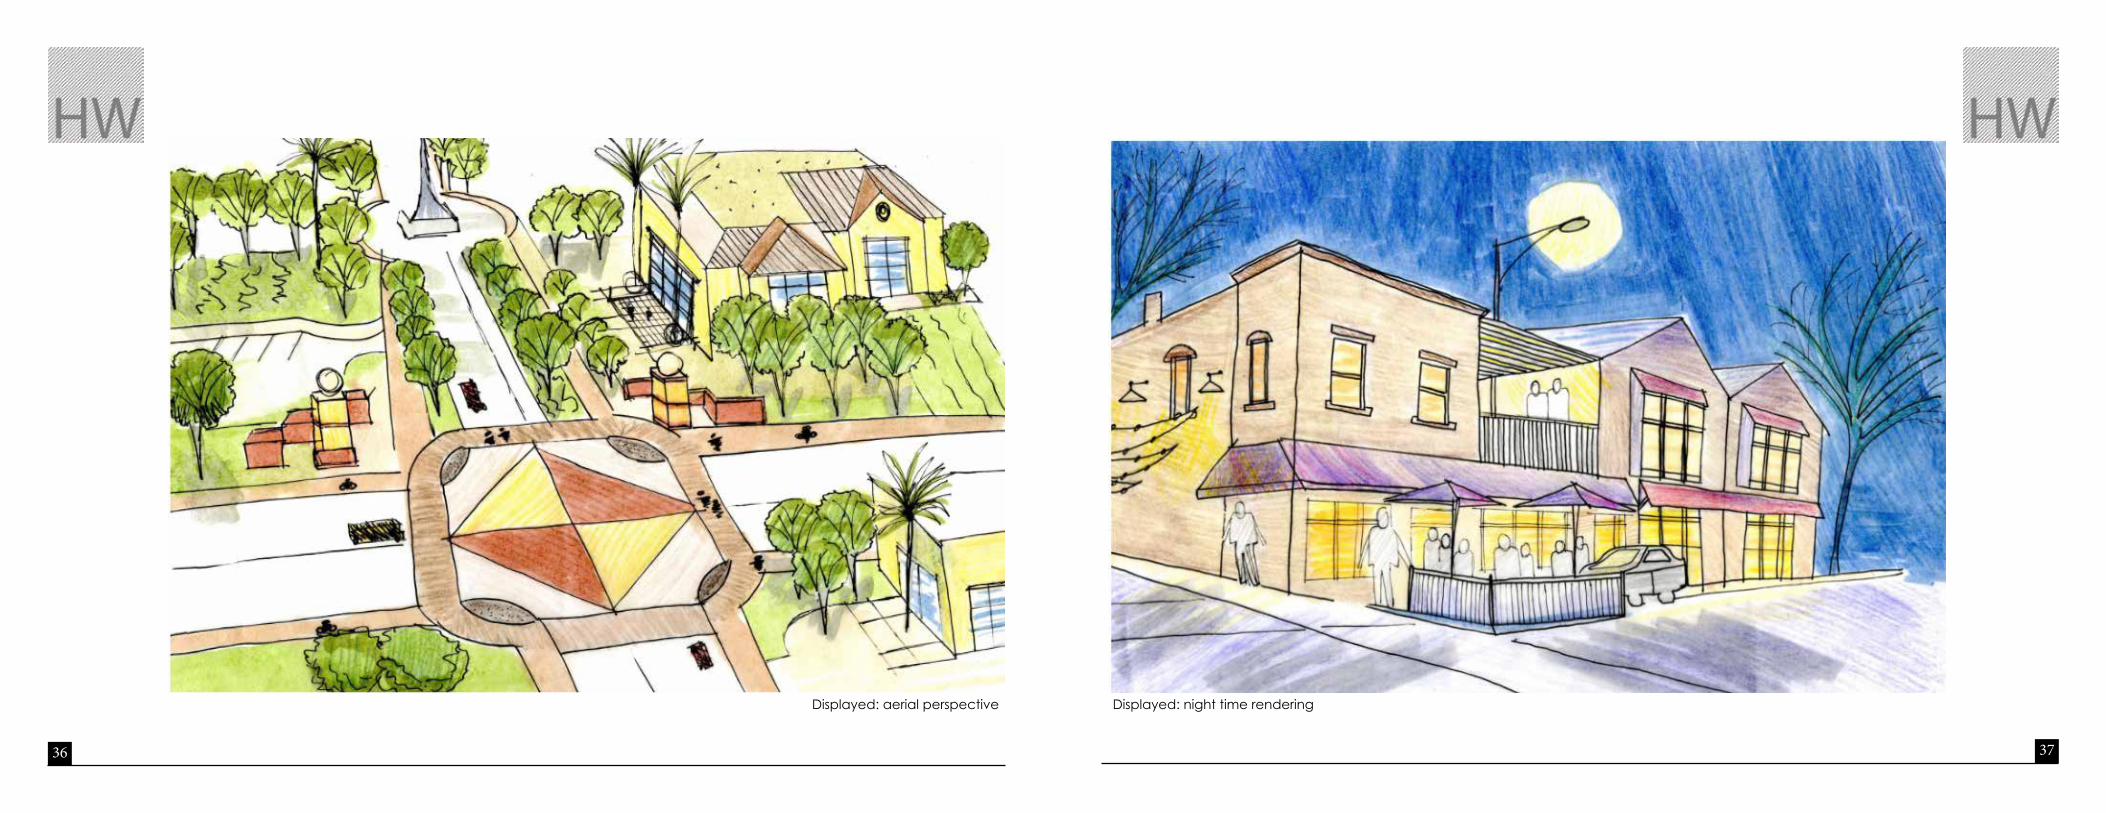
36 37
Displayed: night time rendering Displayed: aerial perspective

38 39
Fl�y� C��n��, �N vs. ������A
P���la�i�� O��� ����
Inc��� & �r�����
P���la�i�� P�r��i�
Ra�� Dis����u�i��
H�u��h�l� T���
Median Income- $53,1862014 Poverty Rate- 11.6%
18.9% 32.2% 9.9% 27.1% 19.4% 30.1% 9.9% 27.8%
Median Income- $49,3842014 Poverty Rate- 15.2%
E��l����n�/ E����ng�
14.5%28.7%
24.9%
8.7%
17.4%
14.3%
26.3%
25.3%
10.1%
17.6%
Floyd County
Indiana
2020
20142010
6,852,1216,596,855
6,483,797
2020
2014
201074,57876,179
77,763
Hailey Woods PLAN320 February 11, 2016
White- 86.1%
Black- 9.6%
Asian- 2.0%
Multi Race- 2.0%
White-91.1%
Black- 5.5%
Asian-1.1%
American Indian or Native- 3.0%Multi Race- 2.0% American Indian
or Native- 0.4%
A�� 45-64
A�� 25-�4
A�� 18-24
A�� 5-17
65 �n� Ol���
Farm
Accommodation, Food Serv.
Arts, Ent. , Recreation
Construction
Health Care, Social Serv.
InformationManufacturing
Professional, Tech. Serv.
Reatil Trade
Trans., Warehousing
Wholesale Trade
Other Private (not listed)
Government
1.7%
7.1%
1.6
6.3%
11.3%1.2%
14.0%
4.4%
9.8%4.1%
3.4%
23.6%
11.9%
0.6%
7.3%1.9%
5.1%
11.1%
0.7%
15.1%
5.2%10.4%
1.5%
1.8%
22.4%
16.2%
Indiana Floyd County
INFOGRAPHICThe graphic on the right represents a comparison of Floyd County, Indiana to the state of Indiana as a whole. I compared the change of population over time, income and poverty data, race distribution, household type, along with a population pyramid and employment comparison.
Spring 2016- Outstanding Student Award presented by Michael Burayidi


![6 hailey b venezuela2013[1]](https://img.pdfslide.tips/doc/110x75/55a026a31a28abe6618b4579/6-hailey-b-venezuela20131.jpg)


![Arthur Hailey - Ultima Sansa [Carti.digitalarena.ro]](https://img.pdfslide.tips/doc/110x75/55cf9d36550346d033acb3cd/arthur-hailey-ultima-sansa-cartidigitalarenaro.jpg)