Embed Size (px)
Citation preview

HECHO RELEVANTE AB-BIOTICS, S.A.
10 de julio de 2019
En virtud de lo previsto en el artículo 17 del Reglamento (UE) nº 596/2014 sobre abuso de
mercado y en el artículo 228 del texto refundido de la Ley del Mercado de Valores, aprobado por
el Real Decreto Legislativo 4/2015, de 23 de octubre, y disposiciones concordantes, así como en
la Circular 6/2018 del Mercado Alternativo Bursátil (MAB), se pone a disposición del mercado la
siguiente información relativa a AB-BIOTICS, S.A.:
En el día de ayer, 9 de julio de 2019, KANEKA EUROPE HOLDING COMPANY NV comunicó a
la Compañía el anuncio de una oferta pública voluntaria de adquisición de acciones de AB-
BIOTICS, S.A., cuyos términos se adjuntaron al correspondiente Hecho Relevante publicado.
En aras de facilitar el acceso a tal información en idioma inglés, se ha estimado oportuno publicar
el presente Hecho Relevante con la traducción del publicado ayer y su documentación anexa.
En caso de discrepancia entre ambas versiones, prevalecerá la versión en idioma español.
Quedamos a su disposición para cuantas aclaraciones consideren oportunas.
En Barcelona, a 10 de julio de 2019
AB-BIOTICS, S.A.
Sergi Audivert Brugué Miquel Àngel Bonachera Sierra
Consejero Ejecutivo Consejero Ejecutivo
-------------------------------- ---------------------------------------

RELEVANT FACT AB-BIOTICS, S.A.
July 10, 2019
Under the provisions of Article 17 of Regulation (EU) No. 596/2014 on market abuse and Article
228 of the revised text of the Securities Market Law, approved by Royal Legislative Decree
4/2015, of 23 October, and concordant provisions, as well as in Circular 6/2018 of the Alternative
Stock Market (MAB), the following information regarding AB-BIOTICS, SA is made available to
the market:
Yesterday, July the 9th, 2019, KANEKA EUROPE HOLDING COMPANY NV notified the
Company of the announcement of a voluntary public offering for the acquisition of shares of AB-
BIOTICS, S.A., whose terms were appended to the relevant published Relevant Fact.
In order to facilitate access to such information in English, it has been considered opportune to
publish this Relevant Fact with the translation of the one published yesterday and its attached
documentation.
In case of discrepancy between both versions, the Spanish version will prevail.
We remain at your disposal for any clarifications deemed appropriate.
In Barcelona, on July 10, 2019
AB-BIOTICS, S.A.
Sergi Audivert Brugué Miquel Àngel Bonachera Sierra
Executive director Executive director
-------------------------------- ---------------------------------------

RELEVANT FACT AB-BIOTICS, S.A.
July 9, 2019
Under the provisions of Article 17 of Regulation (EU) No. 596/2014 on market abuse and Article
228 of the revised text of the Securities Market Law, approved by Royal Legislative Decree
4/2015, of 23 October, and concordant provisions, as well as in Circular 6/2018 of the Alternative
Stock Market (MAB), the following information regarding AB-BIOTICS, SA is made available to
the market:
Today, KANEKA EUROPE HOLDING COMPANY NV has informed the Company of the
announcement of a voluntary public offering for the acquisition of shares of AB-BIOTICS, S.A.,
whose terms are attached to this Relevant Fact.
The price of the offer is 5 euros per share and the term for acceptance begins on July 10, 2019
and ends on August 16, 2019. We remain at your disposal for any clarifications deemed
appropriate.
In Barcelona, on July 9, 2019
AB-BIOTICS, S.A.
Sergi Audivert Brugué Miquel Àngel Bonachera Sierra
Executive Director Executive Director
-------------------------------- --------------------------------

ANNOUNCEMENT OF A VOLUNTARY
PUBLIC TENDER OFFER OVER THE SHARES OF
AB-BIOTICS, S.A.LAUNCHED BY
(KANEKA EUROPE HOLDING COMPANY NV)
Barcelona, July 9, 2019
Global Coordinator: EBN Banco de Negocios, S.A. / Agent Bank: Banco Santander, S.A.
Legal Advisor: Gómez-Acebo & Pombo Abogados, S.L.P.

2
INDEX
1. BACKGROUND OF THE OFFER .......................................................................................................................3
2. IDENTIFICATION OF THE (TARGET) COMPANY .............................................................................................3
3. IDENTIFICATION OF THE OFFEROR.................................................................................................................4
4. SCOPE OF THE OFFER .....................................................................................................................................4
5. OFFER PRICE ...................................................................................................................................................4
6. FUNDING OF THE OFFER.................................................................................................................................6
7. PERIOD FOR THE ACCEPTANCE OF THE OFFER .............................................................................................7
8. FORMALITIES FOR THE ACCEPTANCE OF THE OFFER AND PAYMENT TERMS...............................................7
8.1. Acceptance declarations ........................................................................................................................7
8.2. Acceptance procedure............................................................................................................................7
8.3. Publication of the outcome......................................................................................................................8
8.4. Management of the acquisition and settlement of the Offer ...........................................................8
9. COSTS RELATED TO THE ACCEPTANCE AND SETTLEMENT OF THE OFFER.....................................................8
10. PURPOSE OF THE TRANSACTION....................................................................................................................9
11. SUPPORT TO THIS OFFER ...............................................................................................................................10
12. BYLAWS.........................................................................................................................................................10
3
Barcelona, July 9, 2019
This announcement (the “Announcement”) of a voluntary public tender offer (the “Offer”) to
acquire all the shares of AB-Biotics, S.A. (“AB-Biotics” or the “Company”), which shares are
listed on the Spanish Multilateral Trading Facility (“Mercado Alternativo Bursatil” –the
“MAB”-), is published by Kaneka Europe Holding Company NV (“Kaneka”, the “Offeror” or,
together with the companies within its group, the “Kaneka Group”).
1. BACKGROUND OF THE OFFER
On March 28, 2018, the Company and Kaneka Americas Holding, Inc. entered into a license
agreement by which the exclusive right to manufacture, import, ferment, use, sell and offer of
certain AB-Biotics products in Japan and North America was granted to Kaneka Americas
Holding, Inc.
Likewise, and as an inseparable part of the same agreement, the Kaneka Group, through the
company Kaneka Europe Holding Company NV (i.e. the Offeror), decided to invest in AB-
Biotics’s capital through the acquisition of a 26,859% of its share capital by means of private
acquisitions. Said ownership of the Company has, since then, been increased and, as of the
date of this Announcement, the Offeror owns 5,005,234 shares of AB-Biotics, representing
39.76% of its share capital, as reflected in MAB’s website as of the date hereof.
The Offeror, in line with its previous acquisitions, aims to acquire 100% of the Company’s share
capital, for the reasons further indicated in section 10 below. In this regard, the Offeror hereby
offers to all the shareholders of the Company (other than the Offeror) the acquisition of all the
shares of AB-Biotics, representing 60.24% of its share capital.
The ultimate purpose of Kaneka after the Offer is to promote the delisting of AB-Biotics’ shares
from MAB following the procedures set out in article 34 of the Company’s Bylaws (which refer
to general public offer regulations with regards to delisting price), and in accordance with
Section Six of MAB’s Circular 2/2018 regarding the requirements and procedures applicable
to the admission and exclusion of shares (Circular 2/2018 sobre requisitos y procedimiento
aplicables a la incorporación y exclusión en el Mercado Alternativo Bursátil de acciones
emitidas por empresas en expansión y por Sociedades Anónimas Cotizadas de Inversion en
el Mercado Inmobiliario (SOCIMI)) (“MAB’s Circular 2/2018”). Main reasons for this intended
ultimate delisting are also mentioned in section 10 below.
This Announcement explains the terms and conditions of the voluntary public tender offer
made by the Offeror to all the shareholders of the Company.
2. IDENTIFICATION OF THE (TARGET) COMPANY
AB-BIOTICS, S.A. is a Spanish company with registered address at the Esade Creapolis
Building, Av. de la Torre Blanca, 57, St. Cugat del Vallès (Barcelona), registered with the
Commercial Registry of Barcelona under Volume 45561, Page 33 and Sheet B-293983, and
provided with Spanish Tax Identification Number (NIF) A-63497473.
The share capital of AB-Biotics amounts, on the date hereof, to 629,412.95 Euros, being
represented by 12,588,259 shares of 0.05 euros of nominal value each, of a sole class, fully
subscribed and disbursed, and represented by book entries.

4
All the shares constituting the share capital of the Company are admitted to trading on the
MAB. The share capital structure of the Company, according to the latest information
published by the Company on the MAB’s website as of the date hereof, is the following:
AB-BIOTICS’ SIGNIFICANT SHAREHOLDERS
DIRECT % IN THE
COMPANY
INDIRECT % IN THE
COMPANY %TOTAL
Kaneka Europe Holding Company NV .................................... 39.76% -- 39.76%
D. Miquel Àngel Bonachera Sierra............................................ 8.92% -- 8.92%
D. Sergi Audivert Brugué............................................................. 8.92% -- 8.92%
D. Luis Sánchez Lafuente-Mariol................................................ 8.87% 1.28*% 10.15%_______
(*) Through the Biolittletec, S.L. and Laboratorios Neusc, S.A.
3. IDENTIFICATION OF THE OFFEROR
KANEKA EUROPE HOLDING COMPANY NV is a Belgian company, with registered address at
Alma Court, Lenneke Marelaan, 4, Zaventem (Belgium), incorporated on October 1st, 2015 by
virtue of a public deed granted in front of the Notary Public Daisy Dekegel and registered in
Brussels under number 0640.747.653, and with Spanish Foreigners Identification Number (NIE)
N0174239D.
The share capital of the Offeror amounts up to 62,628,935.25 Euros divided into 3,173,670
shares, fully subscribed and disbursed. Kaneka is a subsidiary 100% controlled by Kaneka
Corporation, a Japanese company which common stock is traded on Tokyo’s and Nagoya’s
Stock Exchanges.
4. SCOPE OF THE OFFER
The Offer is launched by Kaneka and is addressed to all shareholders of AB-Biotics (other than
the Offeror) in order to acquire from them all the outstanding share capital of the Company
not already owned by the Offeror. Consequently, this Offer targets 100% of the share capital
of AB-Biotics, excluding the shares owned by Kaneka, which in due consideration of the
current number of outstanding shares, targets a total of 7,583,025 shares in AB-Biotics,
accounting for 60.24% of its share capital.
To all legal effects, it shall be considered that the publication of this Announcement fulfils the
relevant obligations set forth in article 8.2 of the Company’s Bylaws.
5. OFFER PRICE
The Offer for the acquisition of the shares of AB-Biotics is formulated as a purchase and sale of
shares and shall be settled in cash in accordance with the provisions set forth in section 8 of
this Announcement.
Those shareholders of AB-Biotics who accept the Offer will receive, in exchange for the sale of
their shares, the amount in cash of 5.00 Euros per share (the “Offer Price”).
Notwithstanding the fact that the Offer is (i) being voluntarily made by the Offeror, and (ii) not
subject to the provisions set forth in the Spanish Law for public offerings to acquire shares in
companies whose shares are listed in official markets, the Offeror states that the Offer Price
(i.e. 5.00 Euros per share) shall be deemed a fair/equitable price for the purposes of article 34
of the Company’ Bylaws and articles 9 and 10 of the Spanish Royal Decree on Takeover Bids

5
(Real Decreto 1066/2007, de 27 de julio, sobre el régimen de las ofertas públicas de
adquisición de valores). This is supported by virtue of the report issued on July 9, 2019 by the
independent appraisal firm Crowe Advisory SP, S.L. (the “Independent Appraiser”) on the
Offer Price, which sets out a fair delisting price of Eur 4.305 per share. For information
purposes, a copy of such report has been attached as Annex 1 hereto.
In connection with the Offer Price, the Offeror deems it convenient to state the following:
(a) mainly, the Offer Price represents a premium of 16.14% over the fair delisting value
identified by the Independent Appraiser within its independent expert appraisal
(equivalent to the highest parameter identified by this independent evaluator within its
analysis), which the Offeror considers a good faith additional compensation to the
Company’s shareholders and the fact that the Offeror may take control over the
Company;
(b) the Offer Price represents a premium of 16.14% over the average share value of the
Company during the previous 6 months and of 32.63% over the average share value of
the Company during the previous 12 months;
(c) the Offer Price represents a premium of 29.87% over the latest price paid by the Offeror
in its latest transaction with Company’s shares (acquisition dated June 13, 2019;
(d) the Offer Price represents a premium of (circa) 53.85% over the price paid by the
Offeror in March 2018, when acquiring its first significant stake in the Company from
other directors and significant shareholders of the Company;
(e) additionally, the Offer Price represents (i) a premium of 19.62% over the price per share
identified by the Independent Appraiser following the “discounted cash flow”
calculation method; (ii) a premium of 93.05% and of 50.15% over the price per share
identified by the Independent Appraiser following the “wide market multiples” and the
“narrow market multiples” calculation methods, respectively; and (iii) a premium of
113.68% over the price per share identified by the Independent Appraiser following the
“recent transactions” calculation method. A reference to all these calculation
parameters can be found in the report that has been attached as Annex 1 to this
Announcement.
(f) Without significant news about the Company and with an average daily volume of
(pursuant to Bloomberg) 11,978 titles (which implies a daily trading of only EUR 53,350
against an average market capitalization of the Company of more than Eur 56 million),
AB-Biotics' stock has experienced a significant increase in valuation from EUR 3.90 per
share in early February 2019 to the current EUR 4.98 (which implies an appreciation of
more than 27.69% in 6 months).
The average volume of this period has also been significantly affected by the block
trade of 249,508 titles crossed on 13 June 2019, at a price of EUR 3.85 per share, among
significant shareholders (Kaneka, Mr. Miquel Bonachera and Mr. Sergi Audivert).
This significant increase in the share price, driven by a very little daily volume regarding
capitalisation and without any relevant corporate news or presentation of results that
could have radically changed what the markets had foreseen (other than the 2019 Q1
results), has entailed a significant outperforming of the share price above the target

6
prices or medium-term valuations of all the respected houses of analysis that follow the
value and published their Research on the official website of the MAB, based on
forecasts adjusted, with realism and traceability to the evolution of the Company and
to the sector trends in which AB-Biotics operates. For ease of reference, a link to these
reports, as issued by Researchfly, GVC Gaesco and Morningstar, all of them currently
available at the MAB’s website, has been inserted hereinbelow:
https://www.bolsasymercados.es/docs/MorningStar/MorningStar_ES0109659013.pdf?I
NDKJA;
https://www.bolsasymercados.es/mab/documentos/Analisis/2019/07/09659_Analisis_2
0190708.pdf;
https://www.bolsasymercados.es/mab/documentos/Analisis/2019/06/09659_Analisis_2
0190610.pdf;
https://www.bolsasymercados.es/mab/documentos/Analisis/2019/03/09659_Analisis_2
0190306.pdf;
AB-Biotics’ valuation, taking the 5-euro-per share valuation as reference (the best of the
analysts' target prices), results in a demanding EV/EBITDA ratio (as of closing of 2018
audited accounts) of 31.47x (versus the 22.9x ratio in comparable sector companies)
and a PER ratio (as of closing of 2018 audited accounts) of 52.4x (versus the 36.25x ratio
in comparable sector companies), which means incorporating very high premiums
compared to comparable companies in the sector.
The report issued by the Independent Appraiser highlights this particular case of a great
difference between fair (delisting) valuation and market price, which is reinforced by
the effect of the lack of liquidity of the share and the over-expectations of some short-
term investors.
AB-Biotics is competing in a sector that attracts more and more competitors which,
while putting pressure on medium-term margins as predicted by the sector analysts of
International Investment Banks and research houses, will also entail the need of
significantly increasing its investments in capex, acquisitions and also increasing their
effort in international and commercial exposure which could be undervalued by the
short term investors compared to those with an industrial and substantial long-term
vision.
In due consideration, being the ultimate purpose of Kaneka to promote the delisting of AB-
Biotics’ shares from MAB, the Offer Price shall initially be deemed, to all relevant legal effects,
a fair delisting value in accordance with articles 10 and 9 of the Spanish Royal Decree on
Takeover Bids, as referred by article 34 of the Company’s Bylaws and MAB’s Circular 2/2018.
For the avoidance of doubt, any subsequent offer to delist the shares of the Company to be
made by the Offeror (or by the Company at the request of the Offeror) after this Offer would
be initially made at the same Offer Price (i.e. 5.00 Euros per share).
6. FUNDING OF THE OFFER
Hypothetically, should the Offer be accepted by all the holders of AB-Biotics’ shares, taking
into account the Offer Price (i.e. 5.00 Euros per share), Kaneka would be obliged to pay out
an aggregate amount of 37,915,125 Euros.

7
The Offeror holds a strong financial position and will meet the payment of the Offer Price with
funds obtained from external financing.
7. PERIOD FOR THE ACCEPTANCE OF THE OFFER
The period for the acceptance of this Offer will start to count from the stock market business
day following the date of publication of this Announcement and will expire on (Friday) August
16, 2019 at 23:59 h (CET) (the “Acceptance Period”).
The Offeror may extend the Acceptance Period for acceptance of the Offer, at its sole
discretion, given said extension is announced in the same media as those used to publish this
Announcement, at least three (3) calendar days before the date of expiry of the initial
deadline (-Tuesday- August 13, 2019).
8. FORMALITIES FOR THE ACCEPTANCE OF THE OFFER AND PAYMENT TERMS
8.1. Acceptance declarations
Declarations of acceptance of the Offer by shareholders of the Company will be admitted
from the first day of the Acceptance Period and until the last day, both inclusive.
Acceptances will not be valid if they are subject to any condition and will be deemed issued
on irrevocable, unconditional, firm and binding basis, so that they become actual orders to
transfer the shares (with their inherent political and economic rights) as soon as the Offer is
closed and settled.
8.2. Acceptance procedure
Any shareholder of the Company willing to accept the Offer must contact the bank or
financial entity with which their shares are deposited, and state in writing their wish to accept
the Offer.
AB-Biotics’ shareholders may accept the Offer with respect of all or part of the Company’s
shares held by them.
The shares with respect to which the Offer is accepted must include all the voting rights and
economic rights attached thereto. These shares must be transferred free of charges,
encumbrances and any rights in favour of third parties which may limit the voting rights or
economic rights or their free transferability, and shall be transferred by an authorised
signatory, in such a way that the Offeror acquires full, unrestricted and non-contestable
ownership of the shares.
The declarations of acceptance shall be accompanied by sufficient documentation to
enable the shares to be transferred, and must include all the identification data required by
the applicable regulations for this type of transactions, including, but not limited to, the full
name or company name of the shareholder, its address and tax number or, in the case of
shareholders who are not resident in Spain and do not have a tax number, its passport
number or identity card number, nationality and address.
During the Acceptance Period, Iberclear participants and MAB participants receiving
acceptance declarations will dispatch on a daily basis with the Offeror, through the
representative designated for this purpose as stipulated below, on information concerning

8
the number of shares included in the declarations of acceptance submitted by the
Company’s shareholders.
The representative designated by Kaneka for this purpose is Banco Santander, S.A. (the
“Agent”), with the following contact details:
Banco Santander, S.A.Mr. Carlos Lopez Villa / Mr. Carlos Sanz [email protected]
Likewise, to all relevant effects, including consultation and contacts about this Offer, it is
stated that the Offeror has appointed EBN Banco de Negocios, S.A. as its Global Coordinator
and Advisor on this Offer (the “Global Coordinator”). Shareholders can contact the Global
Coordinator in order to ask any questions or clarify any points related to this Offer. Global
Coordinator’s contact details are hereby set out:
EBN Banco de Negocios, S.A.Mr. Sergio García Sendón – Head of Debt/Equity Capital Markets and M&A ([email protected]) Mr. Finbar Murray – Head of Treasury and Capital Markets ([email protected])Mr. Enrique Diez - Associate Treasury and Capital Markets ([email protected])+34 917009844
Under no circumstances will the Offeror accept shares acquired after the Acceptance
Period. In other words, any shares offered for sale must have been acquired by the
accepting shareholder no later than the last day of the Acceptance Period.
8.3. Publication of the outcome
Following expiry of the Acceptance Period, or of any period arising from an extension or
modification of said period pursuant to section 7 above, the Agent will notify the Offeror and
AB-Biotics, within a maximum of five (5) trading days after the expiry of the Acceptance
Period, about the total acceptances validly received during the Acceptance Period and,
therefore, about the outcome of the Offer. The outcome of the Offer will be published on the
MAB’s website (www.bolsasymercados.es/mab/esp/MaB/Boletin.aspx) and on the website of
the Company (http://www.ab-biotics.com).
8.4. Management of the acquisition and settlement of the Offer
Acquisition of the shares will be managed by the Agent, acting as intermediary in the
acquisition and settlement operation on behalf of Kaneka.
The price of the shares will be settled and paid no later than the eighth (8th) trading day after
the expiry of the Acceptance Period (the “Payment Date”), in accordance with the
procedure established to this end on regulation 11 of MAB’s Circular 7/2017 (“Normas de
contratación de acciones de Empresas en Expansión y de Sociedades Anónimas Cotizadas
de Inversión en el Mercado Inmobiliario (SOCIMI) a través del Mercado Alternativo Bursátil”).
9. COSTS RELATED TO THE ACCEPTANCE AND SETTLEMENT OF THE OFFER
The Offeror will bear the expenses originated by the processing of the Offer and those that, in
relation to its settlement, correspond to the Offeror in accordance with the regulatory rules
set out by MAB. In no case shall the Offeror be responsible nor bear the commissions and/or

9
expenses that the depository entities of the shares may charge their clients (accepting
shareholders) for the processing of the declarations of acceptance of the Offer.
Any other expenses other than those previously outlined will be borne by whoever incurs in
them.
The shareholders of the Company shall seek proper advice on the exact amount of the
expenses that they will have to satisfy in case of acceptance of the Offer.
10. PURPOSE OF THE TRANSACTION
As anticipated, the first purpose sought by the Offeror with this Offer is to reach control over
the Company, once it has had the opportunity to consolidate its position and joint venture
during the previous year and to confirm the synergies between both entities. Likewise, this
Offer is also aimed to (a) help to further develop the business of the Company; (b) achieve a
mutual consolidation within Kaneka Group with stronger links between the Company, on the
one side, and Kaneka, on the other side; and (c) improve synergies and make internal
policies more efficient in terms of management and corporate governance.
Likewise, as a subsequent and immediate next step, the ultimate goal of the Offeror under
this Offer is to promote the delisting of AB-Biotics’ shares from MAB following provisions in
article 34 of the Company’s Bylaws and in accordance with Section Six of MAB’s Circular
2/2018. This decision has been adopted by the Offeror based on the following reasons:
(a) The industry of Probiotics is thriving, and the market is tending to, consolidation due to
the increase of competition, which is leading to, on the one side, an increase in costs
(CAPEX, R&D, etc.) and, on the other side, a progressive margin reduction as it is
foreseen by most of sector participants and analysts. Due to that, the Company will
need to tackle a vertical integration to compete fiercely with new products, new
market niches and potential acquisitions (M&A) which will likely require substantial
funding and investments in capital (through the relevant mechanisms set out under
Spanish law for equity contribution and/or capitalisation) to maintain the financial
orthodoxy vis-a-vis clients, suppliers and employees.
Kaneka, currently the majority shareholder and strategic partner of the Company, with
a market capitalization as of July 9 of [Yen 275.074 billion billion][Eur 2.26 billion], has
the resources and a clear vocation to participate into this corporate process in a
decisive way by providing capital in better conditions than those that capital markets
may offer, but which could harm those other shareholders who cannot or don´t want to
face these material challenges and a potential dilution in the long term.
(b) Listing in MAB entails certain costs, formalities and expenses that the Company would
be able to avoid in order to optimize margins and concentrate efforts in the execution
of the challenging business plan without the volatility and pressure of the capital
markets, especially in a secondary market with reduced liquidity.
(c) Kaneka Group has a great recognition and respect for all the Company’s shareholders
and their strong support during the last years, especially for those who supported the
several capital increases in 2011, 2012, 2013 and 2016. This Offer, including the Offer
Price, represents an opportunity for those shareholders to benefit from a symmetric offer

10
that has been carefully calculated to reflect a solid premium over the fair delisting price
identified by the Independent Appraiser in their independent valuation appraisal.
(d) The Company and Kaneka Group have had to make significant economic and timing
efforts during the previous months in order to align reporting of both companies with
their relevant regulators, a circumstance that would not be required in case the
Company is finally delisted from MAB.
Once the Offer is settled, the Offeror would implement delisting following the corporate
mechanisms legally available to that purpose.
11. SUPPORT TO THIS OFFER
It is stated that Mr. Miquel A. Bonachera and Mr. Sergi Audivert, founders and significant
shareholders of the Company, have expressed their support to this Offer and the ultimate
intention to delist the shares of the Company, and to the conditions set out hereto as well as
they have verbally informed the Offeror about their intention to transfer shares under this
Offer pursuant to the procedures set out in section 8 above.
12. BYLAWS
The Offeror does not intend to amend the Corporate Bylaws of the Company or of any other
company in its group as a consequence of the Offer. However, should the exclusion of AB-
Biotics’ shares from MAB be agreed by the Company’s General Shareholders’ Meeting after
the Offer, the relevant amendments to the Company Bylaws will be made.

11
This Announcement is issued on July 9, 2019 on behalf of Kaneka Europe Holding Company
NV
Mr. Shinji Mizusawa
President and Managing Director of
KANEKA EUROPE HOLDING COMPANY NV

12
Annex I
Independent Appraiser’s Report

July 09th, 2019
Independent Valuation
Project AB
Strictly Private & Confidential
Audit | Tax | Advisory

PROJECT AB
……………………………………………………………………………………………………………………………………………………………………………………………………………………………………………………………..
According to our understanding of the transaction, Kaneka Europe Holding Company NV (hereinafter
the “Client”) is considering to promote a takeover bid over AB-Biotics, S.A. (“Target” or the “Company”
or “Business”) over which already owns 39.8% of the total shares.
In accordance with your instructions, we have performed a valuation of the fair value of the Target
according to the Royal Decree 1066/2007 for delisting TOB purposes.
As set out in our engagement letter dated June 5th 2019, we were required to perform valuation
procedures over the Target and report to you on the matters set out in the Scope of Work as detailed in
our engagement letter.
The information contained in this report is based primarily on public information and industry experts
explanations, however we do not had access to the Management of the Target and hence we could not
verify some of this information.
In no event shall we be liable for any loss or expense arising in any way from fraudulent acts,
misrepresentation or wilful default on the part of Target, its directors, employees or agents.
We point out that the scope of our work did not include a review of Target’s markets or its competitive
position within these markets, nor any operational or technical due diligence.
This report has not been updated for any subsequent information which may have become available
after this date.
This report is intended for the sole use of the directors of our client acting in relation to the Proposed
Transaction . If others choose to rely in any way on the contents of this report they do so entirely at their
own risk. Copies of this report, or extracts therefrom, should not be provided to third parties without our
prior written consent or if specifically stated in this report .
Events and circumstances occurring after the date of our report will, in due course, render our report out
of date and, accordingly, we will not accept a duty of care nor assume responsibility for decisions and
actions which are based upon such an out of date report. Additionally, we have no responsibility to
update this report for events and circumstances occurring after this date.
If there are any matters upon which you require clarification or further information, please contact the
partner of the engagement.
Yours faithfully,
Fernando Segú
Crowe I Financial Advisory
Crowe I Financial Advisory
Paseo de la Castellana, 130
28046 Madrid
T. +34 914 517 030
F. +34 913 990 641
www.crowe.es
July 09th, 2019
Dear Sirs,
Kaneka Europe Holding
Lenneke Marelaan 4, Zaventem,
Flanders 1932,
Belgium
Page 2

PROJECT AB
……………………………………………………………………………………………………………………………………………………………………………………………………………………………………………………………..
Glossary
# Number MaB Alternative Investment Market / Mercado Alternativo Bursatil
% Percentage n.a. Not available
€ Euros n.q. Not quantified
€k Euros in thousands n/a Not applicable
€m Euros in millions NOL Net Operating Loss
Adjs. Adjustments NV Anonymous Society / Naamloze Vennootschap / Sociedad Anonima
β Leveraged Beta OPEX Operating expenses
BS Balance Sheet P&L Profit and Loss
c. Circa/ approximately p.p. Percentage points
CAGR Compound Annual Growth Rate R&D Research and Development
CAPEX Capital expenditure Rc Risk- country
CIT Corporate Income Tax RD Royal Decree /Real Decreto
CNAE National Classification of Economic Activities / Clasificación Nacional de Actividades Económicas Rd Cost of Debt
COGS Cost of Goods Sold Re Cost of equity
CPI Consumer Price Index Rf Risk- free rate of return
Crowe Crowe Advisory SP, S.L. Rm Rate market
D Debt Rr Regulatory risk
D&A Depreciation and Amortization ROCE Return on capital employed
DCF Discounted cash flow Ru Individual risk
DIO Days inventories outstanding S.A. Anonymous Society / Sociedad Anonima
DPO Days payable outstanding S.L. Limited responsability company / Sociedad limitada
DSO Days sales outstanding SH Shareholder
DTA/DTL Deferred tax assets /Deferred tax liabilities Sp Size premium
E Equity ST/LT Short term/Long term
EBIT Earnings before interest and income taxes Tc Corporate tax rate
EBITDA Earnings before interest, income taxes, depreciation and amortisation The Business AB - Biotics S.A.
EBT Earnings before income tax The Client Kaneka Europe Holding
EU European Union The Company AB - Biotics S.A.
EV Enterprise value The Recipient Person with access to this report
FCF Free Cash Flow The target AB - Biotics S.A.
FTE Full Time Equivalents TOB TakeOver Bid
FX Foreign Exchange TV Terminal Value
FY16, FY17, FY18, etc. Fiscal Years ended in December 16, December 17 and December 18, etc. US SIC United States Standard Industrial Classification
GDP Gross Domestic Product USD United States Dollar / Dólar Americano
KPI Key Perfomance Indicator Var. Variation
LTM Last Twelve Months WACC Weighted average cost of capital
L6M Last Six Months WCR Working Capital Requirements
Page 3

PROJECT AB
……………………………………………………………………………………………………………………………………………………………………………………………………………………………………………………………..
Agenda
Section
Page 4
1. About Crowe 4
2. Scope and limitations 10
3. Executive Summary 12
4. Company overview 18
5. Methodology 23
6. Market multiples 26
7. Recent industry transactions 28
8. Average share price 30
9. Discounted cash flow 32
10. Valuation 41
Appendices
A. Appendices 44

PROJECT AB
……………………………………………………………………………………………………………………………………………………………………………………………………………………………………………………………..
Crowe Spain
Spanish member firm of Crowe Global
• Turnover of around c.€35million.
• Led by over 40 partners, with 400 people.
• Operating from 10 offices.
Business Plan Assessment
Strategic Consulting
Management Support
Mergers & Acquisitions
Capital Markets
Valuation
Crowe Global Services
Audit
Forensic Services
Tax
Restructuring
Legal
Due Diligence
Crowe Global
• One of the world's leading
organisations of independent
assurance, tax and advisory firms
• Combined turnover of $4.3 billion
during 2018.
• Over 36,000 people based in over
130 countries.
About Crowe
Page 5
ABOUT CROWE

PROJECT AB
……………………………………………………………………………………………………………………………………………………………………………………………………………………………………………………………..
CareWe take care of all our clients,
our firm and our stakeholders
and we aspire to convert our
efforts into value.
ShareWe choose to work as a family,
sharing responsibilities and
successes. Collaboration, training
and mutual support define our
relationships.
InvestWe invest in people and develop
our resources to expand the
value we bring to our customers.
We embrace change and
encourage continuous learning.
GrowWe seek growth and profitability
sustained over time to reach a higher
level as professionals and respond to
the challenges posed by our customers
and communities.
The values that inspired the creation of our firm guide us in all our decisions.
About Crowe
Page 6
ABOUT CROWE

PROJECT AB
……………………………………………………………………………………………………………………………………………………………………………………………………………………………………………………………..
Wide team
experience with
valuable expertise in many
industries.
Perfect coordinationof international and
multidisciplinary teams for
cross-border operations.
Senior interlocution always available, giving
quick answers at
critical moments of
decision making.
Proactive approach aimed
at detecting the risks of
the transaction and
proposing solutions to
mitigate them
Knowledge, thanks to
the extensive Crowe
network, of the various
accounting plans and local
laws with a guaranteed
standard service.
High quality of work
resulting from the
acquired experience and
from the exhaustive
quality controls
established internally
worldwide.
About Crowe
Page 7
ABOUT CROWE

PROJECT AB
……………………………………………………………………………………………………………………………………………………………………………………………………………………………………………………………..
Recent valuation credentials
About Crowe
Advised
In the valuation of minority
stakes in audiovisual
companies.
Advised
In the valuation of two
profesional services
companies in their merger
process.
Confidential
Advised
In the valuation of the
Company and sinergies
assessment of Stoneworks
during a transaction.
Advised
Strategy appraisal Eurona
Telecom (commercial &
strategic Due Dilligence)
Advised
In the valuation of the
Company and sinergias
assessment of Quantis
España and Quantis
Marruecos during a
transaction.
Advised
In the valuation of both
companies during a merger
process.
Advised
PPA and impairment test of
the companies: Sultan,
Hablaya, Stoneworks,
Quantis España, Quantis
Marruecos and Kubi
Advised
In the valuation of the
Company Beloud
Technologies
Advised
In the valuation of 40
renewable projects at
different development
stages.
Advised
In the Due Diligence and
valuation process of the
acquisition of different
projects in France, Germany,
UK, USA and Poland.
Page 8
ABOUT CROWE

PROJECT AB
……………………………………………………………………………………………………………………………………………………………………………………………………………………………………………………………..
Other credentials
About Crowe
Advised
In the buy-side Due
Diligence for the
acquisition an engineering
group.
Advised
In the buy-side Due
Diligence for the
acquisition of a perfumery
group.
Advised
In the MaB listing
operation Due Diligence
for several SOCIMI as
registered advisor.
Advised
In the buy-side Due
Diligence for the
acquisition of Alimentación
Solo Seafoods group.
GATA CAPITAL
Advised
In the vendor assistance
during the investment
process in a food sector
company.
Advised
In the buy-side Due
Diligence for the
acquisition of a
telecommunication group
in the south of Spain.
Advised
In the buy-side due
diligence for the
acquisition of PEVAFERSA
Group assets
.
Confidential
Advised
In the buy-side due
diligence for the
acquisition of an
engineering group
Advised
In the buy-side Due
Diligence for the
acquisition of Tarbis.
Advised
In the buying Due
Diligence and valuation
process of Infaimon Group.
Page 9
ABOUT CROWE
Advised
In the buy side Due
Diligence for the entry in
the share capital of Iris
Group.
Advised
In the buying Due
Diligence of Pangea. The
travel store

PROJECT AB
……………………………………………………………………………………………………………………………………………………………………………………………………………………………………………………………..
Agenda
Section
Page 10
1. About Crowe 4
2. Scope and limitations 10
3. Executive Summary 12
4. Company overview 18
5. Methodology 23
6. Market multiples 26
7. Recent industry transactions 28
8. Average share price 30
9. Discounted cash flow 32
10. Valuation 41
Appendices
A. Appendices 44

PROJECT AB
……………………………………………………………………………………………………………………………………………………………………………………………………………………………………………………………..
Scope and limitations
Any person who is not an addressee of this report or who has not signed and returned to
Crowe Advisory SP, S.L. (“Crowe") an Access Letter in Crowe’s prescribed form is not
authorized to have access to this report.
Should any unauthorized person obtain access to this report, such person (the
"Recipient"), by reading this report, accepts and agrees to the following terms:
1. The work performed by Crowe was performed in accordance with instructions provided
by our addressee client and was performed exclusively for our addressee client's sole
benefit and use.
2. This report was prepared at the direction of our addressee client and may not include all
procedures deemed necessary for the purposes of the reader.
3. Crowe, its partners, employees and agents, neither owe nor accept any duty or
responsibility to such person, whether by contract or otherwise (including without
limitation, for negligence or breach of any statutory duty), and shall not be liable in
respect of any loss, damage or expense whatsoever incurred by such person as a result of
his or her use of this report, or as a result of his or her access to the report. Further, note
that this report is meant to be quoted in the tender offer announcement, but should not
be distributed for any other purpose to any other person.
4. The recipient shall make no claims whatsoever against Crowe, its partners, employees or
agents arising out of, relating to, or in connection with this report or any of the contents
herein.
Our work and observations included herein were based primarily on the following sources
of information:
▪ All the information used for the elaboration of this report is of public knowledge and was
mainly originated in industry reports such as GVC Gaesco and report published by the
MaB.
▪ Additionally we used the Audited Annual Accounts for the years 2017 and 2018.
▪ All the financial information, valuation ratios and share prices were extracted from Infront
analytics, Yahoo Finance, Thomson Reuters and Bloomberg.
▪ No information was provided by the Target
Important scope comments:
▪ Given that we had no access to the Management of the Target, we could not contrast
with them some of the growth hypothesis established by the industry experts analysis.
Hence we applied our best professional criteria to contrast and verify the reasonability of
these hypothesis among several industry reports and analyst opinions.
▪ We would like to emphasize that we are not legal experts and any reference in the report
to legal matters have been included in accordance to the client advisors.
▪ Our work has focused on the 2018 audited financial statements prepared in Spanish
GAAP, the projections until 2022 and the review of main inputs included during all the
period.
▪ Once received the 1Q19 real figures we proceeded to update the FY19F figures and
onwards projections.
Page 11
SCOPE AND LIMITATIONS

PROJECT AB
……………………………………………………………………………………………………………………………………………………………………………………………………………………………………………………………..
Agenda
Section
Page 12
1. About Crowe 4
2. Scope and limitations 10
3. Executive Summary 12
4. Company overview 18
5. Methodology 23
6. Market multiples 26
7. Recent industry transactions 28
8. Average share price 30
9. Discounted cash flow 32
10. Valuation 41
Appendices
A. Appendices 44

PROJECT AB
……………………………………………………………………………………………………………………………………………………………………………………………………………………………………………………………..
Executive Summary | Profit and loss
Profit and loss
• The Target increased its revenues a 73.3% CAGR between FY16 and FY18 mainly
due to the organic growth of the Company related to the increase of approved
products in Europe, Latam and Asia. The 54.6% of the total revenues are
generated in Europe and 31.1% in Asia & Pacific.
• During 2018, the exports increased 80% mainly driven by the sales in Asia Pacific
and Latam (121% and 123% respectively) with the opening of new markets such
as Russia and China.
• COGS caption mainly comprises merchandises purchase amounting to €4.5m in
FY18 (€2.2m in FY17) mainly in EU and raw material consumption amounting to
€2.5m in FY18 (€1.4m in FY17). This caption increased 98.2% CAGR in line with
the revenues growth. Note that the Target benefited from scale economies and
cost savings.
• Other operating income comprises subsidiaries income and other non-core
operating income. The subsidiaries income correspond to the implicit interest
subsidised by the granted of zero-interest loans granted for R&D project.
• Personnel expenses decreased from 51.4% as % of revenue in FY16 to 15.5%
FY18 due to cost savings process introduces by the Target during the period.
The employees average headcount decreased from #38 in FY16 to #30 in FY18.
However, the average cost per employee increased from €53.6k in FY16 to
€61.3k in FY18.
• The cost savings process developed by the Company decreased OPEX caption
as a % of revenues from 58.2% in FY16 to 17.2% in FY18, mainly driven by the
R&D outsourcing and the sponsorship of the projects.
• The Company increased its EBITDA from €(1.5)m in FY16 to €2m in FY18 mainly
driven by the revenues increase and the cost savings process. In FY18 the
EBITDA represented 16.8% as a % of revenues.
• The main below EBITDA caption was D&A amounting to €(1.2)m as at FY18,
mainly comprising R&D capitalised costs amortisation amounting to €(945)k in
FY18.
The Company increased its EBITDA from €(1.5)m in FY16 to €2m in FY18 mainly driven by the revenues increase and the
cost savings process
Profit and Loss - AB-Biotics
€ in thousand FY16 FY17 FY18
Var. % FY17 -
FY18
CAGR %
FY16 - FY18
Revenues 3,961 7,208 11,892 65.0% 73.3%
Capitalised costs 1,137 512 701 37.0% (21.5%)
COGS (1,853) (4,014) (7,280) 81.4% 98.2%
Gross margin 3,245 3,706 5,314 43.4% 28.0%
Other operating income 289 259 633 144.7% 48.0%
Personnel expenses (2,035) (1,674) (1,839) 9.9% (4.9%)
OPEX (2,304) (1,811) (2,046) 13.0% (5.8%)
Bad debt (848) (267) (99) (62.9%) (65.9%)
Other result 199 0 39 22779.1% (55.5%)
EBITDA (1,454) 212 2,002 842.3% n.a.
D&A (1,090) (1,137) (1,190) 4.7% 4.5%
Impairments and sale of Fixed Assets - 216 1 (99.8%) n.a.
EBIT (2,544) (708) 812 (214.7%) n.a.
Financial income 19 20 8 (61.5%) (35.8%)
Financial expenses (271) (236) (243) 2.8% (5.4%)
EBT (2,797) (924) 577 (162.5%) n.a.
CIT (3,192) 29 641 2082.1% n.a.
Net result (5,989) (895) 1,218 (236.1%) n.a.
As a % of revenues
Gross Margin 81.9% 51.4% 44.7% -6.73p.p.
Other operating income 7.3% 3.6% 5.3% 1.73p.p.
Personnel expenses (51.4%) (23.2%) (15.5%) 7.76p.p.
OPEX (58.2%) (25.1%) (17.2%) 7.93p.p.
Bad debt (21.4%) (3.7%) (0.8%) 2.87p.p.
EBITDA (36.7%) 2.9% 16.8% 13.89p.p.
Source: Audited Annual report
Page 13
EXECUTIVE SUMMARY

PROJECT AB
……………………………………………………………………………………………………………………………………………………………………………………………………………………………………………………………..
Executive Summary | Balance Sheet
Balance sheet
• The Fixed assets of the Company as at Dec-18 comprise (i) intangible assets
including development projects related to clinical studies amounting to €5.7m
and patents, licenses, software and advances amounted to €712k (ii) tangible
assets amounting to €204k related to technical facilities and machinery and (iii)
long-term financial investments amounting to €669k related to deposits and
bails, guarantees, bond funds and yield funds.
• The Inventories of the Company mainly comprise by raw materials and other
supplies amounting to €407k, trade products amounting to €156k and advances
made to suppliers amounting to €46k as at Dec-18.
• Trade receivables mainly corresponding to (i) customers receivables for sales
and customers of group companies and associates amounting to €3.5m, (ii)
public administration creditor amounting to €152k and (iii) personnel amounting
to €27k as at Dec-18.
• The Trade payables of the Company comprise (i) short-term suppliers
amounting to €1.0m, (ii) other creditors amounting to €1.3m, (iii) public
administration debts amounted to €155k and (iv) outstanding remunerations of
personnel amounting to €43k as at Dec-18.
• The Net debt of the Company comprises (i) loans in connection to R&D projects
granted by public administration amounting to €3.9m, (ii) debts with credit
institutions amounting to €335k, (iii) short-term financial investments amounting
to €1.0m related to equity instruments, loans to companies and other financial
assets and (iv) cash and cash equivalents amounting to €1.8m as at Dec-18.
• Other assets and liabilities mainly comprise long-term accruals related to the
exclusive distribution license agreement with Kaneka and deferred taxes of the
Company.
• The Equity of the Company mainly comprises share capital amounted to (i)
€629k (12,588,259 shares amounting to €0.05 per share), (ii) share premium
amounting to €18.6m, (iii) reserves amounting to €30k, (iv) subsidies received
amounting to €384k and (v) own shares amounting to €(309)k as at Dec-18.
The Company maintains loans in connection to R&D projects granted by public administration and credit institutions
amounting to €3.9m and €335k respectively as at Dec-18
Balance Sheet Annual Acount - Project AB
€ in thousands Dec-16 Dec-17 Dec-18
Intagible assets 7,223 6,290 6,430
Tangible assets 341 284 204
Long-term financial investments 525 683 669
Fixed assets 8,090 7,258 7,303
Inventories 333 276 609
Trade receivables 1,201 2,149 3,724
Trade payables (1,411) (2,147) (2,583)
ST accruals (68) (550) (131)
Working capital 55 (273) 1,619
Long-term debt (3,714) (3,481) (3,151)
Short-term debt (1,559) (1,053) (1,045)
Short-term financial investments 48 24 1,004
Cash and cash equivalents 2,688 2,430 1,769
Net debt (2,538) (2,079) (1,423)
DTA 87 - 652
DTL (127) (165) (128)
Provisions - - (9)
LT accruals - - (1,155)
Other assets and liabilities (40) (165) (640)
Share capital 629 629 629
Share premium 18,732 18,574 18,586
Legal reserves 4 4 4
Other reserves 26 26 26
Negative results of previous years (6,761) (12,750) (13,645)
Subsidies, donations and legacies received 382 496 384
Owns shares (1,456) (1,345) (309)
Net profit/Loss for the year (5,989) (895) 1,218
Adjustments for value change - - (35)
Equity 5,567 4,740 6,859
DPO (days) 82 96 74
DSO (days) 33 78 85
DIO (days) 66 25 31
Source: Annual report
Page 14
EXECUTIVE SUMMARY

PROJECT AB
……………………………………………………………………………………………………………………………………………………………………………………………………………………………………………………………..
Executive Summary | Current trading
Page 15
EXECUTIVE SUMMARY
Balance Sheet - AB-Biotics
€ in thousands Dec-16 Dec-17 Dec-18 Mar-19
Intagible assets 7,223 6,290 6,430 6,516
Tangible Assets 341 284 204 194
Long-term financial investments 525 683 669 669
Fixed assets 8,090 7,258 7,303 7,379
Inventories 333 276 609 1,069
Trade receivables 1,201 2,149 3,724 2,706
Trade payables (1,411) (2,147) (2,583) (2,685)
Accruals ST (68) (550) (131) (107)
Working capital 55 (273) 1,619 983
Long-term debt (3,714) (3,481) (3,151) (2,705)
Short-term debt (1,559) (1,053) (1,045) (1,078)
Short-term financial investments 34 24 1,004 965
Short-term group companies investments 14 - - -
Cash and cash equivalents 2,688 2,430 1,769 2,208
Net debt (2,538) (2,079) (1,423) (611)
DTA 87 - 652 604
DTL (127) (165) (128) (120)
Provisions - - (9) (12)
LT accruals - - (1,155) (1,099)
Other assets and liabilities (40) (165) (640) (627)
Share capital 629 629 629 629
Share premium 18,732 18,574 18,586 18,586
Legal reserves 4 4 4 126
Other reserves 26 26 26 26
Negative results of previous years (6,761) (12,750) (13,645) (12,548)
Subsidies, donations and legacies received 382 496 384 360
Owns shares (1,456) (1,345) (309) (164)
Net profit/Loss for the year (5,989) (895) 1,218 124
Adjustments for value change - - (35) (14)
Equity 5,567 4,740 6,859 7,125
DPO (days) 82 96 74 147
DSO (days) 33 78 85 108
DIO (days) 66 25 31 32
Source: Annual report
Profit and Loss - AB-Biotics
€ in thousand FY17 FY18 YTD18 YTD19
Var. %
FY17 -
FY18
Var. %
YTD18 -
YTD19
Revenues 7,208 11,892 1,770 2,702 65.0% 52.6%
Capitalised costs 512 701 157 261 37.0% 66.6%
COGS (4,014) (7,280) (1,122) (1,519) 81.4% 35.4%
Gross margin 3,706 5,314 805 1,443 43.4% 79.3%
Other operating income 259 633 140 82 144.7% (41.7%)
Personnel expenses (1,674) (1,839) (351) (512) 9.9% 45.8%
OPEX (1,811) (2,046) (473) (558) 13.0% 18.1%
Bad debt (267) (99) (95) 8 (62.9%) (108.4%)
Other result 0 39 33 34 22779.1% 1.9%
EBITDA 212 2,002 60 497 842.3% 730.8%
D&A (1,137) (1,190) (281) (310) 4.7% 10.3%
Impairments and sale of Fixed Assets 216 1 - (2) (99.8%) n.a.
EBIT (708) 812 (221) 186 (214.7%) (184.0%)
Financial income 20 8 1 2 (61.5%) 250.3%
Financial expenses (236) (243) (67) (22) 2.8% (66.8%)
EBT (924) 577 (287) 165 (162.5%) (157.6%)
CIT 29 641 - (42) 2082.1% n.a.
Net result (895) 1,218 (287) 124 (236.1%) (143.1%)
As a % of revenues
Gross Margin 51.4% 44.7% 45.5% 53.4% -6.73p.p.
Other operating income 3.6% 5.3% 7.9% 3.0% 1.73p.p.
Personnel expenses (23.2%) (15.5%) (19.8%) (18.9%) 7.76p.p.
OPEX (25.1%) (17.2%) (26.7%) (20.7%) 7.93p.p.
Bad debt (3.7%) (0.8%) (5.4%) 0.3% 2.87p.p.
EBITDA 2.9% 16.8% 3.4% 18.4% 13.89p.p.
Source: Audited Annual report

PROJECT AB
……………………………………………………………………………………………………………………………………………………………………………………………………………………………………………………………..
Executive Summary | Cash flow
Cash flow
• During FY18, the Target significantly increased the cash revenues mainly due to the Asia and LATAM markets expansion and
the LT accrual of the agreement with Kaneka amounting to €1.2m.
• The Target’s CAPEX is mainly related to R&D development. Additionally, during FY17 the Company sold the development of
a product to Frutaron group amounting to €416k.
• The WC variation decrease during FY18 is mainly due to the DSO and DIO increase (from 78 to 85 days and from 25 to 31
days respectively)
• The equity increase are mainly related to subsidies received by the Target related to R&D projects.
• The financial debt movement is related to the debt repayment and guarantees return during FY17.
• The financial investments are mainly related to ST investments in investment funds.
Between FY16 and FY18, the main cash flow movements of the Target are related to revenues increase, working capital,
CAPEX and financial debt.Cash Flow FY16-FY18 - Project AB
€ in thousand FY17 FY18
EBITDA cash 315 3,077
CAPEX (348) (1,250)
Working Capital 141 (1,923)
Other result 416 1
CIT 97 (47)
Operating Cash Flow 622 (143)
Financial debt (739) (338)
Financial investments (134) (965)
Financial results (216) (235)
Financial Cash Flow (467) (1,681)
Changes in Equity 209 1,020
Total Cash Flow (258) (661)
Initial cash 2,688 2,430
Final cash 2,430 1,769
Cash variation (258) (661)
Source: Audited Annual Accounts
2,688 2,430
1,769
315 141 416
97
209
3,077
1
1,020
(348)
(739)
(134)(216)
(1,250)
(1,923)
(47) (338)
(965)
(235)
-
1,000
2,000
3,000
4,000
5,000
6,000
€ in t
ho
usa
nd
s
Cash Flow bridge FY16-FY18 - Project AB
1
1
2
2
3
5
5
6
1
2
3
4
4
4
5
2
6
Note that, the estimated ratio of FCF/EBITDA for the Company amounts to c.72% in average all along the projection, in line with the Biogaia and
Probi estimated ratios. Please refer discounted cash flow for further details.
Page 16
EXECUTIVE SUMMARY

PROJECT AB
……………………………………………………………………………………………………………………………………………………………………………………………………………………………………………………………..
Executive Summary
Observation Recommendation
Valuation
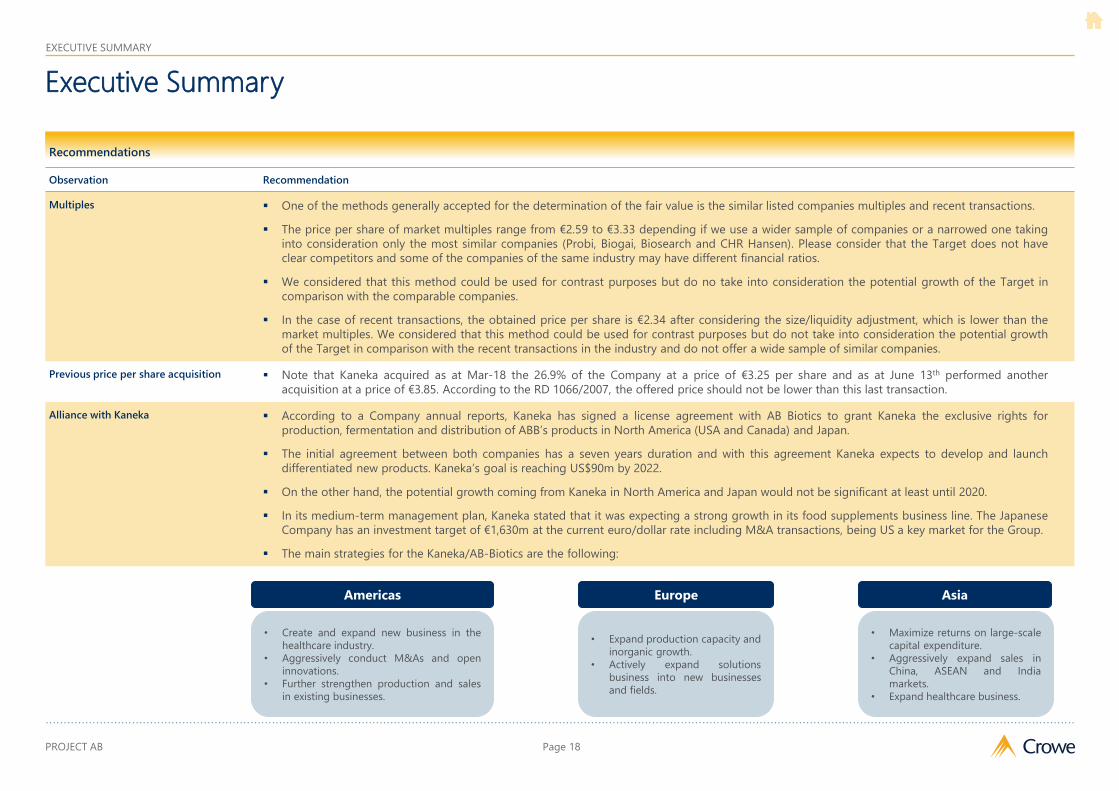
▪ Given that the purpose of the valuation is to determine a fair price for the takeover bid that the Client is planning to promote over the shares of AB-Biotics and
considering that the ultimate purpose of the Client is to promote the delisting of the Company, in accordance with its legal advisors, we should take into
consideration the Royal Decree 1066/2007 which establish rules governing the determination of a fair value and the delisting takeover bids regime in Spain.
▪ The law establish several valuation methods to be used in order to determine the fair value of the share and the delisting price in a delisting TOB. An
hypothetically delisting TOB offer should not be lower in any case to the higher value obtained applying these methods.
▪ Considering that the share price significantly raised during the last months, the highest value obtained considering all the valuation methods set in article
9 and 10.5 of Royal Decree 1066/2007 is the average share price of the last 6 months with a price per share of €4.305 as at 9th of July 2019.
• In this regard, the highest value amongst all the parameters referred to above would be the one corresponding to the “Average Share Price” (i.e. price per share
amounting to €4.305).
• Based on that, and for the avoidance of any doubt about the value, we conclude that the delisting value for the analysed scenario should not be lower
than the highest parameter identified hereto (“Average Share Price”), this is, price per share amounting to €4.305.”
Discounted cash flow ▪ The DCF is the most complete method to calculate the price per share given that it considers the future growth of the Target and takes into consideration
different inputs contained within the WACC and size and liquidity adjustments.
▪ The discounted cash flow method entails an equity value of €52,588k with a price per share of €4.18. This value is lower than other industry analysis such as
GVC Gaesco or Researchfy. The difference mainly arise from the projected revenues increase which we have estimated applying the percentage of increase of
GVC Gaesco and Management over the 2018 real figures. Please refer to DCF section for further details.
Recommendations
Valuation options according to article of RD 1066/2007
€ DCF
Wide
market
multiples
Narrow
market
multiples
Recent
transactions
Average share
price Last transaction
EV/EBITDA 26.98 17.98 22.90 16.34 27.78 24.92
EBITDA 2,002,243 2,002,243 2,002,243 2,002,243 2,002,243 2,002,243
Enterprise Value 54,010,866 36,005,335 45,851,365 32,718,252 55,619,554 49,887,436
Size/liquidity adjustment n/a 5.50% 5.50% 5.50% n/a n/a
Enterprise Value after size adjustment 54,010,866 34,025,041 43,329,540 30,918,749 55,619,554 49,887,436
Net debt (1,422,639) (1,422,639) (1,422,639) (1,422,639) (1,422,639) (1,422,639)
Equity Value 52,588,227 32,602,402 41,906,901 29,496,110 54,196,915 48,464,797
Number of shares 12,588,259 12,588,259 12,588,259 12,588,259 12,588,259 12,588,259
Price per share 4.18 2.59 3.33 2.34 4.305 3.85
Source: Crowe analysis, Annual Accounts, Infront analytics and Yahoo finance
Page 17
EXECUTIVE SUMMARY
PROJECT AB
……………………………………………………………………………………………………………………………………………………………………………………………………………………………………………………………..
Executive Summary
Observation Recommendation
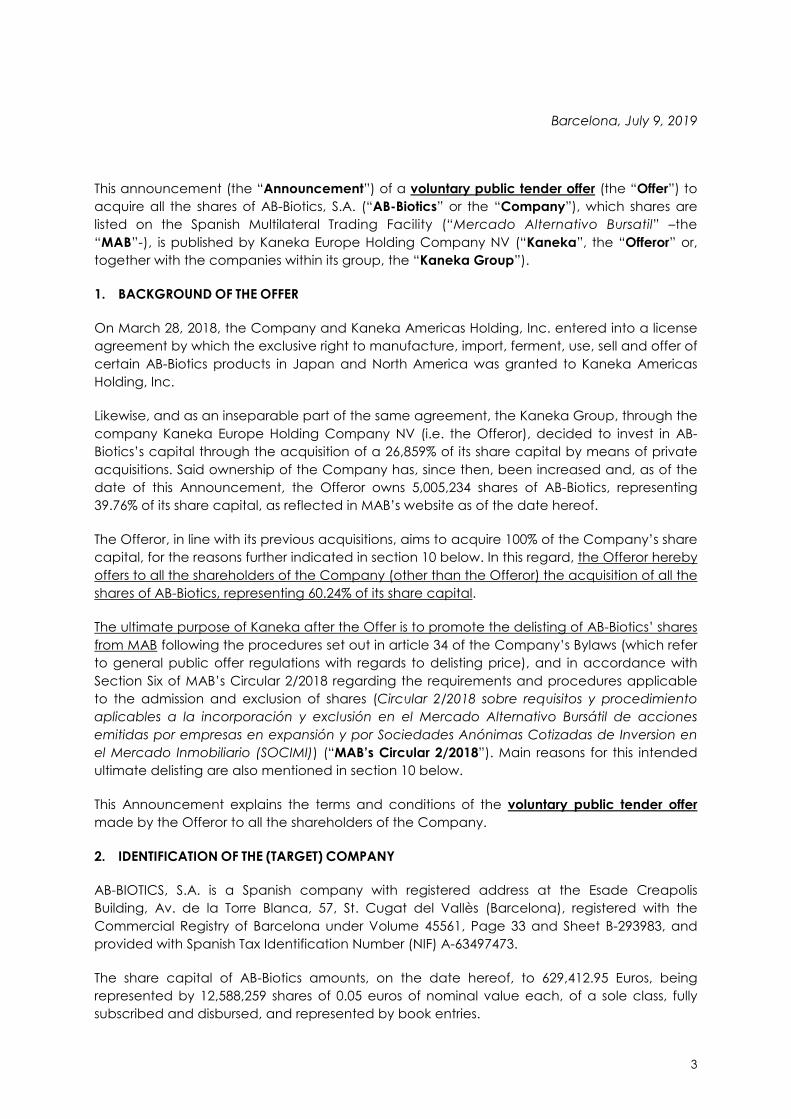
Multiples ▪ One of the methods generally accepted for the determination of the fair value is the similar listed companies multiples and recent transactions.
▪ The price per share of market multiples range from €2.59 to €3.33 depending if we use a wider sample of companies or a narrowed one taking
into consideration only the most similar companies (Probi, Biogai, Biosearch and CHR Hansen). Please consider that the Target does not have
clear competitors and some of the companies of the same industry may have different financial ratios.
▪ We considered that this method could be used for contrast purposes but do no take into consideration the potential growth of the Target in
comparison with the comparable companies.
▪ In the case of recent transactions, the obtained price per share is €2.34 after considering the size/liquidity adjustment, which is lower than the
market multiples. We considered that this method could be used for contrast purposes but do not take into consideration the potential growth
of the Target in comparison with the recent transactions in the industry and do not offer a wide sample of similar companies.
Previous price per share acquisition ▪ Note that Kaneka acquired as at Mar-18 the 26.9% of the Company at a price of €3.25 per share and as at June 13th performed another
acquisition at a price of €3.85. According to the RD 1066/2007, the offered price should not be lower than this last transaction.
Alliance with Kaneka ▪ According to a Company annual reports, Kaneka has signed a license agreement with AB Biotics to grant Kaneka the exclusive rights for
production, fermentation and distribution of ABB’s products in North America (USA and Canada) and Japan.
▪ The initial agreement between both companies has a seven years duration and with this agreement Kaneka expects to develop and launch
differentiated new products. Kaneka’s goal is reaching US$90m by 2022.
▪ On the other hand, the potential growth coming from Kaneka in North America and Japan would not be significant at least until 2020.
▪ In its medium-term management plan, Kaneka stated that it was expecting a strong growth in its food supplements business line. The Japanese
Company has an investment target of €1,630m at the current euro/dollar rate including M&A transactions, being US a key market for the Group.
▪ The main strategies for the Kaneka/AB-Biotics are the following:
Recommendations
Page 18
• Expand production capacity and
inorganic growth.
• Actively expand solutions
business into new businesses
and fields.
• Maximize returns on large-scale
capital expenditure.
• Aggressively expand sales in
China, ASEAN and India
markets.
• Expand healthcare business.
• Create and expand new business in the
healthcare industry.
• Aggressively conduct M&As and open
innovations.
• Further strengthen production and sales
in existing businesses.
Americas Europe Asia
EXECUTIVE SUMMARY

PROJECT AB
……………………………………………………………………………………………………………………………………………………………………………………………………………………………………………………………..
Agenda
Section
Page 19
1. About Crowe 4
2. Scope and limitations 10
3. Executive Summary 12
4. Company overview 18
5. Methodology 23
6. Market multiples 26
7. Recent industry transactions 28
8. Average share price 30
9. Discounted cash flow 32
10. Valuation 41
Appendices
A. Appendices 44

PROJECT AB
……………………………………………………………………………………………………………………………………………………………………………………………………………………………………………………………..
Business overview | The Business
AB-Biotics, S.A. is a thriving Company with revenues amounting to €11,892k with an EBITDA increase of 842.3% between
FY17 and FY18
Revenues (€k)
FTE (#)
Net debt (€k)
FY16 FY17 FY18
3,961 7,208 11,892
2,538 2,079 1,423
38 35 30
(1,454) 212 2,002EBITDA (€k)
Source: Annual accounts
1Q19 FY19F
2,702 14,181
611 n/a
37 n/a
497 2,620
Brief history of the Company
• AB Biotics, S.A. was founded in April 2004 as a spin-off of the Autonomous
University of Barcelona. The Company is specialised in the research,
development, innovation and production of biotechnological solutions which
improve people’s health and welfare.
• The Company is divided in three main business areas (i) AB - Biotics functional
ingredients, devoted to the development of probiotics and nutraceuticals, (ii) AB
- Genotyping, devoted to the genetic analyses for preparation of
pharmacogenetics studies and (iii) AB – Biotics R&D outsourcing, a consultancy
area which is in charge of the integral management of research projects for the
food and pharmaceutical industry.
• Nowadays the Company is a leading biotechnology company, with an
international vocation around the world. The headquarter of the company is
located in Esade-Creápolis, Barcelona.
• The main shareholders of the Company are (i) Miquel Ángel Bonachera Sierra
with a 8.91% , (ii) Sergi Audivert Bruqué with a 8.91%, (iii) Luis Sánchez Lafuente
with 10.15% (8.87% directly and 1.28% through BioLittletec, S.L.) and (iv) since
Jun-2018, Kaneka Europe Holding Company NV with a 39.77%. As a result,
Kaneka Holding has become the main shareholder of AB - Biotics.
• The Company significantly grew during the last years up to a total revenues of
€11.9m during 2018 with an EBITDA of €2m representing a variation of 65.0% in
comparison with the 2017 revenues (€7.2m). The analysts projections estimates
an EBITDA increase of 39.5% until 2022.
• The Company signed more than 80 license agreements with different
pharmaceutical and food supplements companies all over the world, most of
them during the last 4 years.
• The Company aspires to establish state of the art solutions by developing
microbiome modulators to improve people’s health and prevent diseases.
• The Company counts with a team of professionals who are highly qualified in a
variety of fields.
Shareholders
Luis Sánchez
Lafuente
Kaneka Europe
Holding
Company NV
AB – Biotics
S.A.
Other
investors
Company
Miquel Ángel
Bonachera
Sierra
Sergi Audivert
Brugué
8.91% 8.91%
10.15% 39.77% 32.26%
Bio Littletec
S.L.
8.87%
1.28%
Page 20
COMPANY OVERVIEW

PROJECT AB
……………………………………………………………………………………………………………………………………………………………………………………………………………………………………………………………..
Business overview | The Business
AB Biotics, S.A. headquarters are located in Barcelona and has presence in all the continents, while Kaneka Holding Inc.
headquarters are located in Tokyo and mainly has presence in Japan and North America
Barcelona
Tokyo
AB-Biotics headquarters
Kaneka headquarters
AB-Biotics area of presence
Kaneka area of presence
Osaka
Page 21
COMPANY OVERVIEW

PROJECT AB
……………………………………………………………………………………………………………………………………………………………………………………………………………………………………………………………..
Business overview | The Business
• Reduced size
• Non vertically integrated
• Absence of clear regulation
• Lack of vertical integration and
outsourcing dependency
• High and growing competitiveness
• Regulatory uncertainty
• Slowdown of European growth and
cannibalization of the different
categories
• Increase of substitute products
• Key-person dependency risk• Positive track record in the development of
documented probiotics
• B2B model that allows a reduced cost base
with no limited international growth
• Low equity/debt ratio
• Bank of bacteria strain
• Low need of investment in Capex and Net
working capital requirement
• Management, innovation and clinical
documentation
• Low need of public incentives
• Antibiotics substitute
• Ageing of the population
• Alliance with Kaneka and its entry as the
main shareholder
• Vertical integration could increase
margins
• Development of new market niches
• Sustained growth of probiotics market
• Alliance with important market players
Weakness
Threats
Strengths
Opportunities
Weakness
Opportunities
Strengths
Threats
(*) This SWOT analysis is included only for illustrative purposes regardless the outcome of the valuation.
Source: GVC Gaesco and Researchfy
Page 22
COMPANY OVERVIEW

PROJECT AB
……………………………………………………………………………………………………………………………………………………………………………………………………………………………………………………………..
2012
Business overview | History
AB Biotics, S.A. was founded in 2004 as a spin-off of the Autonomous University of Barcelona. In 2018 Kaneka Holding
Inc. became a partner of the company and developed its market in USA, Canada and Japan
• Company founded at UAB
(Autonomous university of
Barcelona)
• Clinical trials probiotics (FI)
• Jul-11, capital increase amounting to €1.43m (€23k
in share capital; €1.41m in share premium) with a
price per share of €3.15
• Nov-11 capital increase amounting to €4.3m (€80k
in share capital; €4.2m in share premium) with a
price per share of €2.7
• 1st financing round (business
angels): €1m
• Focus on own probiotic R&D
• Jul-10 initial Public Offering
(IPO) amounting to €3.5m
(€69k in share capital; €3.4m
in share premium) with a
price per share of €2.53
• R&D plan to develop NFG &
probiotics
Currently.201320102004 2008 2011 20182016 2017
• Launching commercial operations
• First products in the market (NFG,
AB-Life)
• Sep-13 capital increase amounting
to €1,124k (€26k in share capital;
€1,098m in share premium) with a
price per share of €2.15
• New bd’s strategy with focus
on the 78 licenses over the
world and potential markets
• Sep-16, capital increase
amounting to €4.8m (€150k
in share capital; €4.6m in
share premium) with a price
per share of €1.6
• Dec-12, capital increase
amounting to €4.3m
(€100k in share capital;
€4.2m in share
premium) with a price
per share of €2.15
• Strategic partnership with
Kaneka (coq10) in R&D and
US/Canada/Japan market
Page 23
COMPANY OVERVIEW

PROJECT AB
……………………………………………………………………………………………………………………………………………………………………………………………………………………………………………………………..
Agenda
Section
Page 24
1. About Crowe 4
2. Scope and limitations 10
3. Executive Summary 12
4. Company overview 18
5. Methodology 23
6. Market multiples 26
7. Recent industry transactions 28
8. Average share price 30
9. Discounted cash flow 32
10. Valuation 41
Appendices
A. Appendices 44

PROJECT AB
……………………………………………………………………………………………………………………………………………………………………………………………………………………………………………………………..
Methodology
• This report should include a rational justification of the valuation performed and
the price offered based on the following valuation methods:
1) Net book value: This is the value resulting of dividing the equity of the
Company and the total number of shares. We do not consider this method to
be representative given that it does not consider the Target as an operating
Company but use an static focus.
2) Liquidation value: This is the value resulting of adding to the equity value of
the Target the estimation of liquidating assets and liabilities. We do not
consider this to be a suitable method given that it is focused on companies
which will be liquidated after the takeover and the resulting price would be
significantly lower than the obtained through other methods.
3) Weighted average share price during the previous semester: This is the
value resulting of the average share price during the last 6 months previous to
the takeover. The value resulting of this method is usually lower than the ones
obtained though the application of other methods. However, in the case of the
Target, the share price has been significantly raising during the last 6 months
(c.64.1% over the last 6 months at the date of this report) and this value could
be similar to a valuation using other methods.
4) Previously offered consideration: In the case other transactions between the
buyer and the seller were performed during the last 12 months, the delisting
TOB offer should not be lower than the higher of these transactions. In the case
of the Target, no takeover bid was promoted during the last 12 months.
However, Kaneka acquired as at Mar-18 the 26.9% of the Company at a price of
€3.25 per share and as at June 13th performed another acquisition at a price of
€3.85.
5) Other valuation methods: The RD 1066/2007 established additional methods
generally accepted which should be used for valuation purposes such as:
i. Discounted cash flow: Since we were not provided with access to
the Management of the Target, we projected the financial statements
based on industry reports.
We performed valuation procedures based on the methods established in the RD 1066/2007 including DCF and similar
companies multiples
Valuation
• The scope of the assignment is the determination of the market value of the
100% of the listed Company AB-Biotics, S.A. to the date determined by the
Client in order to quantify the future expectations of generating business
wealth that are likely to be estimated.
• Based on valuation purposes, the Value Standard that must be applied is the
Market Value or Fair Market Value.
• Fair Market Value is defined as the highest possible price in the open market
without restrictions between informed and prudent parties, acting under
arm's length conditions and under no coercion expressed in terms of
currency or currency value.
• Do not confuse value and price. While the value is the potential benefit in
relation to the expectations of asset wealth creation, the price is the cost of
the asset acquisition and is determined in the negotiation between the buyer
and the seller, under certain circumstances.
Methodology
• Given that the purpose of the valuation is to determine a fair price for the
delisting takeover bid that the Client is planning to promote over the shares
of AB-Biotics, we should take into consideration the rules established in the
Royal Decree 1066/2007 governing the takeover bids regime in Spain.
• In compliance with the article 10 of the RD 1066/2007, the delisting of the
Target would be performed after approval of the Ordinary General
Shareholder’s meeting through the offering of the takeover shareholders
that did not vote in favour of said delisting.
• The article 10.5 of RD 1066/2007, establish that a valuation report must be
presented by the Company promoting the takeover bid to the shareholders
in order to justify the price offered.
Page 25
METHODOLOGY

PROJECT AB
……………………………………………………………………………………………………………………………………………………………………………………………………………………………………………………………..
Methodology
Methodology (cont.)
ii. Similar companies multiples: We used multiples of similar
companies in the industry listed in liquid markets. Given that the
companies found have different size, we adjusted the multiples
based on size.
iii. Recent industry transactions: We performed database research
to find recent industry transactions to contrast the multiples
found in the previous criteria.
• Additionally, according to the article 9 of the RD 1066/2007, the takeover bid
must not be lower to any previous offer promoted during the last 12 months
between the takeover bidder and any other shareholder affected by the
delisting process.
• The offered price must not be lower to the higher price resulting of the
methodology established in article 10 of the RD 1066/2007 and the fair
price established in article 9 of the RD 1066/2007.
• It is important to understand that a correct valuation plays a key role in
many areas to accurately understand the value of an asset and what drives
that value, and in this way make effective business decisions.
• However, the assessment necessarily involves a certain degree of subjectivity.
The value is influenced by a variety of factors: such as: (i) Preconceived ideas
and bias of the owner of the asset, (ii) the understanding of the market
valuer, (iii) the methodology being used and (iv) the complexity of the
underlying business.
• We believe that the assumptions contained in this report are appropriate, are
not overly optimistic or unnecessarily pessimistic and have a strong
argumentation base that provides a strong point of reference in
understanding the basis of assumptions.
The final price is the result of the higher valuation among the methods established in articles 9 and 10 of the RD
1066/2007
Methodology (cont.)
• The market value of 100% of the shares of AB Biotics is the result of those of the
following values:
• (+) Business Valuation
• (+/-) Net Debt
• (-) Debts to LP and CP with third parties as of December 31, 2018.
• (+) Financial investments to LP and CP as of December 31, 2018.
• (+) Treasury as of December 31, 2018.
Page 26
METHODOLOGY

PROJECT AB
……………………………………………………………………………………………………………………………………………………………………………………………………………………………………………………………..
Agenda
Section
Page 27
1. About Crowe 4
2. Scope and limitations 10
3. Executive Summary 12
4. Company overview 18
5. Methodology 23
6. Market multiples 26
7. Recent industry transactions 28
8. Average share price 30
9. Discounted cash flow 32
10. Valuation 41
Appendices
A. Appendices 44

PROJECT AB
……………………………………………………………………………………………………………………………………………………………………………………………………………………………………………………………..
Industry listed companies
• We performed a database research of listed companies within the same industry in order to obtain a range of multiples which could be applicable to the Target. Most of
the selected companies have a significantly higher EBITDA and market capitalisation than the Target Company. However, an adjustment will be applied to compensate
the potential deviation which may arise from this. We excluded from the calculation the companies with negative EBITDA given that the Target have positive EBITDA.
• The breakdown of selected industry companies is the following:
• Note that the market capitalisation included was the one at the date of the report and the EBITDA included was calculated as at the date of the report for the last twelve
months.
• We obtained an average EV/EBITDA of 18.0x and a median of 15.1x. Note that in the case of the average we excluded the extreme values from the calculation.
• If taken into consideration the considered most similar companies, the EV/EBITDA average would amount to 22.9x.
• We contrasted these results with the multiples provided by Damodaran in Jan-19 in the Drugs (Biotechnology) sector amounting to 13.4x in the Global market, 12.8x in
Europe and 12.0x in USA. Please refer to appendices for further details.
• It is important to highlight that the products of the Target are scientifically well differentiated from those of their competitors, hence, the competition is not about the
same active principle, but rather about the same therapeutic concepts. The similar companies selected in this report does not exactly have the same products than the
Target.
Industry listed Companies
€ estimated Market Cap Country Beta EBITDA (USD) EV/EBITDA ROCE
Amgen Inc 95,660,013,408 USA 0.93 10,958,140,680 9.3 18.32%
CHR Hansen 12,972,045,100 DNK 0.98 342,944,256 29.0 15.52%
BioGaia AB 695,712,436 SWE 1.36 19,660,009 27.1 38.78%
Biosearch S.A. 72,768,484 SPA 1.86 5,776,450 12.5 15.23%
Celgene Corporation 59,716,954,744 USA 1.24 6,867,815,960 10.4 20.95%
Emergent BioSolutions Inc 2,058,558,620 USA 1.43 150,752,579 17.7 3.28%
Exelixis Inc 5,362,969,420 USA 1.10 369,897,531 12.6 61.19%
Probi AB 360,805,936 SWE 0.83 15,338,144 23.1 7.61%
Regeneron Pharmaceuticals, Inc 28,824,286,100 USA 1.03 2,330,949,240 11.6 27.21%
Repligen Corporation 3,215,102,400 USA 1.10 42,609,038 73.5 n/a
Source: Infront analytics, Yahoo Finance and Bloomberg Median 15.1 18.3%
18.0 23.7%
22.9 19.3%
Average without
extreme values
Most similar companies
average
Market multiples
The most similar industry companies at an international level have an average EV/EBITDA ratio amounting to 22.9x
Extreme values to be
excluded from the
calculation
Most comparable companies
Page 28
Note that the ROCE of
the Target amounts to
12.19% in comparison
with the 19.3% average
of most similar
companies.
MARKET MULTIPLES

PROJECT AB
……………………………………………………………………………………………………………………………………………………………………………………………………………………………………………………………..
Agenda
Section
Page 29
1. About Crowe 4
2. Scope and limitations 10
3. Executive Summary 12
4. Company overview 18
5. Methodology 23
6. Market multiples 26
7. Recent industry transactions 28
8. Average share price 30
9. Discounted cash flow 32
10. Valuation 41
Appendices
A. Appendices 44

PROJECT AB
……………………………………………………………………………………………………………………………………………………………………………………………………………………………………………………………..
Recent industry transactions
• We performed a database research of the recent transactions in the Biotechnological industry (CNAE code 7211 and US SIC code 8731) with the following result:
• All the transactions were performed in the industry of the Target between 2016 and 2019. We considered necessary to exclude from the calculation the extreme values,
in this case only the acquisition of CCSTeam Srl from Tech-Value Spa given its significative lower value.
• The average without extreme values and median of EV/EBITDA amounts to 16.3x and 13.2x respectively which is lower than the market multiples (18.0x and 15.1x) and
even lower than the multiples of the most similar companies (22.9x).
• All the transactions are performed in the industry of the target “Research and experimental development on biotechnology” and “Commercial physical and biological
research”.
• Note that, according to expert analysis, the industry is thriving and the market is tending to consolidation due to the competition increase which will lead to an increase
in costs (CAPEX, R&D, etc…) and might decrease the multiples paid for this kind of companies in the future. The Company might need to invest in competitiveness for
new products, market niches and potential acquisitions.
• The industry has relevant margins and it is attracting an increasing number of players which will push back the profitability and the intrinsic companies valuation.
• During the last couple of years, additional non-disclosed transactions were performed such as the acquisition of Life-Space Group (LSG) by By-Health Co Ltd during
2018, acquisition of Ganeden by Kerry Group during 2017 and the acquisition of BioCare Copenhagen A/S by Royal DSM during 2017.
Recent industry transactions
Date
Announced
Date
Effective Target Name Acquiror Name EV/EBITDA
29/10/2018 14/02/2019 Karo Pharma AB Karo Intressenter AB 13.79
29/06/2018 29/06/2018 ADM Probiotics International Limited 16.20
30/06/2017 30/06/2017 CCSTEAM Srl Tech-Value SpA 6.18
31/05/2017 08/06/2017 Oxford Gene Technology IP Ltd Sysmex Corp 26.67
03/06/2016 15/09/2016 Source BioScience PLC Sherwood Holdings Ltd 12.35
06/06/2016 06/06/2016 Nutraceutix Probi AB 12.70
Source: Thomson Reuters Median 13.2
Average without extreme values 16.3
Recent transactions
The recent transactions at an international level have an average and median EV/EBITDA ratio amounting to 16.3x and
13.2x respectively excluding extreme values
Extreme values to be
excluded from the
calculation
Page 30
RECENT INDUSTRY TRANSACTIONS

PROJECT AB
……………………………………………………………………………………………………………………………………………………………………………………………………………………………………………………………..
Agenda
Section
Page 31
1. About Crowe 4
2. Scope and limitations 10
3. Executive Summary 12
4. Company overview 18
5. Methodology 23
6. Market multiples 26
7. Recent industry transactions 28
8. Average share price 30
9. Discounted cash flow 32
10. Valuation 41
Appendices
A. Appendices 44

PROJECT AB
……………………………………………………………………………………………………………………………………………………………………………………………………………………………………………………………..
Average share price during the last 12 and 6 months
• According to the article 10 of the RD 1066/2007, this is the value resulting of the average share price during the last 6 months previous to the takeover. The value
resulting of this method is usually lower than the ones obtained though the application of other methods. However, in the case of the Target, the share price has been
significantly raising during the last six months (c.64.1% over the last 6 months at the date of this report) and this value could be similar to a valuation using other
methods. Please refer to appendices for further details regarding the daily share price.
• The share price fluctuated between a minimum of €3.24 and a maximum of €6.10 per share, with an average of €4.305 during the last 6 months as at 09th of July 2019.
• Note that the MaB is not a high liquid market and small daily trading could significantly affect the share price, which is the reason of the difference between this and
other accepted methods which could better reflect the valuation of the target. During the last 6 months, the day with a higher volume was June 13th with 267,394 (due
to the additional acquisition of 2% from Kaneka) but with a daily average of 10,496. Refer to appendices for further details regarding the daily trading volume.
Average share price
The average of the price share during the last six months (up to 9th of July 2019) amounts to €4.305 per share
Last twelve and six months, trading per day- AB-Biotics
€ Open High Low Close Daily average
Average (LTM) 3.77 3.82 3.71 3.77 3.768
Average (Last 6M) 4.30 4.38 4.23 4.31 4.305
Source: Yahoo finance
Page 32
Last six months, volume trading per day- AB-Biotics
Date Open High Low Close Volume Daily average
Average (Last 6M) 4.30 4.38 4.23 4.31 10,496 4.305
Max. (Last 6M) 5.70 6.10 5.60 5.70 267,394 5.70
Min. (Last 6M) 3.24 3.30 3.24 3.30 - 3.27
Source: Yahoo finance
AVERAGE SHARE PRICE

PROJECT AB
……………………………………………………………………………………………………………………………………………………………………………………………………………………………………………………………..
Agenda
Section
Page 33
1. About Crowe 4
2. Scope and limitations 10
3. Executive Summary 12
4. Company overview 18
5. Methodology 23
6. Market multiples 26
7. Recent industry transactions 28
8. Average share price 30
9. Discounted cash flow 32
10. Valuation 41
Appendices
A. Appendices 44

PROJECT AB
……………………………………………………………………………………………………………………………………………………………………………………………………………………………………………………………..
Current trading
• The 1Q19 results published by the Company shows a significant increase in
comparison with YTD18, with a 52.6% increase in revenues and 730.8% increase
in EBITDA.
• In order to project the future revenues of the Company we have considered that
the YTD19 amount correspond to the 19.1% of the total year revenues, which is
the result of considering the average of the main three competitors (Biogaia,
Probi and CHR Hansen) and the YTD18 percentages over the total FY18
revenues.
• During FY19F, we considered an EBITDA/revenues ratio amounting to 18.5%
which is in line with the 1Q19 EBITDA ratio.
• According to the Annual Accounts of 1Q19, the first 1Q19 results are mainly
driven by:
Exports increased 78% (national sales amounting to 4% in YTD19 in
comparison with 18% in YTD18) with China as the most significant
market.
The alliance with Kaneka in Japan and Northamerica is starting to have
impact in the financial statements of the Company.
The area of functional ingredients continues to be the main driver of
revenues from the Society, while the area of Precision Medicine
NeuroPharmaGen continues being a high potential technology in
which the Company focuses its strategy of generating solid scientific
documentation.
Discounted cash flow | Current trading
The YTD19 (Mar-19) revenues and EBITDA increased 52.6% and 730.8% respectively in comparison with YTD18.
Page 34
Profit and Loss - AB-Biotics
€ in thousand FY17 FY18 YTD18 YTD19
Var. %
FY17 -
FY18
Var. %
YTD18 -
YTD19
Revenues 7,208 11,892 1,770 2,702 65.0% 52.6%
Capitalised costs 512 701 157 261 37.0% 66.6%
COGS (4,014) (7,280) (1,122) (1,519) 81.4% 35.4%
Gross margin 3,706 5,314 805 1,443 43.4% 79.3%
Other operating income 259 633 140 82 144.7% (41.7%)
Personnel expenses (1,674) (1,839) (351) (512) 9.9% 45.8%
OPEX (1,811) (2,046) (473) (558) 13.0% 18.1%
Bad debt (267) (99) (95) 8 (62.9%) (108.4%)
Other result 0 39 33 34 22779.1% 1.9%
EBITDA 212 2,002 60 497 842.3% 730.8%
D&A (1,137) (1,190) (281) (310) 4.7% 10.3%
Impairments and sale of Fixed Assets 216 1 - (2) (99.8%) n.a.
EBIT (708) 812 (221) 186 (214.7%) (184.0%)
Financial income 20 8 1 2 (61.5%) 250.3%
Financial expenses (236) (243) (67) (22) 2.8% (66.8%)
EBT (924) 577 (287) 165 (162.5%) (157.6%)
CIT 29 641 - (42) 2082.1% n.a.
Net result (895) 1,218 (287) 124 (236.1%) (143.1%)
As a % of revenues
Gross Margin 51.4% 44.7% 45.5% 53.4% -6.73p.p.
Other operating income 3.6% 5.3% 7.9% 3.0% 1.73p.p.
Personnel expenses (23.2%) (15.5%) (19.8%) (18.9%) 7.76p.p.
OPEX (25.1%) (17.2%) (26.7%) (20.7%) 7.93p.p.
Bad debt (3.7%) (0.8%) (5.4%) 0.3% 2.87p.p.
EBITDA 2.9% 16.8% 3.4% 18.4% 13.89p.p.
Source: Audited Annual report
DISCOUNTED CASH FLOW

PROJECT AB
……………………………………………………………………………………………………………………………………………………………………………………………………………………………………………………………..
Financial statements projections
• In order to perform a discounted cash flow analysis, we projected the financial
statements of the Target from the 2018 Audited Annual Accounts.
• Given that no information was provided by the Management, our projections
were based on analysis and reports from industry experts and the 1Q19 results.
• Between FY18 and FY22 we considered a CAGR increase of 18.8% mainly based
on the following:
The global demand of probiotics ingredients is estimated to have a
growth of between 6.5% and 8.5% of CAGR. Around a 7.7% CAGR
according to most reports.
According to industry analysts, Probi and Biogaia, which are the most
similar companies in terms of product portfolio and size, will have a
CAGR increase between FY18 and FY21 amounting to 15.7% and 16.4%
respectively, in line with the AB-Biotics estimations.
In the case of CHR Hansen, the CAGR between FY18 and FY21 is lower
than the other similar companies due to its size and market share.
Note that companies such as AB-Biotics, Probi and Biogaia have much
more room for growth than CHR Hansen given their current market
share. However, in absolute terms, CHR Hansen growth at a very
significant pace.
Discounted cash flow | Projections (1 of 3)
The projected EBITDA of the Target might increase by a 39.5% CAGR until FY22 based on 2018 financial statements,
industry estimations and expert reportsProfit and Loss projections - AB Biotics
€ in thousand FY18 FY19e FY20e FY21e FY22e
CAGR %
FY18-FY22
Revenues 11,892 14,181 18,866 21,848 23,677 18.8%
Capitalised costs 701 - - - - (100.0%)
COGS (7,280) (7,535) (9,346) (10,088) (10,300) 9.1%
Gross margin 5,314 6,646 9,519 11,760 13,377 26.0%
Other operating income 633 696 766 842 927 10.0%
Personnel expenses (1,839) (2,022) (2,216) (2,445) (2,685) 9.9%
OPEX (2,046) (2,587) (2,943) (3,365) (3,841) 17.1%
Bad debt (99) (113) (151) (175) (189) 17.6%
Other result 39 - - - - (100.0%)
EBITDA 2,002 2,620 4,975 6,618 7,589 39.5%
D&A (1,190) (1,150) (1,030) (930) (830) (8.6%)
Impairments and sale of Fixed Assets 1 0 - - 0 (100.0%)
EBIT 812 1,470 3,945 5,688 6,759 69.8%
Financial income 8 50 60 100 140 105.4%
Financial expenses (243) (40) (30) (20) (10) (55.0%)
EBT 577 1,480 3,975 5,768 6,889 85.9%
CIT 641 (150) (350) (820) (1,120) n.a.
Net result 1,218 1,330 3,625 4,948 5,769 47.5%
As a % of revenues
Gross Margin 44.7% 46.9% 50.5% 53.8% 56.5% 11.82p.p.
Other operating income 5.3% 4.9% 4.1% 3.9% 3.9% -1.41p.p.
Personnel expenses (15.5%) (14.3%) (11.7%) (11.2%) (11.3%) 4.13p.p.
OPEX (17.2%) (18.2%) (15.6%) (15.4%) (16.2%) 0.98p.p.
Bad debt (0.8%) (0.8%) (0.8%) (0.8%) (0.8%) 0.03p.p.
EBITDA 16.8% 18.5% 26.4% 30.3% 32.1% 15.22p.p.
Source: Crowe and industry analysis and GVC Gaesco
Similar companies sales estimations increase- AB Biotics
% FY19e FY20e FY21e
CAGR % FY18 -
FY21
Probi 6.0% 24.0% 18.0% 15.7%
BioGaia 9.7% 17.3% 22.7% 16.4%
CHR Hansen 7.1% 9.9% 8.9% 8.6%
Sales
Source: ABG Sundal Collier, JP Morgan and Market Screener
Page 35
Note that the projections we used for FY19e are higher than the Management
estimations. (Revenues amounting to €14m vs. revenues amounting to €13m according
to the Management). Note that we were provided with the 1Q19 and we updated the
FY19e based on it.
Consider that the industry has relevant margins and it is attracting an increasing
number of players which will push back the profitability and the intrinsic companies
valuation
DISCOUNTED CASH FLOW

PROJECT AB
……………………………………………………………………………………………………………………………………………………………………………………………………………………………………………………………..
Financial statements projections (cont.)
The Target is one of the top 10 leader in the documented strain
market. This industry is estimated to grow from the current 35% to the
65% in the next five years. Documented strains also have a higher price
and the Target has a bank of unique 550 bacteria strain (unlike most of
its competitors).
The products of the Target are scientifically well differentiated from
those of their competitors, hence, the competition is not about the
same active principle, but rather about the same therapeutic concepts.
The similar companies selected in this report do not exactly have the
same products as the Target.
The increase in the European regulatory requirements regarding
probiotics might make a difference regarding the products of the
Target in comparison with the lack of clinical documentation of some
its competitors.
• All along the period but specially between FY18 and FY19, the revenues’ increase
of the Target took into consideration the exponential increase of licence and the
strategic agreement with Kaneka which will open the North-American market.
• Considering this, we applied over the real 2018 figures the estimated percentage
growth estimated by the analysts.
• According to the GVC Gaesco analysis, the main growth leverage of the
Company are relate to:
i. Pipeline: AB-Biotics would currently be in the pre-commercialisation
phase of most of its pipeline given the development of the R&D
projects. This is the phase were the cash might start to be generated
given that the remaining CAPEX needed would be lower than the
revenues originated with this pipeline.
ii. Operating leverage: Due to the cost structure of the Target and the
operating leverage most of the operating profit will directly increase
the EBITDA.
Discounted cash flow | Projections (2 of 3)
The projected EBITDA of the Target might increase by a 39.5% CAGR until FY22 based on 2018 financial statements,
industry estimations and expert reportsProfit and Loss projections - AB Biotics
€ in thousand FY18 FY19e FY20e FY21e FY22e
CAGR %
FY18-FY22
Revenues 11,892 14,181 18,866 21,848 23,677 18.8%
Capitalised costs 701 - - - - (100.0%)
COGS (7,280) (7,535) (9,346) (10,088) (10,300) 9.1%
Gross margin 5,314 6,646 9,519 11,760 13,377 26.0%
Other operating income 633 696 766 842 927 10.0%
Personnel expenses (1,839) (2,022) (2,216) (2,445) (2,685) 9.9%
OPEX (2,046) (2,587) (2,943) (3,365) (3,841) 17.1%
Bad debt (99) (113) (151) (175) (189) 17.6%
Other result 39 - - - - (100.0%)
EBITDA 2,002 2,620 4,975 6,618 7,589 39.5%
D&A (1,190) (1,150) (1,030) (930) (830) (8.6%)
Impairments and sale of Fixed Assets 1 0 - - 0 (100.0%)
EBIT 812 1,470 3,945 5,688 6,759 69.8%
Financial income 8 50 60 100 140 105.4%
Financial expenses (243) (40) (30) (20) (10) (55.0%)
EBT 577 1,480 3,975 5,768 6,889 85.9%
CIT 641 (150) (350) (820) (1,120) n.a.
Net result 1,218 1,330 3,625 4,948 5,769 47.5%
As a % of revenues
Gross Margin 44.7% 46.9% 50.5% 53.8% 56.5% 11.82p.p.
Other operating income 5.3% 4.9% 4.1% 3.9% 3.9% -1.41p.p.
Personnel expenses (15.5%) (14.3%) (11.7%) (11.2%) (11.3%) 4.13p.p.
OPEX (17.2%) (18.2%) (15.6%) (15.4%) (16.2%) 0.98p.p.
Bad debt (0.8%) (0.8%) (0.8%) (0.8%) (0.8%) 0.03p.p.
EBITDA 16.8% 18.5% 26.4% 30.3% 32.1% 15.22p.p.
Source: Crowe and industry analysis and GVC Gaesco
Page 36
DISCOUNTED CASH FLOW

PROJECT AB
……………………………………………………………………………………………………………………………………………………………………………………………………………………………………………………………..
Financial statements projections (cont.)
iii. Cost savings: Mainly driven by (i) personnel restructuring process
and (ii) outsourcing of R&D including sponsors which significantly
reduce the R&D expenses.
iv. Debt/equity ratio in decrease due to the capacity of the Target to
have benefits without external financing.
• The remaining operating expenses were projected following the estimations of
GVC Gaesco and the Management of the Target.
• We additionally projected the Working Capital of the Company based on the
P&L projections and the average DSO, DPO and DIO of the historical financial
statements of the Target.
• Note that the main WC captions estimations evolution are in line with the
most similar companies estimations (Probi and Biogaia).
Discounted cash flow | Projections (3 of 3)
The Target have a large pipeline and a cost structure which could allow it to significantly increase EBITDA in the
following yearsProfit and Loss projections - AB Biotics
€ in thousand FY18 FY19e FY20e FY21e FY22e
CAGR %
FY18-FY22
Revenues 11,892 14,181 18,866 21,848 23,677 18.8%
Capitalised costs 701 - - - - (100.0%)
COGS (7,280) (7,535) (9,346) (10,088) (10,300) 9.1%
Gross margin 5,314 6,646 9,519 11,760 13,377 26.0%
Other operating income 633 696 766 842 927 10.0%
Personnel expenses (1,839) (2,022) (2,216) (2,445) (2,685) 9.9%
OPEX (2,046) (2,587) (2,943) (3,365) (3,841) 17.1%
Bad debt (99) (113) (151) (175) (189) 17.6%
Other result 39 - - - - (100.0%)
EBITDA 2,002 2,620 4,975 6,618 7,589 39.5%
D&A (1,190) (1,150) (1,030) (930) (830) (8.6%)
Impairments and sale of Fixed Assets 1 0 - - 0 (100.0%)
EBIT 812 1,470 3,945 5,688 6,759 69.8%
Financial income 8 50 60 100 140 105.4%
Financial expenses (243) (40) (30) (20) (10) (55.0%)
EBT 577 1,480 3,975 5,768 6,889 85.9%
CIT 641 (150) (350) (820) (1,120) n.a.
Net result 1,218 1,330 3,625 4,948 5,769 47.5%
As a % of revenues
Gross Margin 44.7% 46.9% 50.5% 53.8% 56.5% 11.82p.p.
Other operating income 5.3% 4.9% 4.1% 3.9% 3.9% -1.41p.p.
Personnel expenses (15.5%) (14.3%) (11.7%) (11.2%) (11.3%) 4.13p.p.
OPEX (17.2%) (18.2%) (15.6%) (15.4%) (16.2%) 0.98p.p.
Bad debt (0.8%) (0.8%) (0.8%) (0.8%) (0.8%) 0.03p.p.
EBITDA 16.8% 18.5% 26.4% 30.3% 32.1% 15.22p.p.
Source: Crowe and industry analysis and GVC Gaesco
Working Capital projections - AB Biotics
€ in thousand Dec-18 Dec-19 Dec-20 Dec-21 Dec-22
Inventories 609 857 1,063 1,147 1,171
Trade receivables 3,724 2,927 3,767 4,302 4,631
Trade payables (2,583) (2,645) (3,155) (3,427) (3,587)
Accruals ST (131) (250) (250) (250) (250)
Working capital 1,619 888 1,425 1,772 1,965
Source: Crowe and industry analysis and GVC Gaesco
Page 37
DISCOUNTED CASH FLOW

PROJECT AB
……………………………………………………………………………………………………………………………………………………………………………………………………………………………………………………………..
WACC Calculation
Cost of equity
• We calculated the cost of equity as at Dec-18 for AB-Biotics using the following
formula:
• Risk-free rate of return (Rf): Corresponding to the rate of an investment whose
risk is minimal for the reference market. The zero coupon bond of the Treasury
of the Government of Spain to 10 years is usually used as an indicator. This
indicator amounted to 1.42% at the date of analysis (Dec-18).
• Risk-country (Rc): This is the risk rate based on the perception of the real
market, including, among others, volatility risk, currency risk, national regulatory
risk and other expectations of the financial markets. The spread of Credit Default
Swap (CDS) (Insurance contracts in which financial instruments are insured in
case of default by the issuer) for the Spanish market is usually used as an
indicator. For the calculation, the CDS has been used for 5 years to the date
amounting to 0.81%, according to the historical information published by World
Government Bonds.
• Leveraged Beta (β): This is the risk of the industry (in the reference market) that
measures the unitary impact on the value of the assets of a given industry with
respect to the unitary movement of the domestic (or national) market. For its
determination, the leveraged beta of comparable companies in the industry is
used.
According to the information published by Damodaran in the New York
University for the “Drugs (biotechnology)" industry, the Beta in the
global market would amount to 1.44.
Note that, given that the individual Beta for the Target amounted to
0.49 according to Thomson Reuters and Infront analytics, we
considered reasonable to use an average of 1.44 and 0.49 for the cost
of equity beta calculation amounting to 0.96.
Discounted cash flow | WACC Calculation
The cost of equity of the Company amounts to 12.79% including a size premium amounting to 5.5%
rupfmpaísfe RRSRRRRR +++−++= )(
Cost of equity - Project AB
Abbreviation Concept data Source
Rf Risk-free rate of return 1.42%10 years Spanish treasury bonds as at Dec-18,
Expansión
Rc Risk-country 0.81%(Spanish CDS as at Dec-18)
Worldgovernmentbonds.com
β Beta 0.96Thomson Reuters and Damodaran, average Beta for
the Company and the industry.
Rm - Rf Rate market return 5.28%Statista, Expansion or Infobolsa market risk premium
as at Dec-18
Sp Size premium 5.50% Damodaran
Ru Individual risk 0.00% Damodaran
Re Cost of Equity 12.79%
Source: Crowe analysis
C
Page 38
DISCOUNTED CASH FLOW

PROJECT AB
……………………………………………………………………………………………………………………………………………………………………………………………………………………………………………………………..
WACC Calculation (cont.)
Cost of equity (cont.)
• Rate market return /market risk premium: The market risk premium is defined
as what investors expect to earn by investing in a business activity with respect
to a risk-free investment. It is calculated as the spread between the Spanish
market risk at the date of the valuation against the spread of the lower risk
market, in this case the Spanish bond. As at Dec-18, this premium amounted to
5.28% based on the market premium risk according to Statista (6.7%) and the 10
years Spanish bond (1.42%).
• Size premium (Sp): Given the lack of liquidity of the Target market (MaB) in
comparison with other similar companies and given the size differences with
some of its competitors, we considered that a size premium may be considered
for the cost of equity calculation:
According to Damodaran models, a Company such as AB-Biotics with
revenues amounting to €11.892k, positive net results, with a cash
amounting to €1,769k and an average monthly volume trading
amounting to €452k, the size and liquidity premium discount might
amount to c.5.5%.
Discounted cash flow | WACC Calculation
The cost of equity of the Company amounts to 12.79% including a size premium amounting to 5.5%
Cost of equity - Project AB
Abbreviation Concept data Source
Rf Risk-free rate of return 1.42%10 years Spanish treasury bonds as at Dec-18,
Expansión
Rc Risk-country 0.81%(Spanish CDS as at Dec-18)
Worldgovernmentbonds.com
β Beta 0.96Thomson Reuters and Damodaran, average Beta for
the Company and the industry.
Rm - Rf Rate market return 5.28%Statista, Expansion or Infobolsa market risk premium
as at Dec-18
Sp Size premium 5.50% Damodaran
Ru Individual risk 0.00% Damodaran
Re Cost of Equity 12.79%
Source: Crowe analysis
Page 39
DISCOUNTED CASH FLOW

PROJECT AB
……………………………………………………………………………………………………………………………………………………………………………………………………………………………………………………………..
WACC Calculation (cont.)
• Once obtained the cost of equity, the WACC calculation is defined as follows:
• According to the information included in the latest Audited Annual Accounts
dated December 31, 2018, the Target's equity amounts to €6,859m and the debt
amounts to €4,196k.
• In this case, we consider more appropriate to use the targeted Debt/Equity ratio
which is in line with the industry proportion according to Damodaran, amounting
to 85,0% equity and 15.0% debt.
• The cost of debt is estimated taken into account the 2018 current debt level and
payment of interest amounting to €4,196k and €202k respectively.
• Given the above aspects, we consider reasonable to determine a WACC
amounting to 11.42% for the Target as of December 31, 2018.
Discounted cash flow | WACC Calculation
Taken into consideration the actual equity/debt proportion, the WACC would amount to 11.42%
WACC calculation - Project AB
Abbreviation concept data Source
E Equity 6,859 Financial statements (equity value)
D Debt 4,196 Financial statements (long and short term debt)
D+E Debt and Equity 11,055 n/a
E/(D+E) Equity over D+E 85.0% Industry and targeted Equity/Debt
D/(E+D) Debt over D+E 15.0% Industry and targeted Equity/Debt
Re Costs of Equity 12.8% n/a
Rd Costs of Debt 4.82% n/a
Tc Corporate tax rate 25% n/a
WACCWeighted Average Cost
of Capital11.42%
Source: Crowe analysis
)1(... cde TRED
DR
ED
ECCAW −
++
+=
Page 40
DISCOUNTED CASH FLOW

PROJECT AB
……………………………………………………………………………………………………………………………………………………………………………………………………………………………………………………………..
Discounted Free Cash Flow
• In order to obtain the enterprise value through the discounted cash flow method
we calculated the free cash flow for the projected financial statements applying
the following formula to each of the periods:
• The terminal value was estimated based on a perpetual growth of 1.50% taken
into account the Spanish GDP 2019 variation amounting to 0.7%, the CPI
fluctuation in Spain of 0.8% and the GVC Gaesco estimation of 2.0%. Considering
this, the terminal value amounts to €59,963k.
• The selected WACC amount to 11.42% as at Dec-18 (Please refer to in WACC
calculation section) which entails a net present value amounting to €54,011k and
a price per share of €4.18.
• The estimated CAPEX is based on GVC Gaesco and other analysts projections
amounting to c.3.5% of yearly revenues, which is in line which the CAPEX
estimations of Probi AB (c.3.5% per year). Note that the CAPEX of FY19
represents a 4.8% of revenues given that R&D project are being developed
during FY19. According to expert analysis, the industry is thriving and the market
is tending to consolidation due to the competition increase which will lead to an
increase in CAPEX/R&D costs.
• Note that, the estimated ratio of FCF/EBITDA amounts to c.72% in average
during the projected period, in line with the Biogaia and Probi estimated ratios.
• The opposite sensibility table shows that, considering a WACC between 9.92%
and 12.92% and a perpetual growth between 0.5% and 2.5%, the price per share
would fluctuate between 3.35 and 5.57.
Discounted cash flow
Based on discount free cash flow, method the Company net present value would amount to €54.01m with a 1.5% of
perpetual growth and a WACC of 11.42%
D𝐹𝐶𝐹 =𝐹𝐶𝐹19
(1+𝑊𝐴𝐶𝐶)1+
𝐹𝐶𝐹201+𝑊𝐴𝐶𝐶 2+
𝐹𝐶𝐹211+𝑊𝐴𝐶𝐶 3 +
𝐹𝐶𝐹22+𝑇𝑉
1+𝑊𝐴𝐶𝐶 4
TV=𝐹𝐶𝐹×(1+𝑔)
(𝑊𝐴𝐶𝐶−𝑔)
Discounted Cash flow
€ in thousand FY18 FY19 FY20 FY21 FY22
EBIT 812 1,470 3,945 5,688 6,759
D&A 1,190 1,150 1,030 930 830
CAPEX - (677) (707) (738) (771)
FCF Before WCR 2,003 1,943 4,268 5,880 6,818
WCR 1,891 (706) 542 350 194
CIT 641 (153) (358) (840) (1,153)
Free Cash flow 4,535 1,084 4,453 5,389 5,859
Terminal value - - - - 59,963
Periods to be discounted - 0.5 1.5 2.5 3.5
Discount factor 1 0.95 0.85 0.76 0.68
Discounted FCF 1,027 3,786 4,113 45,084
Source: Crowe analysis and GVC Gaesco inputs
WACC 11.42%
Perpetual Growth 1.50%
Net present value 54,011
Number of shares 12,588
Price per share 4.18
Price per share sensibility table
4.18 9.92% 10.42% 10.92% 11.42% 11.92% 12.42% 12.92%
0.5% 4.52 4.27 4.05 3.85 3.67 3.50 3.35
1.0% 4.73 4.47 4.22 4.01 3.81 3.63 3.46
1.5% 4.98 4.68 4.42 4.18 3.96 3.77 3.59
2.0% 5.25 4.92 4.63 4.37 4.13 3.92 3.73
2.5% 5.57 5.20 4.87 4.58 4.32 4.09 3.88
Source: Crowe analysis
Perp
etu
al
gro
wth
WACC
Page 41
DISCOUNTED CASH FLOW

PROJECT AB
……………………………………………………………………………………………………………………………………………………………………………………………………………………………………………………………..
Agenda
Section
Page 42
1. About Crowe 4
2. Scope and limitations 10
3. Executive Summary 12
4. Company overview 18
5. Methodology 23
6. Market multiples 26
7. Recent industry transactions 28
8. Average share price 30
9. Discounted cash flow 32
10. Valuation 41
Appendices
A. Appendices 44
PROJECT AB
……………………………………………………………………………………………………………………………………………………………………………………………………………………………………………………………..
Valuation
• Given that the purpose of the valuation is to determine a fair price for the delisting that the Client is planning to promote over the shares of AB-Biotics, we should take
into consideration the rules established in the Royal Decree 1066/2007 governing the takeover bids regime in Spain.
• The multiple valuation method usually uses EBITDA when valuing a company. This multiple is shown as a ratio between the value of the company and EBITDA (EV /
EBITDA = X). This method allows us to estimate the value of the company based on the multiple obtained by comparing similar companies and the EBITDA obtained by
adjusting the reported figure.
• The discounted cash flow method entails an equity value of €52,588k with a price per share of €4.18. This value is lower than other industry analysis such as GVC Gaesco
or Researchfy. The difference mainly arise from the projected revenues increase which we have estimated applying the percentage of increase of GVC Gaesco and
Management over the 2018 real figures.
• The price per share of market multiples range from €2.59 to €3.33 depending if we use a wider sample of companies or a narrowed one taking into consideration only
the most similar companies (Probi, Biogai, Biosearch and CHR Hansen). Please consider that the Target does not have clear competitors and some of the companies of
the same industry may have different financial ratios.
• The price per share of recent transactions method amount to €2.34 respectively. Among all the valuation methods, this one shows the lowest EV/EBITDA and price per
share given that the biotechnological industry ratios have a wide dispersion.
• Note that as at 13th of June 2019, Kaneka acquired a share package with a share price of €3.85, which must also be considered in the methods established in the RD
1066/2007.
• The average price over the last 6 months entails an equity value of €54,196k and a price per share of €4.305 as at 9th of July 2019 which represent the higher
value of the options established by the RD 1066/2007, mainly due to the significant increase of the shares during the last months previous to the TOB.
Valuation (1 of 2)
According to the RD 1066/2007 the TOB price must amount at least the higher price obtained by applying the different
methods established in the art.9 and 10 of the RD1066/2007. In this case, the highest price per share amounts to €4.305
Note that the Net debt
adjustment includes the ST
financial instruments
maintained by the Target.
Valuation options according to article of RD 1066/2007
€ DCF
Wide
market
multiples
Narrow
market
multiples
Recent
transactions
Average share
price Last transaction
EV/EBITDA 26.98 17.98 22.90 16.34 27.78 24.92
EBITDA 2,002,243 2,002,243 2,002,243 2,002,243 2,002,243 2,002,243
Enterprise Value 54,010,866 36,005,335 45,851,365 32,718,252 55,619,554 49,887,436
Size/liquidity adjustment n/a 5.50% 5.50% 5.50% n/a n/a
Enterprise Value after size adjustment 54,010,866 34,025,041 43,329,540 30,918,749 55,619,554 49,887,436
Net debt (1,422,639) (1,422,639) (1,422,639) (1,422,639) (1,422,639) (1,422,639)
Equity Value 52,588,227 32,602,402 41,906,901 29,496,110 54,196,915 48,464,797
Number of shares 12,588,259 12,588,259 12,588,259 12,588,259 12,588,259 12,588,259
Price per share 4.18 2.59 3.33 2.34 4.305 3.85
Source: Crowe analysis, Annual Accounts, Infront analytics and Yahoo finance
Page 43
VALUATION

PROJECT AB
……………………………………………………………………………………………………………………………………………………………………………………………………………………………………………………………..
Valuation
• In summary, pursuant to art. 10.6 of RoyalDecree1066/2007, fair delisting value shall not be lower than the higher value between (i) the fair value under mandatory
takeover bids (art. 9 of Royal Decree 1066/2007), and (ii) that resulting from an evaluation, in a joint form and with justification of their respective relevance, of the five
(5) parameters above explained.
• In this regard, the highest value amongst all the parameters referred to above would be the one corresponding to the “Average Share Price” (i.e. price per share
amounting to €4.305).
• Based on that, and for the avoidance of any doubt about the value, we conclude that the delisting value for the analysed scenario should not be lower than the
highest parameter identified hereto (“Average Share Price”), this is, price per share amounting to €4.305.”
Valuation (2 of 2)
According to the RD 1066/2007 the TOB price must amount at least the higher price obtained by applying the different
methods established in the art.9 and 10 of the RD1066/2007. In this case, the highest price per share amounts to €4.305
Note that the Net debt
adjustment includes the ST
financial instruments
maintained by the Target.
Valuation options according to article of RD 1066/2007
€ DCF
Wide
market
multiples
Narrow
market
multiples
Recent
transactions
Average share
price Last transaction
EV/EBITDA 26.98 17.98 22.90 16.34 27.78 24.92
EBITDA 2,002,243 2,002,243 2,002,243 2,002,243 2,002,243 2,002,243
Enterprise Value 54,010,866 36,005,335 45,851,365 32,718,252 55,619,554 49,887,436
Size/liquidity adjustment n/a 5.50% 5.50% 5.50% n/a n/a
Enterprise Value after size adjustment 54,010,866 34,025,041 43,329,540 30,918,749 55,619,554 49,887,436
Net debt (1,422,639) (1,422,639) (1,422,639) (1,422,639) (1,422,639) (1,422,639)
Equity Value 52,588,227 32,602,402 41,906,901 29,496,110 54,196,915 48,464,797
Number of shares 12,588,259 12,588,259 12,588,259 12,588,259 12,588,259 12,588,259
Price per share 4.18 2.59 3.33 2.34 4.305 3.85
Source: Crowe analysis, Annual Accounts, Infront analytics and Yahoo finance
Page 44
VALUATION

PROJECT AB
……………………………………………………………………………………………………………………………………………………………………………………………………………………………………………………………..
Agenda
Section
Page 45
1. About Crowe 4
2. Scope and limitations 10
3. Executive Summary 12
4. Company overview 18
5. Methodology 23
6. Market multiples 26
7. Recent industry transactions 28
8. Average share price 30
9. Discounted cash flow 32
10. Valuation 41
Appendices
A. Appendices 44

PROJECT AB
……………………………………………………………………………………………………………………………………………………………………………………………………………………………………………………………..
Appendices | Price per share of previous Kaneka acquisition
Previous price per share paid by Kaneka
Seller Nº of shares % of total shares
Price per
share Total price
Seed Capital Fund, S.L. 662,750 5.3% 3.25 2,153,938
Capital MAB, FCR de régimen Simplificado 413,341 3.3% 3.25 1,343,358
INFEMA, S.A. 213,542 1.7% 3.25 694,012
Corporación Ivamosa, S.A. 650,000 5.2% 3.25 2,112,500
Gestión y Administración Mobiliaria, S.A. 650,000 5.2% 3.25 2,112,500
D.R. Masclans 6,000 0.0% 3.25 19,500
D.F.X. Tey 19,762 0.2% 3.25 64,227
D.M. Tey 18,059 0.1% 3.25 58,692
Narrows, S.L. 59,288 0.5% 3.25 192,686
D.Buenaventura Guamis 189,074 1.5% 3.25 614,491
AB Biotics 500,000 4.0% 2.27 1,135,000
Miquel Angel Bonachera 124,754 1.0% 3.85 480,303
Sergi Audivert 124,754 1.0% 3.85 480,303
Total 3,631,324 28.8% 11,461,508
Source: MaB information
Please note that we do not had access to the acquisition price of the remaining shares until the 39.8%
owned by Kaneka.
Page 46
APPENDICES

PROJECT AB
……………………………………………………………………………………………………………………………………………………………………………………………………………………………………………………………..
Appendices | Shareholder’s evolution
Shareholders Mar-18 %
Kaneka 26.9%
Miquel Angel Bonachera 10.1%
Sergi Audivert 10.1%
Luis Sánchez 10.1%
Other shareholders 42.8%
Shareholders Apr-18 %
Kaneka 34.1%
Miquel Angel Bonachera 10.1%
Sergi Audivert 10.1%
Luis Sánchez 10.1%
Other shareholders 35.6%
Shareholders Jul-18 %
Kaneka 37.8%
Miquel Angel Bonachera 9.9%
Sergi Audivert 9.9%
Luis Sánchez 9.8%
Biolittletec, S.L 1.2%
Other shareholders 31.5%
Shareholders Jan-19 %
Kaneka 37.8%
Miquel Angel Bonachera 9.9%
Sergi Audivert 9.9%
Luis Sánchez 10.2%
Other shareholders 32.3%
Shareholders Jun-19 %
Kaneka 39.8%
Miquel Angel Bonachera 8.9%
Sergi Audivert 8.9%
Luis Sánchez 10.2%
Other shareholders 32.3%
Page 47
APPENDICES
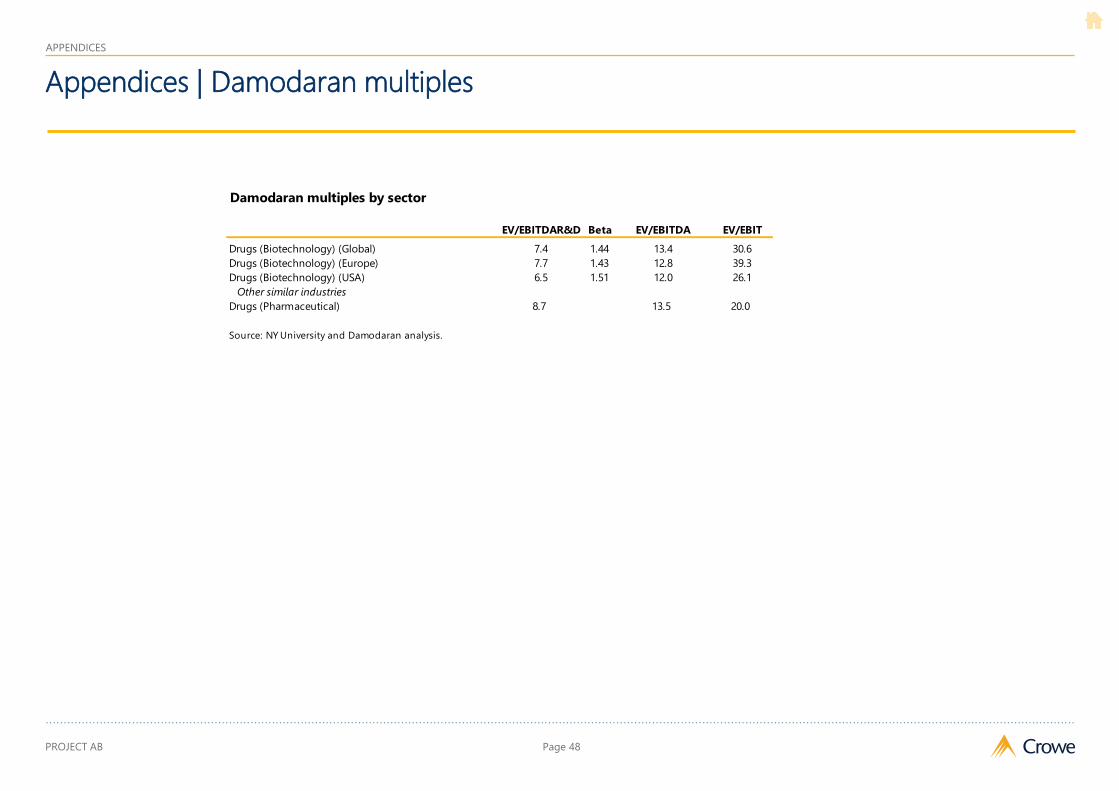
PROJECT AB
……………………………………………………………………………………………………………………………………………………………………………………………………………………………………………………………..
Appendices | Damodaran multiples
Damodaran multiples by sector
EV/EBITDAR&D Beta EV/EBITDA EV/EBIT
Drugs (Biotechnology) (Global) 7.4 1.44 13.4 30.6
Drugs (Biotechnology) (Europe) 7.7 1.43 12.8 39.3
Drugs (Biotechnology) (USA) 6.5 1.51 12.0 26.1
Other similar industries
Drugs (Pharmaceutical) 8.7 13.5 20.0
Source: NY University and Damodaran analysis.
Page 48
APPENDICES

PROJECT AB
……………………………………………………………………………………………………………………………………………………………………………………………………………………………………………………………..
Appendices | Average share price
Page 49
APPENDICES
Last six months, trading per day- AB-Biotics
Date Open High Low Close Volume Daily average Date Open High Low Close Volume Daily average
09/01/2019 3.28 3.32 3.28 3.30 15,413 3.29 09/04/2019 4.02 4.12 3.96 4.04 1,405 4.03
10/01/2019 3.30 3.30 3.30 3.30 200 3.30 10/04/2019 4.12 4.24 4.02 4.20 8,134 4.16
11/01/2019 3.30 3.30 3.30 3.30 1,230 3.30 11/04/2019 4.20 4.34 4.20 4.22 9,631 4.21
14/01/2019 3.34 3.34 3.34 3.30 1 3.32 12/04/2019 4.22 4.22 4.22 4.22 280 4.22
15/01/2019 3.24 3.42 3.24 3.30 13,098 3.27 15/04/2019 4.22 4.34 4.22 4.22 289 4.22
16/01/2019 3.32 3.38 3.32 3.32 550 3.32 16/04/2019 4.32 4.34 4.32 4.34 1,000 4.33
17/01/2019 3.34 3.42 3.30 3.38 4,451 3.36 17/04/2019 4.34 4.34 4.22 4.24 1,922 4.29
18/01/2019 3.40 3.40 3.40 3.38 310 3.39 18/04/2019 4.22 4.32 4.22 4.30 570 4.26
21/01/2019 3.40 3.42 3.38 3.40 3,591 3.40 23/04/2019 4.24 4.32 4.20 4.30 5,476 4.27
22/01/2019 3.42 3.54 3.42 3.50 5,690 3.46 24/04/2019 4.20 4.30 4.14 4.14 7,706 4.17
23/01/2019 3.50 3.62 3.50 3.62 7,754 3.56 25/04/2019 4.24 4.24 4.18 4.24 4,370 4.24
24/01/2019 3.66 3.70 3.50 3.70 5,738 3.68 26/04/2019 4.26 4.28 4.20 4.28 2,372 4.27
25/01/2019 3.72 3.74 3.72 3.74 2,828 3.73 29/04/2019 4.20 4.20 4.20 4.20 1,640 4.20
28/01/2019 3.90 3.90 3.60 3.72 20,631 3.81 30/04/2019 4.20 4.20 4.20 4.20 - 4.20
29/01/2019 3.68 3.70 3.60 3.68 4,496 3.68 02/05/2019 4.28 4.28 4.28 4.20 7 4.24
30/01/2019 3.70 3.70 3.70 3.68 30 3.69 03/05/2019 4.28 4.30 4.16 4.18 28,044 4.23
31/01/2019 3.70 3.76 3.70 3.76 1,671 3.73 06/05/2019 4.20 4.28 4.20 4.22 3,031 4.21
01/02/2019 3.80 3.90 3.80 3.90 11,493 3.85 07/05/2019 4.24 4.28 4.18 4.18 2,010 4.21
04/02/2019 3.90 3.90 3.54 3.88 7,386 3.89 08/05/2019 4.18 4.18 4.18 4.18 - 4.18
05/02/2019 3.82 3.82 3.80 3.80 3,050 3.81 09/05/2019 4.22 4.26 4.22 4.24 1,032 4.23
06/02/2019 3.74 3.74 3.70 3.70 839 3.72 10/05/2019 4.26 4.26 4.26 4.24 60 4.25
07/02/2019 3.72 3.78 3.72 3.72 735 3.72 13/05/2019 4.20 4.28 4.18 4.24 1,608 4.22
08/02/2019 3.72 3.88 3.72 3.74 12,951 3.73 14/05/2019 4.20 4.20 4.20 4.20 2,490 4.20
11/02/2019 3.74 3.74 3.74 3.74 900 3.74 15/05/2019 4.24 4.28 4.24 4.28 6,306 4.26
12/02/2019 3.74 3.84 3.74 3.84 8,265 3.79 16/05/2019 4.28 4.28 4.28 4.28 640 4.28
13/02/2019 3.84 3.86 3.84 3.86 5,750 3.85 17/05/2019 4.28 4.34 4.20 4.32 8,407 4.30
14/02/2019 3.84 3.84 3.84 3.84 630 3.84 20/05/2019 4.34 4.36 4.34 4.34 26,015 4.34
15/02/2019 3.80 3.86 3.80 3.86 10,300 3.83 21/05/2019 4.36 4.50 4.36 4.44 16,962 4.40
18/02/2019 3.86 4.10 3.86 4.10 52,859 3.98 22/05/2019 4.48 4.48 4.26 4.36 3,415 4.42
19/02/2019 4.12 4.18 4.00 4.16 26,092 4.14 23/05/2019 4.38 4.40 4.38 4.38 1,500 4.38
20/02/2019 4.16 4.32 4.16 4.24 27,329 4.20 24/05/2019 4.38 4.38 4.38 4.38 - 4.38
21/02/2019 4.30 4.60 4.22 4.30 55,986 4.30 27/05/2019 4.40 4.66 4.32 4.62 21,711 4.51
22/02/2019 3.98 4.28 3.94 4.12 23,748 4.05 28/05/2019 4.70 4.70 4.44 4.50 6,390 4.60
25/02/2019 4.18 4.30 4.12 4.28 22,718 4.23 29/05/2019 4.60 4.60 4.50 4.50 1,505 4.55
26/02/2019 4.36 4.38 4.02 4.02 15,628 4.19 30/05/2019 4.60 4.60 4.60 4.60 1,000 4.60
27/02/2019 4.10 4.36 4.10 4.22 37,093 4.16 31/05/2019 4.62 4.62 4.48 4.48 8,846 4.55
28/02/2019 4.36 4.38 4.08 4.28 41,818 4.32 03/06/2019 4.60 4.60 4.60 4.48 281 4.54
01/03/2019 4.28 4.28 3.96 4.14 5,945 4.21 04/06/2019 4.60 4.60 4.46 4.50 525 4.55
04/03/2019 4.00 4.16 3.90 4.14 8,265 4.07 05/06/2019 4.58 4.64 4.58 4.64 7,072 4.61
05/03/2019 4.10 4.16 3.94 4.14 2,081 4.12 06/06/2019 4.64 4.66 4.64 4.64 328 4.64
06/03/2019 4.10 4.10 3.90 4.02 5,855 4.06 07/06/2019 4.66 4.86 4.64 4.70 29,891 4.68
07/03/2019 4.04 4.04 4.04 4.02 100 4.03 10/06/2019 4.80 4.94 4.80 4.82 15,184 4.81
08/03/2019 4.00 4.18 4.00 4.18 4,787 4.09 11/06/2019 4.94 5.00 4.84 5.00 31,813 4.97
11/03/2019 4.18 4.18 4.00 4.18 6,780 4.18 12/06/2019 5.10 5.15 5.00 5.00 11,390 5.05
12/03/2019 4.00 4.14 4.00 4.14 373 4.07 13/06/2019 4.92 5.05 4.84 4.90 267,394 4.91
13/03/2019 4.14 4.14 4.00 4.14 576 4.14 14/06/2019 5.05 5.20 5.00 5.10 51,911 5.08
14/03/2019 4.14 4.14 4.14 4.14 125 4.14 17/06/2019 5.20 6.10 5.20 5.60 24,338 5.40
15/03/2019 4.14 4.18 3.98 4.18 8,131 4.16 18/06/2019 5.60 5.70 5.45 5.55 7,954 5.58
18/03/2019 4.10 4.30 4.08 4.26 8,748 4.18 19/06/2019 5.65 5.70 5.60 5.70 5,554 5.68
19/03/2019 4.30 4.30 4.26 4.30 19,526 4.30 20/06/2019 5.70 5.70 5.55 5.65 4,312 5.68
20/03/2019 4.30 4.40 4.08 4.40 11,109 4.35 21/06/2019 5.70 5.70 5.50 5.50 1,361 5.60
21/03/2019 4.42 4.48 4.32 4.42 5,711 4.42 24/06/2019 5.65 5.90 5.60 5.60 26,262 5.63
22/03/2019 4.32 4.44 4.32 4.44 7,280 4.38 25/06/2019 5.50 5.65 5.50 5.55 4,893 5.53
25/03/2019 4.30 4.32 4.04 4.22 12,914 4.26 26/06/2019 5.65 5.65 5.60 5.55 215 5.60
26/03/2019 4.30 4.36 4.20 4.36 7,429 4.33 27/06/2019 5.60 5.60 5.60 5.55 459 5.58
27/03/2019 4.26 4.30 4.18 4.30 351 4.28 28/06/2019 5.65 5.65 5.20 5.35 3,941 5.50
28/03/2019 4.26 4.26 4.16 4.24 3,267 4.25 01/07/2019 5.70 5.85 5.45 5.45 9,393 5.58
29/03/2019 4.16 4.28 4.16 4.28 101 4.22 02/07/2019 5.70 5.70 5.20 5.50 5,929 5.60
01/04/2019 4.24 4.28 4.16 4.24 4,240 4.24 03/07/2019 5.40 5.55 5.10 5.25 13,580 5.33
02/04/2019 4.28 4.28 4.10 4.16 4,031 4.22 04/07/2019 5.25 5.45 5.10 5.35 4,854 5.30
03/04/2019 4.10 4.16 4.08 4.16 915 4.13 05/07/2019 5.25 5.35 5.10 5.10 964 5.18
04/04/2019 4.06 4.08 3.96 4.08 7,874 4.07 08/07/2019 5.10 5.10 4.68 4.98 14,202 5.04
05/04/2019 4.12 4.12 4.00 4.10 845 4.11 09/07/2019 4.72 5.10 4.72 4.98 11,607 4.85
08/04/2019 4.08 4.08 4.02 4.08 938 4.08 Average (Last 6M) 4.30 4.38 4.23 4.31 10,496 4.31
Source: Yahoo finance Max. (Last 6M) 5.70 6.10 5.60 5.70 267,394 5.70

Follow us on:
@croweSpain
Find out more about us at
Crowe Spain is a member of Crowe Global, a Swiss verein. Each member firm of Crowe Global is a separate and independent legal entity. Crowe Spain and its affiliates are not responsible or liable for any
acts or omissions of Crowe Global or any other member of Crowe Global. Crowe Global does not render any professional services and does not have an ownership or partnership interest in Crowe Spain.
©2019 Crowe Advisory SP, S.L.
This material is for informational purposes only and should not be construed as financial or legal advice. Please seek guidance specific to your organisation from qualified advisors in your jurisdiction.
About Crowe Global
The Crowe network consists of more than 200 independent accounting and advisory services firms in over 120 countries around the world.
Crowe Global member firms are known for their local knowledge, expertise, and experience balanced by an international reputation for the highest quality in audit, tax,
advisory and risk services. They are unified through a shared commitment for impeccable quality service, highly integrated service delivery processes and a common
set of core values and management philosophies that guide their decisions daily.
This unique combination of talent provides Crowe Global the worldwide capabilities of a highly integrated network to deliver value to multinational clients doing
business across borders.
www.crowe.es