Embed Size (px)
Citation preview
Hemoglobins in Togolese Newborns: Hb S, Hb C,Hb Bart’s, and a-Globin Gene Status
Akuete Yvon Segbena, 1 Claude Prehu, 2 Henri Wajcman, 2* Josiane Bardakdjian-Michau, 2
Kodjovi Messie, 1 Lochina Feteke, 1 Anne Vovor, 1 Mireille David, 1 Josue Feingold, 3 andFrederic Galacteros 2
1Service d’Hematologie du CHU de Lome-Faculte Mixte de Medecine et de Pharmacie, Lome, Togo2Service de Biochimie- Inserm U 468, Hopital Henri Mondor, 51 avenue du Marechal de Lattre de Tassigny, Creteil, France
3Epidemiologie genetique- Inserm U 155, Universite de Paris VII, Paris, France
The gene frequency of the most important hemoglobin (Hb) abnormalities is reported ina population of 171 Togolese newborns. Hb phenotypes, hematological parameters, andthe more frequently described a-gene deletions were analyzed. Structural abnormalitiesof b-globin were observed in 35.7% of the children with a gene frequency of 0.105 for bS
and 0.091 for bC. The frequency of the different a-globin genotypes was aa/ = 0.71, −a/ =0.28, and aaa/ = 0.01. All of the individuals homozygous for the − a/ genotypes, and mostof the heterozygous individuals, carried Hb Bart’s. Within the aa/aa and the − a/aagroups, several individuals with or without Hb Bart’s were found; they did not differ fromthe others by their red blood cell (RBC) parameters but by their levels of fetal hemoglobin(Hb F). The African a2 polymorphism marker, characterized by the replacement of G byTCGGCCC at position 7238 (EMBL HSHBA4, 1993) and of T 7174 by G, was found in 21newborns. The mean value of Hb F was calculated for each genotype, the mean Ggpercentage was 69.4 ± 4.0%, and the gene frequency of the AgTmarker was 0.10; thismarker was linked to the normal b-globin cluster. Am. J. Hematol. 59:208–213, 1998.© 1998 Wiley-Liss, Inc.
Key words: Hb Bart’s; Hb F; a-globin genotypes; Togo
INTRODUCTION
In West Africa, many hemoglobin (Hb) disorders, in-volving both thea- andb-globin chains, occur in variousfrequencies. The two most common are Hb S and Hb C.In a survey done by Cabannes et al. in 1987 [1], thefrequencies ofb-thalassemia and ofa-thalassemia werefound to vary from 0.5 to 7% and from 0.2 to 2.2%,respectively, according to the location of the study.These Hb disorders may be protective factors againstPlasmodium falciparum[2]. In addition, a-thalassemiacould be of benefit in the course of sickle cell anemia [3].In Togo, as in the other African Countries, Hb disordersconstitute a major problem for public health [4,5].
In the Togolese population, previous studies reportedthat the frequency of Hb abnormalities was 37.6% innewborns [5] and 34.1% in a group of rheumatologypatients [6]. The frequencies of S and C genes were 0.110and 0.053, respectively [5]. In this work, we report thegene frequencies of the most important Hb abnormalitiesin a population of 171 Togolese newborns. The Hb phe-
notypes, hematological parameters, and the more fre-quently describeda-gene deletions were analyzed. Tofind out whether an accurate determination of Hb Bart’sat birth would detect all the cases of deletionala-thalassemia, a comparison was done between thea-genestatus and the Hb Bart’s phenotype of all the children. Inaddition, the presence of the Africana2 polymorphism,previously described by Pre´hu and colleagues [7], waschecked in all the newborns.
MATERIALS AND METHODSPreparation of the Samples
One hundred seventy-four cord blood samples werecollected without selective criteria on ethylenediamine-
*Correspondence to: Dr. Henri Wajcman, Service de Biochimie- In-serm U 468, Hoˆpital Henri Mondor, 51 avenue du Mare´chal de Lattrede Tassigny, 94010 Cre´teil Cedex.
Received for publication 25 January 1998; Accepted 8 July 1998
American Journal of Hematology 59:208–213 (1998)
© 1998 Wiley-Liss, Inc.
tetraacetic acid (EDTA) from children born during athree-week period in the three maternity hospitals inLome (Togo). Three samples were excluded from thestudy because of the poor quality of their DNA, whichdid not allow molecular examination. Red blood cells(RBCs) were washed three times in NaCl (9%) andstored at −70°C. Packed white blood cells were collectedby selective hemolysis of the blood pellet using EDTA(25 mM, pH 8.0) − TRIS (20 mM, pH 7.5) and stored at−70°C.
Hematological Analysis
RBC counts were performed on an automated CoulterCounter (Coulter T 540) (Beckman Coulter, Fullerton,CA) providing eight parameters: red cell, white cell, andplatelet counts, Hb level, hematocrit, mean corpuscularvolume (MCV), mean corpuscular hemoglobin (MCH),and mean corpuscular hemoglobin concentration(MCHC).
Hb Phenotype
Isoelectric focusing on thin-layer agarose gel was per-formed according to Hocking [8]. Hb F and A2 wereassayed using theb-Thalassemia Short Program on aBiorad Variant Hemoglobin Testing system (Bio-RadLabs, Hercules, CA). A modification in the starting timeof the integration program allowed us to measure HbBart’s. The threshold value for detection of Hb Bart’swas 0.5%.
Fetal Hemaglobin Subunit Composition
Fetal Hemoglobin (Hb F) subunit composition (Gg,Ag, AgT) was obtained by reverse-phase perfusion chro-matography using the Poros R1 column (PerSeptive Bio-systems, Cambridge, MA) [9]. This procedure involves ahigh velocity flow of the mobile phase through porouschromatographic particles (10mm diameter) made ofpolystyrene-divinylbenzene. Elution was obtained at aflow rate of three ml/min by developing a gradient from36 to 41% acetonitrile. This measurement was done in allthe newborns.
Molecular Biology Studies
DNA was prepared from packed white cells by stan-dard phenol-chloroform extraction. The −3.7 and −4.2 kbdeletions of thea genes were investigated by polymerasechain reaction (PCR) analysis on a Perkin Elmer ther-mocycler (Norwalk, CT) according to Dode´ et al. [10]with the following modification: denaturation at 94°C for5 min in the first cycle; annealing 1.5 min at 57°C, ex-tension at 72°C for two min in each of the 30 subsequentcycles; and final elongation at 72°C for seven min. Threeprimers were used for characterization of thea−3.7 dele-tion: the upstream oligonucleotide C10 [10], and thea1anda2 specific downstream primers C2 and C3 [11]. For
determination of thea−4.2 deletion, three primers werealso used: the upstream oligonucleotide (58 TAGGACA-GACCCTCCCACGCGTAAG 38) which is locatedwithin IVS2 of Ca1 gene; the downstream primers(58TGTCCAGGAGCAAGCCAGGGTAAG 38) betweena1 anda2; and (58 TGCACGCCTCCCTGGACAAGTT38) located in exon 3 of thea1 gene. The experimentalconditions for amplification were identical to those de-scribed above. PCR products were analyzed by electro-phoresis on a 6% polyacrylamide gel.
The Africana2 polymorphism was determined as de-scribed previously; this abnormality is observed as het-eroduplexes when the PCR products containing thea2gene, selectively amplified according to the procedure ofDodeand colleagues [10], are analyzed by electrophore-sis in a 6% polyacrylamide gel.
Statistical Analysis
Comparisons betweena-thalassemia genotypes weremade using thex2 test. For the comparison of quantita-tive traits, analysis of variance was used.
RESULTSDescription of the Population
Ninety-three female and 78 male cord blood sampleswere analyzed. Seven children were premature. In Togo-lese newborns the mean values for Hb, MCV, and MCHwere 13.1 ± 2.1 g/dl, 106.1 ± 7.4 fl, and 34.5 ± 3.3 pg,respectively.
Hb Variants
Hb electrophoretic studies revealed that two childrenwere homozygous for sickle cell disease (as controlledby restriction endonucleaseBsu 36 I), four were com-pound heterozygotes for Hb S and Hb C, 28 were het-erozygotes for Hb S, and 27 for Hb C. In 110 newbornsthe electrophoretic pattern showed only Hb A as adultHb. At least one child could be suspected, from his he-matological data (Hb4 10.2 g/dl, MCV 4 97.8 fl,MCH 4 27.2 pg), and from the increased Hb A2 and HbF levels of his mother, to be a carrier of ab-thalassemiatrait, but this has not been verified by molecular biologystudies. Altogether, structural abnormalities ofb-globinwere observed in 35.7% of the newborns. The calculatedHb gene frequency was 0.105 forbS and 0.091 forbC.
Hb F
Hb F composition revealed aGg percentage of 69.4 ±4.0%, except in one case in which it was 41%. Hb FSardinia (AgT marker) was found in the heterozygousform in 28 newborns and in the homozygous form inthree of them, which had only Hb A. The heterozygousform of F Sardinia was observed in 20% of the newbornscarrying only Hb A and in 10.9% of those which were
Hemoglobins in Togolese Newborns 209
heterozygous for Hb S and Hb C. This suggests thatAgT
is linked to the Hb A chromosome except for one SCnewborn. The calculated gene frequency ofAgT markerwas 0.10. The Hb F level and percentage of Hb Bart’swere identical in individuals with or without theAgT
marker.
a-Globin Genes Status
Sixty-six newborns were heterozygous for thea−3.7
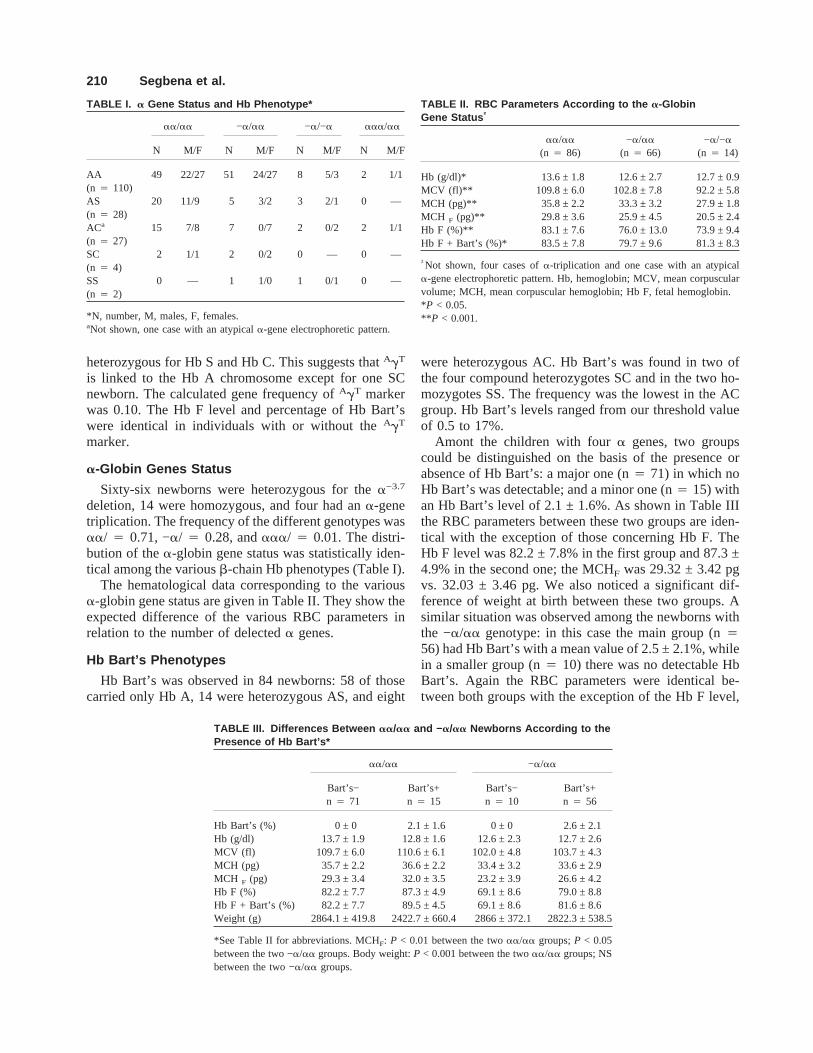
deletion, 14 were homozygous, and four had ana-genetriplication. The frequency of the different genotypes wasaa/ 4 0.71, −a/ 4 0.28, andaaa/ 4 0.01. The distri-bution of thea-globin gene status was statistically iden-tical among the variousb-chain Hb phenotypes (Table I).
The hematological data corresponding to the variousa-globin gene status are given in Table II. They show theexpected difference of the various RBC parameters inrelation to the number of delecteda genes.
Hb Bart’s Phenotypes
Hb Bart’s was observed in 84 newborns: 58 of thosecarried only Hb A, 14 were heterozygous AS, and eight
were heterozygous AC. Hb Bart’s was found in two ofthe four compound heterozygotes SC and in the two ho-mozygotes SS. The frequency was the lowest in the ACgroup. Hb Bart’s levels ranged from our threshold valueof 0.5 to 17%.
Amont the children with foura genes, two groupscould be distinguished on the basis of the presence orabsence of Hb Bart’s: a major one (n4 71) in which noHb Bart’s was detectable; and a minor one (n4 15) withan Hb Bart’s level of 2.1 ± 1.6%. As shown in Table IIIthe RBC parameters between these two groups are iden-tical with the exception of those concerning Hb F. TheHb F level was 82.2 ± 7.8% in the first group and 87.3 ±4.9% in the second one; the MCHF was 29.32 ± 3.42 pgvs. 32.03 ± 3.46 pg. We also noticed a significant dif-ference of weight at birth between these two groups. Asimilar situation was observed among the newborns withthe −a/aa genotype: in this case the main group (n456) had Hb Bart’s with a mean value of 2.5 ± 2.1%, whilein a smaller group (n4 10) there was no detectable HbBart’s. Again the RBC parameters were identical be-tween both groups with the exception of the Hb F level,
TABLE I. a Gene Status and Hb Phenotype*
aa/aa −a/aa −a/−a aaa/aa
N M/F N M/F N M/F N M/F
AA 49 22/27 51 24/27 8 5/3 2 1/1(n 4 110)AS 20 11/9 5 3/2 3 2/1 0 —(n 4 28)ACa 15 7/8 7 0/7 2 0/2 2 1/1(n 4 27)SC 2 1/1 2 0/2 0 — 0 —(n 4 4)SS 0 — 1 1/0 1 0/1 0 —(n 4 2)
*N, number, M, males, F, females.aNot shown, one case with an atypicala-gene electrophoretic pattern.
TABLE II. RBC Parameters According to the a-GlobinGene Status †
aa/aa
(n 4 86)−a/aa
(n 4 66)−a/−a
(n 4 14)
Hb (g/dl)* 13.6 ± 1.8 12.6 ± 2.7 12.7 ± 0.9MCV (fl)** 109.8 ± 6.0 102.8 ± 7.8 92.2 ± 5.8MCH (pg)** 35.8 ± 2.2 33.3 ± 3.2 27.9 ± 1.8MCH F (pg)** 29.8 ± 3.6 25.9 ± 4.5 20.5 ± 2.4Hb F (%)** 83.1 ± 7.6 76.0 ± 13.0 73.9 ± 9.4Hb F + Bart’s (%)* 83.5 ± 7.8 79.7 ± 9.6 81.3 ± 8.3
†Not shown, four cases ofa-triplication and one case with an atypicala-gene electrophoretic pattern. Hb, hemoglobin; MCV, mean corpuscularvolume; MCH, mean corpuscular hemoglobin; Hb F, fetal hemoglobin.*P < 0.05.** P < 0.001.
TABLE III. Differences Between aa/aa and −a/aa Newborns According to thePresence of Hb Bart’s*
aa/aa −a/aa
Bart’s−n 4 71
Bart’s+n 4 15
Bart’s−n 4 10
Bart’s+n 4 56
Hb Bart’s (%) 0 ± 0 2.1 ± 1.6 0 ± 0 2.6 ± 2.1Hb (g/dl) 13.7 ± 1.9 12.8 ± 1.6 12.6 ± 2.3 12.7 ± 2.6MCV (fl) 109.7 ± 6.0 110.6 ± 6.1 102.0 ± 4.8 103.7 ± 4.3MCH (pg) 35.7 ± 2.2 36.6 ± 2.2 33.4 ± 3.2 33.6 ± 2.9MCH F (pg) 29.3 ± 3.4 32.0 ± 3.5 23.2 ± 3.9 26.6 ± 4.2Hb F (%) 82.2 ± 7.7 87.3 ± 4.9 69.1 ± 8.6 79.0 ± 8.8Hb F + Bart’s (%) 82.2 ± 7.7 89.5 ± 4.5 69.1 ± 8.6 81.6 ± 8.6Weight (g) 2864.1 ± 419.8 2422.7 ± 660.4 2866 ± 372.1 2822.3 ± 538.5
*See Table II for abbreviations. MCHF: P < 0.01 between the twoaa/aa groups;P < 0.05between the two −a/aa groups. Body weight:P < 0.001 between the twoaa/aa groups; NSbetween the two −a/aa groups.
210 Segbena et al.
79.0 ± 8.8% in the first group and 69.1 ± 8.6% in thesecond one, and the MCHF. By contrast, Hb Bart’s wasobserved in all the newborns with the −a/−a genotype;its level was clearly higher (7.32 ± 3.48%).
In the individuals with Hb Bart’s who did not have thea−3.7 deletion, thea−4.2 deletion was looked for andnever found. The absence of this deletion was also veri-fied in the few newborns who had one or twoa genesdeleted and the highest level of Hb Bart’s for their group.
African a2 Polymorphism Marker
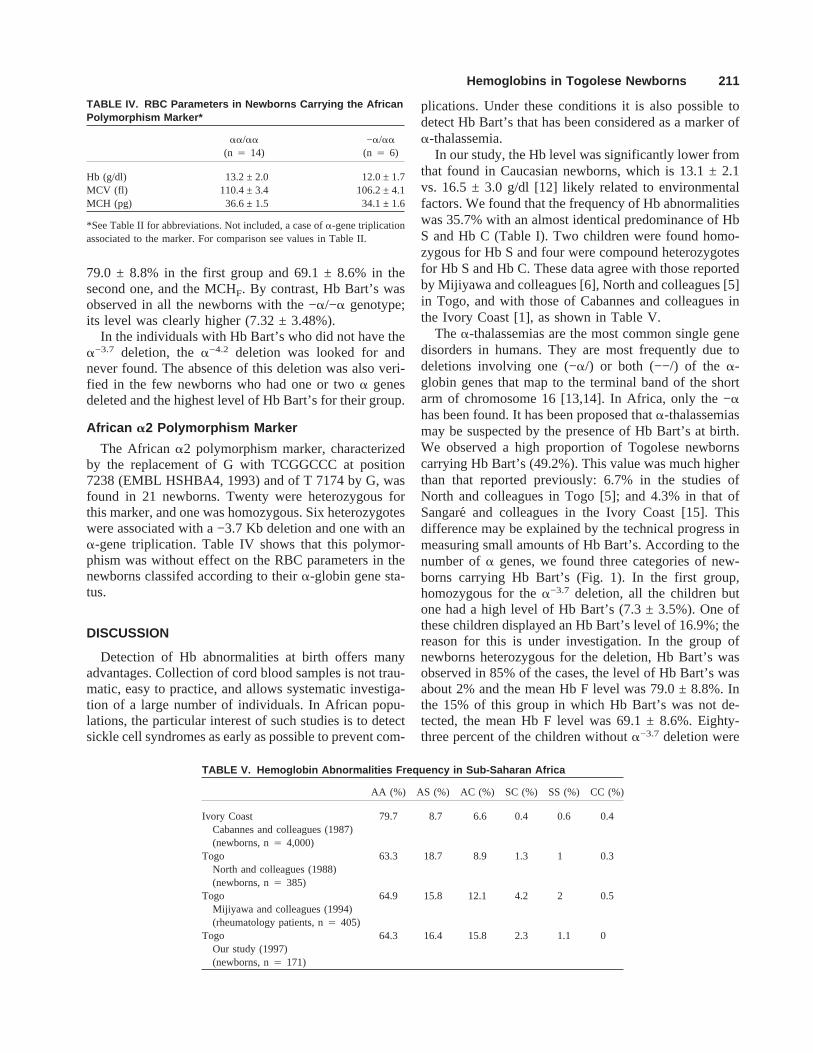
The African a2 polymorphism marker, characterizedby the replacement of G with TCGGCCC at position7238 (EMBL HSHBA4, 1993) and of T 7174 by G, wasfound in 21 newborns. Twenty were heterozygous forthis marker, and one was homozygous. Six heterozygoteswere associated with a −3.7 Kb deletion and one with ana-gene triplication. Table IV shows that this polymor-phism was without effect on the RBC parameters in thenewborns classifed according to theira-globin gene sta-tus.
DISCUSSION
Detection of Hb abnormalities at birth offers manyadvantages. Collection of cord blood samples is not trau-matic, easy to practice, and allows systematic investiga-tion of a large number of individuals. In African popu-lations, the particular interest of such studies is to detectsickle cell syndromes as early as possible to prevent com-
plications. Under these conditions it is also possible todetect Hb Bart’s that has been considered as a marker ofa-thalassemia.
In our study, the Hb level was significantly lower fromthat found in Caucasian newborns, which is 13.1 ± 2.1vs. 16.5 ± 3.0 g/dl [12] likely related to environmentalfactors. We found that the frequency of Hb abnormalitieswas 35.7% with an almost identical predominance of HbS and Hb C (Table I). Two children were found homo-zygous for Hb S and four were compound heterozygotesfor Hb S and Hb C. These data agree with those reportedby Mijiyawa and colleagues [6], North and colleagues [5]in Togo, and with those of Cabannes and colleagues inthe Ivory Coast [1], as shown in Table V.
The a-thalassemias are the most common single genedisorders in humans. They are most frequently due todeletions involving one (−a/) or both (−−/) of thea-globin genes that map to the terminal band of the shortarm of chromosome 16 [13,14]. In Africa, only the −ahas been found. It has been proposed thata-thalassemiasmay be suspected by the presence of Hb Bart’s at birth.We observed a high proportion of Togolese newbornscarrying Hb Bart’s (49.2%). This value was much higherthan that reported previously: 6.7% in the studies ofNorth and colleagues in Togo [5]; and 4.3% in that ofSangare´ and colleagues in the Ivory Coast [15]. Thisdifference may be explained by the technical progress inmeasuring small amounts of Hb Bart’s. According to thenumber ofa genes, we found three categories of new-borns carrying Hb Bart’s (Fig. 1). In the first group,homozygous for thea−3.7 deletion, all the children butone had a high level of Hb Bart’s (7.3 ± 3.5%). One ofthese children displayed an Hb Bart’s level of 16.9%; thereason for this is under investigation. In the group ofnewborns heterozygous for the deletion, Hb Bart’s wasobserved in 85% of the cases, the level of Hb Bart’s wasabout 2% and the mean Hb F level was 79.0 ± 8.8%. Inthe 15% of this group in which Hb Bart’s was not de-tected, the mean Hb F level was 69.1 ± 8.6%. Eighty-three percent of the children withouta−3.7 deletion were
TABLE V. Hemoglobin Abnormalities Frequency in Sub-Saharan Africa
AA (%) AS (%) AC (%) SC (%) SS (%) CC (%)
Ivory Coast 79.7 8.7 6.6 0.4 0.6 0.4Cabannes and colleagues (1987)(newborns, n4 4,000)
Togo 63.3 18.7 8.9 1.3 1 0.3North and colleagues (1988)(newborns, n4 385)
Togo 64.9 15.8 12.1 4.2 2 0.5Mijiyawa and colleagues (1994)(rheumatology patients, n4 405)
Togo 64.3 16.4 15.8 2.3 1.1 0Our study (1997)(newborns, n4 171)
TABLE IV. RBC Parameters in Newborns Carrying the AfricanPolymorphism Marker*
aa/aa
(n 4 14)−a/aa
(n 4 6)
Hb (g/dl) 13.2 ± 2.0 12.0 ± 1.7MCV (fl) 110.4 ± 3.4 106.2 ± 4.1MCH (pg) 36.6 ± 1.5 34.1 ± 1.6
*See Table II for abbreviations. Not included, a case ofa-gene triplicationassociated to the marker. For comparison see values in Table II.
Hemoglobins in Togolese Newborns 211
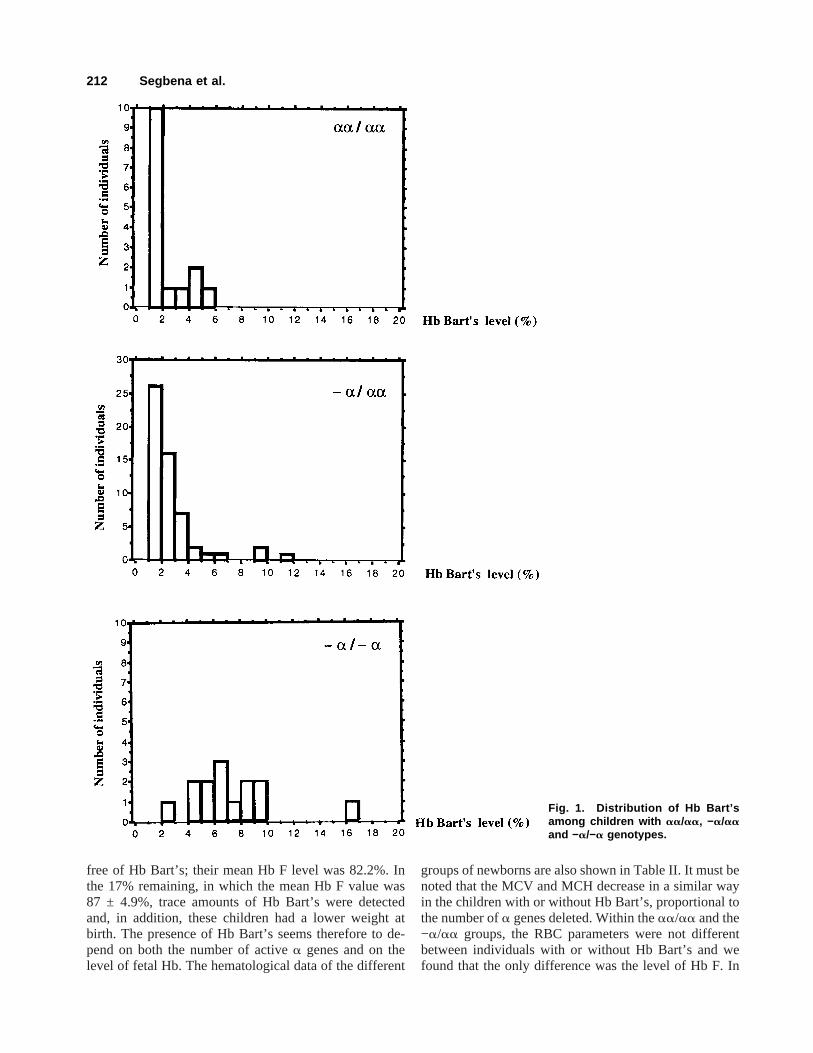
free of Hb Bart’s; their mean Hb F level was 82.2%. Inthe 17% remaining, in which the mean Hb F value was87 ± 4.9%, trace amounts of Hb Bart’s were detectedand, in addition, these children had a lower weight atbirth. The presence of Hb Bart’s seems therefore to de-pend on both the number of activea genes and on thelevel of fetal Hb. The hematological data of the different
groups of newborns are also shown in Table II. It must benoted that the MCV and MCH decrease in a similar wayin the children with or without Hb Bart’s, proportional tothe number ofa genes deleted. Within theaa/aa and the−a/aa groups, the RBC parameters were not differentbetween individuals with or without Hb Bart’s and wefound that the only difference was the level of Hb F. In
Fig. 1. Distribution of Hb Bart’samong children with aa/aa, −a/aaand −a/−a genotypes.
212 Segbena et al.
the absence or in the presence of low amounts of HbBart’s, the level of Hb F and the RBC parameters aresignificantly different, allowing distinction between the−a/aa andaa/aa genotypes. Our results suggest there-fore that previous studies ona-thalassemia epidemiol-ogy, done solely by measurement of Hb BArt’s at birthand RBC parameters, should be considered with caution.
The meanGg percentage observed in our study wassimilar to that reported by Wajcman et al. [16] during asystematic study done in Paris in a program of neonatalscreening for sickle cell disease. In one case, it amountedto 41%, which could be explained by ag-gene rearrange-ment [17]. AgT marker was found with a frequency of18.7%, which is also similar to that of the previous stud-ies [16,18]. This marker was always found associatedwith the A chromosome except for an SC newborn. New-borns with the S Cameroon haplotype were not found inthis Togolese population.
African polymorphism marker of thea2-globin genewas found in the Togolese newborns with a frequencysimilar to that reported by Pre´hu and colleagues [17] in astudy performed on 306 sickle cell disease patients fromAfrican followed in the sickle cell center in Paris. Theresults of Hb Bart’s, MCV, and MCH showed no signifi-cant difference between newborns positive or negativefor the presence of this marker, confirming that it has noa-thalassemia effect. This marker seems to be associatedwith the normalaa chromosomes.
In conclusion, our study confirmed the high frequencyof Hb S and Hb C and revealed a high frequency of thea−3.7 deletion. About 3% of the newborns carry a sicklecell disease. A good correlation between the RBC pa-rameters and thea-gene status was demonstrated, butfrequently individual cases do not correlate with the pres-ence of Hb Bart’s; the influence of Hb F on the Hbphenotype has to be emphasized. Thus, in cases withhigh Hb Barts’s and low Hb F, an additionala-geneabnormality may be suspected.
REFERENCES
1. Cabannes R, Fabritius H, Sangare´ A, Kple-Faget P: Hemoglobin vari-ants: distribution in West Africa. In Winter WP, ed. Hemoglobin Vari-ants in Human Population. Vol 2. Boca Raton Fl: CRC Press Inc., 1987pp 11–28.
2. Miller H: Malaria protective selective pressure. Nature 383:480–481,1996.
3. Higgs DR, Aldridge BE, Lamb J: The interaction ofa-thalassemia andhomozygous sicle cell disease. N Engl J Med 306:1441–1446, 1982.
4. Djembo-Taty M, Tchiloemba M, Galacte´ros F, Rosa J, Lissouba P:Etude epidemiologique des he´moglobinopathies au Congo chez 2257nouveau-ne´s. Nouv Rev Fr Hematol 28:249–251, 1986.
5. North ML, Piffaut MC, Duwig I, Locoh-Donou AG, Locoh-DonouAM: Detection of haemoglobinopathies at birth in Togo, Nouv Rev FrHematol 30:237–241, 1988.
6. Mijiyawa M, Ségbéna A, Vovor A, Nubukpo P, David M, Amédég-nato D: Hemoglobinopathies and rheumatology clinic patients inLome (Togo). Rev Rhum Engl Ed 61(3):165–169, 1994.
7. Prehu C, Pre´hu MO, Lee K, Privato M, Wajcman H, Goossens M,Galacteros F: Replacement of G by TCGGCCC at position 7238 andof T 7174 by G: A new polymorphism of thea2 globin gene in theAfrican population? Br J Haematol 93(suppl 2):26, 1996.
8. Hocking DR: The separation and identification of hemoglobin variantsby isoelectric focusing electrophoresis: An interpretive guide. In Hu-isman THJ, ed. Akron: Isolab Inc., 1997.
9. Wajcman H, Ducrocq R, Riou J, Mathis M, Godart C, Pre´hu C, Ga-lacteros F: Perfusion chromatography on reversed-phase column al-lows fast analysis of human globin chains. Anal Biochem, 237:80–87,1996.
10. DodeC, Krishnamoorthy R, Lamb J, Rochette J: Rapid Analysis ofa−3.7 and aaaanti3.7 triplication by enzymatic amplification analysis.Br J Haematol 82:105–111, 1992.
11. DodeC, Rochette J, Krishnamoorthy R: Locus assignment of humana globin mutations by selective amplification and direct sequencing.Br J Haematol 76:275–281, 1990.
12. Perel Y: Valeurs de re´ference en he´matologie pe´diatrique. In SchaisonG, Barachel A, Leblanc T, eds. He´matologie de l’Enfant. Paris: Flam-marion Medecine-Sciences, 1995.
13. Lauer J, Shen CJK, Maniatis T: The chromosomal arrangement ofhumana like globin genes: sequence homology anda globin genedeletions. Cell 20:119–130, 1980.
14. Buckle VJ, Higgs DR, Wilkie AOM, Super M, Weatherall DJ: Lo-calisation of humana-globin to 16 p 13.3-ter. J Med Genet 25:847–849, 1988.
15. Sangare´ A, Sanogo I, Meite´ M, Ambofo Y, Abe-Sopie V, Se´gbena A:Prevalence et profil ge´netique de L’a-thalasse´mique chez le nouveau-ne en Cote d’Ivoire. Med Trop 52:157–161, 1992.
16. Wajcman H, Riou J, Mathis M, Godart C, Hurtrel D, Pre´hu C, Bardak-djian J, Galacte´ros: Reversed phase perfusion chromatography: A newtool for the study of fetal hemoglobin disorders. Blood, 88(Suppl1):495a, 1996.
17 Efremov GD, Dimovski AJ, Popovski Z, Janeva S, Plaseska D, Sim-janovska L, Sukarova E, Momirovska A, Lazarevski M, Kuljan R: Theg-Globin gene rearrangements in newborns from the republic of Mace-donia. Hemoglobin 20:401–414, 1996.
18. Fei YJ, Kutlar F, Harris HF, Wilson MM, Milana A, Scialla P, SchiliroG, Masala B, Manca L, Altay C, Gurgey A, de Pablos JM, Villegas A,Huisman THJ: A search for anomalies in thez, a, b, and g globingene: Arrangements in normal Black, Italian, Turkish, and SpanishNewborns. Hemoglobin 13:45–65, 1989.
Hemoglobins in Togolese Newborns 213