Embed Size (px)
DESCRIPTION
education survey
Citation preview
(2010-2011)
ALL INDIA SURVEYON
HIGHER EDUCATION
GOVERNMENT OF INDIA
MINISTRY OF HUMAN RESOURCE DEVELOPMENT
DEPARTMENT OF HIGHER EDUCATION
NEW DELHI
2013
ALL INDIA SURVEY ON
HIGHER EDUCATION
2010‐11
GOVERNMENT OF INDIA
MINISTRY OF HUMAN RESOURCE DEVELOPMENT
DEPARTMENT OF HIGHER EDUCATION
NEW DELHI
2013

iii
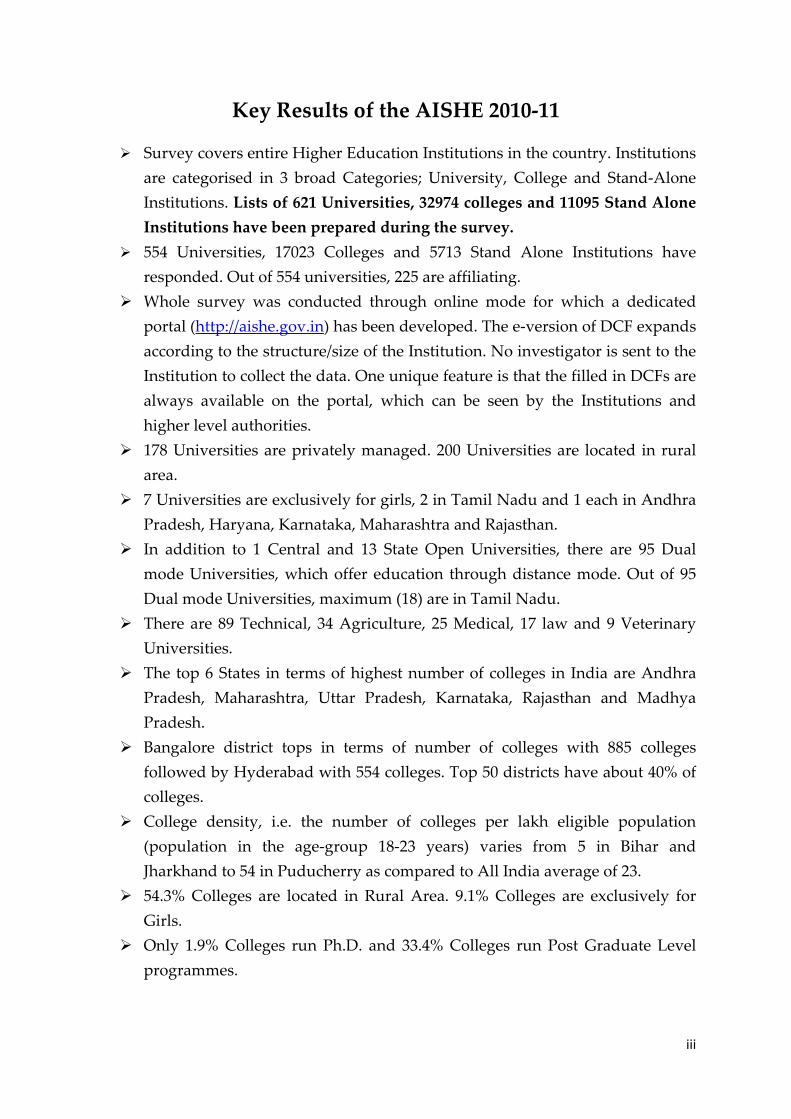
Key Results of the AISHE 2010‐11
Survey covers entire Higher Education Institutions in the country. Institutions
are categorised in 3 broad Categories; University, College and Stand‐Alone
Institutions. Lists of 621 Universities, 32974 colleges and 11095 Stand Alone
Institutions have been prepared during the survey.
554 Universities, 17023 Colleges and 5713 Stand Alone Institutions have
responded. Out of 554 universities, 225 are affiliating.
Whole survey was conducted through online mode for which a dedicated
portal (http://aishe.gov.in) has been developed. The e‐version of DCF expands
according to the structure/size of the Institution. No investigator is sent to the
Institution to collect the data. One unique feature is that the filled in DCFs are
always available on the portal, which can be seen by the Institutions and
higher level authorities.
178 Universities are privately managed. 200 Universities are located in rural
area.
7 Universities are exclusively for girls, 2 in Tamil Nadu and 1 each in Andhra
Pradesh, Haryana, Karnataka, Maharashtra and Rajasthan.
In addition to 1 Central and 13 State Open Universities, there are 95 Dual mode Universities, which offer education through distance mode. Out of 95
Dual mode Universities, maximum (18) are in Tamil Nadu.
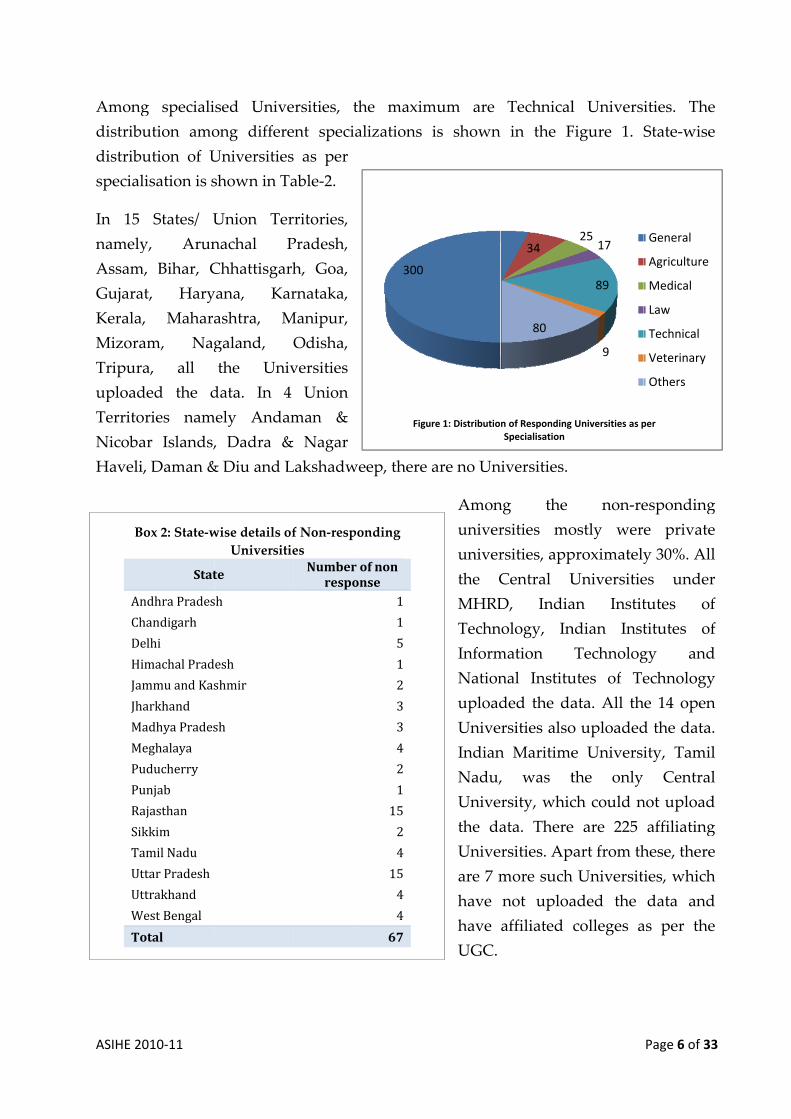
There are 89 Technical, 34 Agriculture, 25 Medical, 17 law and 9 Veterinary
Universities.
The top 6 States in terms of highest number of colleges in India are Andhra
Pradesh, Maharashtra, Uttar Pradesh, Karnataka, Rajasthan and Madhya
Pradesh.
Bangalore district tops in terms of number of colleges with 885 colleges
followed by Hyderabad with 554 colleges. Top 50 districts have about 40% of
colleges.
College density, i.e. the number of colleges per lakh eligible population
(population in the age‐group 18‐23 years) varies from 5 in Bihar and
Jharkhand to 54 in Puducherry as compared to All India average of 23.
54.3% Colleges are located in Rural Area. 9.1% Colleges are exclusively for Girls.
Only 1.9% Colleges run Ph.D. and 33.4% Colleges run Post Graduate Level programmes.
iv
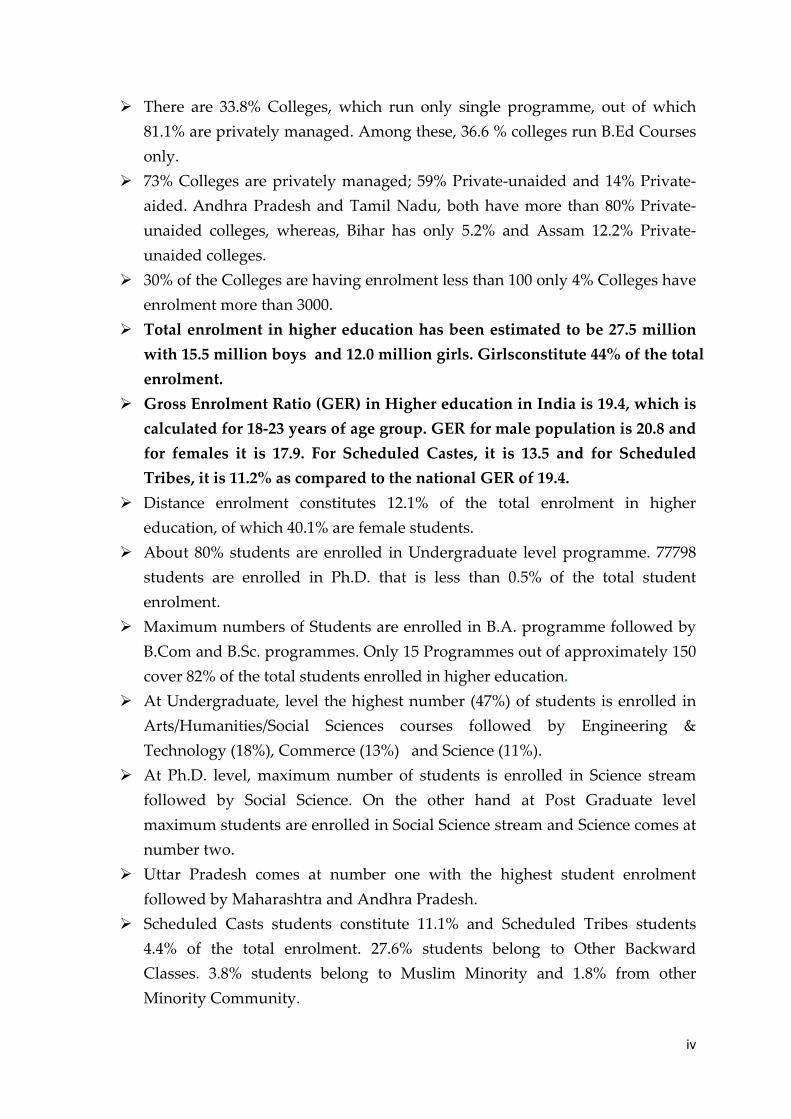
There are 33.8% Colleges, which run only single programme, out of which
81.1% are privately managed. Among these, 36.6 % colleges run B.Ed Courses
only.
73% Colleges are privately managed; 59% Private‐unaided and 14% Private‐
aided. Andhra Pradesh and Tamil Nadu, both have more than 80% Private‐
unaided colleges, whereas, Bihar has only 5.2% and Assam 12.2% Private‐
unaided colleges.
30% of the Colleges are having enrolment less than 100 only 4% Colleges have
enrolment more than 3000.
Total enrolment in higher education has been estimated to be 27.5 million with 15.5 million boys and 12.0 million girls. Girls constitute 44% of the total enrolment.
Gross Enrolment Ratio (GER) in Higher education in India is 19.4, which is calculated for 18‐23 years of age group. GER for male population is 20.8 and
for females it is 17.9. For Scheduled Castes, it is 13.5 and for Scheduled
Tribes, it is 11.2% as compared to the national GER of 19.4.
Distance enrolment constitutes 12.1% of the total enrolment in higher
education, of which 40.1% are female students.
About 80% students are enrolled in Undergraduate level programme. 77798
students are enrolled in Ph.D. that is less than 0.5% of the total student
enrolment.
Maximum numbers of Students are enrolled in B.A. programme followed by
B.Com and B.Sc. programmes. Only 15 Programmes out of approximately 150
cover 82% of the total students enrolled in higher education.
At Undergraduate, level the highest number (47%) of students is enrolled in
Arts/Humanities/Social Sciences courses followed by Engineering &
Technology (18%), Commerce (13%) and Science (11%).
At Ph.D. level, maximum number of students is enrolled in Science stream
followed by Social Science. On the other hand at Post Graduate level
maximum students are enrolled in Social Science stream and Science comes at
number two.
Uttar Pradesh comes at number one with the highest student enrolment
followed by Maharashtra and Andhra Pradesh.
Scheduled Casts students constitute 11.1% and Scheduled Tribes students 4.4% of the total enrolment. 27.6% students belong to Other Backward
Classes. 3.8% students belong to Muslim Minority and 1.8% from other
Minority Community.
v
The total number of foreign students enrolled in higher education is 27,531.
The foreign students come from 153 different countries from all across the
globe. The top 10 countries constitute 61% of the total foreign students
enrolled. Highest share of students come from the neighboring countries, of
which Nepal is 18%, followed by Iran (9%), Afghanistan (8%), and Bhutan
(5%). Sudan and United States constitutes 4% each and China, Iraq and Sri
Lanka constitutes 3% of the foreign students.
There are more than 70% colleges running in Private sector; aided and
unaided taking together, but it caters to only 61% of the total enrolment.
The total number of teachers in responding Institutions is 7,65,349. Out of
which more than half about 62.8% are male teachers and 37.85% are female
teachers.
At all‐India level there are merely 59 female teachers per 100 male teachers.
Pupil Teacher Ratio (PTR) in Universities and Colleges is 26.4. Among non‐teaching staff, the share of Group‐C is the highest with 40%,
while Group‐D seconds it with 33%. Group‐A and Group‐B comprise of 13
and 14 per cent non‐teaching posts respectively.
The average number of females per 100 male non‐teaching staff is 33.
Contents MESSAGE
Foreword (i)
Preface (ii)
Key Results of the AISHE 201011 iii‐v
CHAPTER IINTRODUCTION
1.1 Constitution of Task Force 1 1.2 Identification of Institutions for Coverage 1 1.3 Formulation of Concepts & Definition and Instruction
Manual 2
1.4 Preparation of Core List of Higher Education Institutions 2 1.5 Partner Agencies 3 1.6 Mode of Survey 3 1.7 Duration of the Survey 4 1.8 Institutions Uploaded Data under Survey 4
CHAPTER 2ANALYSIS 2.1 NUMBER OF INSTITUTIONS 5‐11 2.1.1 University 5 2.1.2 College 7 2.1.2(a) Management‐wise number of Colleges 9 2.1.2(b) Size of Colleges 9 2.1.3 Stand Alone Institution 10 2.2 STUDENT ENROLMENT 12‐24 2.2.1 Level‐wise Enrolment 12 2.2.2 Programme‐wise Enrolment
(Based on Actual Response) 13
2.2.3 Discipline/ Subject‐wise Enrolment (Based on Actual Response)
13
2.2.4 Gender Distribution 17 2.2.5 Social Category‐wise Distribution 18 2.2.6 Representation of Minority Students 19 2.2.7 Representation of PWD student 19 2.2.8 Representation of Foreign Students 19 2.2.8 a Programme‐wise Foreign Students 21 2.2.9 Enrolment in Distance Mode 21 2.2.10 Enrolment in Stand‐Alone Institutions 23 2.2.11 Representation of Private Sector 24 3 GROSS ENROLMENT RATIO IN HIGHER EDUCATION (18‐23
Years) 25
4 TEACHING STAFF 26 5 NON‐TEACHING STAFF 29
CHAPTER 3 ESTIMATION METHODOLOGY 31‐33
List of Figures Figure 1 Distribution of Responding Universities as per
Specialisation 6
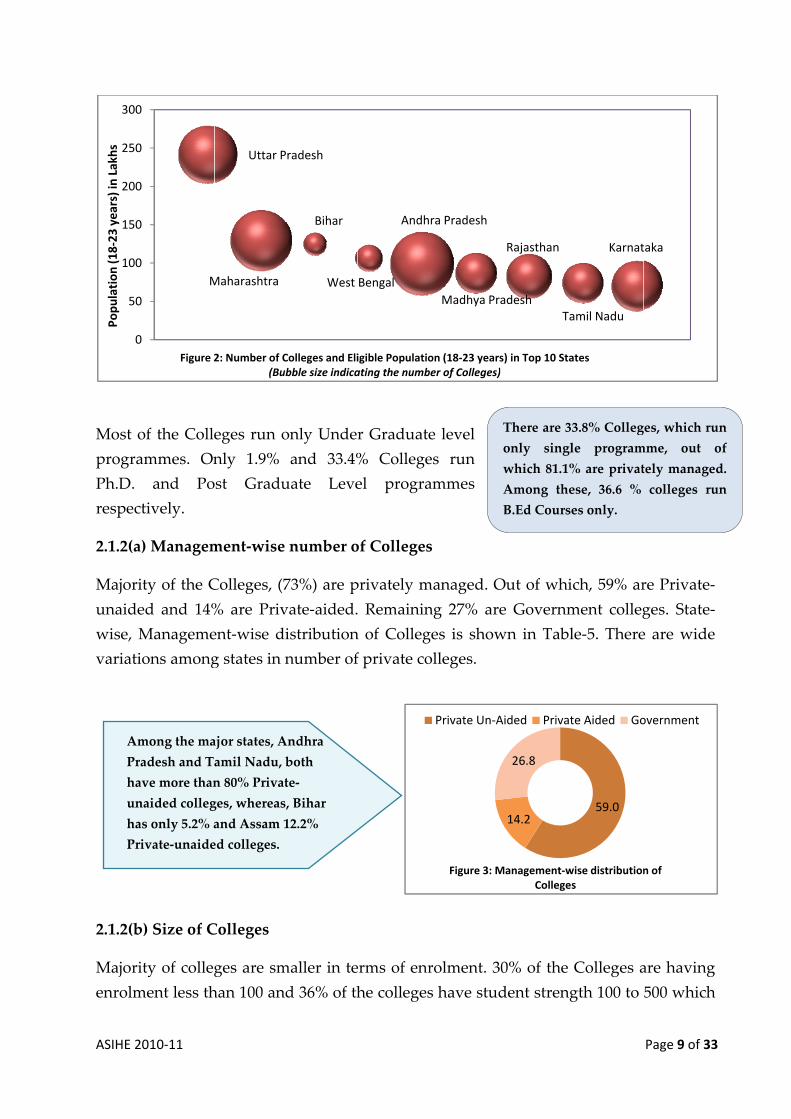
Figure 2 Number of Colleges and Eligible Population (18‐23 years) in Top 10 States
9
Figure 3 Management‐wise distribution of Colleges 9 Figure 4 Number of Colleges in Different Range of Enrolment 10 Figure 5 Share of Private sector in different type of Stand Alone
Institutions 11
Figure 6 Student Enrolment by Levels 12 Figure 7 Stream‐wise Distribution of Under Graduate Enrolment 14 Figure 8 Gender Distribution at Different Levels 17 Figure 9 Top 6 States as per Enrolment & Representation of Males
:Females 18
Figure 10 Social Categories and Gender Distribution in Student Enrolment
18
Figure 11 Foreign Students’ Distribution in Top 10 Countries 19 Figure 12 Foreign Students Enrolment across Levels 20 Figure 13 Gender‐wise & Level‐wise Foreign Students Enrolment 20 Figure 14 Females per 100 Males 22 Figure 15 Level‐wise Enrolment 22 Figure 16 Share of Regular & Distance Enrolment in Universities 22 Figure 17 Female Participation in Different Type of Stand‐Alone
Institutions 23
Figure 18 % Enrolment in Private & Government College 24 Figure 19 GER‐ Distributed according to Social Category and Gender 25 Figure 20 Social Category‐wise Distribution of Teaching Staff 26 Figure 21 Teachers: SC, ST, OBC, Muslims: Top 10 States 26 Figure 22 Teachers: Gender Distribution in Social and Religious
Categories 27
Figure 23 Teachers: Post‐wise Distribution 27 Figure 24 Teachers: Post‐wise Gender Distribution 27 Figure 25 Female per 100 Male Teacher in different types of
Institutions 28
Figure 26 Female per 100 Male Teachers in Stand Alone Institutions 28 Figure 27 Distribution of Non‐Teaching Posts according to Levels 29 Figure 28 Level wise Gender Distribution of Non‐Teaching Staff 29 Figure 29 Category‐wise Distribution of Non‐Teaching Staff 30 Figure 30 Female per 100 Male among Non‐Teaching Staff in Various
categories 30

List of Tables Table 1 State & Type‐Wise Number of Universities T‐1 Table 2 State & Specialisation‐wise Number of Universities T‐2
Table 3 State‐wise Distribution of Districts in Different Ranges of
number of Colleges T‐3
Table 4 Number of College per Lakh Population (18‐23 YEARS), Average Enrolment per College
T‐4
Table 5 Number of Private and Government Colleges T‐5 Table 5(a) Enrolment in Private and Government Colleges T‐6 Table 6 State‐wise Enrolment at various levels T‐7 Table 6(a) State‐wise Enrolment through Regular Mode at various
levels T‐10
Table 7 Enrolment in Universities teaching departments and its Constituent Unit/Off‐campus Centres
T‐13
Table 8 Number of Colleges and Enrolment in responding Colleges at various levels
T‐16
Table 9 Number and Enrolment in different types of Stand Alone Institutions
T‐19
Table 10 Estimated Enrolment in Colleges T‐22 Table 11 Programme‐wise Enrolment in various categories
(based on actual response) T‐23
Table 12 Enrolment at Under Graduate Level in Major Disciplines/ Subjects (based on actual response)
T‐37
Table 13 Enrolment at Ph.D., M.Phil. & Post Graduate Level in Major Disciplines/ Subjects (based on actual response)
T‐38
Table 14 Estimated State‐wise Enrolment in various social categories T‐40 Table 15 State‐wise Enrolment in PWD and Minority Community
(based on actual response) T‐41
Table 16 Country‐wise & Level‐wise Foreign Students (based on actual response)
T‐42
Table 17 State‐wise & Level‐wise Foreign Student (based on actual response)
T‐50
Table 18 Foreign Students in Different Programmes (based on actual response)
T‐53
Table 19 Gross Enrolment Ratio in Higher Education (18‐23 Years) T‐56 Table 20 Gender Parity Index in Higher Education (18‐23 Years) T‐57 Table 21(a) State‐wise Number of Teachers among various social
categories (based on actual response) T‐58
Table 21(b) State‐wise Number of Teachers among Minority & PWD (based on actual response)
T‐59
Table 22 State & Post‐Wise Number of Male & Female Teacher (based on actual response)
T‐60
Table 23 State & Post‐Wise Number of Male & Female Non‐Teaching staff (based on actual response)
T‐62
Table 24(a) State‐wise Number of Non‐Teaching staff among various social categories (based on actual response)
T‐64
Table 24(b) State‐wise Number of Non‐Teaching staff among Minority & PWD (based on actual response)
T‐65
Table 25 Number of different types of Colleges T‐66 Table 26 Number of different types of Responding Colleges T‐67 Table 27 Projected Population (18‐23 Years)‐2011‐11 T‐68
List of Boxes Box 1 State‐wise Dual Mode Universities 5 Box 2 State‐wise details of Non‐responding Universities 6 Box 3 Type‐wise details of Non‐responding Universities 7 Box 4 Number of Universities as per range of Colleges 7 Box 5 Non‐Responding Affiliating Universities 7 Box 6 Category‐wise Distribution of PWD students 19 Box 7 Level‐wise Distribution of Distance Enrolment 21 Box 8 Comparison between Regular & Distance enrolment in
University 22
List of Annexures Annexure1 Constitution of a Task Force for All India Survey on Higher
Education A‐1
Annexure2 Concepts & Definitions A‐8 Annexure3 List of Officers Involved in All India Survey on Higher
Education 2010‐11 A‐17
Annexure4 State‐wise Response in the Survey‐AISHE 2010‐11 A‐19 Annexure5 State‐wise List of Non‐Responding Universities A‐21 Annexure6 Estimation Formula A‐23 Annexure7 Coefficient of Variances (CV) of enrolment in Small Colleges A‐24
List of Maps Map1 Number of Universities and Colleges 2010‐11 Back of 5 Map2 Total Enrolment in Higher Education Back of 12 Map3 Gross Enrolment Ratio 2010‐11 in Higher Education (18‐23
Years) Back of 25
ASIHE 2010‐11 Page 1 of 33
CHAPTER I – INTRODUCTION
The Government has accorded high priority to the development of social sector and for
this purpose a number of flagship programmes are being implemented to build the
social infrastructure, especially in the area of education. However, in the absence of an
effective institutional mechanism, the statistics reflecting the outcomes of these
initiatives of the Government become available only after a considerable time lag and
with a number of limitations.
In view of this an effective institutional system was needed to be evolved to get the
timely and quality data on the progress achieved in the social sector including
education sector, which is having implications for human development. So, M/o
Human Resource Development (MHRD) initiated an All India Survey on Higher
Education to build a database and to assess the overall picture of higher Education in
the country. Database is also required to develop strategic indicators against various
goals that clearly identify what would be measured. Monitoring of achievement of
targets, annual and cumulative, may also be done on the baseline data.
1.1 Constitution of Task Force: A Task Force was constituted with representations
from various stake‐holders such as Ministry of Human Resource Development
(MHRD), University Grants Commission (UGC), All India Council for Technical
Education (AICTE), Medical Council of India (MCI), Indian Council of Agricultural
Research (ICAR), Central Statistics Office (CSO), Universities, State Higher Education
Departments to conceptualise the Survey and to provide technical guidance. The
notification on constitution of the Task Force and its Terms of Reference is given at
Annexure‐1.
1.2 Identification of Institutions for Coverage–The Institutions have been classified
in following 3 broad categories
University & University Level Institutions i.e. the Institutions which are
empowered to award degree under some Act of Parliament or State
Legislature.
Colleges/Institutions which are not empowered to provide degree in its own
name and therefore are affiliated/recognised with Universities.
Stand‐alone institutions (not affiliated with Universities) which are not
empowered to provide degree and therefore run Diploma Level
Programmes. During 2010‐11 survey, 5 types of such Institutions have been
ASIHE 2010‐11 Page 2 of 33
covered. These are, (i) Technical such as Polytechnics & (ii) Post Graduate
Diploma in Management recognised by AICTE (iii) Teacher Training such as
District Institute of Education & Training recognized by National Council
for Teacher Education (iv) Nursing Institutes recognized by Indian Nursing
Council and (v) Institutes directly under the control of various Central
Ministries.
1.3 Formulation of Concepts & Definition and Instruction Manual: All the terms
generally used in higher education such as University, college, programme, discipline,
faculty, department have been clearly defined in the instruction manual, which also
includes item‐wise instructions to fill the forms. Concepts and Definitions used in the
survey are given at Annexure‐2.
1.4 Preparation of Core List of Higher Education Institutions – The first and most
important and phenomenal task was to compile the core list of Institutions of higher
learning. There are numerous players in this field, which are not easily identifiable.
Listing of institutions was one of the major components as exhaustive list of all the
Institutions of higher learning in the country was not available. The list of all the
Universities and the Stand‐Alone Institutions has been prepared by adopting the
following method:
‐ Consulting the websites of the State Government Departments, Ministries
and Institutions.
‐ Consulting all the Central Ministries, Councils and State Governments for
providing the list of Institutions under their control.
Different colleges are regulated with different regulatory bodies. There are some
colleges whose programmes are recognized by more than one regulatory body. To
avoid duplication or omission, University was identified as the best source to prepare
the list of colleges. Thus, the College list was dynamically generated through
University during the survey. Software was designed in such a manner that as soon as
the university uploaded its form on the server, college list was automatically populated
in the data‐base.
A list of 621 Universities and 11095 Stand Alone Institutions has been prepared after
updating it during the survey by obtaining updated list from State Nodal Officers.
Although the List of Stand Alone Institutions is almost exhaustive, it is still not firm as
States are still revising it. Colleges list was prepared through University and a list of
32974 colleges has been generated from the 225 affiliating Universities which have
uploaded the form on the portal. It was found during the survey that some of the
ASIHE 2010‐11 Page 3 of 33
Universities have listed those colleges also which have actually been shifted to some
newly created universities or set up after 2010‐11. This has led to a few cases of
duplication and inclusion of a few colleges, which were not in existence during 2010‐11.
There were 7 affiliating universities which did not upload the form and therefore their
colleges’ list could not be generated. Thus the college list does not include the colleges
affiliated with these 7 universities.
1.5 Partner Agencies ‐ A core team of officers from MHRD and UGC was involved
in providing technical support, which includes preparation of DCF, providing training
in workshops, assisting National Informatics Centre (NIC) in software development
etc. National University of Educational Planning and Administration (NUEPA) was
entrusted with the responsibility of providing the administrative support. The software
support was provided by NIC. Several regulatory authorities also took part by
instructing their institutions for providing information in the survey.
Nodal officer has also been appointed in each State to coordinate the survey work.
Most of the States have nominated Higher/ Technical Education department as Nodal
department/ agency for coordinating the Survey. However, Chandigarh, Jharkhand,
Kerala, Odisha, West Bengal and Puducherry have engaged agencies/ Department
other than Higher/ Technical Education Department. Andaman & Nicobar Islands,
Lakshadweep, Dadra & Nagar Haveli, Jammu & Kashmir did not appoint any nodal
Department and therefore the work in these States was directly coordinated by MHRD.
Along with State nodal officers, 3 more nodal officers, one each from Directorate of
Technical Education (for Polytechnics), SCERT (for DIETs and Teacher Training
diploma level institutions) and State Nursing Council have also been appointed to co‐
ordinate with Standalone Institutions. The names of these nodal officers are shown at
Annexure‐3.
1.6 Mode of Survey ‐ A dedicated portal (http://aishe.gov.in) has been developed
with the help of National Informatics Centre (NIC) for collection & compilation of the
data. All the Institutions need to register on the portal for accessing the portal and
uploading its data. The registrations of the Institutions are approved by appropriate
level of officers at State/ Central Level and in case of colleges, by University nodal
Officers. The e‐version of DCF has been prepared in such a manner that it expands
according to the structure/size (Number of Faculties/ Departments, Programmes, etc.)
of the Institution. The Data Capture Format is downloaded from the portal, filled off‐
line and then filled‐in DCF is uploaded, which has made it completely paper‐less. DCF
ASIHE 2010‐11 Page 4 of 33
has been designed in such a manner that no manual aggregation is required at any
level. No investigator is sent to the Institution to collect the data. In fact the nodal
officers appointed by the Institutions themselves are the Investigator and they are
responsible for filling up the DCF and uploading it on the portal. This eliminates the
duplication of effort in data entry once form is uploaded by the Institution. Once data is
uploaded by the Institutions, data compilation is done automatically in pre‐designed
formats. One unique feature is that the filled in DCFs are always available on the
portal, which can be seen by the Institutions and higher level authorities and can be
modified, whenever required, till survey is closed.
1.7 Duration of the Survey ‐ Main Survey started in the month of August, 2011.
After testing the software in the field, during the initial 2‐3 months, the survey started
in full swing in the month of October, 2011 and continued till 06.05.2013. In between
Survey for the year 2011‐12 was also launched on 21.03.2013, with one of the special
features that data, such as basic details, name of faculties/departments and list of
programmes can be pre‐filled in future survey DCF from the previous filled in DCF
with an option to edit pre‐filled data.
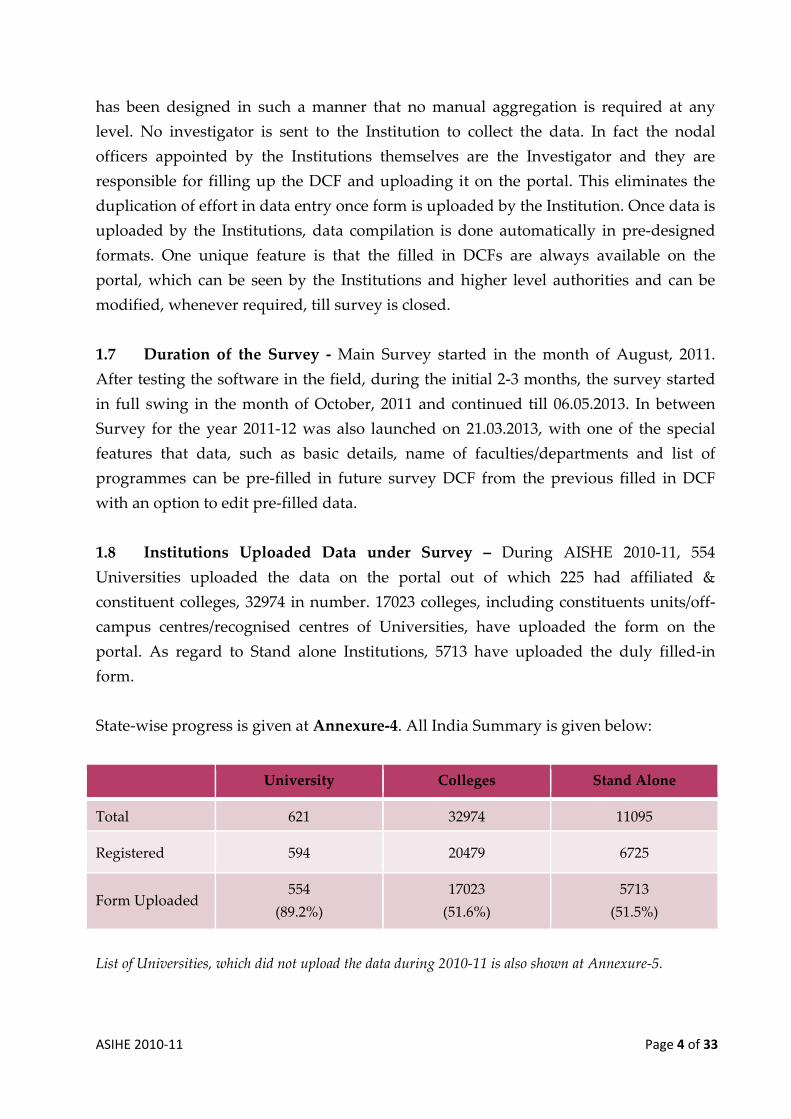
1.8 Institutions Uploaded Data under Survey – During AISHE 2010‐11, 554
Universities uploaded the data on the portal out of which 225 had affiliated &
constituent colleges, 32974 in number. 17023 colleges, including constituents units/off‐
campus centres/recognised centres of Universities, have uploaded the form on the
portal. As regard to Stand alone Institutions, 5713 have uploaded the duly filled‐in
form.
State‐wise progress is given at Annexure‐4. All India Summary is given below:
University Colleges Stand Alone
Total 621 32974 11095
Registered 594 20479 6725
Form Uploaded 554
(89.2%)
17023
(51.6%)
5713
(51.5%)
List of Universities, which did not upload the data during 2010‐11 is also shown at Annexure‐5.
ASIHE 2010‐11 Page 5 of 33
CHAPTER 2 – ANALYSIS
2.1 NUMBER OF INSTITUTIONS
2.1.1 University
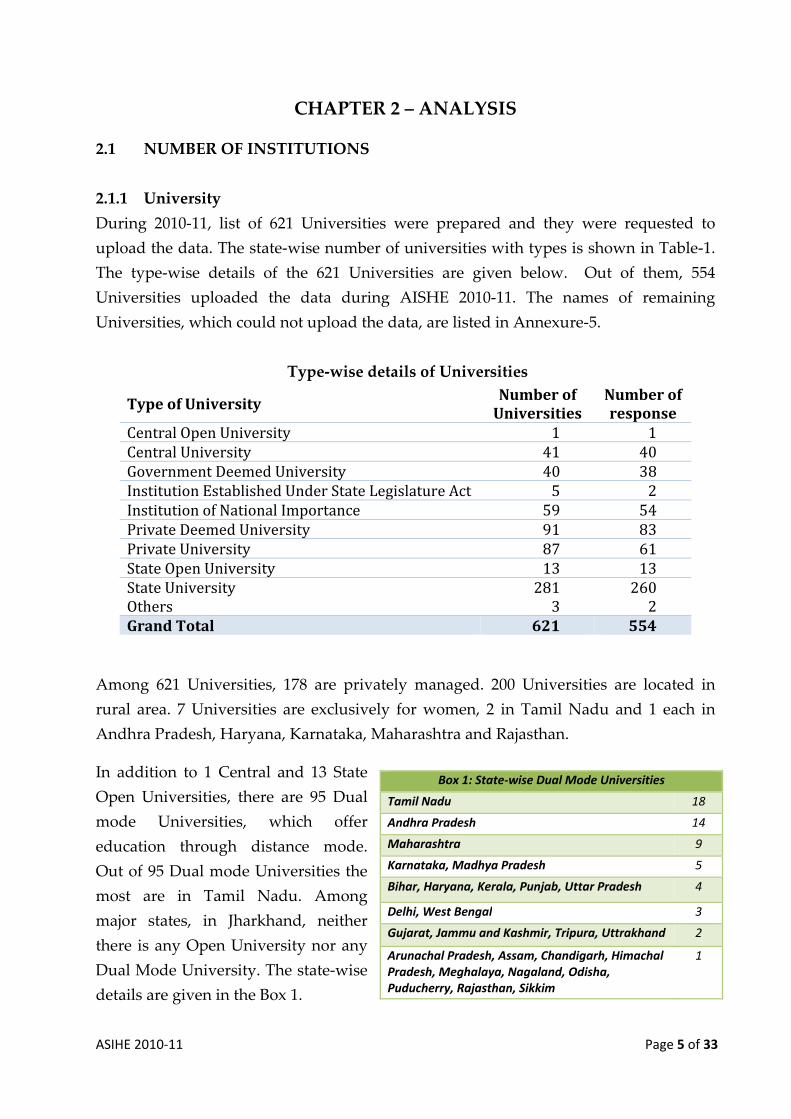
During 2010‐11, list of 621 Universities were prepared and they were requested to
upload the data. The state‐wise number of universities with types is shown in Table‐1.
The type‐wise details of the 621 Universities are given below. Out of them, 554
Universities uploaded the data during AISHE 2010‐11. The names of remaining
Universities, which could not upload the data, are listed in Annexure‐5.
Type‐wise details of Universities
Type of University Number of Universities
Number of response
Central Open University 1 1 Central University 41 40 Government Deemed University 40 38 Institution Established Under State Legislature Act 5 2 Institution of National Importance 59 54 Private Deemed University 91 83 Private University 87 61 State Open University 13 13 State University 281 260 Others 3 2 Grand Total 621 554
Among 621 Universities, 178 are privately managed. 200 Universities are located in
rural area. 7 Universities are exclusively for women, 2 in Tamil Nadu and 1 each in
Andhra Pradesh, Haryana, Karnataka, Maharashtra and Rajasthan.
In addition to 1 Central and 13 State
Open Universities, there are 95 Dual
mode Universities, which offer
education through distance mode.
Out of 95 Dual mode Universities the
most are in Tamil Nadu. Among
major states, in Jharkhand, neither
there is any Open University nor any
Dual Mode University. The state‐wise
details are given in the Box 1.
Box 1: State‐wise Dual Mode Universities
Tamil Nadu 18
Andhra Pradesh 14
Maharashtra 9
Karnataka, Madhya Pradesh 5
Bihar, Haryana, Kerala, Punjab, Uttar Pradesh 4
Delhi, West Bengal 3
Gujarat, Jammu and Kashmir, Tripura, Uttrakhand 2
Arunachal Pradesh, Assam, Chandigarh, Himachal Pradesh, Meghalaya, Nagaland, Odisha, Puducherry, Rajasthan, Sikkim
1
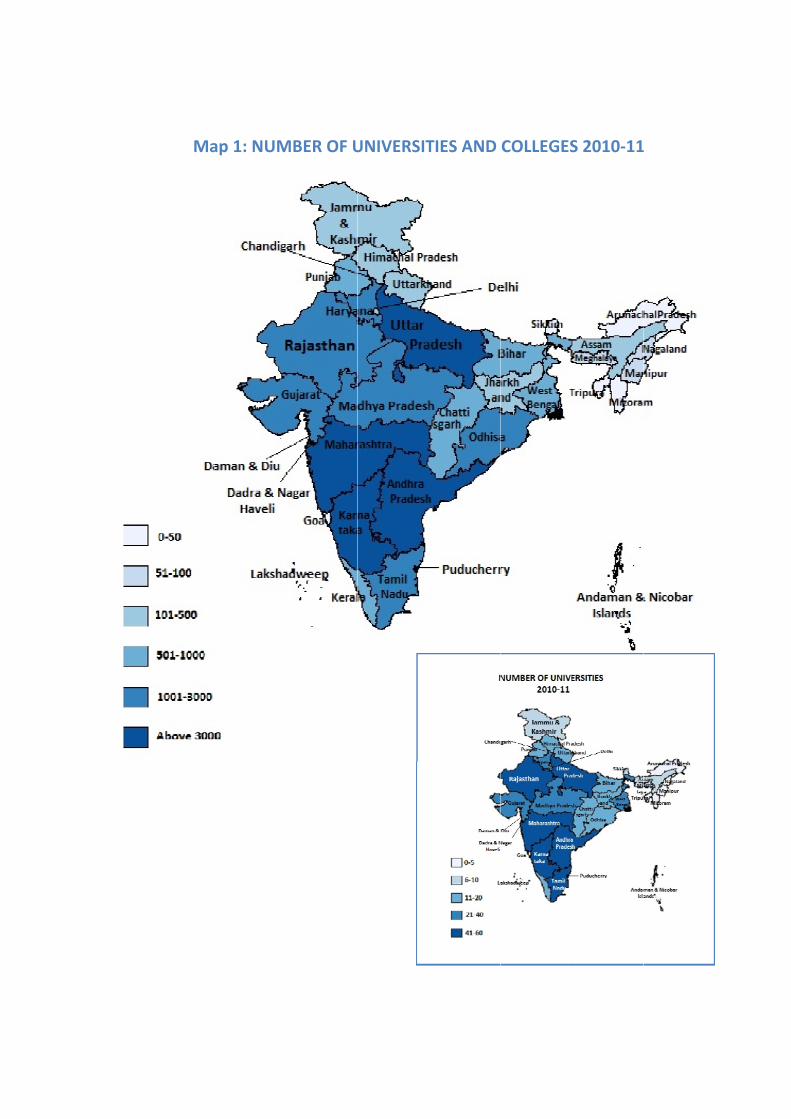
Maap 1: NUMMBER OF UUNIVERSITTIES AND COLLEGESS 2010‐111
ASIHE 20
Among
distribu
distribu
special
In 15
namely
Assam
Gujara
Kerala,
Mizora
Tripura
upload
Territo
Nicoba
Haveli,
B
An
Ch
De
Hi
Jam
Jha
Ma
Me
Pu
Pu
Ra
Sik
Ta
Ut
Ut
W
To
010‐11
g speciali
ution amo
ution of U
lisation is s
States/ U
y, Arun
m, Bihar, C
at, Hary
, Mahara
am, Nag
a, all
ded the d
ories nam
ar Islands,
, Daman &
ox 2: State‐w
Stat
ndhra Prades
handigarh
elhi
imachal Prad
mmu and Kas
arkhand
adhya Prades
eghalaya
uducherry
unjab
ajasthan
kkim
amil Nadu
ttar Pradesh
ttrakhand
West Bengal
otal
sed Univ
ong differ
Universitie
shown in T
Union Te
nachal
Chhattisga
yana, Ka
ashtra, M
galand,
the Uni
data. In 4
mely Anda
, Dadra &
& Diu and L
wise details o
Universit
te
sh
esh
shmir
sh
versities, t
rent specia
es as per
Table‐2.
erritories,
Pradesh,
rh, Goa,
arnataka,
Manipur,
Odisha,
iversities
4 Union
aman &
& Nagar
Lakshadw
of Non‐respo
ties Number
respo
the maxim
alizations
weep, there
onding
of non onse
1
1
5
1
2
3
3
4
2
1
15
2
4
15
4
4
67
300
Figu
mum are
is shown
are no Un
Amon
univer
univer
the C
MHRD
Techn
Inform
Nation
upload
Unive
Indian
Nadu,
Unive
the da
Unive
are 7 m
have
have
UGC.
ure 1: Distributio
Technical
in the F
niversities.
ng the
rsities mo
rsities, app
Central U
D, India
nology, In
mation
nal Institu
ded the da
rsities also
n Maritime
, was t
rsity, whic
ata. There
rsities. Ap
more such
not uploa
affiliated
34
80
n of Responding Specialisation
l Univers
Figure 1.
non‐re
ostly wer
proximately
Universitie
an Instit
ndian Inst
Technolog
utes of Te
ata. All th
o uploaded
e Universi
the only
ch could n
e are 225
part from th
h Universit
aded the
colleges a
2517
89
9
Universities as p
Page 6 of 33
ities. The
State‐wise
esponding
e private
y 30%. All
es under
tutes of
titutes of
gy and
echnology
he 14 open
d the data.
ity, Tamil
Central
not upload
affiliating
hese, there
ies, which
data and
as per the
per
General
Agriculture
Medical
Law
Technical
Veterinary
Others
3
g
r
f
f
y
n
l
l
g
h
ASIHE 2010‐11 Page 7 of 33
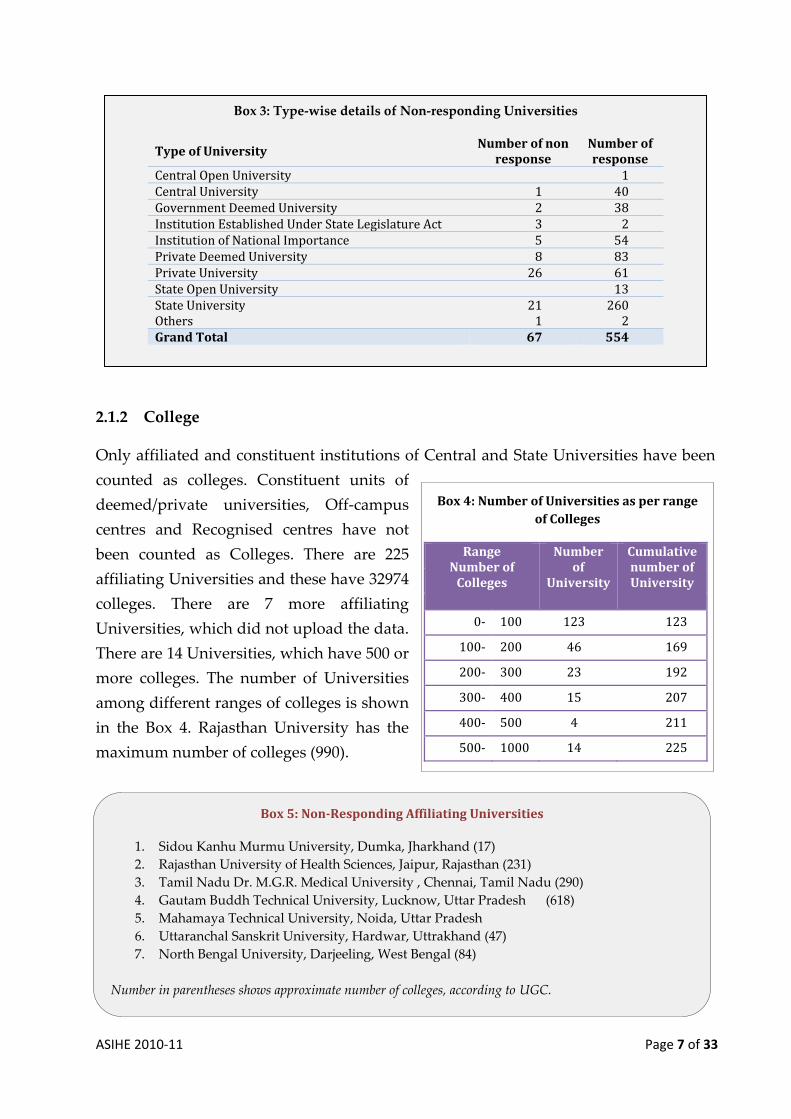
2.1.2 College
Only affiliated and constituent institutions of Central and State Universities have been
counted as colleges. Constituent units of
deemed/private universities, Off‐campus
centres and Recognised centres have not
been counted as Colleges. There are 225
affiliating Universities and these have 32974
colleges. There are 7 more affiliating
Universities, which did not upload the data.
There are 14 Universities, which have 500 or
more colleges. The number of Universities
among different ranges of colleges is shown
in the Box 4. Rajasthan University has the
maximum number of colleges (990).
Box 5: NonResponding Affiliating Universities
1. Sidou Kanhu Murmu University, Dumka, Jharkhand (17)
2. Rajasthan University of Health Sciences, Jaipur, Rajasthan (231)
3. Tamil Nadu Dr. M.G.R. Medical University , Chennai, Tamil Nadu (290)
4. Gautam Buddh Technical University, Lucknow, Uttar Pradesh (618)
5. Mahamaya Technical University, Noida, Uttar Pradesh
6. Uttaranchal Sanskrit University, Hardwar, Uttrakhand (47)
7. North Bengal University, Darjeeling, West Bengal (84)
Number in parentheses shows approximate number of colleges, according to UGC.
Box 4: Number of Universities as per range of Colleges
Range Number of Colleges
Number of
University
Cumulative number of University
0‐ 100 123 123
100‐ 200 46 169
200‐ 300 23 192
300‐ 400 15 207
400‐ 500 4 211
500‐ 1000 14 225
Box 3: Type‐wise details of Non‐responding Universities
Type of University Number of non
response Number of response
Central Open University 1 Central University 1 40 Government Deemed University 2 38 Institution Established Under State Legislature Act 3 2 Institution of National Importance 5 54 Private Deemed University 8 83 Private University 26 61 State Open University 13 State University 21 260 Others 1 2 Grand Total 67 554
ASIHE 2010‐11 Page 8 of 33
54.3% Colleges are
located in Rural Area
9.1% Colleges are
exclusively for Girls
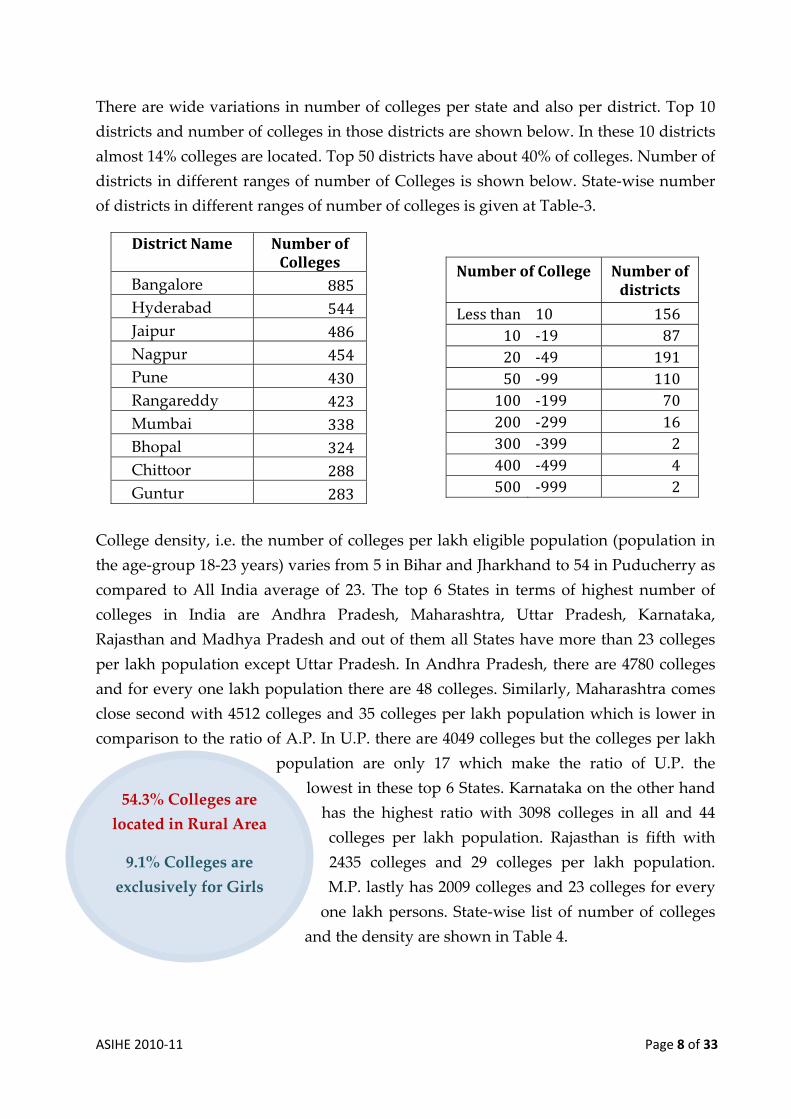
There are wide variations in number of colleges per state and also per district. Top 10
districts and number of colleges in those districts are shown below. In these 10 districts
almost 14% colleges are located. Top 50 districts have about 40% of colleges. Number of
districts in different ranges of number of Colleges is shown below. State‐wise number
of districts in different ranges of number of colleges is given at Table‐3.
District Name Number of Colleges
Bangalore 885 Hyderabad 544 Jaipur 486 Nagpur 454 Pune 430 Rangareddy 423 Mumbai 338 Bhopal 324 Chittoor 288 Guntur 283
Number of College
Number of districts
Less than 10 156 10 ‐19 87 20 ‐49 191 50 ‐99 110 100 ‐199 70 200 ‐299 16 300 ‐399 2 400 ‐499 4 500 ‐999 2
College density, i.e. the number of colleges per lakh eligible population (population in
the age‐group 18‐23 years) varies from 5 in Bihar and Jharkhand to 54 in Puducherry as
compared to All India average of 23. The top 6 States in terms of highest number of
colleges in India are Andhra Pradesh, Maharashtra, Uttar Pradesh, Karnataka,
Rajasthan and Madhya Pradesh and out of them all States have more than 23 colleges
per lakh population except Uttar Pradesh. In Andhra Pradesh, there are 4780 colleges
and for every one lakh population there are 48 colleges. Similarly, Maharashtra comes
close second with 4512 colleges and 35 colleges per lakh population which is lower in
comparison to the ratio of A.P. In U.P. there are 4049 colleges but the colleges per lakh
population are only 17 which make the ratio of U.P. the
lowest in these top 6 States. Karnataka on the other hand
has the highest ratio with 3098 colleges in all and 44
colleges per lakh population. Rajasthan is fifth with
2435 colleges and 29 colleges per lakh population.
M.P. lastly has 2009 colleges and 23 colleges for every
one lakh persons. State‐wise list of number of colleges
and the density are shown in Table 4.
ASIHE 20
Most o
progra
Ph.D.
respect
2.1.2(a)
Majorit
unaide
wise, M
variatio
2.1.2(b
Majorit
enrolm
0
50
100
150
200
250
300Population (18‐23 years) in
Lakhs
Am
Pra
hav
un
has
Pri
010‐11
of the Colle
ammes. On
and Po
tively.
) Managem
ty of the C
ed and 14%
Manageme
ons among
) Size of C
ty of colleg
ment less th
M
Figure 2
mong the ma
adesh and Ta
ve more than
aided colleg
s only 5.2% a
ivate‐unaide
eges run o
nly 1.9%
ost Gradu
ment‐wise
Colleges, (7
% are Priv
ent‐wise di
g states in n
Colleges
ges are sm
han 100 and
Uttar P
Maharashtra
2: Number of C(Bub
ajor states, A
amil Nadu, b
n 80% Privat
ges, whereas,
and Assam 1
ed colleges.
only Unde
and 33.4%
uate Leve
number o
73%) are p
vate‐aided.
istribution
number of
maller in te
d 36% of th
radesh
Bihar
West
Colleges and Elibble size indica
Andhra
both
te‐
, Bihar
12.2%
r Graduate
% College
el progra
of Colleges
privately m
Remainin
n of Colleg
f private co
erms of enr
he colleges
Bengal
Andh
igible Populatioating the numb
e level
es run
ammes
s
managed. O
ng 27% are
ges is show
olleges.
rolment. 3
s have stud
ra Pradesh
Madhya Pra
on (18‐23 yearsber of Colleges)
Figure 3: M
Private Un‐A
Out of whi
e Governm
wn in Tabl
0% of the
dent streng
adesh
Rajasthan
Ta
s) in Top 10 Sta
There are 33
only singl
which 81.1%
Among the
B.Ed Course
14.2
26.8
Management‐wColleges
Aided Privat
ich, 59% ar
ment colleg
le‐5. There
Colleges a
gth 100 to
amil Nadu
Karnat
ates
3.8% Colleg
le program
% are privat
ese, 36.6 %
es only.
59.0
wise distributions
te Aided Go
Page 9 of 33
re Private‐
ges. State‐
e are wide
are having
500 which
taka
ges, which ru
mme, out o
tely manage
colleges ru
n of
overnment
3
g
h
un
of
d.
un
ASIHE 2010‐11 Page 10 of 33
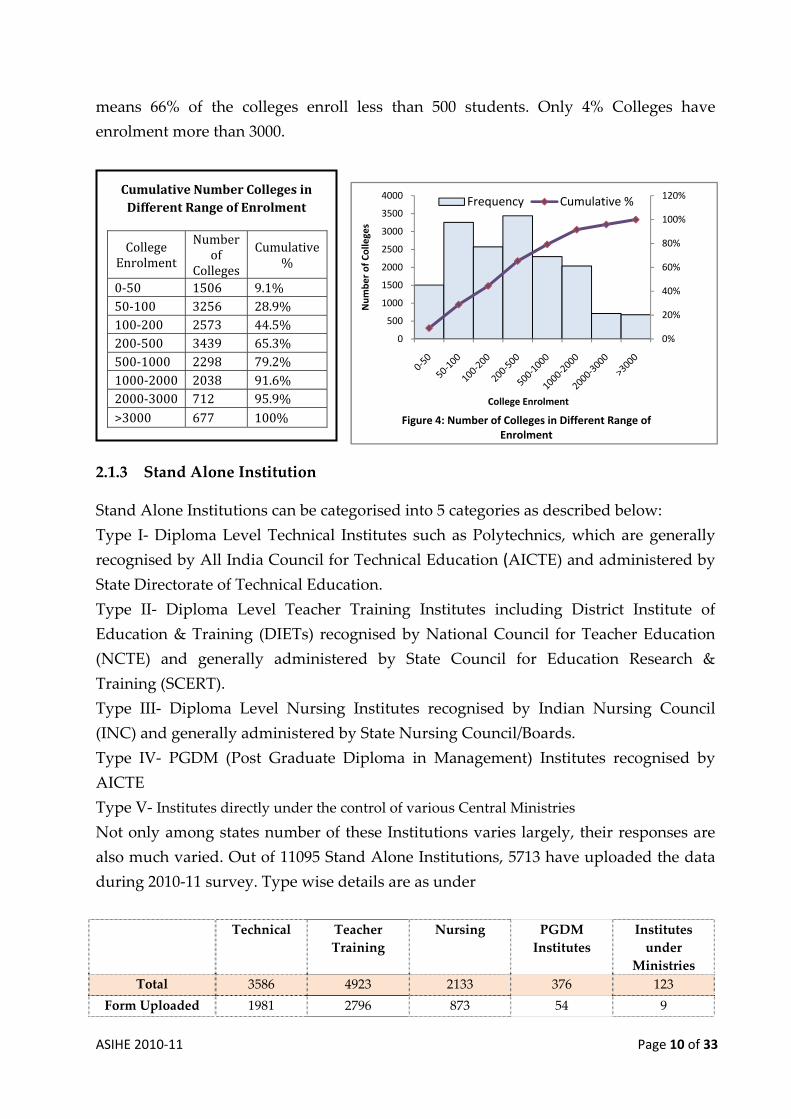
means 66% of the colleges enroll less than 500 students. Only 4% Colleges have
enrolment more than 3000.
2.1.3 Stand Alone Institution
Stand Alone Institutions can be categorised into 5 categories as described below:
Type I‐ Diploma Level Technical Institutes such as Polytechnics, which are generally
recognised by All India Council for Technical Education (AICTE) and administered by
State Directorate of Technical Education.
Type II‐ Diploma Level Teacher Training Institutes including District Institute of
Education & Training (DIETs) recognised by National Council for Teacher Education
(NCTE) and generally administered by State Council for Education Research &
Training (SCERT).
Type III‐ Diploma Level Nursing Institutes recognised by Indian Nursing Council
(INC) and generally administered by State Nursing Council/Boards.
Type IV‐ PGDM (Post Graduate Diploma in Management) Institutes recognised by
AICTE
Type V‐ Institutes directly under the control of various Central Ministries
Not only among states number of these Institutions varies largely, their responses are
also much varied. Out of 11095 Stand Alone Institutions, 5713 have uploaded the data
during 2010‐11 survey. Type wise details are as under
Technical Teacher
Training
Nursing PGDM
Institutes
Institutes
under
Ministries
Total 3586 4923 2133 376 123
Form Uploaded 1981 2796 873 54 9
0%
20%
40%
60%
80%
100%
120%
0
500
1000
1500
2000
2500
3000
3500
4000
Number of Colleges
College Enrolment
Figure 4: Number of Colleges in Different Range of Enrolment
Frequency Cumulative %Cumulative Number Colleges in Different Range of Enrolment
College Enrolment
Number of
Colleges
Cumulative %
0‐50 1506 9.1% 50‐100 3256 28.9% 100‐200 2573 44.5% 200‐500 3439 65.3% 500‐1000 2298 79.2% 1000‐2000 2038 91.6% 2000‐3000 712 95.9% >3000 677 100%
ASIHE 20
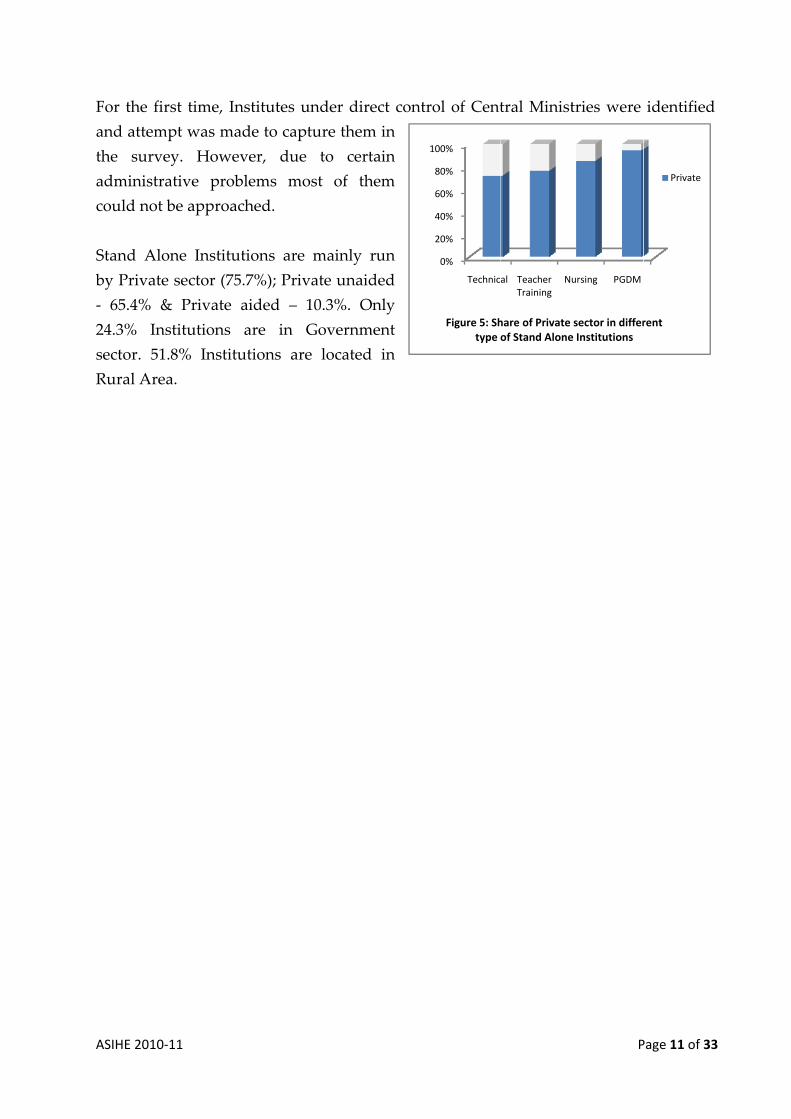
For the
and att
the su
admini
could n
Stand
by Priv
‐ 65.4%
24.3%
sector.
Rural A
010‐11
e first time
tempt was
urvey. Ho
istrative p
not be app
Alone Ins
vate sector
% & Priva
Institutio
51.8% In
Area.
e, Institute
s made to c
owever, d
problems
roached.
stitutions a
r (75.7%); P
ate aided
ns are in
nstitutions
es under d
capture the
due to ce
most of
are mainly
Private una
– 10.3%.
n Govern
are locate
direct contr
em in
ertain
them
y run
aided
Only
nment
ed in
rol of Cent
0%
20%
40%
60%
80%
100%
Technic
Figure 5: Shtype
tral Minist
al Teacher Training
Nu
hare of Private of Stand Alone
P
tries were
ursing PGDM
sector in differe Institutions
Page 11 of 33
identified
rent
Private
3
ASIHE 20
2.2
2.2.1
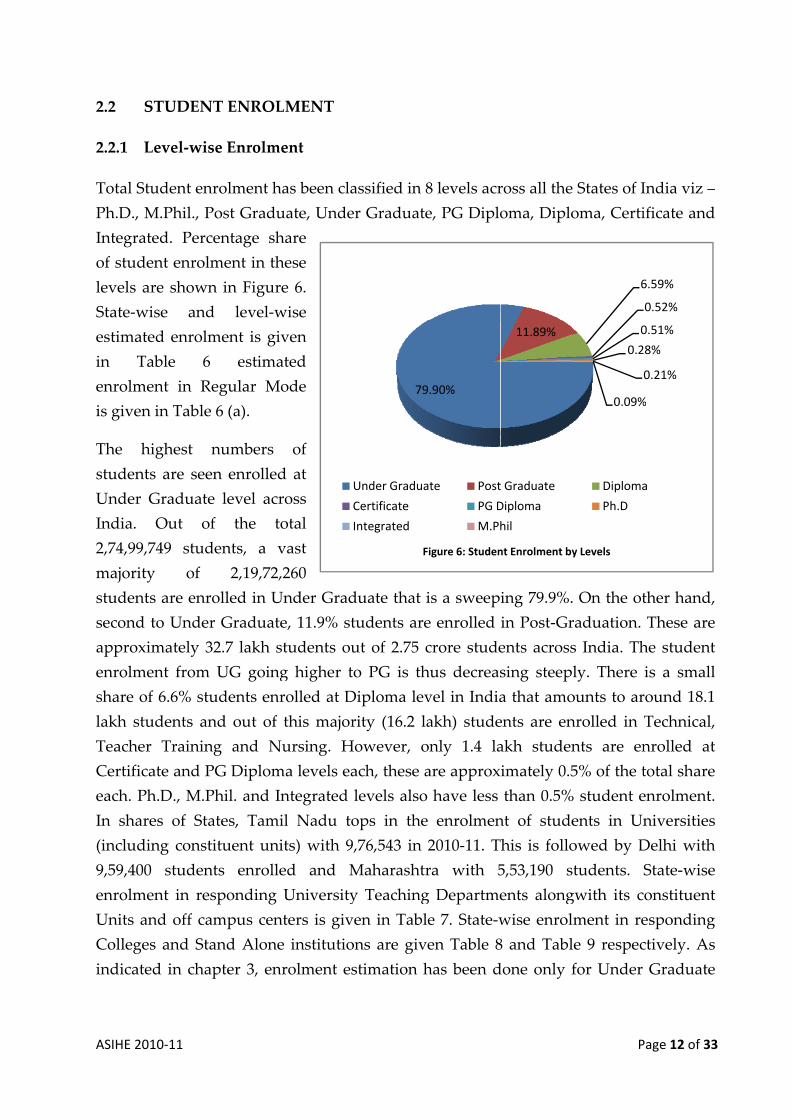
Total S
Ph.D.,
Integra
of stud
levels a
State‐w
estimat
in T
enrolm
is given
The h
studen
Under
India.
2,74,99
majorit
studen
second
approx
enrolm
share o
lakh st
Teache
Certific
each. P
In sha
(includ
9,59,40
enrolm
Units a
College
indicat
010‐11
STUDENT
Level‐wis
Student enr
M.Phil., P
ated. Perce
dent enrolm
are shown
wise and
ted enrolm
Table 6
ment in Re
n in Table
highest n
nts are seen
Graduate
Out of
9,749 stud
ty of
nts are enro
d to Under
ximately 32
ment from
of 6.6% stu
tudents an
er Training
cate and P
Ph.D., M.P
res of Sta
ding consti
00 student
ment in res
and off cam
es and Sta
ted in chap
T ENROLM
e Enrolme
rolment ha
ost Gradu
entage sha
ment in the
n in Figure
level‐w
ment is giv
estimat
egular Mo
6 (a).
numbers
n enrolled
e level acro
f the to
ents, a v
2,19,72,2
olled in Un
r Graduate
2.7 lakh st
UG going
udents enro
nd out of t
g and Nu
G Diploma
hil. and In
ates, Tamil
ituent unit
ts enrolle
sponding U
mpus cent
and Alone
pter 3, enr
MENT
ent
as been cla
ate, Under
are
ese
e 6.
wise
ven
ted
ode
of
d at
oss
otal
vast
260
nder Grad
e, 11.9% stu
tudents ou
g higher to
olled at Di
this majori
ursing. Ho
a levels ea
ntegrated l
l Nadu to
ts) with 9,
ed and M
University
ters is give
institution
rolment es
U
C
In
ssified in 8
r Graduate
uate that i
udents are
ut of 2.75 c
o PG is th
iploma lev
ity (16.2 la
owever, o
ach, these a
levels also
ops in the
76,543 in 2
Maharashtr
y Teaching
en in Table
ns are give
timation h
79
Fi
Under Gradua
Certificate
ntegrated
8 levels acr
e, PG Diplo
is a sweep
e enrolled
crore stude
hus decreas
vel in India
akh) stude
nly 1.4 la
are approx
have less
enrolmen
2010‐11. T
ra with 5
g Departme
e 7. State‐w
en Table 8
has been d
.90%
igure 6: Studen
te Post
PG D
M.Ph
ross all the
oma, Diplo
ing 79.9%.
in Post‐Gr
ents across
sing steep
a that amo
ents are en
akh studen
imately 0.5
than 0.5%
nt of stude
This is follo
5,53,190 s
ents along
wise enrol
8 and Tabl
done only f
11.89%
nt Enrolment by
t Graduate
Diploma
hil
P
e States of I
oma, Certi
. On the ot
raduation.
s India. Th
ly. There
ounts to ar
nrolled in
nts are en
5% of the t
% student e
ents in Un
owed by D
students.
gwith its c
lment in re
le 9 respec
for Under
6
0
0.2
0.09%
y Levels
Diploma
Ph.D
Page 12 of 33
India viz –
ificate and
ther hand,
These are
he student
is a small
round 18.1
Technical,
nrolled at
total share
enrolment.
niversities
Delhi with
State‐wise
onstituent
esponding
ctively. As
Graduate
6.59%
0.52%
0.51%
28%
0.21%
%
a
3
–
t
t
h
t
g
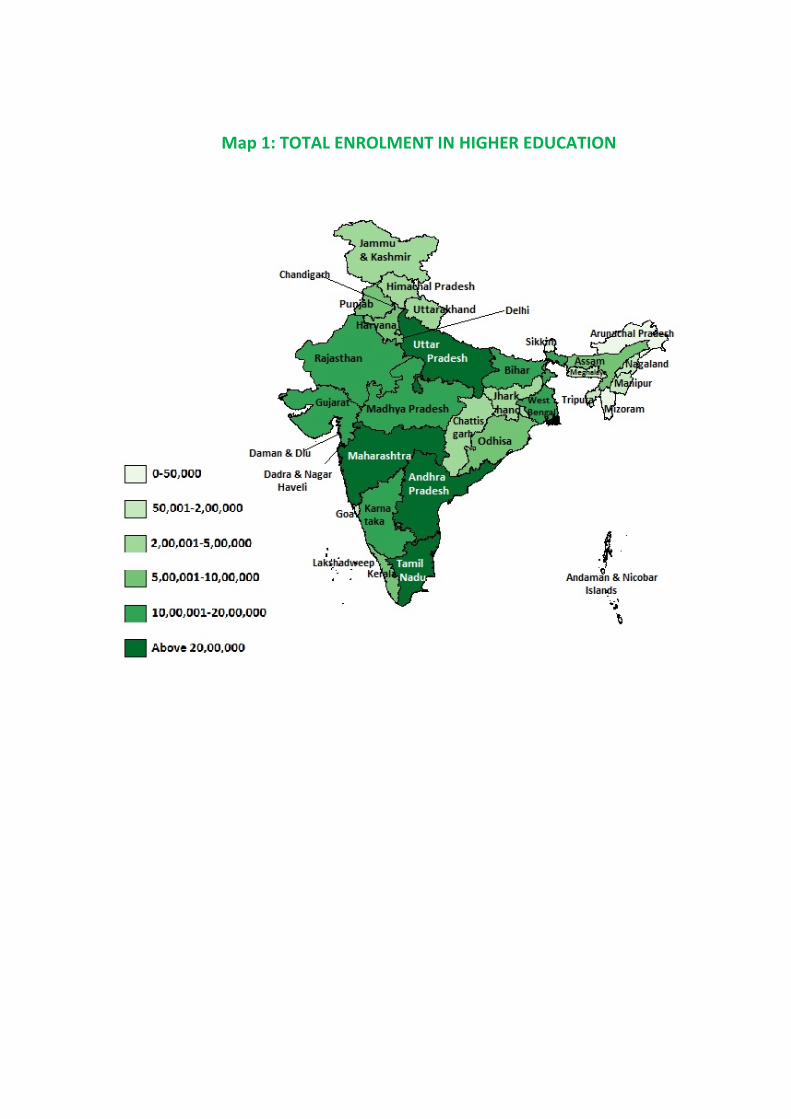
Map 1: TOTAL ENROLMENT IN HIGHER EDUCATION
ASIHE 2010‐11 Page 13 of 33
and Post Graduate level in Colleges and for which State‐wise details is given in Table
10.
2.2.2 Programme‐wise Enrolment (Based on Actual Response)
As regard to Programmes, out of total, 18 programmes were studied to see the
student’s concentration. B.A. has 57.11 lakh
students enrolled in it which is the highest
enrolment. The percentage of male is 50.62% which
shows almost equal distribution of male and
female. BCA has total number of 3.75 lakh students
and out of them 69.9% are males. B.Com. has 18.37
lakh students enrolled in total and out of them 58.28% are male students. B.E. has 8.69
lakh students enrolled out of which 70.68% students are from male category. 17.41 lakh
students are enrolled in B.Sc. and out of them 54.22% are from male category and
45.78% are from female category. B.Tech. has 14.52 lakh enrolled students out of which
70.75% are males which keep the percentage of females restricted to less than 30%. LLB
has total number of 1.18 lakh students out of which 69.72% are males representing
unequal distribution of gender. M.A. has more than 9 lakh students enrolled with
52.97% of female students. MBA has total number of 5.62 lakh students having 73.02%
of male students. MBBS has total number of 89,463 students and male representation is
60.82% in that. MCA has 2.27 lakh students out of which 66.24% are from male
category. There is total number of 1.65 lakh students in M.Com., out of which 51.21%
are females. M.Sc. has total number of 3.62 lakh students with 50.18% of males and
49.82% of females. M.Tech has total number of 88,064 students with high number of
male students. The male representation is 75.19% and female percentage is only 24.81%.
Programme‐wise enrolment on the basis of actual response is given in Table 11.
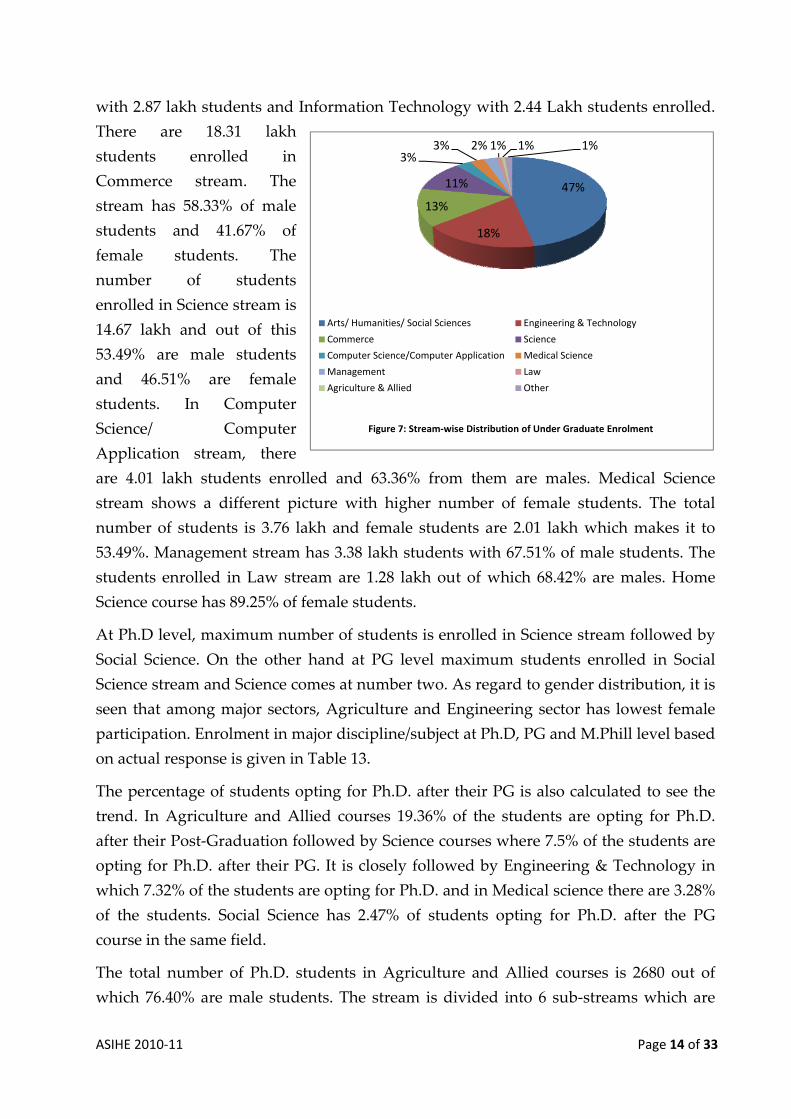
2.2.3 Discipline/Subject‐wise Enrolment (Based on Actual Response)
The total enrolment at Undergraduate Level in major discipline/subject based on actual
response is given in Table 12. The highest number of students is enrolled in
Arts/Humanities/Social Sciences courses. The total number of students enrolled in this
are 63.02 lakh out of which 50.3% are males and 49.7% are females. Engineering and
Technology is second major stream with 23.98 lakh students enrolled. The total number
of male students enrolled in Engineering is 70.84%. Female participation in this sector is
very low. This stream has 13 sub streams like Electronics Engineering, Computer
Engineering, Mechanical Engineering, Electrical Engineering etc. The top 5 sub stream
are Electronics Engineering with 5.42 lakh students, Computer Engineering with 4.75
Lakh students, Mechanical Engineering with 3.56 Lakh students, Electrical Engineering
15 Programmes cover 82% of the total students enrolled in
higher education
ASIHE 2010‐11 Page 14 of 33
with 2.87 lakh students and Information Technology with 2.44 Lakh students enrolled.
There are 18.31 lakh
students enrolled in
Commerce stream. The
stream has 58.33% of male
students and 41.67% of
female students. The
number of students
enrolled in Science stream is
14.67 lakh and out of this
53.49% are male students
and 46.51% are female
students. In Computer
Science/ Computer
Application stream, there
are 4.01 lakh students enrolled and 63.36% from them are males. Medical Science
stream shows a different picture with higher number of female students. The total
number of students is 3.76 lakh and female students are 2.01 lakh which makes it to
53.49%. Management stream has 3.38 lakh students with 67.51% of male students. The
students enrolled in Law stream are 1.28 lakh out of which 68.42% are males. Home
Science course has 89.25% of female students.
At Ph.D level, maximum number of students is enrolled in Science stream followed by
Social Science. On the other hand at PG level maximum students enrolled in Social
Science stream and Science comes at number two. As regard to gender distribution, it is
seen that among major sectors, Agriculture and Engineering sector has lowest female
participation. Enrolment in major discipline/subject at Ph.D, PG and M.Phill level based
on actual response is given in Table 13.
The percentage of students opting for Ph.D. after their PG is also calculated to see the
trend. In Agriculture and Allied courses 19.36% of the students are opting for Ph.D.
after their Post‐Graduation followed by Science courses where 7.5% of the students are
opting for Ph.D. after their PG. It is closely followed by Engineering & Technology in
which 7.32% of the students are opting for Ph.D. and in Medical science there are 3.28%
of the students. Social Science has 2.47% of students opting for Ph.D. after the PG
course in the same field.
The total number of Ph.D. students in Agriculture and Allied courses is 2680 out of
which 76.40% are male students. The stream is divided into 6 sub‐streams which are
47%
18%
13%
11%
3%3% 2% 1% 1% 1%
Figure 7: Stream‐wise Distribution of Under Graduate Enrolment
Arts/ Humanities/ Social Sciences Engineering & Technology
Commerce Science
Computer Science/Computer Application Medical Science
Management Law
Agriculture & Allied Other
ASIHE 2010‐11 Page 15 of 33
Agriculture, Veterinary & Animal, Horticulture, Fisheries Science, Forestry and
Sericulture. Apart from Agriculture main stream with 1925 students (1410 males and
515 females), highest enrolment is seen in Veterinary & Animal sub‐stream has 346
students followed by Horticulture with total number of 147 students. At PG level
13,841 students are enrolled in Agriculture & Allied sector. Agriculture sub‐stream has
total number of 10,080 students with 68.85% of male students and 31.15% of female
students. Veterinary & Animal has total number of 2281 students with 77.9% of male
students at PG level.
Commerce stream has 2533 students enrolled in it for Ph.D. with 60.28% of the male
students. At PG level, 1.81 lakh students are enrolled with 50.11% of the female
students. Computer Science/ Computer have total number of 1402 students with 55.99%
of male students at Ph.D. level and at PG level there are total number 1.66 lakh
students.
Engineering & Technology stream is divided into 13 sub‐streams with total number of
15,346 students enrolled for Ph.D and 2.09 lakh students at PG level. Computer
Engineering has highest number of 1806 students enrolled for Ph.D. with 72.25% of
male students. Information Technology is the second highest having 1084 students with
82.84% of male students. At PG level also, Computer Engineering has highest number
of 68,467 students with 60.19% of male students. Information technology has 20,012
students at PG level with 15,575 male students.
There is total number of 1924 students enrolled in Ph.D. in foreign languages. Foreign
language stream is divided into 5 sub streams and English is at the top of the list with
the students enrolled for Ph.D. There are 1637 students enrolled in Ph.D. in English
with 50.88% of male students and 49.12% of female students. French language has total
number of 120 students enrolled in Ph.D. 62.5% of the total students are from female
category. At PG level, there is total number of 96,594 students enrolled. Out of this total
number 94,531 students are enrolled in English language with 56.9% of female
students.
Home Science stream is divided into 3 sub streams with total number of 725 students
enrolled for Ph.D. There are total number of 8061 students enrolled at PG level with 461
males and 7600 females. Home Science has total number of 6140 students with 6052
females and 88 males. Food technology has 762 students with 560 females and 202
males. Nutrition has 1159 students at PG level with 988 females.
There is total number of 4755 students enrolled in Ph.D. in Indian languages which is
divided into 11 sub‐streams. The highest number of students is enrolled in Hindi
ASIHE 2010‐11 Page 16 of 33
language which is 1435 with 726 male students and 709 female students. Sanskrit has
the second highest number of students. There are 1179 students enrolled in Sanskrit for
Ph.D. with 765 males and 414 females. Altogether, at PG level, there are 1.98 lakh
students enrolled out of which 1.16 lakh are females and 82,564 are males. Hindi with
39,737 students has the highest number of students enrolled at PG level. Out of that
43.45% are females and rest are males. Telugu has 22,239 students with 52.25% of
female students. Bengali has 27,830 students enrolled at PG level with 63.19% of
females. Tamil has total number of 25,540 students with 74.65% of females.
Medical Science has total number of 1781 Ph.D. students which is divided into 17 sub‐
streams. The highest number of students is enrolled in Pharmacy with 572 students
having 432 males and 140 females. Ayurveda has total number of 105 students enrolled
at Ph.D. level with 62 males and 43 females. Dentistry has 79 students, General
medicine has 58 students and Nursing has 22 students enrolled at Ph.D. level. The
number of total students at PG level is 54,335 with 57.31% of male students. Pharmacy
has the highest number of students which is 14,867 with 61.9% of male students. All
other sub‐streams in Medical Science have less than 5000 students enrolled at PG level.
Nursing has 5185 students, Dentistry has 4903 students and General Medicine has 4097
students at PG level.
Science stream has 22,7176 students enrolled for Ph.D. which is divided into 17 sub‐
streams such as Mathematics, Chemistry, Physics, and Zoology etc. Chemistry has the
highest number of Ph.D. students which is 5249 with 3308 males and 1941 females.
Physics has total number of 3007 students with 2118 males and 889 females. There is
total number of 2356 students enrolled in Mathematics for Ph.D. out of which 1441 are
males. Botany has 1516 students, Zoology has 1200 students, and Bio‐technology has
1083 students enrolled for Ph.D. At PG level there are 3.03 lakh students enrolled in
Science courses which are divided into 17 sub‐streams. There are 67,317 students
enrolled in Mathematics which is the highest among all the science streams. Out of the
total, 51.72% are female students. Chemistry has enrolment of 60,342 students at PG
level with 55.7% of male students. Physics has 28,848 students; Zoology has 19,767
students enrolled at PG level with 53.54% and 42.67% of males respectively. Zoology
has higher number of female students.
Social Science stream has total number of 15,277 students enrolled for Ph.D. which is
divided into 10 sub‐streams. Out of this, Economics has the highest number of students
enrolled in Ph.D. which is 2062 with 1128 males and 934 female students. History has
total number of 1709 students with 1056 male students and 653 female students.
Political Science has total number of 1179 students enrolled in Ph.D. with 765 males and
ASIHE 20
414 fem
studen
Philoso
There a
numbe
studen
studen
psycho
studen
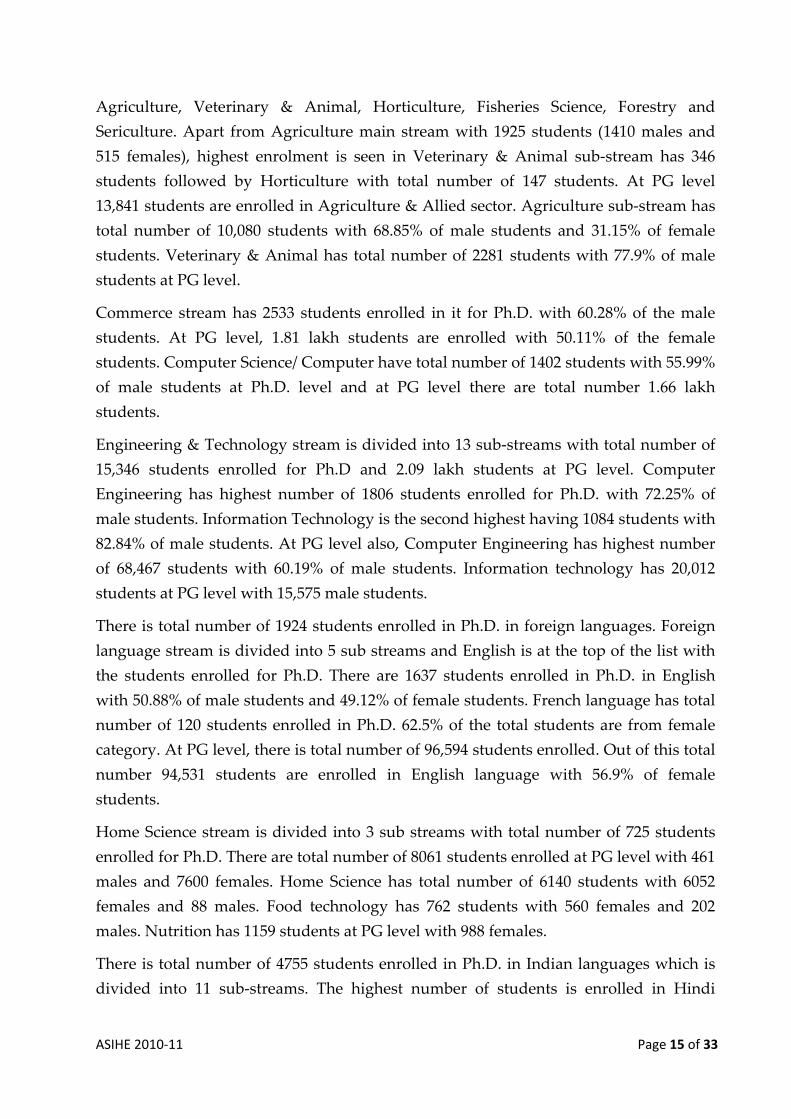
2.2.4
Taking
males
unequa
enrolm
studen
This m
seen ac
Figure
Andhr
numbe
(7196)
(4723),
States
enrolm
the tota
0
25
50
75
100
010‐11
males. Ap
nts, Public
ophy has
are 6.17 la
er of stude
nts. Politica
nts respect
ology repr
nts.
Gender D
g a look at
than fema
al distribu
ment projec
nts.
majority tren
cross the le
9 in term
a Pradesh
er of Institu
at top fol
Tamil Na
with high
ment in Ind
al student
0%
5%
0%
5%
0%
Figure 8: Gender
part from
c Adminis
640 studen
kh studen
ents is enr
al Science,
ively. The
resenting
Distribution
the Male‐
ales in alm
ution with
cts the mos
nd of high
evels in th
ms of highe
h, Tamil N
utions the
llowed by
adu (3504)
hest stude
dian States.
enrolment
r Distribution at
Female
these Soc
stration ha
nts and A
nts enrolled
rolled in H
, Economic
e ratio of
total num
n
Female rat
most every
h around
st lopsided
her male en
he state‐wis
est total stu
Nadu, Karn
ranking of
y Andhra
and Rajas
ent enrolm
. Rest of th
t. So inevit
Different Levels
Male
ciology ha
as 176 stu
Anthropolo
d in Social
History w
cs and Soc
male stud
mber of 13
tio at each
level, exce
5
C
is
en
b
le
5
h
m
a
62% male
d picture w
nrolment th
se distribu
udent enro
nataka, and
f these Stat
Pradesh (5
sthan (303
ment const
he 28 States
tably, the m
as 1191 s
udents, Ps
gy has 22
Science st
which is 92
ciology ha
dents is hi
3104 stud
h level in F
ept M.Phil
0% males
Certificate c
s slightly
nrolment o
both Under
evels has
5% males
has an unb
males and
nd Integr
es and 38
with 71% m
han female
ution. The t
olment are
d Rajastha
tes is slight
5425), Kar
30). It is in
titute near
s (includin
male stude
tudents, G
sychology
8 students
tream at PG
2,335 with
ave 61,285,
igh in all
dents with
Figure 8, th
l., which i
and fem
courses, th
higher at
of 46.6%. S
r Graduate
a similar
and 45% fe
alanced di
35% fema
rated leve
% females
male stude
e enrolmen
top 6 State
e Uttar Pra
an. Howev
tly differen
rnataka (5
nteresting
rly 58% o
ng UTs) fall
ents in the
P
Geography
has 712
s enrolled
G level. Th
h 52.5% of
, 57,953, a
the cours
h 63.65%
he trend is
s almost e
ales each;
he female e
53.4% ve
Student enr
e and Post
trend wit
emales. PG
istribution
ales. Simila
els, both
s. Diplom
ents and 29
nt of stude
es are high
adesh, Ma
ver in term
nt with Ma
063), Utta
to note th
of the tota
l within on
ese 6 States
Page 17 of 33
y has 941
students,
for Ph.D.
he highest
the male
and 52,167
ses except
of female
s of higher
equal with
while in
enrolment
rsus male
rolment at
Graduate
th around
G Diploma
with 65%
arly, Ph.D.
have an
ma student
9% female
ents is also
hlighted in
aharashtra,
ms of total
aharashtra
r Pradesh
hat these 6
al student
nly 42% of
s is almost
3
t
7
t
r
h
n
t
t
n
t
n
h
t
f
t
ASIHE 20
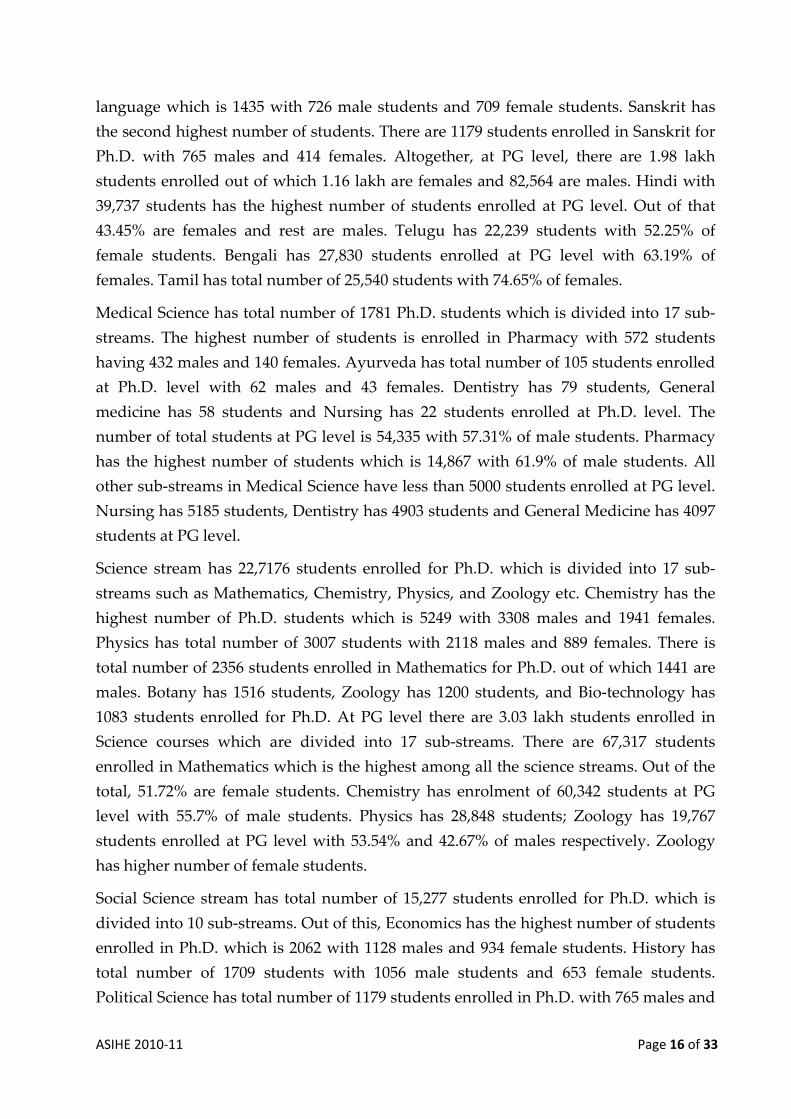
58% of
contrib
Uttar P
enrolm
ratio o
Punjab
enrolm
female
Prades
studen
Karnat
just abo
Kerala
studen
enrolle
Nicoba
are aro
percen
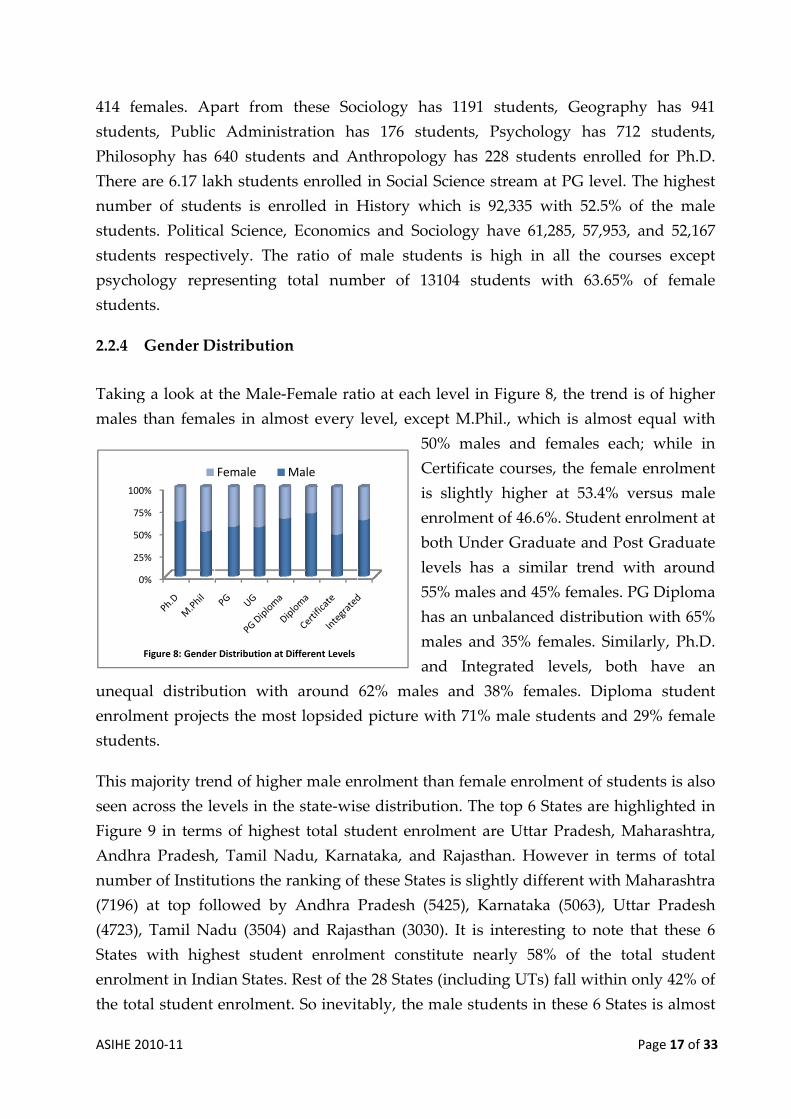
2.2.5
The tot
studen
studen
Catego
given i
is 11.1%
ratio is
the oth
ST cate
total st
studen
belong
studen
1 Two Tecand also
010‐11
f the total
butes to be
Pradesh1, w
ment in Ind
f 50% mal
b has the
ment – 6
s. In M
sh and T
nt enrolme
taka has m
ove 50%. A
though
nts and
ed. Megha
ar Islands
ound 46% i
ntage of ma
Social Cat
tal Estimat
nts and r
nts enroll
ory‐wise e
in Table 14
% of the to
s similar to
her hand,
egory cons
tudent enr
nts. 27.6%
g to OBC
nts.
chnical Univereflecting in g
l students
nearly 59%
with its hig
dia, has an
le and fem
highest m
65% male
Maharasht
Tamil Nad
ent is just
male stude
Another tre
with 5
43% ma
alaya and
also have
in both the
ale and fem
tegory ‐wi
ted Studen
rest 44%
led. Stat
estimated
4. SC stude
tal and the
o the All C
students
stitute only
rolment w
of the to
C with 55
rsities of UP dgender distrib
s enrolled
% of the to
ghest stud
almost eq
male studen
male stud
es and 3
tra, And
du the m
t below 60
ent enrolm
end is seen
57% fem
ale stude
Andaman
more fem
e States. U
male studen
se Distribu
nt enrolmen
are fem
te‐wise a
enrolment
ent enrolm
e male‐fem
Category.
belonging
y 4.4% of
ith 57% m
otal stude
5% of m
did not responbution
and fema
tal female
dent
qual
nts.
dent
35%
hra
male
0%.
ment
n in
male
ents
n &
male studen
Uttarakhand
nts.
ution
nt is 2,74,9
male
and
t is
ment
male
On
g to
the
male
ents
male
nd and therefo
0
10
20
30
40
50
60
70
80
90
100
ale studen
students a
nts i.e. nea
d and Pud
99,749, out
ore enrolmen
0%
0%
0%
0%
0%
0%
0%
0%
0%
0%
0%
Figure 9: Top 6
0%
10%
20%
30%
40%
50%
60%
70%
80%
90%
100%
SC
Figure 10: Socia
nts enrolle
across Indi
arly 54%, w
ducherry h
of which n
t in technical
States as per Enrof Males: Fe
Male
ST
al Categories andStudent Enro
Male
P
d in these
a.
while male
have an alm
nearly 56%
education is o
rolment & Repreemales
Female
OBC All C
d Gender Distribulment
Female
Page 18 of 33
e 6 States
e students
most equal
% are male
on lower side
esentation
Category
ution in
3
ASIHE 2010‐11 Page 19 of 33
2.2.6 Representation of Minority Students
Among Minority category, data on Muslims have been collected separately. According
to the response received during the survey, 3.8% students belong to Muslim Minority
and 1.8% from other Minority Community. Muslim Minority has more male students
than females whereas other Minority has more females than males. Based on actual
response, State‐wise number of students from Minority and PWD category is shown in
Table 15.
2.2.7 Representation of PWD students
As per the response received during the survey 53975 PWD students are enrolled in
higher education. Out of which,
26507 are Male and 27468 are
Female students, thus having
more female students.
Category‐wise distribution of
PWD student is shown in
adjacent table which indicate
that as compared to all SC, ST
and OBC students, share of
PWD students of these
categories is very low
particularly in ST category.
Female participation among PWD students in all categories is high except for ST
category. It is highest in SC category with 159 females per 100 males followed by OBC
(127). State‐wise number of PWD students is given in Table 15.
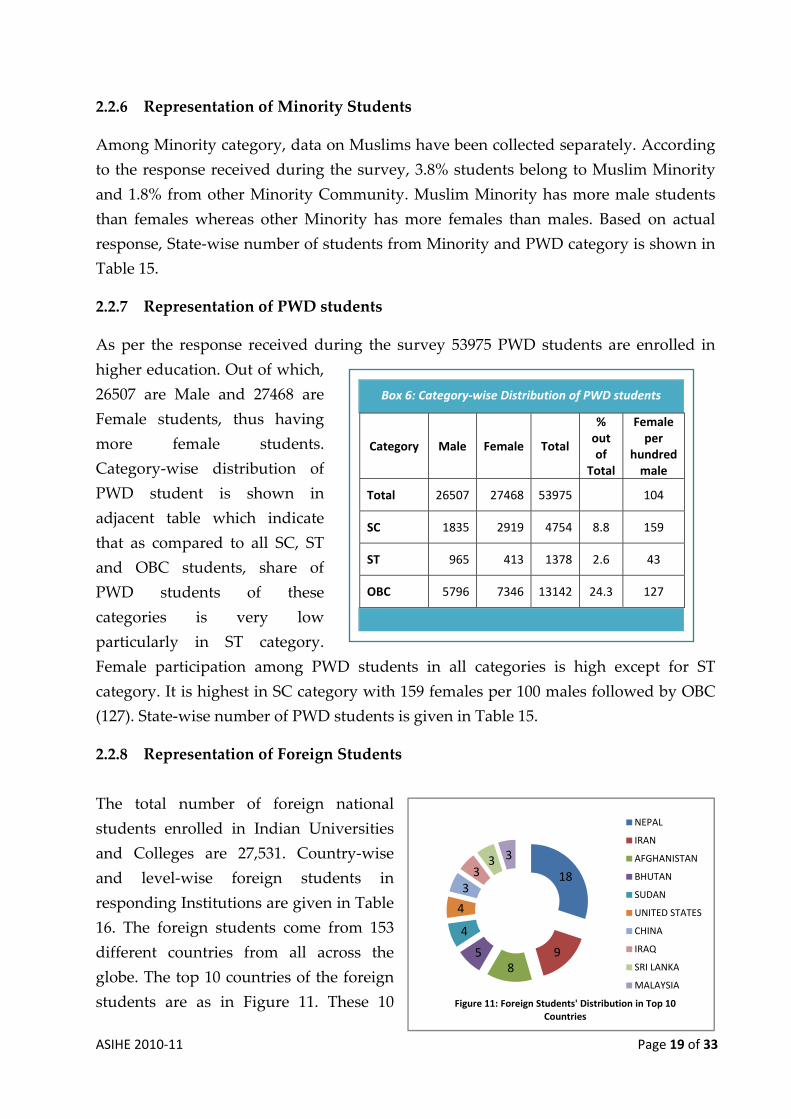
2.2.8 Representation of Foreign Students
The total number of foreign national
students enrolled in Indian Universities
and Colleges are 27,531. Country‐wise
and level‐wise foreign students in
responding Institutions are given in Table
16. The foreign students come from 153
different countries from all across the
globe. The top 10 countries of the foreign
students are as in Figure 11. These 10
Box 6: Category‐wise Distribution of PWD students
Category Male Female Total
% out of
Total
Female per
hundred male
Total 26507 27468 53975
104
SC 1835 2919 4754 8.8 159
ST 965 413 1378 2.6 43
OBC 5796 7346 13142 24.3 127
18
98
5
4
4
33
3 3
Figure 11: Foreign Students' Distribution in Top 10 Countries
NEPAL
IRAN
AFGHANISTAN
BHUTAN
SUDAN
UNITED STATES
CHINA
IRAQ
SRI LANKA
MALAYSIA
ASIHE 20
countri
comes
neighb
Afghan
China,
countri
male. N
studen
conside
of fore
Iran.
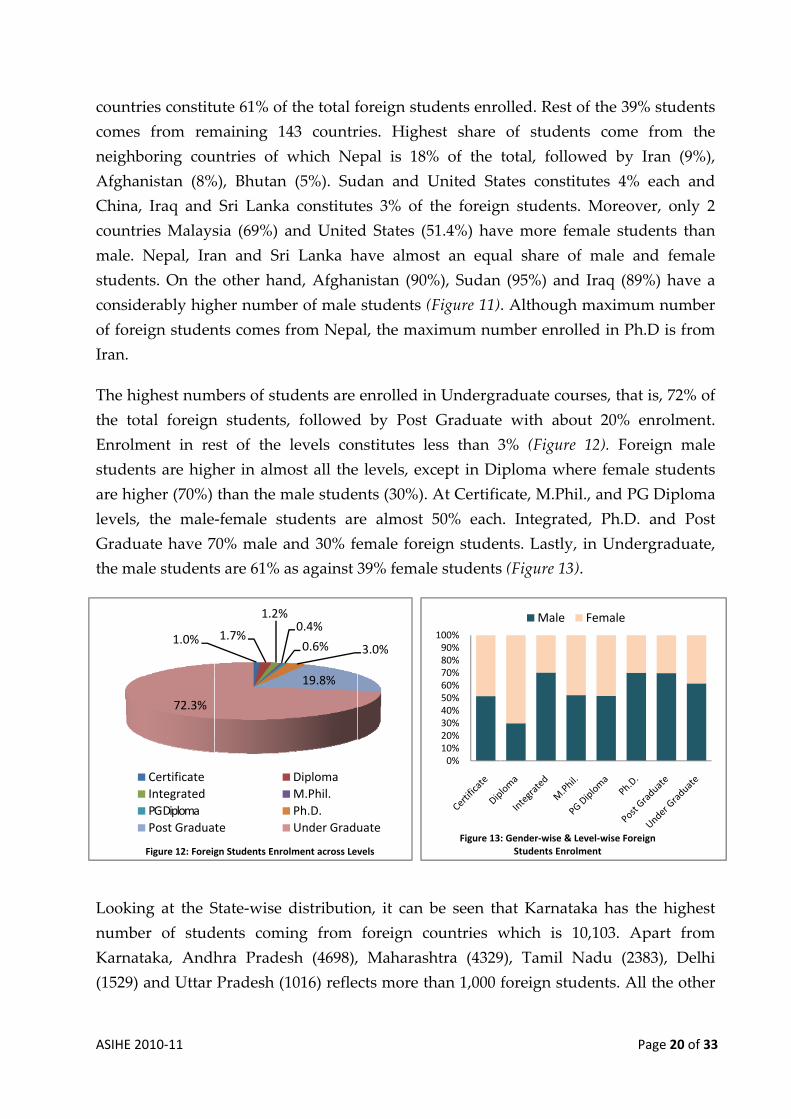
The hig
the tot
Enrolm
studen
are hig
levels,
Gradua
the ma
Lookin
numbe
Karnat
(1529)
010‐11
ies constitu
from rem
boring cou
nistan (8%
Iraq and
ies Malays
Nepal, Ira
nts. On the
erably high
ign studen
ghest num
tal foreign
ment in re
nts are high
gher (70%)
the male
ate have 7
ale students
ng at the S
er of stud
taka, Andh
and Uttar
1.0%
72.3%
Figure 12: Foreig
Certificate
Integrated
PG Diploma
Post Gradua
ute 61% of
maining 1
untries of
%), Bhutan
Sri Lanka
sia (69%) a
an and Sri
e other han
her numbe
nts comes f
mbers of stu
n students
est of the
her in alm
than the m
‐female st
70% male a
s are 61% a
State‐wise
dents comi
hra Prade
Pradesh (1
1.7%
1.2%
gn Students Enro
te
f the total f
43 countr
which Ne
n (5%). Su
a constitut
and Unite
i Lanka h
nd, Afghan
er of male
from Nepa
udents are
, followed
levels con
most all the
male stude
tudents ar
and 30% fe
as against
distributio
ing from
esh (4698),
1016) refle
%0.4%
0.6%
19.8%
olment across Lev
Diploma
M.Phil.
Ph.D.
Under Gradu
foreign stu
ries. Highe
epal is 18%
dan and U
tes 3% of
d States (5
have almos
nistan (90%
students (
al, the max
enrolled in
d by Post
nstitutes le
e levels, ex
ents (30%).
re almost
emale fore
39% femal
on, it can
foreign c
, Maharash
cts more th
3.0%
vels
uate
udents enro
est share
% of the
United Sta
the foreign
51.4%) hav
st an equ
%), Sudan
(Figure 11)
ximum num
n Undergr
Graduate
ess than 3
xcept in Di
At Certific
50% each
eign studen
le students
be seen th
ountries w
htra (4329
han 1,000
0%10%20%30%40%50%60%70%80%90%
100%
Figure 13
olled. Rest
of studen
total, follo
ates consti
n students
ve more fe
al share o
n (95%) and
. Although
mber enro
raduate cou
e with abo
3% (Figure
iploma wh
cate, M.Ph
h. Integrate
nts. Lastly
s (Figure 13
hat Karnat
which is
9), Tamil
foreign stu
: Gender‐wise & Students Enro
Male
P
of the 39%
nts come
owed by I
itutes 4%
s. Moreov
emale stud
of male an
d Iraq (89%
h maximum
olled in Ph
urses, that
out 20% e
e 12). Fore
here female
hil., and PG
ed, Ph.D.
y, in Under
3).
taka has th
10,103. Ap
Nadu (238
udents. All
Level‐wise Foreiolment
Female
Page 20 of 33
% students
from the
Iran (9%),
each and
er, only 2
dents than
nd female
%) have a
m number
.D is from
is, 72% of
enrolment.
eign male
e students
G Diploma
and Post
rgraduate,
he highest
part from
83), Delhi
l the other
ign
3
n
f
a
t
t
r
ASIHE 2010‐11 Page 21 of 33
States have less than 600 foreign students. State‐wise and level‐wise foreign students in
responding Institutions are given in Table 17.
2.2.8 a Programme-wise Foreign Students
There are 14 programmes which are observing the highest enrolment of foreign
students in India. Programme‐wise number of foreign students in responding
Institutions is given in Table 18. On the top we have B.A. with 2,458 students with 62%
of male students. B.Com. is on 2nd top of the list with 2,359 students. The ratio of male‐
female student is 71:29. BCA has total number of 2334 students with 89.37% of male
students. There are 1830 foreign students enrolled in B.Sc. out of which 64.2% are male
students. BBA has total number of 856 students out of which 70% are from male
category. There is total number of 190 students enrolled in LLB with 56.31% male
students. At the Post Graduation level, 1510 students are enrolled at M.A. level with
63.7% male students. M.Sc. has reported enrolment of 1205 students with 72.6% of male
students. There are 1143 students enrolled in B.E. out of which 81.8% are male students.
MBBS has total number of 1140 students with the higher percentage of female students.
The female percentage in MBBS is 54.56%. B. Tech. has total number of 1090 students
with 923 male students. MBA has reported the enrolment of 920 foreign students
with 66.73% of male students. MCA has total number of 109 students with 99 male
students. At Ph.D. level, there are 850 students with male and female ratio of 69:31.
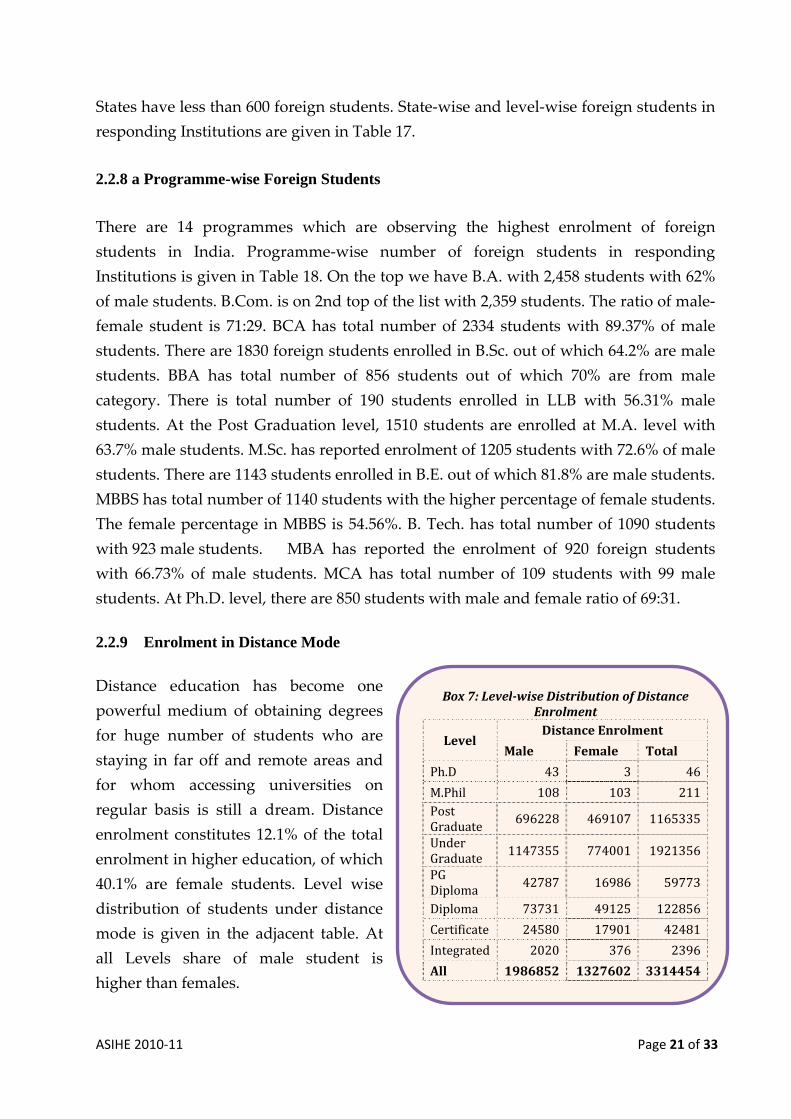
2.2.9 Enrolment in Distance Mode
Distance education has become one
powerful medium of obtaining degrees
for huge number of students who are
staying in far off and remote areas and
for whom accessing universities on
regular basis is still a dream. Distance
enrolment constitutes 12.1% of the total
enrolment in higher education, of which
40.1% are female students. Level wise
distribution of students under distance
mode is given in the adjacent table. At
all Levels share of male student is
higher than females.
Box 7: Levelwise Distribution of Distance Enrolment
Level Distance Enrolment
Male Female Total
Ph.D 43 3 46
M.Phil 108 103 211Post Graduate
696228 469107 1165335
Under Graduate 1147355 774001 1921356
PG Diploma 42787 16986 59773
Diploma 73731 49125 122856
Certificate 24580 17901 42481
Integrated 2020 376 2396
All 1986852 1327602 3314454
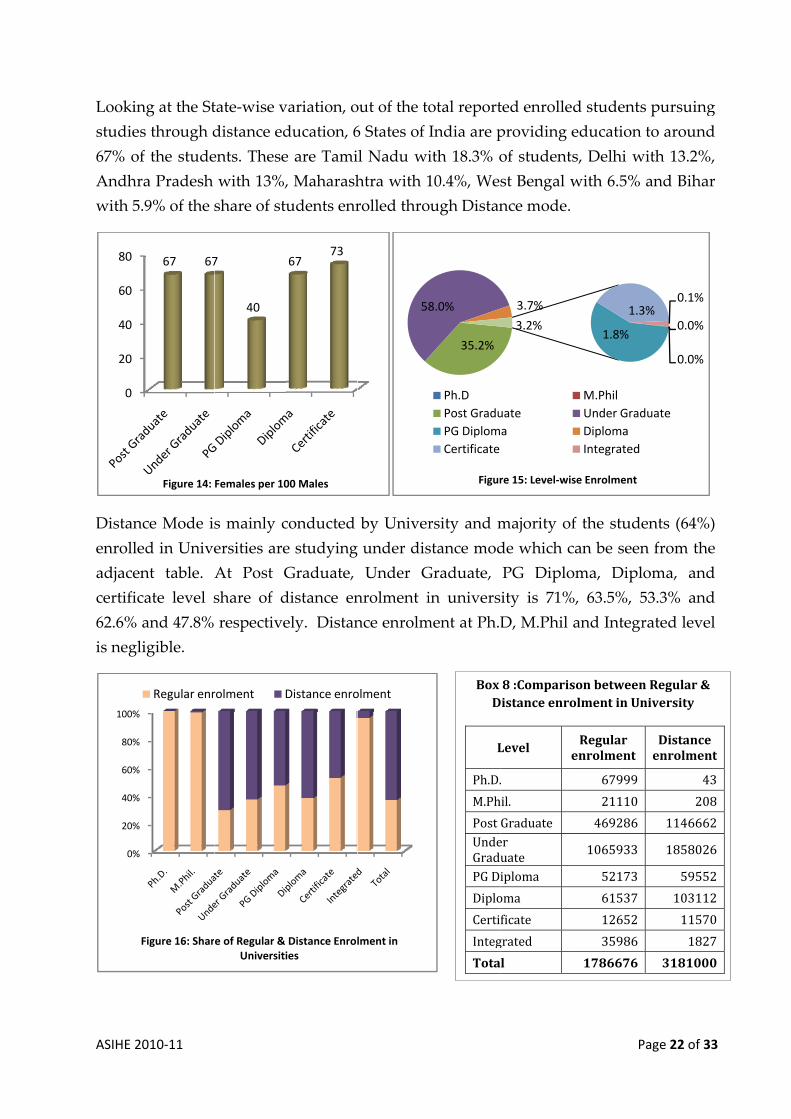
ASIHE 20
Lookin
studies
67% of
Andhr
with 5.
Distanc
enrolle
adjacen
certific
62.6% a
is negli
0
20
40
60
80
0%
20%
40%
60%
80%
100%
F
010‐11
ng at the St
s through d
f the stude
a Pradesh
.9% of the s
ce Mode is
ed in Unive
nt table.
cate level s
and 47.8%
igible.
67 67
Figure 14:
Figure 16: Shar
Regular enr
tate‐wise v
distance ed
ents. These
with 13%,
share of stu
s mainly c
ersities are
At Post G
share of d
respective
7
40
Females per 10
e of Regular & Universiti
rolment D
variation, o
ducation, 6
e are Tami
, Maharash
udents enr
conducted
e studying
Graduate,
distance en
ely. Distan
6773
00 Males
Distance Enrolies
Distance enro
out of the to
6 States of
il Nadu wi
htra with 1
rolled thro
by Univer
g under dis
Under G
nrolment i
nce enrolm
58
lment in
olment
otal report
India are p
ith 18.3% o
10.4%, Wes
ough Distan
rsity and m
stance mod
Graduate,
in univers
ment at Ph.D
35.2%
8.0%
Figur
Ph.D
Post Gradu
PG Diplom
Certificate
Box D
L
Ph.D.
M.Ph
Post UndeGradPG Di
Diplo
Certi
Integ
Tota
ted enrolle
providing e
of student
st Bengal w
nce mode.
majority of
de which c
PG Diplo
ity is 71%
D, M.Phil
3.7%
3.2%
re 15: Level‐wis
uate
a
8 :ComparisDistance enro
Level e
.
hil.
Graduate er uate iploma
oma
ficate
grated
l
P
d students
education
s, Delhi w
with 6.5%
f the stude
can be seen
oma, Diplo
%, 63.5%, 5
and Integr
1.8%
1.3
se Enrolment
M.Phil
Under Grad
Diploma
Integrated
son betweenolment in Un
Regular enrolment
67999
21110
469286
1065933
52173
61537
12652
35986
1786676
Page 22 of 33
s pursuing
to around
with 13.2%,
and Bihar
ents (64%)
n from the
oma, and
53.3% and
rated level
0.0%
0.0%
3%0.1%
duate
n Regular & niversity
Distance enrolment
43
208
1146662
1858026
59552
103112
11570
1827
3181000
3
g
r
t
3
8
2
6
2
2
0
7
0
ASIHE 20
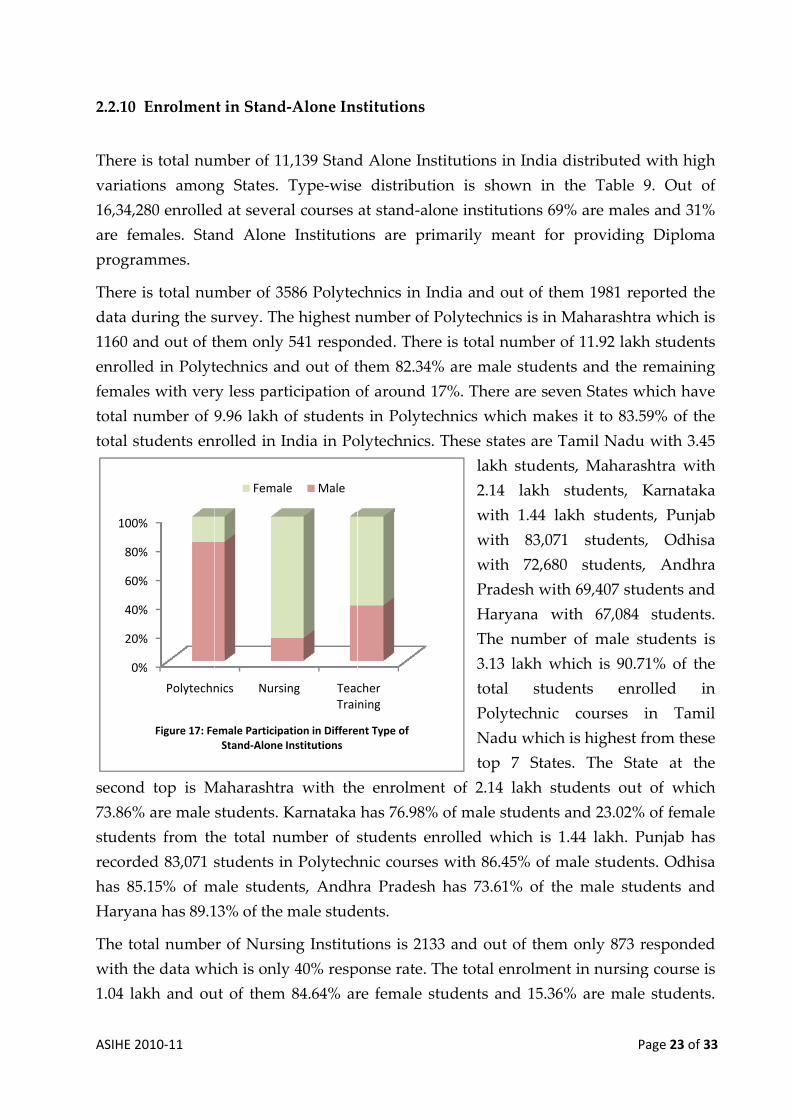
2.2.10
There i
variatio
16,34,2
are fem
progra
There i
data du
1160 an
enrolle
female
total nu
total st
second
73.86%
studen
recorde
has 85
Haryan
The tot
with th
1.04 lak
0%
20%
40%
60%
80%
100%
010‐11
Enrolmen
is total num
ons amon
280 enrolled
males. Sta
ammes.
is total num
uring the s
nd out of t
ed in Polyt
s with ver
umber of
tudents en
d top is M
% are male
nts from th
ed 83,071 s
.15% of m
na has 89.1
tal numbe
he data wh
kh and ou
%
%
%
%
%
%
Polytechn
Figure 17: Fe
nt in Stand
mber of 11
ng States.
d at severa
and Alone
mber of 35
survey. Th
them only
technics an
ry less part
9.96 lakh o
nrolled in I
Maharashtr
students. K
he total nu
students in
male studen
13% of the
r of Nursi
hich is only
ut of them
nics Nursi
emale ParticipaStand‐Alone
Femal
d‐Alone Ins
1,139 Stand
Type‐wise
al courses
Institutio
586 Polyte
he highest n
541 respon
nd out of t
ticipation o
of student
ndia in Po
a with the
Karnataka
umber of s
n Polytech
nts, Andh
male stude
ing Institut
y 40% resp
84.64% ar
ng TeacTrai
ation in DiffereInstitutions
e Male
stitutions
d Alone In
e distribut
at stand‐al
ons are pr
chnics in I
number of
nded. Ther
them 82.34
of around
s in Polyte
olytechnics
e enrolme
has 76.98%
students e
hnic course
ra Pradesh
ents.
tions is 21
ponse rate.
re female s
cher ning
ent Type of
nstitutions
tion is sh
lone institu
rimarily m
India and
f Polytechn
re is total n
4% are mal
17%. Ther
echnics wh
s. These sta
lakh
2.14
with
with
with
Pra
Har
The
3.13
tota
Poly
Nad
top
ent of 2.14
% of male s
enrolled w
es with 86.
h has 73.6
33 and ou
The total e
students a
in India d
own in th
utions 69%
meant for
out of them
nics is in M
number of
le students
re are seve
hich makes
ates are Ta
h students
4 lakh st
h 1.44 lak
h 83,071
h 72,680
desh with
ryana wit
e number
3 lakh whi
al stude
ytechnic
du which i
7 States
4 lakh stu
students a
which is 1.4
45% of ma
61% of the
ut of them
enrolment
and 15.36%
P
istributed
he Table
% are males
providing
m 1981 rep
Maharashtr
f 11.92 lakh
s and the r
en States w
s it to 83.5
amil Nadu
s, Maharas
tudents, K
kh student
students
students,
69,407 stu
th 67,084
of male s
ich is 90.7
nts enro
courses
is highest f
. The Sta
dents out
and 23.02%
44 lakh. P
ale studen
e male stu
only 873 r
in nursing
% are male
Page 23 of 33
with high
9. Out of
s and 31%
g Diploma
ported the
a which is
h students
remaining
which have
59% of the
u with 3.45
shtra with
Karnataka
ts, Punjab
s, Odhisa
, Andhra
udents and
students.
tudents is
71% of the
olled in
in Tamil
from these
ate at the
of which
% of female
Punjab has
ts. Odhisa
dents and
responded
g course is
e students.
3
h
f
g
h
n
h
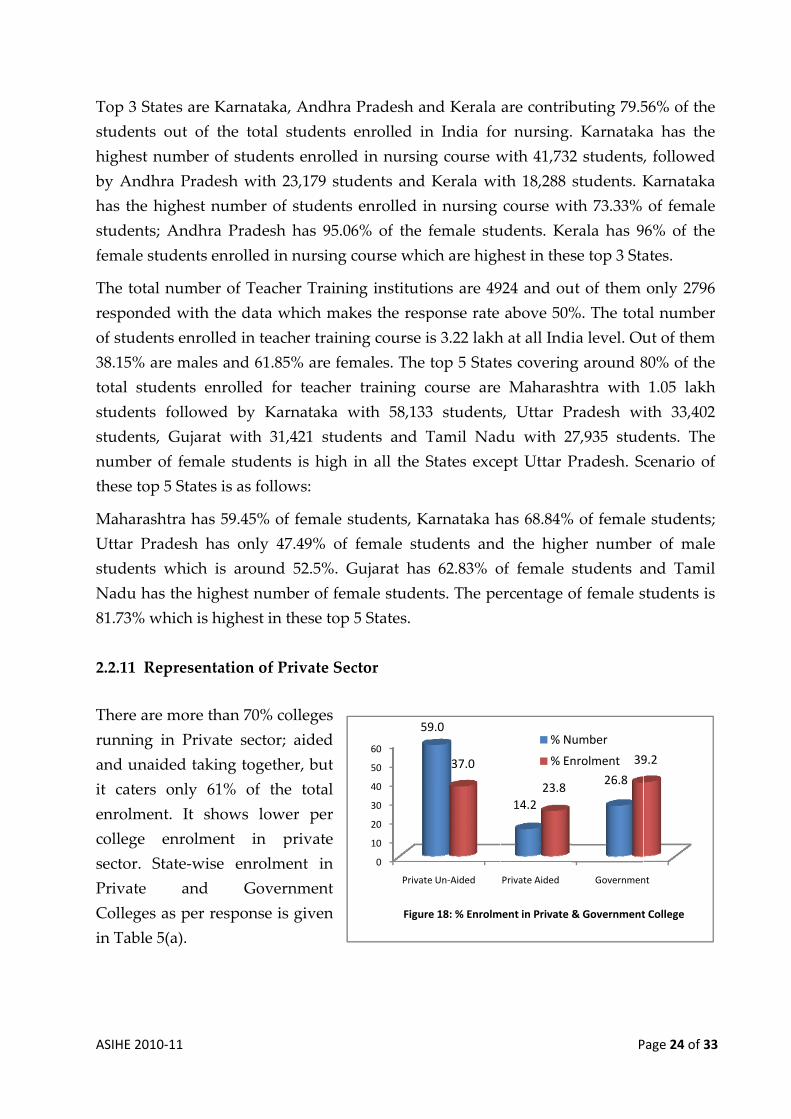
ASIHE 20
Top 3 S
studen
highest
by And
has the
studen
female
The tot
respon
of stud
38.15%
total s
studen
studen
numbe
these to
Mahar
Uttar P
studen
Nadu h
81.73%
2.2.11
There a
runnin
and un
it cate
enrolm
college
sector.
Private
College
in Tabl
010‐11
States are
nts out of
t number
dhra Prad
e highest n
nts; Andhra
students e
tal numbe
nded with t
dents enrol
% are males
tudents en
nts followe
nts, Gujara
er of femal
op 5 States
ashtra has
Pradesh h
nts which
has the hig
% which is h
Represent
are more th
ng in Priva
naided taki
rs only 6
ment. It sh
e enrolme
State‐wis
e and
es as per r
le 5(a).
Karnataka
the total
of student
esh with 2
number of
a Pradesh
enrolled in
r of Teach
the data w
lled in teac
s and 61.85
nrolled fo
ed by Kar
at with 31,
le students
s is as follo
s 59.45% of
has only 47
is around
ghest num
highest in
tation of P
han 70% co
ate sector;
ing togeth
1% of the
hows lowe
ent in p
se enrolm
Gover
response is
a, Andhra P
students e
ts enrolled
23,179 stud
f students
has 95.06
n nursing c
her Trainin
which mak
cher trainin
5% are fem
r teacher
rnataka w
,421 stude
s is high i
ows:
f female st
7.49% of f
52.5%. G
mber of fem
these top 5
Private Sec
olleges
aided
her, but
e total
er per
private
ent in
rnment
s given
Pradesh an
enrolled in
d in nursin
dents and
enrolled in
6% of the f
ourse whic
ng instituti
es the resp
ng course i
males. The
training c
with 58,133
ents and T
in all the S
tudents, Ka
female stu
Gujarat has
male studen
5 States.
tor
0
10
20
30
40
50
60
Private
59
Figure
nd Kerala
n India fo
ng course w
Kerala wi
n nursing
female stu
ch are high
ons are 49
ponse rate
is 3.22 lakh
top 5 State
course are
3 students
Tamil Nad
States exce
arnataka h
udents and
s 62.83% o
nts. The pe
e Un‐Aided
9.0
37.0
e 18: % Enrolm
are contrib
r nursing.
with 41,732
ith 18,288
course wi
udents. Ke
hest in thes
924 and ou
above 50%
h at all Indi
es covering
Maharash
s, Uttar P
du with 2
ept Uttar P
has 68.84%
d the high
of female
ercentage o
Private Aided
14.2
23.8
ment in Private &
% N
% En
P
buting 79.5
Karnatak
2 students,
students. K
ith 73.33%
rala has 9
se top 3 Sta
ut of them
%. The tota
ia level. Ou
g around 8
htra with
radesh wi
7,935 stud
Pradesh. S
% of female
her numbe
students a
of female s
Governmen
26.8
39
& Government
umber
nrolment
Page 24 of 33
56% of the
ka has the
, followed
Karnataka
of female
96% of the
ates.
only 2796
al number
ut of them
80% of the
1.05 lakh
ith 33,402
dents. The
cenario of
e students;
er of male
and Tamil
students is
nt
9.2
t College
3
r
h
f
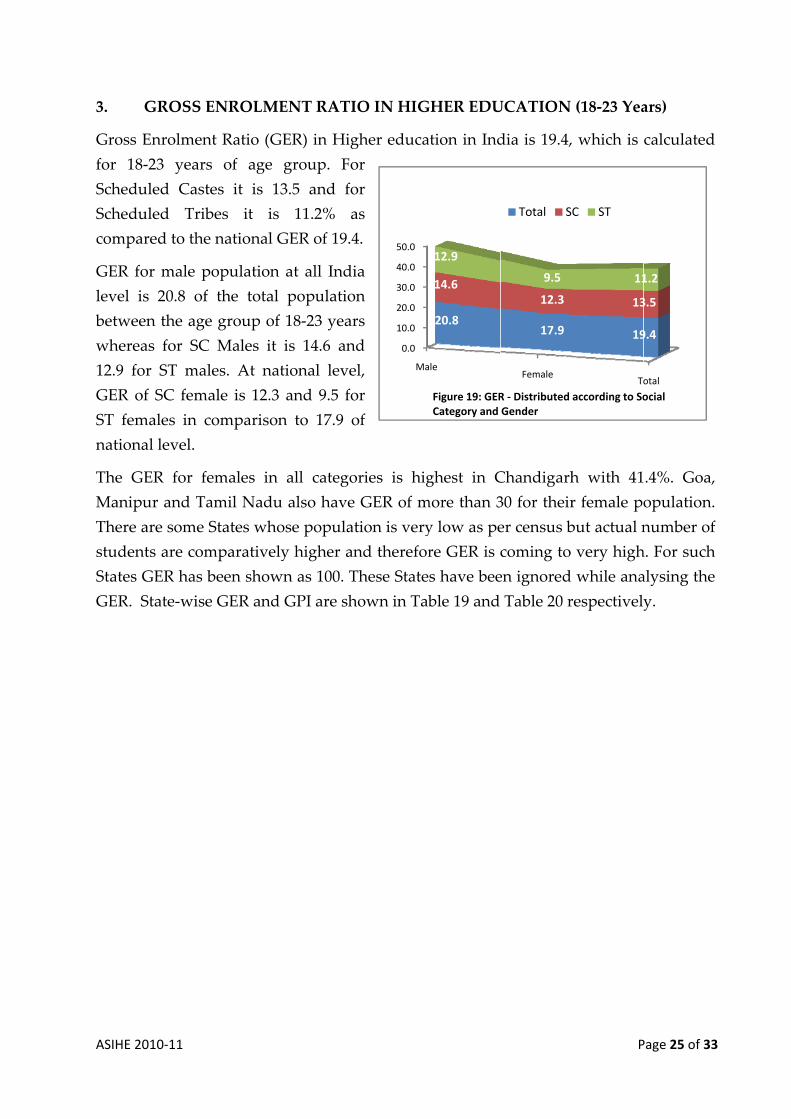
ASIHE 20
3.
Gross E
for 18
Schedu
Schedu
compa
GER fo
level i
betwee
wherea
12.9 fo
GER o
ST fem
nationa
The G
Manipu
There a
studen
States G
GER. S
010‐11
GROSS E
Enrolment
‐23 years
uled Caste
uled Tribe
red to the
or male po
s 20.8 of
en the age
as for SC
or ST male
f SC fema
males in co
al level.
ER for fem
ur and Tam
are some S
nts are com
GER has b
State‐wise
NROLME
t Ratio (GE
of age g
es it is 13
es it is
national G
opulation
the total
group of
Males it i
es. At nati
ale is 12.3
omparison
males in
mil Nadu
States whos
mparatively
been shown
GER and G
ENT RATIO
ER) in Hig
group. Fo
3.5 and fo
11.2% a
GER of 19.4
at all Indi
population
18‐23 year
is 14.6 and
ional level
and 9.5 fo
n to 17.9 o
all catego
also have
se populat
y higher an
n as 100. T
GPI are sh
O IN HIG
gher educa
or
or
as
4.
a
n
rs
d
l,
or
of
ries is hig
GER of m
tion is very
nd therefor
These State
own in Tab
0.0
10.0
20.0
30.0
40.0
50.0
Ma
GHER EDU
ation in Ind
ghest in C
more than 3
y low as pe
re GER is c
s have bee
ble 19 and
le
20.8
14.6
12.9
Figure 19: GERCategory and
UCATION
dia is 19.4,
Chandigarh
30 for their
er census b
coming to
en ignored
Table 20 r
Female
17.9
12.3
9.5
R ‐ Distributed Gender
Total S
P
(18‐23 Yea
which is
h with 41
r female p
but actual n
very high
while ana
respectively
To
19
13
11
according to So
C ST
Page 25 of 33
ars)
calculated
.4%. Goa,
opulation.
number of
h. For such
alysing the
y.
otal
9.4
3.5
1.2
ocial
3
f
h
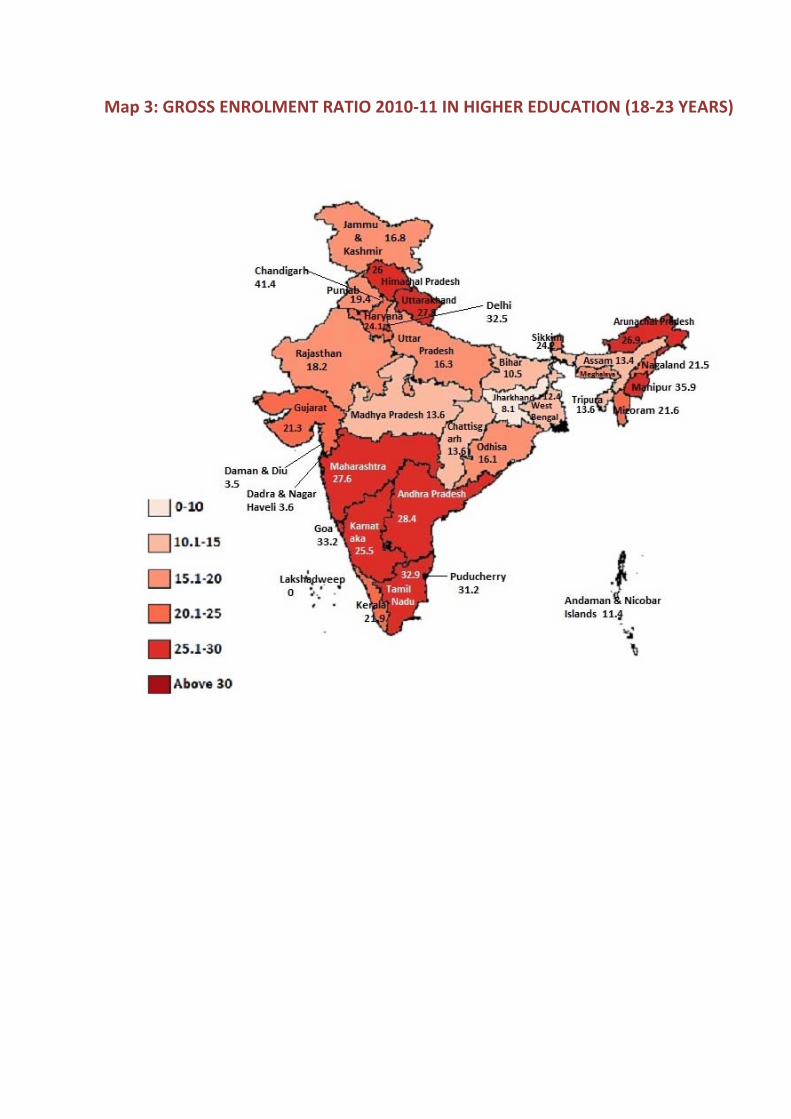
Map 3: GROSS ENROLMENT RATIO 2010‐11 IN HIGHER EDUCATION (18‐23 YEARS)
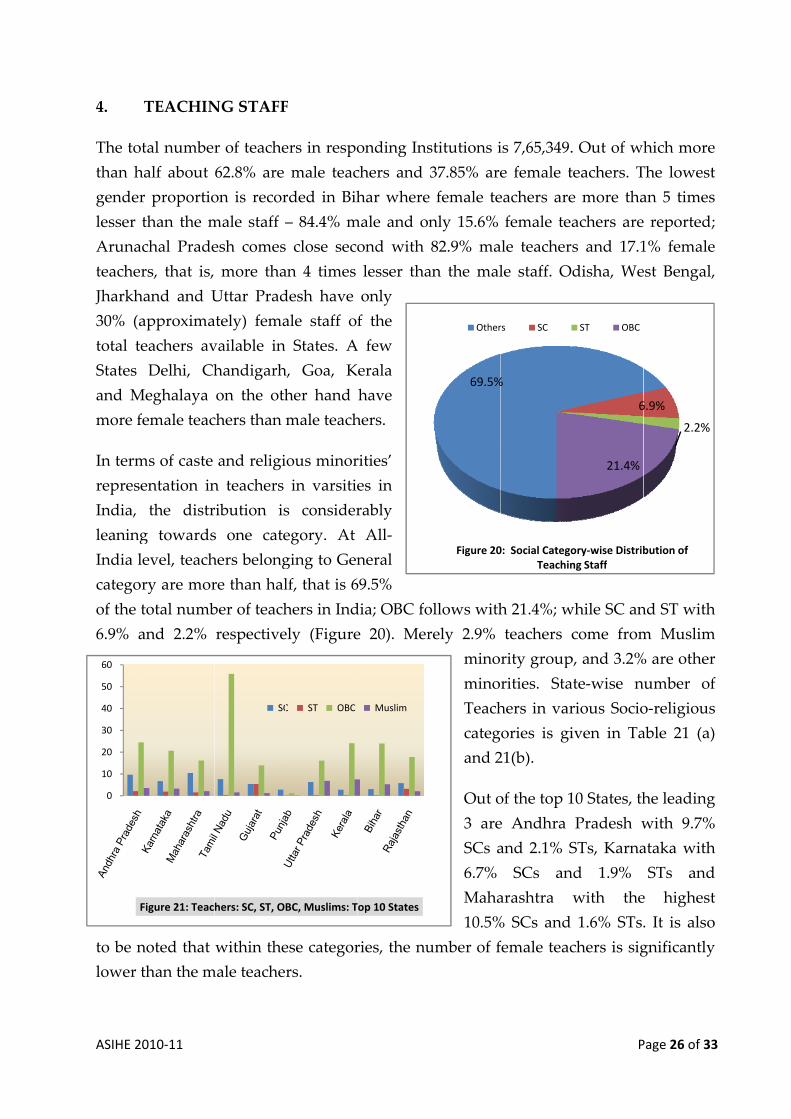
ASIHE 20
4.
The tot
than h
gender
lesser t
Arunac
teacher
Jharkh
30% (a
total te
States
and M
more fe
In term
represe
India,
leaning
India le
categor
of the t
6.9% a
to be n
lower t
0
10
20
30
40
50
60
1F
010‐11
TEACHIN
tal number
half about
r proportio
than the m
chal Prade
rs, that is,
and and U
approxima
eachers av
Delhi, Ch
Meghalaya
emale teac
ms of caste
entation in
the distr
g towards
evel, teach
ry are mor
total numb
and 2.2%
noted that
than the m
2 3Figure 21: Teac
NG STAFF
r of teache
62.8% are
on is recor
male staff –
esh comes
more tha
Uttar Prad
ately) fema
vailable in
handigarh
on the oth
chers than m
and religi
n teachers
ribution is
s one cate
hers belong
re than hal
ber of teach
respective
within the
male teacher
4 5hers: SC, ST, OB
SC
F
ers in respo
male teac
rded in Bih
– 84.4% m
close seco
an 4 times
desh have
ale staff of
States. A
h, Goa, K
her hand
male teach
ous minor
in varsitie
s consider
egory. At
ging to Gen
lf, that is 6
hers in Ind
ely (Figure
ese categor
rs.
6 7 8BC, Muslims: T
C ST OBC
onding Ins
chers and
har where
male and on
ond with
lesser tha
only
f the
A few
Kerala
have
hers.
rities’
es in
rably
All‐
neral
69.5%
dia; OBC fo
e 20). Mer
ries, the nu
9 10Top 10 States
Muslim
stitutions i
37.85% are
e female te
nly 15.6%
82.9% ma
an the mal
ollows with
rely 2.9%
mino
mino
Teach
categ
and 2
Out o
3 are
SCs a
6.7%
Maha
10.5%
umber of f
69.5%
Figure 20
Other
is 7,65,349.
e female t
eachers are
female tea
ale teacher
le staff. O
h 21.4%; w
teachers c
rity group
rities. Sta
hers in var
ories is gi
21(b).
of the top 1
e Andhra
and 2.1% S
SCs an
arashtra
% SCs and
female teac
%
0: Social CategoTeachin
rs SC
P
. Out of wh
teachers. T
e more tha
achers are
s and 17.1
disha, We
while SC an
come from
p, and 3.2%
ate‐wise n
rious Socio
iven in Ta
10 States, th
Pradesh w
STs, Karna
nd 1.9%
with the
1.6% STs.
chers is sig
6
21.4%
ory‐wise Distribng Staff
ST OBC
Page 26 of 33
hich more
The lowest
an 5 times
e reported;
1% female
est Bengal,
nd ST with
m Muslim
% are other
number of
o‐religious
able 21 (a)
he leading
with 9.7%
ataka with
STs and
e highest
. It is also
gnificantly
6.9%
2.2%
bution of
3
t
h
r
f
g
h
t
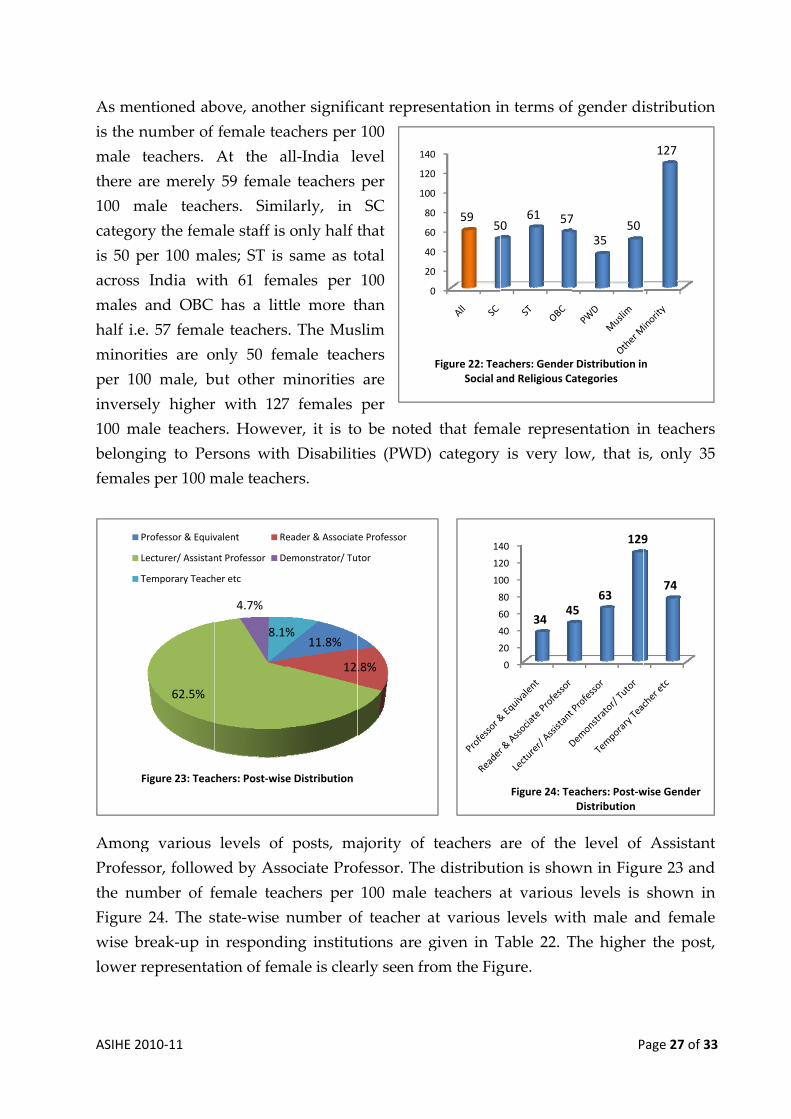
ASIHE 20
As men
is the n
male t
there a
100 m
categor
is 50 p
across
males
half i.e
minori
per 10
inverse
100 ma
belong
female
Among
Profess
the nu
Figure
wise b
lower r
F
P
L
T
010‐11
ntioned ab
number of
teachers.
are merely
male teach
ry the fem
per 100 ma
India wit
and OBC
e. 57 femal
ities are o
0 male, b
ely higher
ale teacher
ging to Per
s per 100 m
g various
sor, follow
umber of f
24. The s
reak‐up in
representa
62.5%
Figure 23: Teac
Professor & Equiv
Lecturer/ Assistan
Temporary Teach
bove, anoth
female tea
At the a
y 59 female
hers. Simi
ale staff is
ales; ST is
th 61 fem
has a litt
le teachers
only 50 fem
ut other m
r with 127
rs. Howev
rsons with
male teache
levels of
wed by Ass
female tea
state‐wise
n respondi
tion of fem
4.7%
8.1%
chers: Post‐wise
valent Re
nt Professor D
her etc
her signific
achers per
all‐India le
e teachers
ilarly, in
only half t
same as t
males per
tle more t
s. The Mus
male teach
minorities
7 females
ver, it is to
h Disabiliti
ers.
posts, ma
sociate Pro
chers per
number o
ing institu
male is clea
11.8%
12
%
e Distribution
eader & Associat
emonstrator/ Tu
cant repres
100
evel
per
SC
that
total
100
than
slim
hers
are
per
o be noted
ies (PWD)
ajority of
ofessor. The
100 male
f teacher a
utions are g
arly seen fr
2
4
6
8
10
12
14
.8%
te Professor
tor
sentation in
d that fem
) category
teachers
e distribut
teachers a
at various
given in T
rom the Fig
0
20
40
60
80
00
20
40
595
Figure 22: TeaSocial a
2
4
6
8
10
12
14
n terms of
ale repres
is very lo
are of the
tion is show
at various
levels wi
Table 22. T
gure.
061 57
achers: Genderand Religious Ca
0
20
40
60
80
00
20
40
344
Figure 24: Te
P
f gender di
entation in
ow, that is
e level of
wn in Figu
s levels is
th male an
The higher
7
3550
r Distribution inategories
4563
129
eachers: Post‐wDistribution
Page 27 of 33
istribution
n teachers
s, only 35
Assistant
ure 23 and
shown in
nd female
r the post,
127
n
9
74
wise Gender
3
n
t
n
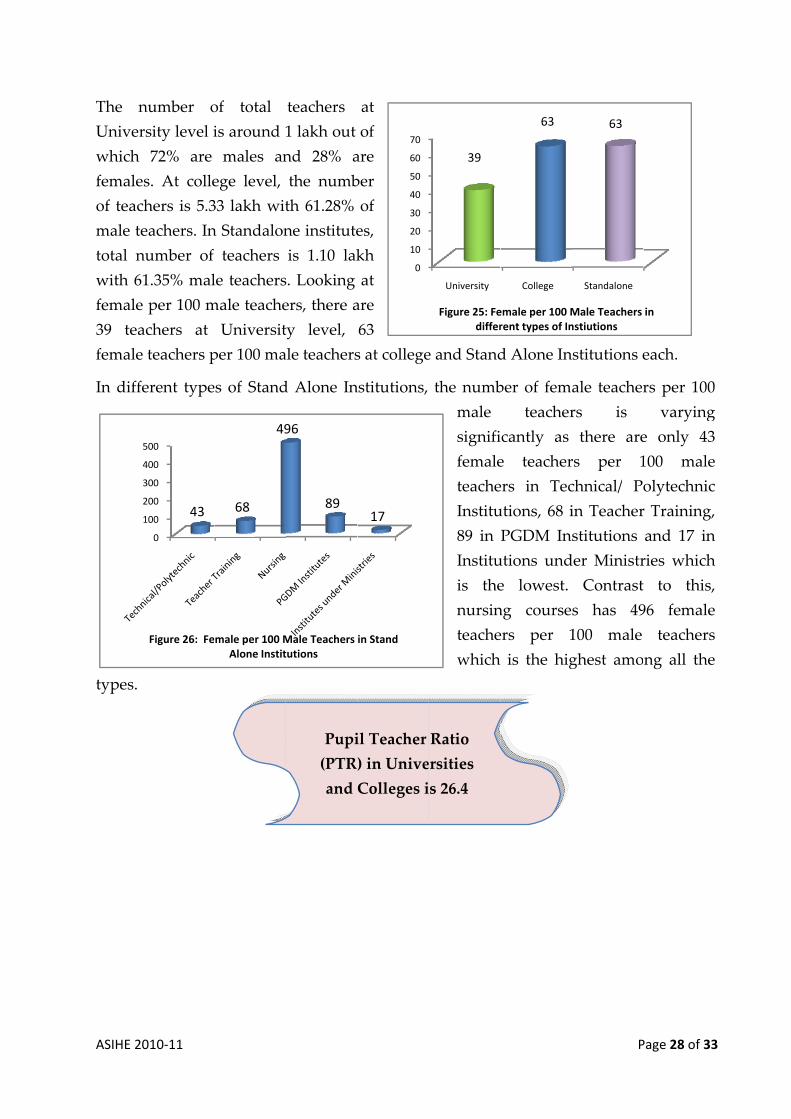
ASIHE 20
The n
Univer
which
female
of teac
male te
total n
with 61
female
39 tea
female
In diffe
types.
4
010‐11
number o
rsity level i
72% are
s. At colle
chers is 5.3
eachers. In
number of
1.35% mal
per 100 m
achers at
teachers p
erent type
0
100
200
300
400
500
43
Figure 26: Fe
of total
is around 1
males an
ege level,
33 lakh wit
n Standalon
teachers
le teachers
male teache
Universit
per 100 ma
s of Stand
68
49
male per 100 MAlone Instit
teachers
1 lakh out
nd 28% a
the numb
th 61.28%
ne institute
is 1.10 lak
s. Looking
ers, there a
ty level,
ale teachers
d Alone In
96
89
Male Teachers tutions
Pupi
(PTR
and
at
of
are
ber
of
es,
kh
at
are
63
s at college
nstitutions,
0
10
20
30
40
50
60
70
17
in Stand
il Teacher
) in Unive
Colleges i
e and Stand
the numb
male
signifi
female
teache
Institu
89 in
Institu
is the
nursin
teache
which
University
39
Figure 25: Fediffer
Ratio
ersities
s 26.4
d Alone In
ber of fem
teacher
icantly as
e teacher
ers in Tec
utions, 68 i
PGDM In
utions und
e lowest.
ng course
ers per 1
is the hig
College
63
emale per 100 Mrent types of In
P
nstitutions e
ale teacher
rs is
there are
rs per 1
chnical/ Po
in Teacher
stitutions
der Ministr
Contrast
s has 49
100 male
ghest amo
Standalone
63
Male Teachers nstiutions
Page 28 of 33
each.
rs per 100
varying
e only 43
100 male
olytechnic
r Training,
and 17 in
ries which
to this,
96 female
teachers
ng all the
in
3
g
n
h
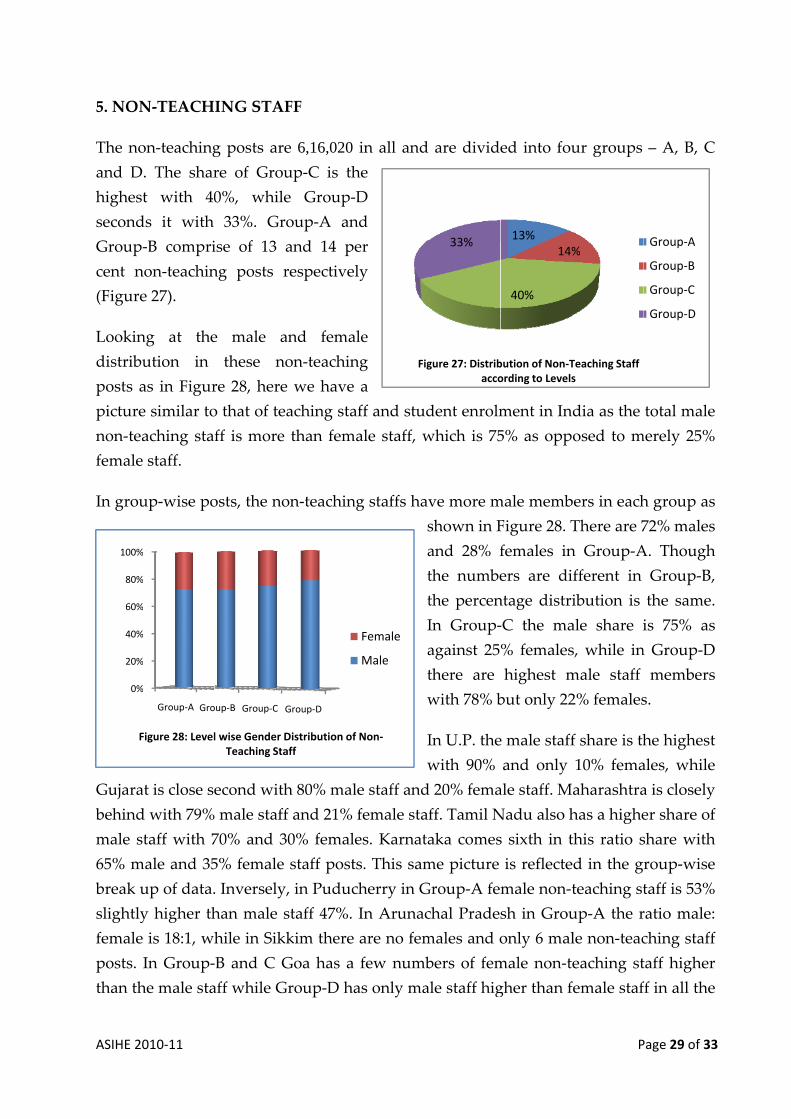
ASIHE 20
5. NON
The no
and D
highest
second
Group‐
cent n
(Figure
Lookin
distribu
posts a
picture
non‐tea
female
In grou
Gujara
behind
male s
65% m
break u
slightly
female
posts.
than th
0%
20%
40%
60%
80%
100%
F
010‐11
N‐TEACH
on‐teaching
. The shar
t with 40
ds it with
‐B compri
non‐teachin
e 27).
ng at the
ution in
as in Figur
e similar to
aching sta
staff.
up‐wise po
at is close se
d with 79%
taff with 7
male and 35
up of data.
y higher th
is 18:1, wh
In Group‐
he male sta
%
%
%
%
%
%
Group‐A Gro
Figure 28: Level
ING STAF
g posts are
re of Grou
0%, while
33%. Gr
ise of 13 a
ng posts r
e male a
these no
re 28, here
o that of te
ff is more
osts, the no
econd with
male staff
70% and 3
5% female
. Inversely,
han male s
hile in Sikk
‐B and C G
aff while G
oup‐B Group‐C G
l wise Gender DTeaching Sta
FF
e 6,16,020
up‐C is th
e Group‐D
oup‐A an
and 14 pe
respectivel
and femal
on‐teachin
e we have
aching sta
than fema
on‐teaching
h 80% male
f and 21% f
30% female
staff posts
, in Puduc
staff 47%.
kim there
Goa has a
Group‐D ha
Group‐D
Distribution of aff
in all and
he
D
nd
er
ly
le
ng
a
ff and stud
ale staff, w
g staffs hav
s
a
t
t
I
a
t
w
I
w
e staff and
female staf
es. Karnata
s. This sam
cherry in G
In Arunac
are no fem
few numb
as only ma
Fig
Non‐
Female
Male
are divide
dent enrolm
which is 75
ve more m
shown in F
and 28% f
the numbe
the percen
In Group‐
against 25
there are
with 78% b
In U.P. the
with 90%
d 20% fema
ff. Tamil N
aka comes
me picture
Group‐A fe
chal Prade
males and o
bers of fem
ale staff hig
33%
gure 27: Distribacco
ed into fou
ment in In
5% as opp
male memb
Figure 28. T
females in
ers are di
ntage distri
‐C the ma
% females
highest m
but only 22
e male staff
and only
ale staff. M
Nadu also h
s sixth in t
is reflecte
male non‐t
sh in Grou
only 6 mal
male non‐t
gher than f
13%14%
40%
bution of Non‐Tording to Levels
P
ur groups
ndia as the
osed to m
bers in each
There are 7
n Group‐A
ifferent in
ibution is
ale share i
s, while in
male staff
2% females
f share is th
10% fema
Maharashtra
has a highe
this ratio s
ed in the g
teaching st
up‐A the r
le non‐teac
eaching st
female staf
%
Teaching Staff s
Page 29 of 33
– A, B, C
total male
merely 25%
h group as
72% males
A. Though
Group‐B,
the same.
is 75% as
n Group‐D
members
s.
he highest
ales, while
a is closely
er share of
share with
roup‐wise
taff is 53%
ratio male:
ching staff
taff higher
ff in all the
Group‐A
Group‐B
Group‐C
Group‐D
3
h
t
f
h
f
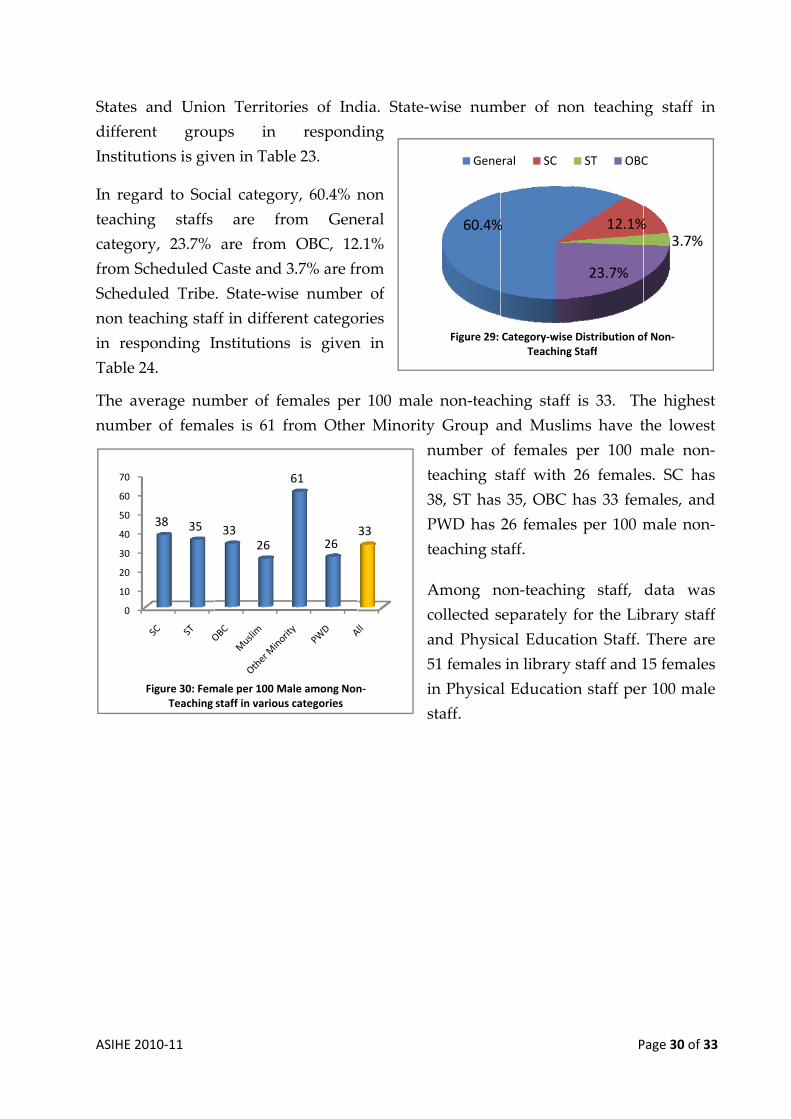
ASIHE 20
States
differen
Institut
In rega
teachin
categor
from S
Schedu
non tea
in resp
Table 2
The av
numbe
0
10
20
30
40
50
60
70
010‐11
and Unio
nt grou
tions is giv
ard to Soc
ng staffs
ry, 23.7%
cheduled C
uled Tribe
aching staf
ponding I
24.
verage num
er of fema
38 35
Figure 30: FemTeaching
on Territor
ups in
ven in Tabl
ial categor
are fr
are from
Caste and
. State‐wis
ff in differ
Institutions
mber of fe
ales is 61 f
3326
male per 100 Mstaff in various
ries of Ind
respond
le 23.
ry, 60.4% n
om Gen
m OBC, 12
3.7% are fr
se number
rent catego
s is given
emales per
from Othe
61
26
Male among Nons categories
dia. State‐
ding
non
neral
2.1%
rom
r of
ories
n in
r 100 male
er Minority
n
t
3
P
t
A
c
a
5
i
s
33
n‐
wise num
e non‐teac
y Group a
number of
teaching s
38, ST has
PWD has
teaching st
Among n
collected s
and Physic
51 females
in Physica
staff.
60.4%
Figure 29:
Gene
mber of no
hing staff
and Muslim
f females
staff with
s 35, OBC
26 females
taff.
non‐teachin
separately
cal Educat
s in library
l Educatio
%
Category‐wiseTeaching
eral SC
P
on teachin
is 33. Th
ms have t
per 100 m
26 female
has 33 fem
s per 100 m
ng staff,
for the Lib
tion Staff.
staff and 1
on staff per
12.1%
23.7%
e Distribution oStaff
ST OBC
Page 30 of 33
ng staff in
he highest
the lowest
male non‐
es. SC has
males, and
male non‐
data was
brary staff
There are
15 females
r 100 male
%3.7%
f Non‐
C
3
n
t
t
f
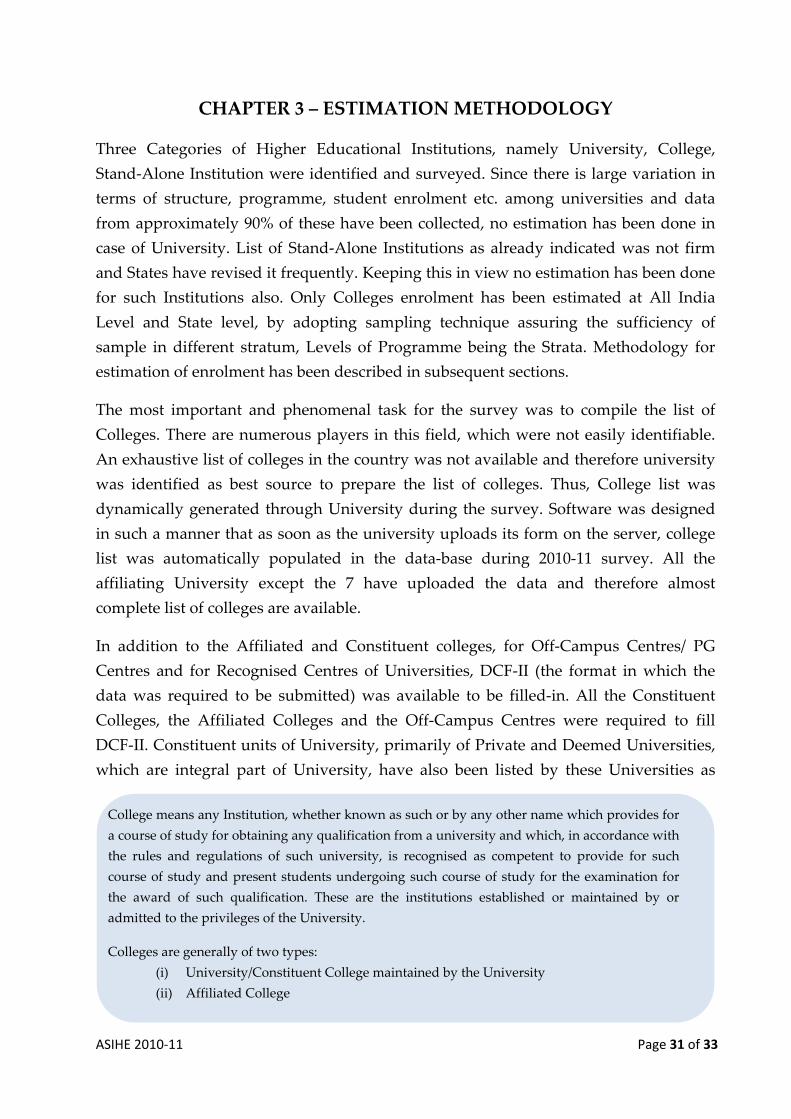
ASIHE 2010‐11 Page 31 of 33
CHAPTER 3 – ESTIMATION METHODOLOGY
Three Categories of Higher Educational Institutions, namely University, College,
Stand‐Alone Institution were identified and surveyed. Since there is large variation in
terms of structure, programme, student enrolment etc. among universities and data
from approximately 90% of these have been collected, no estimation has been done in
case of University. List of Stand‐Alone Institutions as already indicated was not firm
and States have revised it frequently. Keeping this in view no estimation has been done
for such Institutions also. Only Colleges enrolment has been estimated at All India
Level and State level, by adopting sampling technique assuring the sufficiency of
sample in different stratum, Levels of Programme being the Strata. Methodology for
estimation of enrolment has been described in subsequent sections.
The most important and phenomenal task for the survey was to compile the list of
Colleges. There are numerous players in this field, which were not easily identifiable.
An exhaustive list of colleges in the country was not available and therefore university
was identified as best source to prepare the list of colleges. Thus, College list was
dynamically generated through University during the survey. Software was designed
in such a manner that as soon as the university uploads its form on the server, college
list was automatically populated in the data‐base during 2010‐11 survey. All the
affiliating University except the 7 have uploaded the data and therefore almost
complete list of colleges are available.
In addition to the Affiliated and Constituent colleges, for Off‐Campus Centres/ PG
Centres and for Recognised Centres of Universities, DCF‐II (the format in which the
data was required to be submitted) was available to be filled‐in. All the Constituent
Colleges, the Affiliated Colleges and the Off‐Campus Centres were required to fill
DCF‐II. Constituent units of University, primarily of Private and Deemed Universities,
which are integral part of University, have also been listed by these Universities as
College means any Institution, whether known as such or by any other name which provides for
a course of study for obtaining any qualification from a university and which, in accordance with
the rules and regulations of such university, is recognised as competent to provide for such
course of study and present students undergoing such course of study for the examination for
the award of such qualification. These are the institutions established or maintained by or
admitted to the privileges of the University.
Colleges are generally of two types:
(i) University/Constituent College maintained by the University
(ii) Affiliated College
ASIHE 2010‐11 Page 32 of 33
Constituent College. However, DCF‐II for such units were not required to be filled. For
Recognised Centres, in normal cases, DCF‐II have not
been filled, but in a few cases where these are
independent institutions, DCF‐II have been filled.
Thus, there are four types of College/Institution, for
which DCF‐II have been filled:
1. Affiliated College (31876)
2. Constituent College (1508)
3. PG and off. Campus Centre (357)
4. Recognised Centre (2281) In bracket, numbers of such institutions during AISHE 2010‐11
are given. State‐wise number of colleges of different types is
given in Table 25.
Although intended to cover the entire population,
approximately 50% colleges’ data could be collected
and thus to have an idea of total College’s enrolment,
estimation adopting proper sampling methodology,
was required. Constituent Colleges are mainly
located in Bihar, Jharkhand and Maharashtra and
most of them have uploaded the data. Therefore,
enrolment for Constituent Colleges including constituent units of University has not
been estimated except in the State of Jharkhand. In view of poor response in Jharkhand,
enrolment for Constituent Colleges was also estimated. For PG/Off‐Campus Centres
and for Recognised Centres also no estimation has been made. During 2010‐11 survey,
DCF‐II for only 76 PG/Off‐campus centres and 287 Recognised centres have been filled.
State‐wise number of responded colleges of different types is given in Table 26.
Thus for only affiliated colleges, enrolment has been estimated based on the Stratified
Sampling technique. Post‐Stratification has been done, after the survey for the year
2010‐11 is closed.
Affiliated Colleges has been divided into two strata; one is Lagre College and other
Small college. Large Colleges are those, which have enrolment of 3000 or more and the
remaining are Small colleges. In absence of a priori information, it may be assumed that
all large colleges have uploaded the data i.e. in the population the number of large
colleges is equal to the number of such colleges that have uploaded DCF‐II. Thus, we
have avoided over estimation of enrolment of colleges. Average enrolment at a
A Off‐Campus Centre/ PG Centre is a
centre of the University established
by it, outside the main campus
(within or outside the state) operated
and maintained as its constituent
unit, having the University’s
compliment of facilities, faculty and
staff. A Recognised Centre is an
institution attached with the
University for the purpose of
awarding degree in respect of
programmes being run in these
institutions. e.g. Army Cadet College
Wing, Indian Military Academy,
Dehradun is not affiliated with any
University but the degree in respect
of Programmes run in the institute are
awarded by Jawaharlal Nehru
University.
ASIHE 20
particu
the enr
affiliate
This m
The Es
Based
differen
Constit
Table
Gradua
The co
the me
It show
less tha
based o
010‐11
ular Level
rolment of
ed college
method was
timation fo
on the me
nt levels a
tuent Coll
8. State‐w
ate and Un
oefficient o
ean :
ws the exte
an 0.05 ind
on the sam
for the co
f all colleg
s’ respons
s used as w
ormula is g
ethodology
are given i
eges, PG/O
wise Coeffi
nder Gradu
f variation
ent of varia
dicates high
mple.
lleges of a
ges of that
se was less
within a un
given at An
y explaine
n Table 10
Off‐Campu
icient of v
uate levels
n (CV) is d
ability in r
h homogen
a particula
University
s than 10%
niversity th
nnexure‐6.
d above, s
0. Actual e
us Centres
variances o
are shown
defined as
elation to
neity in the
r Universi
y. Further,
%, state lev
here is hom
.
state‐wise
enrolment
s and Reco
of enrolme
n in Annex
the ratio o
mean of th
e sample an
ity has bee
for those
vel averag
mogeneity i
total enro
in case of
ognised Ce
ent of sm
xure‐7.
of the stand
he populat
nd high re
P
en taken to
Universiti
ges have b
in nature o
lment in c
Affiliated
entres are
mall college
dard devia
tion. Thus
eliability of
Page 33 of 33
o estimate
ies, where
been used.
of colleges.
colleges at
d Colleges,
shown in
es at Post
ation to
any value
f estimates
3
t
n
t
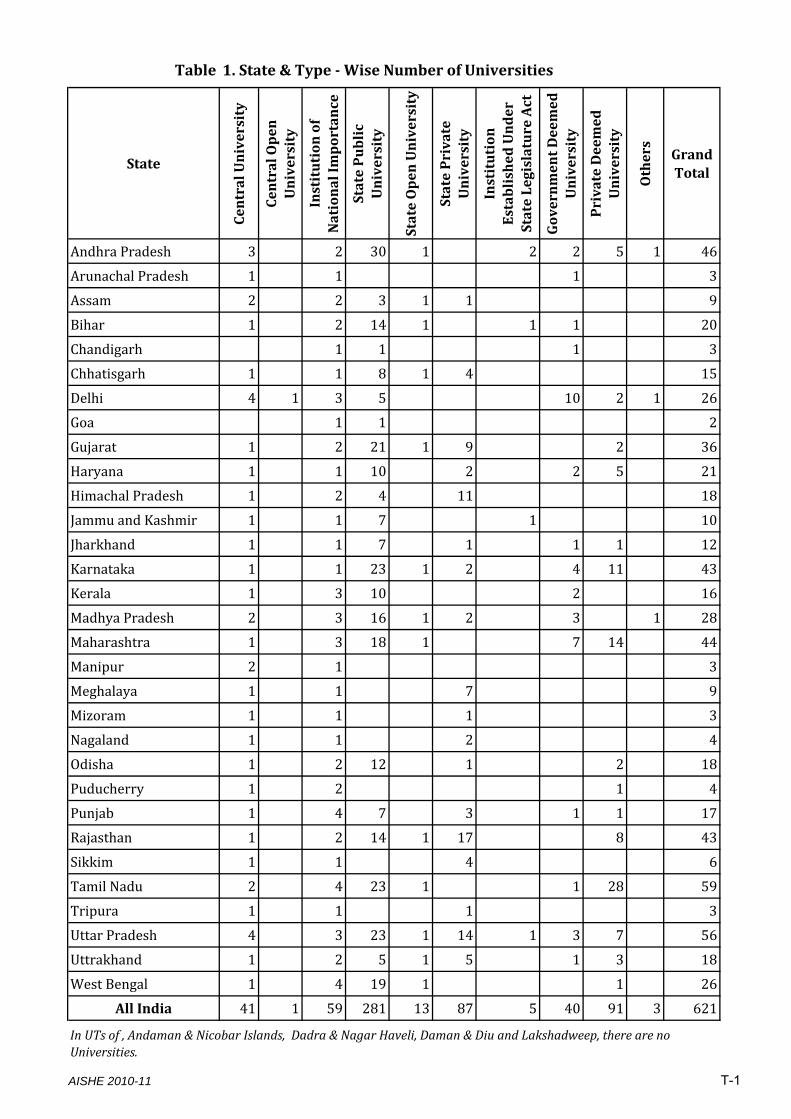
Table 1. State & Type Wise Number of Universities
State
Central University
Central Open
University
Institution of
National Im
portance
State Public
University
State Open University
State Private
University
Institution
Established Under
State Legislature Act
Government Deemed
University
Private Deemed
University
Others
Grand Total
Andhra Pradesh 3 2 30 1 2 2 5 1 46
Arunachal Pradesh 1 1 1 3
Assam 2 2 3 1 1 9
Bihar 1 2 14 1 1 1 20
Chandigarh 1 1 1 3
Chhatisgarh 1 1 8 1 4 15
Delhi 4 1 3 5 10 2 1 26
Goa 1 1 2
Gujarat 1 2 21 1 9 2 36
Haryana 1 1 10 2 2 5 21
Himachal Pradesh 1 2 4 11 18
Jammu and Kashmir 1 1 7 1 10
Jharkhand 1 1 7 1 1 1 12
Karnataka 1 1 23 1 2 4 11 43
Kerala 1 3 10 2 16
Madhya Pradesh 2 3 16 1 2 3 1 28
Maharashtra 1 3 18 1 7 14 44
Manipur 2 1 3
Meghalaya 1 1 7 9
Mizoram 1 1 1 3
Nagaland 1 1 2 4
Odisha 1 2 12 1 2 18
Puducherry 1 2 1 4
Punjab 1 4 7 3 1 1 17
Rajasthan 1 2 14 1 17 8 43
Sikkim 1 1 4 6
Tamil Nadu 2 4 23 1 1 28 59
Tripura 1 1 1 3
Uttar Pradesh 4 3 23 1 14 1 3 7 56
Uttrakhand 1 2 5 1 5 1 3 18
West Bengal 1 4 19 1 1 26
All India 41 1 59 281 13 87 5 40 91 3 621
In UTs of , Andaman & Nicobar Islands, Dadra & Nagar Haveli, Daman & Diu and Lakshadweep, there are no Universities.
AISHE 2010-11 T-1
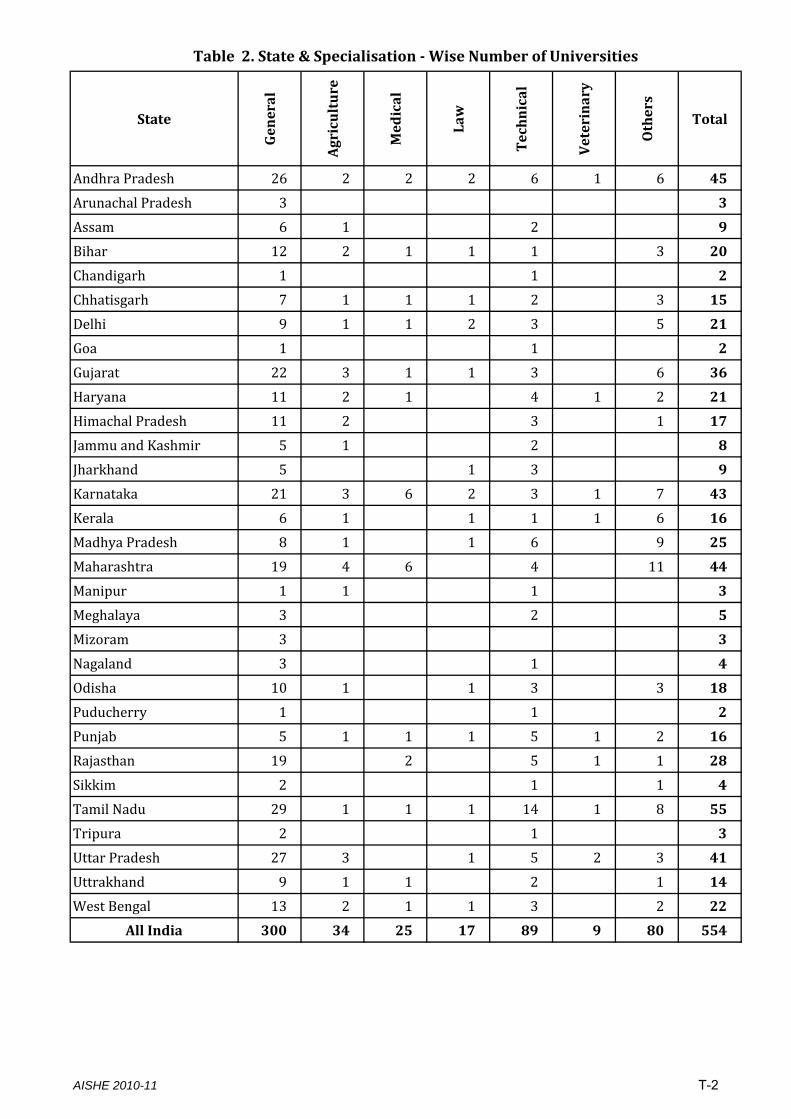
Table 2. State & Specialisation Wise Number of Universities
State
General
Agriculture
Medical
Law
Technical
Veterinary
Others
Total
Andhra Pradesh 26 2 2 2 6 1 6 45
Arunachal Pradesh 3 3
Assam 6 1 2 9
Bihar 12 2 1 1 1 3 20
Chandigarh 1 1 2
Chhatisgarh 7 1 1 1 2 3 15
Delhi 9 1 1 2 3 5 21
Goa 1 1 2
Gujarat 22 3 1 1 3 6 36
Haryana 11 2 1 4 1 2 21
Himachal Pradesh 11 2 3 1 17
Jammu and Kashmir 5 1 2 8
Jharkhand 5 1 3 9
Karnataka 21 3 6 2 3 1 7 43
Kerala 6 1 1 1 1 6 16
Madhya Pradesh 8 1 1 6 9 25
Maharashtra 19 4 6 4 11 44
Manipur 1 1 1 3
Meghalaya 3 2 5
Mizoram 3 3
Nagaland 3 1 4
Odisha 10 1 1 3 3 18
Puducherry 1 1 2
Punjab 5 1 1 1 5 1 2 16
Rajasthan 19 2 5 1 1 28
Sikkim 2 1 1 4
Tamil Nadu 29 1 1 1 14 1 8 55
Tripura 2 1 3
Uttar Pradesh 27 3 1 5 2 3 41
Uttrakhand 9 1 1 2 1 14
West Bengal 13 2 1 1 3 2 22
All India 300 34 25 17 89 9 80 554
AISHE 2010-11 T-2
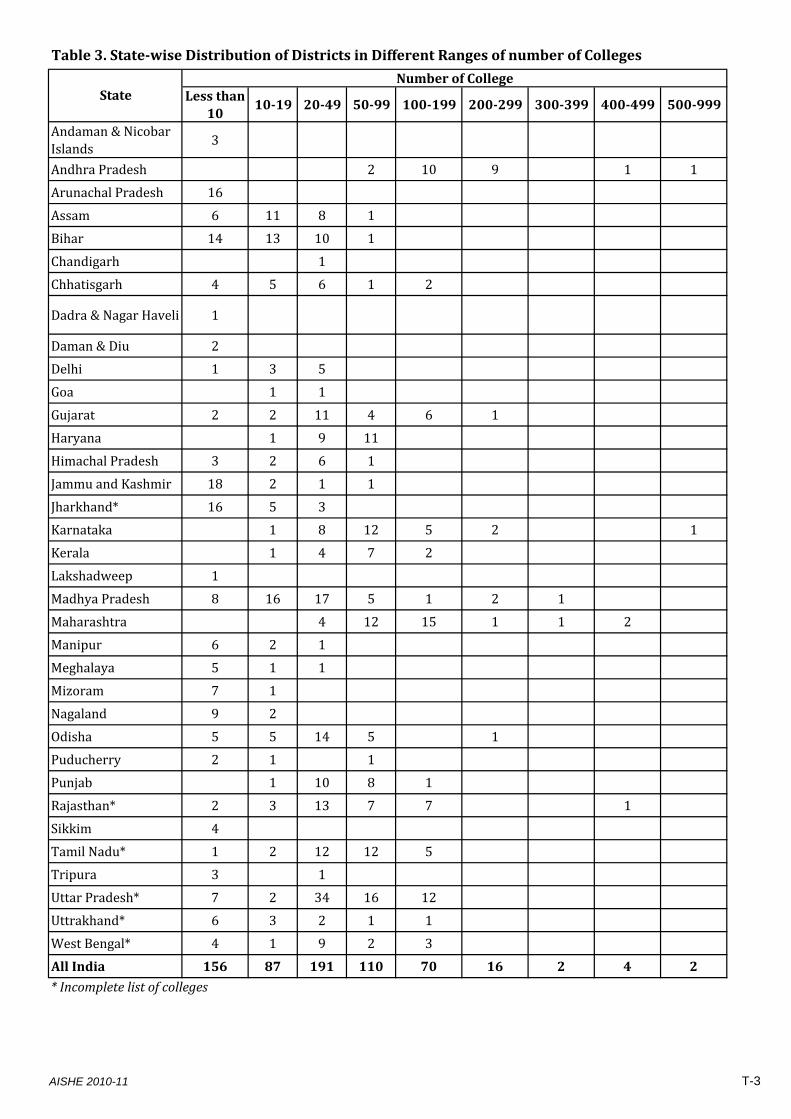
Table 3. Statewise Distribution of Districts in Different Ranges of number of Colleges
Less than 10
1019 2049 5099 100199 200299 300399 400499 500999
Andaman & Nicobar Islands
3
Andhra Pradesh 2 10 9 1 1
Arunachal Pradesh 16
Assam 6 11 8 1
Bihar 14 13 10 1
Chandigarh 1
Chhatisgarh 4 5 6 1 2
Dadra & Nagar Haveli 1
Daman & Diu 2
Delhi 1 3 5
Goa 1 1
Gujarat 2 2 11 4 6 1
Haryana 1 9 11
Himachal Pradesh 3 2 6 1
Jammu and Kashmir 18 2 1 1
Jharkhand* 16 5 3
Karnataka 1 8 12 5 2 1
Kerala 1 4 7 2
Lakshadweep 1
Madhya Pradesh 8 16 17 5 1 2 1
Maharashtra 4 12 15 1 1 2
Manipur 6 2 1
Meghalaya 5 1 1
Mizoram 7 1
Nagaland 9 2
Odisha 5 5 14 5 1
Puducherry 2 1 1
Punjab 1 10 8 1
Rajasthan* 2 3 13 7 7 1
Sikkim 4
Tamil Nadu* 1 2 12 12 5
Tripura 3 1
Uttar Pradesh* 7 2 34 16 12
Uttrakhand* 6 3 2 1 1
West Bengal* 4 1 9 2 3
All India 156 87 191 110 70 16 2 4 2
* Incomplete list of colleges
StateNumber of College
AISHE 2010-11 T-3
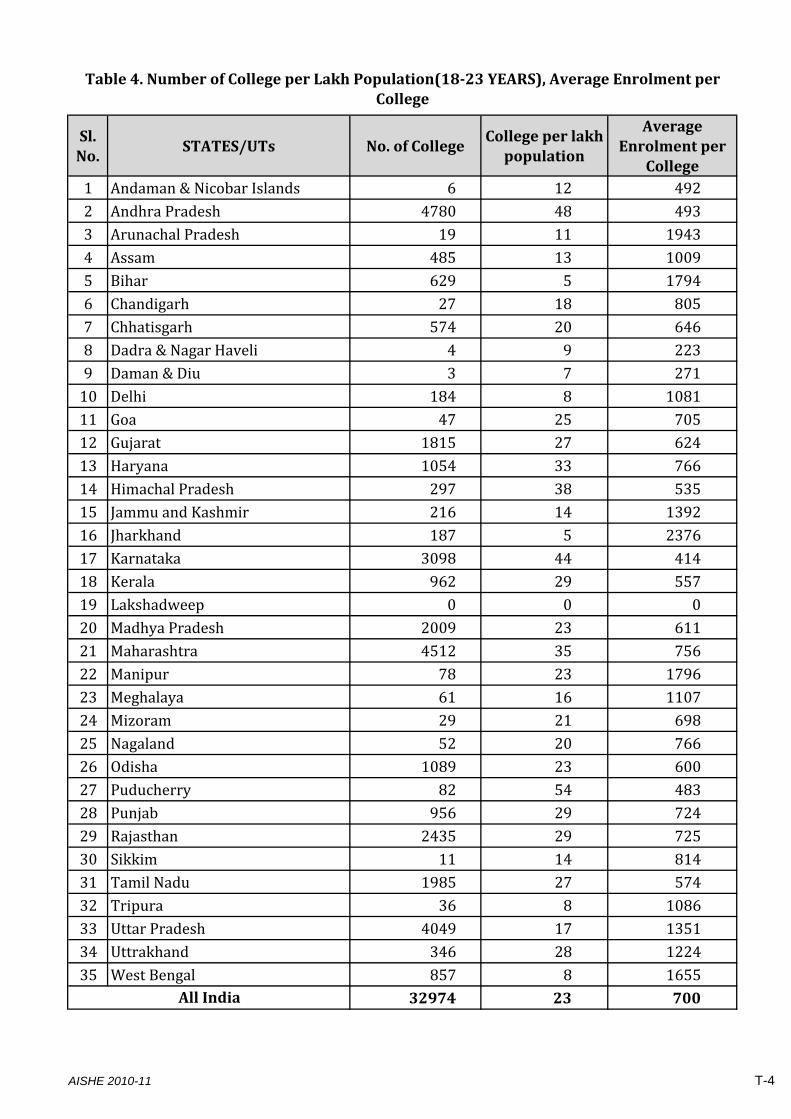
Sl.No.
STATES/UTs No. of CollegeCollege per lakh population
Average Enrolment per
College1 Andaman & Nicobar Islands 6 12 4922 Andhra Pradesh 4780 48 4933 Arunachal Pradesh 19 11 19434 Assam 485 13 10095 Bihar 629 5 17946 Chandigarh 27 18 8057 Chhatisgarh 574 20 6468 Dadra & Nagar Haveli 4 9 2239 Daman & Diu 3 7 27110 Delhi 184 8 108111 Goa 47 25 70512 Gujarat 1815 27 62413 Haryana 1054 33 76614 Himachal Pradesh 297 38 53515 Jammu and Kashmir 216 14 139216 Jharkhand 187 5 237617 Karnataka 3098 44 41418 Kerala 962 29 55719 Lakshadweep 0 0 020 Madhya Pradesh 2009 23 61121 Maharashtra 4512 35 75622 Manipur 78 23 179623 Meghalaya 61 16 110724 Mizoram 29 21 69825 Nagaland 52 20 76626 Odisha 1089 23 60027 Puducherry 82 54 48328 Punjab 956 29 72429 Rajasthan 2435 29 72530 Sikkim 11 14 81431 Tamil Nadu 1985 27 57432 Tripura 36 8 108633 Uttar Pradesh 4049 17 135134 Uttrakhand 346 28 122435 West Bengal 857 8 1655
32974 23 700
Table 4. Number of College per Lakh Population(1823 YEARS), Average Enrolment per College
All India
AISHE 2010-11 T-4
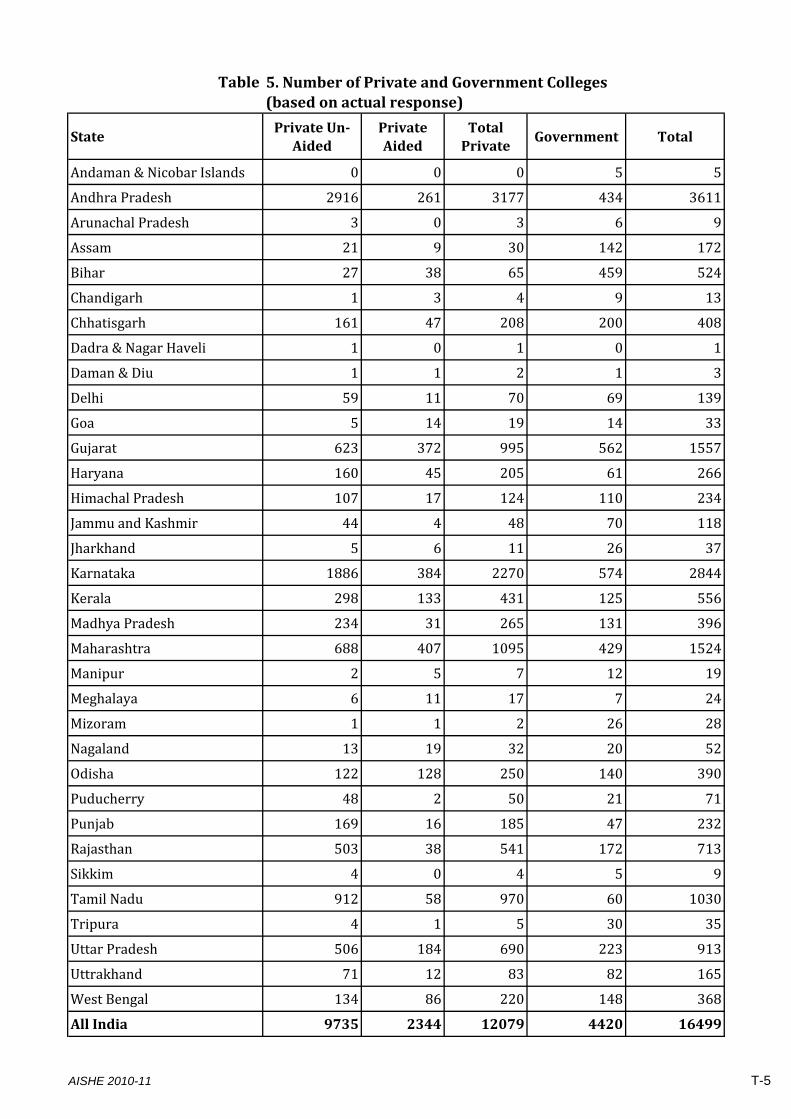
Table
StatePrivate UnAided
Private Aided
Total Private
Government Total
Andaman & Nicobar Islands 0 0 0 5 5
Andhra Pradesh 2916 261 3177 434 3611
Arunachal Pradesh 3 0 3 6 9
Assam 21 9 30 142 172
Bihar 27 38 65 459 524
Chandigarh 1 3 4 9 13
Chhatisgarh 161 47 208 200 408
Dadra & Nagar Haveli 1 0 1 0 1
Daman & Diu 1 1 2 1 3
Delhi 59 11 70 69 139
Goa 5 14 19 14 33
Gujarat 623 372 995 562 1557
Haryana 160 45 205 61 266
Himachal Pradesh 107 17 124 110 234
Jammu and Kashmir 44 4 48 70 118
Jharkhand 5 6 11 26 37
Karnataka 1886 384 2270 574 2844
Kerala 298 133 431 125 556
Madhya Pradesh 234 31 265 131 396
Maharashtra 688 407 1095 429 1524
Manipur 2 5 7 12 19
Meghalaya 6 11 17 7 24
Mizoram 1 1 2 26 28
Nagaland 13 19 32 20 52
Odisha 122 128 250 140 390
Puducherry 48 2 50 21 71
Punjab 169 16 185 47 232
Rajasthan 503 38 541 172 713
Sikkim 4 0 4 5 9
Tamil Nadu 912 58 970 60 1030
Tripura 4 1 5 30 35
Uttar Pradesh 506 184 690 223 913
Uttrakhand 71 12 83 82 165
West Bengal 134 86 220 148 368
All India 9735 2344 12079 4420 16499
5. Number of Private and Government Colleges(based on actual response)
AISHE 2010-11 T-5
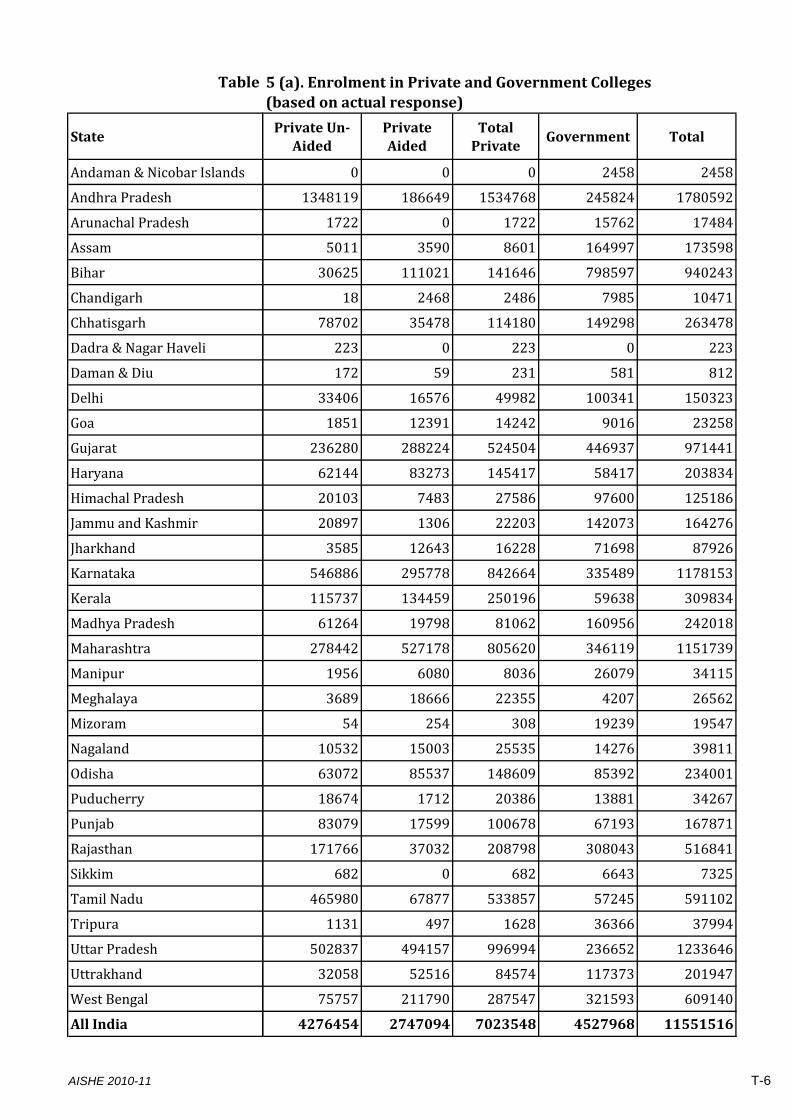
Table
State
Andaman & Nicobar Islands
Andhra Pradesh
Arunachal Pradesh
Assam
Bihar
Chandigarh
Chhatisgarh
Dadra & Nagar Haveli
Daman & Diu
Delhi
Goa
Gujarat
Haryana
Himachal Pradesh
Jammu and Kashmir
Jharkhand
Karnataka
Kerala
Madhya Pradesh
Maharashtra
Manipur
Meghalaya
Mizoram
Nagaland
Odisha
Puducherry
Punjab
Rajasthan
Sikkim
Tamil Nadu
Tripura
Uttar Pradesh
Uttrakhand
West Bengal
All India
Private UnAided
Private Aided
Total Private
Government Total
0 0 0 2458 2458
1348119 186649 1534768 245824 1780592
1722 0 1722 15762 17484
5011 3590 8601 164997 173598
30625 111021 141646 798597 940243
18 2468 2486 7985 10471
78702 35478 114180 149298 263478
223 0 223 0 223
172 59 231 581 812
33406 16576 49982 100341 150323
1851 12391 14242 9016 23258
236280 288224 524504 446937 971441
62144 83273 145417 58417 203834
20103 7483 27586 97600 125186
20897 1306 22203 142073 164276
3585 12643 16228 71698 87926
546886 295778 842664 335489 1178153
115737 134459 250196 59638 309834
61264 19798 81062 160956 242018
278442 527178 805620 346119 1151739
1956 6080 8036 26079 34115
3689 18666 22355 4207 26562
54 254 308 19239 19547
10532 15003 25535 14276 39811
63072 85537 148609 85392 234001
18674 1712 20386 13881 34267
83079 17599 100678 67193 167871
171766 37032 208798 308043 516841
682 0 682 6643 7325
465980 67877 533857 57245 591102
1131 497 1628 36366 37994
502837 494157 996994 236652 1233646
32058 52516 84574 117373 201947
75757 211790 287547 321593 609140
4276454 2747094 7023548 4527968 11551516
5 (a). Enrolment in Private and Government Colleges(based on actual response)
AISHE 2010-11 T-6
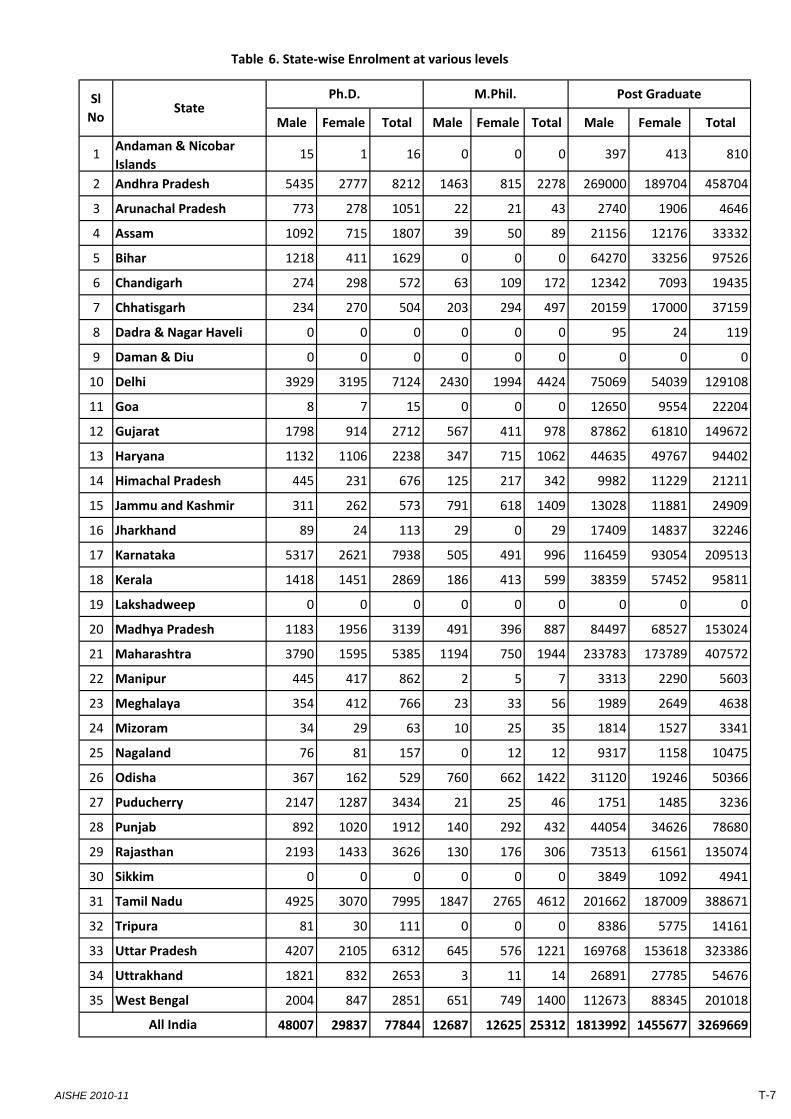
Table 6. State‐wise Enrolment at various levels
Male Female Total Male Female Total Male Female Total
1Andaman & Nicobar
Islands15 1 16 0 0 0 397 413 810
2 Andhra Pradesh 5435 2777 8212 1463 815 2278 269000 189704 458704
3 Arunachal Pradesh 773 278 1051 22 21 43 2740 1906 4646
4 Assam 1092 715 1807 39 50 89 21156 12176 33332
5 Bihar 1218 411 1629 0 0 0 64270 33256 97526
6 Chandigarh 274 298 572 63 109 172 12342 7093 19435
7 Chhatisgarh 234 270 504 203 294 497 20159 17000 37159
8 Dadra & Nagar Haveli 0 0 0 0 0 0 95 24 119
9 Daman & Diu 0 0 0 0 0 0 0 0 0
10 Delhi 3929 3195 7124 2430 1994 4424 75069 54039 129108
11 Goa 8 7 15 0 0 0 12650 9554 22204
12 Gujarat 1798 914 2712 567 411 978 87862 61810 149672
13 Haryana 1132 1106 2238 347 715 1062 44635 49767 94402
14 Himachal Pradesh 445 231 676 125 217 342 9982 11229 21211
15 Jammu and Kashmir 311 262 573 791 618 1409 13028 11881 24909
16 Jharkhand 89 24 113 29 0 29 17409 14837 32246
17 Karnataka 5317 2621 7938 505 491 996 116459 93054 209513
18 Kerala 1418 1451 2869 186 413 599 38359 57452 95811
19 Lakshadweep 0 0 0 0 0 0 0 0 0
20 Madhya Pradesh 1183 1956 3139 491 396 887 84497 68527 153024
21 Maharashtra 3790 1595 5385 1194 750 1944 233783 173789 407572
22 Manipur 445 417 862 2 5 7 3313 2290 5603
23 Meghalaya 354 412 766 23 33 56 1989 2649 4638
24 Mizoram 34 29 63 10 25 35 1814 1527 3341
25 Nagaland 76 81 157 0 12 12 9317 1158 10475
26 Odisha 367 162 529 760 662 1422 31120 19246 50366
27 Puducherry 2147 1287 3434 21 25 46 1751 1485 3236
28 Punjab 892 1020 1912 140 292 432 44054 34626 78680
29 Rajasthan 2193 1433 3626 130 176 306 73513 61561 135074
30 Sikkim 0 0 0 0 0 0 3849 1092 4941
31 Tamil Nadu 4925 3070 7995 1847 2765 4612 201662 187009 388671
32 Tripura 81 30 111 0 0 0 8386 5775 14161
33 Uttar Pradesh 4207 2105 6312 645 576 1221 169768 153618 323386
34 Uttrakhand 1821 832 2653 3 11 14 26891 27785 54676
35 West Bengal 2004 847 2851 651 749 1400 112673 88345 201018
48007 29837 77844 12687 12625 25312 1813992 1455677 3269669
Post Graduate
All India
Sl
NoState
Ph.D. M.Phil.
AISHE 2010-11 T-7
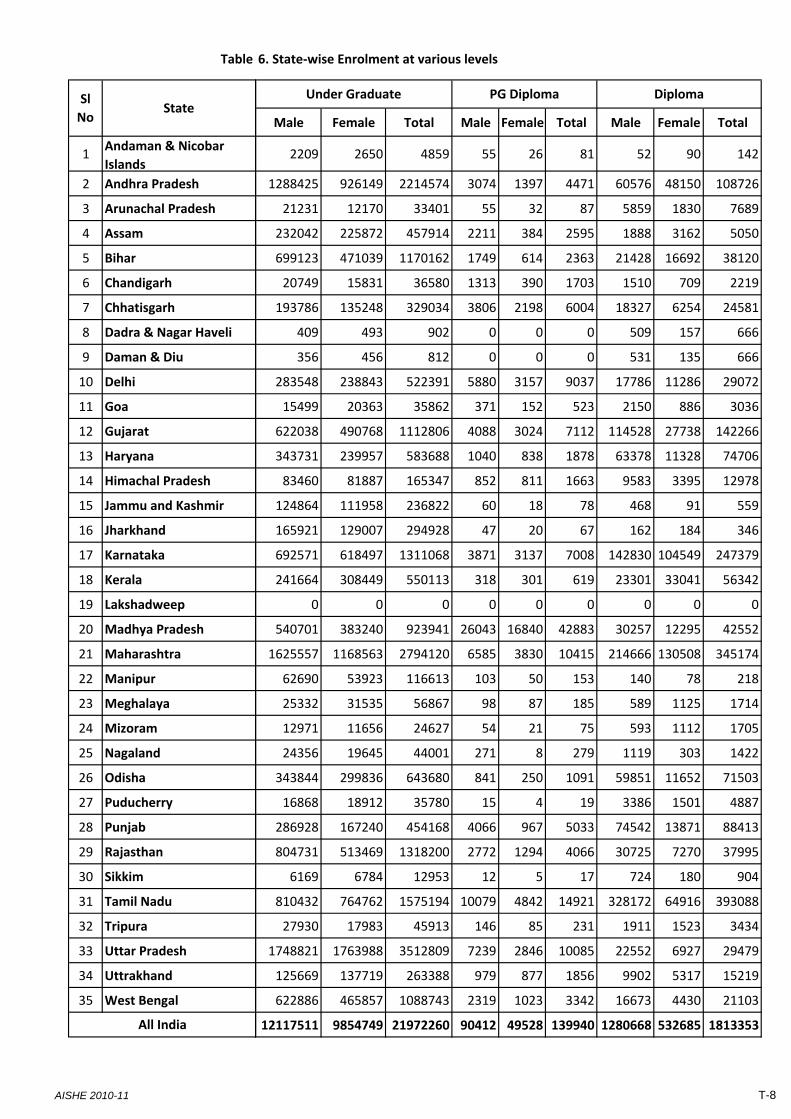
Table
1Andaman & Nicobar
Islands
2 Andhra Pradesh
3 Arunachal Pradesh
4 Assam
5 Bihar
6 Chandigarh
7 Chhatisgarh
8 Dadra & Nagar Haveli
9 Daman & Diu
10 Delhi
11 Goa
12 Gujarat
13 Haryana
14 Himachal Pradesh
15 Jammu and Kashmir
16 Jharkhand
17 Karnataka
18 Kerala
19 Lakshadweep
20 Madhya Pradesh
21 Maharashtra
22 Manipur
23 Meghalaya
24 Mizoram
25 Nagaland
26 Odisha
27 Puducherry
28 Punjab
29 Rajasthan
30 Sikkim
31 Tamil Nadu
32 Tripura
33 Uttar Pradesh
34 Uttrakhand
35 West Bengal
All India
Sl
NoState
6. State‐wise Enrolment at various levels
Male Female Total Male Female Total Male Female Total
2209 2650 4859 55 26 81 52 90 142
1288425 926149 2214574 3074 1397 4471 60576 48150 108726
21231 12170 33401 55 32 87 5859 1830 7689
232042 225872 457914 2211 384 2595 1888 3162 5050
699123 471039 1170162 1749 614 2363 21428 16692 38120
20749 15831 36580 1313 390 1703 1510 709 2219
193786 135248 329034 3806 2198 6004 18327 6254 24581
409 493 902 0 0 0 509 157 666
356 456 812 0 0 0 531 135 666
283548 238843 522391 5880 3157 9037 17786 11286 29072
15499 20363 35862 371 152 523 2150 886 3036
622038 490768 1112806 4088 3024 7112 114528 27738 142266
343731 239957 583688 1040 838 1878 63378 11328 74706
83460 81887 165347 852 811 1663 9583 3395 12978
124864 111958 236822 60 18 78 468 91 559
165921 129007 294928 47 20 67 162 184 346
692571 618497 1311068 3871 3137 7008 142830 104549 247379
241664 308449 550113 318 301 619 23301 33041 56342
0 0 0 0 0 0 0 0 0
540701 383240 923941 26043 16840 42883 30257 12295 42552
1625557 1168563 2794120 6585 3830 10415 214666 130508 345174
62690 53923 116613 103 50 153 140 78 218
25332 31535 56867 98 87 185 589 1125 1714
12971 11656 24627 54 21 75 593 1112 1705
24356 19645 44001 271 8 279 1119 303 1422
343844 299836 643680 841 250 1091 59851 11652 71503
16868 18912 35780 15 4 19 3386 1501 4887
286928 167240 454168 4066 967 5033 74542 13871 88413
804731 513469 1318200 2772 1294 4066 30725 7270 37995
6169 6784 12953 12 5 17 724 180 904
810432 764762 1575194 10079 4842 14921 328172 64916 393088
27930 17983 45913 146 85 231 1911 1523 3434
1748821 1763988 3512809 7239 2846 10085 22552 6927 29479
125669 137719 263388 979 877 1856 9902 5317 15219
622886 465857 1088743 2319 1023 3342 16673 4430 21103
12117511 9854749 21972260 90412 49528 139940 1280668 532685 1813353
Under Graduate PG Diploma Diploma
AISHE 2010-11 T-8
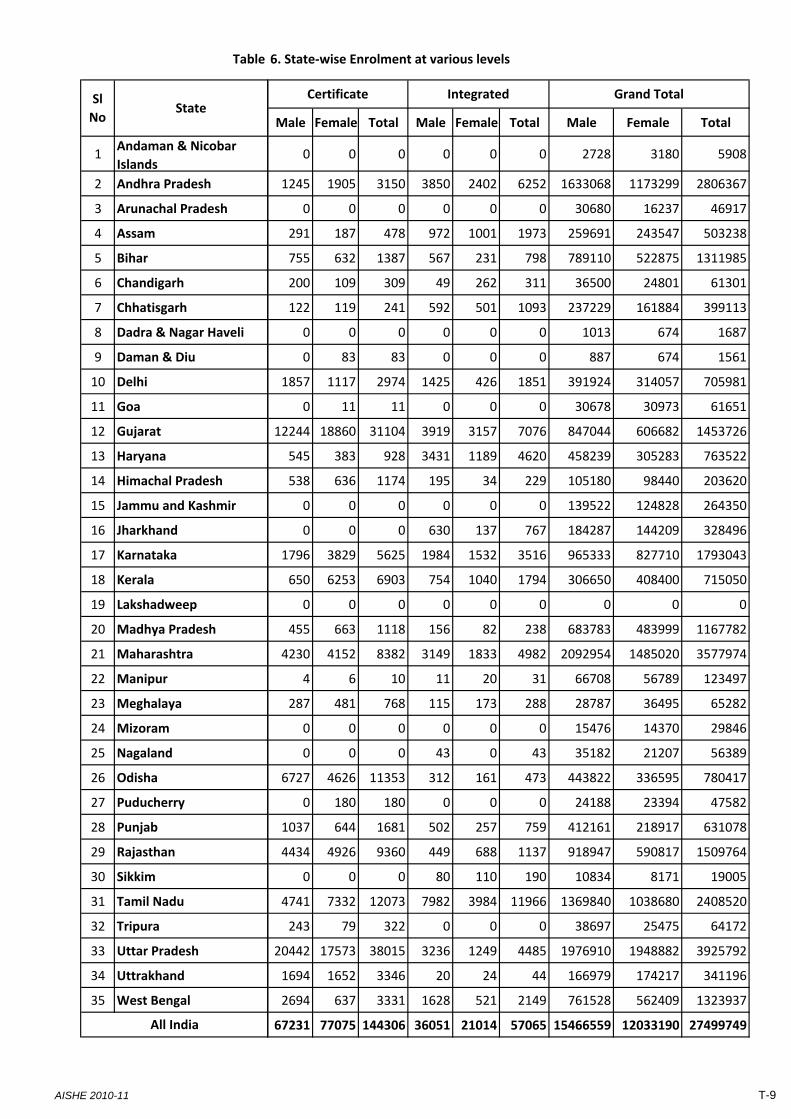
Table
1Andaman & Nicobar
Islands
2 Andhra Pradesh
3 Arunachal Pradesh
4 Assam
5 Bihar
6 Chandigarh
7 Chhatisgarh
8 Dadra & Nagar Haveli
9 Daman & Diu
10 Delhi
11 Goa
12 Gujarat
13 Haryana
14 Himachal Pradesh
15 Jammu and Kashmir
16 Jharkhand
17 Karnataka
18 Kerala
19 Lakshadweep
20 Madhya Pradesh
21 Maharashtra
22 Manipur
23 Meghalaya
24 Mizoram
25 Nagaland
26 Odisha
27 Puducherry
28 Punjab
29 Rajasthan
30 Sikkim
31 Tamil Nadu
32 Tripura
33 Uttar Pradesh
34 Uttrakhand
35 West Bengal
All India
Sl
NoState
6. State‐wise Enrolment at various levels
Male Female Total Male Female Total Male Female Total
0 0 0 0 0 0 2728 3180 5908
1245 1905 3150 3850 2402 6252 1633068 1173299 2806367
0 0 0 0 0 0 30680 16237 46917
291 187 478 972 1001 1973 259691 243547 503238
755 632 1387 567 231 798 789110 522875 1311985
200 109 309 49 262 311 36500 24801 61301
122 119 241 592 501 1093 237229 161884 399113
0 0 0 0 0 0 1013 674 1687
0 83 83 0 0 0 887 674 1561
1857 1117 2974 1425 426 1851 391924 314057 705981
0 11 11 0 0 0 30678 30973 61651
12244 18860 31104 3919 3157 7076 847044 606682 1453726
545 383 928 3431 1189 4620 458239 305283 763522
538 636 1174 195 34 229 105180 98440 203620
0 0 0 0 0 0 139522 124828 264350
0 0 0 630 137 767 184287 144209 328496
1796 3829 5625 1984 1532 3516 965333 827710 1793043
650 6253 6903 754 1040 1794 306650 408400 715050
0 0 0 0 0 0 0 0 0
455 663 1118 156 82 238 683783 483999 1167782
4230 4152 8382 3149 1833 4982 2092954 1485020 3577974
4 6 10 11 20 31 66708 56789 123497
287 481 768 115 173 288 28787 36495 65282
0 0 0 0 0 0 15476 14370 29846
0 0 0 43 0 43 35182 21207 56389
6727 4626 11353 312 161 473 443822 336595 780417
0 180 180 0 0 0 24188 23394 47582
1037 644 1681 502 257 759 412161 218917 631078
4434 4926 9360 449 688 1137 918947 590817 1509764
0 0 0 80 110 190 10834 8171 19005
4741 7332 12073 7982 3984 11966 1369840 1038680 2408520
243 79 322 0 0 0 38697 25475 64172
20442 17573 38015 3236 1249 4485 1976910 1948882 3925792
1694 1652 3346 20 24 44 166979 174217 341196
2694 637 3331 1628 521 2149 761528 562409 1323937
67231 77075 144306 36051 21014 57065 15466559 12033190 27499749
Certificate Integrated Grand Total
AISHE 2010-11 T-9
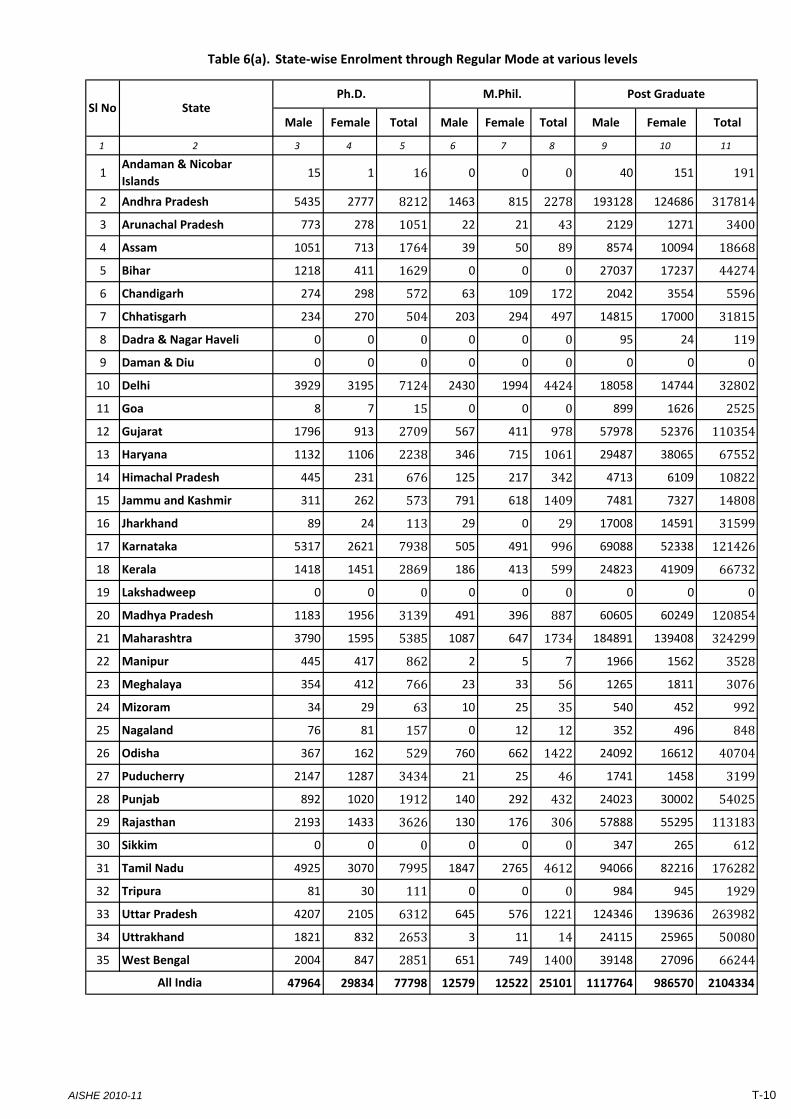
Table 6(a). State‐wise Enrolment through Regular Mode at various levels
Male Female Total Male Female Total Male Female Total
1 2 3 4 5 6 7 8 9 10 11
1Andaman & Nicobar
Islands15 1 16 0 0 0 40 151 191
2 Andhra Pradesh 5435 2777 8212 1463 815 2278 193128 124686 317814
3 Arunachal Pradesh 773 278 1051 22 21 43 2129 1271 3400
4 Assam 1051 713 1764 39 50 89 8574 10094 18668
5 Bihar 1218 411 1629 0 0 0 27037 17237 44274
6 Chandigarh 274 298 572 63 109 172 2042 3554 5596
7 Chhatisgarh 234 270 504 203 294 497 14815 17000 31815
8 Dadra & Nagar Haveli 0 0 0 0 0 0 95 24 119
9 Daman & Diu 0 0 0 0 0 0 0 0 0
10 Delhi 3929 3195 7124 2430 1994 4424 18058 14744 32802
11 Goa 8 7 15 0 0 0 899 1626 2525
12 Gujarat 1796 913 2709 567 411 978 57978 52376 110354
13 Haryana 1132 1106 2238 346 715 1061 29487 38065 67552
14 Himachal Pradesh 445 231 676 125 217 342 4713 6109 10822
15 Jammu and Kashmir 311 262 573 791 618 1409 7481 7327 14808
16 Jharkhand 89 24 113 29 0 29 17008 14591 31599
17 Karnataka 5317 2621 7938 505 491 996 69088 52338 121426
18 Kerala 1418 1451 2869 186 413 599 24823 41909 66732
19 Lakshadweep 0 0 0 0 0 0 0 0 0
20 Madhya Pradesh 1183 1956 3139 491 396 887 60605 60249 120854
21 Maharashtra 3790 1595 5385 1087 647 1734 184891 139408 324299
22 Manipur 445 417 862 2 5 7 1966 1562 3528
23 Meghalaya 354 412 766 23 33 56 1265 1811 3076
24 Mizoram 34 29 63 10 25 35 540 452 992
25 Nagaland 76 81 157 0 12 12 352 496 848
26 Odisha 367 162 529 760 662 1422 24092 16612 40704
27 Puducherry 2147 1287 3434 21 25 46 1741 1458 3199
28 Punjab 892 1020 1912 140 292 432 24023 30002 54025
29 Rajasthan 2193 1433 3626 130 176 306 57888 55295 113183
30 Sikkim 0 0 0 0 0 0 347 265 612
31 Tamil Nadu 4925 3070 7995 1847 2765 4612 94066 82216 176282
32 Tripura 81 30 111 0 0 0 984 945 1929
33 Uttar Pradesh 4207 2105 6312 645 576 1221 124346 139636 263982
34 Uttrakhand 1821 832 2653 3 11 14 24115 25965 50080
35 West Bengal 2004 847 2851 651 749 1400 39148 27096 66244
47964 29834 77798 12579 12522 25101 1117764 986570 2104334
Post Graduate
All India
Sl No StatePh.D. M.Phil.
AISHE 2010-11 T-10
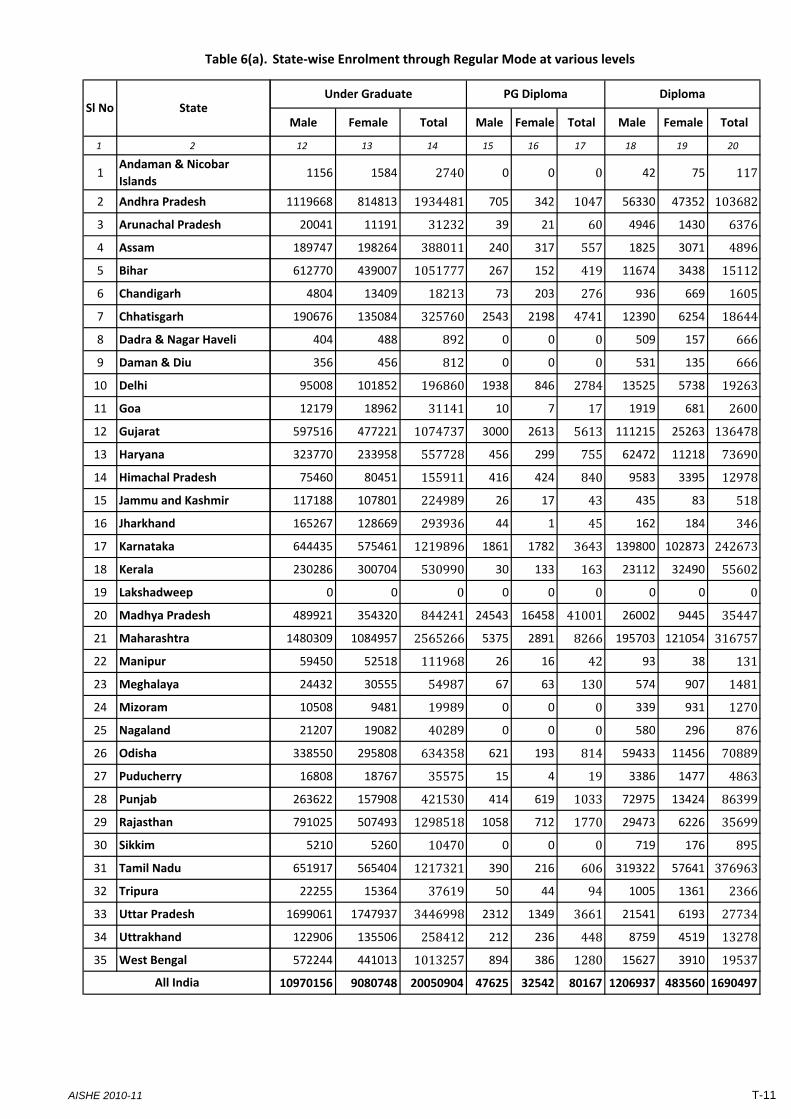
Table 6(a).
1 2
1Andaman & Nicobar
Islands
2 Andhra Pradesh
3 Arunachal Pradesh
4 Assam
5 Bihar
6 Chandigarh
7 Chhatisgarh
8 Dadra & Nagar Haveli
9 Daman & Diu
10 Delhi
11 Goa
12 Gujarat
13 Haryana
14 Himachal Pradesh
15 Jammu and Kashmir
16 Jharkhand
17 Karnataka
18 Kerala
19 Lakshadweep
20 Madhya Pradesh
21 Maharashtra
22 Manipur
23 Meghalaya
24 Mizoram
25 Nagaland
26 Odisha
27 Puducherry
28 Punjab
29 Rajasthan
30 Sikkim
31 Tamil Nadu
32 Tripura
33 Uttar Pradesh
34 Uttrakhand
35 West Bengal
All India
Sl No State
State‐wise Enrolment through Regular Mode at various levels
Male Female Total Male Female Total Male Female Total
12 13 14 15 16 17 18 19 20
1156 1584 2740 0 0 0 42 75 117
1119668 814813 1934481 705 342 1047 56330 47352 103682
20041 11191 31232 39 21 60 4946 1430 6376
189747 198264 388011 240 317 557 1825 3071 4896
612770 439007 1051777 267 152 419 11674 3438 15112
4804 13409 18213 73 203 276 936 669 1605
190676 135084 325760 2543 2198 4741 12390 6254 18644
404 488 892 0 0 0 509 157 666
356 456 812 0 0 0 531 135 666
95008 101852 196860 1938 846 2784 13525 5738 19263
12179 18962 31141 10 7 17 1919 681 2600
597516 477221 1074737 3000 2613 5613 111215 25263 136478
323770 233958 557728 456 299 755 62472 11218 73690
75460 80451 155911 416 424 840 9583 3395 12978
117188 107801 224989 26 17 43 435 83 518
165267 128669 293936 44 1 45 162 184 346
644435 575461 1219896 1861 1782 3643 139800 102873 242673
230286 300704 530990 30 133 163 23112 32490 55602
0 0 0 0 0 0 0 0 0
489921 354320 844241 24543 16458 41001 26002 9445 35447
1480309 1084957 2565266 5375 2891 8266 195703 121054 316757
59450 52518 111968 26 16 42 93 38 131
24432 30555 54987 67 63 130 574 907 1481
10508 9481 19989 0 0 0 339 931 1270
21207 19082 40289 0 0 0 580 296 876
338550 295808 634358 621 193 814 59433 11456 70889
16808 18767 35575 15 4 19 3386 1477 4863
263622 157908 421530 414 619 1033 72975 13424 86399
791025 507493 1298518 1058 712 1770 29473 6226 35699
5210 5260 10470 0 0 0 719 176 895
651917 565404 1217321 390 216 606 319322 57641 376963
22255 15364 37619 50 44 94 1005 1361 2366
1699061 1747937 3446998 2312 1349 3661 21541 6193 27734
122906 135506 258412 212 236 448 8759 4519 13278
572244 441013 1013257 894 386 1280 15627 3910 19537
10970156 9080748 20050904 47625 32542 80167 1206937 483560 1690497
PG Diploma DiplomaUnder Graduate
AISHE 2010-11 T-11
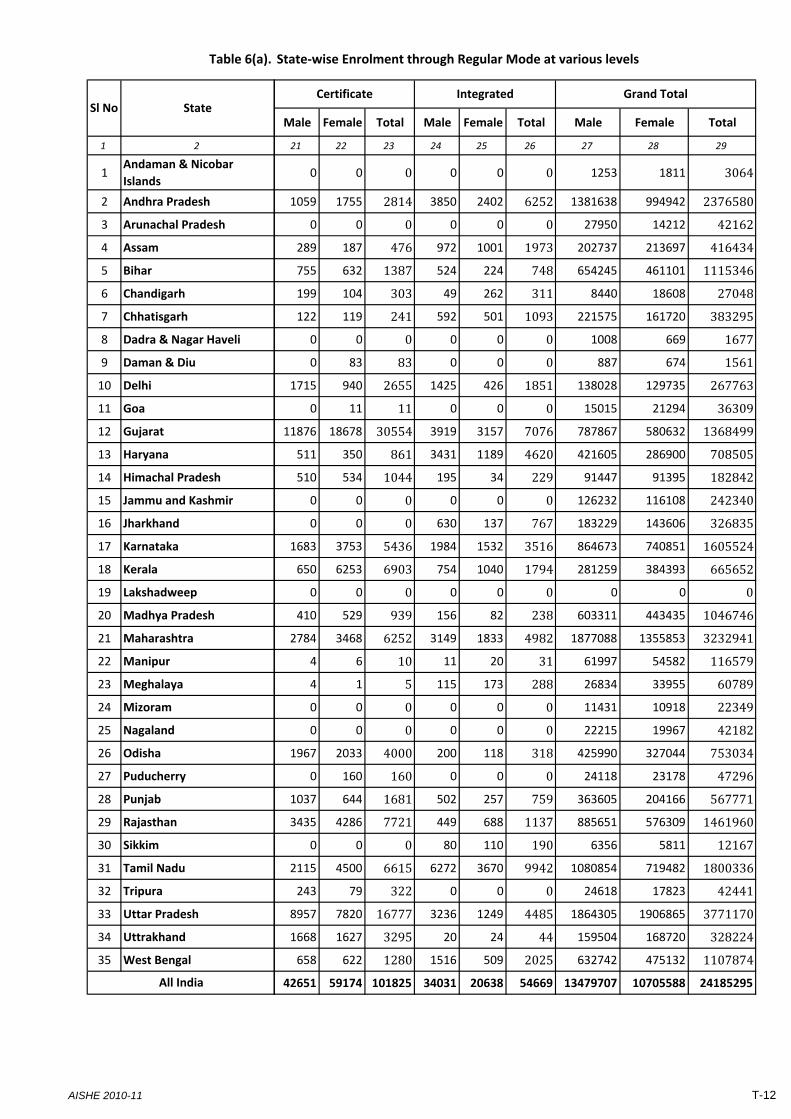
Table 6(a).
1 2
1Andaman & Nicobar
Islands
2 Andhra Pradesh
3 Arunachal Pradesh
4 Assam
5 Bihar
6 Chandigarh
7 Chhatisgarh
8 Dadra & Nagar Haveli
9 Daman & Diu
10 Delhi
11 Goa
12 Gujarat
13 Haryana
14 Himachal Pradesh
15 Jammu and Kashmir
16 Jharkhand
17 Karnataka
18 Kerala
19 Lakshadweep
20 Madhya Pradesh
21 Maharashtra
22 Manipur
23 Meghalaya
24 Mizoram
25 Nagaland
26 Odisha
27 Puducherry
28 Punjab
29 Rajasthan
30 Sikkim
31 Tamil Nadu
32 Tripura
33 Uttar Pradesh
34 Uttrakhand
35 West Bengal
All India
Sl No State
State‐wise Enrolment through Regular Mode at various levels
Male Female Total Male Female Total Male Female Total
21 22 23 24 25 26 27 28 29
0 0 0 0 0 0 1253 1811 3064
1059 1755 2814 3850 2402 6252 1381638 994942 2376580
0 0 0 0 0 0 27950 14212 42162
289 187 476 972 1001 1973 202737 213697 416434
755 632 1387 524 224 748 654245 461101 1115346
199 104 303 49 262 311 8440 18608 27048
122 119 241 592 501 1093 221575 161720 383295
0 0 0 0 0 0 1008 669 1677
0 83 83 0 0 0 887 674 1561
1715 940 2655 1425 426 1851 138028 129735 267763
0 11 11 0 0 0 15015 21294 36309
11876 18678 30554 3919 3157 7076 787867 580632 1368499
511 350 861 3431 1189 4620 421605 286900 708505
510 534 1044 195 34 229 91447 91395 182842
0 0 0 0 0 0 126232 116108 242340
0 0 0 630 137 767 183229 143606 326835
1683 3753 5436 1984 1532 3516 864673 740851 1605524
650 6253 6903 754 1040 1794 281259 384393 665652
0 0 0 0 0 0 0 0 0
410 529 939 156 82 238 603311 443435 1046746
2784 3468 6252 3149 1833 4982 1877088 1355853 3232941
4 6 10 11 20 31 61997 54582 116579
4 1 5 115 173 288 26834 33955 60789
0 0 0 0 0 0 11431 10918 22349
0 0 0 0 0 0 22215 19967 42182
1967 2033 4000 200 118 318 425990 327044 753034
0 160 160 0 0 0 24118 23178 47296
1037 644 1681 502 257 759 363605 204166 567771
3435 4286 7721 449 688 1137 885651 576309 1461960
0 0 0 80 110 190 6356 5811 12167
2115 4500 6615 6272 3670 9942 1080854 719482 1800336
243 79 322 0 0 0 24618 17823 42441
8957 7820 16777 3236 1249 4485 1864305 1906865 3771170
1668 1627 3295 20 24 44 159504 168720 328224
658 622 1280 1516 509 2025 632742 475132 1107874
42651 59174 101825 34031 20638 54669 13479707 10705588 24185295
Certificate Integrated Grand Total
AISHE 2010-11 T-12
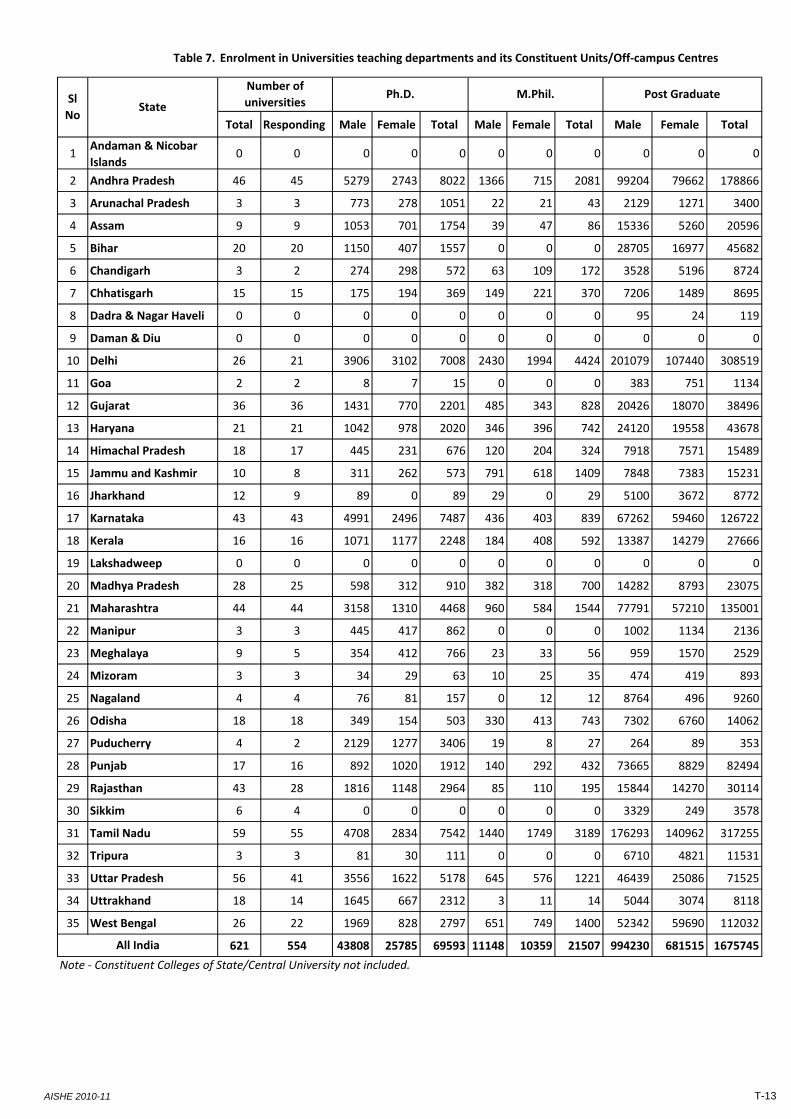
Table 7. Enrolment in Universities teaching departments and its Constituent Units/Off‐campus Centres
Total Responding Male Female Total Male Female Total Male Female Total
1Andaman & Nicobar
Islands0 0 0 0 0 0 0 0 0 0 0
2 Andhra Pradesh 46 45 5279 2743 8022 1366 715 2081 99204 79662 178866
3 Arunachal Pradesh 3 3 773 278 1051 22 21 43 2129 1271 3400
4 Assam 9 9 1053 701 1754 39 47 86 15336 5260 20596
5 Bihar 20 20 1150 407 1557 0 0 0 28705 16977 45682
6 Chandigarh 3 2 274 298 572 63 109 172 3528 5196 8724
7 Chhatisgarh 15 15 175 194 369 149 221 370 7206 1489 8695
8 Dadra & Nagar Haveli 0 0 0 0 0 0 0 0 95 24 119
9 Daman & Diu 0 0 0 0 0 0 0 0 0 0 0
10 Delhi 26 21 3906 3102 7008 2430 1994 4424 201079 107440 308519
11 Goa 2 2 8 7 15 0 0 0 383 751 1134
12 Gujarat 36 36 1431 770 2201 485 343 828 20426 18070 38496
13 Haryana 21 21 1042 978 2020 346 396 742 24120 19558 43678
14 Himachal Pradesh 18 17 445 231 676 120 204 324 7918 7571 15489
15 Jammu and Kashmir 10 8 311 262 573 791 618 1409 7848 7383 15231
16 Jharkhand 12 9 89 0 89 29 0 29 5100 3672 8772
17 Karnataka 43 43 4991 2496 7487 436 403 839 67262 59460 126722
18 Kerala 16 16 1071 1177 2248 184 408 592 13387 14279 27666
19 Lakshadweep 0 0 0 0 0 0 0 0 0 0 0
20 Madhya Pradesh 28 25 598 312 910 382 318 700 14282 8793 23075
21 Maharashtra 44 44 3158 1310 4468 960 584 1544 77791 57210 135001
22 Manipur 3 3 445 417 862 0 0 0 1002 1134 2136
23 Meghalaya 9 5 354 412 766 23 33 56 959 1570 2529
24 Mizoram 3 3 34 29 63 10 25 35 474 419 893
25 Nagaland 4 4 76 81 157 0 12 12 8764 496 9260
26 Odisha 18 18 349 154 503 330 413 743 7302 6760 14062
27 Puducherry 4 2 2129 1277 3406 19 8 27 264 89 353
28 Punjab 17 16 892 1020 1912 140 292 432 73665 8829 82494
29 Rajasthan 43 28 1816 1148 2964 85 110 195 15844 14270 30114
30 Sikkim 6 4 0 0 0 0 0 0 3329 249 3578
31 Tamil Nadu 59 55 4708 2834 7542 1440 1749 3189 176293 140962 317255
32 Tripura 3 3 81 30 111 0 0 0 6710 4821 11531
33 Uttar Pradesh 56 41 3556 1622 5178 645 576 1221 46439 25086 71525
34 Uttrakhand 18 14 1645 667 2312 3 11 14 5044 3074 8118
35 West Bengal 26 22 1969 828 2797 651 749 1400 52342 59690 112032
621 554 43808 25785 69593 11148 10359 21507 994230 681515 1675745
Note ‐ Constituent Colleges of State/Central University not included.
Sl
NoState
Number of
universitiesPh.D. M.Phil. Post Graduate
All India
AISHE 2010-11 T-13
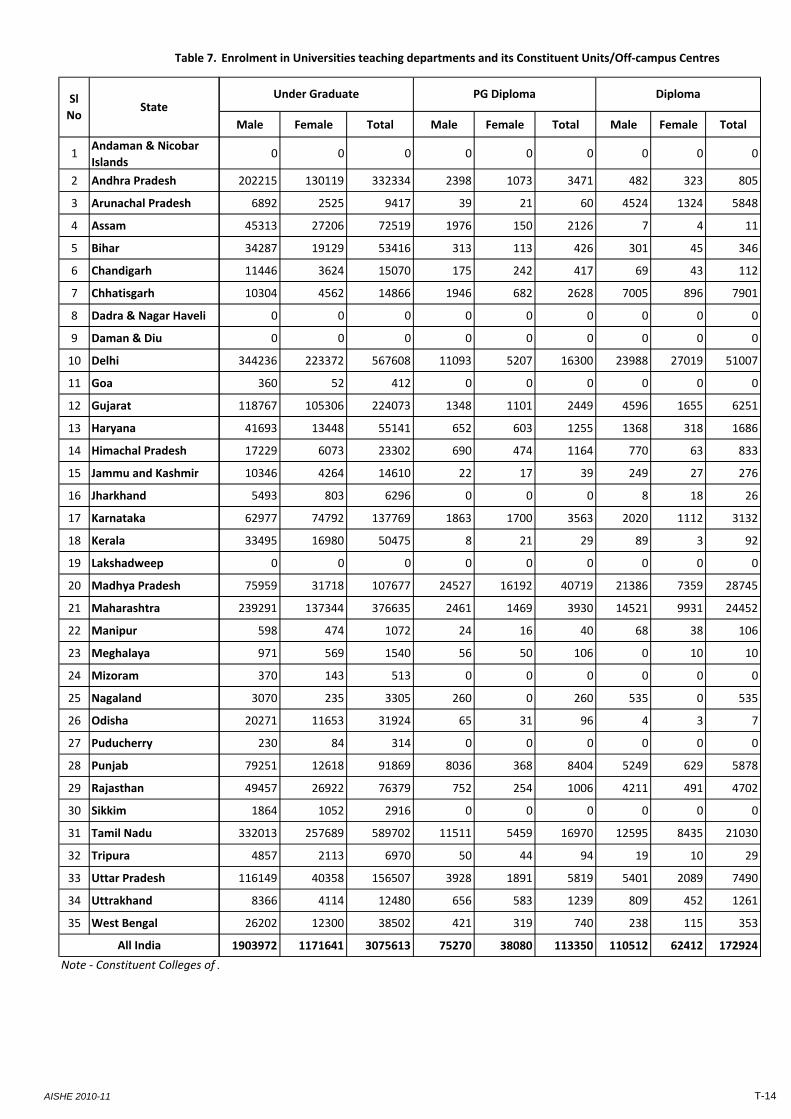
Table 7.
1Andaman & Nicobar
Islands
2 Andhra Pradesh
3 Arunachal Pradesh
4 Assam
5 Bihar
6 Chandigarh
7 Chhatisgarh
8 Dadra & Nagar Haveli
9 Daman & Diu
10 Delhi
11 Goa
12 Gujarat
13 Haryana
14 Himachal Pradesh
15 Jammu and Kashmir
16 Jharkhand
17 Karnataka
18 Kerala
19 Lakshadweep
20 Madhya Pradesh
21 Maharashtra
22 Manipur
23 Meghalaya
24 Mizoram
25 Nagaland
26 Odisha
27 Puducherry
28 Punjab
29 Rajasthan
30 Sikkim
31 Tamil Nadu
32 Tripura
33 Uttar Pradesh
34 Uttrakhand
35 West Bengal
Note ‐ Constituent Colleges of S
Sl
NoState
All India
Enrolment in Universities teaching departments and its Constituent Units/Off‐campus Centres
Male Female Total Male Female Total Male Female Total
0 0 0 0 0 0 0 0 0
202215 130119 332334 2398 1073 3471 482 323 805
6892 2525 9417 39 21 60 4524 1324 5848
45313 27206 72519 1976 150 2126 7 4 11
34287 19129 53416 313 113 426 301 45 346
11446 3624 15070 175 242 417 69 43 112
10304 4562 14866 1946 682 2628 7005 896 7901
0 0 0 0 0 0 0 0 0
0 0 0 0 0 0 0 0 0
344236 223372 567608 11093 5207 16300 23988 27019 51007
360 52 412 0 0 0 0 0 0
118767 105306 224073 1348 1101 2449 4596 1655 6251
41693 13448 55141 652 603 1255 1368 318 1686
17229 6073 23302 690 474 1164 770 63 833
10346 4264 14610 22 17 39 249 27 276
5493 803 6296 0 0 0 8 18 26
62977 74792 137769 1863 1700 3563 2020 1112 3132
33495 16980 50475 8 21 29 89 3 92
0 0 0 0 0 0 0 0 0
75959 31718 107677 24527 16192 40719 21386 7359 28745
239291 137344 376635 2461 1469 3930 14521 9931 24452
598 474 1072 24 16 40 68 38 106
971 569 1540 56 50 106 0 10 10
370 143 513 0 0 0 0 0 0
3070 235 3305 260 0 260 535 0 535
20271 11653 31924 65 31 96 4 3 7
230 84 314 0 0 0 0 0 0
79251 12618 91869 8036 368 8404 5249 629 5878
49457 26922 76379 752 254 1006 4211 491 4702
1864 1052 2916 0 0 0 0 0 0
332013 257689 589702 11511 5459 16970 12595 8435 21030
4857 2113 6970 50 44 94 19 10 29
116149 40358 156507 3928 1891 5819 5401 2089 7490
8366 4114 12480 656 583 1239 809 452 1261
26202 12300 38502 421 319 740 238 115 353
1903972 1171641 3075613 75270 38080 113350 110512 62412 172924
Under Graduate PG Diploma Diploma
AISHE 2010-11 T-14
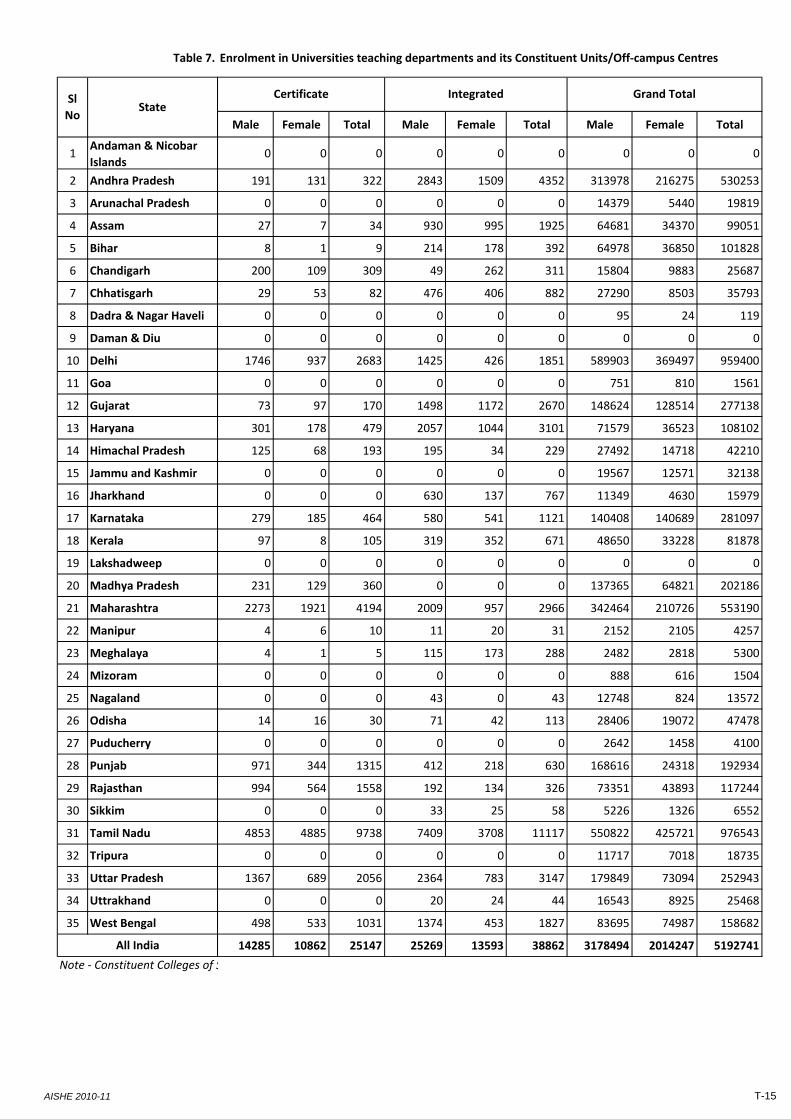
Table 7.
1Andaman & Nicobar
Islands
2 Andhra Pradesh
3 Arunachal Pradesh
4 Assam
5 Bihar
6 Chandigarh
7 Chhatisgarh
8 Dadra & Nagar Haveli
9 Daman & Diu
10 Delhi
11 Goa
12 Gujarat
13 Haryana
14 Himachal Pradesh
15 Jammu and Kashmir
16 Jharkhand
17 Karnataka
18 Kerala
19 Lakshadweep
20 Madhya Pradesh
21 Maharashtra
22 Manipur
23 Meghalaya
24 Mizoram
25 Nagaland
26 Odisha
27 Puducherry
28 Punjab
29 Rajasthan
30 Sikkim
31 Tamil Nadu
32 Tripura
33 Uttar Pradesh
34 Uttrakhand
35 West Bengal
Note ‐ Constituent Colleges of S
Sl
NoState
All India
Enrolment in Universities teaching departments and its Constituent Units/Off‐campus Centres
Male Female Total Male Female Total Male Female Total
0 0 0 0 0 0 0 0 0
191 131 322 2843 1509 4352 313978 216275 530253
0 0 0 0 0 0 14379 5440 19819
27 7 34 930 995 1925 64681 34370 99051
8 1 9 214 178 392 64978 36850 101828
200 109 309 49 262 311 15804 9883 25687
29 53 82 476 406 882 27290 8503 35793
0 0 0 0 0 0 95 24 119
0 0 0 0 0 0 0 0 0
1746 937 2683 1425 426 1851 589903 369497 959400
0 0 0 0 0 0 751 810 1561
73 97 170 1498 1172 2670 148624 128514 277138
301 178 479 2057 1044 3101 71579 36523 108102
125 68 193 195 34 229 27492 14718 42210
0 0 0 0 0 0 19567 12571 32138
0 0 0 630 137 767 11349 4630 15979
279 185 464 580 541 1121 140408 140689 281097
97 8 105 319 352 671 48650 33228 81878
0 0 0 0 0 0 0 0 0
231 129 360 0 0 0 137365 64821 202186
2273 1921 4194 2009 957 2966 342464 210726 553190
4 6 10 11 20 31 2152 2105 4257
4 1 5 115 173 288 2482 2818 5300
0 0 0 0 0 0 888 616 1504
0 0 0 43 0 43 12748 824 13572
14 16 30 71 42 113 28406 19072 47478
0 0 0 0 0 0 2642 1458 4100
971 344 1315 412 218 630 168616 24318 192934
994 564 1558 192 134 326 73351 43893 117244
0 0 0 33 25 58 5226 1326 6552
4853 4885 9738 7409 3708 11117 550822 425721 976543
0 0 0 0 0 0 11717 7018 18735
1367 689 2056 2364 783 3147 179849 73094 252943
0 0 0 20 24 44 16543 8925 25468
498 533 1031 1374 453 1827 83695 74987 158682
14285 10862 25147 25269 13593 38862 3178494 2014247 5192741
Integrated Grand TotalCertificate
AISHE 2010-11 T-15
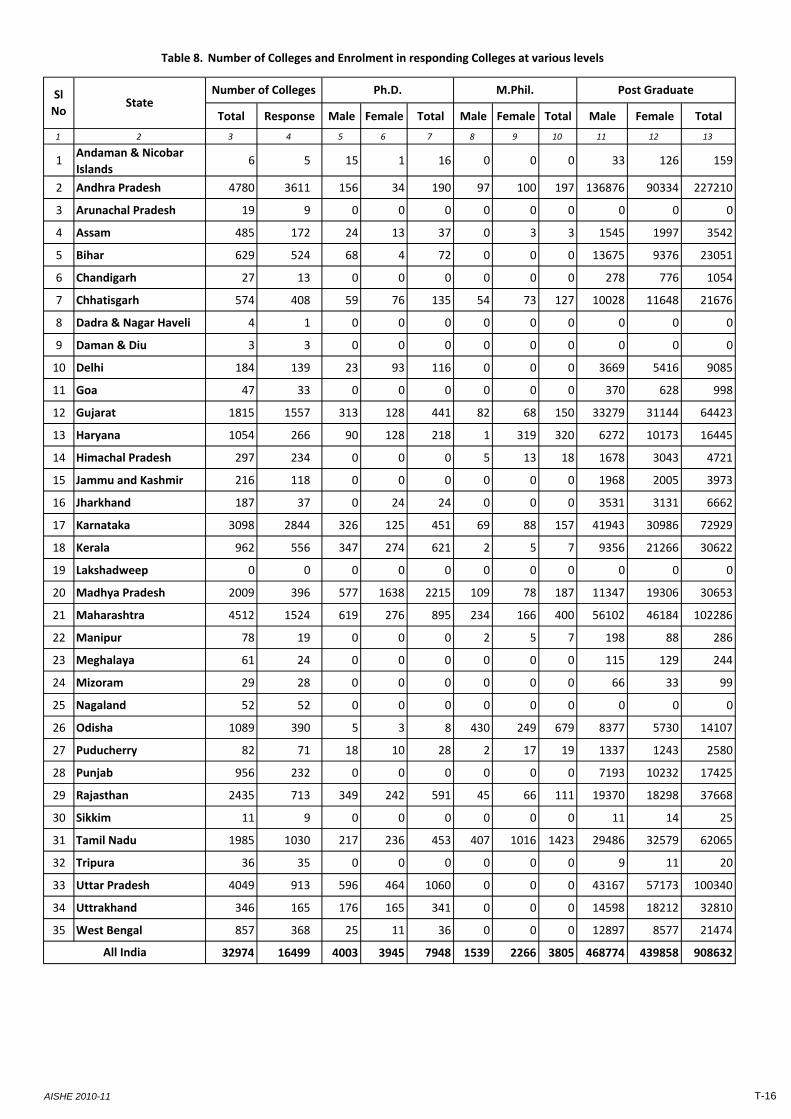
Table 8. Number of Colleges and Enrolment in responding Colleges at various levels
Total Response Male Female Total Male Female Total Male Female Total
1 2 3 4 5 6 7 8 9 10 11 12 13
1Andaman & Nicobar
Islands6 5 15 1 16 0 0 0 33 126 159
2 Andhra Pradesh 4780 3611 156 34 190 97 100 197 136876 90334 227210
3 Arunachal Pradesh 19 9 0 0 0 0 0 0 0 0 0
4 Assam 485 172 24 13 37 0 3 3 1545 1997 3542
5 Bihar 629 524 68 4 72 0 0 0 13675 9376 23051
6 Chandigarh 27 13 0 0 0 0 0 0 278 776 1054
7 Chhatisgarh 574 408 59 76 135 54 73 127 10028 11648 21676
8 Dadra & Nagar Haveli 4 1 0 0 0 0 0 0 0 0 0
9 Daman & Diu 3 3 0 0 0 0 0 0 0 0 0
10 Delhi 184 139 23 93 116 0 0 0 3669 5416 9085
11 Goa 47 33 0 0 0 0 0 0 370 628 998
12 Gujarat 1815 1557 313 128 441 82 68 150 33279 31144 64423
13 Haryana 1054 266 90 128 218 1 319 320 6272 10173 16445
14 Himachal Pradesh 297 234 0 0 0 5 13 18 1678 3043 4721
15 Jammu and Kashmir 216 118 0 0 0 0 0 0 1968 2005 3973
16 Jharkhand 187 37 0 24 24 0 0 0 3531 3131 6662
17 Karnataka 3098 2844 326 125 451 69 88 157 41943 30986 72929
18 Kerala 962 556 347 274 621 2 5 7 9356 21266 30622
19 Lakshadweep 0 0 0 0 0 0 0 0 0 0 0
20 Madhya Pradesh 2009 396 577 1638 2215 109 78 187 11347 19306 30653
21 Maharashtra 4512 1524 619 276 895 234 166 400 56102 46184 102286
22 Manipur 78 19 0 0 0 2 5 7 198 88 286
23 Meghalaya 61 24 0 0 0 0 0 0 115 129 244
24 Mizoram 29 28 0 0 0 0 0 0 66 33 99
25 Nagaland 52 52 0 0 0 0 0 0 0 0 0
26 Odisha 1089 390 5 3 8 430 249 679 8377 5730 14107
27 Puducherry 82 71 18 10 28 2 17 19 1337 1243 2580
28 Punjab 956 232 0 0 0 0 0 0 7193 10232 17425
29 Rajasthan 2435 713 349 242 591 45 66 111 19370 18298 37668
30 Sikkim 11 9 0 0 0 0 0 0 11 14 25
31 Tamil Nadu 1985 1030 217 236 453 407 1016 1423 29486 32579 62065
32 Tripura 36 35 0 0 0 0 0 0 9 11 20
33 Uttar Pradesh 4049 913 596 464 1060 0 0 0 43167 57173 100340
34 Uttrakhand 346 165 176 165 341 0 0 0 14598 18212 32810
35 West Bengal 857 368 25 11 36 0 0 0 12897 8577 21474
32974 16499 4003 3945 7948 1539 2266 3805 468774 439858 908632All India
Sl
NoState
Number of Colleges Ph.D. M.Phil. Post Graduate
AISHE 2010-11 T-16
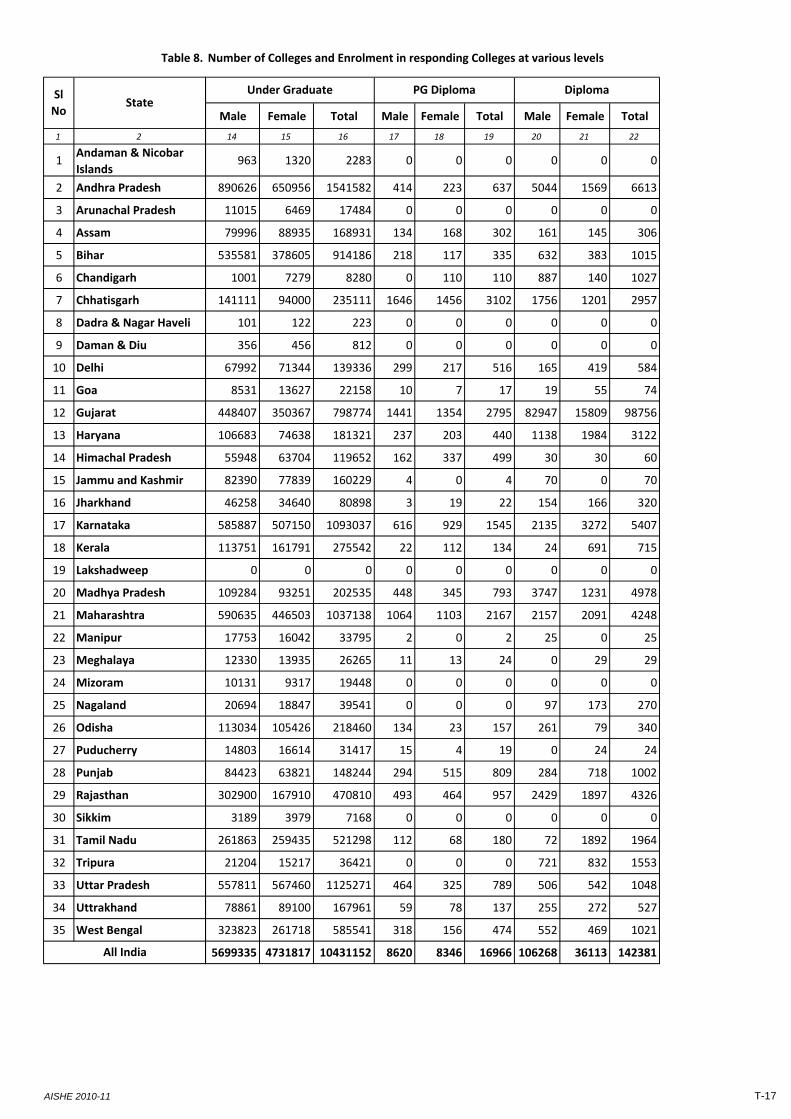
Table 8.
1 2
1Andaman & Nicobar
Islands
2 Andhra Pradesh
3 Arunachal Pradesh
4 Assam
5 Bihar
6 Chandigarh
7 Chhatisgarh
8 Dadra & Nagar Haveli
9 Daman & Diu
10 Delhi
11 Goa
12 Gujarat
13 Haryana
14 Himachal Pradesh
15 Jammu and Kashmir
16 Jharkhand
17 Karnataka
18 Kerala
19 Lakshadweep
20 Madhya Pradesh
21 Maharashtra
22 Manipur
23 Meghalaya
24 Mizoram
25 Nagaland
26 Odisha
27 Puducherry
28 Punjab
29 Rajasthan
30 Sikkim
31 Tamil Nadu
32 Tripura
33 Uttar Pradesh
34 Uttrakhand
35 West Bengal
All India
Sl
NoState
Number of Colleges and Enrolment in responding Colleges at various levels
Male Female Total Male Female Total Male Female Total
14 15 16 17 18 19 20 21 22
963 1320 2283 0 0 0 0 0 0
890626 650956 1541582 414 223 637 5044 1569 6613
11015 6469 17484 0 0 0 0 0 0
79996 88935 168931 134 168 302 161 145 306
535581 378605 914186 218 117 335 632 383 1015
1001 7279 8280 0 110 110 887 140 1027
141111 94000 235111 1646 1456 3102 1756 1201 2957
101 122 223 0 0 0 0 0 0
356 456 812 0 0 0 0 0 0
67992 71344 139336 299 217 516 165 419 584
8531 13627 22158 10 7 17 19 55 74
448407 350367 798774 1441 1354 2795 82947 15809 98756
106683 74638 181321 237 203 440 1138 1984 3122
55948 63704 119652 162 337 499 30 30 60
82390 77839 160229 4 0 4 70 0 70
46258 34640 80898 3 19 22 154 166 320
585887 507150 1093037 616 929 1545 2135 3272 5407
113751 161791 275542 22 112 134 24 691 715
0 0 0 0 0 0 0 0 0
109284 93251 202535 448 345 793 3747 1231 4978
590635 446503 1037138 1064 1103 2167 2157 2091 4248
17753 16042 33795 2 0 2 25 0 25
12330 13935 26265 11 13 24 0 29 29
10131 9317 19448 0 0 0 0 0 0
20694 18847 39541 0 0 0 97 173 270
113034 105426 218460 134 23 157 261 79 340
14803 16614 31417 15 4 19 0 24 24
84423 63821 148244 294 515 809 284 718 1002
302900 167910 470810 493 464 957 2429 1897 4326
3189 3979 7168 0 0 0 0 0 0
261863 259435 521298 112 68 180 72 1892 1964
21204 15217 36421 0 0 0 721 832 1553
557811 567460 1125271 464 325 789 506 542 1048
78861 89100 167961 59 78 137 255 272 527
323823 261718 585541 318 156 474 552 469 1021
5699335 4731817 10431152 8620 8346 16966 106268 36113 142381
Under Graduate PG Diploma Diploma
AISHE 2010-11 T-17
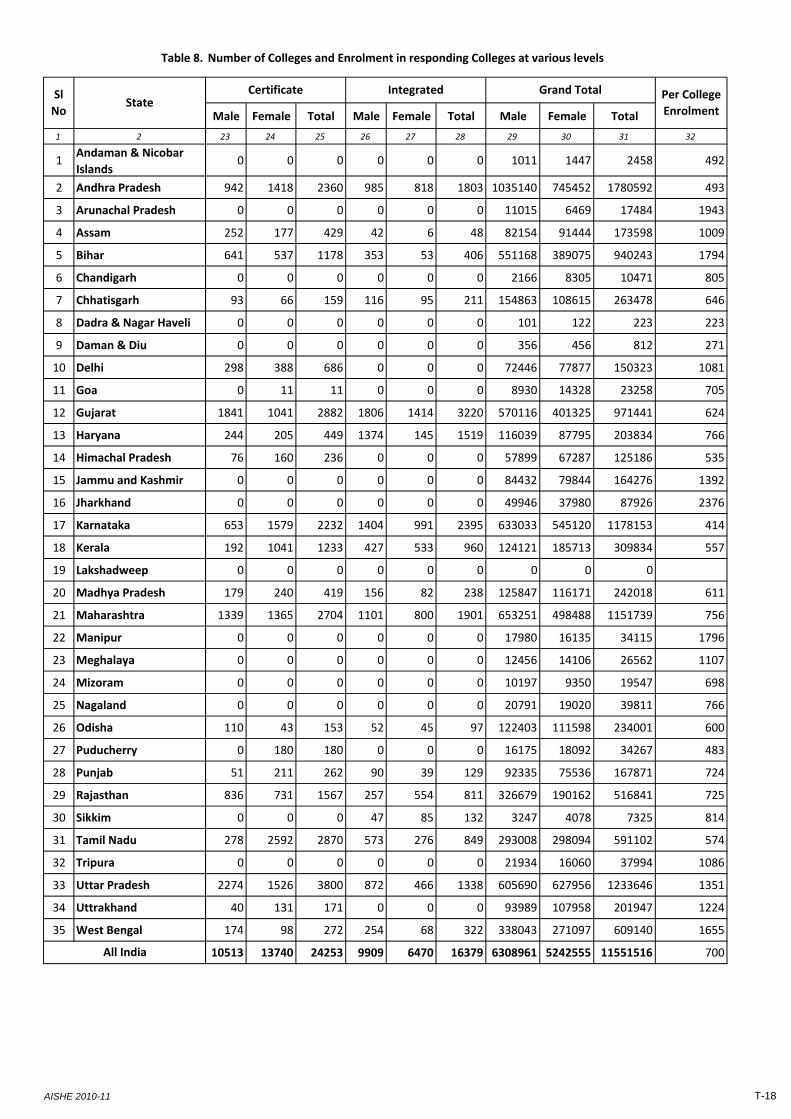
Table 8.
1 2
1Andaman & Nicobar
Islands
2 Andhra Pradesh
3 Arunachal Pradesh
4 Assam
5 Bihar
6 Chandigarh
7 Chhatisgarh
8 Dadra & Nagar Haveli
9 Daman & Diu
10 Delhi
11 Goa
12 Gujarat
13 Haryana
14 Himachal Pradesh
15 Jammu and Kashmir
16 Jharkhand
17 Karnataka
18 Kerala
19 Lakshadweep
20 Madhya Pradesh
21 Maharashtra
22 Manipur
23 Meghalaya
24 Mizoram
25 Nagaland
26 Odisha
27 Puducherry
28 Punjab
29 Rajasthan
30 Sikkim
31 Tamil Nadu
32 Tripura
33 Uttar Pradesh
34 Uttrakhand
35 West Bengal
All India
Sl
NoState
Number of Colleges and Enrolment in responding Colleges at various levels
Male Female Total Male Female Total Male Female Total
23 24 25 26 27 28 29 30 31 32
0 0 0 0 0 0 1011 1447 2458 492
942 1418 2360 985 818 1803 1035140 745452 1780592 493
0 0 0 0 0 0 11015 6469 17484 1943
252 177 429 42 6 48 82154 91444 173598 1009
641 537 1178 353 53 406 551168 389075 940243 1794
0 0 0 0 0 0 2166 8305 10471 805
93 66 159 116 95 211 154863 108615 263478 646
0 0 0 0 0 0 101 122 223 223
0 0 0 0 0 0 356 456 812 271
298 388 686 0 0 0 72446 77877 150323 1081
0 11 11 0 0 0 8930 14328 23258 705
1841 1041 2882 1806 1414 3220 570116 401325 971441 624
244 205 449 1374 145 1519 116039 87795 203834 766
76 160 236 0 0 0 57899 67287 125186 535
0 0 0 0 0 0 84432 79844 164276 1392
0 0 0 0 0 0 49946 37980 87926 2376
653 1579 2232 1404 991 2395 633033 545120 1178153 414
192 1041 1233 427 533 960 124121 185713 309834 557
0 0 0 0 0 0 0 0 0
179 240 419 156 82 238 125847 116171 242018 611
1339 1365 2704 1101 800 1901 653251 498488 1151739 756
0 0 0 0 0 0 17980 16135 34115 1796
0 0 0 0 0 0 12456 14106 26562 1107
0 0 0 0 0 0 10197 9350 19547 698
0 0 0 0 0 0 20791 19020 39811 766
110 43 153 52 45 97 122403 111598 234001 600
0 180 180 0 0 0 16175 18092 34267 483
51 211 262 90 39 129 92335 75536 167871 724
836 731 1567 257 554 811 326679 190162 516841 725
0 0 0 47 85 132 3247 4078 7325 814
278 2592 2870 573 276 849 293008 298094 591102 574
0 0 0 0 0 0 21934 16060 37994 1086
2274 1526 3800 872 466 1338 605690 627956 1233646 1351
40 131 171 0 0 0 93989 107958 201947 1224
174 98 272 254 68 322 338043 271097 609140 1655
10513 13740 24253 9909 6470 16379 6308961 5242555 11551516 700
Per College
Enrolment
Certificate Integrated Grand Total
AISHE 2010-11 T-18
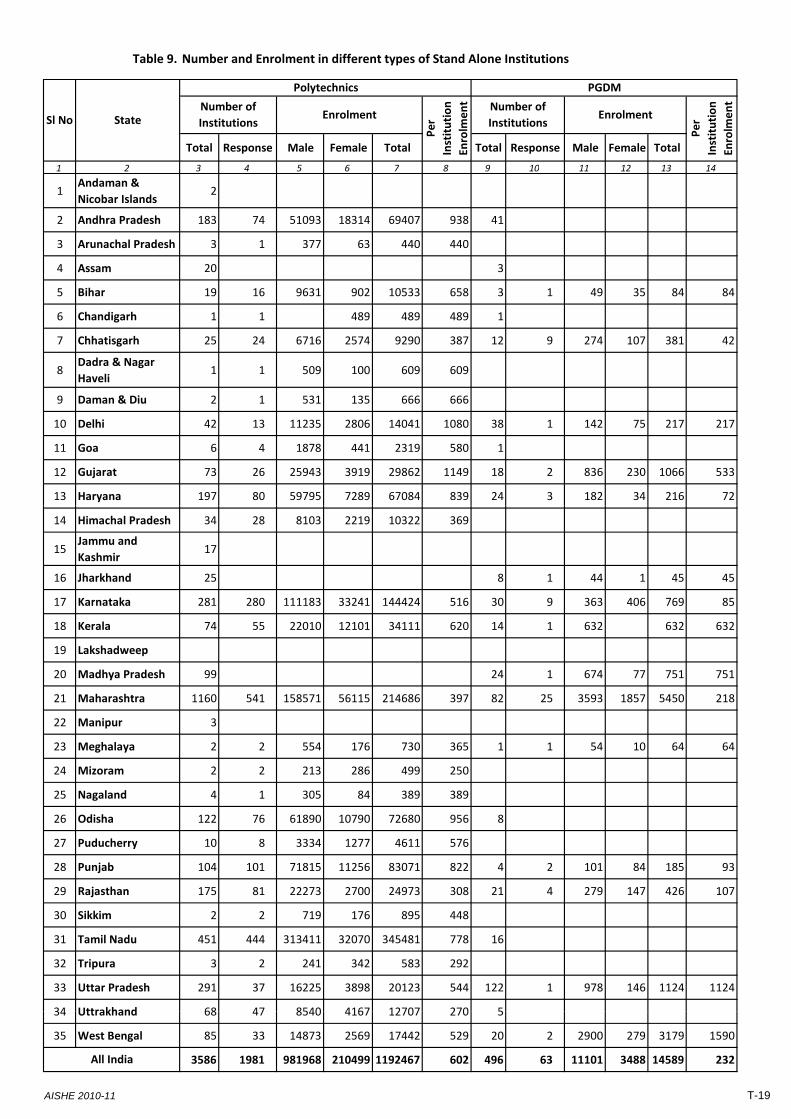
Table 9. Number and Enrolment in different types of Stand Alone Institutions
Total Response Male Female Total Total Response Male Female Total
1 2 3 4 5 6 7 8 9 10 11 12 13 14
1Andaman &
Nicobar Islands2
2 Andhra Pradesh 183 74 51093 18314 69407 938 41
3 Arunachal Pradesh 3 1 377 63 440 440
4 Assam 20 3
5 Bihar 19 16 9631 902 10533 658 3 1 49 35 84 84
6 Chandigarh 1 1 489 489 489 1
7 Chhatisgarh 25 24 6716 2574 9290 387 12 9 274 107 381 42
8Dadra & Nagar
Haveli1 1 509 100 609 609
9 Daman & Diu 2 1 531 135 666 666
10 Delhi 42 13 11235 2806 14041 1080 38 1 142 75 217 217
11 Goa 6 4 1878 441 2319 580 1
12 Gujarat 73 26 25943 3919 29862 1149 18 2 836 230 1066 533
13 Haryana 197 80 59795 7289 67084 839 24 3 182 34 216 72
Polytechnics PGDM
Number of
InstitutionsEnrolment
Per
Institution
Enrolm
ent Number of
InstitutionsEnrolment
Per
Institution
Enrolm
ent
Sl No State
14 Himachal Pradesh 34 28 8103 2219 10322 369
15Jammu and
Kashmir17
16 Jharkhand 25 8 1 44 1 45 45
17 Karnataka 281 280 111183 33241 144424 516 30 9 363 406 769 85
18 Kerala 74 55 22010 12101 34111 620 14 1 632 632 632
19 Lakshadweep
20 Madhya Pradesh 99 24 1 674 77 751 751
21 Maharashtra 1160 541 158571 56115 214686 397 82 25 3593 1857 5450 218
22 Manipur 3
23 Meghalaya 2 2 554 176 730 365 1 1 54 10 64 64
24 Mizoram 2 2 213 286 499 250
25 Nagaland 4 1 305 84 389 389
26 Odisha 122 76 61890 10790 72680 956 8
27 Puducherry 10 8 3334 1277 4611 576
28 Punjab 104 101 71815 11256 83071 822 4 2 101 84 185 93
29 Rajasthan 175 81 22273 2700 24973 308 21 4 279 147 426 107
30 Sikkim 2 2 719 176 895 448
31 Tamil Nadu 451 444 313411 32070 345481 778 16
32 Tripura 3 2 241 342 583 292
33 Uttar Pradesh 291 37 16225 3898 20123 544 122 1 978 146 1124 1124
34 Uttrakhand 68 47 8540 4167 12707 270 534 Uttrakhand 68 47 8540 4167 12707 270 5
35 West Bengal 85 33 14873 2569 17442 529 20 2 2900 279 3179 1590
3586 1981 981968 210499 1192467 602 496 63 11101 3488 14589 232All India
AISHE 2010-11 T-19
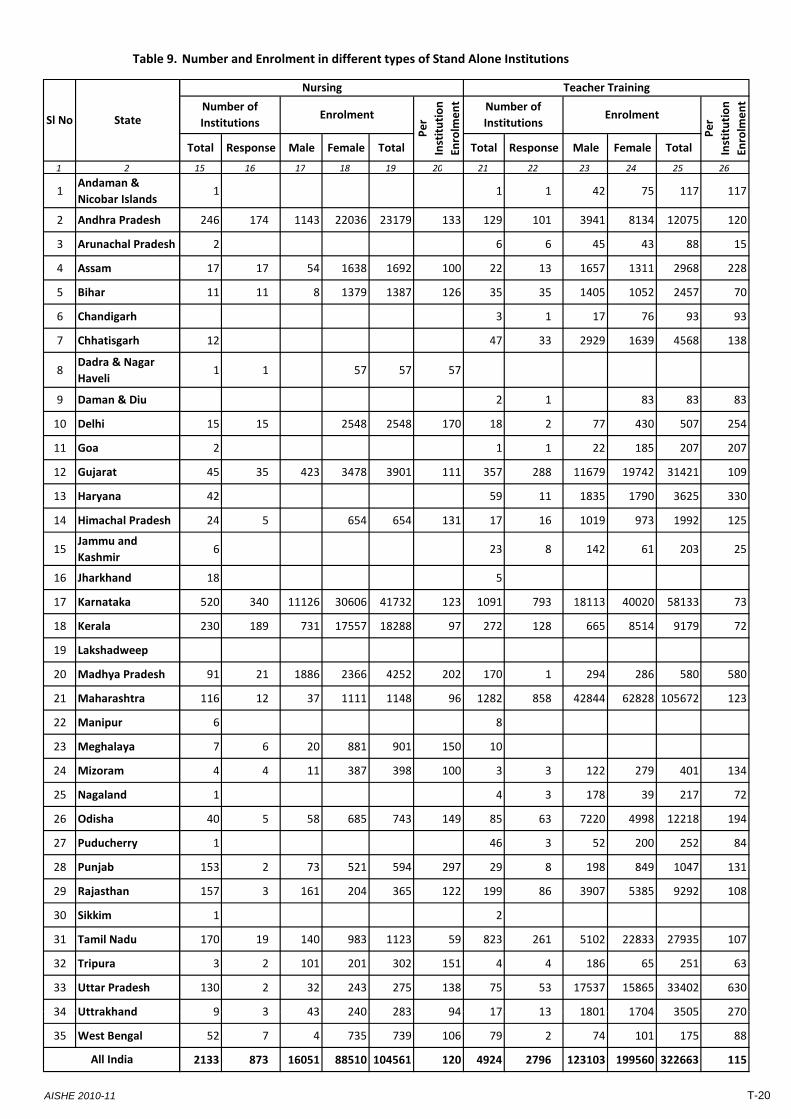
Table 9.
1 2
1Andaman &
Nicobar Islands
2 Andhra Pradesh
3 Arunachal Pradesh
4 Assam
5 Bihar
6 Chandigarh
7 Chhatisgarh
8Dadra & Nagar
Haveli
9 Daman & Diu
10 Delhi
11 Goa
12 Gujarat
13 Haryana
Sl No State
Number and Enrolment in different types of Stand Alone Institutions
Total Response Male Female Total Total Response Male Female Total
15 16 17 18 19 20 21 22 23 24 25 26
1 1 1 42 75 117 117
246 174 1143 22036 23179 133 129 101 3941 8134 12075 120
2 6 6 45 43 88 15
17 17 54 1638 1692 100 22 13 1657 1311 2968 228
11 11 8 1379 1387 126 35 35 1405 1052 2457 70
3 1 17 76 93 93
12 47 33 2929 1639 4568 138
1 1 57 57 57
2 1 83 83 83
15 15 2548 2548 170 18 2 77 430 507 254
2 1 1 22 185 207 207
45 35 423 3478 3901 111 357 288 11679 19742 31421 109
42 59 11 1835 1790 3625 330
Nursing Teacher Training
Number of
InstitutionsEnrolment
Per
Institution
Enrolm
entNumber of
InstitutionsEnrolment
Per
Institution
Enrolm
ent
14 Himachal Pradesh
15Jammu and
Kashmir
16 Jharkhand
17 Karnataka
18 Kerala
19 Lakshadweep
20 Madhya Pradesh
21 Maharashtra
22 Manipur
23 Meghalaya
24 Mizoram
25 Nagaland
26 Odisha
27 Puducherry
28 Punjab
29 Rajasthan
30 Sikkim
31 Tamil Nadu
32 Tripura
33 Uttar Pradesh
34 Uttrakhand
24 5 654 654 131 17 16 1019 973 1992 125
6 23 8 142 61 203 25
18 5
520 340 11126 30606 41732 123 1091 793 18113 40020 58133 73
230 189 731 17557 18288 97 272 128 665 8514 9179 72
91 21 1886 2366 4252 202 170 1 294 286 580 580
116 12 37 1111 1148 96 1282 858 42844 62828 105672 123
6 8
7 6 20 881 901 150 10
4 4 11 387 398 100 3 3 122 279 401 134
1 4 3 178 39 217 72
40 5 58 685 743 149 85 63 7220 4998 12218 194
1 46 3 52 200 252 84
153 2 73 521 594 297 29 8 198 849 1047 131
157 3 161 204 365 122 199 86 3907 5385 9292 108
1 2
170 19 140 983 1123 59 823 261 5102 22833 27935 107
3 2 101 201 302 151 4 4 186 65 251 63
130 2 32 243 275 138 75 53 17537 15865 33402 630
9 3 43 240 283 94 17 13 1801 1704 3505 27034 Uttrakhand
35 West Bengal
All India
9 3 43 240 283 94 17 13 1801 1704 3505 270
52 7 4 735 739 106 79 2 74 101 175 88
2133 873 16051 88510 104561 120 4924 2796 123103 199560 322663 115
AISHE 2010-11 T-20
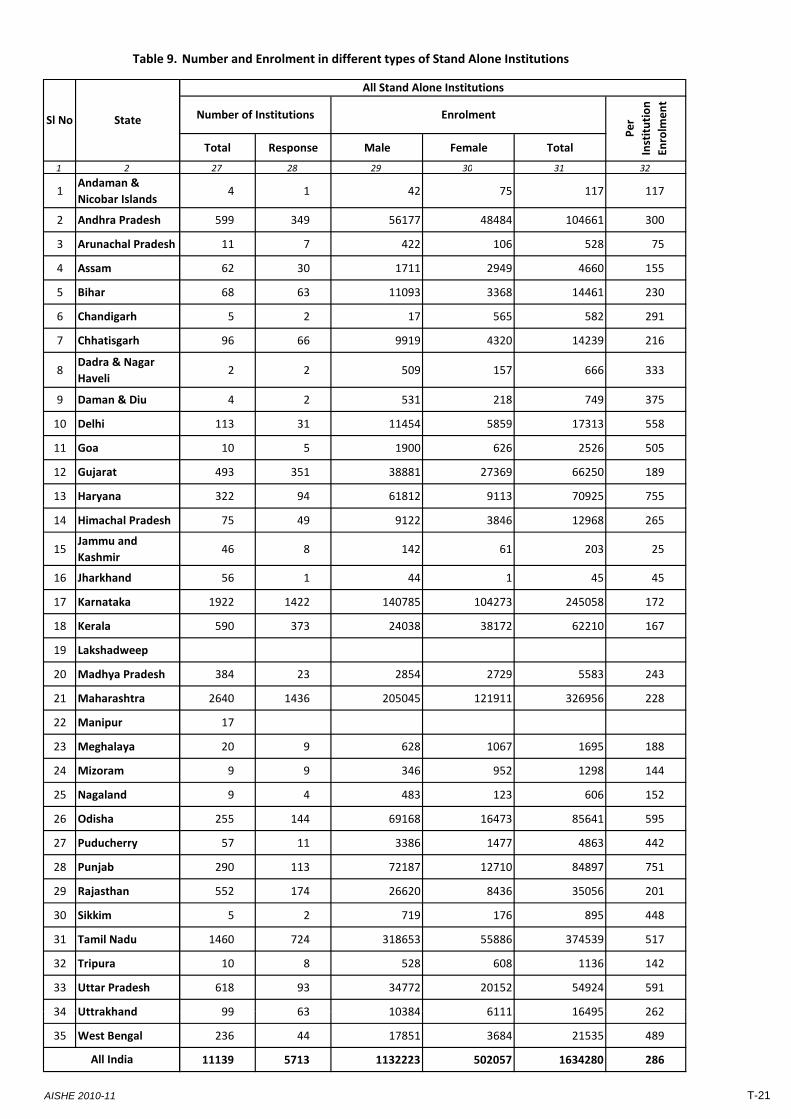
Table 9.
1 2
1Andaman &
Nicobar Islands
2 Andhra Pradesh
3 Arunachal Pradesh
4 Assam
5 Bihar
6 Chandigarh
7 Chhatisgarh
8Dadra & Nagar
Haveli
9 Daman & Diu
10 Delhi
11 Goa
12 Gujarat
13 Haryana
Sl No State
Number and Enrolment in different types of Stand Alone Institutions
Total Response Male Female Total
27 28 29 30 31 32
4 1 42 75 117 117
599 349 56177 48484 104661 300
11 7 422 106 528 75
62 30 1711 2949 4660 155
68 63 11093 3368 14461 230
5 2 17 565 582 291
96 66 9919 4320 14239 216
2 2 509 157 666 333
4 2 531 218 749 375
113 31 11454 5859 17313 558
10 5 1900 626 2526 505
493 351 38881 27369 66250 189
322 94 61812 9113 70925 755
Number of Institutions Enrolment
Per
Institution
Enrolm
ent
All Stand Alone Institutions
14 Himachal Pradesh
15Jammu and
Kashmir
16 Jharkhand
17 Karnataka
18 Kerala
19 Lakshadweep
20 Madhya Pradesh
21 Maharashtra
22 Manipur
23 Meghalaya
24 Mizoram
25 Nagaland
26 Odisha
27 Puducherry
28 Punjab
29 Rajasthan
30 Sikkim
31 Tamil Nadu
32 Tripura
33 Uttar Pradesh
34 Uttrakhand
75 49 9122 3846 12968 265
46 8 142 61 203 25
56 1 44 1 45 45
1922 1422 140785 104273 245058 172
590 373 24038 38172 62210 167
384 23 2854 2729 5583 243
2640 1436 205045 121911 326956 228
17
20 9 628 1067 1695 188
9 9 346 952 1298 144
9 4 483 123 606 152
255 144 69168 16473 85641 595
57 11 3386 1477 4863 442
290 113 72187 12710 84897 751
552 174 26620 8436 35056 201
5 2 719 176 895 448
1460 724 318653 55886 374539 517
10 8 528 608 1136 142
618 93 34772 20152 54924 591
99 63 10384 6111 16495 26234 Uttrakhand
35 West Bengal
All India
99 63 10384 6111 16495 262
236 44 17851 3684 21535 489
11139 5713 1132223 502057 1634280 286
AISHE 2010-11 T-21
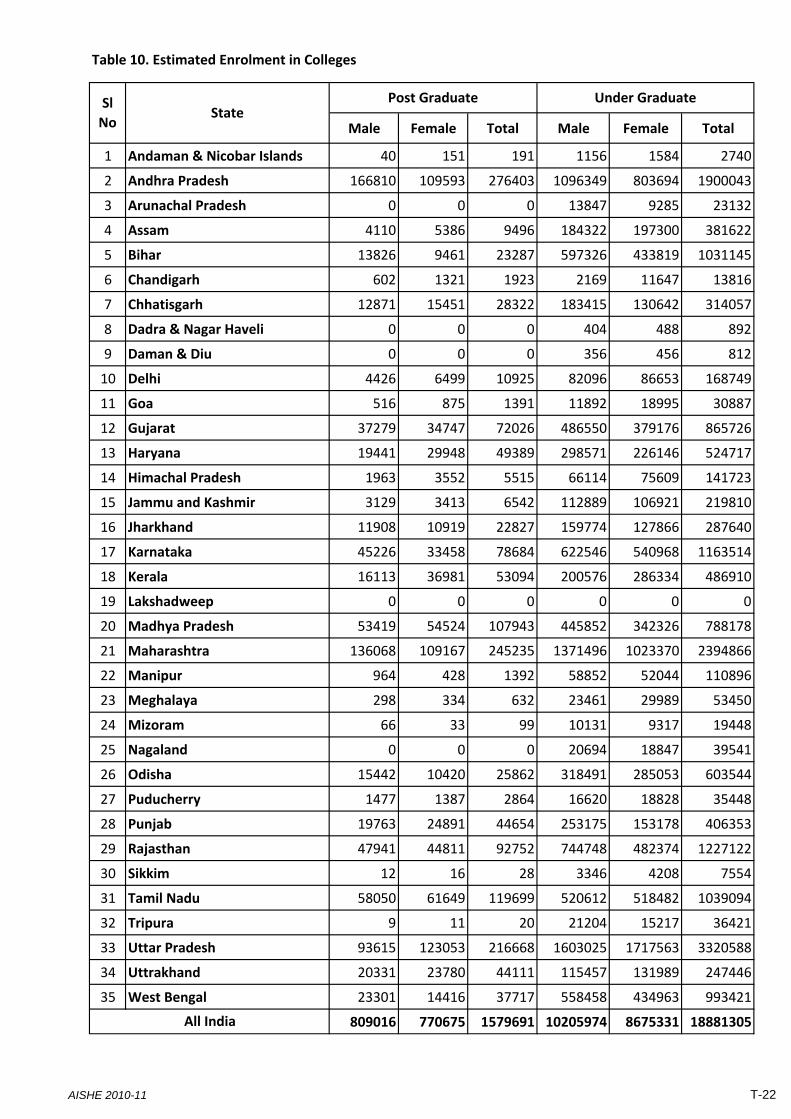
Table 10. Estimated Enrolment in Colleges
Male Female Total Male Female Total
1 Andaman & Nicobar Islands 40 151 191 1156 1584 2740
2 Andhra Pradesh 166810 109593 276403 1096349 803694 1900043
3 Arunachal Pradesh 0 0 0 13847 9285 23132
4 Assam 4110 5386 9496 184322 197300 381622
5 Bihar 13826 9461 23287 597326 433819 1031145
6 Chandigarh 602 1321 1923 2169 11647 13816
7 Chhatisgarh 12871 15451 28322 183415 130642 314057
8 Dadra & Nagar Haveli 0 0 0 404 488 892
9 Daman & Diu 0 0 0 356 456 812
10 Delhi 4426 6499 10925 82096 86653 168749
11 Goa 516 875 1391 11892 18995 30887
12 Gujarat 37279 34747 72026 486550 379176 865726
13 Haryana 19441 29948 49389 298571 226146 524717
14 Himachal Pradesh 1963 3552 5515 66114 75609 141723
15 Jammu and Kashmir 3129 3413 6542 112889 106921 219810
16 Jharkhand 11908 10919 22827 159774 127866 287640
17 Karnataka 45226 33458 78684 622546 540968 1163514
18 Kerala 16113 36981 53094 200576 286334 486910
19 Lakshadweep 0 0 0 0 0 0
20 Madhya Pradesh 53419 54524 107943 445852 342326 788178
21 Maharashtra 136068 109167 245235 1371496 1023370 2394866
22 Manipur 964 428 1392 58852 52044 110896
23 Meghalaya 298 334 632 23461 29989 53450
24 Mizoram 66 33 99 10131 9317 19448
25 Nagaland 0 0 0 20694 18847 39541
26 Odisha 15442 10420 25862 318491 285053 603544
27 Puducherry 1477 1387 2864 16620 18828 35448
28 Punjab 19763 24891 44654 253175 153178 406353
29 Rajasthan 47941 44811 92752 744748 482374 1227122
30 Sikkim 12 16 28 3346 4208 7554
31 Tamil Nadu 58050 61649 119699 520612 518482 1039094
32 Tripura 9 11 20 21204 15217 36421
33 Uttar Pradesh 93615 123053 216668 1603025 1717563 3320588
34 Uttrakhand 20331 23780 44111 115457 131989 247446
35 West Bengal 23301 14416 37717 558458 434963 993421
809016 770675 1579691 10205974 8675331 18881305
Sl
NoState
Post Graduate Under Graduate
All India
AISHE 2010-11 T-22
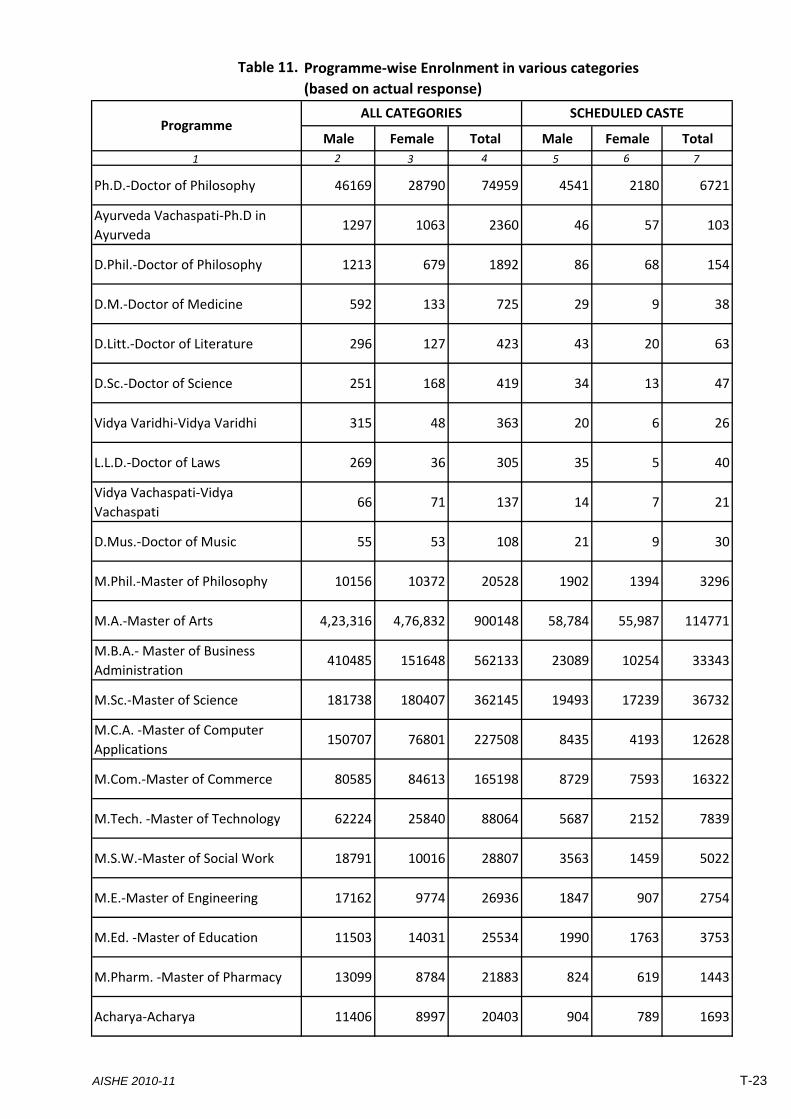
Table 11.
Male Female Total Male Female Total
1 2 3 4 5 6 7
Ph.D.‐Doctor of Philosophy 46169 28790 74959 4541 2180 6721
Ayurveda Vachaspati‐Ph.D in
Ayurveda1297 1063 2360 46 57 103
D.Phil.‐Doctor of Philosophy 1213 679 1892 86 68 154
D.M.‐Doctor of Medicine 592 133 725 29 9 38
D.Litt.‐Doctor of Literature 296 127 423 43 20 63
D.Sc.‐Doctor of Science 251 168 419 34 13 47
Vidya Varidhi‐Vidya Varidhi 315 48 363 20 6 26
L.L.D.‐Doctor of Laws 269 36 305 35 5 40
Vidya Vachaspati‐Vidya
Vachaspati66 71 137 14 7 21
D.Mus.‐Doctor of Music 55 53 108 21 9 30
M.Phil.‐Master of Philosophy 10156 10372 20528 1902 1394 3296
M.A.‐Master of Arts 4,23,316 4,76,832 900148 58,784 55,987 114771
M.B.A.‐ Master of Business
Administration410485 151648 562133 23089 10254 33343
M.Sc.‐Master of Science 181738 180407 362145 19493 17239 36732
M.C.A. ‐Master of Computer
Applications150707 76801 227508 8435 4193 12628
M.Com.‐Master of Commerce 80585 84613 165198 8729 7593 16322
M.Tech. ‐Master of Technology 62224 25840 88064 5687 2152 7839
M.S.W.‐Master of Social Work 18791 10016 28807 3563 1459 5022
M.E.‐Master of Engineering 17162 9774 26936 1847 907 2754
M.Ed. ‐Master of Education 11503 14031 25534 1990 1763 3753
M.Pharm. ‐Master of Pharmacy 13099 8784 21883 824 619 1443
Acharya‐Acharya 11406 8997 20403 904 789 1693
Programme‐wise Enrolnment in various categories
(based on actual response)
ProgrammeALL CATEGORIES SCHEDULED CASTE
AISHE 2010-11 T-23

Table 11.
1
Ph.D.‐Doctor of Philosophy
Ayurveda Vachaspati‐Ph.D in
Ayurveda
D.Phil.‐Doctor of Philosophy
D.M.‐Doctor of Medicine
D.Litt.‐Doctor of Literature
D.Sc.‐Doctor of Science
Vidya Varidhi‐Vidya Varidhi
L.L.D.‐Doctor of Laws
Vidya Vachaspati‐Vidya
Vachaspati
D.Mus.‐Doctor of Music
M.Phil.‐Master of Philosophy
M.A.‐Master of Arts
M.B.A.‐ Master of Business
Administration
M.Sc.‐Master of Science
M.C.A. ‐Master of Computer
Applications
M.Com.‐Master of Commerce
M.Tech. ‐Master of Technology
M.S.W.‐Master of Social Work
M.E.‐Master of Engineering
M.Ed. ‐Master of Education
M.Pharm. ‐Master of Pharmacy
Acharya‐Acharya
ProgrammeMale Female Total Male Female Total
8 9 10 11 12 13
1527 957 2484 7117 4662 11779
41 59 100 152 180 332
6 0 6 142 79 221
10 4 14 51 17 68
3 5 8 109 43 152
6 4 10 52 21 73
0 0 0 19 4 23
0 2 2 100 4 104
9 10 19 9 14 23
5 1 6 24 8 32
373 339 712 2456 2741 5197
26,481 22,978 49459 95,833 1,12,797 208630
7115 2381 9496 76847 34735 111582
6263 4942 11205 45015 51776 96791
1805 732 2537 34769 20301 55070
2606 2066 4672 19042 20212 39254
2019 694 2713 14249 5951 20200
1646 824 2470 4365 2327 6692
385 93 478 6849 4816 11665
546 453 999 3429 4566 7995
254 152 406 2517 1778 4295
215 153 368 1819 2326 4145
Programme‐wise Enrolnment in various categories
(based on actual response)
SCHEDULED TRIBE OTHER BACKWARD CLASSES
AISHE 2010-11 T-24

Table 11.
Male Female Total Male Female Total
1 2 3 4 5 6 7
Programme‐wise Enrolnment in various categories
(based on actual response)
ProgrammeALL CATEGORIES SCHEDULED CASTE
L.L.M.‐Master of Law or Laws 9966 5836 15802 1243 628 1871
M.D. ‐Doctor of Medicine 9717 5939 15656 577 450 1027
M.S.‐Master of Science 5651 7747 13398 290 224 514
M.Mgt.‐Master of Management 7981 3351 11332 537 213 750
M.B.A.(Tech.)‐Master of Business
Administration in Technology4811 2466 7277 365 179 544
M.Sc. Nursing‐Master of Science
in Nursing1936 4567 6503 39 239 278
M.Lib.Sc. ‐Master of Library
Science2702 3155 5857 358 283 641
M.L.I.Sc.‐Master of Library &
Information Science2953 2797 5750 267 229 496
M.D.S.‐Master of Dental Surgery 3093 2653 5746 97 58 155
M.Sc. Tech. ‐Master of Science in
Technology3029 2029 5058 255 126 381
M.P.Ed.‐Master of Physical
Education2636 981 3617 554 138 692
M.S.‐Master of Surgery 2423 1009 3432 134 52 186
M.J.M.C.‐Master of Journalism
and Mass Communication1860 1300 3160 238 72 310
M.H.R.D. ‐Master of Human
Resource Development1681 1346 3027 156 84 240
M.F.M. ‐Master of Financial
Management1953 1022 2975 112 52 164
M.P.T.‐Master of Physiotherapy 954 1308 2262 61 89 150
M.F.A. ‐Master of Fine Arts 1183 956 2139 208 88 296
M.V.Sc. ‐Master of Veterinary
Sciences1564 475 2039 107 55 162
M.Mkt.M. ‐Master of Marketing
Management1311 507 1818 56 34 90
M.J.‐Master of Journalism 1304 469 1773 169 70 239
M.Arch.‐Master of Architecture 866 816 1682 56 49 105
M.M.C.‐Master in Mass
Communication741 673 1414 22 18 40
AISHE 2010-11 T-25
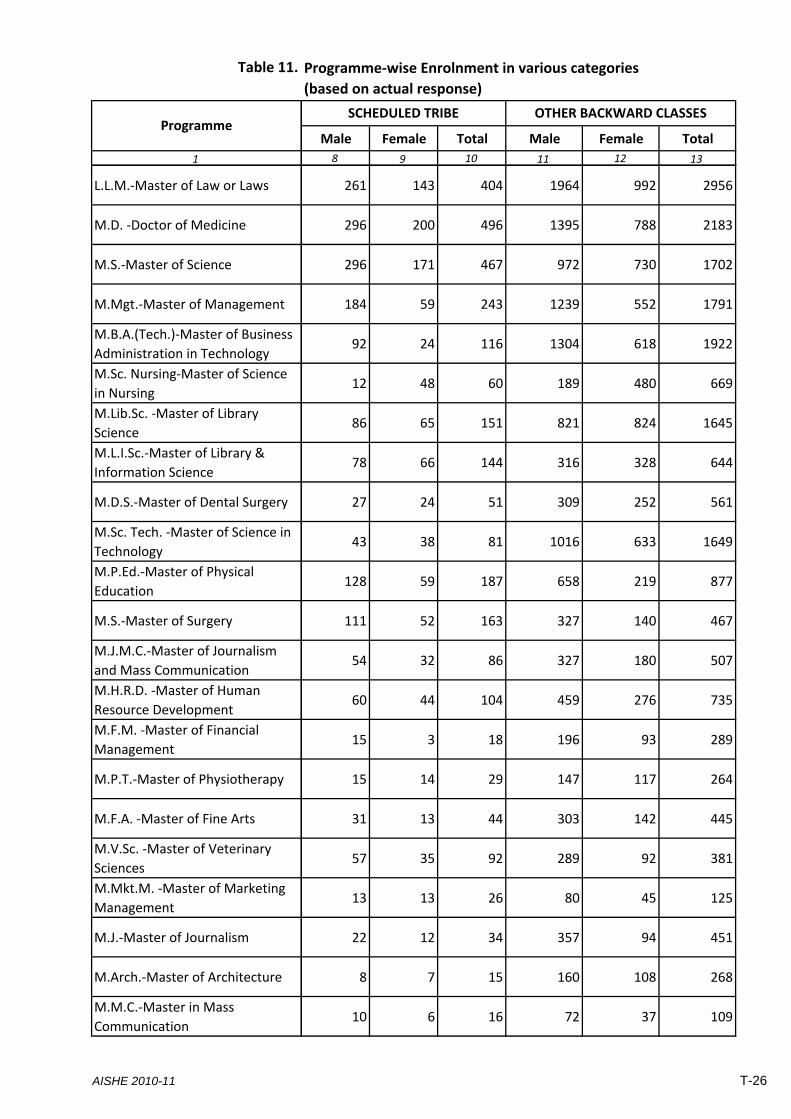
Table 11.
1
Programme
L.L.M.‐Master of Law or Laws
M.D. ‐Doctor of Medicine
M.S.‐Master of Science
M.Mgt.‐Master of Management
M.B.A.(Tech.)‐Master of Business
Administration in Technology
M.Sc. Nursing‐Master of Science
in Nursing
M.Lib.Sc. ‐Master of Library
Science
M.L.I.Sc.‐Master of Library &
Information Science
M.D.S.‐Master of Dental Surgery
M.Sc. Tech. ‐Master of Science in
Technology
M.P.Ed.‐Master of Physical
Education
M.S.‐Master of Surgery
M.J.M.C.‐Master of Journalism
and Mass Communication
M.H.R.D. ‐Master of Human
Resource Development
M.F.M. ‐Master of Financial
Management
M.P.T.‐Master of Physiotherapy
M.F.A. ‐Master of Fine Arts
M.V.Sc. ‐Master of Veterinary
Sciences
M.Mkt.M. ‐Master of Marketing
Management
M.J.‐Master of Journalism
M.Arch.‐Master of Architecture
M.M.C.‐Master in Mass
Communication
Male Female Total Male Female Total
8 9 10 11 12 13
Programme‐wise Enrolnment in various categories
(based on actual response)
SCHEDULED TRIBE OTHER BACKWARD CLASSES
261 143 404 1964 992 2956
296 200 496 1395 788 2183
296 171 467 972 730 1702
184 59 243 1239 552 1791
92 24 116 1304 618 1922
12 48 60 189 480 669
86 65 151 821 824 1645
78 66 144 316 328 644
27 24 51 309 252 561
43 38 81 1016 633 1649
128 59 187 658 219 877
111 52 163 327 140 467
54 32 86 327 180 507
60 44 104 459 276 735
15 3 18 196 93 289
15 14 29 147 117 264
31 13 44 303 142 445
57 35 92 289 92 381
13 13 26 80 45 125
22 12 34 357 94 451
8 7 15 160 108 268
10 6 16 72 37 109
AISHE 2010-11 T-26
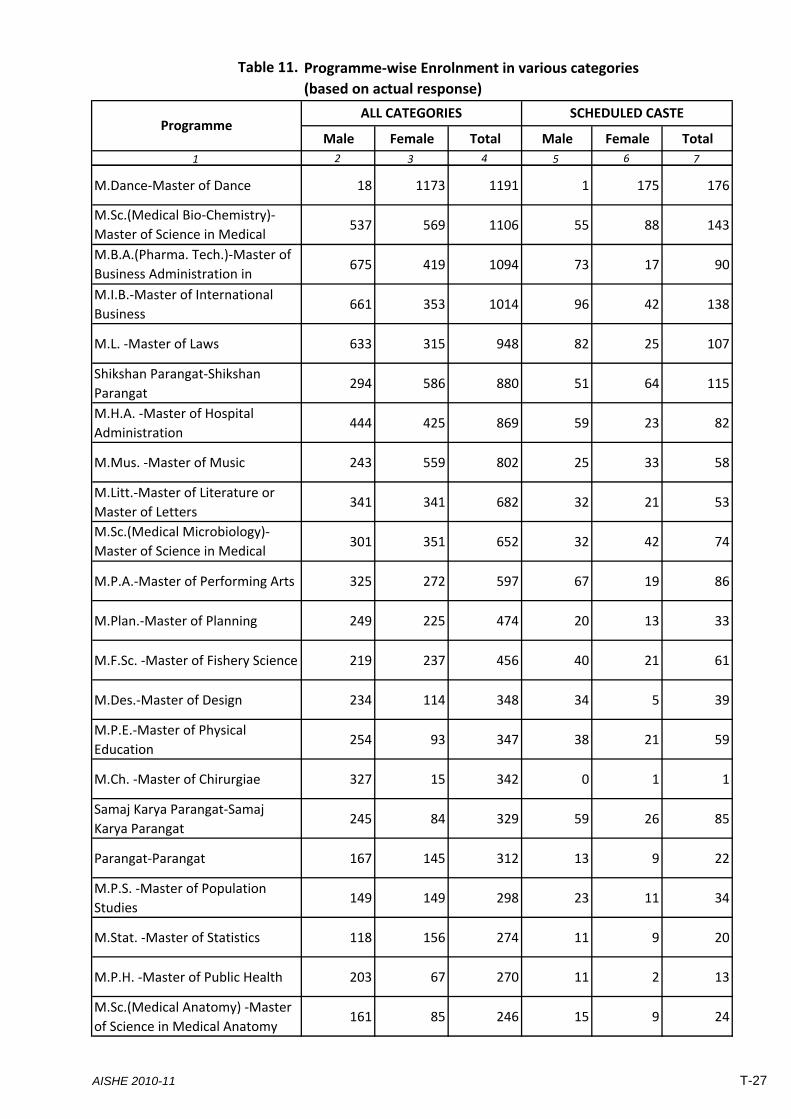
Table 11.
Male Female Total Male Female Total
1 2 3 4 5 6 7
Programme‐wise Enrolnment in various categories
(based on actual response)
ProgrammeALL CATEGORIES SCHEDULED CASTE
M.Dance‐Master of Dance 18 1173 1191 1 175 176
M.Sc.(Medical Bio‐Chemistry)‐
Master of Science in Medical 537 569 1106 55 88 143
M.B.A.(Pharma. Tech.)‐Master of
Business Administration in 675 419 1094 73 17 90
M.I.B.‐Master of International
Business661 353 1014 96 42 138
M.L. ‐Master of Laws 633 315 948 82 25 107
Shikshan Parangat‐Shikshan
Parangat294 586 880 51 64 115
M.H.A. ‐Master of Hospital
Administration444 425 869 59 23 82
M.Mus. ‐Master of Music 243 559 802 25 33 58
M.Litt.‐Master of Literature or
Master of Letters341 341 682 32 21 53
M.Sc.(Medical Microbiology)‐
Master of Science in Medical 301 351 652 32 42 74
M.P.A.‐Master of Performing Arts 325 272 597 67 19 86
M.Plan.‐Master of Planning 249 225 474 20 13 33
M.F.Sc. ‐Master of Fishery Science 219 237 456 40 21 61
M.Des.‐Master of Design 234 114 348 34 5 39
M.P.E.‐Master of Physical
Education254 93 347 38 21 59
M.Ch. ‐Master of Chirurgiae 327 15 342 0 1 1
Samaj Karya Parangat‐Samaj
Karya Parangat245 84 329 59 26 85
Parangat‐Parangat 167 145 312 13 9 22
M.P.S. ‐Master of Population
Studies149 149 298 23 11 34
M.Stat. ‐Master of Statistics 118 156 274 11 9 20
M.P.H. ‐Master of Public Health 203 67 270 11 2 13
M.Sc.(Medical Anatomy) ‐Master
of Science in Medical Anatomy161 85 246 15 9 24
AISHE 2010-11 T-27
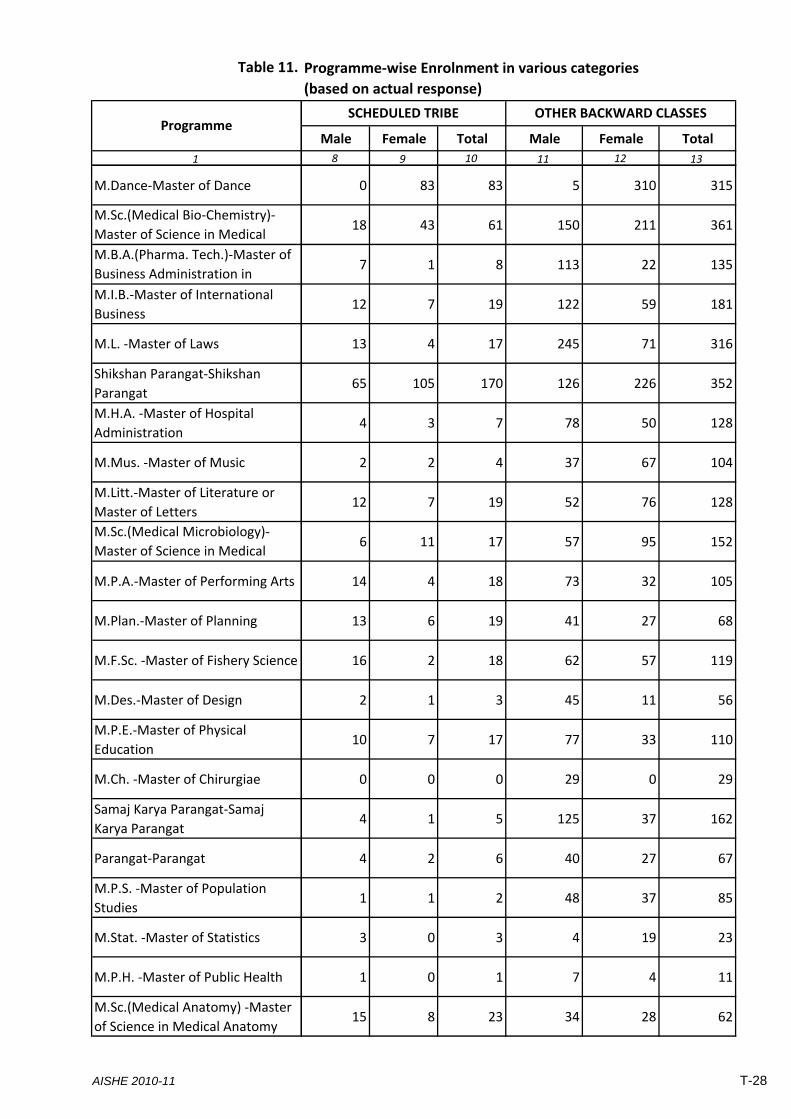
Table 11.
1
Programme
M.Dance‐Master of Dance
M.Sc.(Medical Bio‐Chemistry)‐
Master of Science in Medical
M.B.A.(Pharma. Tech.)‐Master of
Business Administration in
M.I.B.‐Master of International
Business
M.L. ‐Master of Laws
Shikshan Parangat‐Shikshan
Parangat
M.H.A. ‐Master of Hospital
Administration
M.Mus. ‐Master of Music
M.Litt.‐Master of Literature or
Master of Letters
M.Sc.(Medical Microbiology)‐
Master of Science in Medical
M.P.A.‐Master of Performing Arts
M.Plan.‐Master of Planning
M.F.Sc. ‐Master of Fishery Science
M.Des.‐Master of Design
M.P.E.‐Master of Physical
Education
M.Ch. ‐Master of Chirurgiae
Samaj Karya Parangat‐Samaj
Karya Parangat
Parangat‐Parangat
M.P.S. ‐Master of Population
Studies
M.Stat. ‐Master of Statistics
M.P.H. ‐Master of Public Health
M.Sc.(Medical Anatomy) ‐Master
of Science in Medical Anatomy
Male Female Total Male Female Total
8 9 10 11 12 13
Programme‐wise Enrolnment in various categories
(based on actual response)
SCHEDULED TRIBE OTHER BACKWARD CLASSES
0 83 83 5 310 315
18 43 61 150 211 361
7 1 8 113 22 135
12 7 19 122 59 181
13 4 17 245 71 316
65 105 170 126 226 352
4 3 7 78 50 128
2 2 4 37 67 104
12 7 19 52 76 128
6 11 17 57 95 152
14 4 18 73 32 105
13 6 19 41 27 68
16 2 18 62 57 119
2 1 3 45 11 56
10 7 17 77 33 110
0 0 0 29 0 29
4 1 5 125 37 162
4 2 6 40 27 67
1 1 2 48 37 85
3 0 3 4 19 23
1 0 1 7 4 11
15 8 23 34 28 62
AISHE 2010-11 T-28
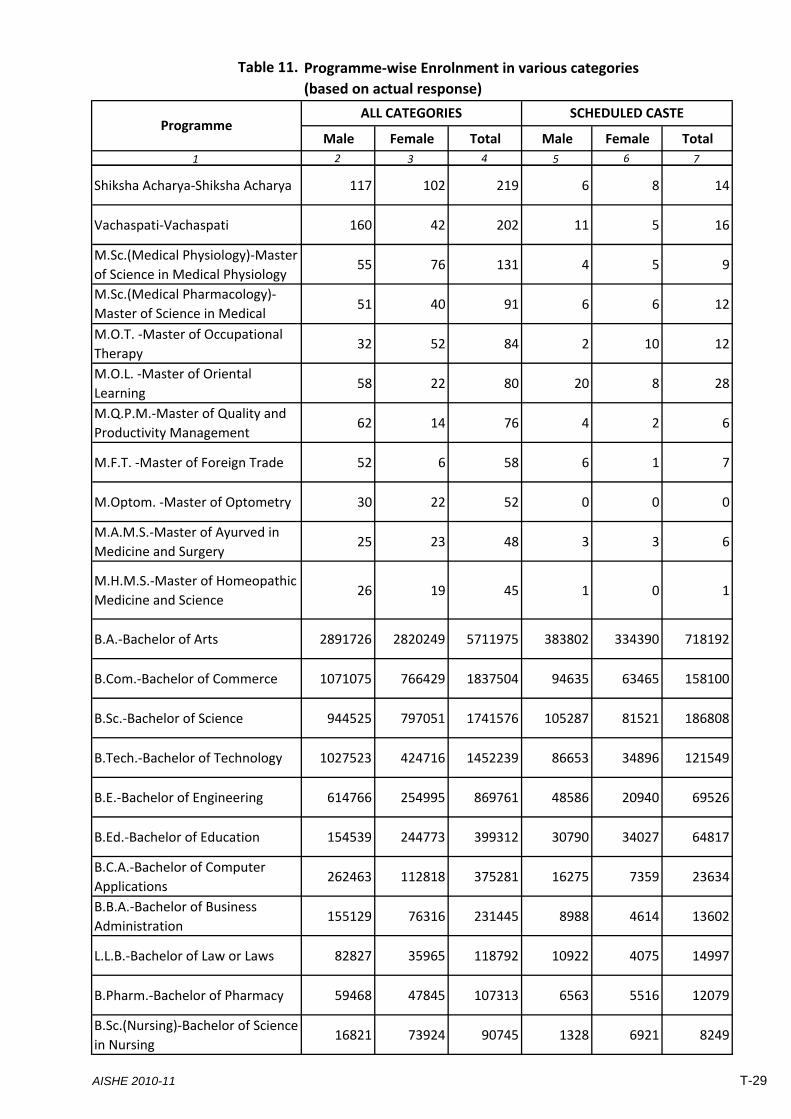
Table 11.
Male Female Total Male Female Total
1 2 3 4 5 6 7
Programme‐wise Enrolnment in various categories
(based on actual response)
ProgrammeALL CATEGORIES SCHEDULED CASTE
Shiksha Acharya‐Shiksha Acharya 117 102 219 6 8 14
Vachaspati‐Vachaspati 160 42 202 11 5 16
M.Sc.(Medical Physiology)‐Master
of Science in Medical Physiology55 76 131 4 5 9
M.Sc.(Medical Pharmacology)‐
Master of Science in Medical 51 40 91 6 6 12
M.O.T. ‐Master of Occupational
Therapy32 52 84 2 10 12
M.O.L. ‐Master of Oriental
Learning58 22 80 20 8 28
M.Q.P.M.‐Master of Quality and
Productivity Management62 14 76 4 2 6
M.F.T. ‐Master of Foreign Trade 52 6 58 6 1 7
M.Optom. ‐Master of Optometry 30 22 52 0 0 0
M.A.M.S.‐Master of Ayurved in
Medicine and Surgery25 23 48 3 3 6
M.H.M.S.‐Master of Homeopathic
Medicine and Science26 19 45 1 0 1
B.A.‐Bachelor of Arts 2891726 2820249 5711975 383802 334390 718192
B.Com.‐Bachelor of Commerce 1071075 766429 1837504 94635 63465 158100
B.Sc.‐Bachelor of Science 944525 797051 1741576 105287 81521 186808
B.Tech.‐Bachelor of Technology 1027523 424716 1452239 86653 34896 121549
B.E.‐Bachelor of Engineering 614766 254995 869761 48586 20940 69526
B.Ed.‐Bachelor of Education 154539 244773 399312 30790 34027 64817
B.C.A.‐Bachelor of Computer
Applications262463 112818 375281 16275 7359 23634
B.B.A.‐Bachelor of Business
Administration155129 76316 231445 8988 4614 13602
L.L.B.‐Bachelor of Law or Laws 82827 35965 118792 10922 4075 14997
B.Pharm.‐Bachelor of Pharmacy 59468 47845 107313 6563 5516 12079
B.Sc.(Nursing)‐Bachelor of Science
in Nursing16821 73924 90745 1328 6921 8249
AISHE 2010-11 T-29

Table 11.
1
Programme
Shiksha Acharya‐Shiksha Acharya
Vachaspati‐Vachaspati
M.Sc.(Medical Physiology)‐Master
of Science in Medical Physiology
M.Sc.(Medical Pharmacology)‐
Master of Science in Medical
M.O.T. ‐Master of Occupational
Therapy
M.O.L. ‐Master of Oriental
Learning
M.Q.P.M.‐Master of Quality and
Productivity Management
M.F.T. ‐Master of Foreign Trade
M.Optom. ‐Master of Optometry
M.A.M.S.‐Master of Ayurved in
Medicine and Surgery
M.H.M.S.‐Master of Homeopathic
Medicine and Science
B.A.‐Bachelor of Arts
B.Com.‐Bachelor of Commerce
B.Sc.‐Bachelor of Science
B.Tech.‐Bachelor of Technology
B.E.‐Bachelor of Engineering
B.Ed.‐Bachelor of Education
B.C.A.‐Bachelor of Computer
Applications
B.B.A.‐Bachelor of Business
Administration
L.L.B.‐Bachelor of Law or Laws
B.Pharm.‐Bachelor of Pharmacy
B.Sc.(Nursing)‐Bachelor of Science
in Nursing
Male Female Total Male Female Total
8 9 10 11 12 13
Programme‐wise Enrolnment in various categories
(based on actual response)
SCHEDULED TRIBE OTHER BACKWARD CLASSES
7 4 11 30 21 51
8 3 11 31 12 43
0 1 1 14 21 35
0 3 3 19 18 37
0 0 0 1 5 6
8 4 12 22 6 28
0 0 0 7 2 9
0 0 0 11 1 12
0 0 0 1 2 3
2 1 3 6 3 9
0 0 0 0 1 1
215820 177624 393444 774207 784074 1558281
27833 16975 44808 292072 204690 496762
38057 30284 68341 278673 259669 538342
34101 11017 45118 269570 123400 392970
11788 4443 16231 224661 97540 322201
12571 10526 23097 50677 95690 146367
4288 1905 6193 55776 28233 84009
1615 1002 2617 32726 16327 49053
3042 1255 4297 19841 7280 27121
2840 1839 4679 15360 12781 28141
488 2214 2702 2835 11110 13945
AISHE 2010-11 T-30
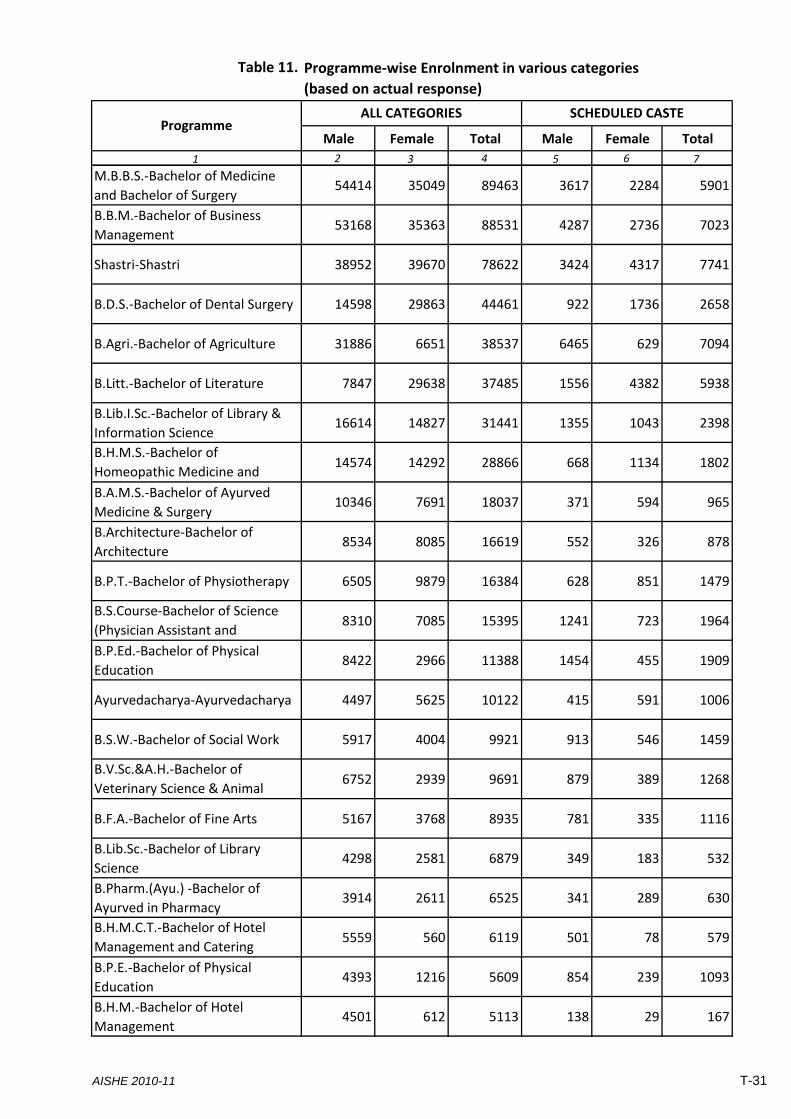
Table 11.
Male Female Total Male Female Total
1 2 3 4 5 6 7
Programme‐wise Enrolnment in various categories
(based on actual response)
ProgrammeALL CATEGORIES SCHEDULED CASTE
M.B.B.S.‐Bachelor of Medicine
and Bachelor of Surgery54414 35049 89463 3617 2284 5901
B.B.M.‐Bachelor of Business
Management53168 35363 88531 4287 2736 7023
Shastri‐Shastri 38952 39670 78622 3424 4317 7741
B.D.S.‐Bachelor of Dental Surgery 14598 29863 44461 922 1736 2658
B.Agri.‐Bachelor of Agriculture 31886 6651 38537 6465 629 7094
B.Litt.‐Bachelor of Literature 7847 29638 37485 1556 4382 5938
B.Lib.I.Sc.‐Bachelor of Library &
Information Science16614 14827 31441 1355 1043 2398
B.H.M.S.‐Bachelor of
Homeopathic Medicine and 14574 14292 28866 668 1134 1802
B.A.M.S.‐Bachelor of Ayurved
Medicine & Surgery10346 7691 18037 371 594 965
B.Architecture‐Bachelor of
Architecture8534 8085 16619 552 326 878
B.P.T.‐Bachelor of Physiotherapy 6505 9879 16384 628 851 1479
B.S.Course‐Bachelor of Science
(Physician Assistant and 8310 7085 15395 1241 723 1964
B.P.Ed.‐Bachelor of Physical
Education8422 2966 11388 1454 455 1909
Ayurvedacharya‐Ayurvedacharya 4497 5625 10122 415 591 1006
B.S.W.‐Bachelor of Social Work 5917 4004 9921 913 546 1459
B.V.Sc.&A.H.‐Bachelor of
Veterinary Science & Animal 6752 2939 9691 879 389 1268
B.F.A.‐Bachelor of Fine Arts 5167 3768 8935 781 335 1116
B.Lib.Sc.‐Bachelor of Library
Science4298 2581 6879 349 183 532
B.Pharm.(Ayu.) ‐Bachelor of
Ayurved in Pharmacy3914 2611 6525 341 289 630
B.H.M.C.T.‐Bachelor of Hotel
Management and Catering 5559 560 6119 501 78 579
B.P.E.‐Bachelor of Physical
Education4393 1216 5609 854 239 1093
B.H.M.‐Bachelor of Hotel
Management4501 612 5113 138 29 167
AISHE 2010-11 T-31
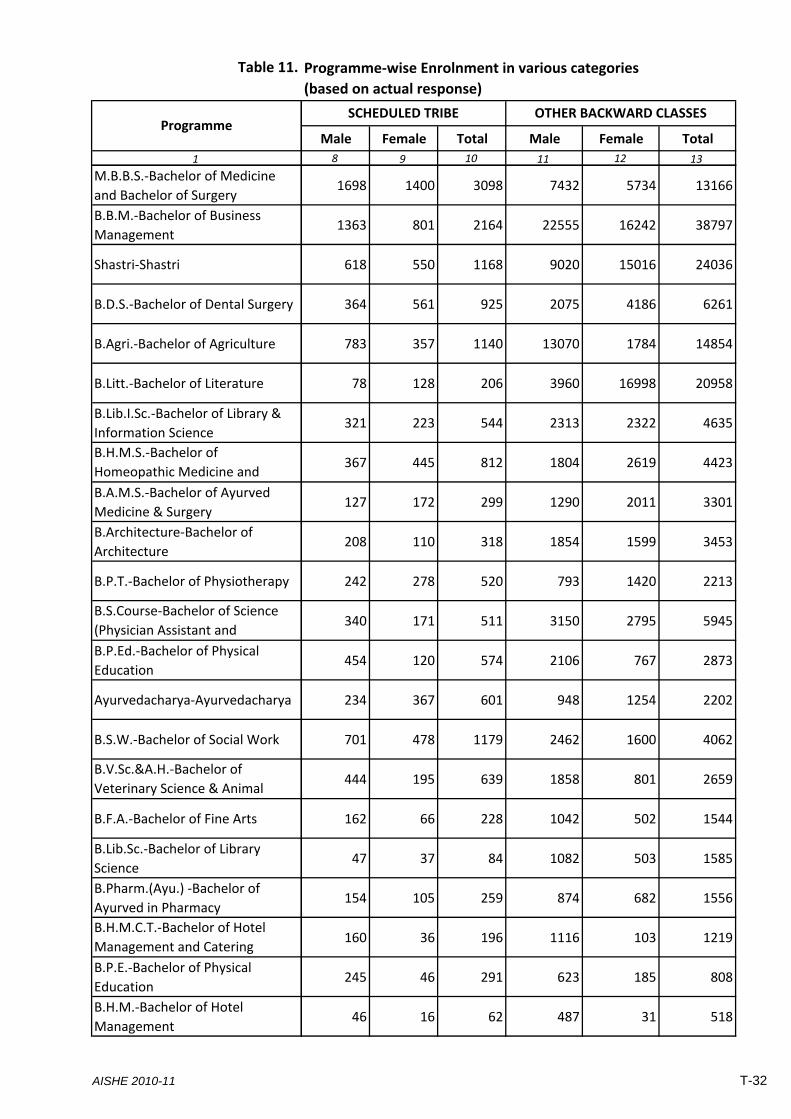
Table 11.
1
Programme
M.B.B.S.‐Bachelor of Medicine
and Bachelor of Surgery
B.B.M.‐Bachelor of Business
Management
Shastri‐Shastri
B.D.S.‐Bachelor of Dental Surgery
B.Agri.‐Bachelor of Agriculture
B.Litt.‐Bachelor of Literature
B.Lib.I.Sc.‐Bachelor of Library &
Information Science
B.H.M.S.‐Bachelor of
Homeopathic Medicine and
B.A.M.S.‐Bachelor of Ayurved
Medicine & Surgery
B.Architecture‐Bachelor of
Architecture
B.P.T.‐Bachelor of Physiotherapy
B.S.Course‐Bachelor of Science
(Physician Assistant and
B.P.Ed.‐Bachelor of Physical
Education
Ayurvedacharya‐Ayurvedacharya
B.S.W.‐Bachelor of Social Work
B.V.Sc.&A.H.‐Bachelor of
Veterinary Science & Animal
B.F.A.‐Bachelor of Fine Arts
B.Lib.Sc.‐Bachelor of Library
Science
B.Pharm.(Ayu.) ‐Bachelor of
Ayurved in Pharmacy
B.H.M.C.T.‐Bachelor of Hotel
Management and Catering
B.P.E.‐Bachelor of Physical
Education
B.H.M.‐Bachelor of Hotel
Management
Male Female Total Male Female Total
8 9 10 11 12 13
Programme‐wise Enrolnment in various categories
(based on actual response)
SCHEDULED TRIBE OTHER BACKWARD CLASSES
1698 1400 3098 7432 5734 13166
1363 801 2164 22555 16242 38797
618 550 1168 9020 15016 24036
364 561 925 2075 4186 6261
783 357 1140 13070 1784 14854
78 128 206 3960 16998 20958
321 223 544 2313 2322 4635
367 445 812 1804 2619 4423
127 172 299 1290 2011 3301
208 110 318 1854 1599 3453
242 278 520 793 1420 2213
340 171 511 3150 2795 5945
454 120 574 2106 767 2873
234 367 601 948 1254 2202
701 478 1179 2462 1600 4062
444 195 639 1858 801 2659
162 66 228 1042 502 1544
47 37 84 1082 503 1585
154 105 259 874 682 1556
160 36 196 1116 103 1219
245 46 291 623 185 808
46 16 62 487 31 518
AISHE 2010-11 T-32
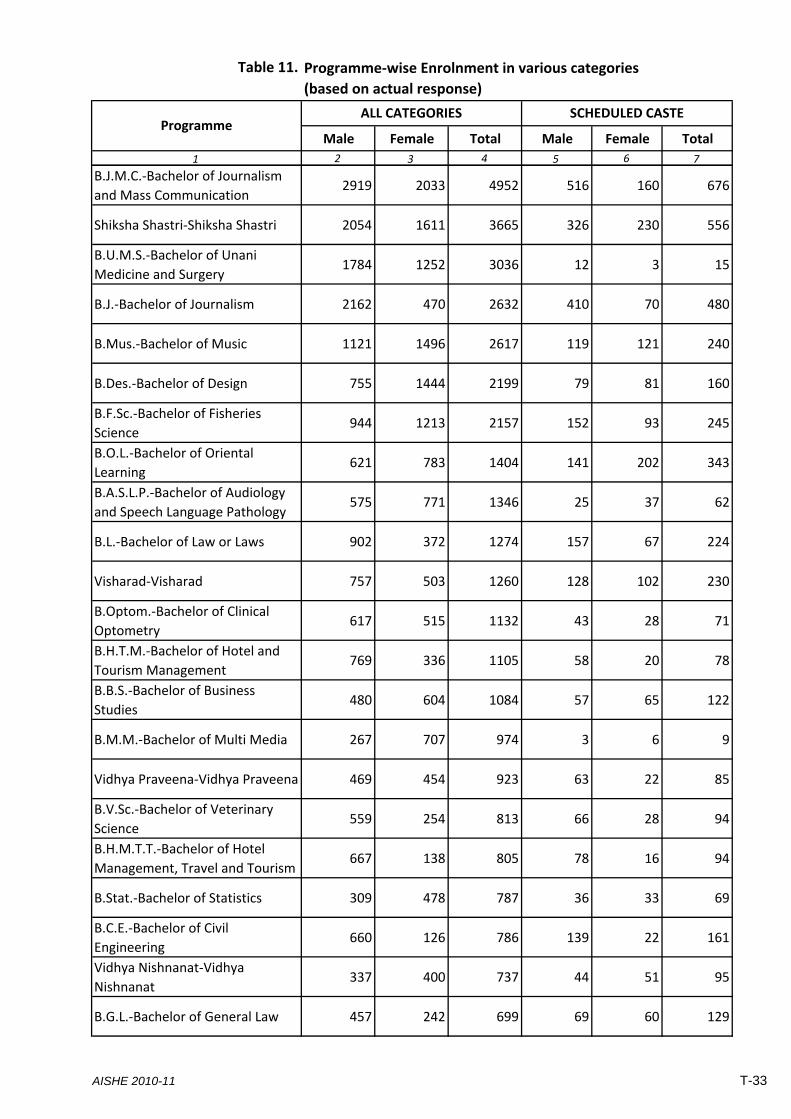
Table 11.
Male Female Total Male Female Total
1 2 3 4 5 6 7
Programme‐wise Enrolnment in various categories
(based on actual response)
ProgrammeALL CATEGORIES SCHEDULED CASTE
B.J.M.C.‐Bachelor of Journalism
and Mass Communication2919 2033 4952 516 160 676
Shiksha Shastri‐Shiksha Shastri 2054 1611 3665 326 230 556
B.U.M.S.‐Bachelor of Unani
Medicine and Surgery1784 1252 3036 12 3 15
B.J.‐Bachelor of Journalism 2162 470 2632 410 70 480
B.Mus.‐Bachelor of Music 1121 1496 2617 119 121 240
B.Des.‐Bachelor of Design 755 1444 2199 79 81 160
B.F.Sc.‐Bachelor of Fisheries
Science944 1213 2157 152 93 245
B.O.L.‐Bachelor of Oriental
Learning621 783 1404 141 202 343
B.A.S.L.P.‐Bachelor of Audiology
and Speech Language Pathology575 771 1346 25 37 62
B.L.‐Bachelor of Law or Laws 902 372 1274 157 67 224
Visharad‐Visharad 757 503 1260 128 102 230
B.Optom.‐Bachelor of Clinical
Optometry617 515 1132 43 28 71
B.H.T.M.‐Bachelor of Hotel and
Tourism Management769 336 1105 58 20 78
B.B.S.‐Bachelor of Business
Studies480 604 1084 57 65 122
B.M.M.‐Bachelor of Multi Media 267 707 974 3 6 9
Vidhya Praveena‐Vidhya Praveena 469 454 923 63 22 85
B.V.Sc.‐Bachelor of Veterinary
Science559 254 813 66 28 94
B.H.M.T.T.‐Bachelor of Hotel
Management, Travel and Tourism667 138 805 78 16 94
B.Stat.‐Bachelor of Statistics 309 478 787 36 33 69
B.C.E.‐Bachelor of Civil
Engineering660 126 786 139 22 161
Vidhya Nishnanat‐Vidhya
Nishnanat337 400 737 44 51 95
B.G.L.‐Bachelor of General Law 457 242 699 69 60 129
AISHE 2010-11 T-33
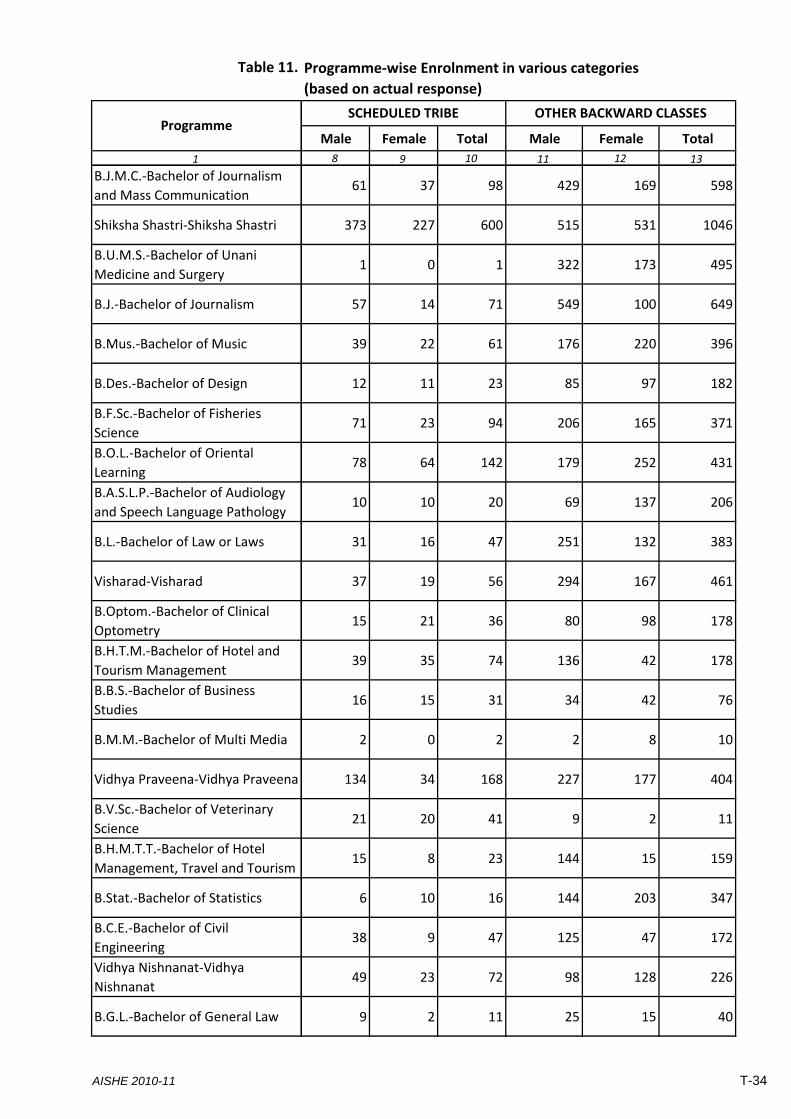
Table 11.
1
Programme
B.J.M.C.‐Bachelor of Journalism
and Mass Communication
Shiksha Shastri‐Shiksha Shastri
B.U.M.S.‐Bachelor of Unani
Medicine and Surgery
B.J.‐Bachelor of Journalism
B.Mus.‐Bachelor of Music
B.Des.‐Bachelor of Design
B.F.Sc.‐Bachelor of Fisheries
Science
B.O.L.‐Bachelor of Oriental
Learning
B.A.S.L.P.‐Bachelor of Audiology
and Speech Language Pathology
B.L.‐Bachelor of Law or Laws
Visharad‐Visharad
B.Optom.‐Bachelor of Clinical
Optometry
B.H.T.M.‐Bachelor of Hotel and
Tourism Management
B.B.S.‐Bachelor of Business
Studies
B.M.M.‐Bachelor of Multi Media
Vidhya Praveena‐Vidhya Praveena
B.V.Sc.‐Bachelor of Veterinary
Science
B.H.M.T.T.‐Bachelor of Hotel
Management, Travel and Tourism
B.Stat.‐Bachelor of Statistics
B.C.E.‐Bachelor of Civil
Engineering
Vidhya Nishnanat‐Vidhya
Nishnanat
B.G.L.‐Bachelor of General Law
Male Female Total Male Female Total
8 9 10 11 12 13
Programme‐wise Enrolnment in various categories
(based on actual response)
SCHEDULED TRIBE OTHER BACKWARD CLASSES
61 37 98 429 169 598
373 227 600 515 531 1046
1 0 1 322 173 495
57 14 71 549 100 649
39 22 61 176 220 396
12 11 23 85 97 182
71 23 94 206 165 371
78 64 142 179 252 431
10 10 20 69 137 206
31 16 47 251 132 383
37 19 56 294 167 461
15 21 36 80 98 178
39 35 74 136 42 178
16 15 31 34 42 76
2 0 2 2 8 10
134 34 168 227 177 404
21 20 41 9 2 11
15 8 23 144 15 159
6 10 16 144 203 347
38 9 47 125 47 172
49 23 72 98 128 226
9 2 11 25 15 40
AISHE 2010-11 T-34

Table 11.
Male Female Total Male Female Total
1 2 3 4 5 6 7
Programme‐wise Enrolnment in various categories
(based on actual response)
ProgrammeALL CATEGORIES SCHEDULED CASTE
B.S.S.‐Bachelor in Social Sciences 431 215 646 35 30 65
B.P.A.‐Bachelor of Performing
Arts215 308 523 30 32 62
B.Ch.E.‐Bachelor of Chemical
Engineering364 148 512 89 21 110
B.Nat.(Yogic Sciences)‐Bachelor of
Naturopathy and Yogic Sciences137 335 472 0 7 7
Hindi Shiksha Visharad‐Hindi
Shiksha Visharad108 343 451 25 54 79
Shiksha Visharad‐Shiksha Visharad 304 112 416 83 54 137
B.O.T.‐Bachelor of Occupational
Therapy230 87 317 0 11 11
Alankar‐Alankar 146 138 284 9 20 29
B.A.M.‐Bachelor of Ayurved
Medicine257 12 269 86 2 88
B.Dance‐Bachelor of Dance 58 210 268 3 9 12
B.Sc.(Post Basic)‐B.Sc (Post Basic) 96 168 264 4 5 9
B.Plan.‐Bachelor of Planning 168 89 257 27 11 38
B.C.L.‐Bachelor of Civil Law 97 98 195 9 8 17
B.P.S.‐Bachelor of Professional
Studies114 56 170 7 3 10
Vidhyalankar‐Vidhyalankar 120 34 154 4 0 4
B.Chem.Tech.‐Bachelor of
Chemical Technology36 100 136 3 4 7
B.S.M.S.‐Bachelor of Sridhar
Medicine and Surgery65 70 135 7 14 21
B.I.M.‐Bachelor of Indian
Medicine37 15 52 5 1 6
B.Nat.(Ayu)‐Bachelor of Ayurved
in Naturopathy6 2 8 0 0 0
AISHE 2010-11 T-35
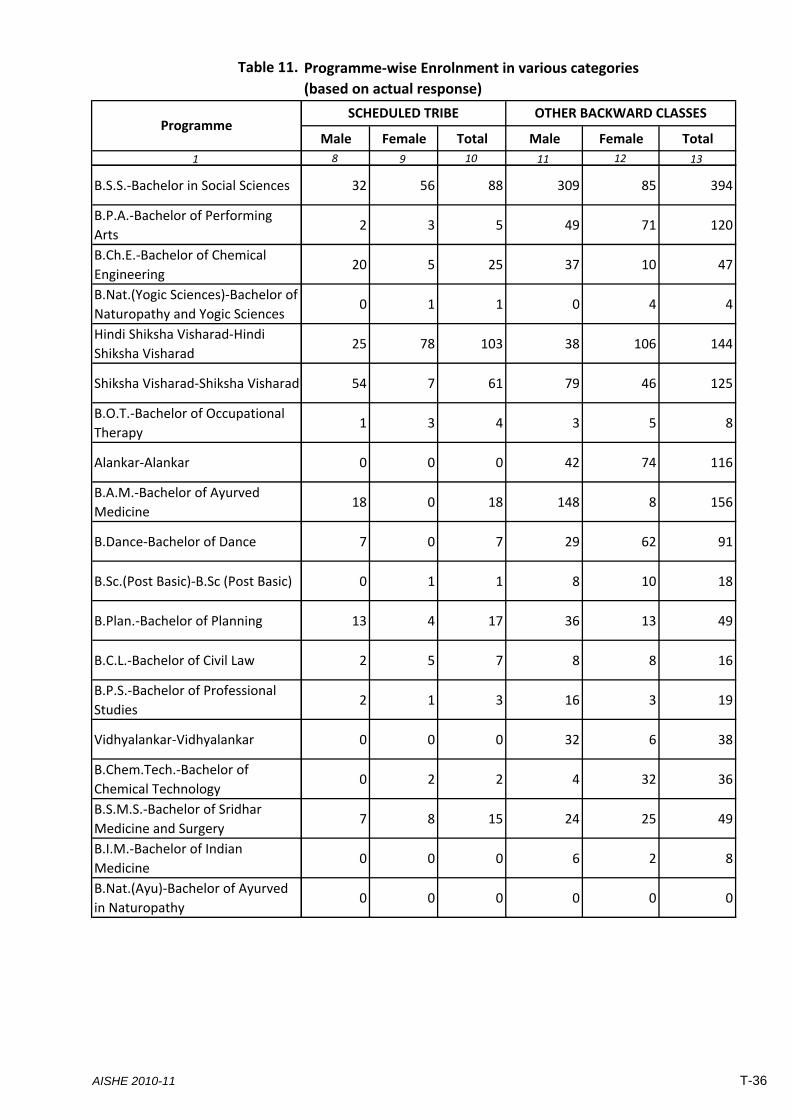
Table 11.
1
Programme
B.S.S.‐Bachelor in Social Sciences
B.P.A.‐Bachelor of Performing
Arts
B.Ch.E.‐Bachelor of Chemical
Engineering
B.Nat.(Yogic Sciences)‐Bachelor of
Naturopathy and Yogic Sciences
Hindi Shiksha Visharad‐Hindi
Shiksha Visharad
Shiksha Visharad‐Shiksha Visharad
B.O.T.‐Bachelor of Occupational
Therapy
Alankar‐Alankar
B.A.M.‐Bachelor of Ayurved
Medicine
B.Dance‐Bachelor of Dance
B.Sc.(Post Basic)‐B.Sc (Post Basic)
B.Plan.‐Bachelor of Planning
B.C.L.‐Bachelor of Civil Law
B.P.S.‐Bachelor of Professional
Studies
Vidhyalankar‐Vidhyalankar
B.Chem.Tech.‐Bachelor of
Chemical Technology
B.S.M.S.‐Bachelor of Sridhar
Medicine and Surgery
B.I.M.‐Bachelor of Indian
Medicine
B.Nat.(Ayu)‐Bachelor of Ayurved
in Naturopathy
Male Female Total Male Female Total
8 9 10 11 12 13
Programme‐wise Enrolnment in various categories
(based on actual response)
SCHEDULED TRIBE OTHER BACKWARD CLASSES
32 56 88 309 85 394
2 3 5 49 71 120
20 5 25 37 10 47
0 1 1 0 4 4
25 78 103 38 106 144
54 7 61 79 46 125
1 3 4 3 5 8
0 0 0 42 74 116
18 0 18 148 8 156
7 0 7 29 62 91
0 1 1 8 10 18
13 4 17 36 13 49
2 5 7 8 8 16
2 1 3 16 3 19
0 0 0 32 6 38
0 2 2 4 32 36
7 8 15 24 25 49
0 0 0 6 2 8
0 0 0 0 0 0
AISHE 2010-11 T-36
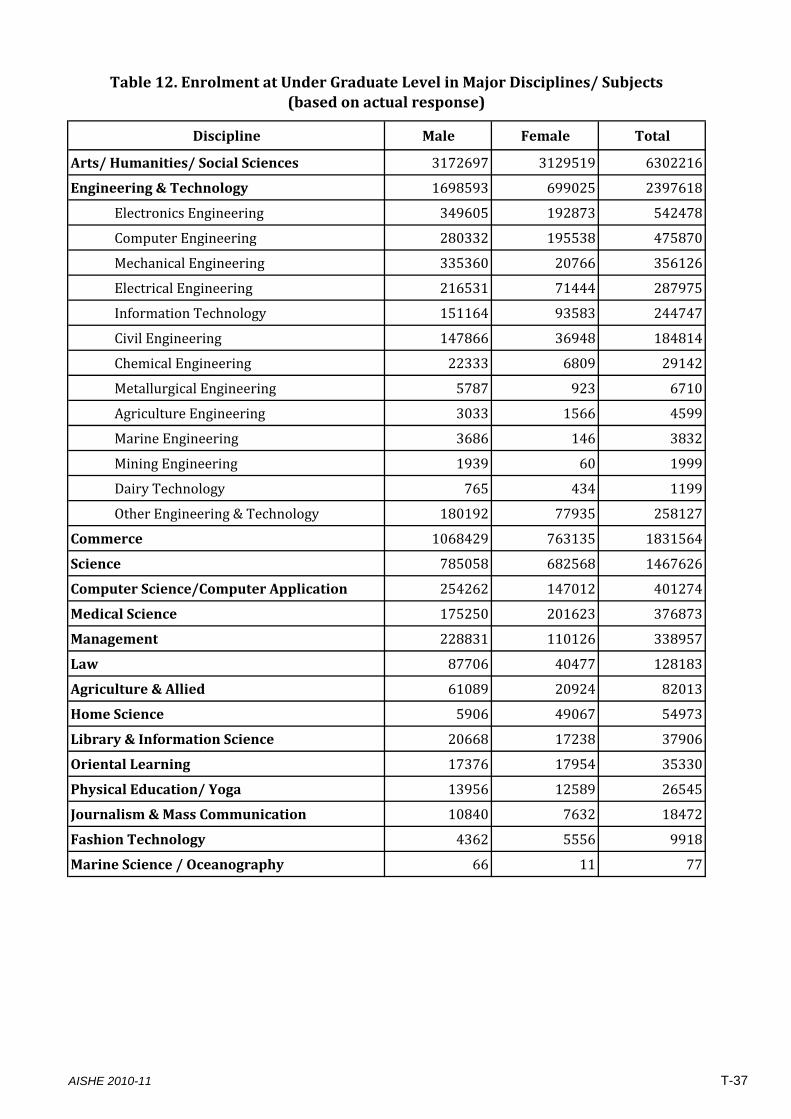
Discipline Male Female Total
Arts/ Humanities/ Social Sciences 3172697 3129519 6302216
Engineering & Technology 1698593 699025 2397618
Electronics Engineering 349605 192873 542478
Computer Engineering 280332 195538 475870
Mechanical Engineering 335360 20766 356126
Electrical Engineering 216531 71444 287975
Information Technology 151164 93583 244747
Civil Engineering 147866 36948 184814
Chemical Engineering 22333 6809 29142
Metallurgical Engineering 5787 923 6710
Agriculture Engineering 3033 1566 4599
Marine Engineering 3686 146 3832
Mining Engineering 1939 60 1999
Dairy Technology 765 434 1199
Other Engineering & Technology 180192 77935 258127
Commerce 1068429 763135 1831564
Science 785058 682568 1467626
Computer Science/Computer Application 254262 147012 401274
Medical Science 175250 201623 376873
Management 228831 110126 338957
Law 87706 40477 128183
Agriculture & Allied 61089 20924 82013
Home Science 5906 49067 54973
Library & Information Science 20668 17238 37906
Oriental Learning 17376 17954 35330
Physical Education/ Yoga 13956 12589 26545
Journalism & Mass Communication 10840 7632 18472
Fashion Technology 4362 5556 9918
Marine Science / Oceanography 66 11 77
Table 12. Enrolment at Under Graduate Level in Major Disciplines/ Subjects(based on actual response)
AISHE 2010-11 T-37
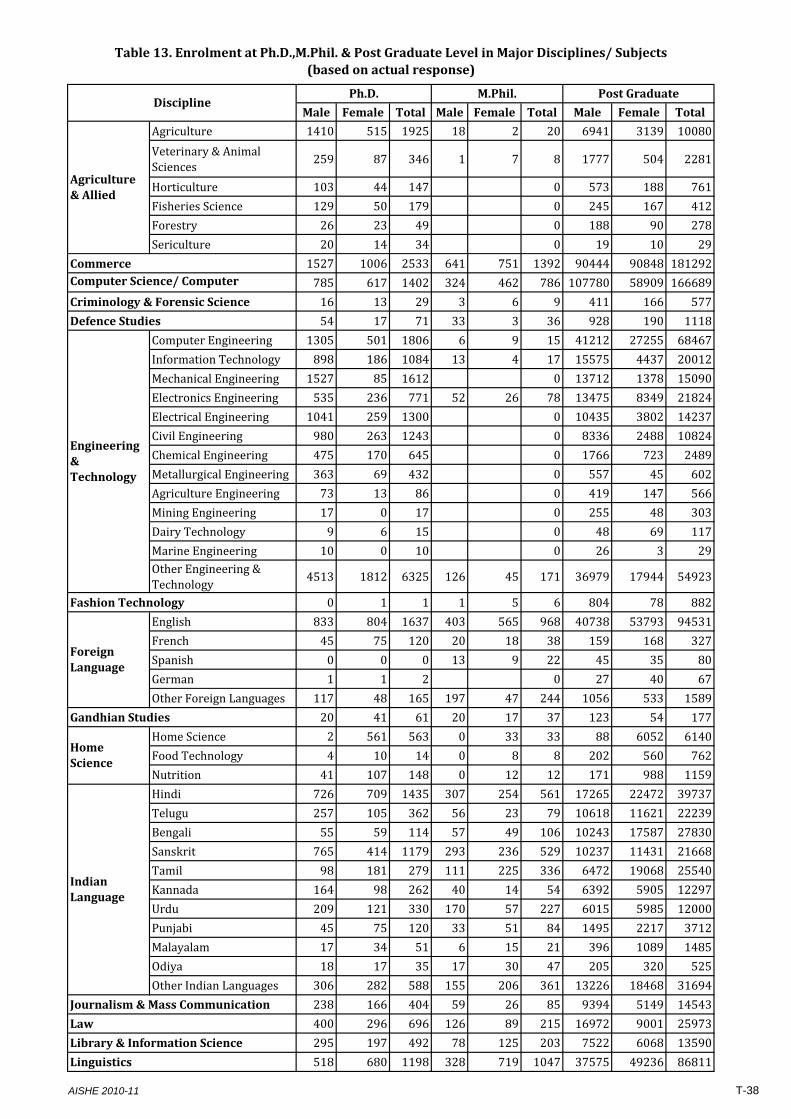
Male Female Total Male Female Total Male Female Total
Agriculture 1410 515 1925 18 2 20 6941 3139 10080
Veterinary & Animal Sciences
259 87 346 1 7 8 1777 504 2281
Horticulture 103 44 147 0 573 188 761
Fisheries Science 129 50 179 0 245 167 412
Forestry 26 23 49 0 188 90 278
Sericulture 20 14 34 0 19 10 29
Commerce 1527 1006 2533 641 751 1392 90444 90848 181292
785 617 1402 324 462 786 107780 58909 166689
Criminology & Forensic Science 16 13 29 3 6 9 411 166 577
Defence Studies 54 17 71 33 3 36 928 190 1118
Computer Engineering 1305 501 1806 6 9 15 41212 27255 68467
Information Technology 898 186 1084 13 4 17 15575 4437 20012
Mechanical Engineering 1527 85 1612 0 13712 1378 15090
Electronics Engineering 535 236 771 52 26 78 13475 8349 21824
Electrical Engineering 1041 259 1300 0 10435 3802 14237
Civil Engineering 980 263 1243 0 8336 2488 10824
Chemical Engineering 475 170 645 0 1766 723 2489
Metallurgical Engineering 363 69 432 0 557 45 602
Agriculture Engineering 73 13 86 0 419 147 566
Mining Engineering 17 0 17 0 255 48 303
Dairy Technology 9 6 15 0 48 69 117
Marine Engineering 10 0 10 0 26 3 29Other Engineering & Technology
4513 1812 6325 126 45 171 36979 17944 54923
Fashion Technology 0 1 1 1 5 6 804 78 882
English 833 804 1637 403 565 968 40738 53793 94531
French 45 75 120 20 18 38 159 168 327
Spanish 0 0 0 13 9 22 45 35 80
German 1 1 2 0 27 40 67
Other Foreign Languages 117 48 165 197 47 244 1056 533 1589
Gandhian Studies 20 41 61 20 17 37 123 54 177
Home Science 2 561 563 0 33 33 88 6052 6140
Food Technology 4 10 14 0 8 8 202 560 762
Nutrition 41 107 148 0 12 12 171 988 1159
Hindi 726 709 1435 307 254 561 17265 22472 39737
Telugu 257 105 362 56 23 79 10618 11621 22239
Bengali 55 59 114 57 49 106 10243 17587 27830
Sanskrit 765 414 1179 293 236 529 10237 11431 21668
Tamil 98 181 279 111 225 336 6472 19068 25540
Kannada 164 98 262 40 14 54 6392 5905 12297
Urdu 209 121 330 170 57 227 6015 5985 12000
Punjabi 45 75 120 33 51 84 1495 2217 3712
Malayalam 17 34 51 6 15 21 396 1089 1485
Odiya 18 17 35 17 30 47 205 320 525
Other Indian Languages 306 282 588 155 206 361 13226 18468 31694
Journalism & Mass Communication 238 166 404 59 26 85 9394 5149 14543
Law 400 296 696 126 89 215 16972 9001 25973
Library & Information Science 295 197 492 78 125 203 7522 6068 13590
Linguistics 518 680 1198 328 719 1047 37575 49236 86811
Table 13. Enrolment at Ph.D.,M.Phil. & Post Graduate Level in Major Disciplines/ Subjects(based on actual response)
Engineering & Technology
Foreign Language
Home Science
Indian Language
DisciplinePh.D. M.Phil. Post Graduate
Agriculture & Allied
Computer Science/ Computer
AISHE 2010-11 T-38
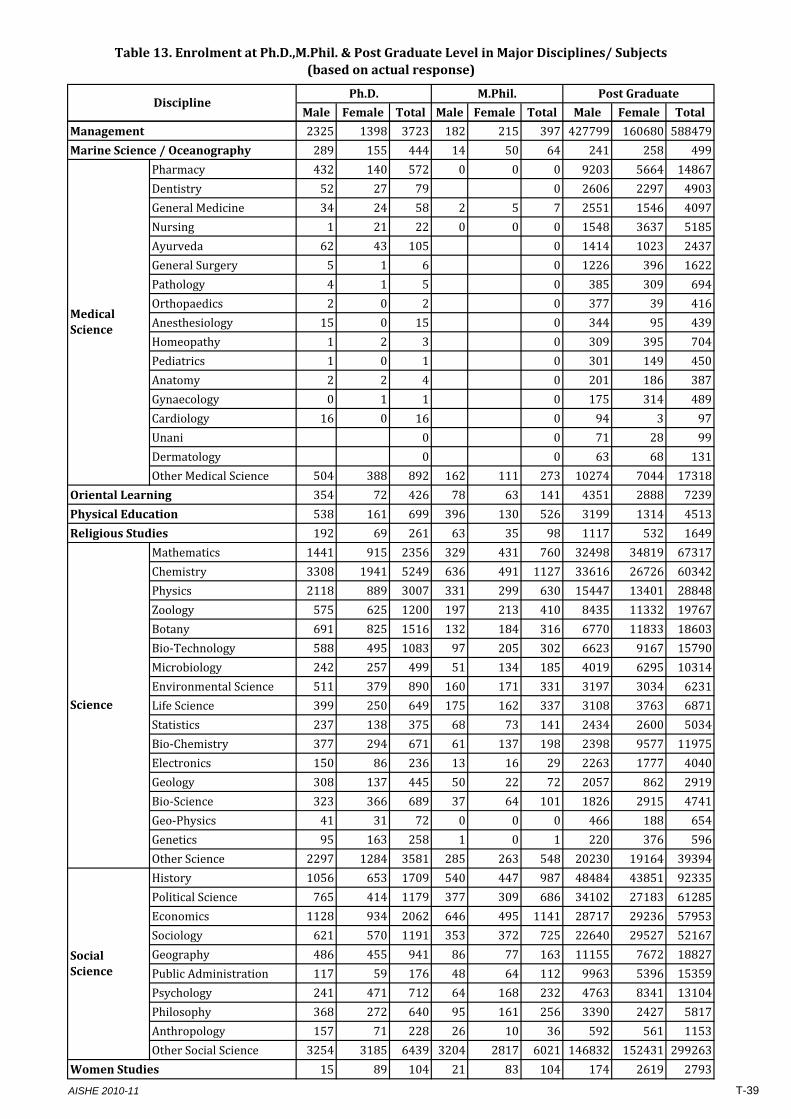
Male Female Total Male Female Total Male Female Total
Table 13. Enrolment at Ph.D.,M.Phil. & Post Graduate Level in Major Disciplines/ Subjects(based on actual response)
DisciplinePh.D. M.Phil. Post Graduate
Management 2325 1398 3723 182 215 397 427799 160680 588479
Marine Science / Oceanography 289 155 444 14 50 64 241 258 499
Pharmacy 432 140 572 0 0 0 9203 5664 14867
Dentistry 52 27 79 0 2606 2297 4903
General Medicine 34 24 58 2 5 7 2551 1546 4097
Nursing 1 21 22 0 0 0 1548 3637 5185
Ayurveda 62 43 105 0 1414 1023 2437
General Surgery 5 1 6 0 1226 396 1622
Pathology 4 1 5 0 385 309 694
Orthopaedics 2 0 2 0 377 39 416
Anesthesiology 15 0 15 0 344 95 439
Homeopathy 1 2 3 0 309 395 704
Pediatrics 1 0 1 0 301 149 450
Anatomy 2 2 4 0 201 186 387
Gynaecology 0 1 1 0 175 314 489
Cardiology 16 0 16 0 94 3 97
Unani 0 0 71 28 99
Dermatology 0 0 63 68 131
Other Medical Science 504 388 892 162 111 273 10274 7044 17318
Oriental Learning 354 72 426 78 63 141 4351 2888 7239
Physical Education 538 161 699 396 130 526 3199 1314 4513
Religious Studies 192 69 261 63 35 98 1117 532 1649
Mathematics 1441 915 2356 329 431 760 32498 34819 67317
Chemistry 3308 1941 5249 636 491 1127 33616 26726 60342
Physics 2118 889 3007 331 299 630 15447 13401 28848
Zoology 575 625 1200 197 213 410 8435 11332 19767
Botany 691 825 1516 132 184 316 6770 11833 18603
Bio‐Technology 588 495 1083 97 205 302 6623 9167 15790
Microbiology 242 257 499 51 134 185 4019 6295 10314
Environmental Science 511 379 890 160 171 331 3197 3034 6231
Life Science 399 250 649 175 162 337 3108 3763 6871
Statistics 237 138 375 68 73 141 2434 2600 5034
Bio‐Chemistry 377 294 671 61 137 198 2398 9577 11975
Electronics 150 86 236 13 16 29 2263 1777 4040
Geology 308 137 445 50 22 72 2057 862 2919
Bio‐Science 323 366 689 37 64 101 1826 2915 4741
Geo‐Physics 41 31 72 0 0 0 466 188 654
Genetics 95 163 258 1 0 1 220 376 596
Other Science 2297 1284 3581 285 263 548 20230 19164 39394
History 1056 653 1709 540 447 987 48484 43851 92335
Political Science 765 414 1179 377 309 686 34102 27183 61285
Economics 1128 934 2062 646 495 1141 28717 29236 57953
Sociology 621 570 1191 353 372 725 22640 29527 52167
Geography 486 455 941 86 77 163 11155 7672 18827
Public Administration 117 59 176 48 64 112 9963 5396 15359
Psychology 241 471 712 64 168 232 4763 8341 13104
Philosophy 368 272 640 95 161 256 3390 2427 5817
Anthropology 157 71 228 26 10 36 592 561 1153
Other Social Science 3254 3185 6439 3204 2817 6021 146832 152431 299263
Women Studies 15 89 104 21 83 104 174 2619 2793
Social Science
Medical Science
Science
AISHE 2010-11 T-39
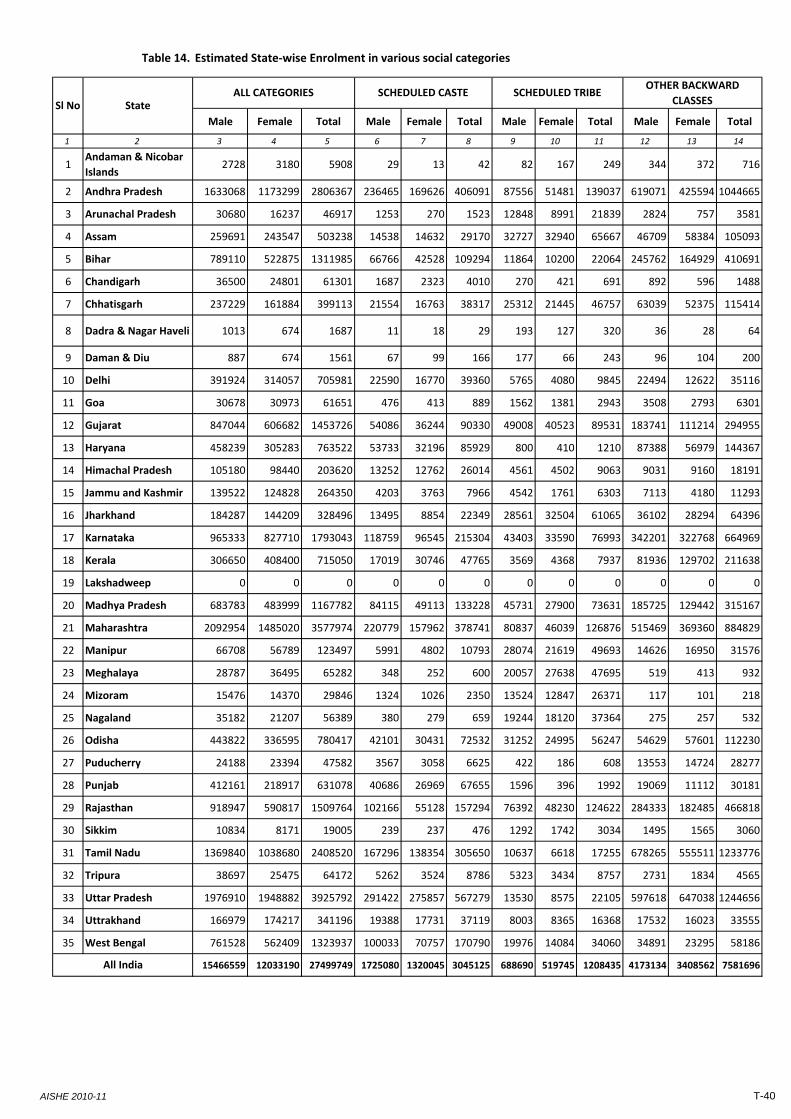
Table 14. Estimated State‐wise Enrolment in various social categories
Male Female Total Male Female Total Male Female Total Male Female Total
1 2 3 4 5 6 7 8 9 10 11 12 13 14
1Andaman & Nicobar
Islands2728 3180 5908 29 13 42 82 167 249 344 372 716
2 Andhra Pradesh 1633068 1173299 2806367 236465 169626 406091 87556 51481 139037 619071 425594 1044665
3 Arunachal Pradesh 30680 16237 46917 1253 270 1523 12848 8991 21839 2824 757 3581
4 Assam 259691 243547 503238 14538 14632 29170 32727 32940 65667 46709 58384 105093
5 Bihar 789110 522875 1311985 66766 42528 109294 11864 10200 22064 245762 164929 410691
6 Chandigarh 36500 24801 61301 1687 2323 4010 270 421 691 892 596 1488
7 Chhatisgarh 237229 161884 399113 21554 16763 38317 25312 21445 46757 63039 52375 115414
8 Dadra & Nagar Haveli 1013 674 1687 11 18 29 193 127 320 36 28 64
9 Daman & Diu 887 674 1561 67 99 166 177 66 243 96 104 200
10 Delhi 391924 314057 705981 22590 16770 39360 5765 4080 9845 22494 12622 35116
11 Goa 30678 30973 61651 476 413 889 1562 1381 2943 3508 2793 6301
12 Gujarat 847044 606682 1453726 54086 36244 90330 49008 40523 89531 183741 111214 294955
13 Haryana 458239 305283 763522 53733 32196 85929 800 410 1210 87388 56979 144367
14 Himachal Pradesh 105180 98440 203620 13252 12762 26014 4561 4502 9063 9031 9160 18191
15 Jammu and Kashmir 139522 124828 264350 4203 3763 7966 4542 1761 6303 7113 4180 11293
16 Jharkhand 184287 144209 328496 13495 8854 22349 28561 32504 61065 36102 28294 64396
17 Karnataka 965333 827710 1793043 118759 96545 215304 43403 33590 76993 342201 322768 664969
18 Kerala 306650 408400 715050 17019 30746 47765 3569 4368 7937 81936 129702 211638
19 Lakshadweep 0 0 0 0 0 0 0 0 0 0 0 0
20 Madhya Pradesh 683783 483999 1167782 84115 49113 133228 45731 27900 73631 185725 129442 315167
21 Maharashtra 2092954 1485020 3577974 220779 157962 378741 80837 46039 126876 515469 369360 884829
22 Manipur 66708 56789 123497 5991 4802 10793 28074 21619 49693 14626 16950 31576
23 Meghalaya 28787 36495 65282 348 252 600 20057 27638 47695 519 413 932
24 Mizoram 15476 14370 29846 1324 1026 2350 13524 12847 26371 117 101 218
25 Nagaland 35182 21207 56389 380 279 659 19244 18120 37364 275 257 532
26 Odisha 443822 336595 780417 42101 30431 72532 31252 24995 56247 54629 57601 112230
27 Puducherry 24188 23394 47582 3567 3058 6625 422 186 608 13553 14724 28277
28 Punjab 412161 218917 631078 40686 26969 67655 1596 396 1992 19069 11112 30181
29 Rajasthan 918947 590817 1509764 102166 55128 157294 76392 48230 124622 284333 182485 466818
30 Sikkim 10834 8171 19005 239 237 476 1292 1742 3034 1495 1565 3060
31 Tamil Nadu 1369840 1038680 2408520 167296 138354 305650 10637 6618 17255 678265 555511 1233776
32 Tripura 38697 25475 64172 5262 3524 8786 5323 3434 8757 2731 1834 4565
33 Uttar Pradesh 1976910 1948882 3925792 291422 275857 567279 13530 8575 22105 597618 647038 1244656
34 Uttrakhand 166979 174217 341196 19388 17731 37119 8003 8365 16368 17532 16023 33555
35 West Bengal 761528 562409 1323937 100033 70757 170790 19976 14084 34060 34891 23295 58186
15466559 12033190 27499749 1725080 1320045 3045125 688690 519745 1208435 4173134 3408562 7581696
SCHEDULED TRIBEOTHER BACKWARD
CLASSES
All India
Sl No StateALL CATEGORIES SCHEDULED CASTE
AISHE 2010-11 T-40
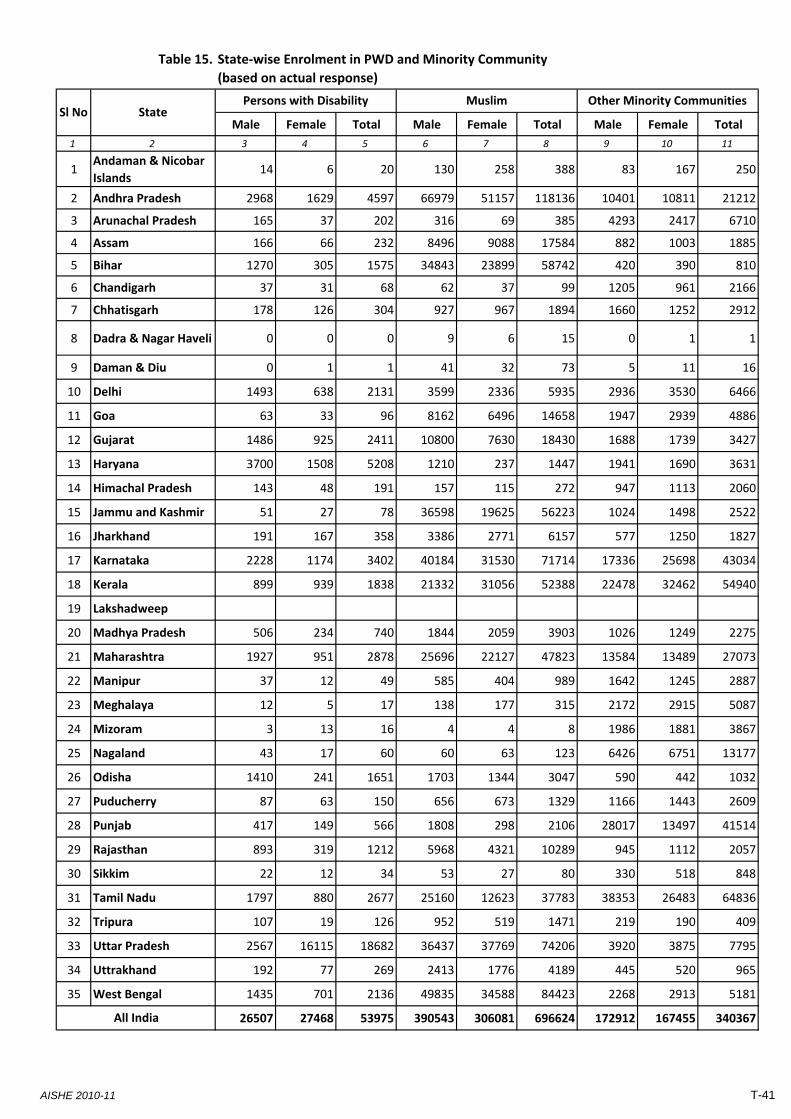
Table 15.
Male Female Total Male Female Total Male Female Total
1 2 3 4 5 6 7 8 9 10 11
1Andaman & Nicobar
Islands14 6 20 130 258 388 83 167 250
2 Andhra Pradesh 2968 1629 4597 66979 51157 118136 10401 10811 21212
3 Arunachal Pradesh 165 37 202 316 69 385 4293 2417 6710
4 Assam 166 66 232 8496 9088 17584 882 1003 1885
5 Bihar 1270 305 1575 34843 23899 58742 420 390 810
6 Chandigarh 37 31 68 62 37 99 1205 961 2166
7 Chhatisgarh 178 126 304 927 967 1894 1660 1252 2912
8 Dadra & Nagar Haveli 0 0 0 9 6 15 0 1 1
9 Daman & Diu 0 1 1 41 32 73 5 11 16
10 Delhi 1493 638 2131 3599 2336 5935 2936 3530 6466
11 Goa 63 33 96 8162 6496 14658 1947 2939 4886
12 Gujarat 1486 925 2411 10800 7630 18430 1688 1739 3427
13 Haryana 3700 1508 5208 1210 237 1447 1941 1690 3631
14 Himachal Pradesh 143 48 191 157 115 272 947 1113 2060
15 Jammu and Kashmir 51 27 78 36598 19625 56223 1024 1498 2522
16 Jharkhand 191 167 358 3386 2771 6157 577 1250 1827
17 Karnataka 2228 1174 3402 40184 31530 71714 17336 25698 43034
18 Kerala 899 939 1838 21332 31056 52388 22478 32462 54940
19 Lakshadweep
20 Madhya Pradesh 506 234 740 1844 2059 3903 1026 1249 2275
21 Maharashtra 1927 951 2878 25696 22127 47823 13584 13489 27073
22 Manipur 37 12 49 585 404 989 1642 1245 2887
23 Meghalaya 12 5 17 138 177 315 2172 2915 5087
24 Mizoram 3 13 16 4 4 8 1986 1881 3867
25 Nagaland 43 17 60 60 63 123 6426 6751 13177
26 Odisha 1410 241 1651 1703 1344 3047 590 442 1032
27 Puducherry 87 63 150 656 673 1329 1166 1443 2609
28 Punjab 417 149 566 1808 298 2106 28017 13497 41514
29 Rajasthan 893 319 1212 5968 4321 10289 945 1112 2057
30 Sikkim 22 12 34 53 27 80 330 518 848
31 Tamil Nadu 1797 880 2677 25160 12623 37783 38353 26483 64836
32 Tripura 107 19 126 952 519 1471 219 190 409
33 Uttar Pradesh 2567 16115 18682 36437 37769 74206 3920 3875 7795
34 Uttrakhand 192 77 269 2413 1776 4189 445 520 965
35 West Bengal 1435 701 2136 49835 34588 84423 2268 2913 5181
26507 27468 53975 390543 306081 696624 172912 167455 340367All India
State‐wise Enrolment in PWD and Minority Community
(based on actual response)
Sl No StatePersons with Disability Muslim Other Minority Communities
AISHE 2010-11 T-41
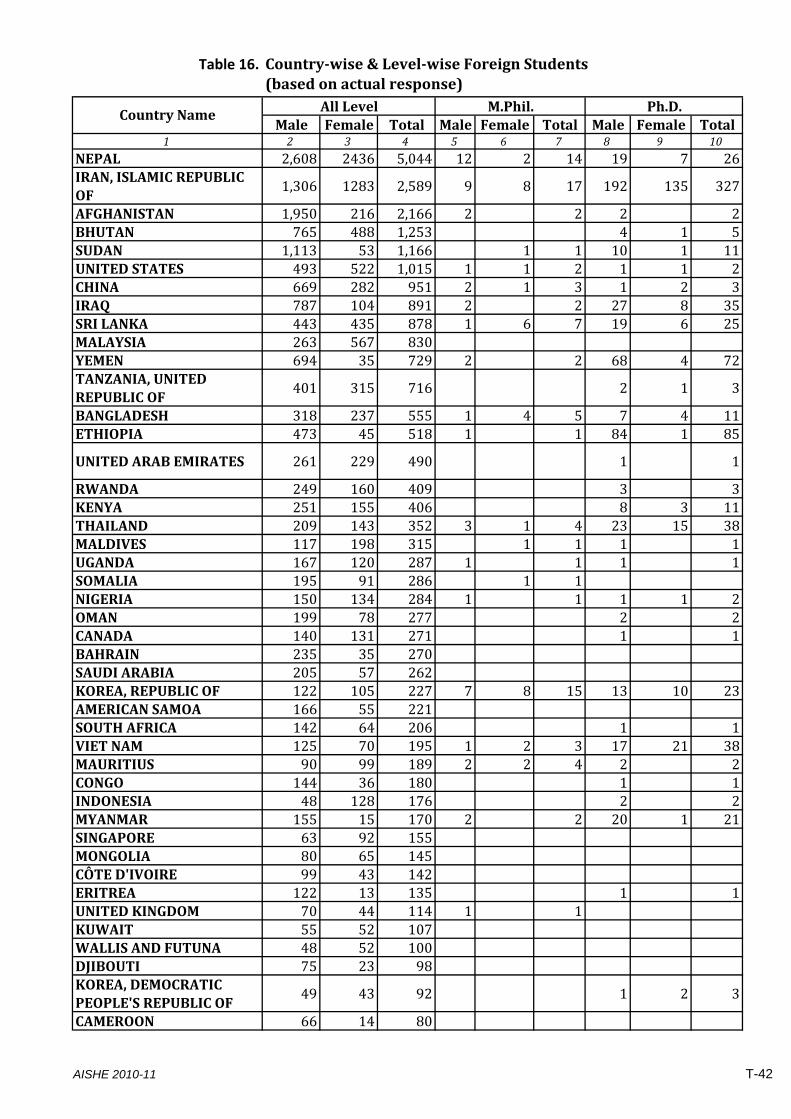
Table 16.
Male Female Total Male Female Total Male Female Total1 2 3 4 5 6 7 8 9 10
NEPAL 2,608 2436 5,044 12 2 14 19 7 26IRAN, ISLAMIC REPUBLIC OF
1,306 1283 2,589 9 8 17 192 135 327
AFGHANISTAN 1,950 216 2,166 2 2 2 2BHUTAN 765 488 1,253 4 1 5SUDAN 1,113 53 1,166 1 1 10 1 11UNITED STATES 493 522 1,015 1 1 2 1 1 2CHINA 669 282 951 2 1 3 1 2 3IRAQ 787 104 891 2 2 27 8 35SRI LANKA 443 435 878 1 6 7 19 6 25MALAYSIA 263 567 830YEMEN 694 35 729 2 2 68 4 72TANZANIA, UNITED REPUBLIC OF
401 315 716 2 1 3
BANGLADESH 318 237 555 1 4 5 7 4 11ETHIOPIA 473 45 518 1 1 84 1 85
UNITED ARAB EMIRATES 261 229 490 1 1
RWANDA 249 160 409 3 3KENYA 251 155 406 8 3 11THAILAND 209 143 352 3 1 4 23 15 38MALDIVES 117 198 315 1 1 1 1UGANDA 167 120 287 1 1 1 1SOMALIA 195 91 286 1 1NIGERIA 150 134 284 1 1 1 1 2OMAN 199 78 277 2 2CANADA 140 131 271 1 1BAHRAIN 235 35 270SAUDI ARABIA 205 57 262KOREA, REPUBLIC OF 122 105 227 7 8 15 13 10 23AMERICAN SAMOA 166 55 221SOUTH AFRICA 142 64 206 1 1VIET NAM 125 70 195 1 2 3 17 21 38MAURITIUS 90 99 189 2 2 4 2 2CONGO 144 36 180 1 1INDONESIA 48 128 176 2 2MYANMAR 155 15 170 2 2 20 1 21SINGAPORE 63 92 155MONGOLIA 80 65 145CÔTE D'IVOIRE 99 43 142ERITREA 122 13 135 1 1UNITED KINGDOM 70 44 114 1 1KUWAIT 55 52 107WALLIS AND FUTUNA 48 52 100DJIBOUTI 75 23 98KOREA, DEMOCRATIC PEOPLE'S REPUBLIC OF
49 43 92 1 2 3
CAMEROON 66 14 80
Countrywise & Levelwise Foreign Students(based on actual response)
Country Name All Level M.Phil. Ph.D.
AISHE 2010-11 T-42
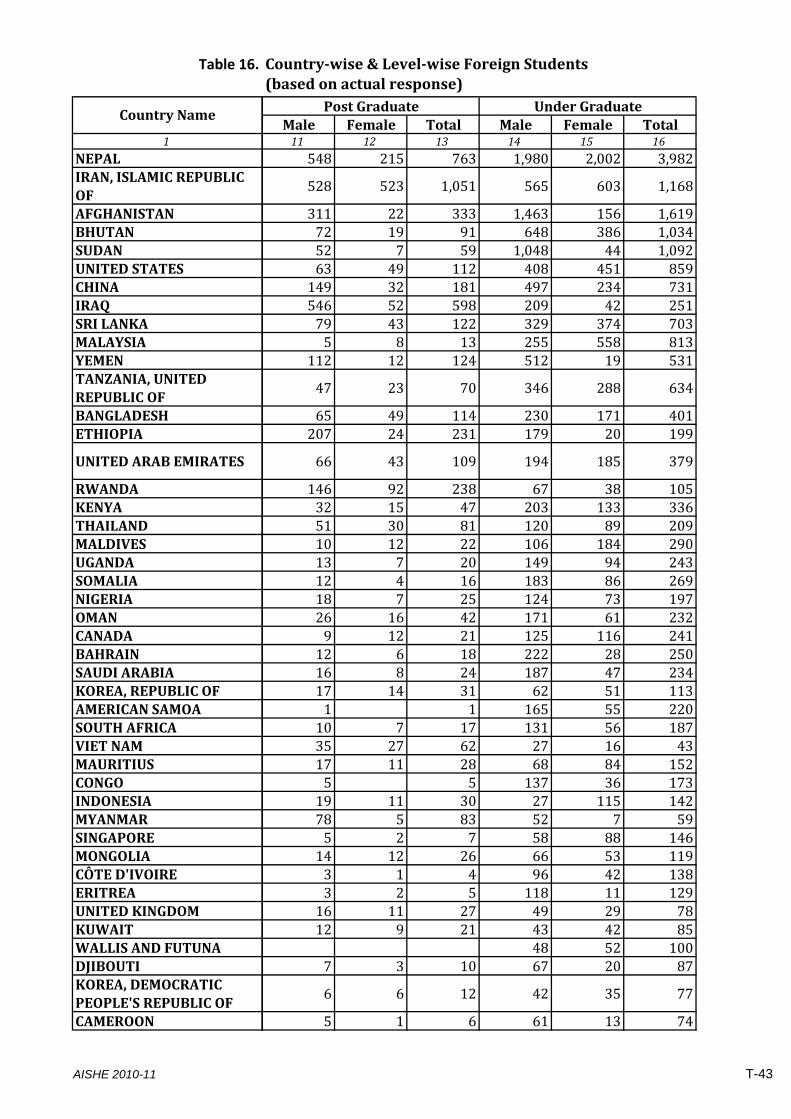
Table 16.
1
NEPALIRAN, ISLAMIC REPUBLIC OFAFGHANISTANBHUTANSUDANUNITED STATESCHINAIRAQSRI LANKAMALAYSIAYEMENTANZANIA, UNITED REPUBLIC OFBANGLADESHETHIOPIA
UNITED ARAB EMIRATES
RWANDAKENYATHAILANDMALDIVESUGANDASOMALIANIGERIAOMANCANADABAHRAINSAUDI ARABIAKOREA, REPUBLIC OFAMERICAN SAMOASOUTH AFRICAVIET NAMMAURITIUSCONGOINDONESIAMYANMARSINGAPOREMONGOLIACÔTE D'IVOIREERITREAUNITED KINGDOMKUWAITWALLIS AND FUTUNADJIBOUTIKOREA, DEMOCRATIC PEOPLE'S REPUBLIC OFCAMEROON
Country NameMale Female Total Male Female Total11 12 13 14 15 16
548 215 763 1,980 2,002 3,982
528 523 1,051 565 603 1,168
311 22 333 1,463 156 1,61972 19 91 648 386 1,03452 7 59 1,048 44 1,09263 49 112 408 451 859149 32 181 497 234 731546 52 598 209 42 25179 43 122 329 374 7035 8 13 255 558 813
112 12 124 512 19 531
47 23 70 346 288 634
65 49 114 230 171 401207 24 231 179 20 199
66 43 109 194 185 379
146 92 238 67 38 10532 15 47 203 133 33651 30 81 120 89 20910 12 22 106 184 29013 7 20 149 94 24312 4 16 183 86 26918 7 25 124 73 19726 16 42 171 61 2329 12 21 125 116 24112 6 18 222 28 25016 8 24 187 47 23417 14 31 62 51 1131 1 165 55 22010 7 17 131 56 18735 27 62 27 16 4317 11 28 68 84 1525 5 137 36 17319 11 30 27 115 14278 5 83 52 7 595 2 7 58 88 14614 12 26 66 53 1193 1 4 96 42 1383 2 5 118 11 12916 11 27 49 29 7812 9 21 43 42 85
48 52 1007 3 10 67 20 87
6 6 12 42 35 77
5 1 6 61 13 74
Countrywise & Levelwise Foreign Students(based on actual response)
Under GraduatePost Graduate
AISHE 2010-11 T-43
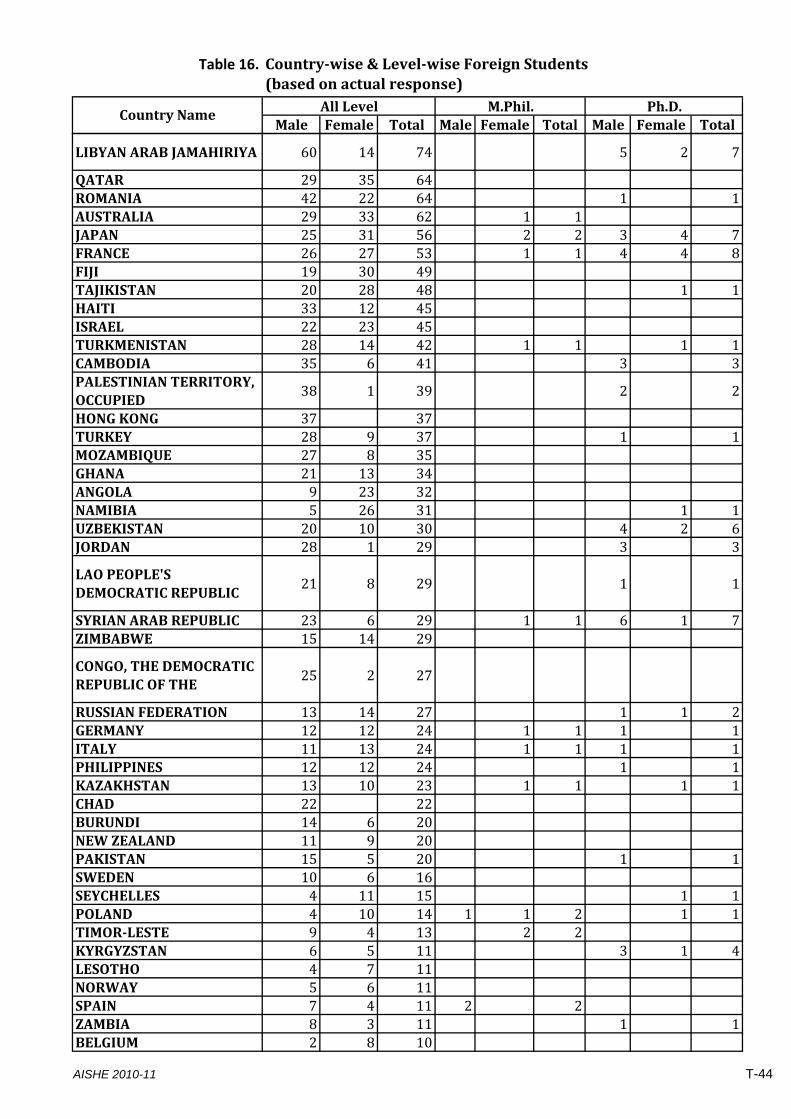
Table 16.
Male Female Total Male Female Total Male Female Total
Countrywise & Levelwise Foreign Students(based on actual response)
Country Name All Level M.Phil. Ph.D.
LIBYAN ARAB JAMAHIRIYA 60 14 74 5 2 7
QATAR 29 35 64ROMANIA 42 22 64 1 1AUSTRALIA 29 33 62 1 1JAPAN 25 31 56 2 2 3 4 7FRANCE 26 27 53 1 1 4 4 8FIJI 19 30 49TAJIKISTAN 20 28 48 1 1HAITI 33 12 45ISRAEL 22 23 45TURKMENISTAN 28 14 42 1 1 1 1CAMBODIA 35 6 41 3 3PALESTINIAN TERRITORY, OCCUPIED
38 1 39 2 2
HONG KONG 37 37TURKEY 28 9 37 1 1MOZAMBIQUE 27 8 35GHANA 21 13 34ANGOLA 9 23 32NAMIBIA 5 26 31 1 1UZBEKISTAN 20 10 30 4 2 6JORDAN 28 1 29 3 3
LAO PEOPLE'S DEMOCRATIC REPUBLIC
21 8 29 1 1
SYRIAN ARAB REPUBLIC 23 6 29 1 1 6 1 7ZIMBABWE 15 14 29
CONGO, THE DEMOCRATIC REPUBLIC OF THE
25 2 27
RUSSIAN FEDERATION 13 14 27 1 1 2GERMANY 12 12 24 1 1 1 1ITALY 11 13 24 1 1 1 1PHILIPPINES 12 12 24 1 1KAZAKHSTAN 13 10 23 1 1 1 1CHAD 22 22BURUNDI 14 6 20NEW ZEALAND 11 9 20PAKISTAN 15 5 20 1 1SWEDEN 10 6 16SEYCHELLES 4 11 15 1 1POLAND 4 10 14 1 1 2 1 1TIMORLESTE 9 4 13 2 2KYRGYZSTAN 6 5 11 3 1 4LESOTHO 4 7 11NORWAY 5 6 11SPAIN 7 4 11 2 2ZAMBIA 8 3 11 1 1BELGIUM 2 8 10
AISHE 2010-11 T-44
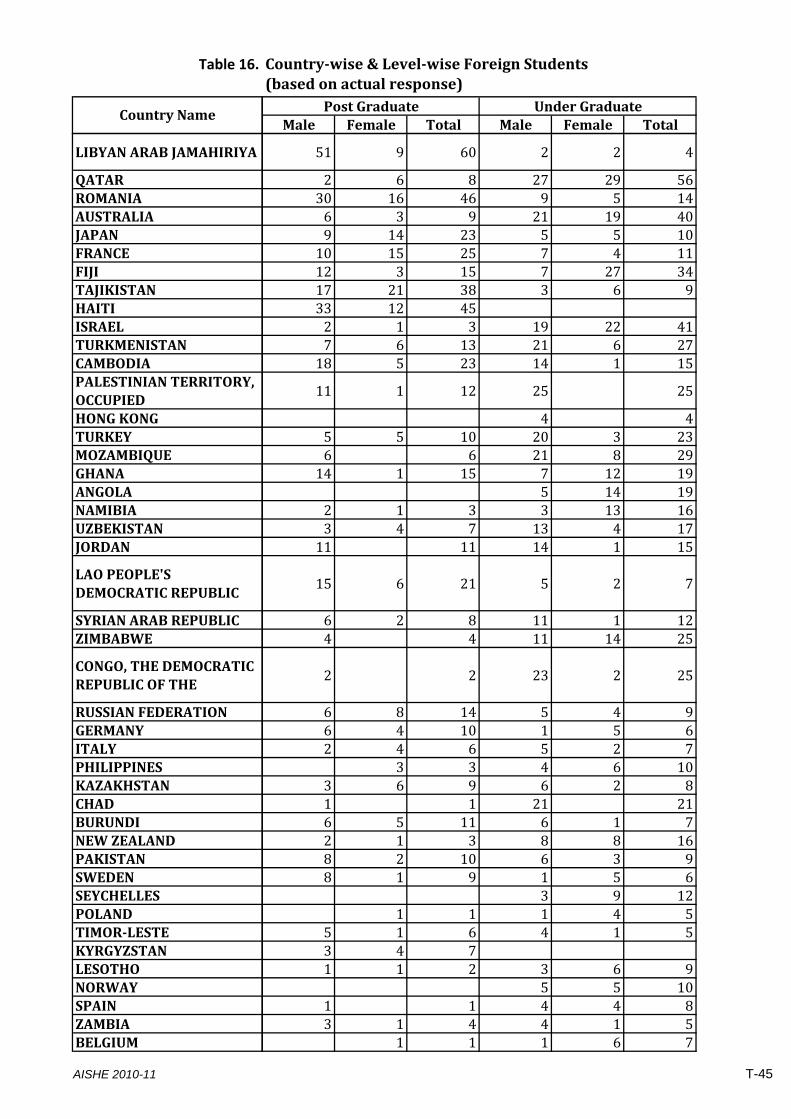
Table 16.
Country Name
LIBYAN ARAB JAMAHIRIYA
QATARROMANIAAUSTRALIAJAPANFRANCEFIJITAJIKISTANHAITIISRAELTURKMENISTANCAMBODIAPALESTINIAN TERRITORY, OCCUPIEDHONG KONGTURKEYMOZAMBIQUEGHANAANGOLANAMIBIAUZBEKISTANJORDAN
LAO PEOPLE'S DEMOCRATIC REPUBLIC
SYRIAN ARAB REPUBLICZIMBABWE
CONGO, THE DEMOCRATIC REPUBLIC OF THE
RUSSIAN FEDERATIONGERMANYITALYPHILIPPINESKAZAKHSTANCHADBURUNDINEW ZEALANDPAKISTANSWEDENSEYCHELLESPOLANDTIMORLESTEKYRGYZSTANLESOTHONORWAYSPAINZAMBIABELGIUM
Male Female Total Male Female Total
Countrywise & Levelwise Foreign Students(based on actual response)
Under GraduatePost Graduate
51 9 60 2 2 4
2 6 8 27 29 5630 16 46 9 5 146 3 9 21 19 409 14 23 5 5 1010 15 25 7 4 1112 3 15 7 27 3417 21 38 3 6 933 12 452 1 3 19 22 417 6 13 21 6 2718 5 23 14 1 15
11 1 12 25 25
4 45 5 10 20 3 236 6 21 8 2914 1 15 7 12 19
5 14 192 1 3 3 13 163 4 7 13 4 1711 11 14 1 15
15 6 21 5 2 7
6 2 8 11 1 124 4 11 14 25
2 2 23 2 25
6 8 14 5 4 96 4 10 1 5 62 4 6 5 2 7
3 3 4 6 103 6 9 6 2 81 1 21 216 5 11 6 1 72 1 3 8 8 168 2 10 6 3 98 1 9 1 5 6
3 9 121 1 1 4 5
5 1 6 4 1 53 4 71 1 2 3 6 9
5 5 101 1 4 4 83 1 4 4 1 5
1 1 1 6 7
AISHE 2010-11 T-45
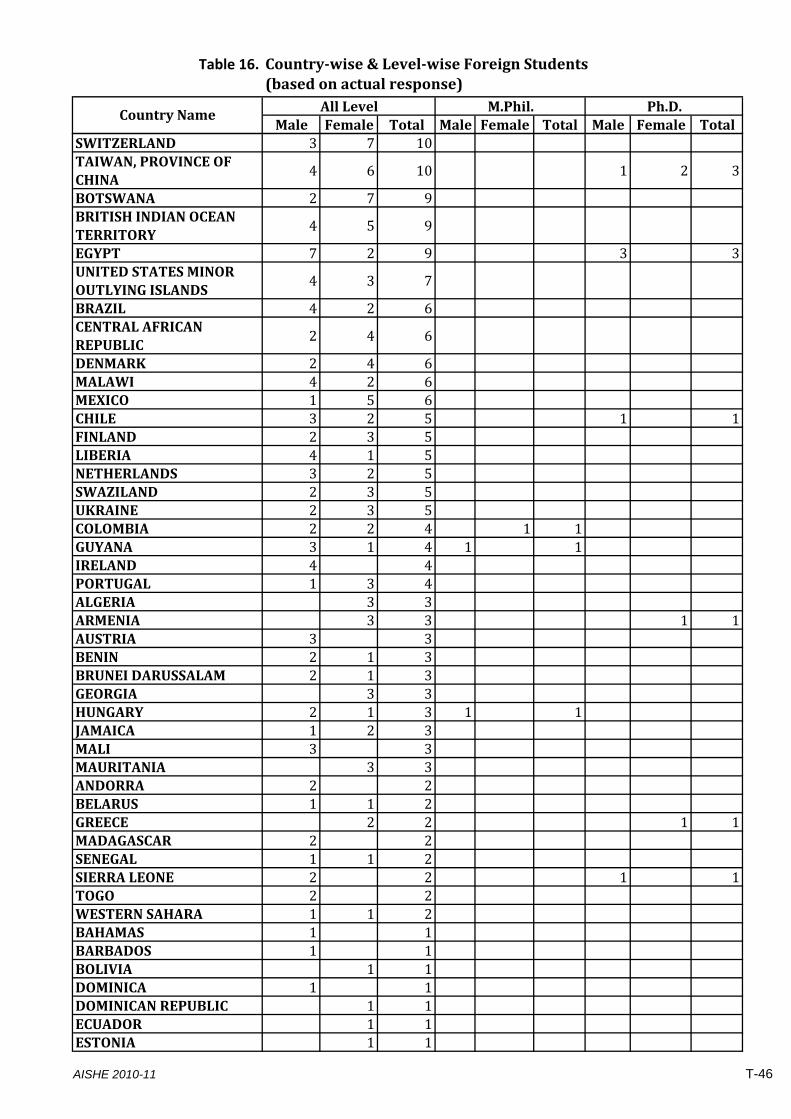
Table 16.
Male Female Total Male Female Total Male Female Total
Countrywise & Levelwise Foreign Students(based on actual response)
Country Name All Level M.Phil. Ph.D.
SWITZERLAND 3 7 10TAIWAN, PROVINCE OF CHINA
4 6 10 1 2 3
BOTSWANA 2 7 9BRITISH INDIAN OCEAN TERRITORY
4 5 9
EGYPT 7 2 9 3 3UNITED STATES MINOR OUTLYING ISLANDS
4 3 7
BRAZIL 4 2 6CENTRAL AFRICAN REPUBLIC
2 4 6
DENMARK 2 4 6MALAWI 4 2 6MEXICO 1 5 6CHILE 3 2 5 1 1FINLAND 2 3 5LIBERIA 4 1 5NETHERLANDS 3 2 5SWAZILAND 2 3 5UKRAINE 2 3 5COLOMBIA 2 2 4 1 1GUYANA 3 1 4 1 1IRELAND 4 4PORTUGAL 1 3 4ALGERIA 3 3ARMENIA 3 3 1 1AUSTRIA 3 3BENIN 2 1 3BRUNEI DARUSSALAM 2 1 3GEORGIA 3 3HUNGARY 2 1 3 1 1JAMAICA 1 2 3MALI 3 3MAURITANIA 3 3ANDORRA 2 2BELARUS 1 1 2GREECE 2 2 1 1MADAGASCAR 2 2SENEGAL 1 1 2SIERRA LEONE 2 2 1 1TOGO 2 2WESTERN SAHARA 1 1 2BAHAMAS 1 1BARBADOS 1 1BOLIVIA 1 1DOMINICA 1 1DOMINICAN REPUBLIC 1 1ECUADOR 1 1ESTONIA 1 1
AISHE 2010-11 T-46

Table 16.
Country Name
SWITZERLANDTAIWAN, PROVINCE OF CHINABOTSWANABRITISH INDIAN OCEAN TERRITORYEGYPTUNITED STATES MINOR OUTLYING ISLANDSBRAZILCENTRAL AFRICAN REPUBLICDENMARKMALAWIMEXICOCHILEFINLANDLIBERIANETHERLANDSSWAZILANDUKRAINECOLOMBIAGUYANAIRELANDPORTUGALALGERIAARMENIAAUSTRIABENINBRUNEI DARUSSALAMGEORGIAHUNGARYJAMAICAMALIMAURITANIAANDORRABELARUSGREECEMADAGASCARSENEGALSIERRA LEONETOGOWESTERN SAHARABAHAMASBARBADOSBOLIVIADOMINICADOMINICAN REPUBLICECUADORESTONIA
Male Female Total Male Female Total
Countrywise & Levelwise Foreign Students(based on actual response)
Under GraduatePost Graduate
1 2 3 1 4 5
1 1 2 2 1 3
1 1 2 1 6 7
1 1 2 4 6
4 2 6
4 3 7
1 1 2 2 4
2 4 6
1 1 2 1 1 24 4 2 2
1 1 1 4 51 1 2 1 1
1 1 2 2 43 3 1 13 1 4 1 12 1 3 2 21 1 2 1 1 2
1 12 1 32 2 2 2
1 3 43 32 2
1 1 2 21 1 2 2
2 1 31 1 2 2
1 1 21 1 2 1 1
3 33 3
1 11 1 2
1 1 1 11 1 21 11 1 1 1
1 11 1
1 11 1
1 11 1
AISHE 2010-11 T-47
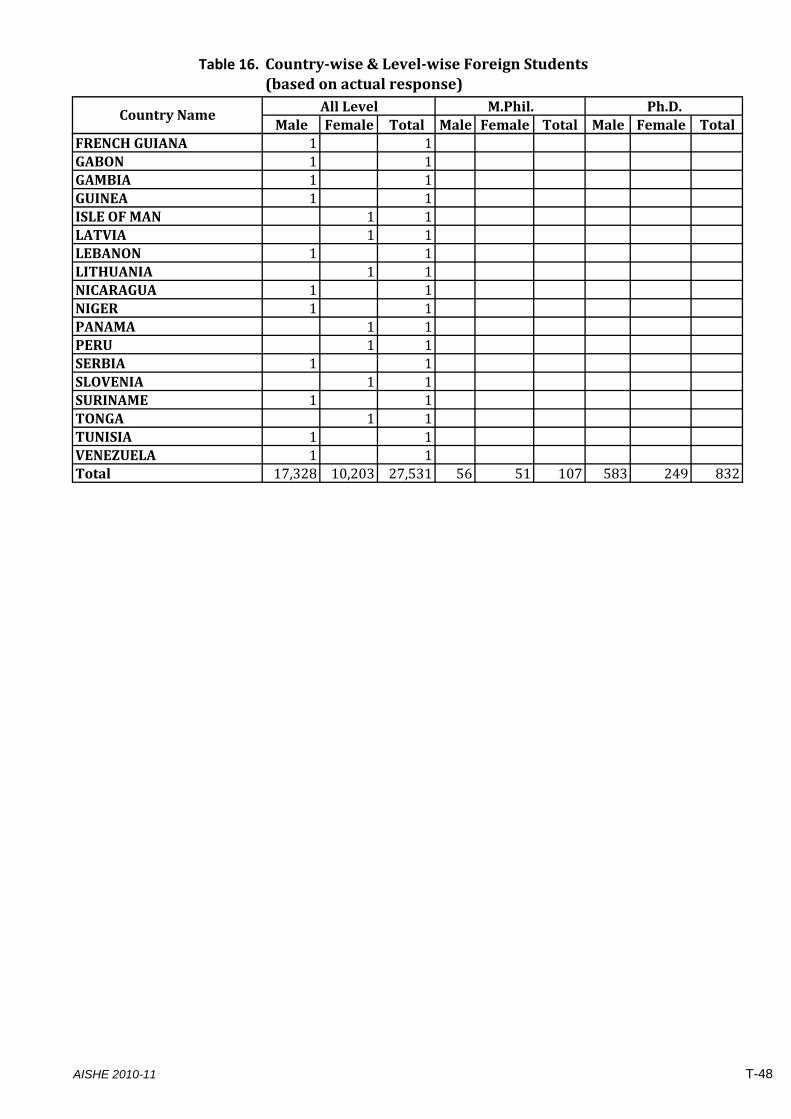
Table 16.
Male Female Total Male Female Total Male Female Total
Countrywise & Levelwise Foreign Students(based on actual response)
Country Name All Level M.Phil. Ph.D.
FRENCH GUIANA 1 1GABON 1 1GAMBIA 1 1GUINEA 1 1ISLE OF MAN 1 1LATVIA 1 1LEBANON 1 1LITHUANIA 1 1NICARAGUA 1 1NIGER 1 1PANAMA 1 1PERU 1 1SERBIA 1 1SLOVENIA 1 1SURINAME 1 1TONGA 1 1TUNISIA 1 1VENEZUELA 1 1Total 17,328 10,203 27,531 56 51 107 583 249 832
AISHE 2010-11 T-48
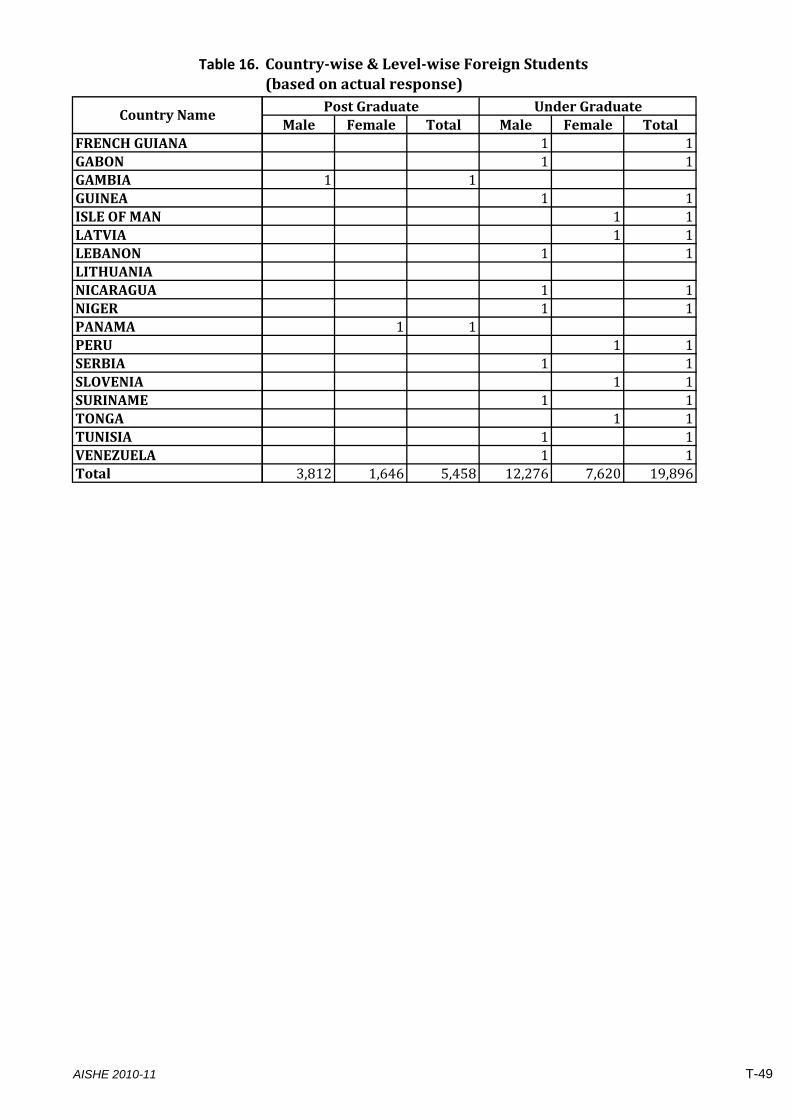
Table 16.
Country Name
FRENCH GUIANAGABONGAMBIAGUINEAISLE OF MANLATVIALEBANONLITHUANIANICARAGUANIGERPANAMAPERUSERBIASLOVENIASURINAMETONGATUNISIAVENEZUELATotal
Male Female Total Male Female Total
Countrywise & Levelwise Foreign Students(based on actual response)
Under GraduatePost Graduate
1 11 1
1 11 1
1 11 1
1 1
1 11 1
1 11 1
1 11 1
1 11 1
1 11 1
3,812 1,646 5,458 12,276 7,620 19,896
AISHE 2010-11 T-49
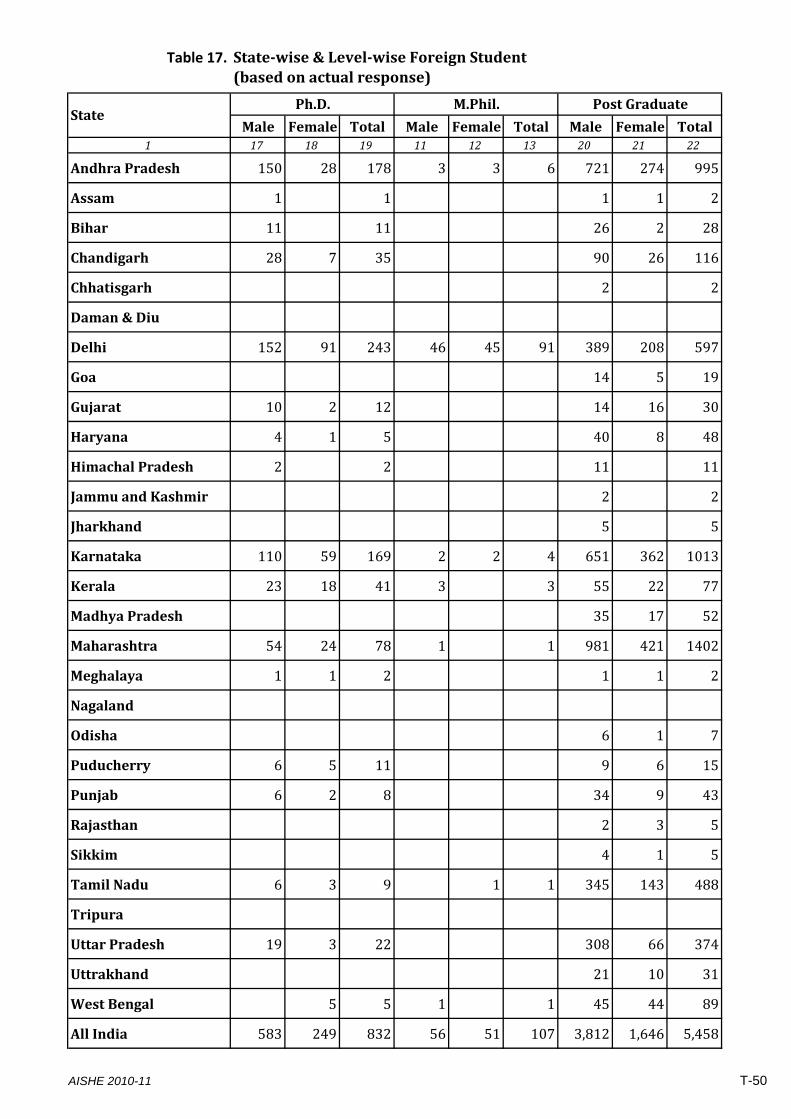
Table 17.
Male Female Total Male Female Total Male Female Total1 17 18 19 11 12 13 20 21 22
Andhra Pradesh 150 28 178 3 3 6 721 274 995
Assam 1 1 1 1 2
Bihar 11 11 26 2 28
Chandigarh 28 7 35 90 26 116
Chhatisgarh 2 2
Daman & Diu
Delhi 152 91 243 46 45 91 389 208 597
Goa 14 5 19
Gujarat 10 2 12 14 16 30
Haryana 4 1 5 40 8 48
Himachal Pradesh 2 2 11 11
Jammu and Kashmir 2 2
Jharkhand 5 5
Karnataka 110 59 169 2 2 4 651 362 1013
Kerala 23 18 41 3 3 55 22 77
Madhya Pradesh 35 17 52
Maharashtra 54 24 78 1 1 981 421 1402
Meghalaya 1 1 2 1 1 2
Nagaland
Odisha 6 1 7
Puducherry 6 5 11 9 6 15
Punjab 6 2 8 34 9 43
Rajasthan 2 3 5
Sikkim 4 1 5
Tamil Nadu 6 3 9 1 1 345 143 488
Tripura
Uttar Pradesh 19 3 22 308 66 374
Uttrakhand 21 10 31
West Bengal 5 5 1 1 45 44 89
All India 583 249 832 56 51 107 3,812 1,646 5,458
StatePh.D. M.Phil. Post Graduate
Statewise & Levelwise Foreign Student(based on actual response)
AISHE 2010-11 T-50
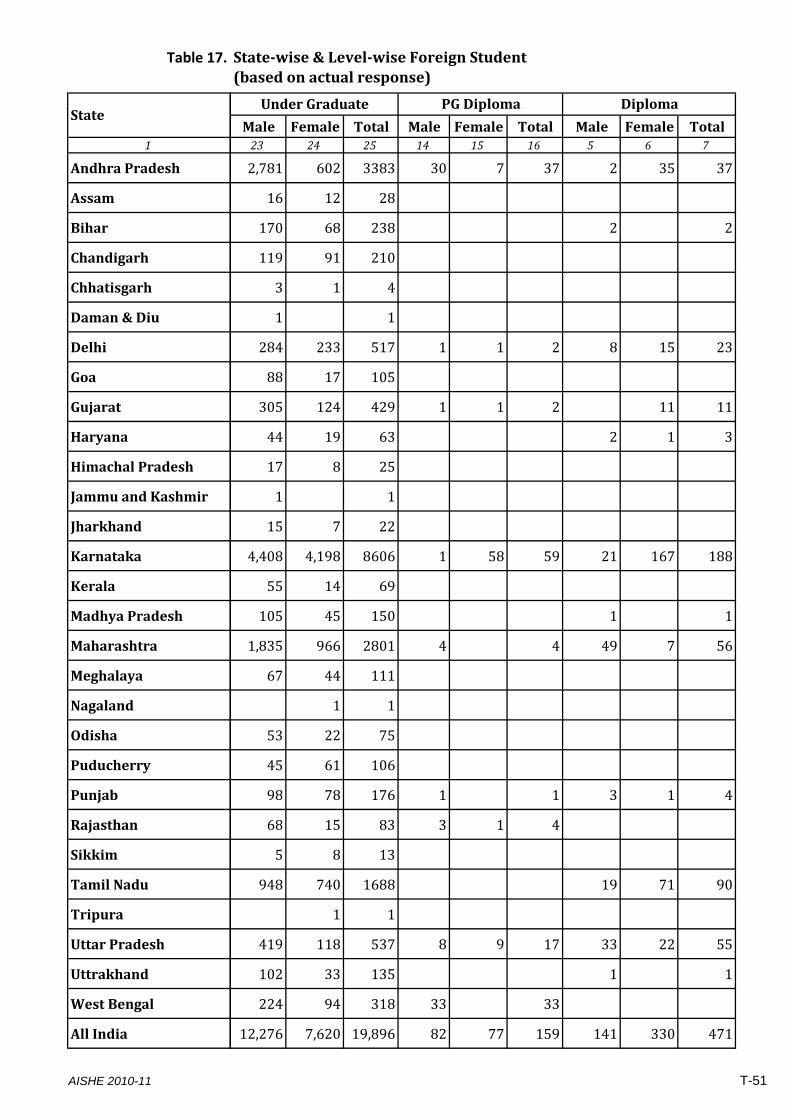
Table 17.
1
Andhra Pradesh
Assam
Bihar
Chandigarh
Chhatisgarh
Daman & Diu
Delhi
Goa
Gujarat
Haryana
Himachal Pradesh
Jammu and Kashmir
Jharkhand
Karnataka
Kerala
Madhya Pradesh
Maharashtra
Meghalaya
Nagaland
Odisha
Puducherry
Punjab
Rajasthan
Sikkim
Tamil Nadu
Tripura
Uttar Pradesh
Uttrakhand
West Bengal
All India
StateMale Female Total Male Female Total Male Female Total23 24 25 14 15 16 5 6 7
2,781 602 3383 30 7 37 2 35 37
16 12 28
170 68 238 2 2
119 91 210
3 1 4
1 1
284 233 517 1 1 2 8 15 23
88 17 105
305 124 429 1 1 2 11 11
44 19 63 2 1 3
17 8 25
1 1
15 7 22
4,408 4,198 8606 1 58 59 21 167 188
55 14 69
105 45 150 1 1
1,835 966 2801 4 4 49 7 56
67 44 111
1 1
53 22 75
45 61 106
98 78 176 1 1 3 1 4
68 15 83 3 1 4
5 8 13
948 740 1688 19 71 90
1 1
419 118 537 8 9 17 33 22 55
102 33 135 1 1
224 94 318 33 33
12,276 7,620 19,896 82 77 159 141 330 471
Under Graduate
Statewise & Levelwise Foreign Student(based on actual response)
DiplomaPG Diploma
AISHE 2010-11 T-51
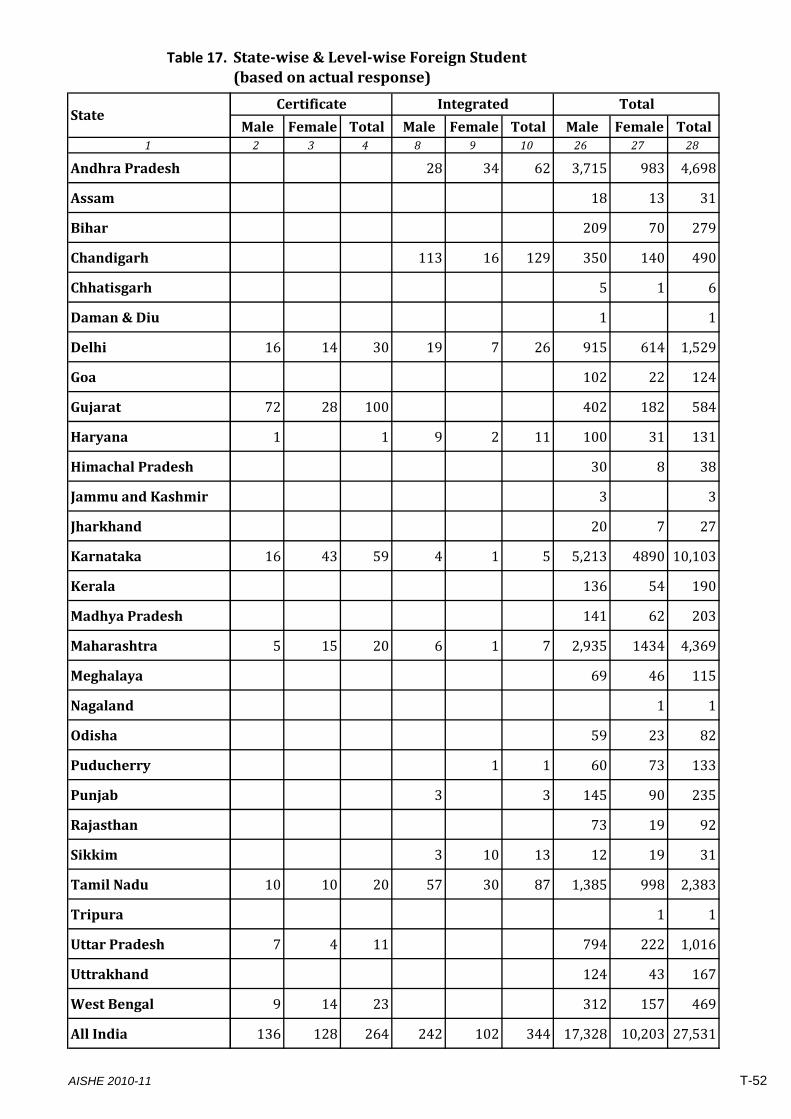
Table 17.
1
Andhra Pradesh
Assam
Bihar
Chandigarh
Chhatisgarh
Daman & Diu
Delhi
Goa
Gujarat
Haryana
Himachal Pradesh
Jammu and Kashmir
Jharkhand
Karnataka
Kerala
Madhya Pradesh
Maharashtra
Meghalaya
Nagaland
Odisha
Puducherry
Punjab
Rajasthan
Sikkim
Tamil Nadu
Tripura
Uttar Pradesh
Uttrakhand
West Bengal
All India
StateMale Female Total Male Female Total Male Female Total2 3 4 8 9 10 26 27 28
28 34 62 3,715 983 4,698
18 13 31
209 70 279
113 16 129 350 140 490
5 1 6
1 1
16 14 30 19 7 26 915 614 1,529
102 22 124
72 28 100 402 182 584
1 1 9 2 11 100 31 131
30 8 38
3 3
20 7 27
16 43 59 4 1 5 5,213 4890 10,103
136 54 190
141 62 203
5 15 20 6 1 7 2,935 1434 4,369
69 46 115
1 1
59 23 82
1 1 60 73 133
3 3 145 90 235
73 19 92
3 10 13 12 19 31
10 10 20 57 30 87 1,385 998 2,383
1 1
7 4 11 794 222 1,016
124 43 167
9 14 23 312 157 469
136 128 264 242 102 344 17,328 10,203 27,531
Statewise & Levelwise Foreign Student(based on actual response)
Certificate Integrated Total
AISHE 2010-11 T-52
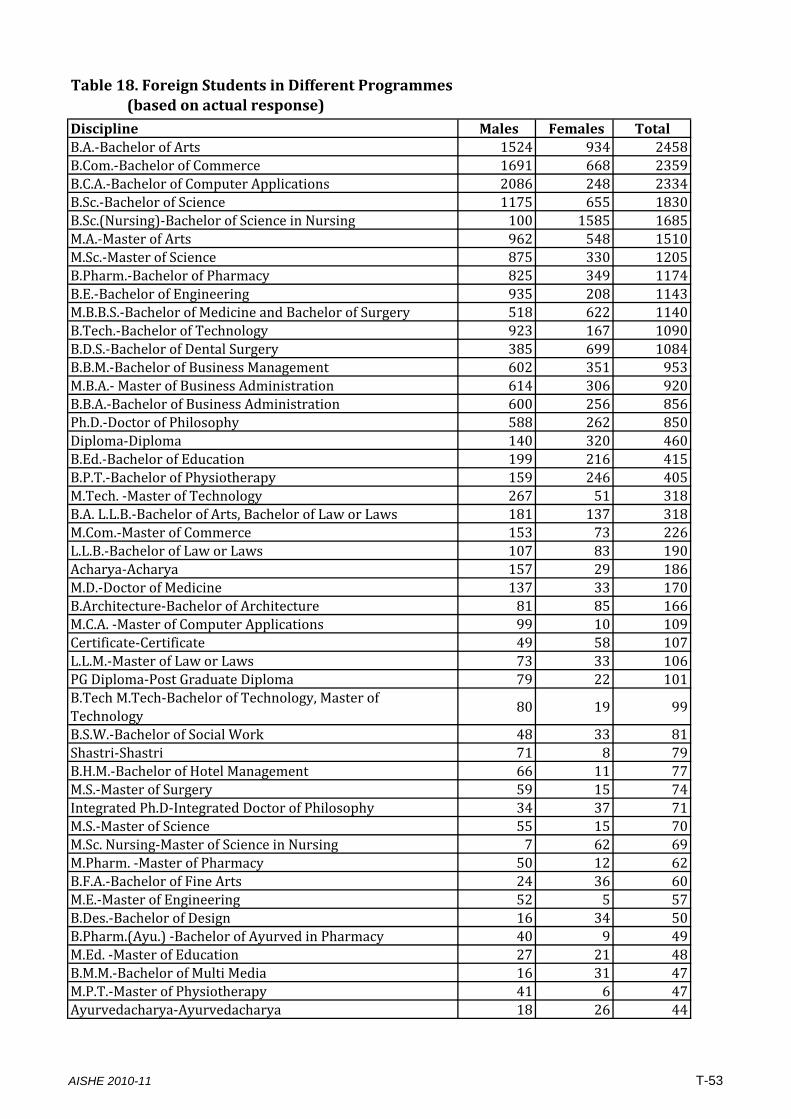
Discipline Males Females TotalB.A.‐Bachelor of Arts 1524 934 2458B.Com.‐Bachelor of Commerce 1691 668 2359B.C.A.‐Bachelor of Computer Applications 2086 248 2334B.Sc.‐Bachelor of Science 1175 655 1830B.Sc.(Nursing)‐Bachelor of Science in Nursing 100 1585 1685M.A.‐Master of Arts 962 548 1510M.Sc.‐Master of Science 875 330 1205B.Pharm.‐Bachelor of Pharmacy 825 349 1174B.E.‐Bachelor of Engineering 935 208 1143M.B.B.S.‐Bachelor of Medicine and Bachelor of Surgery 518 622 1140B.Tech.‐Bachelor of Technology 923 167 1090B.D.S.‐Bachelor of Dental Surgery 385 699 1084B.B.M.‐Bachelor of Business Management 602 351 953M.B.A.‐ Master of Business Administration 614 306 920B.B.A.‐Bachelor of Business Administration 600 256 856Ph.D.‐Doctor of Philosophy 588 262 850Diploma‐Diploma 140 320 460B.Ed.‐Bachelor of Education 199 216 415B.P.T.‐Bachelor of Physiotherapy 159 246 405M.Tech. ‐Master of Technology 267 51 318B.A. L.L.B.‐Bachelor of Arts, Bachelor of Law or Laws 181 137 318M.Com.‐Master of Commerce 153 73 226L.L.B.‐Bachelor of Law or Laws 107 83 190Acharya‐Acharya 157 29 186M.D.‐Doctor of Medicine 137 33 170B.Architecture‐Bachelor of Architecture 81 85 166M.C.A. ‐Master of Computer Applications 99 10 109Certificate‐Certificate 49 58 107L.L.M.‐Master of Law or Laws 73 33 106PG Diploma‐Post Graduate Diploma 79 22 101B.Tech M.Tech‐Bachelor of Technology, Master of Technology
80 19 99
B.S.W.‐Bachelor of Social Work 48 33 81Shastri‐Shastri 71 8 79B.H.M.‐Bachelor of Hotel Management 66 11 77M.S.‐Master of Surgery 59 15 74Integrated Ph.D‐Integrated Doctor of Philosophy 34 37 71M.S.‐Master of Science 55 15 70M.Sc. Nursing‐Master of Science in Nursing 7 62 69M.Pharm. ‐Master of Pharmacy 50 12 62B.F.A.‐Bachelor of Fine Arts 24 36 60M.E.‐Master of Engineering 52 5 57B.Des.‐Bachelor of Design 16 34 50B.Pharm.(Ayu.) ‐Bachelor of Ayurved in Pharmacy 40 9 49M.Ed. ‐Master of Education 27 21 48B.M.M.‐Bachelor of Multi Media 16 31 47M.P.T.‐Master of Physiotherapy 41 6 47Ayurvedacharya‐Ayurvedacharya 18 26 44
Table 18. Foreign Students in Different Programmes (based on actual response)
AISHE 2010-11 T-53
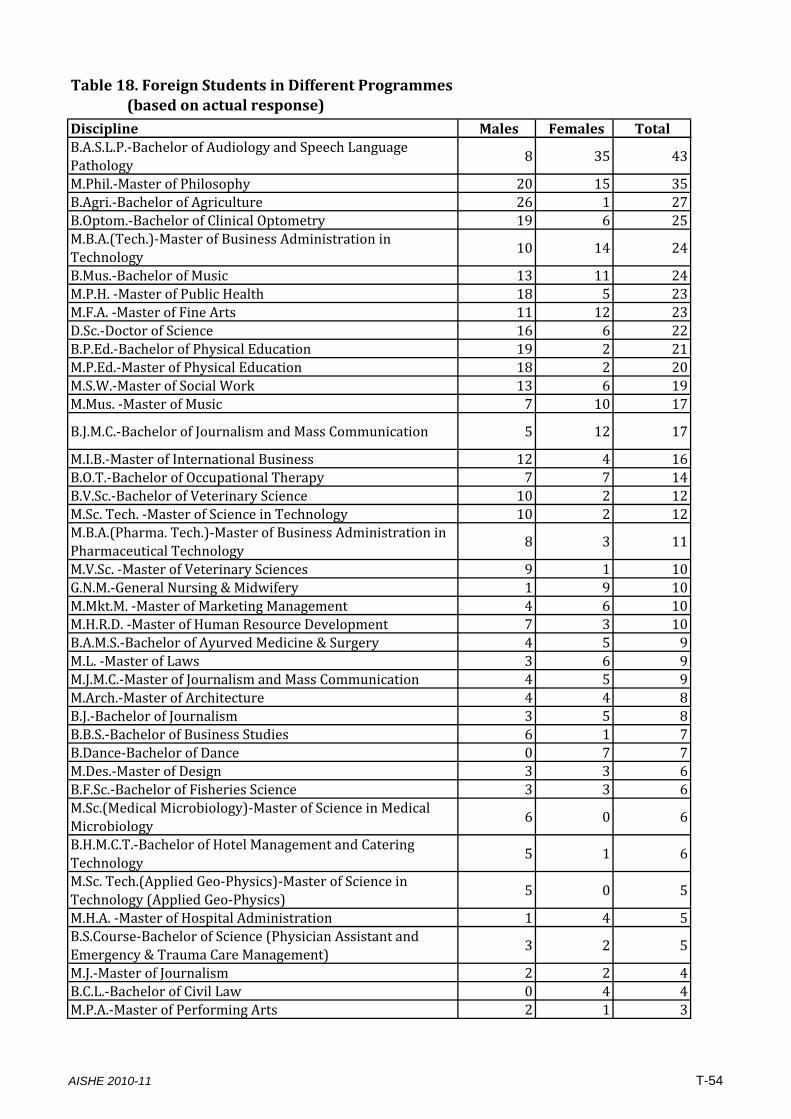
Discipline Males Females Total
Table 18. Foreign Students in Different Programmes (based on actual response)
B.A.S.L.P.‐Bachelor of Audiology and Speech Language Pathology
8 35 43
M.Phil.‐Master of Philosophy 20 15 35B.Agri.‐Bachelor of Agriculture 26 1 27B.Optom.‐Bachelor of Clinical Optometry 19 6 25M.B.A.(Tech.)‐Master of Business Administration in Technology
10 14 24
B.Mus.‐Bachelor of Music 13 11 24M.P.H. ‐Master of Public Health 18 5 23M.F.A. ‐Master of Fine Arts 11 12 23D.Sc.‐Doctor of Science 16 6 22B.P.Ed.‐Bachelor of Physical Education 19 2 21M.P.Ed.‐Master of Physical Education 18 2 20M.S.W.‐Master of Social Work 13 6 19M.Mus. ‐Master of Music 7 10 17
B.J.M.C.‐Bachelor of Journalism and Mass Communication 5 12 17
M.I.B.‐Master of International Business 12 4 16B.O.T.‐Bachelor of Occupational Therapy 7 7 14B.V.Sc.‐Bachelor of Veterinary Science 10 2 12M.Sc. Tech. ‐Master of Science in Technology 10 2 12M.B.A.(Pharma. Tech.)‐Master of Business Administration in Pharmaceutical Technology
8 3 11
M.V.Sc. ‐Master of Veterinary Sciences 9 1 10G.N.M.‐General Nursing & Midwifery 1 9 10M.Mkt.M. ‐Master of Marketing Management 4 6 10M.H.R.D. ‐Master of Human Resource Development 7 3 10B.A.M.S.‐Bachelor of Ayurved Medicine & Surgery 4 5 9M.L. ‐Master of Laws 3 6 9M.J.M.C.‐Master of Journalism and Mass Communication 4 5 9M.Arch.‐Master of Architecture 4 4 8B.J.‐Bachelor of Journalism 3 5 8B.B.S.‐Bachelor of Business Studies 6 1 7B.Dance‐Bachelor of Dance 0 7 7M.Des.‐Master of Design 3 3 6B.F.Sc.‐Bachelor of Fisheries Science 3 3 6M.Sc.(Medical Microbiology)‐Master of Science in Medical Microbiology
6 0 6
B.H.M.C.T.‐Bachelor of Hotel Management and Catering Technology
5 1 6
M.Sc. Tech.(Applied Geo‐Physics)‐Master of Science in Technology (Applied Geo‐Physics)
5 0 5
M.H.A. ‐Master of Hospital Administration 1 4 5B.S.Course‐Bachelor of Science (Physician Assistant and Emergency & Trauma Care Management)
3 2 5
M.J.‐Master of Journalism 2 2 4B.C.L.‐Bachelor of Civil Law 0 4 4M.P.A.‐Master of Performing Arts 2 1 3
AISHE 2010-11 T-54
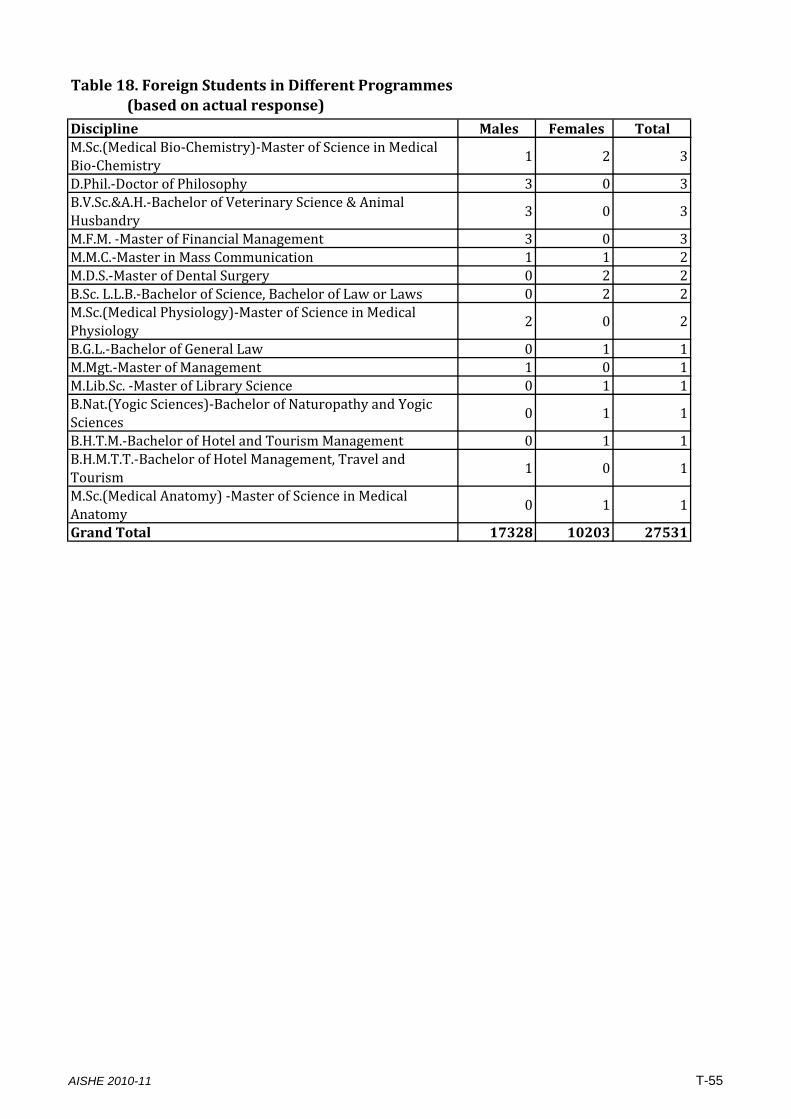
Discipline Males Females Total
Table 18. Foreign Students in Different Programmes (based on actual response)
M.Sc.(Medical Bio‐Chemistry)‐Master of Science in Medical Bio‐Chemistry
1 2 3
D.Phil.‐Doctor of Philosophy 3 0 3B.V.Sc.&A.H.‐Bachelor of Veterinary Science & Animal Husbandry
3 0 3
M.F.M. ‐Master of Financial Management 3 0 3M.M.C.‐Master in Mass Communication 1 1 2M.D.S.‐Master of Dental Surgery 0 2 2B.Sc. L.L.B.‐Bachelor of Science, Bachelor of Law or Laws 0 2 2M.Sc.(Medical Physiology)‐Master of Science in Medical Physiology
2 0 2
B.G.L.‐Bachelor of General Law 0 1 1M.Mgt.‐Master of Management 1 0 1M.Lib.Sc. ‐Master of Library Science 0 1 1B.Nat.(Yogic Sciences)‐Bachelor of Naturopathy and Yogic Sciences
0 1 1
B.H.T.M.‐Bachelor of Hotel and Tourism Management 0 1 1B.H.M.T.T.‐Bachelor of Hotel Management, Travel and Tourism
1 0 1
M.Sc.(Medical Anatomy) ‐Master of Science in Medical Anatomy
0 1 1
Grand Total 17328 10203 27531
AISHE 2010-11 T-55
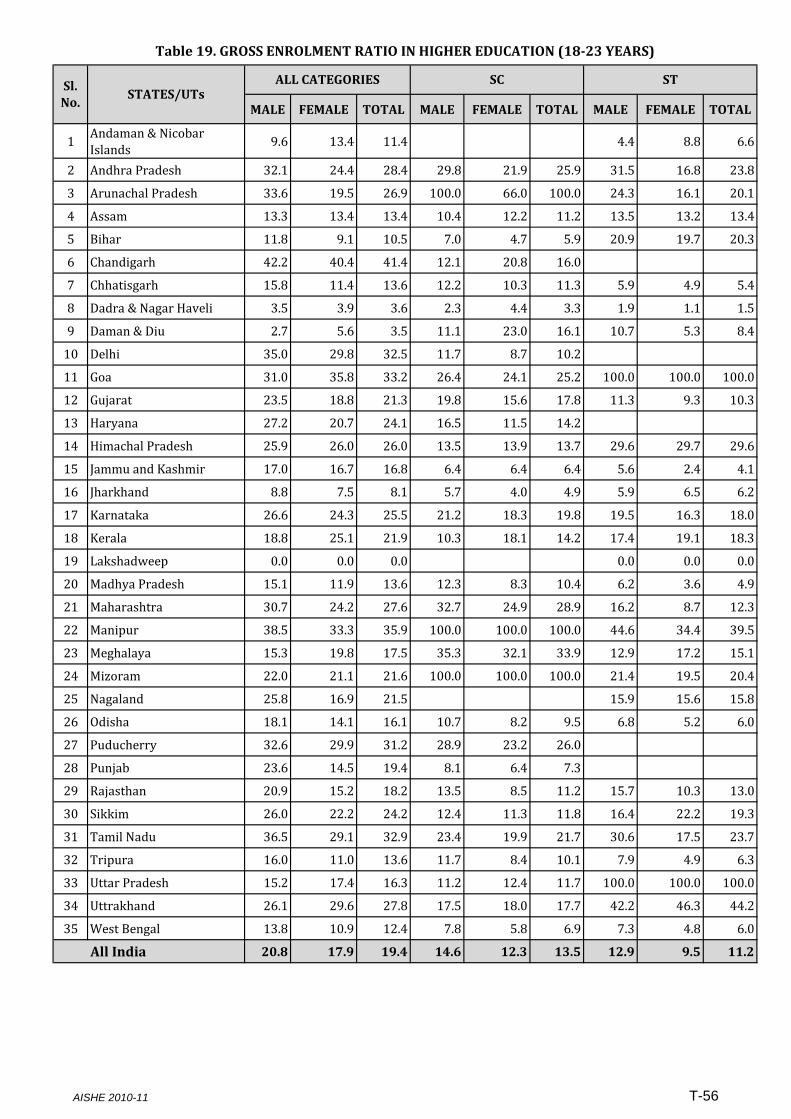
MALE FEMALE TOTAL MALE FEMALE TOTAL MALE FEMALE TOTAL
1Andaman & Nicobar Islands
9.6 13.4 11.4 4.4 8.8 6.6
2 Andhra Pradesh 32.1 24.4 28.4 29.8 21.9 25.9 31.5 16.8 23.8
3 Arunachal Pradesh 33.6 19.5 26.9 100.0 66.0 100.0 24.3 16.1 20.1
4 Assam 13.3 13.4 13.4 10.4 12.2 11.2 13.5 13.2 13.4
5 Bihar 11.8 9.1 10.5 7.0 4.7 5.9 20.9 19.7 20.3
6 Chandigarh 42.2 40.4 41.4 12.1 20.8 16.0
7 Chhatisgarh 15.8 11.4 13.6 12.2 10.3 11.3 5.9 4.9 5.4
8 Dadra & Nagar Haveli 3.5 3.9 3.6 2.3 4.4 3.3 1.9 1.1 1.5
9 Daman & Diu 2.7 5.6 3.5 11.1 23.0 16.1 10.7 5.3 8.4
10 Delhi 35.0 29.8 32.5 11.7 8.7 10.2
11 Goa 31.0 35.8 33.2 26.4 24.1 25.2 100.0 100.0 100.0
12 Gujarat 23.5 18.8 21.3 19.8 15.6 17.8 11.3 9.3 10.3
13 Haryana 27.2 20.7 24.1 16.5 11.5 14.2
14 Himachal Pradesh 25.9 26.0 26.0 13.5 13.9 13.7 29.6 29.7 29.6
15 Jammu and Kashmir 17.0 16.7 16.8 6.4 6.4 6.4 5.6 2.4 4.1
16 Jharkhand 8.8 7.5 8.1 5.7 4.0 4.9 5.9 6.5 6.2
Table 19. GROSS ENROLMENT RATIO IN HIGHER EDUCATION (1823 YEARS)
Sl.No.
STATES/UTsALL CATEGORIES SC ST
17 Karnataka 26.6 24.3 25.5 21.2 18.3 19.8 19.5 16.3 18.0
18 Kerala 18.8 25.1 21.9 10.3 18.1 14.2 17.4 19.1 18.3
19 Lakshadweep 0.0 0.0 0.0 0.0 0.0 0.0
20 Madhya Pradesh 15.1 11.9 13.6 12.3 8.3 10.4 6.2 3.6 4.9
21 Maharashtra 30.7 24.2 27.6 32.7 24.9 28.9 16.2 8.7 12.3
22 Manipur 38.5 33.3 35.9 100.0 100.0 100.0 44.6 34.4 39.5
23 Meghalaya 15.3 19.8 17.5 35.3 32.1 33.9 12.9 17.2 15.1
24 Mizoram 22.0 21.1 21.6 100.0 100.0 100.0 21.4 19.5 20.4
25 Nagaland 25.8 16.9 21.5 15.9 15.6 15.8
26 Odisha 18.1 14.1 16.1 10.7 8.2 9.5 6.8 5.2 6.0
27 Puducherry 32.6 29.9 31.2 28.9 23.2 26.0
28 Punjab 23.6 14.5 19.4 8.1 6.4 7.3
29 Rajasthan 20.9 15.2 18.2 13.5 8.5 11.2 15.7 10.3 13.0
30 Sikkim 26.0 22.2 24.2 12.4 11.3 11.8 16.4 22.2 19.3
31 Tamil Nadu 36.5 29.1 32.9 23.4 19.9 21.7 30.6 17.5 23.7
32 Tripura 16.0 11.0 13.6 11.7 8.4 10.1 7.9 4.9 6.3
33 Uttar Pradesh 15.2 17.4 16.3 11.2 12.4 11.7 100.0 100.0 100.0
34 Uttrakhand 26.1 29.6 27.8 17.5 18.0 17.7 42.2 46.3 44.2
35 West Bengal 13.8 10.9 12.4 7.8 5.8 6.9 7.3 4.8 6.0
All India 20.8 17.9 19.4 14.6 12.3 13.5 12.9 9.5 11.2
AISHE 2010-11 T-56
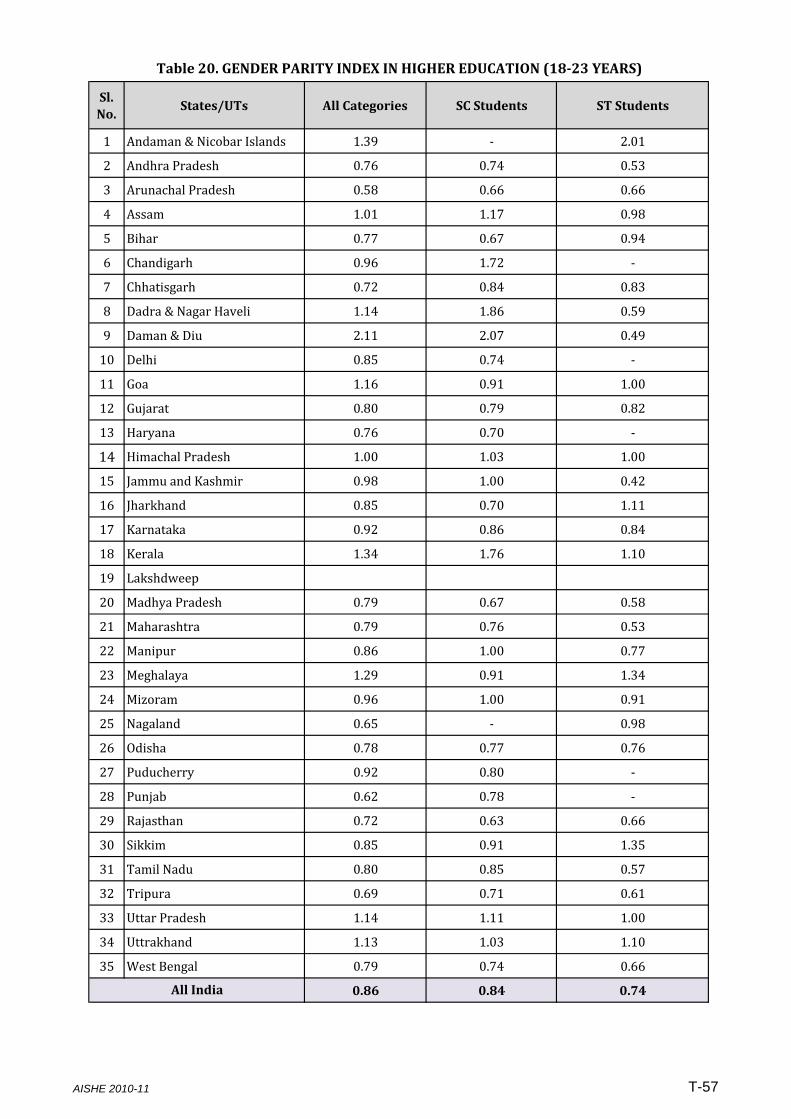
Sl.No.
States/UTs All Categories SC Students ST Students
1 Andaman & Nicobar Islands 1.39 ‐ 2.01
2 Andhra Pradesh 0.76 0.74 0.53
3 Arunachal Pradesh 0.58 0.66 0.66
4 Assam 1.01 1.17 0.98
5 Bihar 0.77 0.67 0.94
6 Chandigarh 0.96 1.72 ‐
7 Chhatisgarh 0.72 0.84 0.83
8 Dadra & Nagar Haveli 1.14 1.86 0.59
9 Daman & Diu 2.11 2.07 0.49
10 Delhi 0.85 0.74 ‐
11 Goa 1.16 0.91 1.00
12 Gujarat 0.80 0.79 0.82
13 Haryana 0.76 0.70 ‐
14 Himachal Pradesh 1.00 1.03 1.00
15 Jammu and Kashmir 0.98 1.00 0.42
16 Jharkhand 0.85 0.70 1.11
17 Karnataka 0.92 0.86 0.84
18 Kerala 1.34 1.76 1.10
19 Lakshdweep
20 Madhya Pradesh 0.79 0.67 0.58
21 Maharashtra 0.79 0.76 0.53
22 Manipur 0.86 1.00 0.77
23 Meghalaya 1.29 0.91 1.34
24 Mizoram 0.96 1.00 0.91
25 Nagaland 0.65 ‐ 0.98
26 Odisha 0.78 0.77 0.76
27 Puducherry 0.92 0.80 ‐
28 Punjab 0.62 0.78 ‐
29 Rajasthan 0.72 0.63 0.66
30 Sikkim 0.85 0.91 1.35
31 Tamil Nadu 0.80 0.85 0.57
32 Tripura 0.69 0.71 0.61
33 Uttar Pradesh 1.14 1.11 1.00
34 Uttrakhand 1.13 1.03 1.10
35 West Bengal 0.79 0.74 0.66
0.86 0.84 0.74
Table 20. GENDER PARITY INDEX IN HIGHER EDUCATION (1823 YEARS)
All India
AISHE 2010-11 T-57
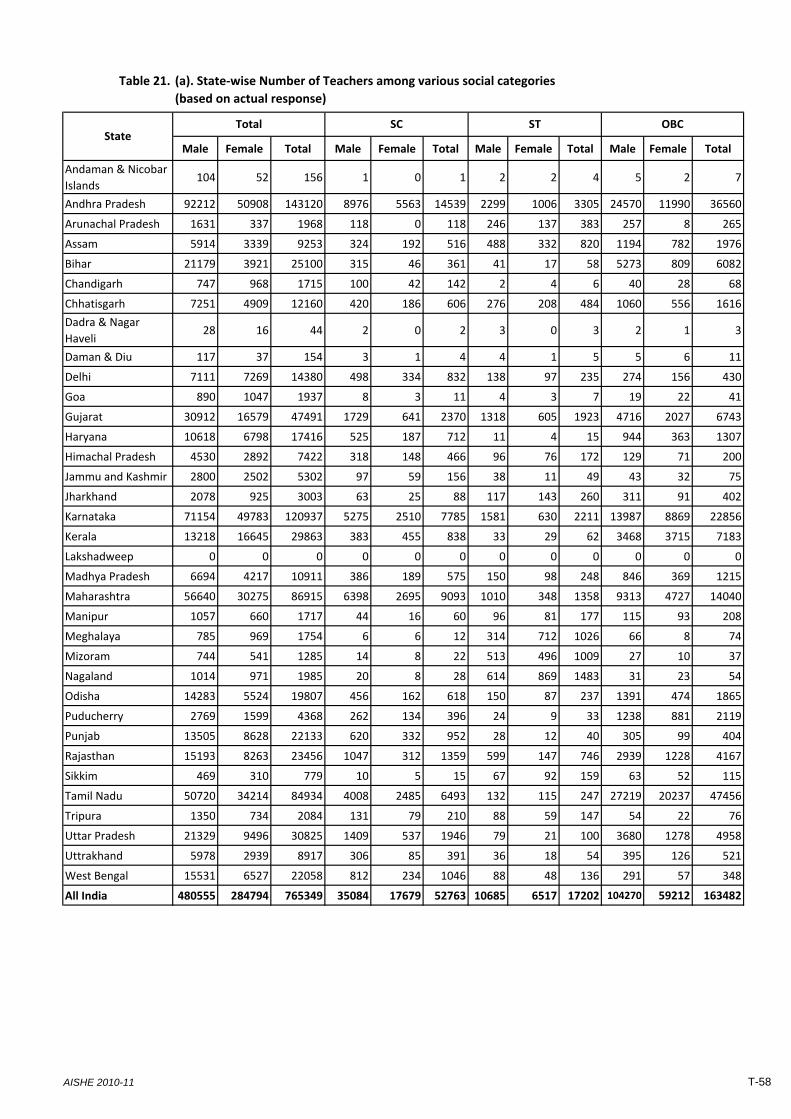
Table 21.
Male Female Total Male Female Total Male Female Total Male Female Total
Andaman & Nicobar
Islands104 52 156 1 0 1 2 2 4 5 2 7
Andhra Pradesh 92212 50908 143120 8976 5563 14539 2299 1006 3305 24570 11990 36560
Arunachal Pradesh 1631 337 1968 118 0 118 246 137 383 257 8 265
Assam 5914 3339 9253 324 192 516 488 332 820 1194 782 1976
Bihar 21179 3921 25100 315 46 361 41 17 58 5273 809 6082
Chandigarh 747 968 1715 100 42 142 2 4 6 40 28 68
Chhatisgarh 7251 4909 12160 420 186 606 276 208 484 1060 556 1616
Dadra & Nagar
Haveli28 16 44 2 0 2 3 0 3 2 1 3
Daman & Diu 117 37 154 3 1 4 4 1 5 5 6 11
Delhi 7111 7269 14380 498 334 832 138 97 235 274 156 430
Goa 890 1047 1937 8 3 11 4 3 7 19 22 41
Gujarat 30912 16579 47491 1729 641 2370 1318 605 1923 4716 2027 6743
Haryana 10618 6798 17416 525 187 712 11 4 15 944 363 1307
Himachal Pradesh 4530 2892 7422 318 148 466 96 76 172 129 71 200
Jammu and Kashmir 2800 2502 5302 97 59 156 38 11 49 43 32 75
Jharkhand 2078 925 3003 63 25 88 117 143 260 311 91 402
Karnataka 71154 49783 120937 5275 2510 7785 1581 630 2211 13987 8869 22856
Kerala 13218 16645 29863 383 455 838 33 29 62 3468 3715 7183
Lakshadweep 0 0 0 0 0 0 0 0 0 0 0 0
Madhya Pradesh 6694 4217 10911 386 189 575 150 98 248 846 369 1215
Maharashtra 56640 30275 86915 6398 2695 9093 1010 348 1358 9313 4727 14040
Manipur 1057 660 1717 44 16 60 96 81 177 115 93 208
Meghalaya 785 969 1754 6 6 12 314 712 1026 66 8 74
Mizoram 744 541 1285 14 8 22 513 496 1009 27 10 37
Nagaland 1014 971 1985 20 8 28 614 869 1483 31 23 54
Odisha 14283 5524 19807 456 162 618 150 87 237 1391 474 1865
Puducherry 2769 1599 4368 262 134 396 24 9 33 1238 881 2119
Punjab 13505 8628 22133 620 332 952 28 12 40 305 99 404
Rajasthan 15193 8263 23456 1047 312 1359 599 147 746 2939 1228 4167
Sikkim 469 310 779 10 5 15 67 92 159 63 52 115
Tamil Nadu 50720 34214 84934 4008 2485 6493 132 115 247 27219 20237 47456
Tripura 1350 734 2084 131 79 210 88 59 147 54 22 76
Uttar Pradesh 21329 9496 30825 1409 537 1946 79 21 100 3680 1278 4958
Uttrakhand 5978 2939 8917 306 85 391 36 18 54 395 126 521
West Bengal 15531 6527 22058 812 234 1046 88 48 136 291 57 348
All India 480555 284794 765349 35084 17679 52763 10685 6517 17202 104270 59212 163482
(a). State‐wise Number of Teachers among various social categories
(based on actual response)
StateTotal SC ST OBC
AISHE 2010-11 T-58
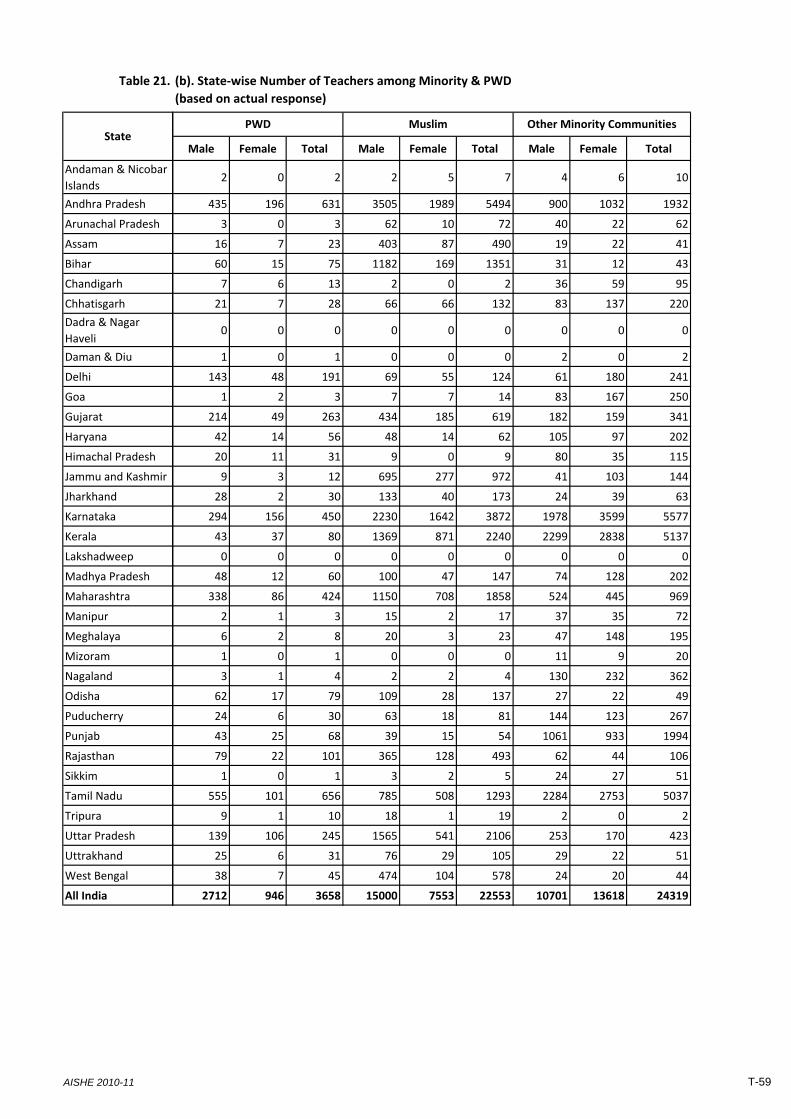
Table 21.
Andaman & Nicobar
Islands
Andhra Pradesh
Arunachal Pradesh
Assam
Bihar
Chandigarh
Chhatisgarh
Dadra & Nagar
Haveli
Daman & Diu
Delhi
Goa
Gujarat
Haryana
Himachal Pradesh
Jammu and Kashmir
Jharkhand
Karnataka
Kerala
Lakshadweep
Madhya Pradesh
Maharashtra
Manipur
Meghalaya
Mizoram
Nagaland
Odisha
Puducherry
Punjab
Rajasthan
Sikkim
Tamil Nadu
Tripura
Uttar Pradesh
Uttrakhand
West Bengal
All India
StateMale Female Total Male Female Total Male Female Total
2 0 2 2 5 7 4 6 10
435 196 631 3505 1989 5494 900 1032 1932
3 0 3 62 10 72 40 22 62
16 7 23 403 87 490 19 22 41
60 15 75 1182 169 1351 31 12 43
7 6 13 2 0 2 36 59 95
21 7 28 66 66 132 83 137 220
0 0 0 0 0 0 0 0 0
1 0 1 0 0 0 2 0 2
143 48 191 69 55 124 61 180 241
1 2 3 7 7 14 83 167 250
214 49 263 434 185 619 182 159 341
42 14 56 48 14 62 105 97 202
20 11 31 9 0 9 80 35 115
9 3 12 695 277 972 41 103 144
28 2 30 133 40 173 24 39 63
294 156 450 2230 1642 3872 1978 3599 5577
43 37 80 1369 871 2240 2299 2838 5137
0 0 0 0 0 0 0 0 0
48 12 60 100 47 147 74 128 202
338 86 424 1150 708 1858 524 445 969
2 1 3 15 2 17 37 35 72
6 2 8 20 3 23 47 148 195
1 0 1 0 0 0 11 9 20
3 1 4 2 2 4 130 232 362
62 17 79 109 28 137 27 22 49
24 6 30 63 18 81 144 123 267
43 25 68 39 15 54 1061 933 1994
79 22 101 365 128 493 62 44 106
1 0 1 3 2 5 24 27 51
555 101 656 785 508 1293 2284 2753 5037
9 1 10 18 1 19 2 0 2
139 106 245 1565 541 2106 253 170 423
25 6 31 76 29 105 29 22 51
38 7 45 474 104 578 24 20 44
2712 946 3658 15000 7553 22553 10701 13618 24319
(b). State‐wise Number of Teachers among Minority & PWD
(based on actual response)
Muslim Other Minority CommunitiesPWD
AISHE 2010-11 T-59
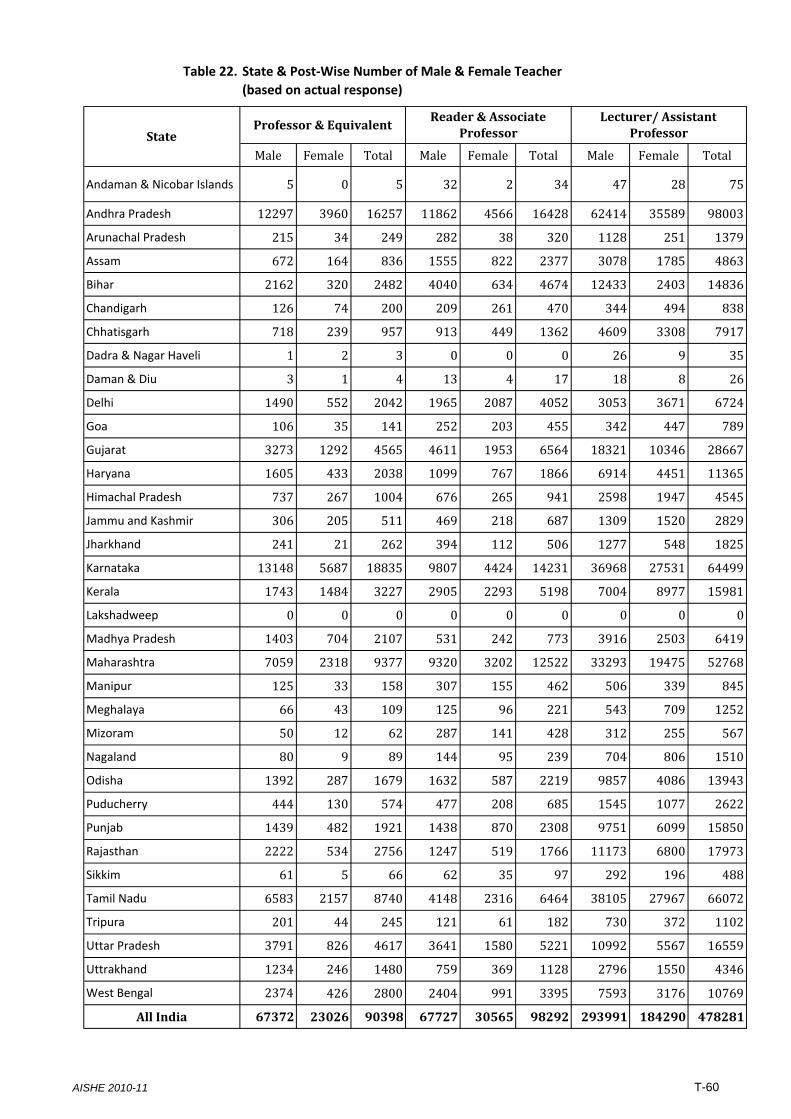
Table 22.
Male Female Total Male Female Total Male Female Total
Andaman & Nicobar Islands 5 0 5 32 2 34 47 28 75
Andhra Pradesh 12297 3960 16257 11862 4566 16428 62414 35589 98003
Arunachal Pradesh 215 34 249 282 38 320 1128 251 1379
Assam 672 164 836 1555 822 2377 3078 1785 4863
Bihar 2162 320 2482 4040 634 4674 12433 2403 14836
Chandigarh 126 74 200 209 261 470 344 494 838
Chhatisgarh 718 239 957 913 449 1362 4609 3308 7917
Dadra & Nagar Haveli 1 2 3 0 0 0 26 9 35
Daman & Diu 3 1 4 13 4 17 18 8 26
Delhi 1490 552 2042 1965 2087 4052 3053 3671 6724
Goa 106 35 141 252 203 455 342 447 789
Gujarat 3273 1292 4565 4611 1953 6564 18321 10346 28667
Haryana 1605 433 2038 1099 767 1866 6914 4451 11365
Himachal Pradesh 737 267 1004 676 265 941 2598 1947 4545
Jammu and Kashmir 306 205 511 469 218 687 1309 1520 2829
Jharkhand 241 21 262 394 112 506 1277 548 1825
Karnataka 13148 5687 18835 9807 4424 14231 36968 27531 64499
Kerala 1743 1484 3227 2905 2293 5198 7004 8977 15981
Lakshadweep 0 0 0 0 0 0 0 0 0
Madhya Pradesh 1403 704 2107 531 242 773 3916 2503 6419
Maharashtra 7059 2318 9377 9320 3202 12522 33293 19475 52768
Manipur 125 33 158 307 155 462 506 339 845
Meghalaya 66 43 109 125 96 221 543 709 1252
Mizoram 50 12 62 287 141 428 312 255 567
Nagaland 80 9 89 144 95 239 704 806 1510
Odisha 1392 287 1679 1632 587 2219 9857 4086 13943
Puducherry 444 130 574 477 208 685 1545 1077 2622
Punjab 1439 482 1921 1438 870 2308 9751 6099 15850
Rajasthan 2222 534 2756 1247 519 1766 11173 6800 17973
Sikkim 61 5 66 62 35 97 292 196 488
Tamil Nadu 6583 2157 8740 4148 2316 6464 38105 27967 66072
Tripura 201 44 245 121 61 182 730 372 1102
Uttar Pradesh 3791 826 4617 3641 1580 5221 10992 5567 16559
Uttrakhand 1234 246 1480 759 369 1128 2796 1550 4346
West Bengal 2374 426 2800 2404 991 3395 7593 3176 10769
All India 67372 23026 90398 67727 30565 98292 293991 184290 478281
State & Post‐Wise Number of Male & Female Teacher
(based on actual response)
StateProfessor & Equivalent
Reader & Associate Professor
Lecturer/ Assistant Professor
AISHE 2010-11 T-60
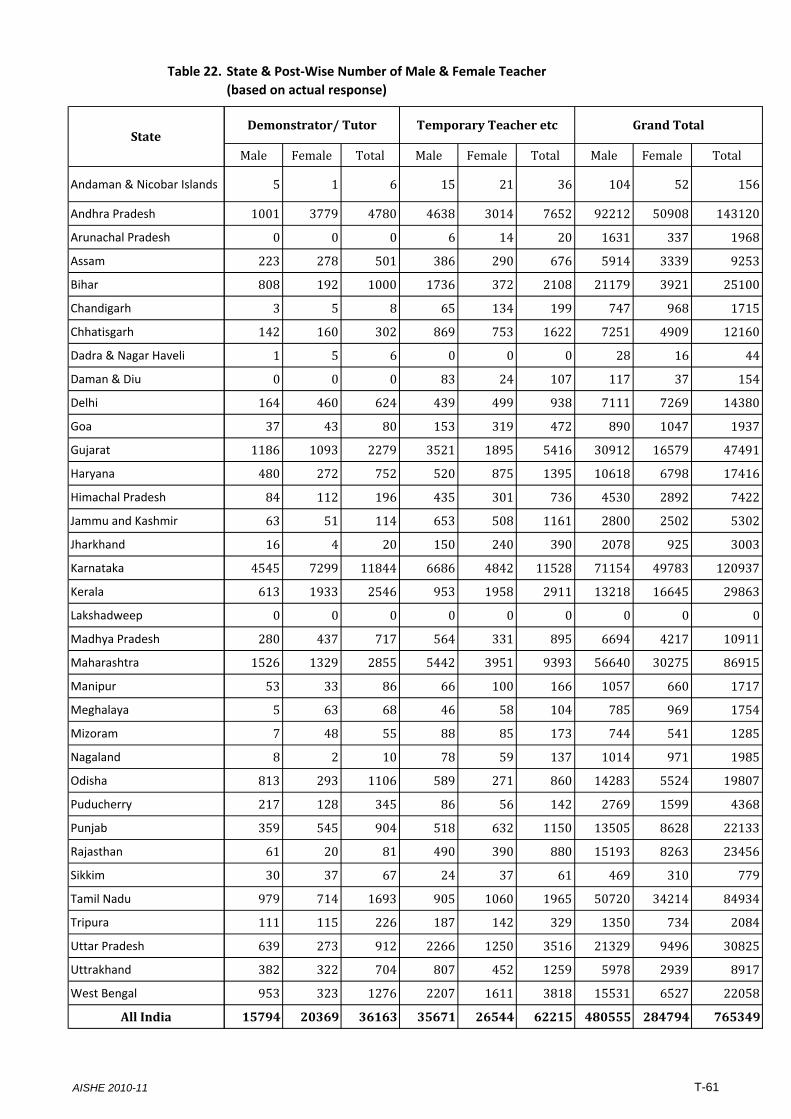
Table 22.
Andaman & Nicobar Islands
Andhra Pradesh
Arunachal Pradesh
Assam
Bihar
Chandigarh
Chhatisgarh
Dadra & Nagar Haveli
Daman & Diu
Delhi
Goa
Gujarat
Haryana
Himachal Pradesh
Jammu and Kashmir
Jharkhand
Karnataka
Kerala
Lakshadweep
Madhya Pradesh
Maharashtra
Manipur
Meghalaya
Mizoram
Nagaland
Odisha
Puducherry
Punjab
Rajasthan
Sikkim
Tamil Nadu
Tripura
Uttar Pradesh
Uttrakhand
West Bengal
All India
StateMale Female Total Male Female Total Male Female Total
5 1 6 15 21 36 104 52 156
1001 3779 4780 4638 3014 7652 92212 50908 143120
0 0 0 6 14 20 1631 337 1968
223 278 501 386 290 676 5914 3339 9253
808 192 1000 1736 372 2108 21179 3921 25100
3 5 8 65 134 199 747 968 1715
142 160 302 869 753 1622 7251 4909 12160
1 5 6 0 0 0 28 16 44
0 0 0 83 24 107 117 37 154
164 460 624 439 499 938 7111 7269 14380
37 43 80 153 319 472 890 1047 1937
1186 1093 2279 3521 1895 5416 30912 16579 47491
480 272 752 520 875 1395 10618 6798 17416
84 112 196 435 301 736 4530 2892 7422
63 51 114 653 508 1161 2800 2502 5302
16 4 20 150 240 390 2078 925 3003
4545 7299 11844 6686 4842 11528 71154 49783 120937
613 1933 2546 953 1958 2911 13218 16645 29863
0 0 0 0 0 0 0 0 0
280 437 717 564 331 895 6694 4217 10911
1526 1329 2855 5442 3951 9393 56640 30275 86915
53 33 86 66 100 166 1057 660 1717
5 63 68 46 58 104 785 969 1754
7 48 55 88 85 173 744 541 1285
8 2 10 78 59 137 1014 971 1985
813 293 1106 589 271 860 14283 5524 19807
217 128 345 86 56 142 2769 1599 4368
359 545 904 518 632 1150 13505 8628 22133
61 20 81 490 390 880 15193 8263 23456
30 37 67 24 37 61 469 310 779
979 714 1693 905 1060 1965 50720 34214 84934
111 115 226 187 142 329 1350 734 2084
639 273 912 2266 1250 3516 21329 9496 30825
382 322 704 807 452 1259 5978 2939 8917
953 323 1276 2207 1611 3818 15531 6527 22058
15794 20369 36163 35671 26544 62215 480555 284794 765349
State & Post‐Wise Number of Male & Female Teacher
(based on actual response)
Temporary Teacher etc Grand TotalDemonstrator/ Tutor
AISHE 2010-11 T-61
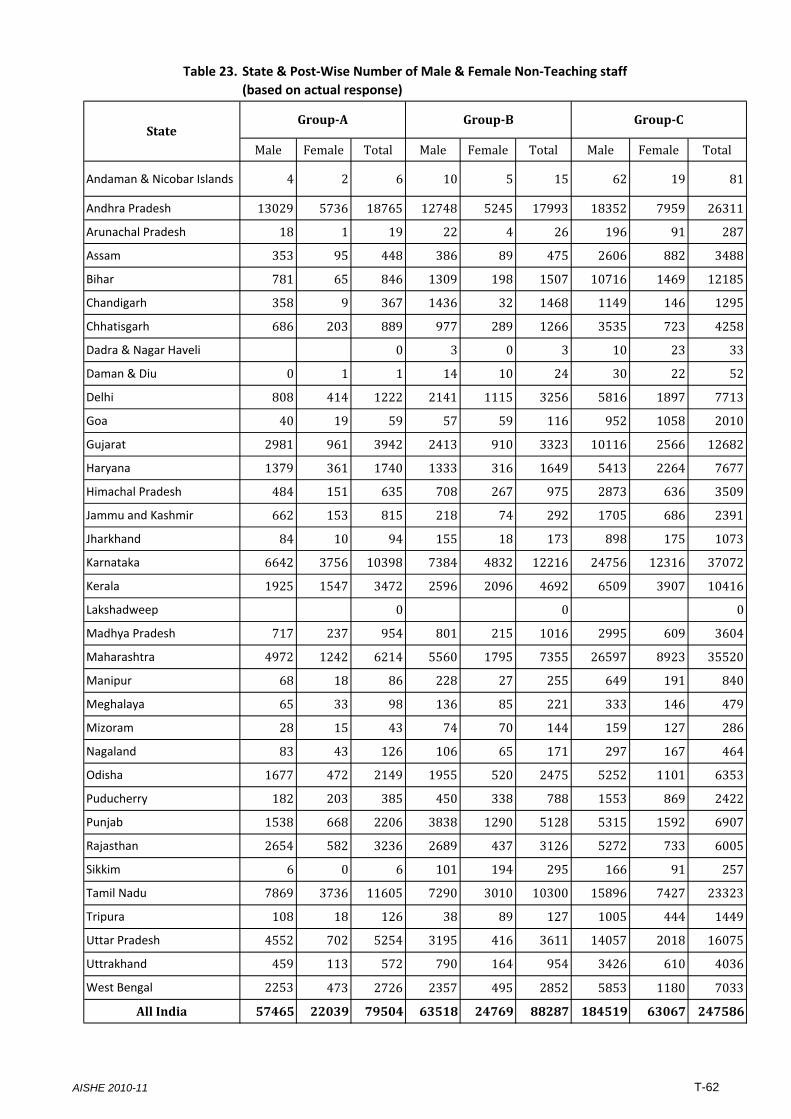
Table 23.
Male Female Total Male Female Total Male Female Total
Andaman & Nicobar Islands 4 2 6 10 5 15 62 19 81
Andhra Pradesh 13029 5736 18765 12748 5245 17993 18352 7959 26311
Arunachal Pradesh 18 1 19 22 4 26 196 91 287
Assam 353 95 448 386 89 475 2606 882 3488
Bihar 781 65 846 1309 198 1507 10716 1469 12185
Chandigarh 358 9 367 1436 32 1468 1149 146 1295
Chhatisgarh 686 203 889 977 289 1266 3535 723 4258
Dadra & Nagar Haveli 0 3 0 3 10 23 33
Daman & Diu 0 1 1 14 10 24 30 22 52
Delhi 808 414 1222 2141 1115 3256 5816 1897 7713
Goa 40 19 59 57 59 116 952 1058 2010
Gujarat 2981 961 3942 2413 910 3323 10116 2566 12682
Haryana 1379 361 1740 1333 316 1649 5413 2264 7677
Himachal Pradesh 484 151 635 708 267 975 2873 636 3509
Jammu and Kashmir 662 153 815 218 74 292 1705 686 2391
Jharkhand 84 10 94 155 18 173 898 175 1073
Karnataka 6642 3756 10398 7384 4832 12216 24756 12316 37072
Kerala 1925 1547 3472 2596 2096 4692 6509 3907 10416
Lakshadweep 0 0 0
Madhya Pradesh 717 237 954 801 215 1016 2995 609 3604
Maharashtra 4972 1242 6214 5560 1795 7355 26597 8923 35520
Manipur 68 18 86 228 27 255 649 191 840
Meghalaya 65 33 98 136 85 221 333 146 479
Mizoram 28 15 43 74 70 144 159 127 286
Nagaland 83 43 126 106 65 171 297 167 464
Odisha 1677 472 2149 1955 520 2475 5252 1101 6353
Puducherry 182 203 385 450 338 788 1553 869 2422
Punjab 1538 668 2206 3838 1290 5128 5315 1592 6907
Rajasthan 2654 582 3236 2689 437 3126 5272 733 6005
Sikkim 6 0 6 101 194 295 166 91 257
Tamil Nadu 7869 3736 11605 7290 3010 10300 15896 7427 23323
Tripura 108 18 126 38 89 127 1005 444 1449
Uttar Pradesh 4552 702 5254 3195 416 3611 14057 2018 16075
Uttrakhand 459 113 572 790 164 954 3426 610 4036
West Bengal 2253 473 2726 2357 495 2852 5853 1180 7033
All India 57465 22039 79504 63518 24769 88287 184519 63067 247586
State & Post‐Wise Number of Male & Female Non‐Teaching staff
(based on actual response)
StateGroupA GroupB GroupC
AISHE 2010-11 T-62
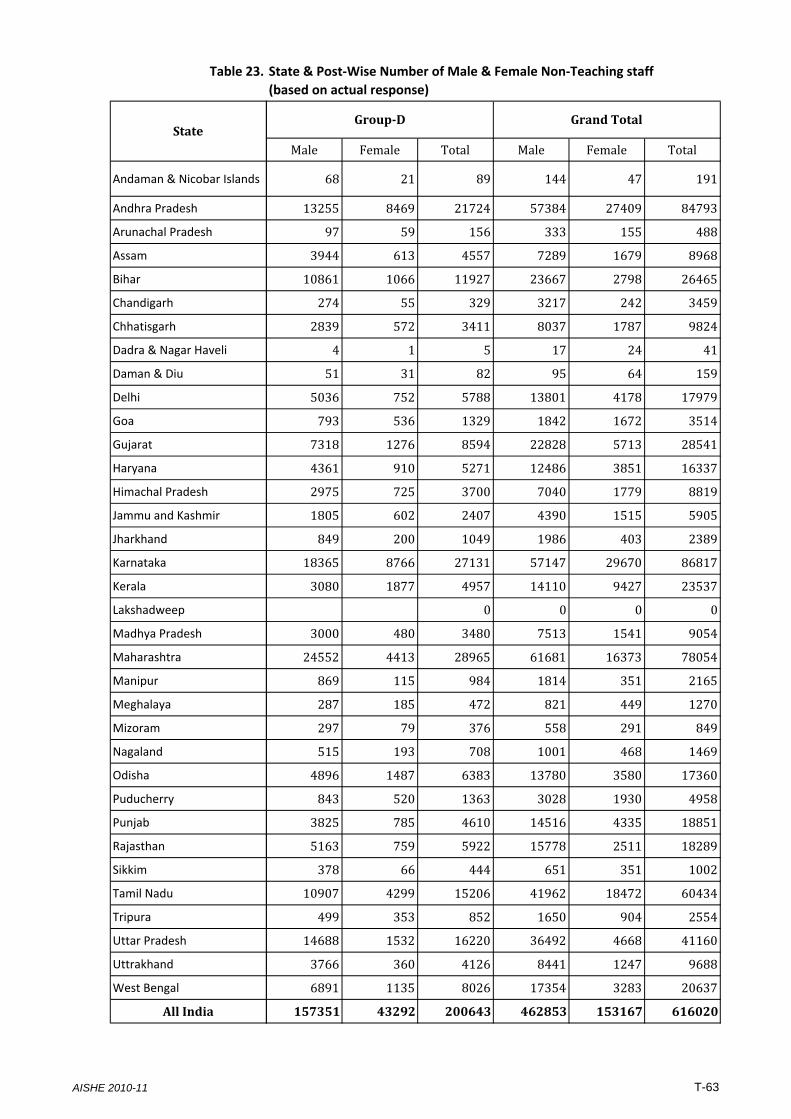
Table 23.
Andaman & Nicobar Islands
Andhra Pradesh
Arunachal Pradesh
Assam
Bihar
Chandigarh
Chhatisgarh
Dadra & Nagar Haveli
Daman & Diu
Delhi
Goa
Gujarat
Haryana
Himachal Pradesh
Jammu and Kashmir
Jharkhand
Karnataka
Kerala
Lakshadweep
Madhya Pradesh
Maharashtra
Manipur
Meghalaya
Mizoram
Nagaland
Odisha
Puducherry
Punjab
Rajasthan
Sikkim
Tamil Nadu
Tripura
Uttar Pradesh
Uttrakhand
West Bengal
All India
StateMale Female Total Male Female Total
68 21 89 144 47 191
13255 8469 21724 57384 27409 84793
97 59 156 333 155 488
3944 613 4557 7289 1679 8968
10861 1066 11927 23667 2798 26465
274 55 329 3217 242 3459
2839 572 3411 8037 1787 9824
4 1 5 17 24 41
51 31 82 95 64 159
5036 752 5788 13801 4178 17979
793 536 1329 1842 1672 3514
7318 1276 8594 22828 5713 28541
4361 910 5271 12486 3851 16337
2975 725 3700 7040 1779 8819
1805 602 2407 4390 1515 5905
849 200 1049 1986 403 2389
18365 8766 27131 57147 29670 86817
3080 1877 4957 14110 9427 23537
0 0 0 0
3000 480 3480 7513 1541 9054
24552 4413 28965 61681 16373 78054
869 115 984 1814 351 2165
287 185 472 821 449 1270
297 79 376 558 291 849
515 193 708 1001 468 1469
4896 1487 6383 13780 3580 17360
843 520 1363 3028 1930 4958
3825 785 4610 14516 4335 18851
5163 759 5922 15778 2511 18289
378 66 444 651 351 1002
10907 4299 15206 41962 18472 60434
499 353 852 1650 904 2554
14688 1532 16220 36492 4668 41160
3766 360 4126 8441 1247 9688
6891 1135 8026 17354 3283 20637
157351 43292 200643 462853 153167 616020
State & Post‐Wise Number of Male & Female Non‐Teaching staff
(based on actual response)
GroupD Grand Total
AISHE 2010-11 T-63
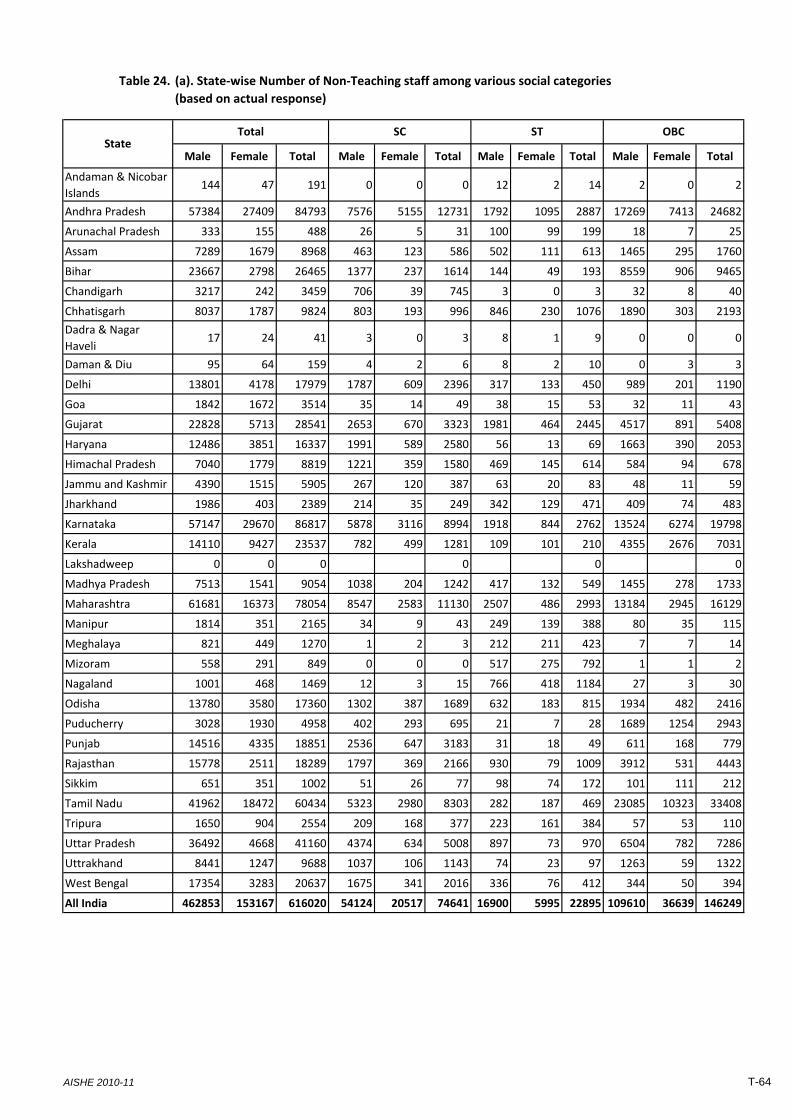
Table 24.
Male Female Total Male Female Total Male Female Total Male Female Total
Andaman & Nicobar
Islands144 47 191 0 0 0 12 2 14 2 0 2
Andhra Pradesh 57384 27409 84793 7576 5155 12731 1792 1095 2887 17269 7413 24682
Arunachal Pradesh 333 155 488 26 5 31 100 99 199 18 7 25
Assam 7289 1679 8968 463 123 586 502 111 613 1465 295 1760
Bihar 23667 2798 26465 1377 237 1614 144 49 193 8559 906 9465
Chandigarh 3217 242 3459 706 39 745 3 0 3 32 8 40
Chhatisgarh 8037 1787 9824 803 193 996 846 230 1076 1890 303 2193
Dadra & Nagar
Haveli17 24 41 3 0 3 8 1 9 0 0 0
Daman & Diu 95 64 159 4 2 6 8 2 10 0 3 3
Delhi 13801 4178 17979 1787 609 2396 317 133 450 989 201 1190
Goa 1842 1672 3514 35 14 49 38 15 53 32 11 43
Gujarat 22828 5713 28541 2653 670 3323 1981 464 2445 4517 891 5408
Haryana 12486 3851 16337 1991 589 2580 56 13 69 1663 390 2053
Himachal Pradesh 7040 1779 8819 1221 359 1580 469 145 614 584 94 678
Jammu and Kashmir 4390 1515 5905 267 120 387 63 20 83 48 11 59
Jharkhand 1986 403 2389 214 35 249 342 129 471 409 74 483
Karnataka 57147 29670 86817 5878 3116 8994 1918 844 2762 13524 6274 19798
Kerala 14110 9427 23537 782 499 1281 109 101 210 4355 2676 7031
Lakshadweep 0 0 0 0 0 0
Madhya Pradesh 7513 1541 9054 1038 204 1242 417 132 549 1455 278 1733
Maharashtra 61681 16373 78054 8547 2583 11130 2507 486 2993 13184 2945 16129
Manipur 1814 351 2165 34 9 43 249 139 388 80 35 115
Meghalaya 821 449 1270 1 2 3 212 211 423 7 7 14
Mizoram 558 291 849 0 0 0 517 275 792 1 1 2
Nagaland 1001 468 1469 12 3 15 766 418 1184 27 3 30
Odisha 13780 3580 17360 1302 387 1689 632 183 815 1934 482 2416
Puducherry 3028 1930 4958 402 293 695 21 7 28 1689 1254 2943
Punjab 14516 4335 18851 2536 647 3183 31 18 49 611 168 779
Rajasthan 15778 2511 18289 1797 369 2166 930 79 1009 3912 531 4443
Sikkim 651 351 1002 51 26 77 98 74 172 101 111 212
Tamil Nadu 41962 18472 60434 5323 2980 8303 282 187 469 23085 10323 33408
Tripura 1650 904 2554 209 168 377 223 161 384 57 53 110
Uttar Pradesh 36492 4668 41160 4374 634 5008 897 73 970 6504 782 7286
Uttrakhand 8441 1247 9688 1037 106 1143 74 23 97 1263 59 1322
West Bengal 17354 3283 20637 1675 341 2016 336 76 412 344 50 394
All India 462853 153167 616020 54124 20517 74641 16900 5995 22895 109610 36639 146249
(a). State‐wise Number of Non‐Teaching staff among various social categories
(based on actual response)
StateTotal SC ST OBC
AISHE 2010-11 T-64
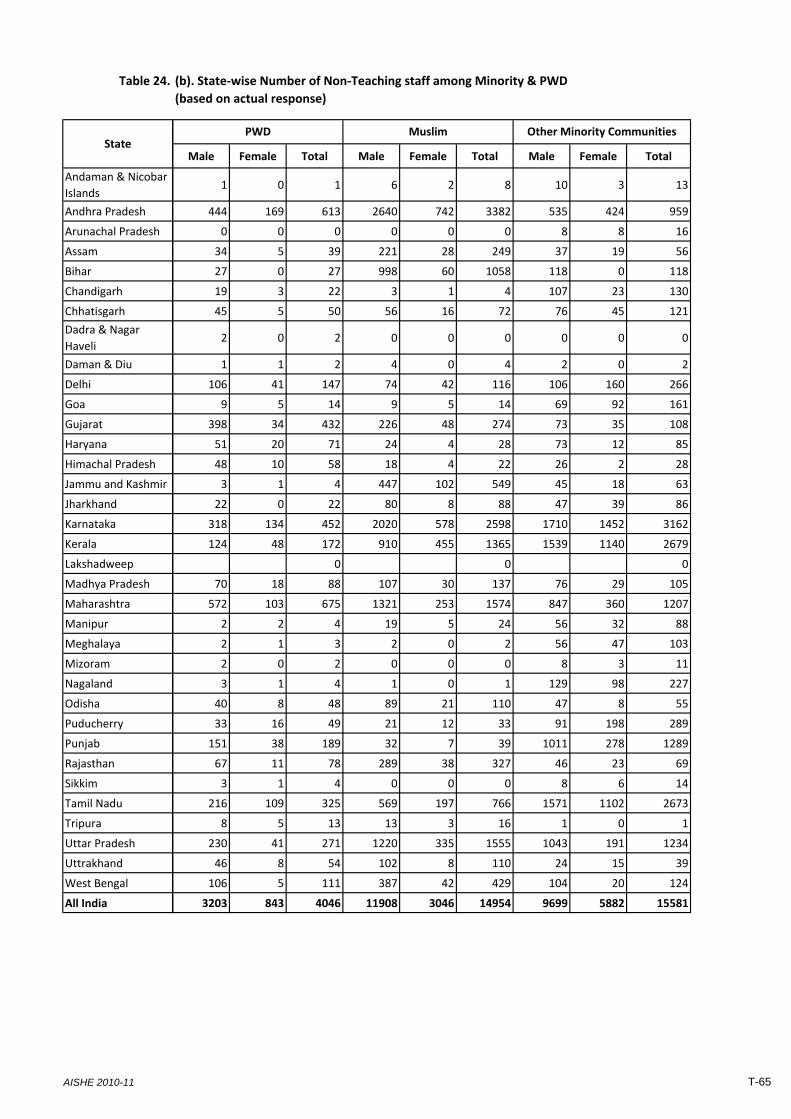
Table 24.
Andaman & Nicobar
Islands
Andhra Pradesh
Arunachal Pradesh
Assam
Bihar
Chandigarh
Chhatisgarh
Dadra & Nagar
Haveli
Daman & Diu
Delhi
Goa
Gujarat
Haryana
Himachal Pradesh
Jammu and Kashmir
Jharkhand
Karnataka
Kerala
Lakshadweep
Madhya Pradesh
Maharashtra
Manipur
Meghalaya
Mizoram
Nagaland
Odisha
Puducherry
Punjab
Rajasthan
Sikkim
Tamil Nadu
Tripura
Uttar Pradesh
Uttrakhand
West Bengal
All India
StateMale Female Total Male Female Total Male Female Total
1 0 1 6 2 8 10 3 13
444 169 613 2640 742 3382 535 424 959
0 0 0 0 0 0 8 8 16
34 5 39 221 28 249 37 19 56
27 0 27 998 60 1058 118 0 118
19 3 22 3 1 4 107 23 130
45 5 50 56 16 72 76 45 121
2 0 2 0 0 0 0 0 0
1 1 2 4 0 4 2 0 2
106 41 147 74 42 116 106 160 266
9 5 14 9 5 14 69 92 161
398 34 432 226 48 274 73 35 108
51 20 71 24 4 28 73 12 85
48 10 58 18 4 22 26 2 28
3 1 4 447 102 549 45 18 63
22 0 22 80 8 88 47 39 86
318 134 452 2020 578 2598 1710 1452 3162
124 48 172 910 455 1365 1539 1140 2679
0 0 0
70 18 88 107 30 137 76 29 105
572 103 675 1321 253 1574 847 360 1207
2 2 4 19 5 24 56 32 88
2 1 3 2 0 2 56 47 103
2 0 2 0 0 0 8 3 11
3 1 4 1 0 1 129 98 227
40 8 48 89 21 110 47 8 55
33 16 49 21 12 33 91 198 289
151 38 189 32 7 39 1011 278 1289
67 11 78 289 38 327 46 23 69
3 1 4 0 0 0 8 6 14
216 109 325 569 197 766 1571 1102 2673
8 5 13 13 3 16 1 0 1
230 41 271 1220 335 1555 1043 191 1234
46 8 54 102 8 110 24 15 39
106 5 111 387 42 429 104 20 124
3203 843 4046 11908 3046 14954 9699 5882 15581
(b). State‐wise Number of Non‐Teaching staff among Minority & PWD
(based on actual response)
Muslim Other Minority CommunitiesPWD
AISHE 2010-11 T-65
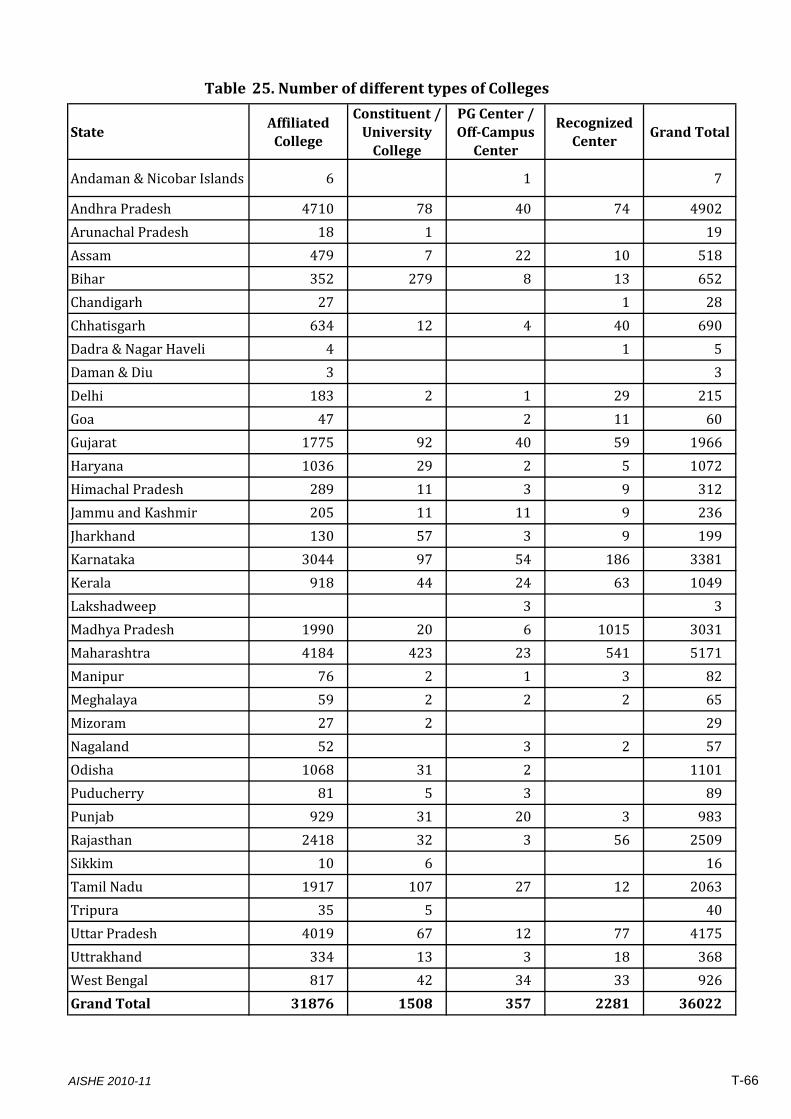
Table 25. Number of different types of Colleges
StateAffiliated College
Constituent / University College
PG Center / OffCampus Center
Recognized Center
Grand Total
Andaman & Nicobar Islands 6 1 7
Andhra Pradesh 4710 78 40 74 4902
Arunachal Pradesh 18 1 19
Assam 479 7 22 10 518
Bihar 352 279 8 13 652
Chandigarh 27 1 28
Chhatisgarh 634 12 4 40 690
Dadra & Nagar Haveli 4 1 5
Daman & Diu 3 3
Delhi 183 2 1 29 215
Goa 47 2 11 60
Gujarat 1775 92 40 59 1966
Haryana 1036 29 2 5 1072
Himachal Pradesh 289 11 3 9 312
Jammu and Kashmir 205 11 11 9 236
Jharkhand 130 57 3 9 199
Karnataka 3044 97 54 186 3381
Kerala 918 44 24 63 1049
Lakshadweep 3 3
Madhya Pradesh 1990 20 6 1015 3031
Maharashtra 4184 423 23 541 5171
Manipur 76 2 1 3 82
Meghalaya 59 2 2 2 65
Mizoram 27 2 29
Nagaland 52 3 2 57
Odisha 1068 31 2 1101
Puducherry 81 5 3 89
Punjab 929 31 20 3 983
Rajasthan 2418 32 3 56 2509
Sikkim 10 6 16
Tamil Nadu 1917 107 27 12 2063
Tripura 35 5 40
Uttar Pradesh 4019 67 12 77 4175
Uttrakhand 334 13 3 18 368
West Bengal 817 42 34 33 926
Grand Total 31876 1508 357 2281 36022
AISHE 2010-11 T-66
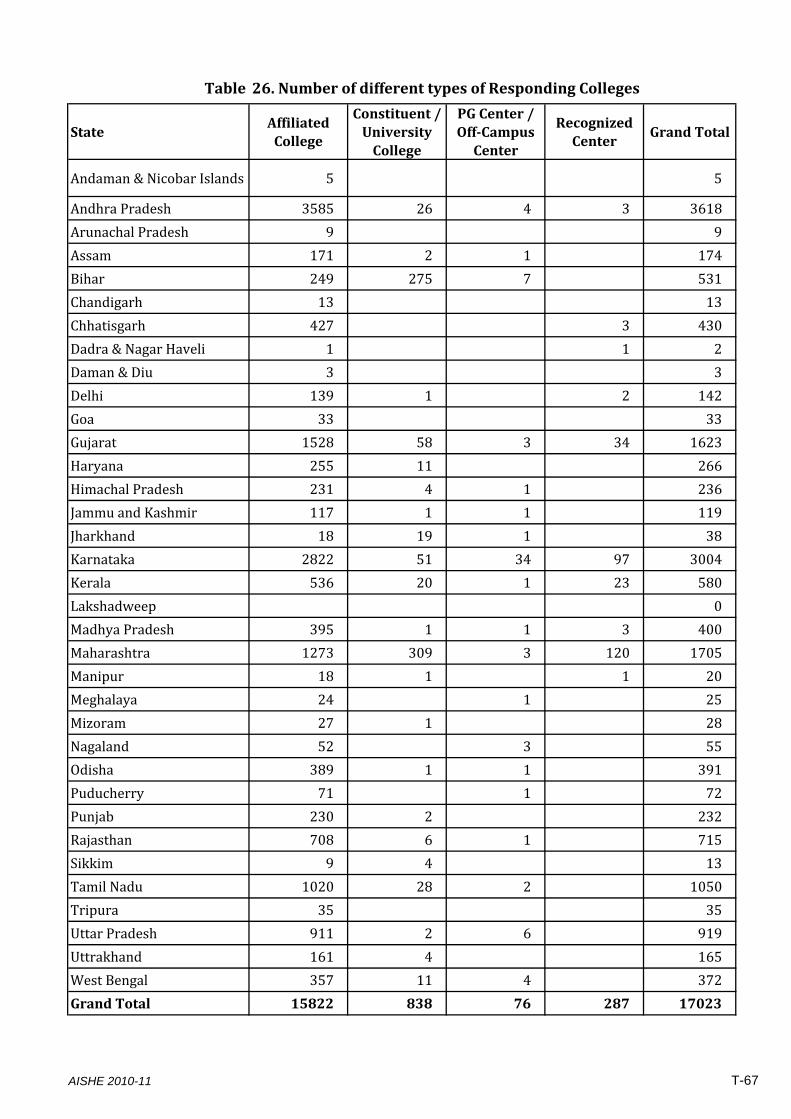
Table 26. Number of different types of Responding Colleges
StateAffiliated College
Constituent / University College
PG Center / OffCampus Center
Recognized Center
Grand Total
Andaman & Nicobar Islands 5 5
Andhra Pradesh 3585 26 4 3 3618
Arunachal Pradesh 9 9
Assam 171 2 1 174
Bihar 249 275 7 531
Chandigarh 13 13
Chhatisgarh 427 3 430
Dadra & Nagar Haveli 1 1 2
Daman & Diu 3 3
Delhi 139 1 2 142
Goa 33 33
Gujarat 1528 58 3 34 1623
Haryana 255 11 266
Himachal Pradesh 231 4 1 236
Jammu and Kashmir 117 1 1 119
Jharkhand 18 19 1 38
Karnataka 2822 51 34 97 3004
Kerala 536 20 1 23 580
Lakshadweep 0
Madhya Pradesh 395 1 1 3 400
Maharashtra 1273 309 3 120 1705
Manipur 18 1 1 20
Meghalaya 24 1 25
Mizoram 27 1 28
Nagaland 52 3 55
Odisha 389 1 1 391
Puducherry 71 1 72
Punjab 230 2 232
Rajasthan 708 6 1 715
Sikkim 9 4 13
Tamil Nadu 1020 28 2 1050
Tripura 35 35
Uttar Pradesh 911 2 6 919
Uttrakhand 161 4 165
West Bengal 357 11 4 372
Grand Total 15822 838 76 287 17023
AISHE 2010-11 T-67
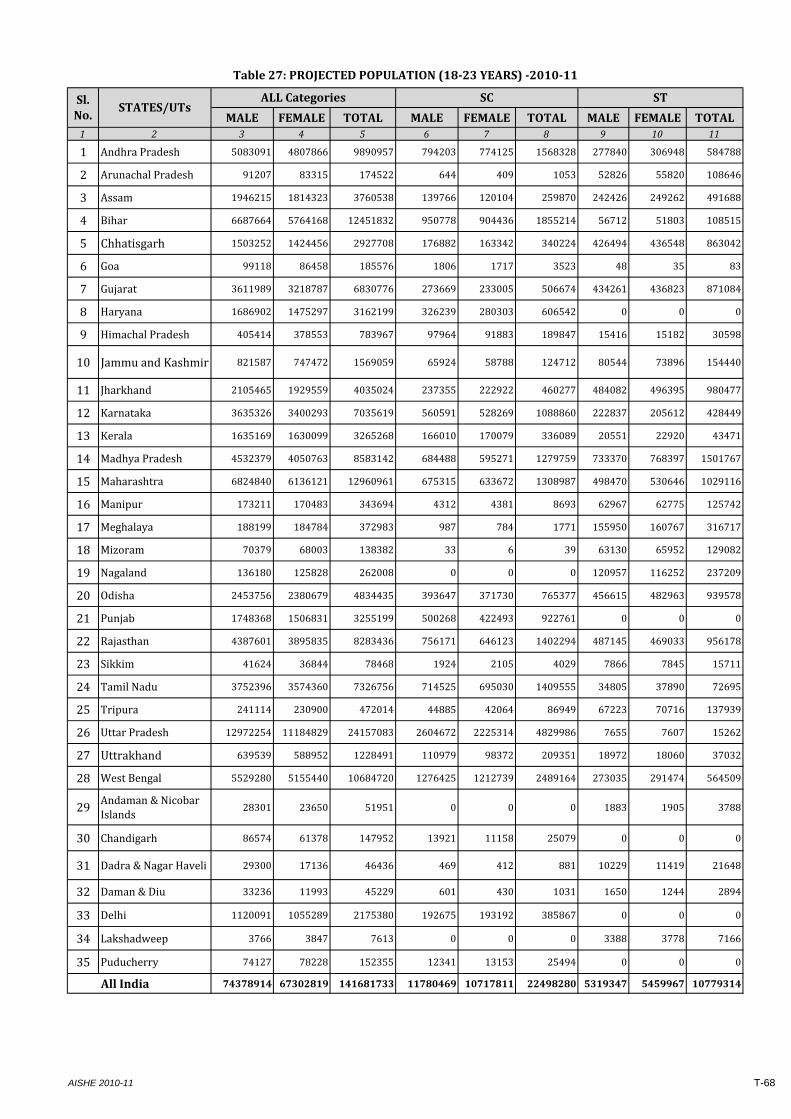
MALE FEMALE TOTAL MALE FEMALE TOTAL MALE FEMALE TOTAL1 2 3 4 5 6 7 8 9 10 11
1 Andhra Pradesh 5083091 4807866 9890957 794203 774125 1568328 277840 306948 584788
2 Arunachal Pradesh 91207 83315 174522 644 409 1053 52826 55820 108646
3 Assam 1946215 1814323 3760538 139766 120104 259870 242426 249262 491688
4 Bihar 6687664 5764168 12451832 950778 904436 1855214 56712 51803 108515
5 Chhatisgarh 1503252 1424456 2927708 176882 163342 340224 426494 436548 863042
6 Goa 99118 86458 185576 1806 1717 3523 48 35 83
7 Gujarat 3611989 3218787 6830776 273669 233005 506674 434261 436823 871084
8 Haryana 1686902 1475297 3162199 326239 280303 606542 0 0 0
9 Himachal Pradesh 405414 378553 783967 97964 91883 189847 15416 15182 30598
10 Jammu and Kashmir 821587 747472 1569059 65924 58788 124712 80544 73896 154440
11 Jharkhand 2105465 1929559 4035024 237355 222922 460277 484082 496395 980477
12 Karnataka 3635326 3400293 7035619 560591 528269 1088860 222837 205612 428449
13 Kerala 1635169 1630099 3265268 166010 170079 336089 20551 22920 43471
14 Madhya Pradesh 4532379 4050763 8583142 684488 595271 1279759 733370 768397 1501767
15 Maharashtra 6824840 6136121 12960961 675315 633672 1308987 498470 530646 1029116
16 Manipur 173211 170483 343694 4312 4381 8693 62967 62775 125742
17 Meghalaya 188199 184784 372983 987 784 1771 155950 160767 316717
18 Mizoram 70379 68003 138382 33 6 39 63130 65952 129082
19 Nagaland 136180 125828 262008 0 0 0 120957 116252 237209
20 Odisha 2453756 2380679 4834435 393647 371730 765377 456615 482963 939578
21 Punjab 1748368 1506831 3255199 500268 422493 922761 0 0 0
22 Rajasthan 4387601 3895835 8283436 756171 646123 1402294 487145 469033 956178
23 Sikkim 41624 36844 78468 1924 2105 4029 7866 7845 15711
24 Tamil Nadu 3752396 3574360 7326756 714525 695030 1409555 34805 37890 72695
25 Tripura 241114 230900 472014 44885 42064 86949 67223 70716 137939
26 Uttar Pradesh 12972254 11184829 24157083 2604672 2225314 4829986 7655 7607 15262
27 Uttrakhand 639539 588952 1228491 110979 98372 209351 18972 18060 37032
28 West Bengal 5529280 5155440 10684720 1276425 1212739 2489164 273035 291474 564509
29Andaman & Nicobar Islands
28301 23650 51951 0 0 0 1883 1905 3788
30 Chandigarh 86574 61378 147952 13921 11158 25079 0 0 0
31 Dadra & Nagar Haveli 29300 17136 46436 469 412 881 10229 11419 21648
32 Daman & Diu 33236 11993 45229 601 430 1031 1650 1244 2894
33 Delhi 1120091 1055289 2175380 192675 193192 385867 0 0 0
34 Lakshadweep 3766 3847 7613 0 0 0 3388 3778 7166
35 Puducherry 74127 78228 152355 12341 13153 25494 0 0 0
All India 74378914 67302819 141681733 11780469 10717811 22498280 5319347 5459967 10779314
Table 27: PROJECTED POPULATION (1823 YEARS) 201011
Sl.No.
STATES/UTsALL Categories SC ST
AISHE 2010-11 T-68
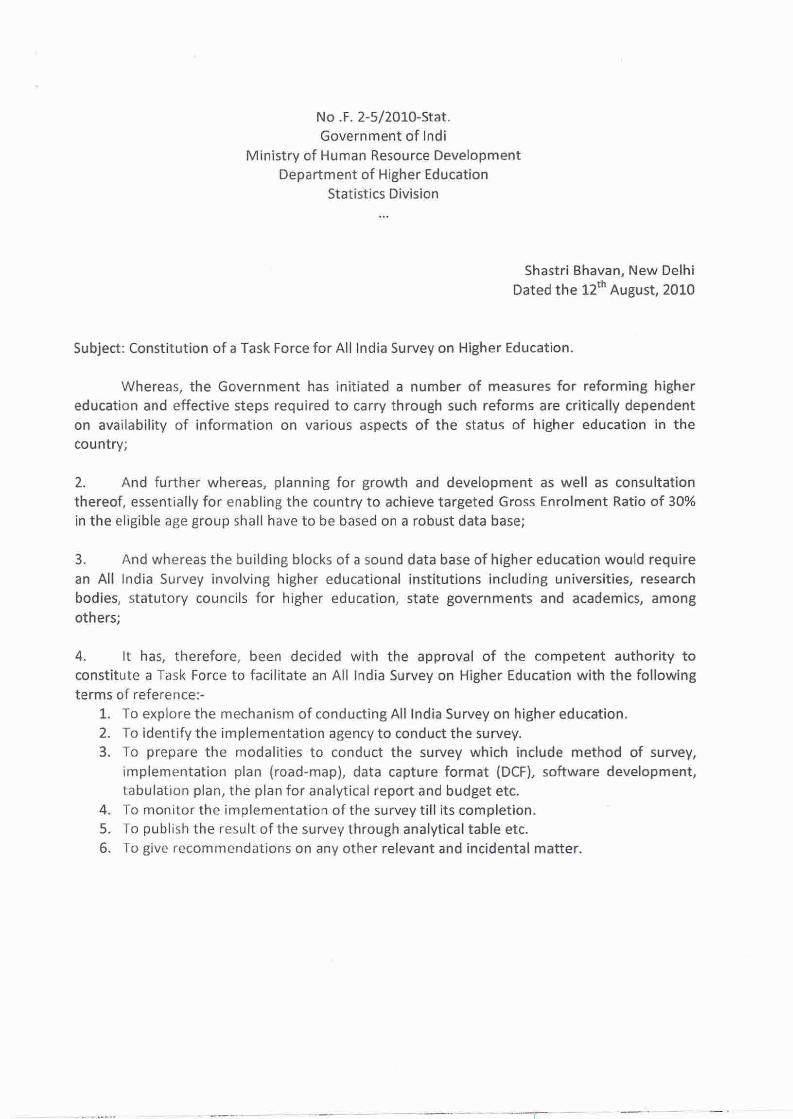
No .F. 2-512010-Stat. Government of lndi
Ministry of Human Resource Development Department of Higher Education
Statistics Division ...
Shastri Bhavan, New Delhi Dated the 12'~ August, 2010
Subject: Constitution of a Task Force for All lndia Survey on Higher Education.
Whereas, the Government has initiated a number of measures for reforming higher education and effective steps required to carry through such reforms are critically dependent on availability of information on various aspects of the status of higher education in the country;
2. And further whereas, planning for growth and development as well as consultation thereof, essentially for enabling the country to achieve targeted Gross Enrolment Ratio of 30% in the eligible age group shall have to be based on a robust data base;
3. And whereas the building blocks of a sound data base of higher education would require an All lndia Survey involving higher educational institutions including universities, research bodies, statutory councils for higher education, state governments and academics, among others;
4. It has, therefore, been decided with the approval of the competent authority to constitute a Task Force to facilitate an All lndia Survey on Higher Education with the following terms of reference:-
1. To explore the mechanism of conducting All lndia Survey on higher education. 2. To identify the implementation agency to conduct the survey. 3. To prepare the modalities to conduct the survey which include method of survey,
implementation plan (road-map), data capture format (DCF), software development, tabulat~on plan, the plan for analytical report and budget etc.
4. To mon~torthe implementation of the survey till its completion. 5. To publlsh the result of the survey through analytical table etc. 6. To give recommendations on any other relevant and incidental matter.
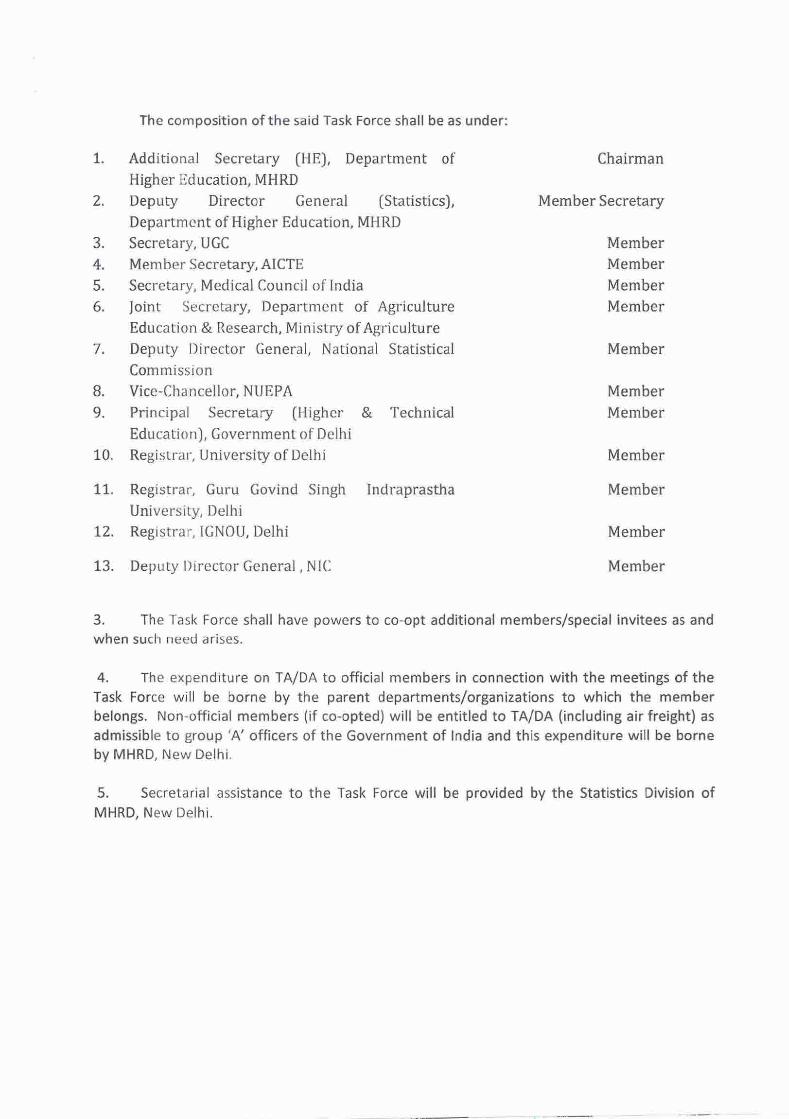
The composition of t h e said Task Force shall be as under:
Additional Secretary (HE], Department of Chairman Higher Education, MHRD Deputy Director General (Statistics), Member Secretary Department of Higher Education, MHRD Secretary, UGC Member Member Secretary, AlCTE Member Secretary, Medical Council of India Member Joint Secretary, Department of Agriculture Member Education & Research, Ministry ofAgriculture Deputy Director General, National Statistical Member Commiss~on Vice-Chancellor, NUEPA Member Princ~pal Secretary (Higher & Technical Member Education), Government of Delhi Registrar, University of Delh~ Member
11. Registrar, Guru Govind Singh Indraprastha Member University, Delhi
12. Reg~strar, IGNOU, Delhi Member
13. Deputy Director General, NIC Member
3. The Task Force shall have powers to co-opt additional members/special invitees as and when such need arises.
4. The expend~ture on TA/DA to official members in connection with the meetings of the Task Force will be borne by the parent departments/organizations to which the member belongs. Non-official members (if co-opted) will be entitled to TA/DA (including air freight) as admissible to group 'A' officers of the Government of India and this expenditure will be borne by MHRD, New Delhi.
5. Secretarial assistance to the Task Force will be provided by the Statistics Division of MHRD, New Delhi.
6. The Task Force shall submit its preliminary recommendations to the Ministry to operationalize the survey within 2 months from the date of issue of this Notification.
h
(Vijay P. Goel) Deputy Director General
Copy to:
1)All members of the Task Force of All India Survey on Higher Education 2 ) PS to HRM 3) PSO to Secretary, Department of Higher Education 4) PPS to Secretary, Department of School Education & Literacy 5) PPS t o Secretary, Ministry of Statistics and Programme Implementation 6) PPS to Addl. Secretary, (TE), Department of Higher Education 7) PPS to Addl. Secretary, (HE), Department of Higher Education 8) Director General, National Statistical Commission, Sardar Patel Bhawan, New Delhi 9) Copy to all Bureau Heads in the Ministry of Human Resource Development
(Vijay P. Goel) Deputy Director General
4
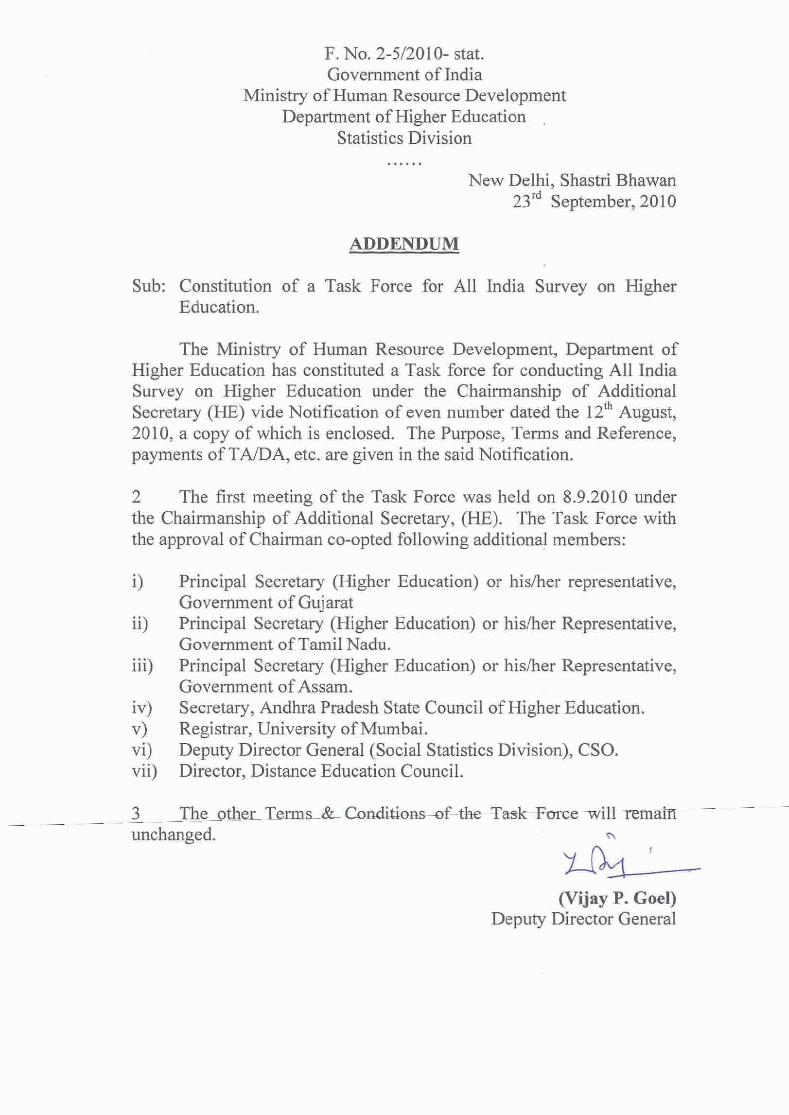
------
F. No. 2-512010- stat. Government of India
Ministry of Human Resource Development Department of Higher Education
Statistics Division
New Delhi, Shastri Bhawan 23'd September, 2010
ADDENDUM
Sub: Constitution of a Task Force for All India Survey on Higher Education.
The Ministry of Human Resource Development, Department of Higher Education has constituted a Task force for conducting All India Survey on Higher Education under the Chairmanship of Additional Secretary (HE) vide Notification of even number dated the 1 2 ~August, 2010, a copy of which is enclosed. The Purpose, Terms and Reference, payments of TA/DA, etc. are given in the said Notification.
2 The first meeting of the Task Force was held on 8.9.2010 under the Chairmanship of Additional Secretary, (HE). The Task Force with the approval of Chairman co-opted following additional members:
i) Principal Secretary (Higher Education) or hidher representative, Government of Gujarat
ii) Principal Secretary (Higher Education) or histher Representative, Government of Tamil Nadu.
iii) Principal Secretary (Higher Education) or hisher Representative, Government of Assam.
iv)v)
Secretary, Andhra Pradesh State Council of Higher Education. Registrar, University of Mumbai.
vi) vii)
Deputy Director General (Social Statistics Division), CSO. Director, Distance Education Council.
3 The o t h e r T e r m s 8 L l 3 m d i t i d h T a s ~ ~=main unchanged.
(Vijay P. Goel) Deputy Director General
Copy to:
All members of the Task Force. PS to HRM. PSO to Secretary, Department of Higher Education. PPS to Secretary, Department of SE&L. PPS to Secretary, MOSPI. PPS to Additional Secretary (TE), Department of Higher Education. PPS to Additional Secretary (m),Department of Higher Education. Director General, National Statistical Commission, Sardar Pate1 Bhawan, New Delhi. All Bureau Heads in the Ministry of Human Resource Development
Also copy to:
10. Principal Secretary (Higher Education) Government of Gujarat 11. Principal Secretary (Higher Education) Government of Tamil
Nadu. 12. Principal Secretary (Higher Education), Government of Assam. 13. Secretary, Andhra Pradesh State Council of Higher Education 14. Registrar, University of Mumbai. 15. Deputy Director General (Social Statistics Division), CSO. 16. Director, Distance Education Council.
(Vijay P. Goel) Deputy Director General
Tele: 01 1-23381484 Fax. 011-23384191
F. No. 2-5/20 10- stat. Government of India
Ministry of Human Resource Development Department of Higher Education
Statistics Division ......
New Delhi, Shastri Bhawan 23d September, 20 10
ADDENDUM
Sub: Constitution of a Task Force for All India Survey on Higher Education.
The first meeting of the Task Force constituted for conducting All India Education Survey was held on 8.9.2010 under the Chairmanship of Additional Secretary, (HE). The Task Force with the approval of Chairman took following decision.
"ADG (ICAR) will be a member of Task force in place of Joint Secretary (DARE)".
2. The other Terms & Conditions of the Task Force will remain unchanged.
(Ruchika Gupta) Deputy Director Tele: 23385935
Copy to:
1. All members of the Task Force. 2. PS to HRM. 3. PSO to Secretary, Department of Higher Education. 4. PPS to Secretary, Department of SE&L. 5. PPS to Secretary, MOSPI. 6. ADG (ICAR). 7. Joint Secretary OGRE).
8. PPS to Additional Secretary (TE), Department of Higher Education.
9. PPS to Additional Secretary (HE), Department of Higher Education.
1O.Director General, National Statistical Commission, Sardar Pate1 Bhawan, New Delhi.
11.All Bureau Heads in the Ministry of Human Resource Development
Also copy to:
12.Principal Secretary (Higher Education), Government of Gujarat 13.Principal Secretary (Higher Education), Government of Tamil
Nadu. 14.Principal Secretary (Higher Education), Government of Assam. lS.Secretary, Andhra Pradesh State Council of Higher Education 16.Registrar, University of Mumbai. 17.Deputy Director General (Social Statistics Division), CSO. 18.Director, Distance Education Council.
(Ruchika Gupta) Deputy Director
Tele: 01 1-23385935
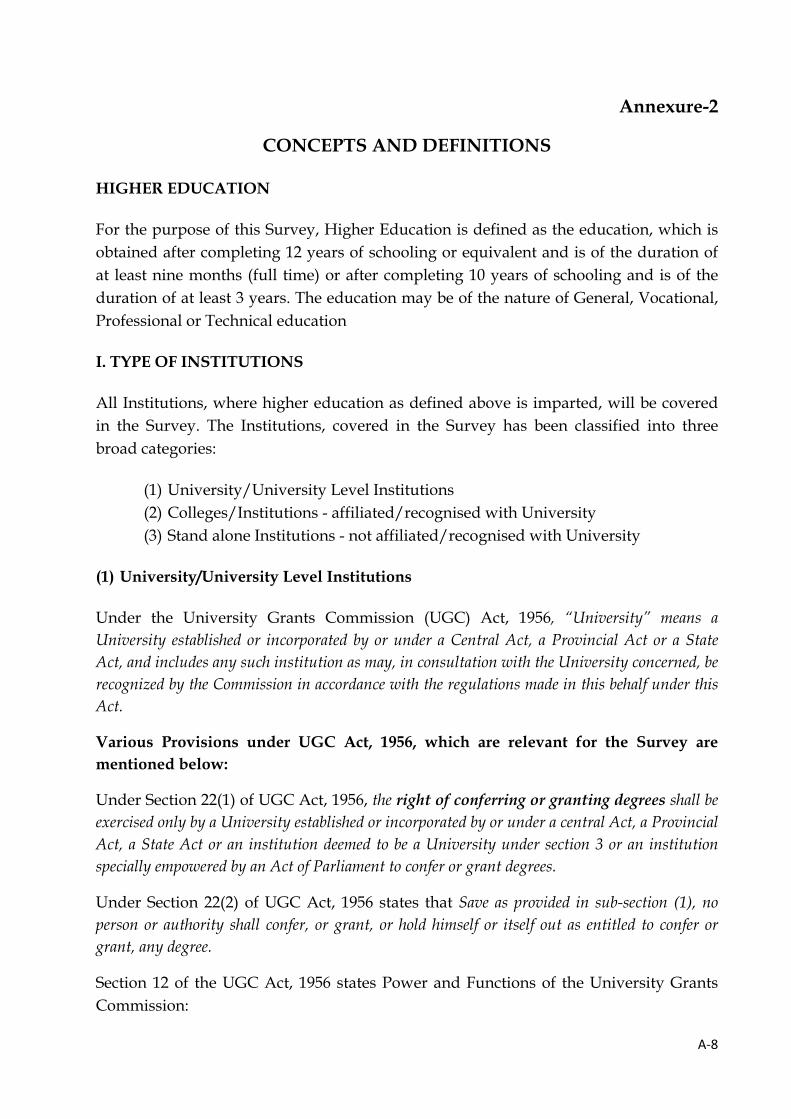
A‐8
Annexure-2
CONCEPTS AND DEFINITIONS
HIGHER EDUCATION
For the purpose of this Survey, Higher Education is defined as the education, which is obtained after completing 12 years of schooling or equivalent and is of the duration of at least nine months (full time) or after completing 10 years of schooling and is of the duration of at least 3 years. The education may be of the nature of General, Vocational, Professional or Technical education
I. TYPE OF INSTITUTIONS
All Institutions, where higher education as defined above is imparted, will be covered in the Survey. The Institutions, covered in the Survey has been classified into three broad categories:
(1) University/University Level Institutions (2) Colleges/Institutions - affiliated/recognised with University (3) Stand alone Institutions - not affiliated/recognised with University
(1) University/University Level Institutions
Under the University Grants Commission (UGC) Act, 1956, “University” means a University established or incorporated by or under a Central Act, a Provincial Act or a State Act, and includes any such institution as may, in consultation with the University concerned, be recognized by the Commission in accordance with the regulations made in this behalf under this Act.
Various Provisions under UGC Act, 1956, which are relevant for the Survey are mentioned below:
Under Section 22(1) of UGC Act, 1956, the right of conferring or granting degrees shall be exercised only by a University established or incorporated by or under a central Act, a Provincial Act, a State Act or an institution deemed to be a University under section 3 or an institution specially empowered by an Act of Parliament to confer or grant degrees.
Under Section 22(2) of UGC Act, 1956 states that Save as provided in sub-section (1), no person or authority shall confer, or grant, or hold himself or itself out as entitled to confer or grant, any degree.
Section 12 of the UGC Act, 1956 states Power and Functions of the University Grants Commission:
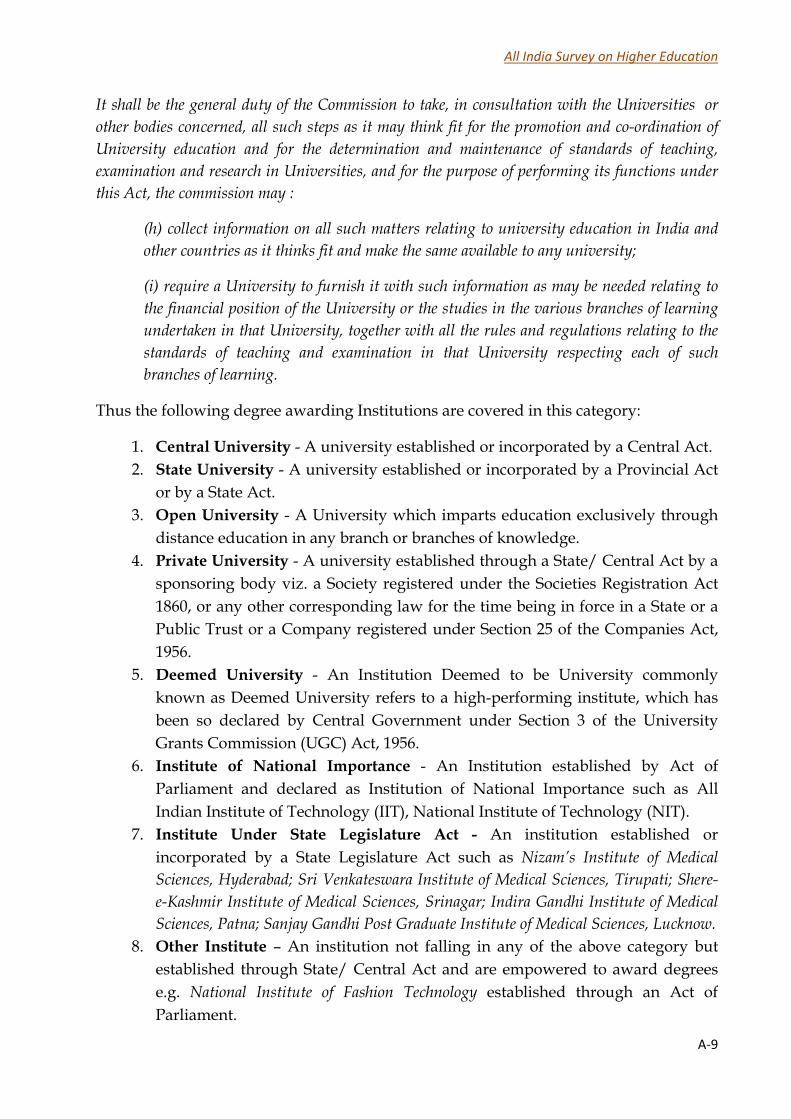
All India Survey on Higher Education
A‐9
It shall be the general duty of the Commission to take, in consultation with the Universities or other bodies concerned, all such steps as it may think fit for the promotion and co-ordination of University education and for the determination and maintenance of standards of teaching, examination and research in Universities, and for the purpose of performing its functions under this Act, the commission may :
(h) collect information on all such matters relating to university education in India and other countries as it thinks fit and make the same available to any university;
(i) require a University to furnish it with such information as may be needed relating to the financial position of the University or the studies in the various branches of learning undertaken in that University, together with all the rules and regulations relating to the standards of teaching and examination in that University respecting each of such branches of learning.
Thus the following degree awarding Institutions are covered in this category:
1. Central University - A university established or incorporated by a Central Act. 2. State University - A university established or incorporated by a Provincial Act
or by a State Act. 3. Open University - A University which imparts education exclusively through
distance education in any branch or branches of knowledge. 4. Private University - A university established through a State/ Central Act by a
sponsoring body viz. a Society registered under the Societies Registration Act 1860, or any other corresponding law for the time being in force in a State or a Public Trust or a Company registered under Section 25 of the Companies Act, 1956.
5. Deemed University - An Institution Deemed to be University commonly known as Deemed University refers to a high-performing institute, which has been so declared by Central Government under Section 3 of the University Grants Commission (UGC) Act, 1956.
6. Institute of National Importance - An Institution established by Act of Parliament and declared as Institution of National Importance such as All Indian Institute of Technology (IIT), National Institute of Technology (NIT).
7. Institute Under State Legislature Act - An institution established or incorporated by a State Legislature Act such as Nizam’s Institute of Medical Sciences, Hyderabad; Sri Venkateswara Institute of Medical Sciences, Tirupati; Shere-e-Kashmir Institute of Medical Sciences, Srinagar; Indira Gandhi Institute of Medical Sciences, Patna; Sanjay Gandhi Post Graduate Institute of Medical Sciences, Lucknow.
8. Other Institute – An institution not falling in any of the above category but established through State/ Central Act and are empowered to award degrees e.g. National Institute of Fashion Technology established through an Act of Parliament.
All India Survey on Higher Education
A‐10
2. Colleges/Institutions affiliated/recognised with University These are institutions which can run degree programmes but are not empowered to provide degree on their own and are necessarily have to be attached with some University/University level institution for the purpose of awarding degree. For the purpose of the survey these institutions have been classified as under: 2.1 Colleges Affiliated with University/ University level Institutions – Under Section 12A(1)(b), College means any Institution, whether known as such or by any other name which provides for a course of study for obtaining any qualification from a university and which, in accordance with the rules and regulations of such university, is recognised as competent to provide for such course of study and present students undergoing such course of study for the examination for the award of such qualification. These are the institutions established or maintained by, or admitted to the privileges of the University. Colleges can be of two types:
(i) University/ Constituent College - A college maintained by the University (ii) Affiliated College
Some colleges are given Autonomous Status. UGC has introduced a scheme of Autonomous colleges keeping in view the objectives of the National Education Policy (1986-92). All Colleges under Section 2(f) & 12(b) of the UGC Act are eligible under the Scheme. Criteria for identification of institutions for grant of autonomy are as follows:
a. Academic reputation and previous performance in university examinations and its academic/co-curricular/extension activities in the past.
b. Academic/extension achievements of the faculty. c. Quality and merit in the selection of students and teachers, subject to statutory
requirements in this regard. d. Adequacy of infrastructure, for example, library, equipment, accommodation for
academic activities, etc. e. Quality of institutional management. f. Financial resources provided by the management/state government for the
development of the institution. g. Responsiveness of administrative structure. h. Motivation and involvement of faculty in the promotion of innovative
reforms. The Parent University awards degrees to the students, evaluated and recommended by colleges. Autonomous colleges that have completed three year terms can confer the degree under their title with the seal of the university.
All India Survey on Higher Education
A‐11
2.2 Institutions Recognised by the University: These are the institutions attached with the University for the purpose of awarding degree in respect of programmes being run in these institutions. e.g. Army Cadet College Wing, Indian Military Academy, Dehradun is not affiliated with any University but the degree in respect of Programmes run in the institute are awarded by Jawaharlal Nehru University. 2.3 Off-Campus Centre/ PG Centre - A centre of the University established by it, outside the main campus (within or outside the state) operated and maintained as its constituent unit, having the University’s compliment of facilities, faculty and staff. 2.4 Off-shore Campus - A campus of the Private University or Deemed to be University established by it outside the country, operated and maintained as its constituent unit, having the University’s compliment of facilities, faculty and staff. 2.5 Regional Centre - A centre established and maintained or recognized by the University for the purpose of the coordination of the functioning of the Study Centres in the region, advising, counseling or for rendering any other assistance required by the students used in the context of regular/ distance education. 2.6 Study Centre - A centre established and maintained or recognized by the university for the purpose of advising, counseling or for rendering any other assistance required by the students. Evening College – The College in which education is imparted in the evening. It may be noted that in a few colleges, using the same infrastructure, education is imparted in two sessions-morning or day and evening. Generally, for all practical purposes these are treated as two colleges.
(3) Stand alone Institutions not affiliated/recognised with University
There are several institutions which are outside the purview of the University & College. These Institutions generally run Diploma/PG Diploma level programmes for which they require recognition from one or other Statutory Bodies. For the purpose of this survey, such Institutions will be referred as Stand-alone Institution. Such Institutions mainly fall under following categories: - Indian Institute of Management (IIM) awarding PG Diploma in Management of two
years duration whose entry qualification is Graduate. - Diploma awarding Institutions under the control of All India Council for Technical
Education (AICTE) e.g. Lal Bahadur Shastri Management Institute awarding PG diplomas in Management of two years duration whose entry qualification is Graduate.
All India Survey on Higher Education
A‐12
- Diploma awarding Institutions under the control of Indian Nursing Council (INC). - Government or Government recognised Institutions to conduct Teachers Training
courses whose entry qualification is 10+2 e.g. District Institute of Educational and Training (DIET) or similar institutes.
- Polytechnics. - Company Secretary, Charted Accountancy, Actuarial Science etc. Institution for Women: An Institution which enrolls only female students in all its programmes is categorised as Institution for Women. Such institutes may or may not have male teaching and non-teaching staff. II. FACULTY, DEPARTMENT AND PROGRAMME Faculty - A Faculty of Studies of the University. Department - A Department of Studies and includes a Centre of Studies. For the purpose of survey, the School will be treated similar to Faculty and Centre will be treated similar to the Department. Programme – It is a course of study for which Degree or Certificate is awarded by the Institution. A Programme of study is the approved curriculum followed by an individual student such as B.A, M.A, MBA etc. Levels of Programmes:
1. Under-Graduate - Programme after 10+2 and generally having the duration of 3/4/5 years, in General or Professional courses.
2. Post-Graduate - Programme after Graduation and generally having the duration of 2/3 years in General/Professional courses.
3. M.Phil - Programme after Post-Graduation and generally having the duration of 1/2 years and are pre-research course.
4. Ph.D - Programme after M.Phil or Post-Graduation and generally having the duration of 2/3/4/5 years.
5. Post Graduate Diploma - Programme generally after 10+2 or after Graduation in General and Professional courses and having duration of 1/2/3 years.
6. Diploma - Programme generally after 10+2 or after Graduation in General and Professional courses and having duration of 1/2/3 years.
7. Certificate – It is a Programme similar to Diploma, but is awarded a Certificate by the Institution.
All India Survey on Higher Education
A‐13
8. Integrated/Dual Degree – It is a Programme leading to Post-Graduate Degree and/or Research Degree. Generally it is a combination of two degree programmes e.g. M.Tech Ph.D, B.A. LLB, M.Sc. Ph.D, B.Tech M.Tech etc.
Discipline - An academic discipline or field of study is a branch of knowledge that is taught and researched at the Institution. There are large numbers of disciplines, which are taught in various Institutions and their nomenclature varies from Institution to Institution.
For example in case of M.A. in Geography, M.A. is a Programme and Geography is a discipline.
III. MODE OF HIGHER EDUCATION
Regular Mode i.e. Formal system of Higher Education - Education provided in the system of Colleges, Universities and other formal educational institutions where the students getting education in a classroom in direct contact with the teachers and also make use of other infrastructure facilities like laboratories, library etc to enhance its learning capacity.
Self-Financing Courses in Regular Mode - Government Aided Universities/Colleges/ Institutions conducting certain career oriented courses without the financial support of the Government. The recurring expenditure to run these courses is being met by students’ fees etc.
Distance/Correspondence Mode i.e. Non-Formal system of Higher Education - The system of imparting education through broadcasting, telecasting, internet, correspondence courses, seminars, contact programmes or the combination of any two or more such means of communication.
IV. MANAGEMENT OF UNIVERSITY /COLLEGE/INSTITUTION Central Government - Universities/Colleges/Institutions which are maintained by Central Government whether directly or indirectly e.g. University of Delhi is a Central University. Dyal Singh College is a University College of University of Delhi which is getting maintenance grant from UGC. State Government - Universities/Colleges/Institutions which are maintained by State Government whether directly or indirectly e.g. Choudhry Charan Singh University, Meerut is a State University getting maintenance grant from Uttar Pradesh Government.
All India Survey on Higher Education
A‐14
Local Body - Colleges/Institutions which are managed by the local body such as Panchayats (as defined in Art 243 read with 243 B of the Constitution), Municipalities (as defined in Article 243 P read with 243 Q of the Constitution), Cantonment Boards, Town Area Committees and any other bodies of the local self government constituted under a law. e.g. Firoz Gandhi College & C.P.Verma College, Patna affiliated to Magadh University. Private Aided - Institutions, which are managed by an Individual, Trust, Society or Other Private Organization and receive regular maintenance grants from Government or Local Body. e.g. Hindu College, Delhi affiliated to University of Delhi. Private Un-aided - Institutions, which are managed by an Individual, Trust, Society or Other Private Organization, which is either not receiving any grant or in receipt of one-time ad-hoc grant for a specific purpose like building construction, strengthening of library or laboratory, one-time subsidy towards teacher salary etc., but not receiving regular maintenance grant. e.g Chanchalben Mafatlal Patel College of Nursing, Ahemadabad. V. STUDENT Student means a student of the Institution and includes any person who has enrolled himself/ herself for pursuing any programme of study conducted by the Institution. Foreign Student means those students who are citizens of a country other than India. Students’ intake is annual permitted strength for a particular programme of study which means the number of seats in a programme.
Students’ enrolment is total students on roll in a Programme as on 30th September of the academic year, as explained below through an example:
Programme: MCA Duration: 3 years
Year Students enrolled 1st Year 30 2nd year 29 3rd year 28 Total Enrolment 87
VI. TEACHING STAFF
Teacher is defined as a faculty/staff assigned the professional activities of instructing pupils, providing knowledge and giving guidance in the subject area of studies in self
All India Survey on Higher Education
A‐15
contained classes or courses or in class room situations. Generally the designation of teaching staff are Vice-Chancellor, Director, Pro-Vice-Chancellor, Principal, Professor & Equivalent, Associate Professor, Reader, Lecturer (Selection Grade), Assistant Professor, Lecturer (Senior Scale), Lecturer, Tutor, Demonstrator, Part-Time Teacher, Ad hoc Teacher, Temporary Teacher, Contract Teacher, Visiting Teacher.
Sanctioned strength of Teaching Staff means the number of posts sanctioned designation-wise like Professor, Associate Professor and Assistant Professor etc.
Existing strength (Teachers in position) means the number of teachers currently in position against each post working in the University/Department on a particular date.
Career Advancement Scheme (CAS) is a scheme of UGC to promote Teachers from a few selected stages to higher stages.
Grade Pay – Grade Pay is a fixed amount attached to each post in the hierarchy. Grade pay determines the status of a post. VII. NON-TEACHING STAFF Non-teaching staff are staff other than Teaching staff engaged in Administrative, Secretarial, Laboratory, Library work etc. of the University/ Institution/ College in different level Groups i.e. Group A, Group B, Group C and Group D as defined by Department of Personnel & Training.
VIII. RESERVATION
Person with Disability (PWD): A person suffering from a disability as defined in the “Persons with Disabilities (Equal Opportunities, Protection of Right and Full Participation) Act, 1995”. As per Section 2 of this Act:
“Person with disability” (PWD) means a person suffering from not less than forty per cent of any of the following disabilities as certified by a medical authority;
i. Blindness; ii. Low vision; iii. Leprosy-cured; iv. Hearing impairment; v. Locomotors disability; vi. Mental retardation; vii. Mental illness;
All India Survey on Higher Education
A‐16
Other Backward Classes means the class or classes of citizens who are socially and educationally backward, and are so determined by the Central/ State Government.
Scheduled Castes means the Scheduled Castes notified under article 341 of the Constitutions.
Scheduled Tribes means the Scheduled Tribes notified under article 342 of the Constitution.
Religious Minority: Five religious communities, viz; Muslims, Christians, Sikhs, Buddhists and Zorastrians (Parsis) have been notified as minority communities by the Union Government.
IX. EXAMINATION RESULTS
Out-Turn means number of final year students of a particular programme, who have successfully completed the programme i.e number of students who have passed the final year examination of the programme.
X. REFERENCE PERIOD
Academic Year - The academic year is the period, during which one year or two semesters or three trimester of a Programme is completed.
Financial Year - The financial year is the period from 1st April of the Year to 31st March of the next year.
Reference Date - 30th September of the Academic year is taken as the reference date for filling up the all the Blocks of DCF, except the block on Examination Results and Financial Information. Generally all the admissions in various courses in a University, College & Stand alone Institutions are completed before 30th September. Reference period for financial data is Financial Year and for examination result is Academic Year.
Examination Year – It is the academic year prior to the reference date, for which Examination Results are declared. Examination results include the final and supplementary examination conducted during that year. In case of Ph.D, the out-turn is the number of students, who are awarded degree during two convocations falling prior to the reference date.
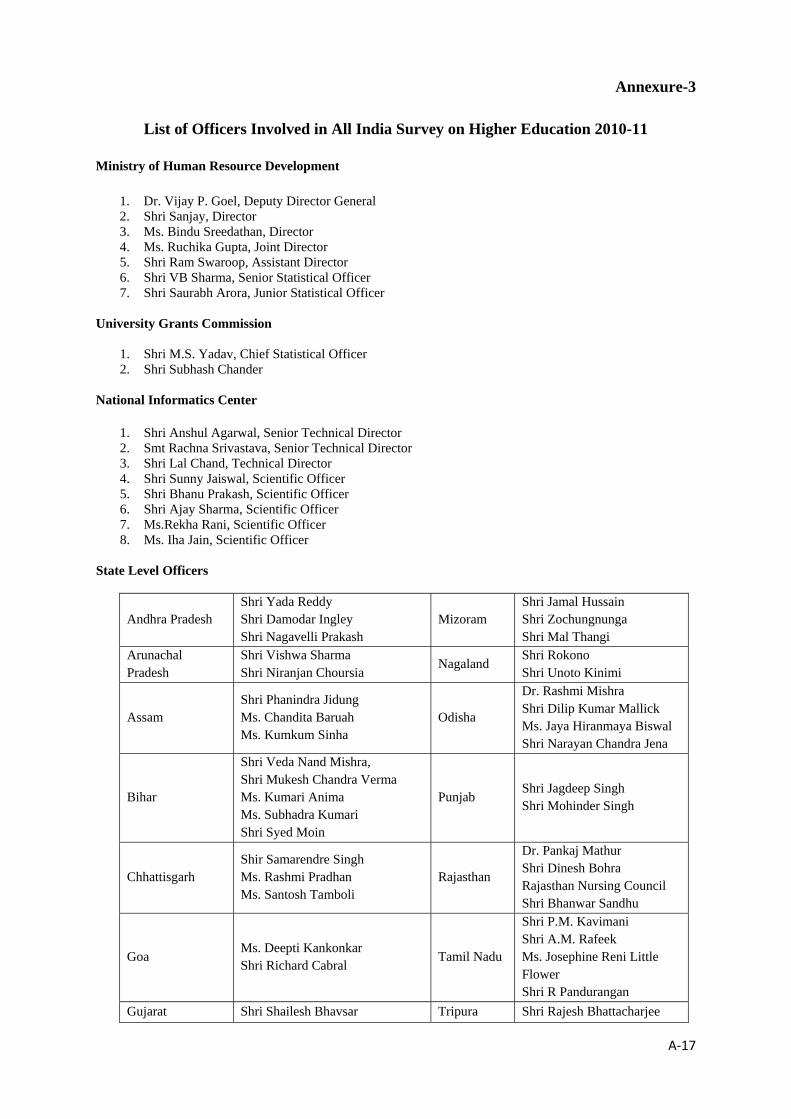
A‐17
Annexure-3
List of Officers Involved in All India Survey on Higher Education 2010-11 Ministry of Human Resource Development
1. Dr. Vijay P. Goel, Deputy Director General 2. Shri Sanjay, Director 3. Ms. Bindu Sreedathan, Director 4. Ms. Ruchika Gupta, Joint Director 5. Shri Ram Swaroop, Assistant Director 6. Shri VB Sharma, Senior Statistical Officer 7. Shri Saurabh Arora, Junior Statistical Officer
University Grants Commission
1. Shri M.S. Yadav, Chief Statistical Officer 2. Shri Subhash Chander
National Informatics Center
1. Shri Anshul Agarwal, Senior Technical Director 2. Smt Rachna Srivastava, Senior Technical Director 3. Shri Lal Chand, Technical Director 4. Shri Sunny Jaiswal, Scientific Officer 5. Shri Bhanu Prakash, Scientific Officer 6. Shri Ajay Sharma, Scientific Officer 7. Ms.Rekha Rani, Scientific Officer 8. Ms. Iha Jain, Scientific Officer
State Level Officers
Andhra Pradesh Shri Yada Reddy Shri Damodar Ingley Shri Nagavelli Prakash
Mizoram Shri Jamal Hussain Shri Zochungnunga Shri Mal Thangi
Arunachal Pradesh
Shri Vishwa Sharma Shri Niranjan Choursia
Nagaland Shri Rokono Shri Unoto Kinimi
Assam Shri Phanindra Jidung Ms. Chandita Baruah Ms. Kumkum Sinha
Odisha
Dr. Rashmi Mishra Shri Dilip Kumar Mallick Ms. Jaya Hiranmaya Biswal Shri Narayan Chandra Jena
Bihar
Shri Veda Nand Mishra, Shri Mukesh Chandra Verma Ms. Kumari Anima Ms. Subhadra Kumari Shri Syed Moin
Punjab Shri Jagdeep Singh Shri Mohinder Singh
Chhattisgarh Shir Samarendre Singh Ms. Rashmi Pradhan Ms. Santosh Tamboli
Rajasthan
Dr. Pankaj Mathur Shri Dinesh Bohra Rajasthan Nursing Council Shri Bhanwar Sandhu
Goa Ms. Deepti Kankonkar Shri Richard Cabral
Tamil Nadu
Shri P.M. Kavimani Shri A.M. Rafeek Ms. Josephine Reni Little Flower Shri R Pandurangan
Gujarat Shri Shailesh Bhavsar Tripura Shri Rajesh Bhattacharjee
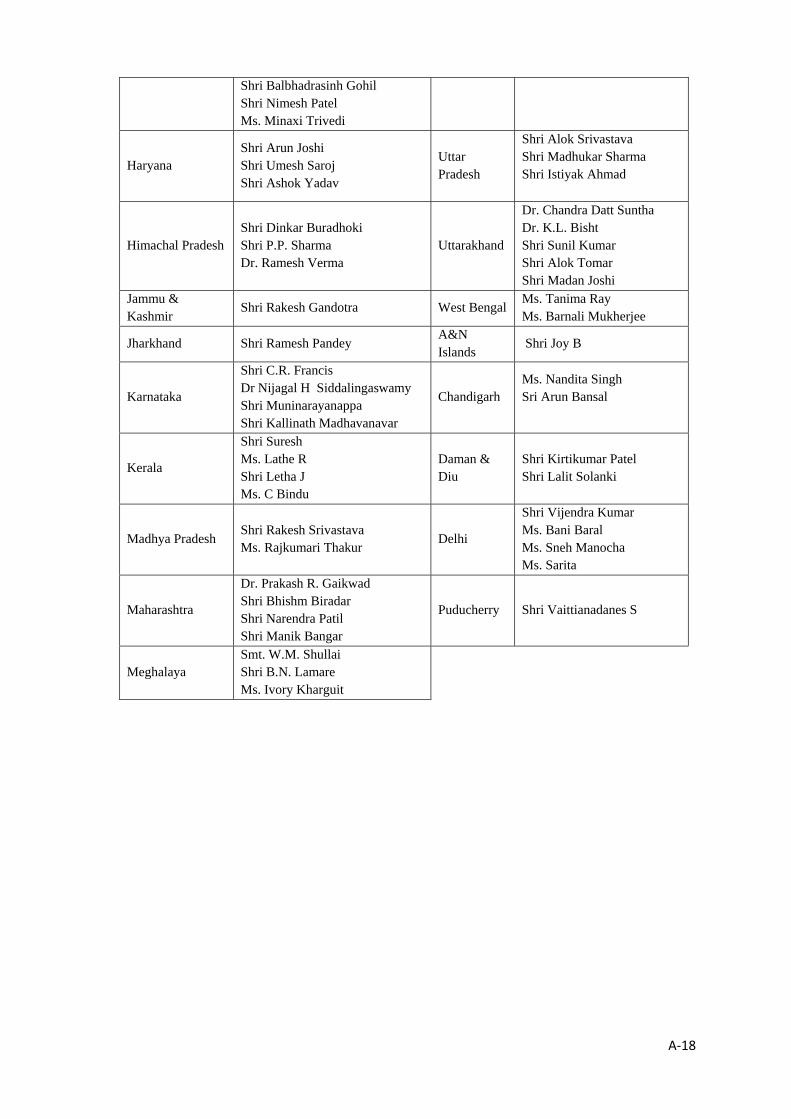
A‐18
Shri Balbhadrasinh Gohil Shri Nimesh Patel Ms. Minaxi Trivedi
Haryana Shri Arun Joshi Shri Umesh Saroj Shri Ashok Yadav
Uttar Pradesh
Shri Alok Srivastava Shri Madhukar Sharma Shri Istiyak Ahmad
Himachal Pradesh Shri Dinkar Buradhoki Shri P.P. Sharma Dr. Ramesh Verma
Uttarakhand
Dr. Chandra Datt Suntha Dr. K.L. Bisht Shri Sunil Kumar Shri Alok Tomar Shri Madan Joshi
Jammu & Kashmir
Shri Rakesh Gandotra West Bengal Ms. Tanima Ray Ms. Barnali Mukherjee
Jharkhand Shri Ramesh Pandey A&N Islands
Shri Joy B
Karnataka
Shri C.R. Francis Dr Nijagal H Siddalingaswamy Shri Muninarayanappa Shri Kallinath Madhavanavar
Chandigarh Ms. Nandita Singh Sri Arun Bansal
Kerala
Shri Suresh Ms. Lathe R Shri Letha J Ms. C Bindu
Daman & Diu
Shri Kirtikumar Patel Shri Lalit Solanki
Madhya Pradesh Shri Rakesh Srivastava Ms. Rajkumari Thakur
Delhi
Shri Vijendra Kumar Ms. Bani Baral Ms. Sneh Manocha Ms. Sarita
Maharashtra
Dr. Prakash R. Gaikwad Shri Bhishm Biradar Shri Narendra Patil Shri Manik Bangar
Puducherry Shri Vaittianadanes S
Meghalaya Smt. W.M. Shullai Shri B.N. Lamare Ms. Ivory Kharguit
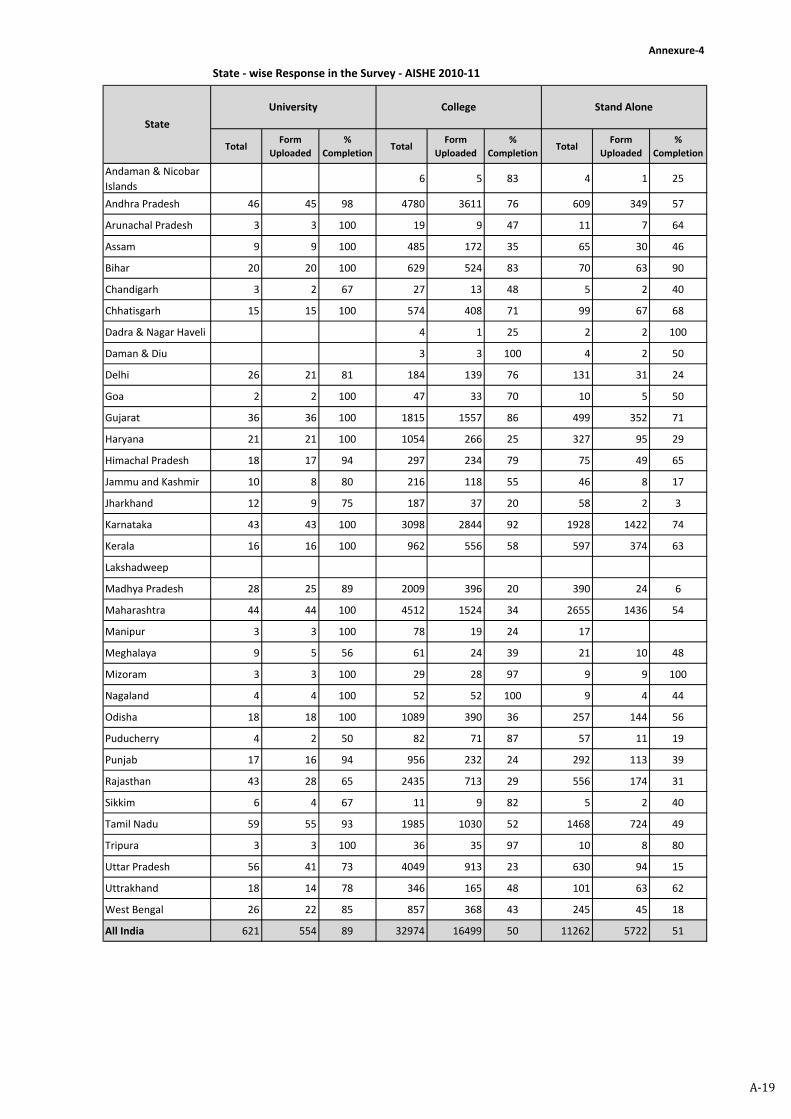
Annexure‐4
State ‐ wise Response in the Survey ‐ AISHE 2010‐11
TotalForm
Uploaded
%
CompletionTotal
Form
Uploaded
%
CompletionTotal
Form
Uploaded
%
Completion
Andaman & Nicobar
Islands6 5 83 4 1 25
Andhra Pradesh 46 45 98 4780 3611 76 609 349 57
Arunachal Pradesh 3 3 100 19 9 47 11 7 64
Assam 9 9 100 485 172 35 65 30 46
Bihar 20 20 100 629 524 83 70 63 90
Chandigarh 3 2 67 27 13 48 5 2 40
Chhatisgarh 15 15 100 574 408 71 99 67 68
Dadra & Nagar Haveli 4 1 25 2 2 100
Daman & Diu 3 3 100 4 2 50
Delhi 26 21 81 184 139 76 131 31 24
Goa 2 2 100 47 33 70 10 5 50
Gujarat 36 36 100 1815 1557 86 499 352 71
Haryana 21 21 100 1054 266 25 327 95 29
Himachal Pradesh 18 17 94 297 234 79 75 49 65
Jammu and Kashmir 10 8 80 216 118 55 46 8 17
Jharkhand 12 9 75 187 37 20 58 2 3
Karnataka 43 43 100 3098 2844 92 1928 1422 74
Kerala 16 16 100 962 556 58 597 374 63
Lakshadweep
Madhya Pradesh 28 25 89 2009 396 20 390 24 6
Maharashtra 44 44 100 4512 1524 34 2655 1436 54
Manipur 3 3 100 78 19 24 17
Meghalaya 9 5 56 61 24 39 21 10 48
Mizoram 3 3 100 29 28 97 9 9 100
Nagaland 4 4 100 52 52 100 9 4 44
Odisha 18 18 100 1089 390 36 257 144 56
Puducherry 4 2 50 82 71 87 57 11 19
Punjab 17 16 94 956 232 24 292 113 39
Rajasthan 43 28 65 2435 713 29 556 174 31
Sikkim 6 4 67 11 9 82 5 2 40
Tamil Nadu 59 55 93 1985 1030 52 1468 724 49
Tripura 3 3 100 36 35 97 10 8 80
Uttar Pradesh 56 41 73 4049 913 23 630 94 15
Uttrakhand 18 14 78 346 165 48 101 63 62
West Bengal 26 22 85 857 368 43 245 45 18
All India 621 554 89 32974 16499 50 11262 5722 51
State
University College Stand Alone
A‐19
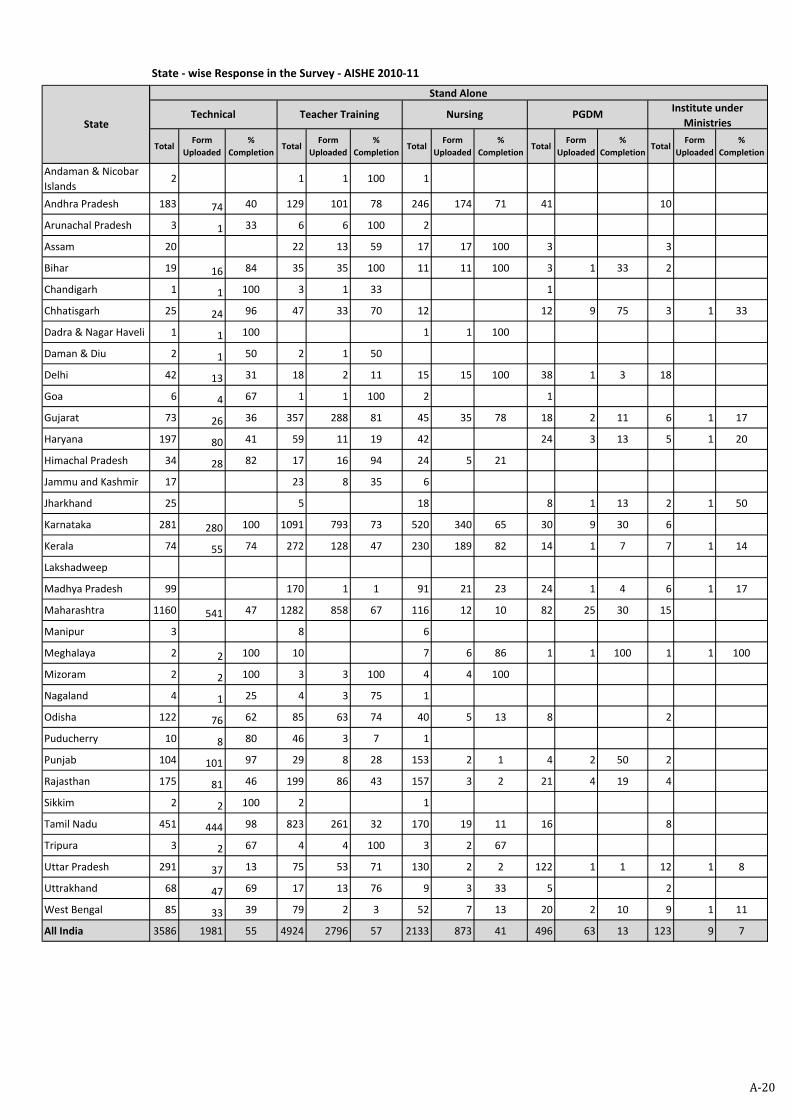
Andaman & Nicobar
Islands
Andhra Pradesh
Arunachal Pradesh
Assam
Bihar
Chandigarh
Chhatisgarh
Dadra & Nagar Haveli
Daman & Diu
Delhi
Goa
Gujarat
Haryana
Himachal Pradesh
Jammu and Kashmir
Jharkhand
Karnataka
Kerala
Lakshadweep
Madhya Pradesh
Maharashtra
Manipur
Meghalaya
Mizoram
Nagaland
Odisha
Puducherry
Punjab
Rajasthan
Sikkim
Tamil Nadu
Tripura
Uttar Pradesh
Uttrakhand
West Bengal
All India
State
State ‐ wise Response in the Survey ‐ AISHE 2010‐11
TotalForm
Uploaded
%
CompletionTotal
Form
Uploaded
%
CompletionTotal
Form
Uploaded
%
CompletionTotal
Form
Uploaded
%
CompletionTotal
Form
Uploaded
%
Completion
2 1 1 100 1
183 74 40 129 101 78 246 174 71 41 10
3 1 33 6 6 100 2
20 22 13 59 17 17 100 3 3
19 16 84 35 35 100 11 11 100 3 1 33 2
1 1 100 3 1 33 1
25 24 96 47 33 70 12 12 9 75 3 1 33
1 1 100 1 1 100
2 1 50 2 1 50
42 13 31 18 2 11 15 15 100 38 1 3 18
6 4 67 1 1 100 2 1
73 26 36 357 288 81 45 35 78 18 2 11 6 1 17
197 80 41 59 11 19 42 24 3 13 5 1 20
34 28 82 17 16 94 24 5 21
17 23 8 35 6
25 5 18 8 1 13 2 1 50
281 280 100 1091 793 73 520 340 65 30 9 30 6
74 55 74 272 128 47 230 189 82 14 1 7 7 1 14
99 170 1 1 91 21 23 24 1 4 6 1 17
1160 541 47 1282 858 67 116 12 10 82 25 30 15
3 8 6
2 2 100 10 7 6 86 1 1 100 1 1 100
2 2 100 3 3 100 4 4 100
4 1 25 4 3 75 1
122 76 62 85 63 74 40 5 13 8 2
10 8 80 46 3 7 1
104 101 97 29 8 28 153 2 1 4 2 50 2
175 81 46 199 86 43 157 3 2 21 4 19 4
2 2 100 2 1
451 444 98 823 261 32 170 19 11 16 8
3 2 67 4 4 100 3 2 67
291 37 13 75 53 71 130 2 2 122 1 1 12 1 8
68 47 69 17 13 76 9 3 33 5 2
85 33 39 79 2 3 52 7 13 20 2 10 9 1 11
3586 1981 55 4924 2796 57 2133 873 41 496 63 13 123 9 7
PGDMInstitute under
Ministries
Stand Alone
Technical Teacher Training Nursing
A‐20
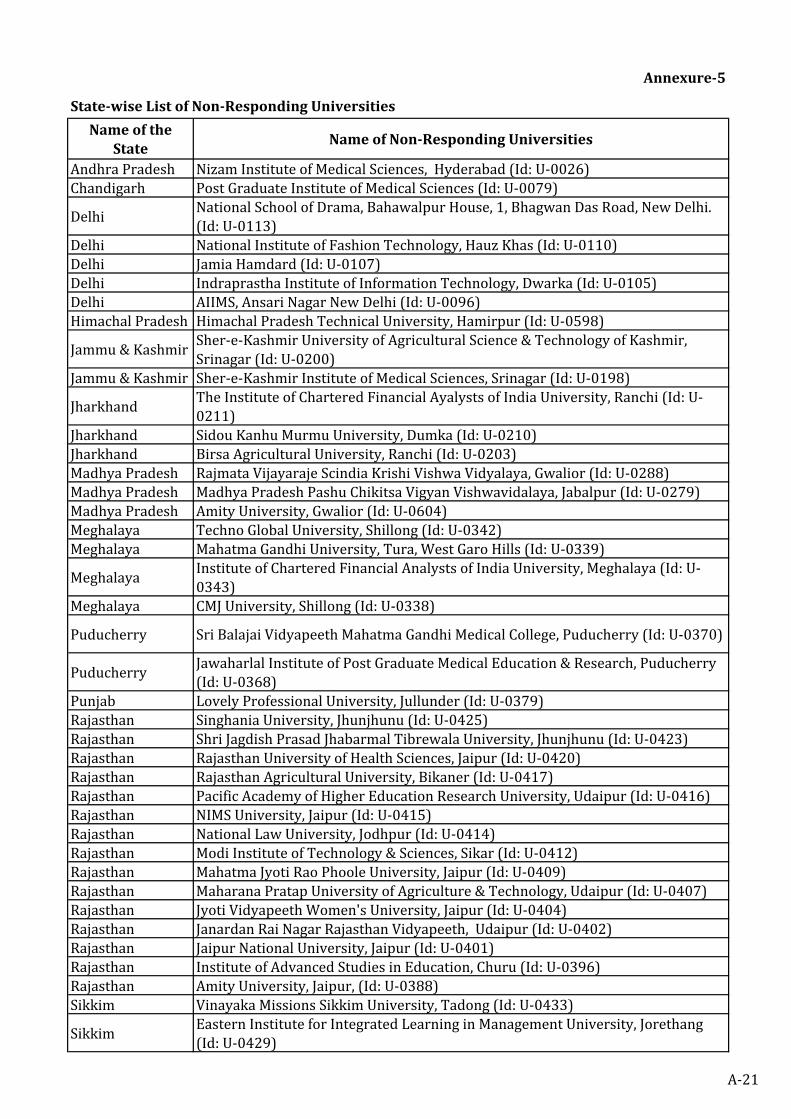
Annexure5
Statewise List of NonResponding Universities
Name of the State
Name of NonResponding Universities
Andhra Pradesh Nizam Institute of Medical Sciences, Hyderabad (Id: U‐0026)Chandigarh Post Graduate Institute of Medical Sciences (Id: U‐0079)
DelhiNational School of Drama, Bahawalpur House, 1, Bhagwan Das Road, New Delhi. (Id: U‐0113)
Delhi National Institute of Fashion Technology, Hauz Khas (Id: U‐0110)Delhi Jamia Hamdard (Id: U‐0107)Delhi Indraprastha Institute of Information Technology, Dwarka (Id: U‐0105)Delhi AIIMS, Ansari Nagar New Delhi (Id: U‐0096)Himachal Pradesh Himachal Pradesh Technical University, Hamirpur (Id: U‐0598)
Jammu & KashmirSher‐e‐Kashmir University of Agricultural Science & Technology of Kashmir, Srinagar (Id: U‐0200)
Jammu & Kashmir Sher‐e‐Kashmir Institute of Medical Sciences, Srinagar (Id: U‐0198)
JharkhandThe Institute of Chartered Financial Ayalysts of India University, Ranchi (Id: U‐0211)
Jharkhand Sidou Kanhu Murmu University, Dumka (Id: U‐0210)Jharkhand Birsa Agricultural University, Ranchi (Id: U‐0203)Madhya Pradesh Rajmata Vijayaraje Scindia Krishi Vishwa Vidyalaya, Gwalior (Id: U‐0288)Madhya Pradesh Madhya Pradesh Pashu Chikitsa Vigyan Vishwavidalaya, Jabalpur (Id: U‐0279)Madhya Pradesh Amity University, Gwalior (Id: U‐0604)Meghalaya Techno Global University, Shillong (Id: U‐0342)Meghalaya Mahatma Gandhi University, Tura, West Garo Hills (Id: U‐0339)
MeghalayaInstitute of Chartered Financial Analysts of India University, Meghalaya (Id: U‐0343)
Meghalaya CMJ University, Shillong (Id: U‐0338)
Puducherry Sri Balajai Vidyapeeth Mahatma Gandhi Medical College, Puducherry (Id: U‐0370)
PuducherryJawaharlal Institute of Post Graduate Medical Education & Research, Puducherry (Id: U‐0368)
Punjab Lovely Professional University, Jullunder (Id: U‐0379)Rajasthan Singhania University, Jhunjhunu (Id: U‐0425)Rajasthan Shri Jagdish Prasad Jhabarmal Tibrewala University, Jhunjhunu (Id: U‐0423)Rajasthan Rajasthan University of Health Sciences, Jaipur (Id: U‐0420)Rajasthan Rajasthan Agricultural University, Bikaner (Id: U‐0417)Rajasthan Pacific Academy of Higher Education Research University, Udaipur (Id: U‐0416)Rajasthan NIMS University, Jaipur (Id: U‐0415)Rajasthan National Law University, Jodhpur (Id: U‐0414)Rajasthan Modi Institute of Technology & Sciences, Sikar (Id: U‐0412)Rajasthan Mahatma Jyoti Rao Phoole University, Jaipur (Id: U‐0409)Rajasthan Maharana Pratap University of Agriculture & Technology, Udaipur (Id: U‐0407)Rajasthan Jyoti Vidyapeeth Women's University, Jaipur (Id: U‐0404)Rajasthan Janardan Rai Nagar Rajasthan Vidyapeeth, Udaipur (Id: U‐0402)Rajasthan Jaipur National University, Jaipur (Id: U‐0401)Rajasthan Institute of Advanced Studies in Education, Churu (Id: U‐0396)Rajasthan Amity University, Jaipur, (Id: U‐0388)Sikkim Vinayaka Missions Sikkim University, Tadong (Id: U‐0433)
SikkimEastern Institute for Integrated Learning in Management University, Jorethang (Id: U‐0429)
A‐21
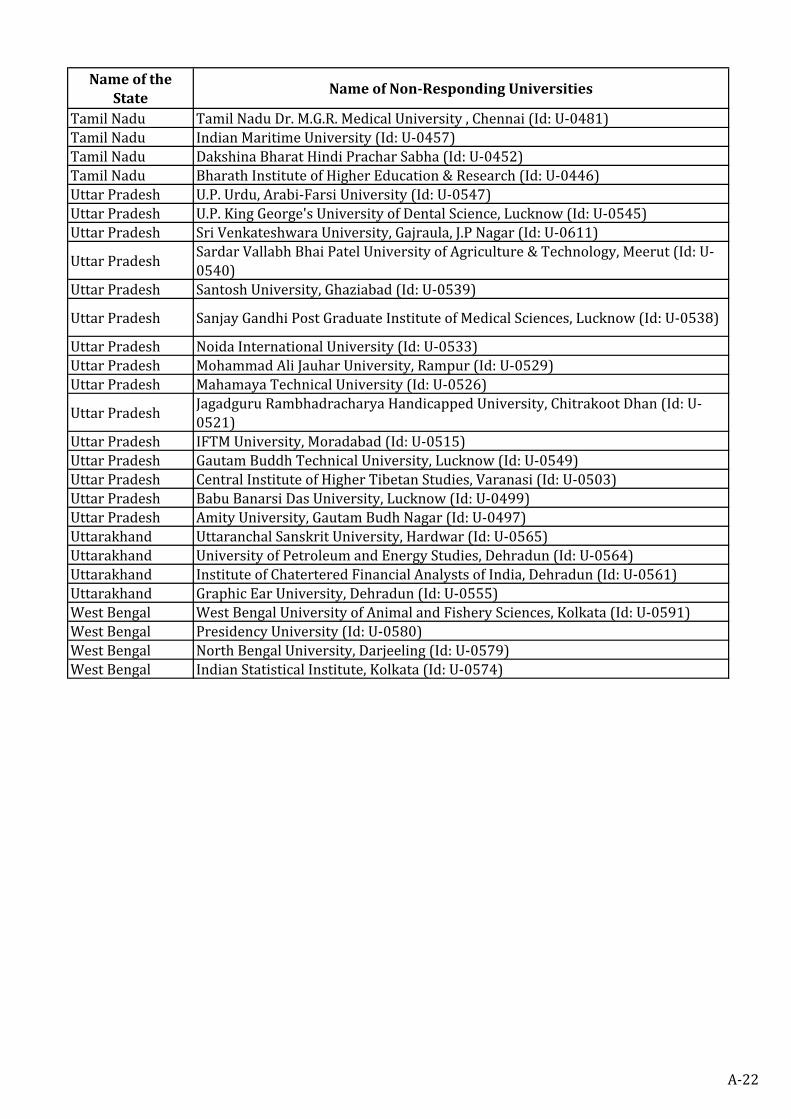
Name of the State
Name of NonResponding Universities
Tamil Nadu Tamil Nadu Dr. M.G.R. Medical University , Chennai (Id: U‐0481)Tamil Nadu Indian Maritime University (Id: U‐0457)Tamil Nadu Dakshina Bharat Hindi Prachar Sabha (Id: U‐0452)Tamil Nadu Bharath Institute of Higher Education & Research (Id: U‐0446)Uttar Pradesh U.P. Urdu, Arabi‐Farsi University (Id: U‐0547)Uttar Pradesh U.P. King George's University of Dental Science, Lucknow (Id: U‐0545)Uttar Pradesh Sri Venkateshwara University, Gajraula, J.P Nagar (Id: U‐0611)
Uttar PradeshSardar Vallabh Bhai Patel University of Agriculture & Technology, Meerut (Id: U‐0540)
Uttar Pradesh Santosh University, Ghaziabad (Id: U‐0539)
Uttar Pradesh Sanjay Gandhi Post Graduate Institute of Medical Sciences, Lucknow (Id: U‐0538)
Uttar Pradesh Noida International University (Id: U‐0533)Uttar Pradesh Mohammad Ali Jauhar University, Rampur (Id: U‐0529)Uttar Pradesh Mahamaya Technical University (Id: U‐0526)
Uttar PradeshJagadguru Rambhadracharya Handicapped University, Chitrakoot Dhan (Id: U‐0521)
Uttar Pradesh IFTM University, Moradabad (Id: U‐0515)Uttar Pradesh Gautam Buddh Technical University, Lucknow (Id: U‐0549)Uttar Pradesh Central Institute of Higher Tibetan Studies, Varanasi (Id: U‐0503)Uttar Pradesh Babu Banarsi Das University, Lucknow (Id: U‐0499)Uttar Pradesh Amity University, Gautam Budh Nagar (Id: U‐0497)Uttarakhand Uttaranchal Sanskrit University, Hardwar (Id: U‐0565)Uttarakhand University of Petroleum and Energy Studies, Dehradun (Id: U‐0564)Uttarakhand Institute of Chatertered Financial Analysts of India, Dehradun (Id: U‐0561)Uttarakhand Graphic Ear University, Dehradun (Id: U‐0555)West Bengal West Bengal University of Animal and Fishery Sciences, Kolkata (Id: U‐0591)West Bengal Presidency University (Id: U‐0580)West Bengal North Bengal University, Darjeeling (Id: U‐0579)West Bengal Indian Statistical Institute, Kolkata (Id: U‐0574)
A‐22
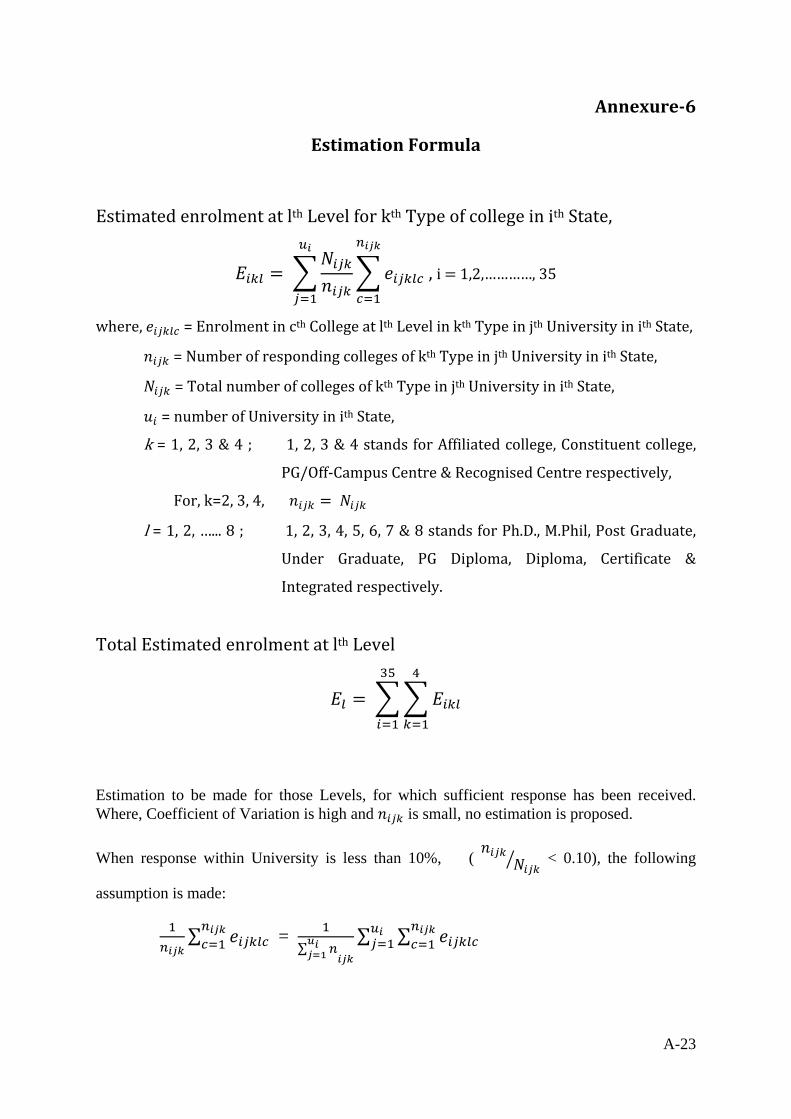
A-23
Annexure6
Estimation Formula
Estimated enrolment at lth Level for kth Type of college in ith State,
, i 1,2,…………, 35
where, = Enrolment in cth College at lth Level in kth Type in jth University in ith State,
= Number of responding colleges of kth Type in jth University in ith State,
= Total number of colleges of kth Type in jth University in ith State,
= number of University in ith State,
k = 1, 2, 3 & 4 ; 1, 2, 3 & 4 stands for Affiliated college, Constituent college,
PG/Off‐Campus Centre & Recognised Centre respectively,
For, k=2, 3, 4,
l = 1, 2, …... 8 ; 1, 2, 3, 4, 5, 6, 7 & 8 stands for Ph.D., M.Phil, Post Graduate,
Under Graduate, PG Diploma, Diploma, Certificate &
Integrated respectively.
Total Estimated enrolment at lth Level
Estimation to be made for those Levels, for which sufficient response has been received. Where, Coefficient of Variation is high and is small, no estimation is proposed.
When response within University is less than 10%, ( < 0.10), the following
assumption is made:
∑ = ∑
∑ ∑
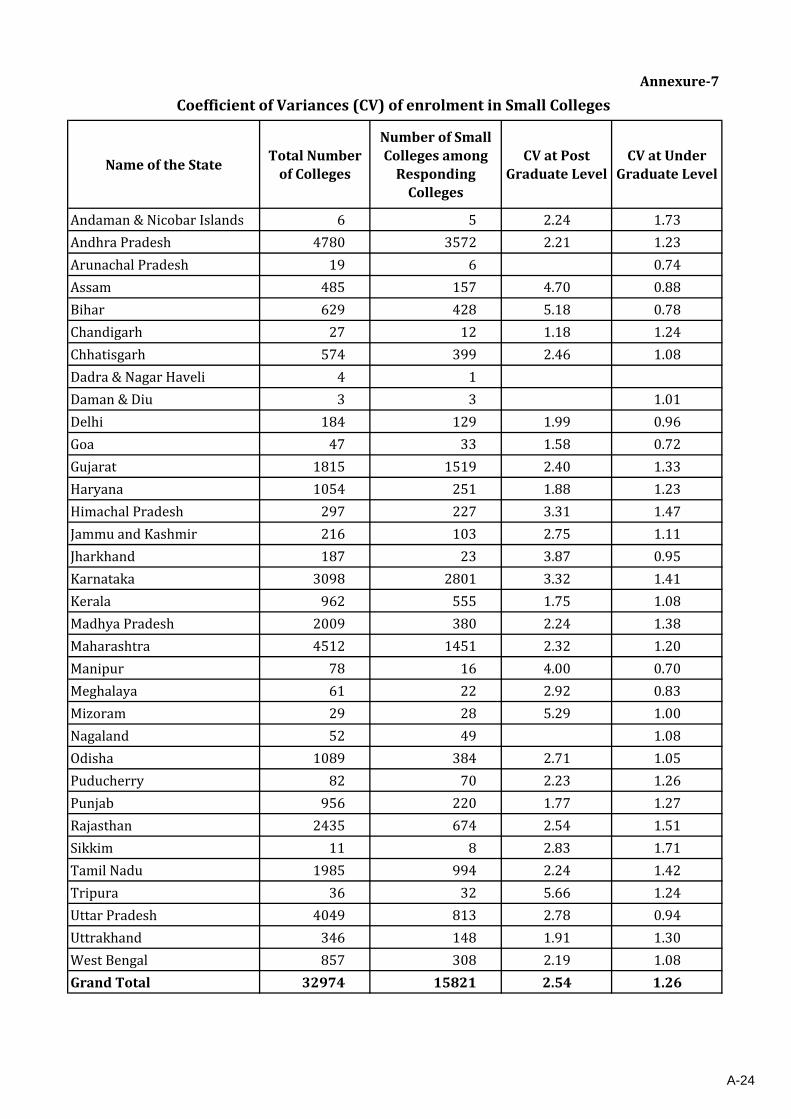
Annexure7
Name of the StateTotal Number of Colleges
Number of Small Colleges among Responding Colleges
CV at Post Graduate Level
CV at Under Graduate Level
Andaman & Nicobar Islands 6 5 2.24 1.73
Andhra Pradesh 4780 3572 2.21 1.23
Arunachal Pradesh 19 6 0.74
Assam 485 157 4.70 0.88
Bihar 629 428 5.18 0.78
Chandigarh 27 12 1.18 1.24
Chhatisgarh 574 399 2.46 1.08
Dadra & Nagar Haveli 4 1
Daman & Diu 3 3 1.01
Delhi 184 129 1.99 0.96
Goa 47 33 1.58 0.72
Gujarat 1815 1519 2.40 1.33
Haryana 1054 251 1.88 1.23
Himachal Pradesh 297 227 3.31 1.47
Jammu and Kashmir 216 103 2.75 1.11
Jharkhand 187 23 3.87 0.95
Karnataka 3098 2801 3.32 1.41
Kerala 962 555 1.75 1.08
Madhya Pradesh 2009 380 2.24 1.38
Maharashtra 4512 1451 2.32 1.20
Manipur 78 16 4.00 0.70
Meghalaya 61 22 2.92 0.83
Mizoram 29 28 5.29 1.00
Nagaland 52 49 1.08
Odisha 1089 384 2.71 1.05
Puducherry 82 70 2.23 1.26
Punjab 956 220 1.77 1.27
Rajasthan 2435 674 2.54 1.51
Sikkim 11 8 2.83 1.71
Tamil Nadu 1985 994 2.24 1.42
Tripura 36 32 5.66 1.24
Uttar Pradesh 4049 813 2.78 0.94
Uttrakhand 346 148 1.91 1.30
West Bengal 857 308 2.19 1.08
Grand Total 32974 15821 2.54 1.26
Coefficient of Variances (CV) of enrolment in Small Colleges
A-24