Embed Size (px)
Citation preview
History of social security in Europe
Quick view on EU history of social securityMedieval - Renaissance times: Poorhouses & charity Controlling role of the State Guilds, fraternities and commons Craft guilds; in particular in the Low Lands
Both “employers organisations and trade unions” Unite members of the same occupational group Serving members’ economic interests And the general well-being of their group Achieving agreements: negotiation and collective action Income security and social security Contributions to secure income
2
We’re getting closer….
Industrial revolution 1750-1850 Classical liberalism (A. Smith):
Economic doctrine of free enterprise Urbanisation From family economy to industry economy:
Rightless workers – no correction mechanisms Child labour
Need for organisation of workers’ interests 1848…
3
Beginning of institutionalised social security
1850-1900 Upcoming socialism (Marx) Upcoming trade unions:
First priority for wages and working hours and Christian social thinking (Rerum novarum):
First labour laws (child labour and women) Laws for the poor
1889 Germany (Von Bismarck): Retirement benefits (70 years) Disability benefits Sickness insurance
4
Beginning of institutionalised social security
1900-1950 Trade unions:
Funds for income support unemployment & sickness WW 1: this never again….
Beginning social dialogue (Low lands, Nordic countries) Beginning overarching international institutions
Russian revolution: state communism Crash of 1929 John Maynard Keynes
5
Beginning of institutionalised social security
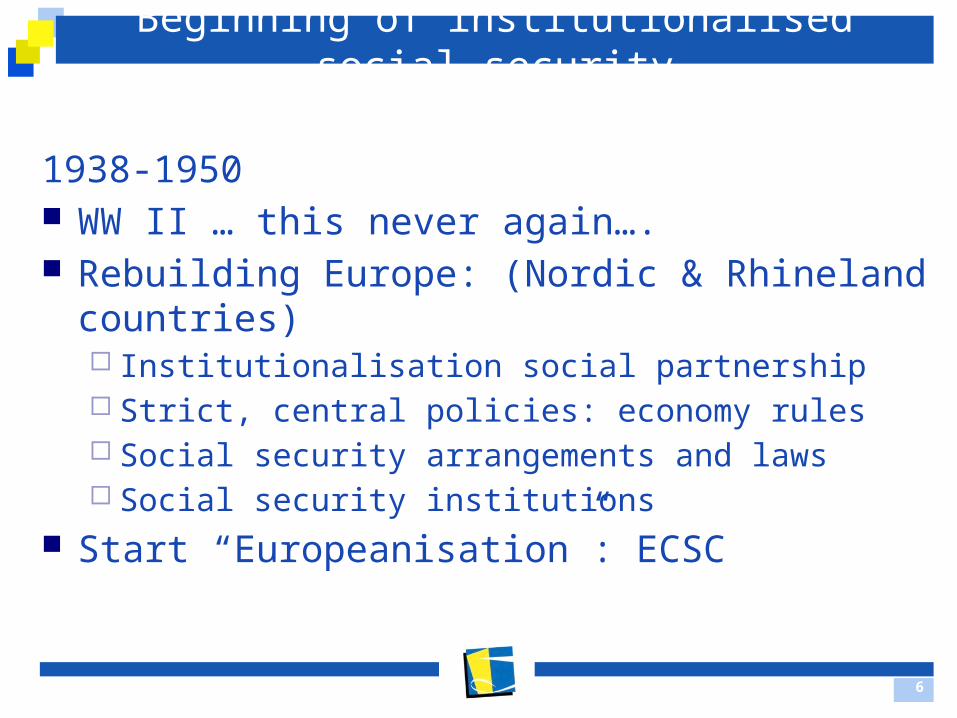
1938-1950 WW II … this never again…. Rebuilding Europe: (Nordic & Rhineland countries)
Institutionalisation social partnership Strict, central policies: economy rules Social security arrangements and laws Social security institutions
Start “Europeanisation”: ECSC
6

7
8
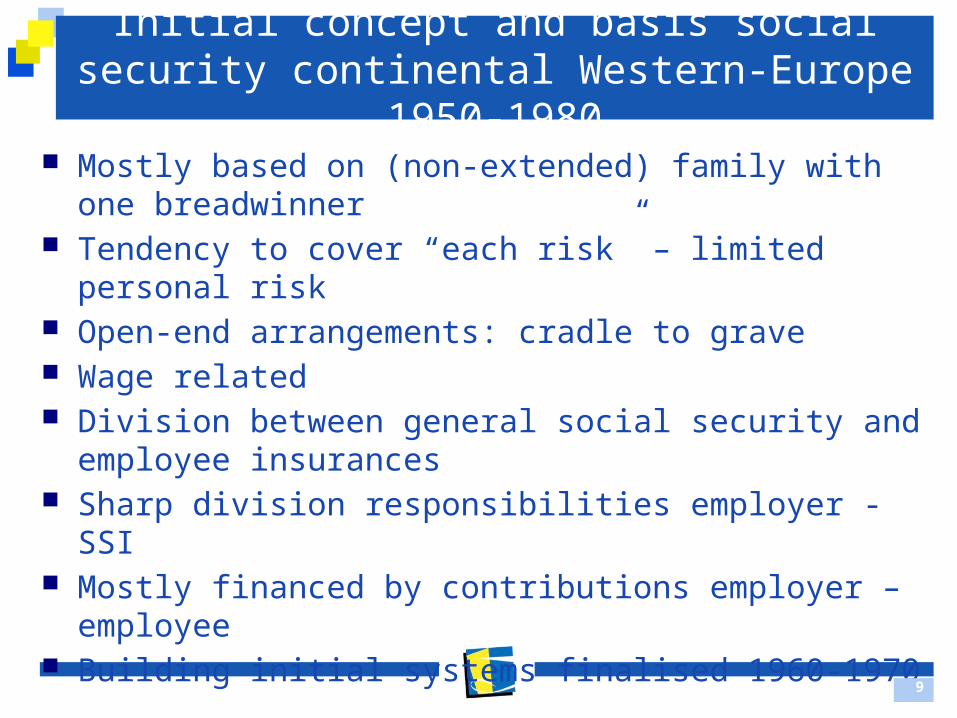
Initial concept and basis social security continental Western-Europe 1950-1980
Mostly based on (non-extended) family with one breadwinner
Tendency to cover “each risk” – limited personal risk Open-end arrangements: cradle to grave Wage related Division between general social security and employee
insurances Sharp division responsibilities employer - SSI Mostly financed by contributions employer – employee Building initial systems finalised 1960-1970
9
Europe: one and undivided?
Economic models in Europe
11
Subjects
(Socio-) economic models in Europe: Rhineland Anglo-Saxon Mediterranean Nordic
Exercise… Performances of the models Where does Turkey stand?
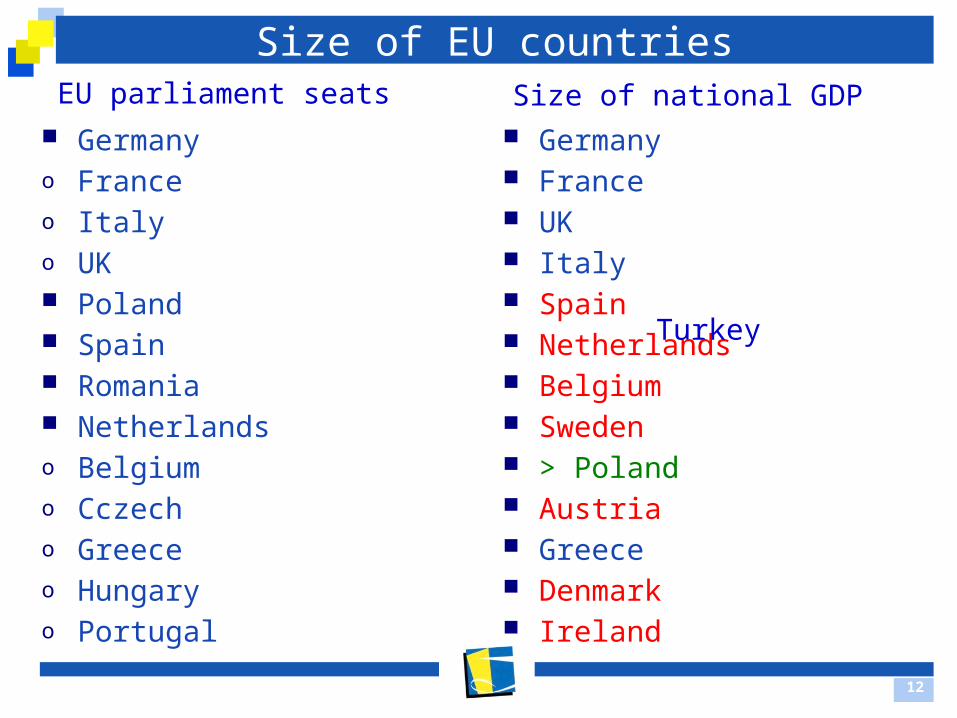
Size of EU countries
Germanyo France o Italyo UK Poland Spain Romania Netherlandso Belgiumo Cczecho Greeceo Hungaryo Portugal
Germany France UK Italy Spain Netherlands Belgium Sweden > Poland Austria Greece Denmark Ireland
12
EU parliament seats Size of national GDP
Turkey
Many differences in Europe
Differences in: Economic characteristics Stage of development and Performances
Differences in history and applied economic models Two illustrative indicators: GDP and Minimum
Wages
13
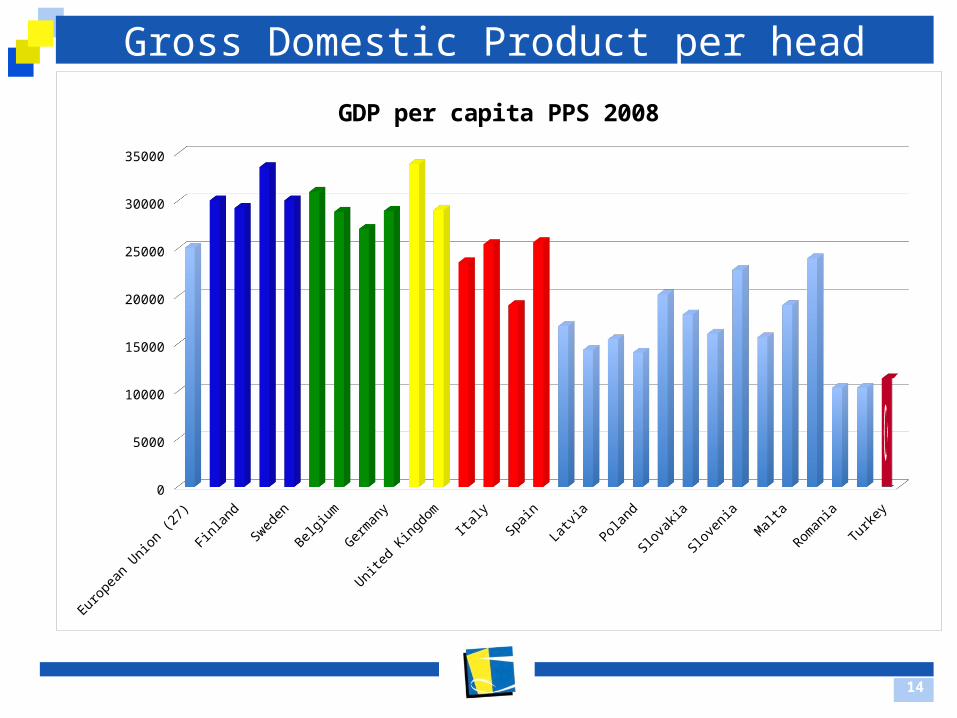
Gross Domestic Product per head
14
Europ
ean
Union
(27)
Denm
ark
Finlan
d
Nethe
rland
s
Sweden
Austri
a
Belgium
Franc
e
Germ
any
Irelan
d
United
King
dom
Greec
eIta
ly
Portu
gal
Spain
Eston
ia
Latv
ia
Lithu
ania
Poland
Czech
Rep
ublic
Slovak
ia
Hunga
ry
Sloven
ia
Croat
iaM
alta
Cypru
s
Roman
ia
Bulgar
ia
Turke
y0
5000
10000
15000
20000
25000
30000
35000
GDP per capita PPS 2008
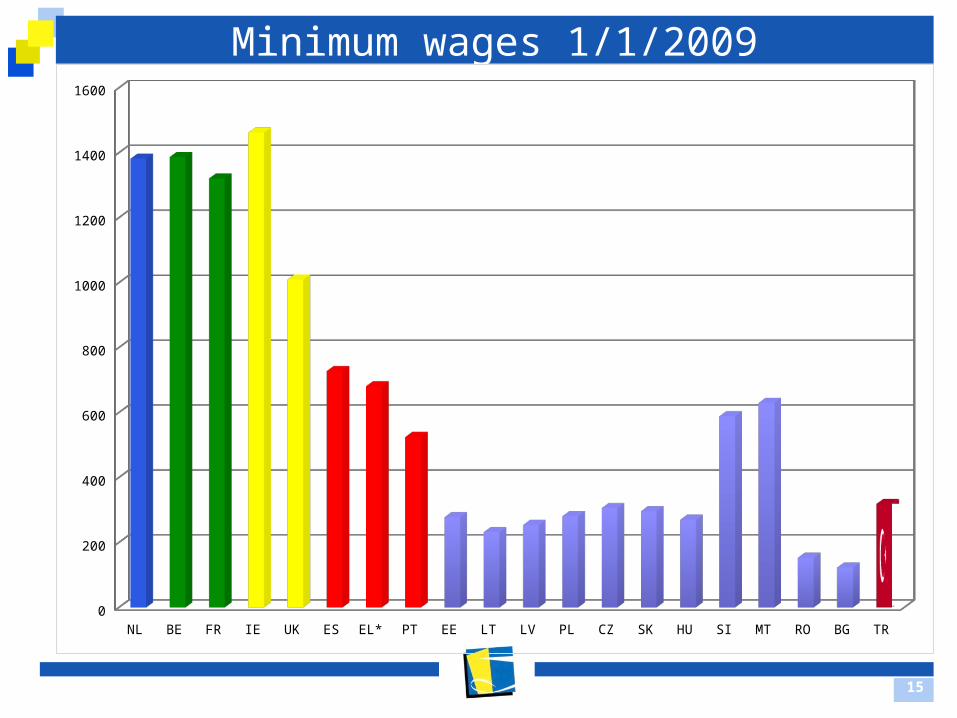
Minimum wages 1/1/2009
15
NL BE FR IE UK ES EL* PT EE LT LV PL CZ SK HU SI MT RO BG TR0
200
400
600
800
1000
1200
1400
1600
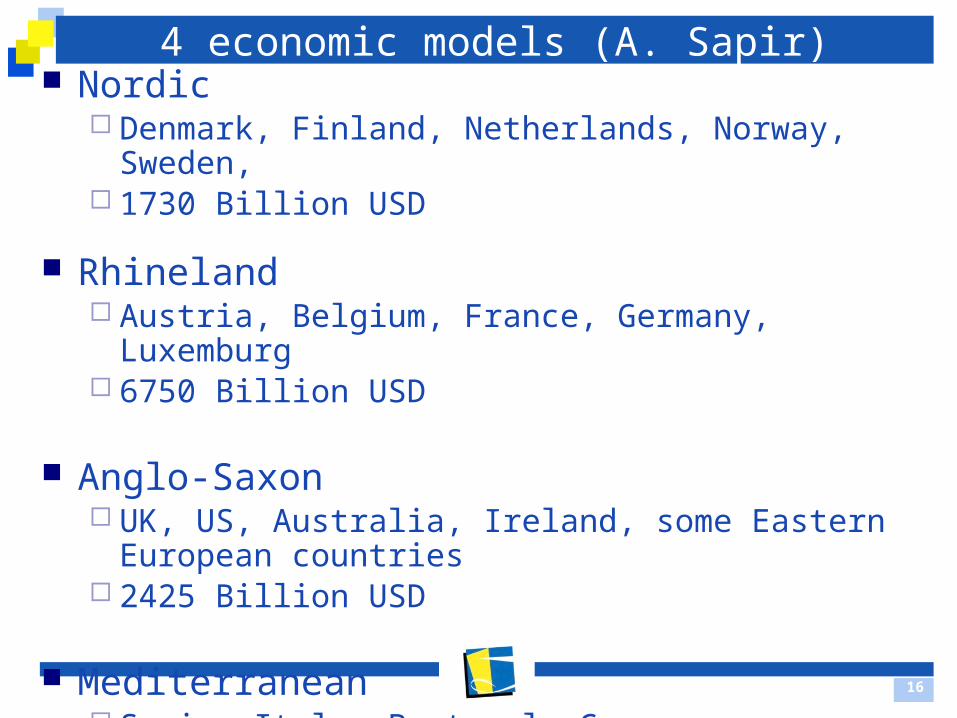
4 economic models (A. Sapir) Nordic
Denmark, Finland, Netherlands, Norway, Sweden, 1730 Billion USD
Rhineland Austria, Belgium, France, Germany, Luxemburg 6750 Billion USD
Anglo-Saxon UK, US, Australia, Ireland, some Eastern European
countries 2425 Billion USD
Mediterranean Spain, Italy, Portugal, Greece 4120 Billion USD
16
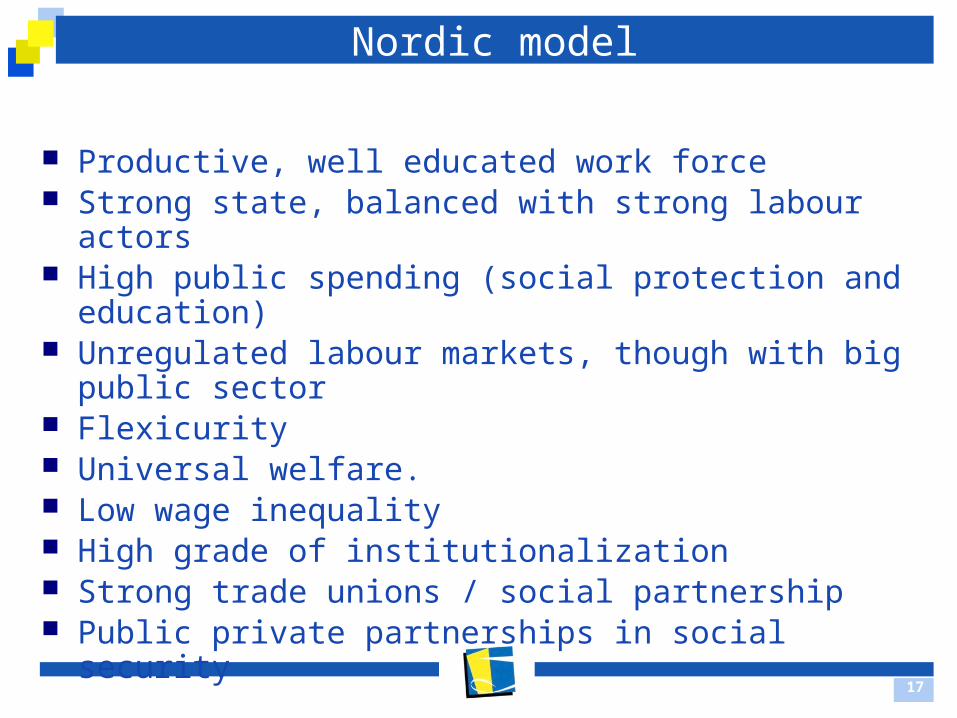
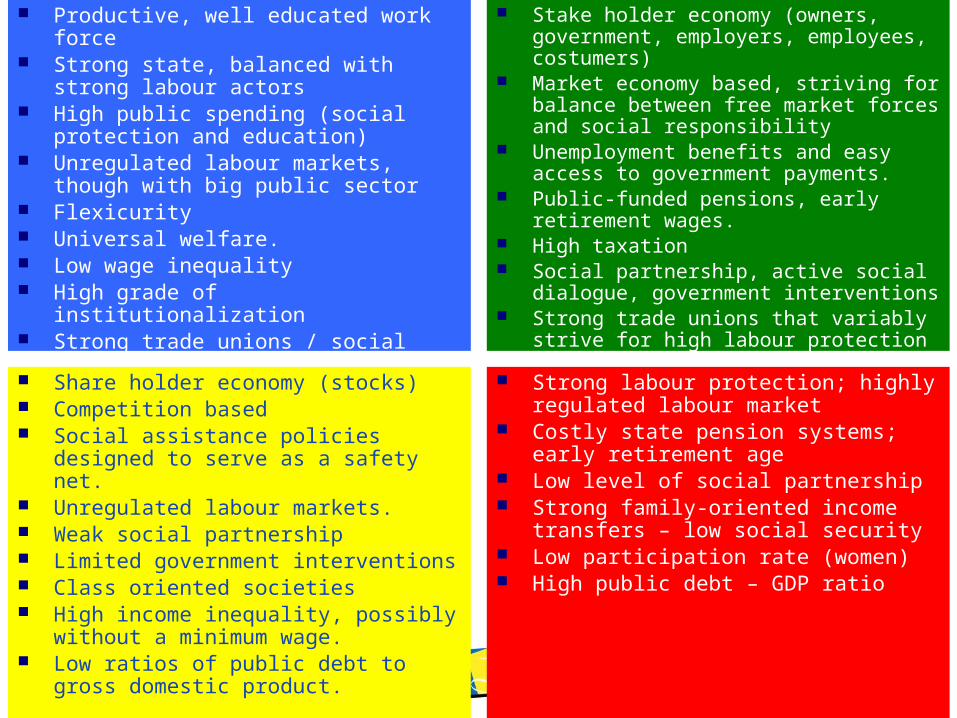
Nordic model
Productive, well educated work force Strong state, balanced with strong labour actors High public spending (social protection and
education) Unregulated labour markets, though with big public
sector Flexicurity Universal welfare. Low wage inequality High grade of institutionalization Strong trade unions / social partnership Public private partnerships in social security
17
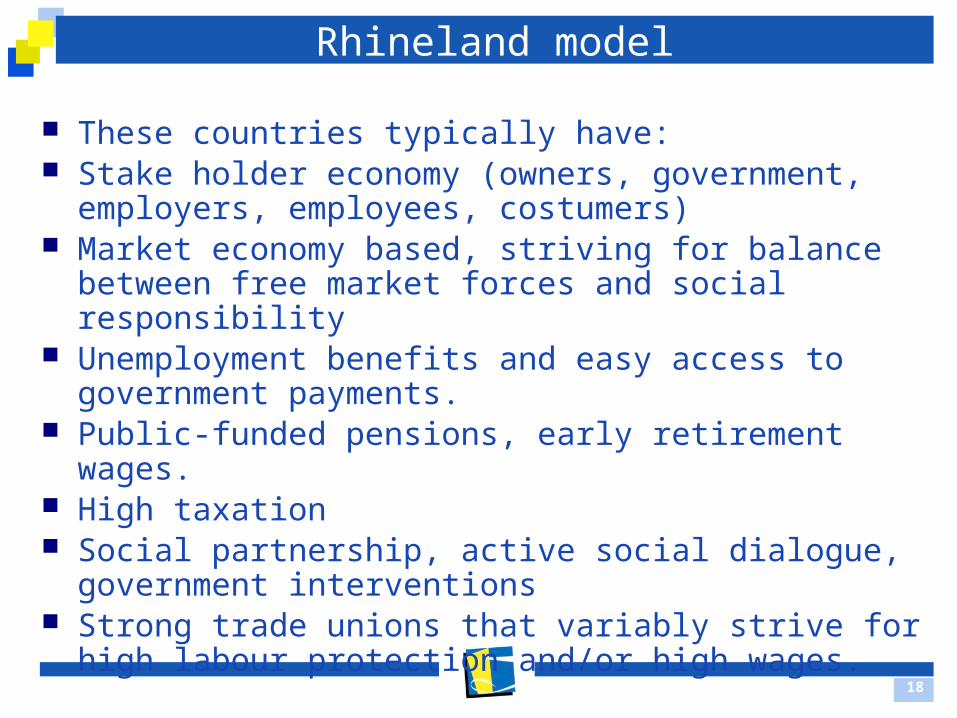
Rhineland model
These countries typically have: Stake holder economy (owners, government,
employers, employees, costumers) Market economy based, striving for balance between
free market forces and social responsibility Unemployment benefits and easy access to
government payments. Public-funded pensions, early retirement wages. High taxation Social partnership, active social dialogue,
government interventions Strong trade unions that variably strive for high
labour protection and/or high wages.
18
Anglo-Saxon model
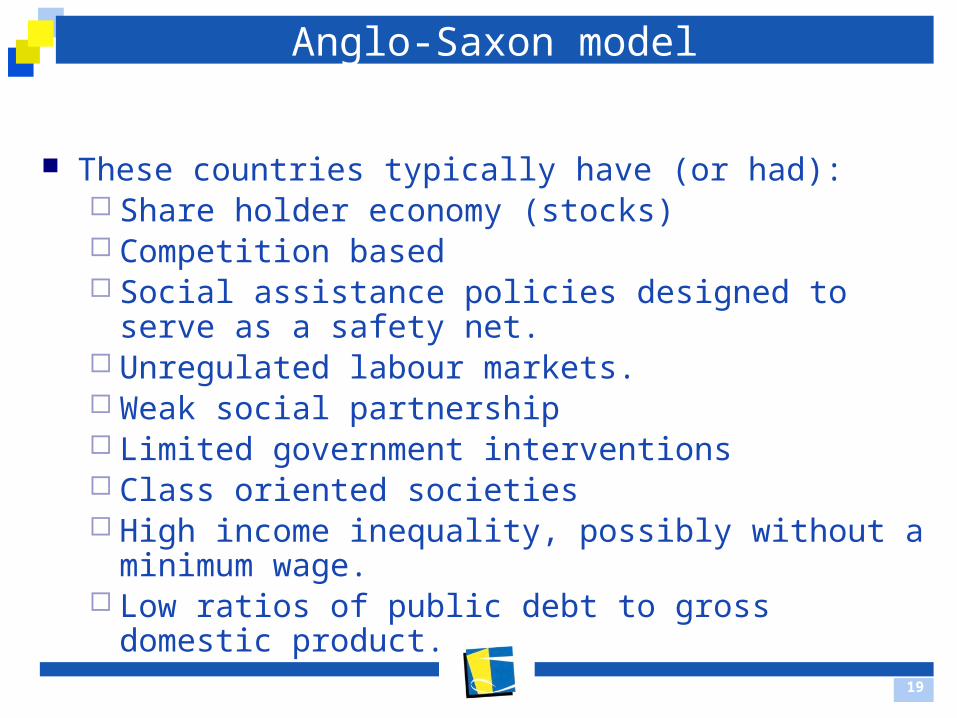
These countries typically have (or had): Share holder economy (stocks) Competition based Social assistance policies designed to serve as a
safety net. Unregulated labour markets. Weak social partnership Limited government interventions Class oriented societies High income inequality, possibly without a
minimum wage. Low ratios of public debt to gross domestic
product.19
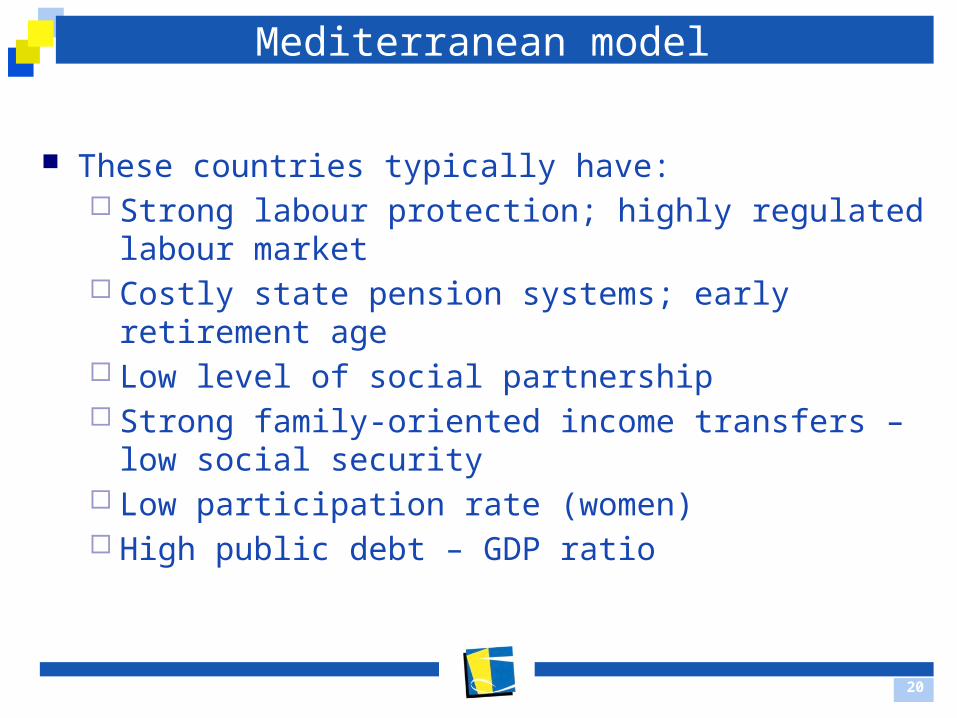
Mediterranean model
These countries typically have: Strong labour protection; highly regulated labour
market Costly state pension systems; early retirement
age Low level of social partnership Strong family-oriented income transfers – low
social security Low participation rate (women) High public debt – GDP ratio
20

MODELS’ PERFORMANCES
21
22
Nordic
Rhineland
Anglo-Saxan
Mediterranean
0.00 10000.00 20000.00 30000.00 40000.00
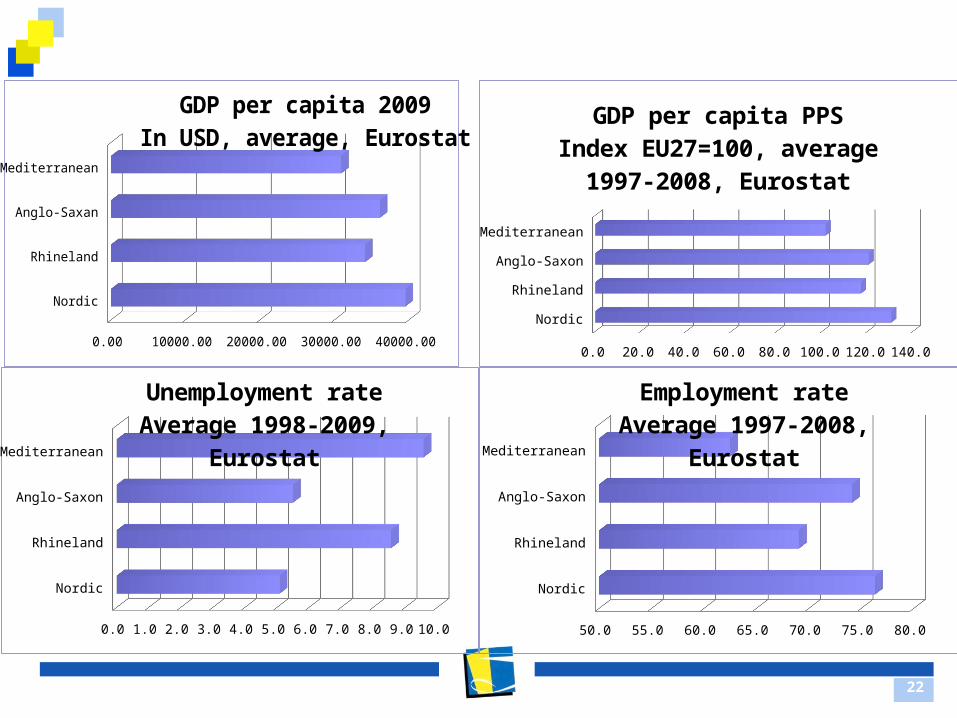
GDP per capita 2009In USD, average, Eurostat
Nordic
Rhineland
Anglo-Saxon
Mediterranean
0.0 1.0 2.0 3.0 4.0 5.0 6.0 7.0 8.0 9.0 10.0
Unemployment rateAverage 1998-2009, Eurostat
Nordic
Rhineland
Anglo-Saxon
Mediterranean
0.0 20.0 40.0 60.0 80.0 100.0 120.0 140.0
GDP per capita PPSIndex EU27=100, average 1997-
2008, Eurostat
Nordic
Rhineland
Anglo-Saxon
Mediterranean
50.0 55.0 60.0 65.0 70.0 75.0 80.0
Employment rateAverage 1997-2008, Eurostat
23
Nordic
Rhineland
Anglo-Saxon
Mediterranean
0.0 5.0 10.0 15.0 20.0 25.0 30.0 35.0 40.0 45.0
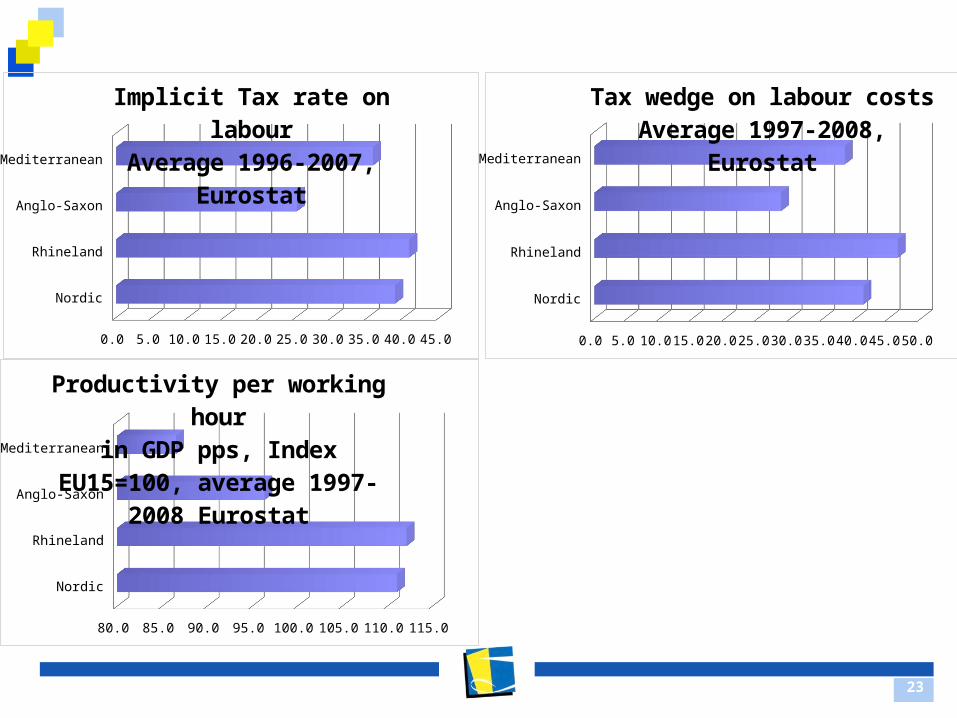
Implicit Tax rate on labourAverage 1996-2007, Eurostat
Nordic
Rhineland
Anglo-Saxon
Mediterranean
0.0 5.0 10.0 15.0 20.0 25.0 30.0 35.0 40.0 45.0 50.0
Tax wedge on labour costsAverage 1997-2008, Eurostat
Nordic
Rhineland
Anglo-Saxon
Mediterranean
80.0 85.0 90.0 95.0 100.0 105.0 110.0 115.0
Productivity per working hourin GDP pps, Index EU15=100, average 1997-2008 Eurostat
24
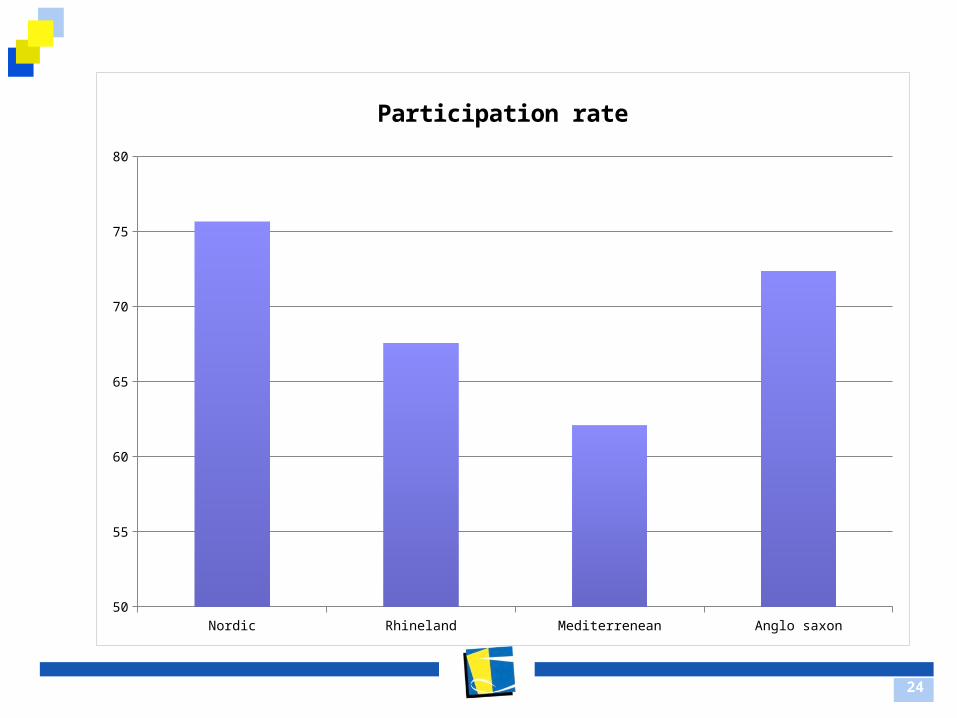
Nordic Rhineland Mediterrenean Anglo saxon50
55
60
65
70
75
80
Participation rate
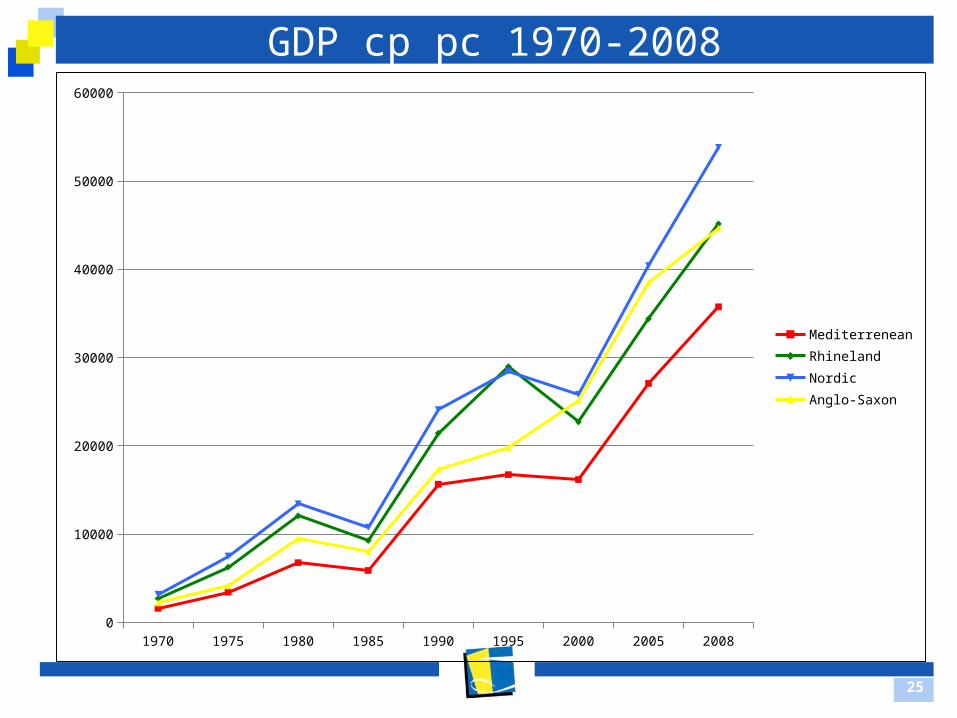
GDP cp pc 1970-2008
25
1970 1975 1980 1985 1990 1995 2000 2005 20080
10000
20000
30000
40000
50000
60000
Mediterrenean
Rhineland
Nordic
Anglo-Saxon
WHERE DOES TURKEY STAND?
26
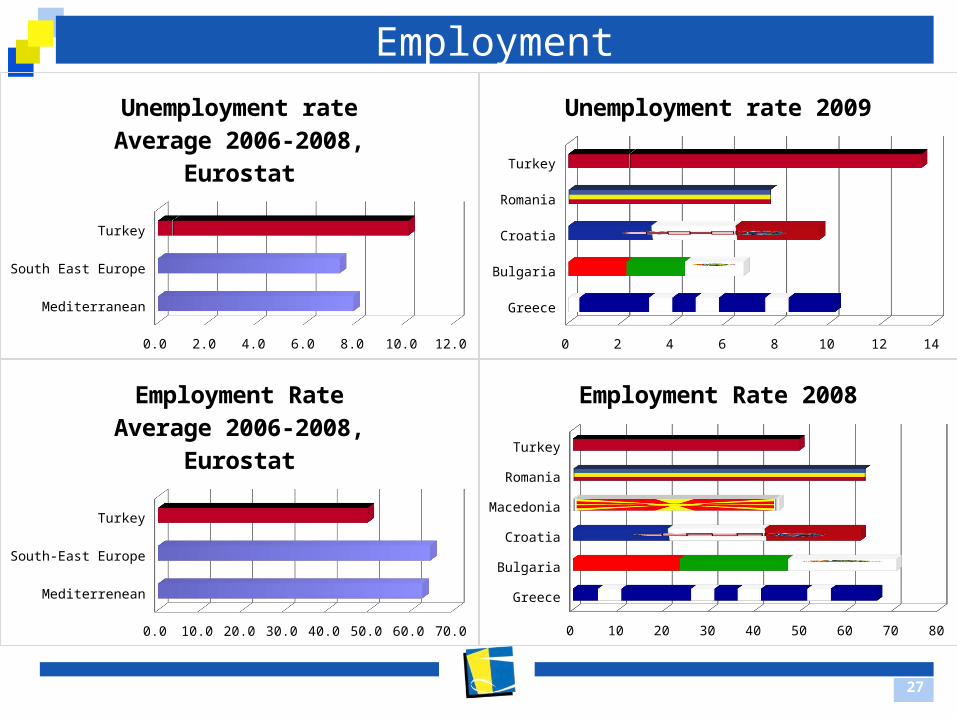
Employment
27
Mediterranean
South East Europe
Turkey
0.0 2.0 4.0 6.0 8.0 10.0 12.0
Unemployment rateAverage 2006-2008, Eurostat
Greece
Bulgaria
Croatia
Romania
Turkey
0 2 4 6 8 10 12 14
Unemployment rate 2009
Mediterrenean
South-East Europe
Turkey
0.0 10.0 20.0 30.0 40.0 50.0 60.0 70.0
Employment RateAverage 2006-2008, Eurostat
Greece
Bulgaria
Croatia
Macedonia
Romania
Turkey
0 10 20 30 40 50 60 70 80
Employment Rate 2008
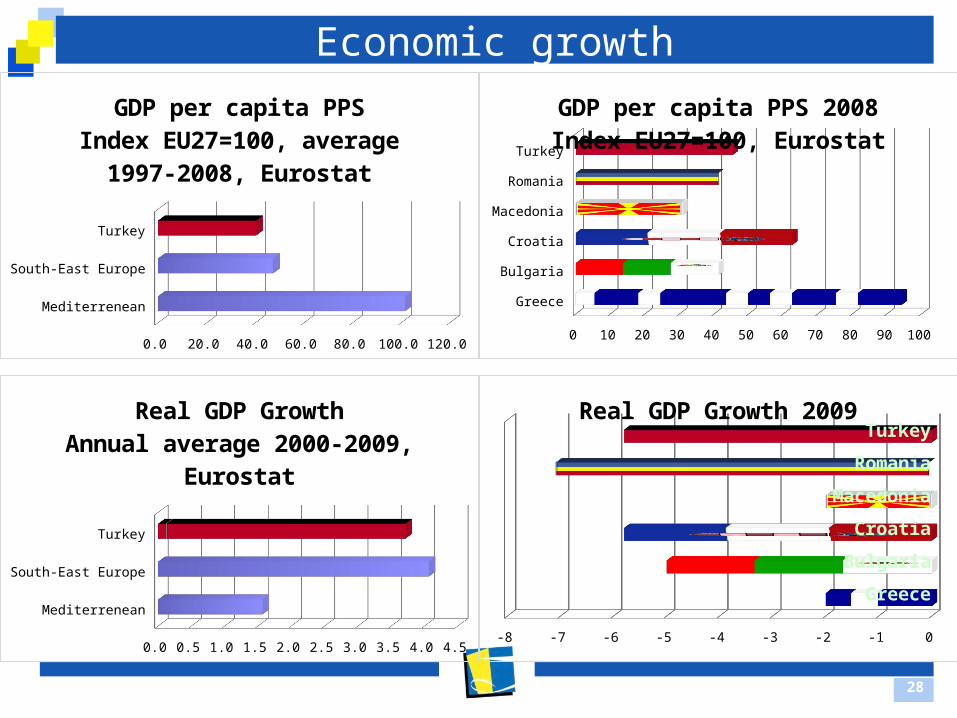
Economic growth
28
Mediterrenean
South-East Europe
Turkey
0.0 20.0 40.0 60.0 80.0 100.0 120.0
GDP per capita PPSIndex EU27=100, average 1997-
2008, Eurostat
Greece
Bulgaria
Croatia
Macedonia
Romania
Turkey
0 10 20 30 40 50 60 70 80 90 100
GDP per capita PPS 2008Index EU27=100, Eurostat
Mediterrenean
South-East Europe
Turkey
0.0 0.5 1.0 1.5 2.0 2.5 3.0 3.5 4.0 4.5
Real GDP GrowthAnnual average 2000-2009,
Eurostat
Greece
Bulgaria
Croatia
Macedonia
Romania
Turkey
-8 -7 -6 -5 -4 -3 -2 -1 0
Real GDP Growth 2009
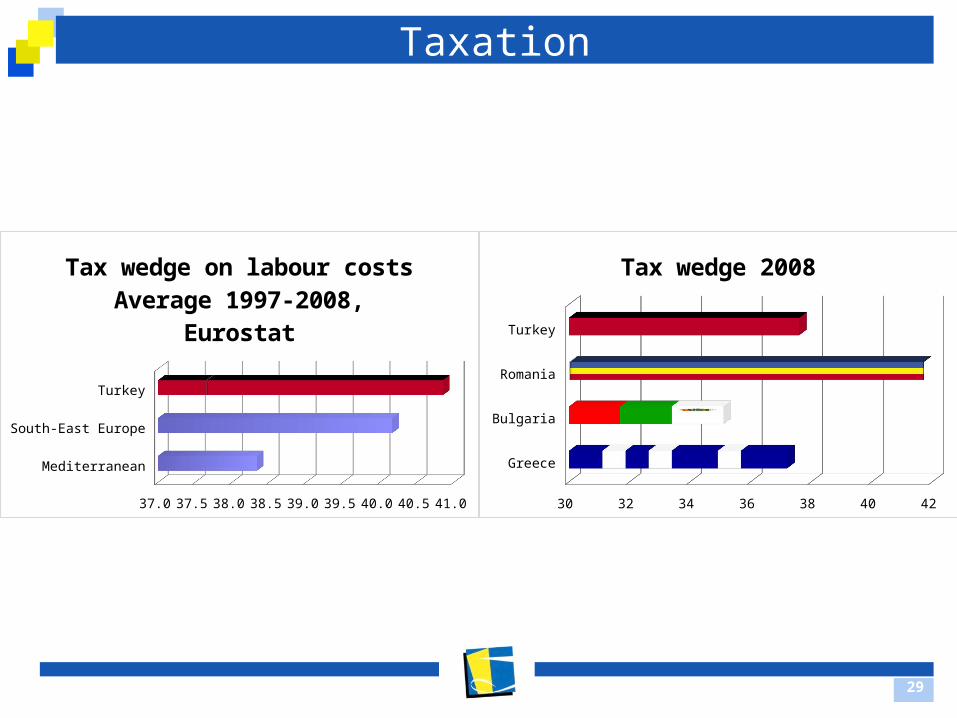
Taxation
29
Mediterranean
South-East Europe
Turkey
37.0 37.5 38.0 38.5 39.0 39.5 40.0 40.5 41.0
Tax wedge on labour costsAverage 1997-2008, Eurostat
Greece
Bulgaria
Romania
Turkey
30 32 34 36 38 40 42
Tax wedge 2008

Exercise 1 Which model is closest to Turkey and why? (please
do not let the performances be leading, motivate your answer relating to culture and social & economic structure)
Is that the best model for Turkey’s development? Are there areas in socio-economic development
where you see a need for change? If so: how? Where and how will this possibly effect social
security? 40 minutes discussion, 10 minutes prepare report 10 minutes presentation.15 minutes plenary
30
Productive, well educated work force Strong state, balanced with strong
labour actors High public spending (social protection
and education) Unregulated labour markets, though
with big public sector Flexicurity Universal welfare. Low wage inequality High grade of institutionalization Strong trade unions / social
partnership Public private partnerships in social
security
31
Stake holder economy (owners, government, employers, employees, costumers)
Market economy based, striving for balance between free market forces and social responsibility
Unemployment benefits and easy access to government payments.
Public-funded pensions, early retirement wages.
High taxation Social partnership, active social dialogue,
government interventions Strong trade unions that variably strive for
high labour protection and/or high wages.
Share holder economy (stocks) Competition based Social assistance policies designed to
serve as a safety net. Unregulated labour markets. Weak social partnership Limited government interventions Class oriented societies High income inequality, possibly
without a minimum wage. Low ratios of public debt to gross
domestic product.
Strong labour protection; highly regulated labour market
Costly state pension systems; early retirement age
Low level of social partnership Strong family-oriented income
transfers – low social security Low participation rate (women) High public debt – GDP ratio
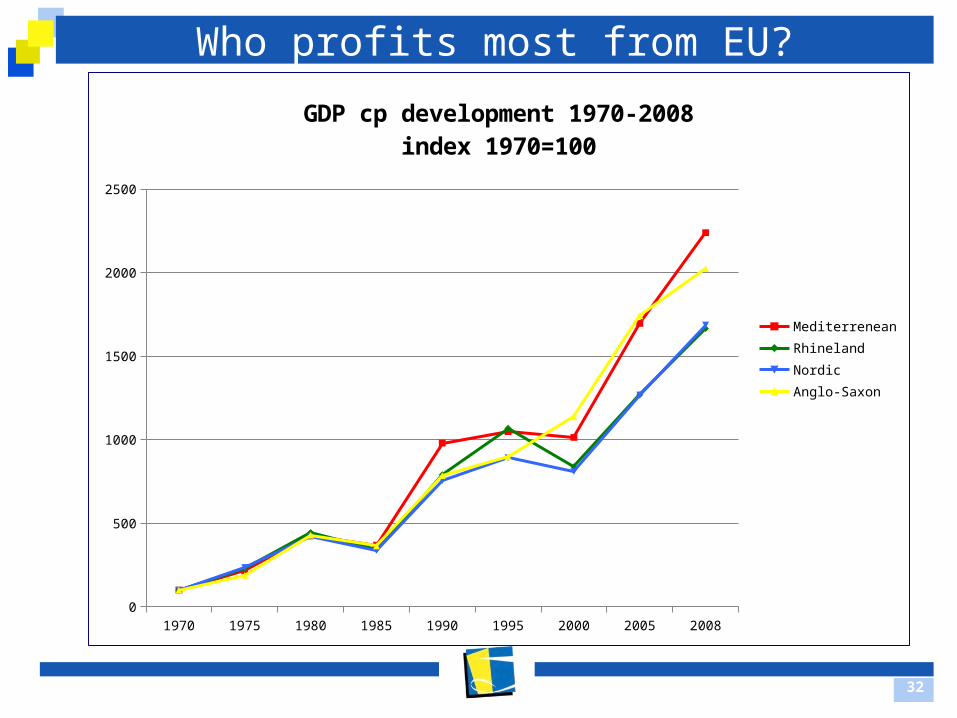
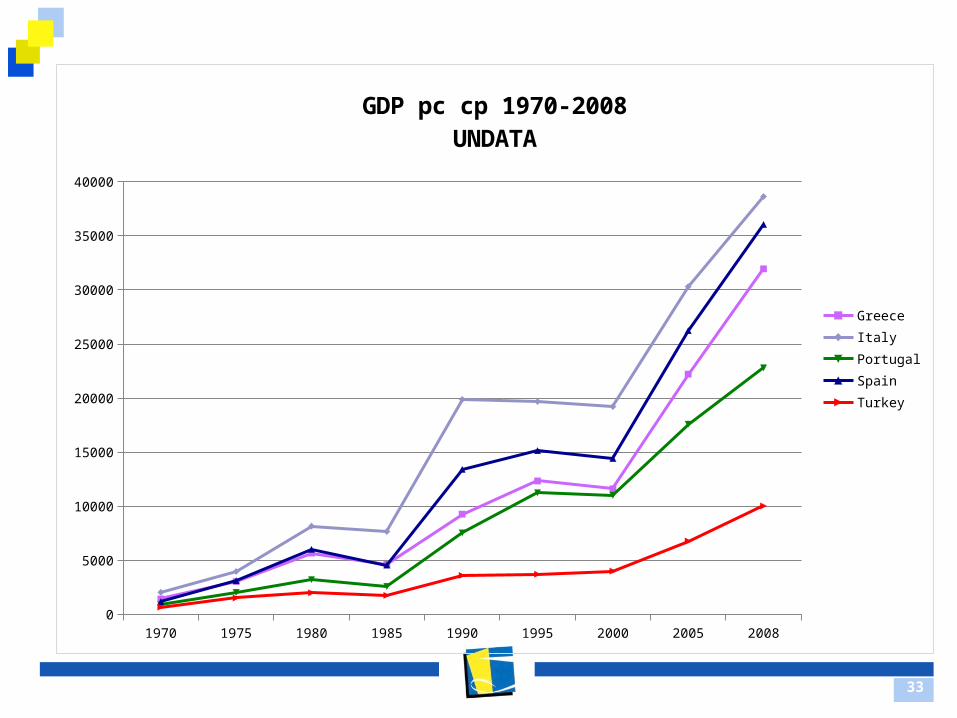
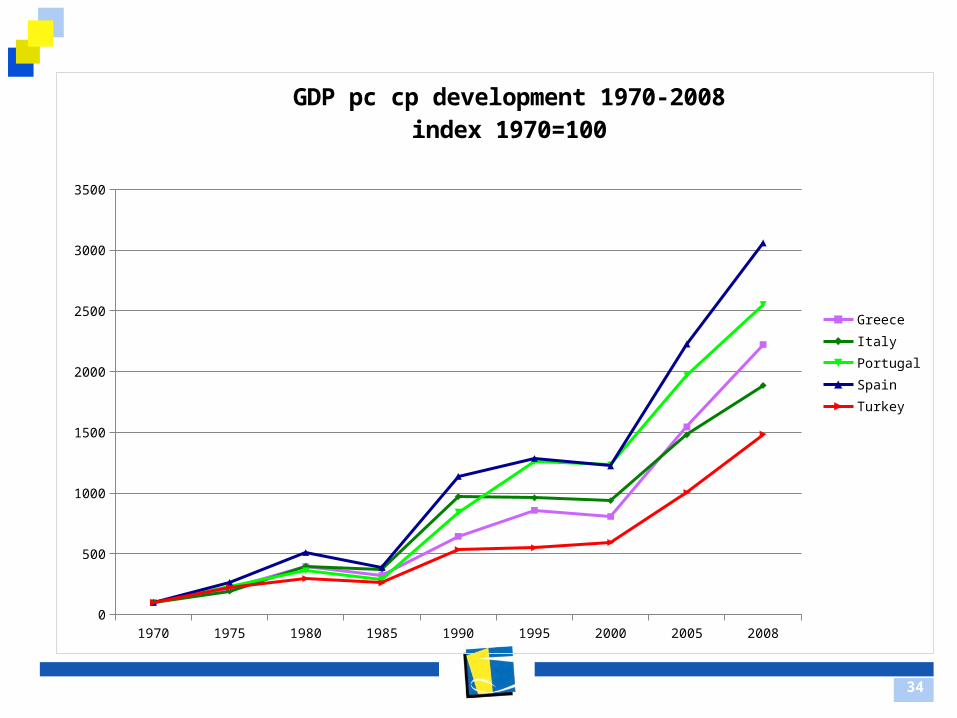
Who profits most from EU?
32
1970 1975 1980 1985 1990 1995 2000 2005 20080
500
1000
1500
2000
2500
GDP cp development 1970-2008index 1970=100
Mediterrenean
Rhineland
Nordic
Anglo-Saxon
33
1970 1975 1980 1985 1990 1995 2000 2005 20080
5000
10000
15000
20000
25000
30000
35000
40000
GDP pc cp 1970-2008UNDATA
Greece
Italy
Portugal
Spain
Turkey
34
1970 1975 1980 1985 1990 1995 2000 2005 20080
500
1000
1500
2000
2500
3000
3500
GDP pc cp development 1970-2008index 1970=100
Greece
Italy
Portugal
Spain
Turkey