Embed Size (px)
Citation preview
ISSN: 1439-2305
Number 81 – May 2009
History without Evidence:
Latin American Inequality since 1491
Jeffrey G. Williamson

Der Beitrag basiert auf einem Vortrag, welcher an der Wirtschaftswissenschaftlichen Fakultät der Georg-August-Universität Göttingen im Mai 2009 gehalten wurde.
History without Evidence: Latin American Inequality since 1491
Jeffrey G. Williamson Harvard University and University of Wisconsin
April 2009 draft Paper to be presented to an inequality session at the Utrecht World Economic History meetings, August 3, 2009. I acknowledge with gratitude: help with the analysis from Hilary Williamson Hoynes; comments on the paper and previous discussions on the topic with Bob Allen, Lety Arroyo Abad, Carlos Bazdresch, Luis Bértola, Amilcar Challu, John Coatsworth, Rafa Dobado, Regina Grafe, Alejandra Irigoin, Peter Lindert, Branko Milanovic, Jaime Salgado, Dick Salvucci, Blanca Sánchez-Alonso, Sam Williamson and participants at seminars at CIDE (October 2007), Canterbury (March 2009), ANU RSSS-Economics (April 2008), Warwick (May 2008), Paris GlobalEuronet Summer School (July 2008), Barcelona (October 2008), IISH (October 2008), the Wisconsin AE Development Workshop (October 2008), and the Michigan Development/History Workshop (December 2008); and comments on this draft by John Coatsworth, Branko Milanovic and especially Leandro Prados de la Escosura.
2
Abstract Most analysts of the modern Latin American economy hold to a pessimistic belief in historical persistence -- they believe that Latin America has always had very high levels of inequality, suggesting it will be hard for modern social policy to create a more egalitarian society. This paper argues that this conclusion is not supported by what little evidence we have. The persistence view is based on an historical literature which has made little or no effort to be comparative. Modern analysts see a more unequal Latin America compared with Asia and the rich post-industrial nations and then assume that this must always have been true. Indeed, some have argued that high inequality appeared very early in the post-conquest Americas, and that this fact supported rent-seeking and anti-growth institutions which help explain the disappointing growth performance we observe there even today. This paper argues to the contrary. Compared with the rest of the world, inequality was not high in pre-conquest 1491, nor was it high in the post-conquest decades following 1492. Indeed, it was not even high in the mid-19th century just prior Latin America’s belle époque. It only became high thereafter. Historical persistence in Latin American inequality is a myth. Jeffrey G. Williamson Harvard University, University of Wisconsin and NBER 350 South Hamilton St. Madison WI 53703 USA [email protected] Keywords: Inequality, development, Latin America JEL No. N16, N36, O15, D3
3
1. Latin American Inequality over Five Centuries
Most analysts of the modern Latin American economy carry a pessimistic belief in
historical persistence: that is, they believe that Latin America has always had very high levels of
income and wealth inequality, suggesting it will be hard, or even impossible, for modern social
policy to create a more egalitarian society. This paper argues that this conclusion is not supported
by what little evidence we have. The persistence view is based on an historical literature which
has made little or no effort to be comparative. Modern analysts see a more unequal Latin America
compared with Asia and the rich post-industrial nations and then assume that this must always
have been true. Indeed, some have argued that high inequality appeared very early in the post-
conquest Americas, and that this fact supported rent-seeking and anti-growth institutions which
help explain the disappointing growth performance we observe there even today. This paper
argues to the contrary. Compared with the rest of the world, inequality was not high in pre-
conquest 1491, nor was it high in the post-conquest decades following 1492. Indeed, it was not
even high in the mid-19th century just prior Latin America’s belle époque. It only became high
thereafter. Historical persistence in Latin American inequality is a myth.
Section 2 places Latin American pre-industrial inequality in context by comparing it with
inequality the world around over the two millennia from Rome in 14 AD to British India in 1947.
It turns out that there is little that is unusual about pre-industrial Latin America when that
comparison is made. Section 3 offers empirical explanations for pre-industrial inequality the
world around over the two millennia since Rome, including late 18th and 19th century Latin
America. Section 4 uses these explanations to fill in the many and big empirical blanks in Latin
American inequality history from 1491 through the end of the belle époque. That is, it uses an
estimated world pre-industrial relationship to predict Latin American inequality where no income
distribution evidence yet exists: hence, the “History without Evidence” title for the paper. It
concludes with four revisionist hypotheses. The hope is that these hypotheses will be used to
motivate the collection of new pre-industrial inequality evidence and thus perhaps to overthrow
once and for all the historical persistence view that pervades modern debate about Latin
American inequality.
4
2. Latin America in Context:
What Did Pre-Industrial Inequality Look Like the World Round?1
We have no evidence documenting inequality for the Inca, Aztec or other indigenous
civilizations in the Americas prior to the arrival of the Iberian conquerors. But we can guess.
Recently, Branko Milanovic, Peter Lindert and myself (2008) collected what we call an ‘ancient
inequality’ data base for 29 places, ranging over two millennia from the Roman Empire in the
year 14, Byzantium in the year 1000, England in 1290, Old Castille in 1752, France in 1788 and
British India in 1947. The sample includes four Latin America observations: Nueva España 1790,
Chile 1861, Brazil 1872, and Peru 1876. While each of these 29 observations reports a Gini
coefficient and other measures of inequality, only Tuscany 1427 offers a full size distribution of
income. Instead, the observations have been constructed mainly from what are called social
tables, sources which report average income and income recipients by social classes, but no
income variance within them.
Social tables are particularly useful in evaluating ancient societies where classes were
clearly delineated, where the differences in mean incomes between them were substantial, and
where mobility between them was trivial. If class alone determined one’s income, and if income
differences between classes were large while income differences within classes were small
(mainly reflecting life-cycle status and luck), then most inequality would be explained by average
income differences between classes. One of the most famous social tables was constructed by
Gregory King for England and Wales in 1688 (Barnett 1936; Lindert and Williamson 1982).
King’s class list was fairly detailed (31 in number), but he did not report inequalities within these
social groups, so we cannot identify within-class inequality for 1688 England. Yet, when income
variance within class is also available for any pre-industrial country offering social table
estimates, the differences between measured inequality are typically very small whether within
class variance is included or excluded. Indeed, when comparing any two pre-industrial societies
where full size distributions are available, inequality differences between them can be explained
almost entirely by inequality differences measured by class differences alone. In short, the lion’s
share of inequality in pre-industrial societies is and was accounted for by between-class average
income differences. 1 Sections 2 and 3 draw heavily on Milanovic et al. (2008).
5
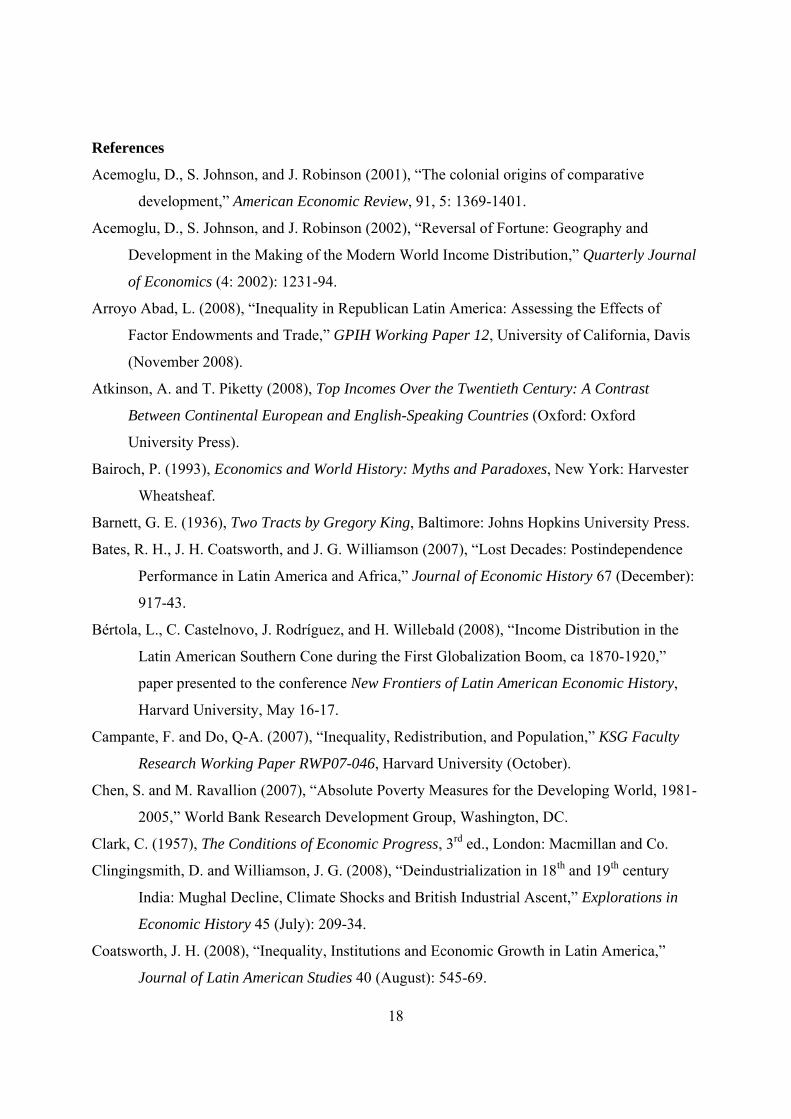
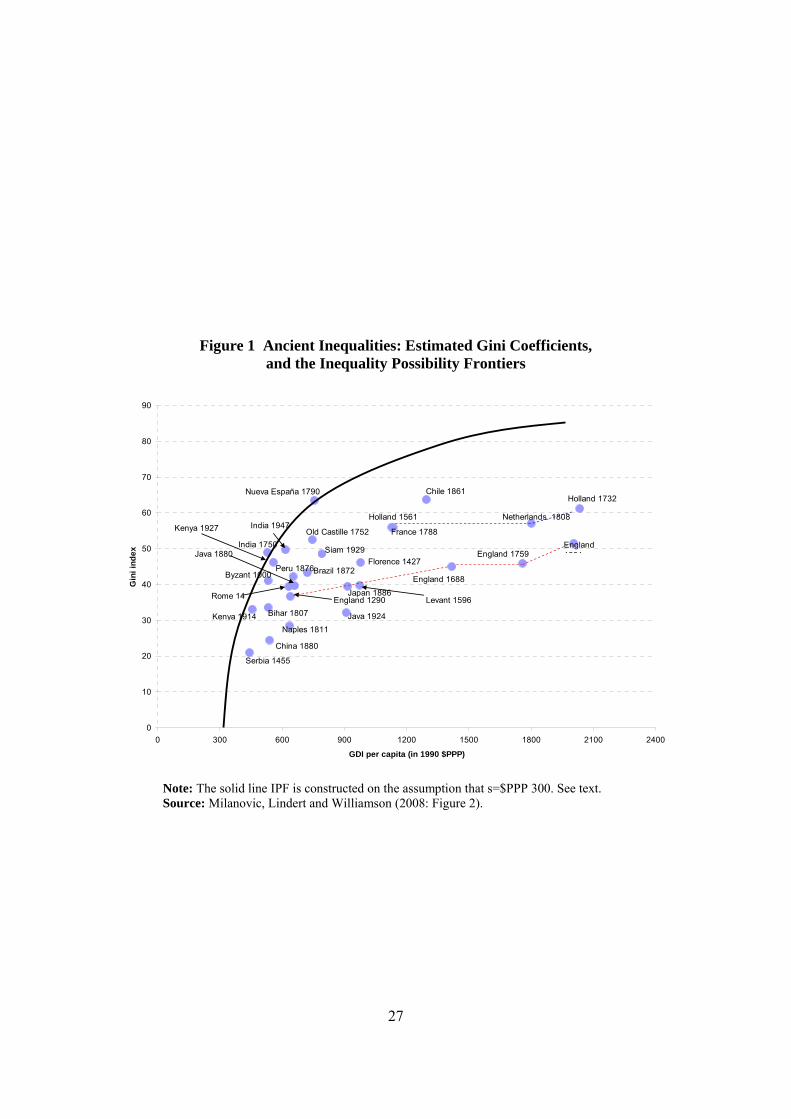
Table 1 and Figure 1 report what these data look like. The Gini estimates are plotted in
Figure 1 against income or GDP (or GDI) per capita. Figure 1 also displays what we call the
inequality possibility frontier (solid line), a curve based on the maximum inequality the elite
could have extracted at that income per capita. The maximum is constructed under the
assumption that everybody but the elite in such repressive societies would have gotten just the
World Bank’s subsistence minimum of $PPP 300.2 The ratio of the actual inequality to the
maximum feasible inequality (both expressed in Gini coefficients) is called the extraction ratio.3
In most cases, the calculated pre-industrial Ginis lie pretty close to the inequality possibility
frontier (IPF). The countries farthest below the IPF curve – with the lowest extraction ratios -- are
the most advanced pre-industrial economies in northwestern Europe: that is, 1561-1808 Holland,
1788 France, and 1688-1801 England.
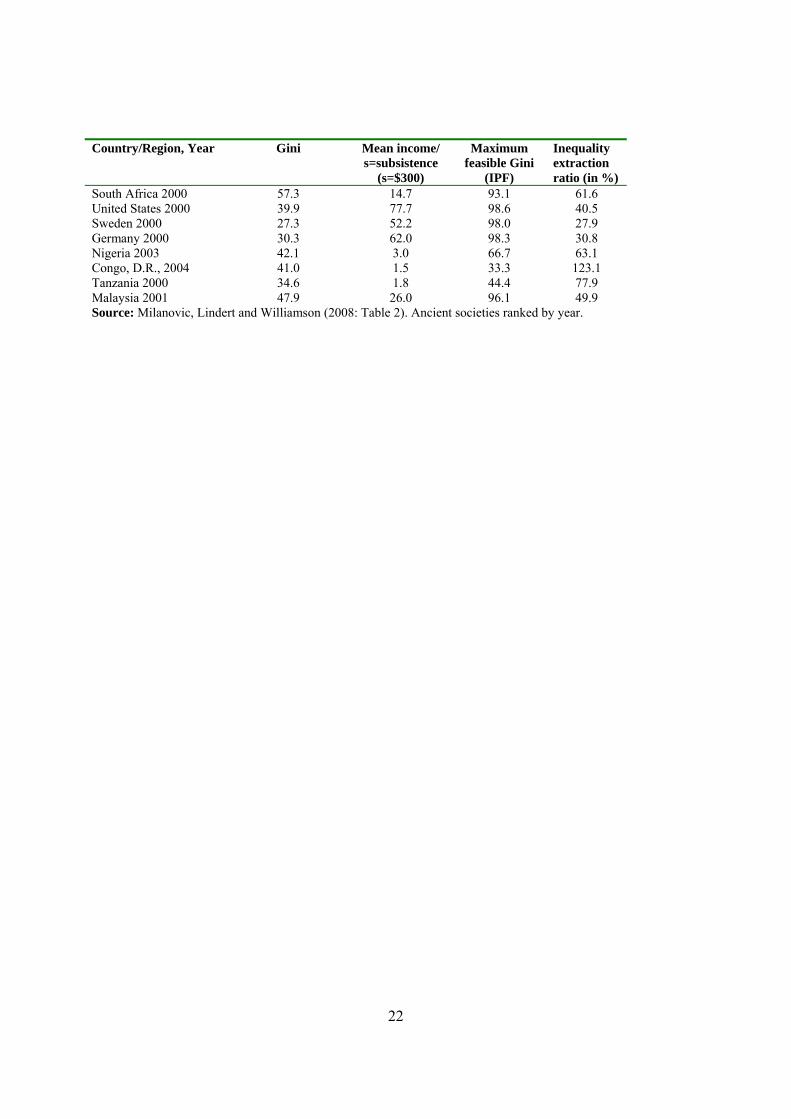
The inequality possibility frontier allows us to better situate these ancient pre-industrial
inequality estimates in a modern context. The bottom panel of Table 1 provides estimates of
inequality extraction ratios for 25 contemporary societies. Brazil has often been cited as an
example of an extremely unequal society, driven by a long history including slavery, racial
discrimination and regional dualism. Indeed, Brazil’s Gini in 2002 is comparable to the most
unequal pre-industrial societies in our ancient inequality sample. But Brazil is more than four
times richer than the average ancient society in our sample, so its maximum feasible inequality
(92.7) is much higher than our ancient society average (60.6). Thus, modern elites have extracted
only a little more than 63 percent of the maximum feasible inequality in Brazil, and its inequality
extraction ratio is about the same as what we find among the least exploitative and repressive
ancient societies like 1801-3 England and 1886 Japan. What is true of Brazil, is also true of
contemporary Chile, Mexico and Peru. All three have Ginis today well above the average (Chile
2 This is less than Maddison’s (1998: 12) assumed subsistence minimum of $PPP 400 which, in principle, covers more than physiological needs. Note that a purely physiological minimum “sufficient to sustain life with moderate activity and zero consumption of other goods” (Bairoch 1993: 106) was estimated by Bairoch to be $PPP 80 at 1960 prices, or $PPP 355 at 1990 prices. Our minimum is also consistent with the World Bank absolute poverty line which is 1.08 per day per capita in 1993 $PPP (Chen and Ravallion 2007: 6). This works out to be about $PPP 365 per annum in 1990 international prices. Since more than a billion people are believed to have incomes less than the World Bank global poverty line, it seems reasonable to assume that the physiological minimum income must be less. One may recall also that Colin Clark (1957: 18-23) distinguished between international units (the early PPP dollar) and oriental units, the lower dollar equivalents which he thought held for subtropical or tropical regions where calorie, housing and clothing needs are considerably less than those in temperate climates. Since our ancient pre-industrial sample includes a fair number of tropical countries, this gives us another reason to use a conservatively low estimate of the physiological minimum. 3 The extraction ratio is not unlike an index of the percent in poverty, but where the poverty line is fixed.
6
2003 = 54.6, Mexico 2000 = 53.8 and Peru 2002 = 52 versus the average = 40.6), but all three
have extraction ratios below the least exploitative in our ancient societies sample. Furthermore,
not all of these four have Ginis today above what they were 150-200 years ago. Inequality has
fallen over two centuries in two Latin American republics: Chile 2003 = 54.6 vs 1861 = 63.7, or
14 percent lower, and Mexico 2000 = 53.8 vs 1790 = 63.5, or 15 percent lower. Inequality has
been on the rise over two centuries in the other two Latin American republics: Brazil 2002 = 58.8
vs 1872 = 43.3, or 36 percent higher; and Peru 2002 = 52 vs 1876 = 42.2, or 23 percent higher.
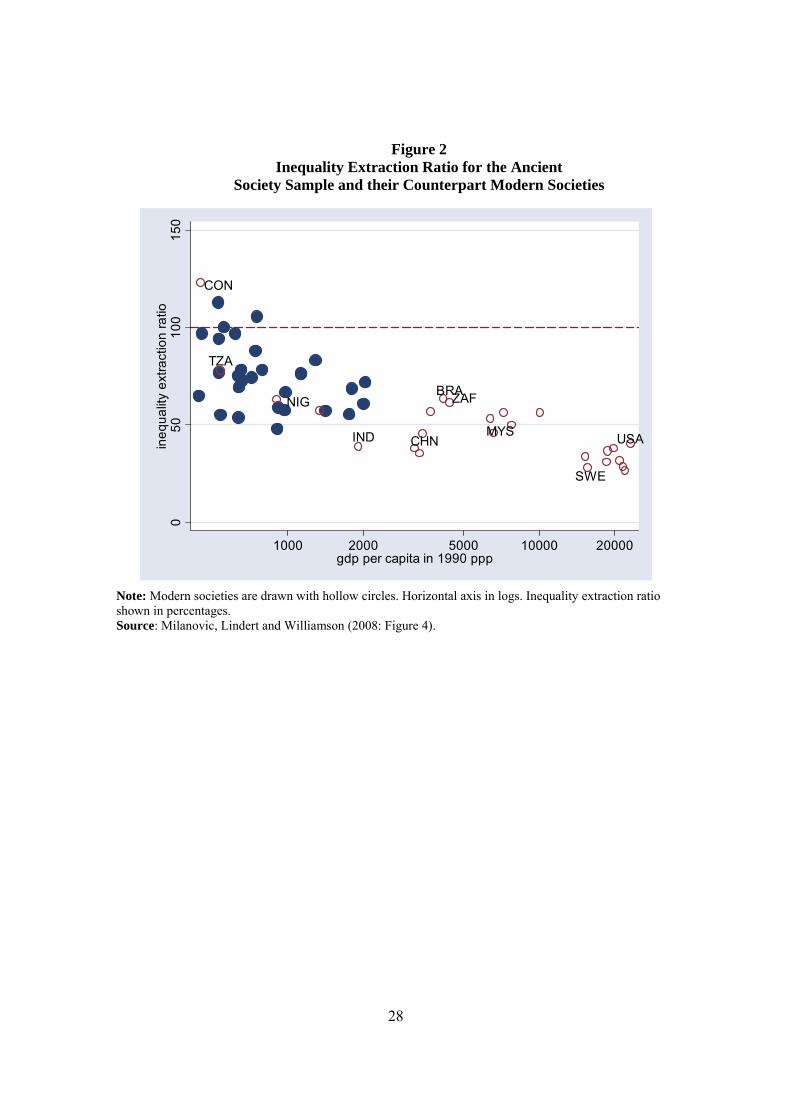
As a country becomes richer, and its surplus above subsistence rises, its feasible
inequality expands. Consequently, even if recorded inequality is stable, the extraction ratio must
fall. This can be seen in Figure 2 where the inequality extraction ratio is plotted against income
per capita for both ancient societies and their modern counterparts. Thus, the social consequences
of increased inequality may not entail as much relative impoverishment, or as much perceived
injustice, as might appear if we looked only at the recorded Gini. This logic is particularly
compelling for low and middle-income countries where increases in income push the maximum
feasible inequality up sharply along the steepest part of the IPF curve. The farther a society rises
above the subsistence minimum, the less will economic development lift its inequality
possibilities, and thus the extraction ratio will be driven more and more by the rise in the actual
Gini itself. Thus, the inequality extraction ratio has fallen everywhere in Latin America over the
past century or two, and in some cases by a lot: it has fallen by 15 percent in Brazil (from 74.2 in
1872 to 63.4 in 2002), by 32 percent in Chile (from 83 in 1861 to 56.4 in 2003), by 47 percent in
Mexico (from 105.5 in 1790 to 56.2 in 2000), and by 27 percent in Peru (from 78.1 in 1876 to
56.7 in 2002).
3. Fundamentals: Explaining Pre-Industrial Inequality the World Round
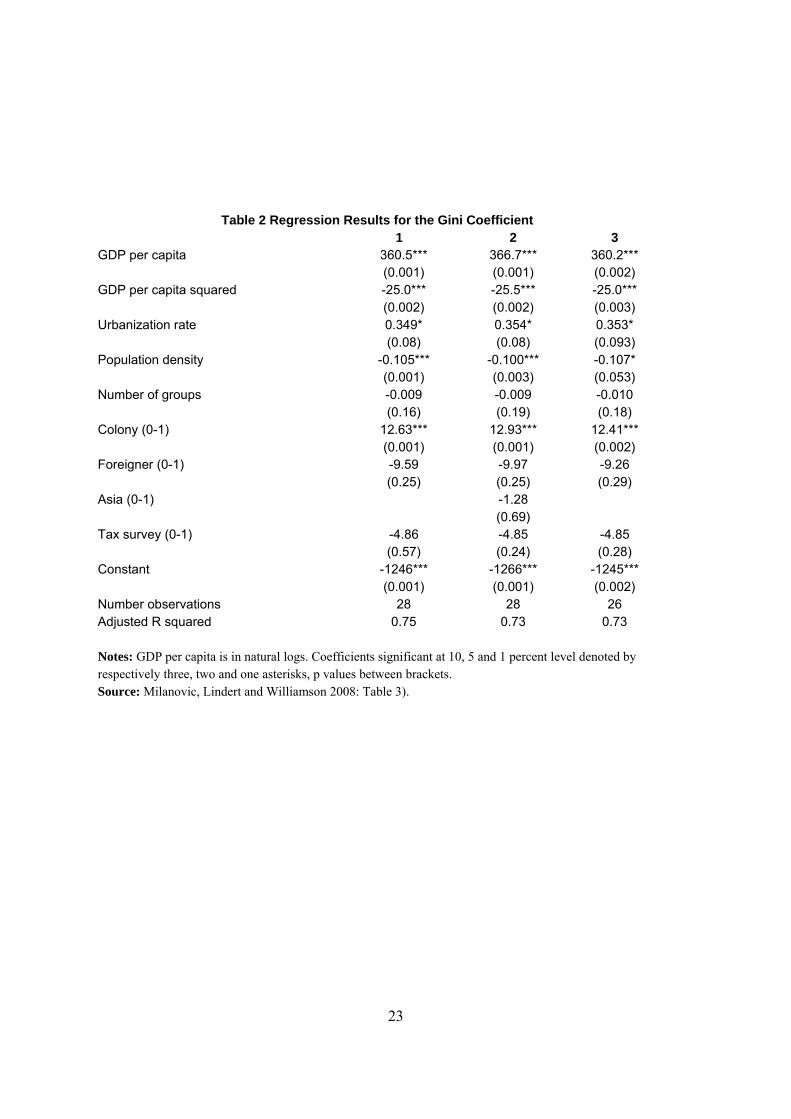
Using this information from ancient pre-industrial societies, can we explain differences in
observed inequality? The Kuznets hypothesis posits that inequality tends to follow a bell-shape as
average real income increases. Although Kuznets formulated his hypothesis explicitly with a
view toward industrializing and industrialized economies, one might wonder whether his Curve
can be found among our pre-industrial economies as well. In addition to log average income and
its square, Table 2 includes the urbanization rate, population density and colonial status (a
dummy variable). The regression also includes a number of controls for country-specific
7
eccentricities in the data: the number of social groups available for calculating the Gini, whether
the social table is based on tax data, and whether the social table for a colony includes the income
of resident colonists. The Kuznets hypothesis predicts a positive coefficient on average income
(or its log) and negative coefficient on its square. We also expect higher inequality for the more
urbanized countries (reflecting a common finding that inequality in urban areas tends to be higher
than in rural areas: Ravallion et al. 2007), and for those that are ruled by foreign elites since
powerful colonizers are presumed to be able to achieve higher extraction rates than weaker local
elites, and since countries with weak local elites but with large surpluses will attract powerful
colonizers to extract it (Acemoglu, Johnson and Robinson 2001, 2002).
The empirical results confirm all expectations. Both income terms are of the right sign
and significant, supporting a pre-industrial Kuznets Curve.4 The sign on the urbanization rate is,
as predicted, positive, but since it competes with population density, its statistical significance is
somewhat lower. Still, each percentage point increase in the urbanization rate (say, from 10
percent to 11 percent) is associated with an increase in the Gini by 0.35 points. Colonies were
clearly much more unequal: holding everything else constant, colonies had a Gini almost 13
points higher than non-colonies. Foreigner is a dummy variable that controls for two
observations (South Serbia 1455 and Levant 1596) that were colonies but where their ancient
inequality surveys did not report the incomes and numbers of colonizers at the top. This is
therefore simply another control for data eccentricity, and its negative sign shows that being a
colony, but not having colonizers included in the survey, reduces recorded inequality
considerably (9 to 10 points).
The number of social groups used in the inequality calculations, or tax census origin of
social tables, do not affect the Gini in any significant way. This finding is comforting, especially
regarding Nueva España’s three classes, because it shows that our estimates of inequality are
being driven by fundamentals, not by the way the social tables were constructed.
Population density is negatively associated with inequality, although its significance
weakens when the two Java observations – the most dense part of the pre-industrial world – are
removed. It might have been expected that the introduction of a dummy variable for more
densely populated Asia would have caused the effect of density to dissipate. This is not the case,
as shown in column 2 of Table 2. The negative impact of population density on inequality seems
to be counter-intuitive. After all, conventional theory – which we will exploit below -- would 4 Note that GDP per capita is in natural logs.
8
predict that more population pressure on the land should raise land yields and rents, lower labor’s
marginal product and the wage, thus producing more inequality, not less. It seems likely that this
conventional effect is being offset in the ancient economy data by two forces. First, densely
populated agrarian societies also had lower per capita income, so this may have been working
against the conventional force (since inequality rises with per capita income). Second, more
densely populated agrarian societies must have had higher relative food prices than thinly settled
societies, so that nominal subsistence had to be much higher to purchase the more expensive
foodstuffs, lowering measured inequality and the extraction ratio.5 It seems likely that this force
must have been most powerful during the two millennia before the middle of the 19th century
since a world market for grains did not yet exist and thus local conditions dictated the relative
price of food (Latham and Neal 1983; Clingingsmith and Williamson 2008; Studer 2008). This
second offset has important implications for comparing inequality in the labor-scarce and land-
abundant Americas with the labor-abundant and land-scarce Europe, and between the densely
populated highlands in Mexico and the Andes relative to land abundant Brazil and the Pampas
within the Americas. However, it less clear that it had the same effect within countries over time,
since the results in Table 2 rely almost entirely on a cross section, not a time series. Finally, to the
extent that population size and density are correlated, there is a third possible offset. Looking at
modern data, Filipe Campante and Quoc-Anh Do (2007) explain the negative correlation by the
size of the potential revolutionary underclass concentrated around the capital thus posing a threat
to the elite.
The stylized picture that emerges is this: Inequality follows contours that are consistent
with the Kuznets Curve hypothesis, a pre-industrial secular rise to a peak, followed by a fall
during modern economic growth. It follows that most of the pre-industrial Third World had
probably reached very high levels of inequality by the early 19th century before what is called the
first global trade boom. However, the extraction ratio tends to fall as income increases, even
during pre-industrial times. This fact would, of course, invite a European colonist to plunder
5 Rarely do even modern inequality studies assess the impact of different class-specific cost-of-living trends on real inequality trends. We know this mattered hugely in early modern Europe (Hoffman et al. 2002), and we need to know whether it has also mattered at any time in Latin America since 1491. When Latin America underwent her commodity export boom during the belle époque, did the rise in food export prices in the Southern Cone serve to raise real inequality even more than measured nominal inequality? Did it have the opposite effect in Mexico, which imported cheap corn from the United States? And what about 20th century Latin American food exporters when their terms of trade collapsed 1915-1940?
9
where the potential surplus was big, but where the local elite had relaxed their extraction rate. We
will return to this issue below.
What about the historical persistence of inequality? For example, has Asia always been
less unequal? The answer is no: it does not appear that ancient Asia was significantly less
unequal when we control for other factors. Indeed, population density is sufficient to identify
why ancient Asia had lower levels of inequality than the rest of the pre-industrial world.
What about Latin America? Has it always been more unequal, as implied by the recent
work of Stanley Engerman and Kenneth Sokoloff (1997; Engerman, Haber and Sokoloff 2000)?
Engerman and Sokoloff offered a hypothesis to account for Latin American growth
underachievement during the two centuries following its independence. Their thesis begins with
the plausible assertion that high levels of income inequality, and thus of political power, favor
rich landlords and rent-seekers, and thus the development of institutions which are compatible
with rent-seeking but incompatible with economic growth. Their thesis argues further that high
levels of Latin American inequality have their roots in the natural resource endowments present
when Iberia conquered and colonized the region five centuries ago. Exploitation of the native
population and of imported African slaves, as well as their subsequent disenfranchisement,
reinforced the development of institutions incompatible with growth. Engerman and Sokoloff had
no difficulty collecting evidence which confirmed high inequality, disenfranchisement and lack
of suffrage in Latin America compared with the United States. But what about comparisons with
the rest of the world, and what about earlier?6 Oddly enough, neither the Engerman-Sokoloff
team or its critics have confronted the thesis with inequality evidence for the economic leaders in
northwest Europe at comparable pre-industrial stages; this is the comparison that matters, not that
with industrial United States.
Table 3 presents inequality information for pre-industrial western Europe (that is, prior to
1810) and for pre-industrial Latin America (that is, prior to 1880). For the former, we have
observations from 1788 France, 1561 and 1732 Holland, and 1688, 1759 and 1801 England-
Wales. For the latter, we have Nueva España 1790, Chile 1861, Brazil 1872 and Peru 1876.
6 John Coatsworth argues that the Engerman-Sokoloff thesis has not held up well to scrutiny: “what little quantitative evidence there is does not suggest that ownership of land, or other assets for that matter, was more concentrated in Latin America than in the United States” (Coatsworth 2008: 553). However, Coatsworth’s survey of the land and wealth distribution estimates for Latin America (Coatsworth 2008: Table 2, 553) reveals that the first Latin America observations are for the province of Buenos Aires in 1820 and 1838, and for Rio de Janeiro in 1830. He is not able to report any colonial observations. See also Johnson and Frank (2006) and Gelman and Santilli (2006).
10
Engerman and Sokoloff coined their hypothesis in terms of actual inequality. According to that
criterion, their thesis must be soundly rejected. That is, the (population weighted) average Latin
American Gini (48.9) was lower than that of western Europe (52.9), not higher. It is not true that
pre-industrial Latin America was unambiguously more unequal than pre-industrial northwest
Europe. Thus, if inequality encouraged rent-seeking and discouraged growth in Latin America, it
did it even more so in northwest Europe where the industrial revolution first started! Since we
know that high inequality was consistent with industrial revolutions occurring in western Europe,
it is unclear why it should be inconsistent with it in Latin America somewhat later. However,
Latin America was poorer than northwest Europe, and poorer societies have a smaller surplus for
the elite to extract. Thus, maximum feasible inequality was considerably lower and extraction
rates were considerably higher in Latin America than in northwest Europe (Table 3). While
measured inequality does not support the Engerman-Sokoloff thesis, the extraction rate does.7
The Engerman-Sokoloff team, their followers, and their critics all need to decide which of these
inequality indicators matters for their hypothesis and why.
4. Broad Sweep: Reconstructing Latin American Inequality Trends since 1491
Initial Conditions: What Was Latin American Inequality Like in 1491?
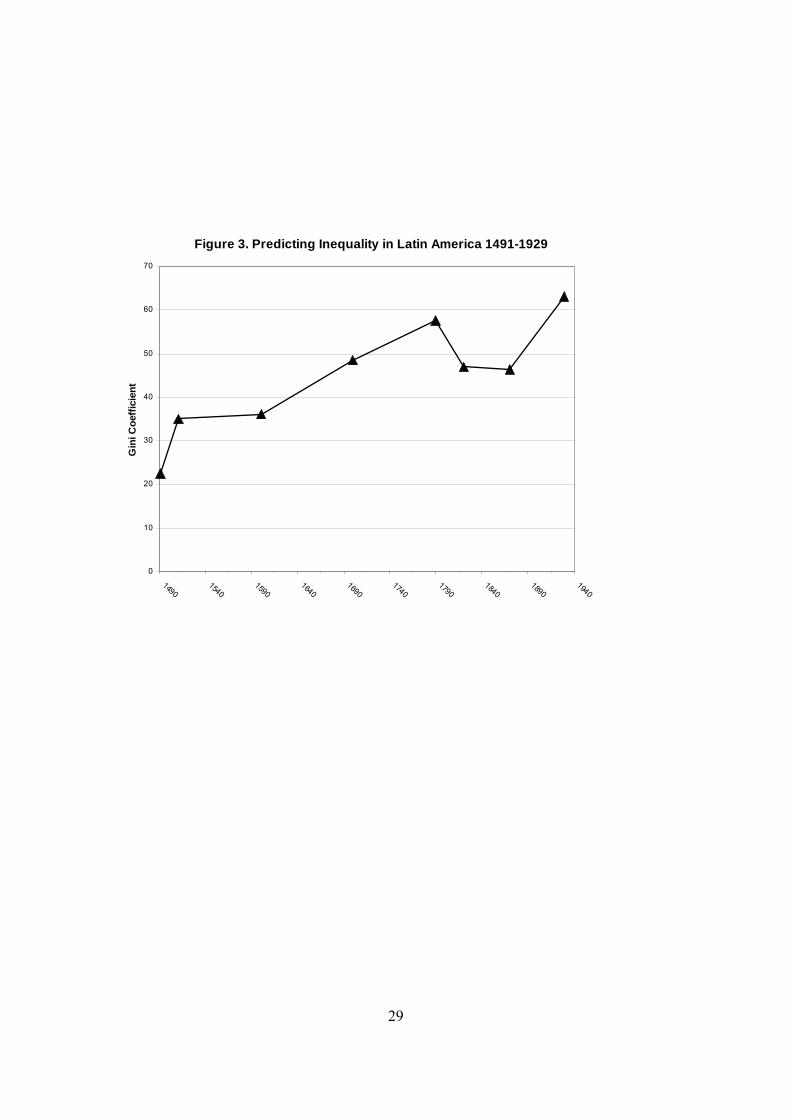
Table 4 and Figure 3 use the Gini regression equation (1) in Table 2 and estimates of the
dependent variables also reported in Table 4 to predict Ginis for Latin America in 1491 before
the arrival of the Iberians, shortly after the conquest (call it 1492), 1600, 1700, 1790, 1820 and
1870. Table 4 also predicts Ginis for Mexico in 1820 and 1870. In addition, the table reports
predictions for the few Latin American cases where we also have actual inequality estimates: i.e.
Mexico 1790, Brazil 1872, Chile 1861 and Peru 1876. While the correlation between actual and
predicted inequality for those four cases is hardly perfect, it is positive and strongly significant
(R2=0.75), a comforting result.
Table 4 implies that the Gini coefficient in Latin America prior to the arrival of the
Iberians was 22.5, which would have made it the society with the lowest inequality in the pre-
industrial world (or at least in our sample of it: Table 1). China in 1880 had a Gini of 24.5, very
close to pre-conquest Latin America. Dutch colonial Java had a Gini in 1880 of 39.7, a figure 7 In this sense, Coatsworth may have been too quick to conclude, based on measured inequality, that “if colonial institutions constrained economic development, they did not do so until after the colonial era” (Coatsworth 2008: 11).
11
which would have been 27.1 without the Dutch colonists (39.7-12.6). Thus, Table 4 implies that
pre-conquest Latin America had modest levels of inequality much like all the other poor pre-
industrial societies in our sample which had escaped being colonized.
Extracting the Surplus: What Was the Colonial Impact Like after 1492?
Given what we know about ancient pre-industrial economies the world around, and
assuming that Iberian colonists were no better or worse at extracting surplus than were the other
colonizers in the ancient inequality sample (England, Holland, and the Ottoman Turks), the
answer to this question is quite simple. Colonies had higher Gini coefficients by 12-13
percentage points (Table 2), so the Latin American Gini coefficient might have drifted up from
22.5 in 1491 to something like 35 in the post-1492 decades. Perhaps it was in fact a bit lower or a
bit higher, but inequality clearly must have jumped up significantly during the first decades after
the Iberian conquest, an increase of about half. Not only did the Iberian elite replace the
indigenous elite, but, if they were anything like the English, the Dutch and the Turks, the Iberians
must have been able (or willing) to raise the extraction rate in their favor by a lot.
Inequality Decline? The Likely Impact of the 16th Century Demographic Disaster
As is well known, European disease caused immense demographic damage to the
indigenous population over the century following Columbus’s first voyage, due to soaring
mortality rates. Massimo Livi-Bacci thinks it shrank by more than 90 percent by the early 17th
century (Livi Bacci 2006). Other scholars, like Angus Maddison, think the shrinking was smaller,
and Table 4 uses Maddison to take the lower bound. The Atlantic slave trade tried to substitute
African slaves for decimated indigenous populations but their addition was far smaller than the
subtraction from the indigenous population caused by European disease. Furthermore, the
African slaves arrived in significant numbers only after a long lag. Moreover, not many were
transported to the once densely populated highlands where the population losses were greatest,
but rather to the sugar-rich tropics where the losses were smallest. The demographic collapse
destroyed indigenous political and institutional structures, facilitated religious and cultural
assimilation, and helped raise the per capita income of the indigenous survivors who resettled on
the best lands.8
8 This paragraph draws heavily on Bates, Coatsworth and Williamson (2007: 919-20). Note the demographic parallel with Alwyn Young’s argument that today’s HIV-AIDS raises the incomes of those Africans who survive the disease
12
It is useful to elaborate that last point: the demographic disaster in Latin America must
have contributed to higher (but unknown) GDP per capita and average labor productivity, higher
marginal productivity of labor, and lower marginal productivity of land, suggesting that the
wage-rental ratio (w/r) went up and that inequality went down. The economics can be made a
little more precise. Assume that only land (R) and labor (L) mattered in the early colonial
economy, and that technology (A) was unchanged across the 16th century. If we also assume
constant returns to scale, then it follows that
Y = ARαLβ, α + β = 1,
Y/L = A(R/L)α = y = GDP per capita.
The marginal product of labor and land are, respectively,
dY/dL = β(Y/L) = w, dY/dR = α (Y/R) = r
so that the wage-rental ratio is
w/r = (β/α)(R/L)
Thus, the wage-rental ratio rises with the land-labor ratio, and the elasticity relating the two is
(under these assumptions) always 1.
The elasticity of GDP per capita to the land-labor ratio is α. Table 4 reports that
population density fell by 51 percent between 1500 and 1600 (from 1.60 to 0.78 persons per
square kilometer), implying that the land-labor ratio rose about 103 percent (from 0.63 to 1.28
square kilometers per person). If α = 0.5, then GDP per capita might have increased by about 52
percent over the century. John Coatsworth (2008: 548) is in agreement: “As European disease
and abuse decimated indigenous populations … per capita output rose ... Additional gains in
productivity occurred when those who survived found work, resettled or were ‘congregated’ on
the most productive lands.” And what went up, then went down. As the indigenous population
slowly recovered between 1600 and 1700, the land-labor ratio fell about 29 percent, implying that
GDP per capita might have decreased by almost 15 percent, at least in the Latin American
interior. Based on Mexican evidence, Coatsworth (2008: 548) thinks the fall was even bigger:
“Mexican production stagnated for most of the seventeenth century, falling by half in per capita
terms as population recovered … The revival of the indigenous population … put an end to rising
productivity in agriculture.” Of course, things were different in the sugar-based plantation islands
(Young 2005), or Joel Mokyr’s argument that the Irish famine in the late 1840s raised per capita income of the survivors (Mokyr 1983).
13
of the Caribbean, but these crude estimates generated by land-labor ratio trends are used in Table
4 to interpolate GDP per capita between Maddison’s observations for 1500 and 1790.
According to the simple economics above, the percentage rise in the wage-rental ratio
across the 16th century would have been about the same as the percentage fall in the labor-land
ratio.9 If population fell by Livi-Bacci’s 90 percent estimate (from an index of 100 to 10), then
the land-labor ratio rose by a factor of ten (from 10 to 100),10 which implies that wage-rental ratio
rose by a factor of 10 as well. As we noted above, and based instead on Maddison’s population
estimates, Table 4 implies that the land-labor ratio rose by more than 100 percent. We have
assumed perfect competition in these calculations which, of course, is completely inconsistent
with our knowledge that Iberian colonists introduced coercive and repressive devices so that
labor’s greater scarcity was not fully rewarded. In more formal terms, the Iberians pushed the
wage below labor’s marginal product. Thus, the demographically-induced rise in the wage-rental
ratio must have been considerably less than 100 percent. But even if it was only 50 percent, it
implies pronounced downward pressure on inequality across the 16th century. Furthermore, it
seems likely that land concentration also diminished as labor got scarcer, so there are other
reasons to believe that exogenous demographic trends put strong downward pressure on
inequality across the 16th century. On the other hand, improved productivity in extracting
minerals from the mines as well as any general improvement in economy-wide productivity (e.g.
a rise in A) might have pushed inequality in the opposite direction, upwards. What was the net
effect? Table 4 predicts that after the initial effect of colonization, there was very little additional
change in Latin American inequality up to 1600.
Inequality Rise: What Did Latin American Inequality Look Like in 1790?
Over the two centuries between 1600 and 1790, a number of fundamentals were at work
in Latin America which would have served to raise inequality and extraction ratios. First and
foremost, populations partially recovered their 16th century losses. Interpolating 1790 from
9 The economics is very simple, and complexity would diminish the size of the demographic disaster effects estimated here, but not the direction. For example, if land supply was very elastic (as it probably was in the Americas) then the impact on the land-labor ratio would be diminished. To take another example, while the assumption of constant technology across the 16th century is analytically convenient, technological transfer from Europe and mining development must have increased A in the formal output and output per worker expression in the text. This point is expanded below. 10 The cultivatable land area of Latin America was 10.966 million km2 between 1500 and 1800. Livi-Bacci’s 50 million pre-conquest population implies a population density of 4.56. His 3-4 (say 3.5) million estimate for c1700 implies a density of 0.31, a spectacular fall of population density over the 16th century.
14
Maddison’s (2008) estimates for 1700 and 1820, yields a rise in population from 8.6 million in
1600 to 12.45 million in 1790. Thus, population density rose from about 0.78 to 1.14, and land-
labor ratios fell by about 31 percent. Second, GDP per capita rose from 438 to 650, or almost by
half, and urbanization rose from 9 to 14.2 percent, or by more than half. These forces imply that
the Gini might have risen from 36.2 to 57.6, which, according to the Table 4 predictions, implies
that inequality in 1790 was the highest it got in Latin America over the three centuries between
1491 and 1870.
Revolution, Independence and Lost Decades
While revolution, independence and the ‘lost decades’ that followed up to about 1870
(Bates, Coatsworth and Williamson 2007) were very complicated times, and while there must
have been many forces at work influencing inequality, the ancient inequality regression predicts
that the Gini probably dropped from 57.6 in 1790 to 46.4 in 1870. The biggest force contributing
to the fall was, of course, independence and de-colonization since the five ‘lost decades’ between
the 1820s and the 1870 yielded very little GDP per capita growth11 or urbanization. Mexico
repeats the Latin American (predicted) trends, its Gini falling from 57.7 to 44 between 1790 and
1870, and, once again, by far the biggest fall being between 1790 and 1820, from 57.7 to 47.8.
Recent archival work by Leticia Arroyo Abad (2008: Figure 1) confirms this prediction of falling
inequality after independence. She uses data on wage rates and land rents to infer trends in
inequality. When her rent-wage ratios for Argentina, Mexico, and Venezuela are weighted by
1850 populations, the resulting Latin American rent-wage ratio falls by 11 percent 1820-1850,
and for Mexico alone the fall is 12 percent.
Creating Modern Inequality during the Belle Époque Globalization Boom
“[As] export-led economic growth took off throughout Latin America in the late
nineteenth century, economic inequality increased … The returns to [land,] scarce capital
and skills rose precipitously. Peasant and public lands … passed into the hands of
landlords, politicians, land companies and plantations ... The conditions that Engerman-
Sokoloff and Acemoglu, Johnson, and Robinson saw as blocking economic growth were
in fact the conditions that made it possible” (Coatsworth 2008: 567-8).
11 Debate over Angus Maddison’s data is intense, but some adopt his more positive view of Latin American growth 1820-1870. See, for example, Leandro Prados de la Escosura (2009).
15
The economics underlying Coatsworth’s statement above is, of course, quite straight
forward. Latin America faced a rising terms of trade throughout the late 19th century (Williamson
2008). Since it was a primary product exporter, land and mineral rents were driven up relative to
wages. This happened everywhere around the poor periphery (Williamson 2002), but it was
especially dramatic in Latin America partly because the region was able to expand its export
sectors so effectively, thus to become very large shares in GDP (Williamson 2009: Table 4.1).
Since land and mineral resources were held by those at the top, inequality rose as well. Not too
long ago, the only data we had to judge the magnitude of these inequality trends were proxies,
like the rent-unskilled wage ratio or the GDP per capita-unskilled wage ratio (Williamson 1999,
2002). Thus, when the rent-wage ratios for Argentina, Mexico, Uruguay and Venezuela (Arroyo
Abad 2008: Figure 1) are weighted by 1890 populations, the Latin American average rises 7.9
percent per decade 1850-1870 and 6.3 percent per decade 1870-1900, for a total increase of 37
percent after 1850. This rent-wage proxy thus implies an inequality surge over the second half of
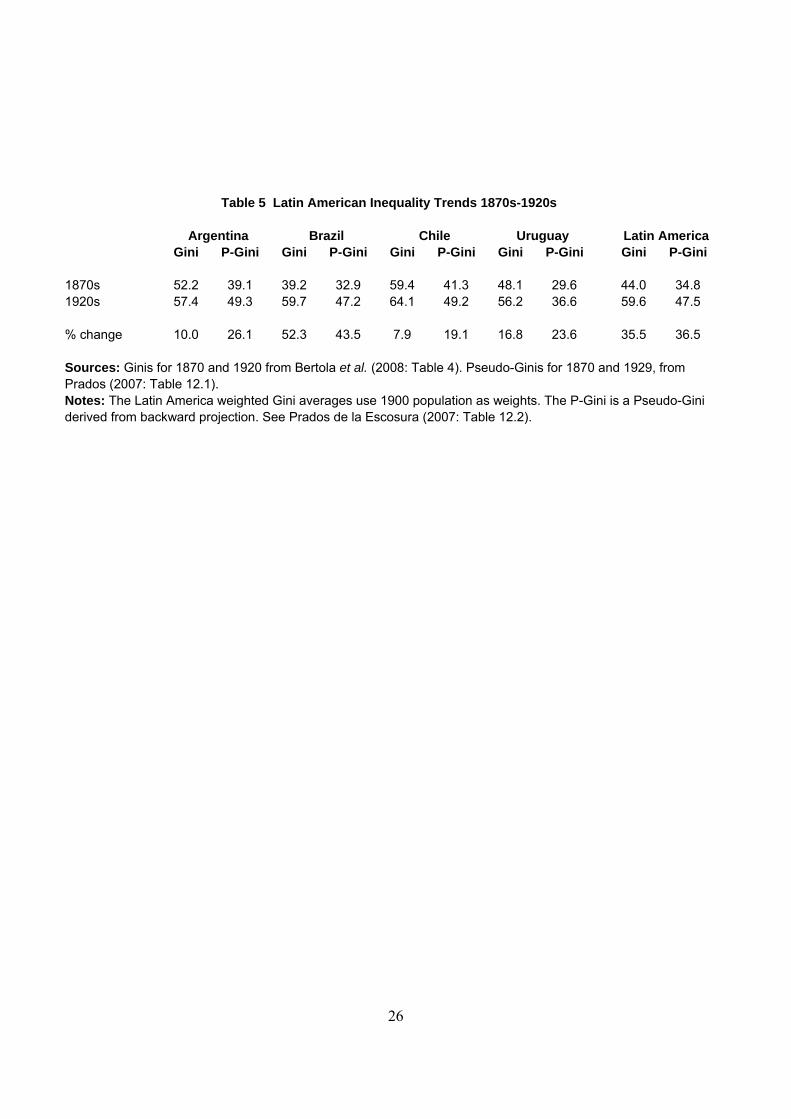
the century. We also have the more comprehensive belle époque inequality evidence summarized
in Table 5. It comes from two sources: the first, Ginis calculated from new evidence collected by
Luis Bértola and his collaborators (2008: Table 4), and second, what Leandro Prados de la
Escosura (2007: Table 12.1) calls his backward projected Pseudo-Ginis. They both tell the same
tale: Latin American inequality rose by 35-36 percent over the belle époque. True, and as the
table makes clear, the Latin American weighted average reported in Table 5 refers only to Brazil
and three in the southern cone. That is, the Latin American average misses the heavily populated
Mexican and Andean republics. However, Prados de la Escosura also shows that the Mexican
income per capita to unskilled wage ratio rose dramatically over the period (Prados de la
Escosura 2007: Figure 12.1b), suggesting that Mexico followed the rest of Latin America
recording a steep rise in inequality over the four Porfiriato pre-revolutionary decades. And the
Arroyo rent-wage proxy for Mexico confirms the Prados data (the 1870-1900 increase was 27
percent over the three decades). Applying that 35-36 percent increase to the 1870 Latin American
Gini coefficient in Table 4 would imply that it rose from 46.4 to 63.1, making the Gini in the
1920s the highest that Latin America recorded since pre-conquest, even higher than the 1790
colonial peak (57.6), and much, much higher than 1600 (36.2). Any modern analyst who believes
that high inequality has been an attribute of Latin America since the Iberian conquest should take
note.
16
Revisionist Hypotheses
Figure 3 plots our inequality predictions from 1491 to 1929. However crude the evidence
may seem, it points to several revisionist interpretations of, or hypotheses about, 500 years of
Latin American inequality.
First, it is simply not true that Latin America has always been unequal. It cannot be
stressed enough that this is a comparative statement. Only by comparisons with other times and
places can statements about Latin American inequality offer any useful meaning. While
comparisons with the United States are not uncommon in the recent literature, comparisons with
the European (colonial) leaders or with other parts of the poor periphery are rarely, if ever, made.
When such comparisons are made (Table 3 and Milanovic, Lindert and Williamson 2008),
income inequality in pre-industrial Latin America is found to have been lower than that of
northwest Europe, not higher. To repeat, it is not true that pre-industrial Latin America (pre-
1870) was more unequal than pre-industrial northwest Europe (pre-1800). Thus, if, as Engerman
and Sokoloff have suggested, it is thought that inequality encouraged rent-seeking, suppressed
private property rights, retarded the development of ‘good’ institutions, and thus discouraged
growth in Latin America, it must have done even more so in northwest Europe where the
industrial revolution first started! In addition, it appears that pre-conquest Latin America had one
of the lowest, if not the lowest, level of inequality anywhere in the poor periphery. It also appears
that Latin American inequality remained one of the lowest anywhere around the world until the
start of the seventeenth century. It can hardly be said that initial endowments and Iberian
colonization made Latin America more unequal than other places.
Second, Latin America was poorer than northwest Europe, and poorer societies have
smaller surpluses for the elite to extract. Thus, while inequality was no higher, what this paper
and Milanovic et al. (2008) call extraction rates (how much of the available surplus was actually
extracted by the elite) were considerably higher in Latin America than in northwest Europe.
Whether measured inequality or extraction rates are the best indicators of pro-rent-seeking and
anti-growth institutions is an issue that needs to be resolved since they offer very different
inferences regarding Latin American growth underachievement.
Third, Latin American inequality over the five centuries from pre-conquest to the present
has exhibited immense variance. While the historical literature certainly offers strong opinions
about potential explanations, we need far more evidence to document them firmly. By replacing
17
less rapacious indigenous elite with more rapacious European elite, the Iberian conquest appears
to have raised, initially, inequality by about half. Yet, the sixteenth century saw very little further
rise in inequality, most probably because the demographic disaster produced a powerful
downward offset to all other inequality-increasing forces. It looks like the two centuries up to
about 1790 saw the biggest increase in Latin American inequality, reaching its colonial peak in
that year (Gini 57.6: Table 4). What are the explanations for the colonial inequality boom? Was it
simply driven by increases in GDP per capita and thus in the surplus available for the elite to
extract? Or, did the elite learn more effective ways to extract a bigger share of the same surplus?
Or was it both? In any case, about half of that huge rise up to 1790 was eroded by three decades
of war and independence, followed by five post-independence ‘lost decades’ of economic
stagnation. Thus, by 1870 inequality in Latin America (Gini 46.4: Table 4) was not much
different than it was for all pre-industrial societies for which we can get the data (Gini 44.3:
Table 1). To repeat, while inequality was high in Latin America as it was poised for its industrial
revolution, it was no higher than the average pre-industrial society, nor higher than
industrializing Europe.
Fourth, globalization forces during the belle époque pushed Latin American inequality up
to historic highs by the 1920s. Although that belle époque inequality boom is not yet adequately
measured, it looks like ongoing research will shortly do so (e.g Bértola et al. 2008). Other
primary product exporters underwent similar inequality-enhancing booms over that half century
too (Williamson 2002; 2006), but it appears that Latin America had one of the biggest inequality
booms, and, even more notable, that the high inequality achieved persisted during the anti-global
episode between the 1920s and the 1970s. The latter offers a striking contrast with the
industrialized world which underwent a great egalitarian leveling across the mid-20th century
(Williamson and Lindert 1980: 53-62; Goldin and Margo 1992; Atkinson and Piketty 2008).
The inequality history that makes Latin America distinctive stretches across the 20th
century when Europe and its English-speaking offshoots underwent a secular decline in
inequality correlated with the rise of the welfare state (Lindert 2004; Atkinson and Piketty 2008).
Latin America did not share that 20th century decline (Prados 2007). Why has 20th century Latin
American inequality history been so unique, while everything else about their inequality history
from 1491 to the 1920s was so ordinary?
18
References
Acemoglu, D., S. Johnson, and J. Robinson (2001), “The colonial origins of comparative
development,” American Economic Review, 91, 5: 1369-1401.
Acemoglu, D., S. Johnson, and J. Robinson (2002), “Reversal of Fortune: Geography and
Development in the Making of the Modern World Income Distribution,” Quarterly Journal
of Economics (4: 2002): 1231-94.
Arroyo Abad, L. (2008), “Inequality in Republican Latin America: Assessing the Effects of
Factor Endowments and Trade,” GPIH Working Paper 12, University of California, Davis
(November 2008).
Atkinson, A. and T. Piketty (2008), Top Incomes Over the Twentieth Century: A Contrast
Between Continental European and English-Speaking Countries (Oxford: Oxford
University Press).
Bairoch, P. (1993), Economics and World History: Myths and Paradoxes, New York: Harvester
Wheatsheaf.
Barnett, G. E. (1936), Two Tracts by Gregory King, Baltimore: Johns Hopkins University Press.
Bates, R. H., J. H. Coatsworth, and J. G. Williamson (2007), “Lost Decades: Postindependence
Performance in Latin America and Africa,” Journal of Economic History 67 (December):
917-43.
Bértola, L., C. Castelnovo, J. Rodríguez, and H. Willebald (2008), “Income Distribution in the
Latin American Southern Cone during the First Globalization Boom, ca 1870-1920,”
paper presented to the conference New Frontiers of Latin American Economic History,
Harvard University, May 16-17.
Campante, F. and Do, Q-A. (2007), “Inequality, Redistribution, and Population,” KSG Faculty
Research Working Paper RWP07-046, Harvard University (October).
Chen, S. and M. Ravallion (2007), “Absolute Poverty Measures for the Developing World, 1981-
2005,” World Bank Research Development Group, Washington, DC.
Clark, C. (1957), The Conditions of Economic Progress, 3rd ed., London: Macmillan and Co.
Clingingsmith, D. and Williamson, J. G. (2008), “Deindustrialization in 18th and 19th century
India: Mughal Decline, Climate Shocks and British Industrial Ascent,” Explorations in
Economic History 45 (July): 209-34.
Coatsworth, J. H. (2008), “Inequality, Institutions and Economic Growth in Latin America,”
Journal of Latin American Studies 40 (August): 545-69.
19
Engerman, S. and K. Sokoloff (1997), “Factor Endowments, Institutions, and Differential Paths
of Growth Among New World Economies,” in How Latin America Fell Behind, ed. by S.
Haber, Palo Alto, Cal.: Stanford: 260-304.
Engerman, S., S. Haber and K. Sokoloff (2000), “Institutions, Factor Endowments, and Paths of
Development in the New World,” Journal of Economic Perspectives 14, 3: 217-32.
Goldin, C. and R. A. Margo (1992), "The Great Compression: The Wage Structure in the United
States at Mid-Century," Quarterly Journal of Economics 107: 1-34.
Gelman, J. and D. Santilli (2006), Historia del Capitalismo agrario pampeano: Volume 3: De
Rivadavia a Rosas; Desigualdad y crecimiento economico (Buenos Aires: Universidad de
Belgrano-Siglo XXI).
Hoffman, P. T., D. Jacks, P. Levin, and P. H. Lindert, “Real Inequality in Western Europe since
1500,” Journal of Economic History 62, 2 (June 2002): 322-355.
Johnson, L. L. and Z. Frank (2006), “Cities and Wealth in the South Atlantic: Buenos Aires and
Rio de Janeiro before 1860,” Comparative Studies in Society and History 48 (3): xx-xx.
Latham, A. J. H. and L. Neal (1983), "The International Market in Rice and Wheat 1868-1914,"
Economic History Review 36 (May): 260-75.
Lindert, P. H. (2004), Growing Public: Social Spending and Economic Growth Since the
Eighteenth Century, Volume 1 (Cambridge: Cambridge University Press).
Lindert, P. H. and J. G. Williamson (1982), “Revising England’s Social Tables, 1688-1812,”
Explorations in Economic History 19, 4: 385-408.
Livi-Bacci, M. (2006), “The Depopulation of Hispanic America after the Conquest,”
Population and Development Review 32 (June): 199-232.
Maddison, A. (1998), Chinese Economic Performance in the Long Run, Paris: OECD
Development Centre.
Maddison, A. (2008), at http://www.ggdc.net/Maddison
Milanovic, B., P. H. Lindert and J. G. Williamson (2008), “Ancient Inequality,” revised
version of “Measuring Ancient Inequality,” NBER Working Paper 13550, National
Bureau of Economic Research, Cambridge, Mass.
(October).
Mokyr, J. (1983), Why Ireland Starved: A Quantitative and Analytical History of the Irish
Economy, 1800-1850, Boston: Allen and Unwin.
Prados de la Escosura, L. (2007), “Inequality and Poverty in Latin America: A Long-Run
20
Exploration,” in T. J. Hatton, K. H. O’Rourke, and A. M. Taylor (eds.), The New
Comparative Economic History (Cambridge, Mass.: MIT Press), pp. 291-315.
Prados de la Escosura, L. (2009), “Lost Decades? Economic Performance in Post-
Independence Latin America,” Journal of Latin American Studies 41 (2): forthcoming.
Ravallion, M., S. Chen and P. Sangraula (2007), "New evidence on the
urbanization of global poverty," Population and Development Review 33, 4: 667-701.
Studer, R. (2008), “India and the Great Divergence: Assessing the Efficiency of Grain
Markets in Eighteenth- and Nineteenth-Century India,” Journal of Economic History 68
(June): 393-437.
Williamson, J. G. (1999), “Real Wages, Inequality, and Globalization in Latin America
Before 1940,” Revista de Historia Economica 17, special number: 101-42.
Williamson, J. G. (2002), “Land, Labor, and Globalization in the Third World, 1870-
1940,” Journal of Economic History 62 (1): 55-85.
Williamson, J. G. (2006), Globalization and the Poor Periphery before 1950 (Cambridge,
Mass.: MIT Press).
Williamson, J. G. (2008), “Globalization and the Great Divergence: Terms of Trade
Booms and Volatility in the Poor Periphery 1782-1913,” European Review of Economic
History 12 (December): 355-91.
Williamson, J. G. (2009), Trade and Poverty since 1750: When the Third World Fell
Behind (ongoing).
Williamson, J. G. and P. H. Lindert (1980), American Inequality: A Macroeconomic History
(New York: Academic Press).
Young, A. (2005), “The Gift of the Dying: The Tragedy of AIDs and the Welfare of
Future African Generations,” Quarterly Journal of Economics 120 (May): 423-66.
21
Table 1 Pre-Industrial Inequality Measures
Country/Region, Year Gini Mean income/
s=subsistence (s=$300)
Maximum feasible Gini
(IPF)
Inequality extraction ratio (in %)
Roman Empire 14 39.4 2.1 52.6 75.0 Byzantium 1000 41.1 1.8 43.7 94.1 England & Wales 1290 36.7 2.1 53.0 69.2 Tuscany 1427 46.1 3.3 69.3 66.6 South Serbia 1455 20.9 1.5 32.2 64.8 Holland 1561 56.0 3.8 73.4 76.3 Levant 1596 39.8 3.2 69.1 57.6 England & Wales 1688 45.0 4.7 78.8 57.1 Holland 1732 61.1 6.8 85.2 71.7 Moghul India 1750 48.9 1.8 43.4 112.8 Old Castille 1752 52.5 2.5 59.7 88.0 Eng1and & Wales 1759 45.9 5.9 82.9 55.4 France 1788 55.9 3.8 73.5 76.1 Nueva España 1790 63.5 2.5 60.2 105.5 England & Wales 1801 51.5 6.7 85.0 60.6 Bihar (India) 1807 33.5 1.8 43.7 76.7 Netherlands 1808 57.0 6.0 83.3 68.5 Naples 1811 28.4 2.2 52.9 53.7 Chile1861 63.7 4.3 76.8 83.0 Brazil 1872 43.3 2.4 58.3 74.2 Peru 1876 42.2 2.2 54.0 78.1 Java 1880 39.7 2.2 54.6 72.8 China 1880 24.5 1.8 44.4 55.2 Japan 1886 39.5 3.1 67.2 58.8 Kenya 1914 33.2 1.5 34.2 96.8 Java 1924 32.1 3.0 66.9 48.0 Kenya 1927 46.2 1.9 46.2 100.0 Siam 1929 48.5 2.6 62.1 78.1 British India 1947 49.7 2.1 51.3 96.8 Average 44.3 3.1 60.6 74.9 Modern counterparts Italy 2000 35.9 62.5 98.3 36.5 Turkey 2003 43.6 22.0 95.4 45.7 United Kingdom 1999 37.4 66.1 98.4 38.0 Serbia 2003 32.2 11.2 91.0 35.4 Netherlands 1999 28.1 72.0 98.5 28.5 India 2004 32.6 6.4 84.2 38.7 Spain 2000 33.0 50.9 97.9 33.7 France 2000 31.2 69.4 98.4 31.7 Mexico 2000 53.8 24.1 95.7 56.2 Chile 2003 54.6 33.7 96.6 56.4 Brazil 2002 58.8 13.9 92.7 63.4 Peru 2002 52.0 12.3 91.8 56.7 Kenya 1998 44.4 4.5 77.6 57.2 Indonesia 2002 34.3 10.7 90.5 37.9 China 2001 41.6 11.5 91.2 45.6 Japan 2002 26.0 70.2 98.5 26.4 Thailand 2002 50.9 21.3 95.2 53.5 Average 40.6 33.1 93.6 43.6 Other contemporary countries
22
Country/Region, Year Gini Mean income/ s=subsistence
(s=$300)
Maximum feasible Gini
(IPF)
Inequality extraction ratio (in %)
South Africa 2000 57.3 14.7 93.1 61.6 United States 2000 39.9 77.7 98.6 40.5 Sweden 2000 27.3 52.2 98.0 27.9 Germany 2000 30.3 62.0 98.3 30.8 Nigeria 2003 42.1 3.0 66.7 63.1 Congo, D.R., 2004 41.0 1.5 33.3 123.1 Tanzania 2000 34.6 1.8 44.4 77.9 Malaysia 2001 47.9 26.0 96.1 49.9 Source: Milanovic, Lindert and Williamson (2008: Table 2). Ancient societies ranked by year.
23
Table 2 Regression Results for the Gini Coefficient 1 2 3 GDP per capita 360.5*** 366.7*** 360.2*** (0.001) (0.001) (0.002) GDP per capita squared -25.0*** -25.5*** -25.0*** (0.002) (0.002) (0.003) Urbanization rate 0.349* 0.354* 0.353* (0.08) (0.08) (0.093) Population density -0.105*** -0.100*** -0.107* (0.001) (0.003) (0.053) Number of groups -0.009 -0.009 -0.010 (0.16) (0.19) (0.18) Colony (0-1) 12.63*** 12.93*** 12.41*** (0.001) (0.001) (0.002) Foreigner (0-1) -9.59 -9.97 -9.26 (0.25) (0.25) (0.29) Asia (0-1) -1.28 (0.69) Tax survey (0-1) -4.86 -4.85 -4.85 (0.57) (0.24) (0.28) Constant -1246*** -1266*** -1245*** (0.001) (0.001) (0.002) Number observations 28 28 26 Adjusted R squared 0.75 0.73 0.73 Notes: GDP per capita is in natural logs. Coefficients significant at 10, 5 and 1 percent level denoted by respectively three, two and one asterisks, p values between brackets. Source: Milanovic, Lindert and Williamson 2008: Table 3).
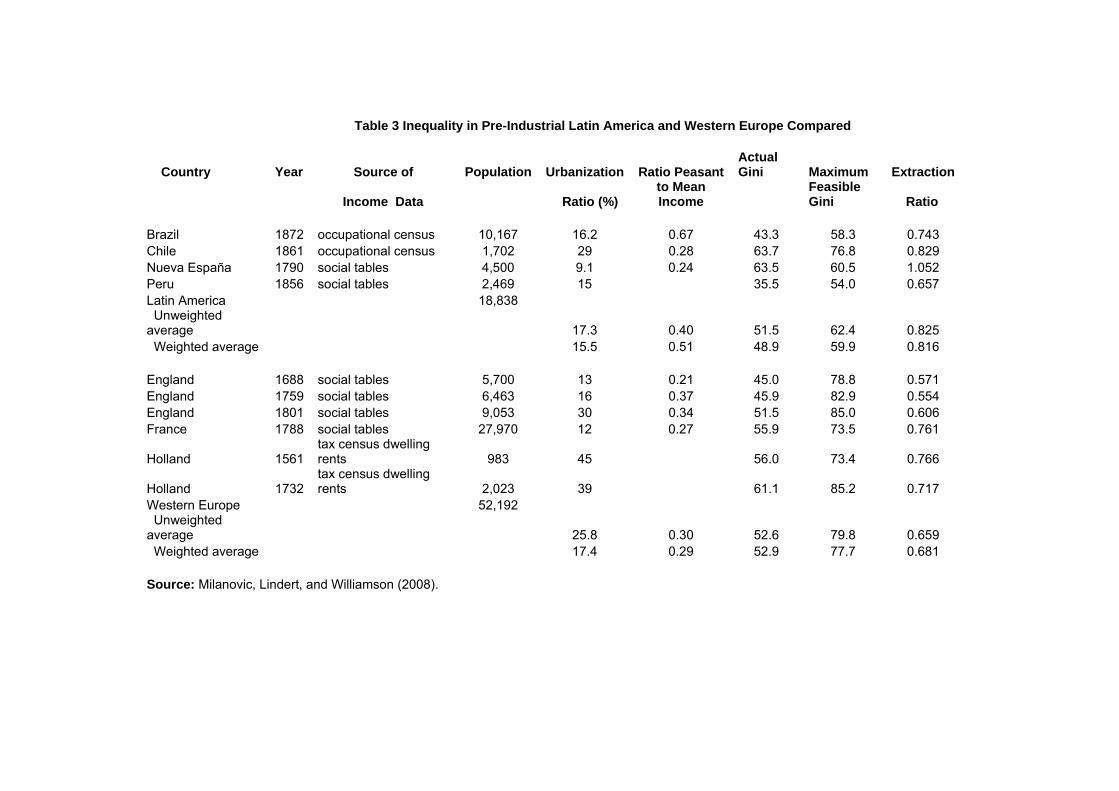
Table 3 Inequality in Pre-Industrial Latin America and Western Europe Compared
Country Year Source of
Population Urbanization Ratio Peasant
Actual Gini
Maximum
Extraction
Income Data Ratio (%) to Mean Income
Feasible Gini Ratio
Brazil 1872 occupational census 10,167 16.2 0.67 43.3 58.3 0.743 Chile 1861 occupational census 1,702 29 0.28 63.7 76.8 0.829 Nueva España 1790 social tables 4,500 9.1 0.24 63.5 60.5 1.052 Peru 1856 social tables 2,469 15 35.5 54.0 0.657 Latin America 18,838 Unweighted average 17.3 0.40 51.5 62.4 0.825 Weighted average 15.5 0.51 48.9 59.9 0.816 England 1688 social tables 5,700 13 0.21 45.0 78.8 0.571 England 1759 social tables 6,463 16 0.37 45.9 82.9 0.554 England 1801 social tables 9,053 30 0.34 51.5 85.0 0.606 France 1788 social tables 27,970 12 0.27 55.9 73.5 0.761
Holland 1561 tax census dwelling rents 983 45 56.0 73.4 0.766
Holland 1732 tax census dwelling rents 2,023 39 61.1 85.2 0.717
Western Europe 52,192 Unweighted average 25.8 0.30 52.6 79.8 0.659 Weighted average 17.4 0.29 52.9 77.7 0.681 Source: Milanovic, Lindert, and Williamson (2008).
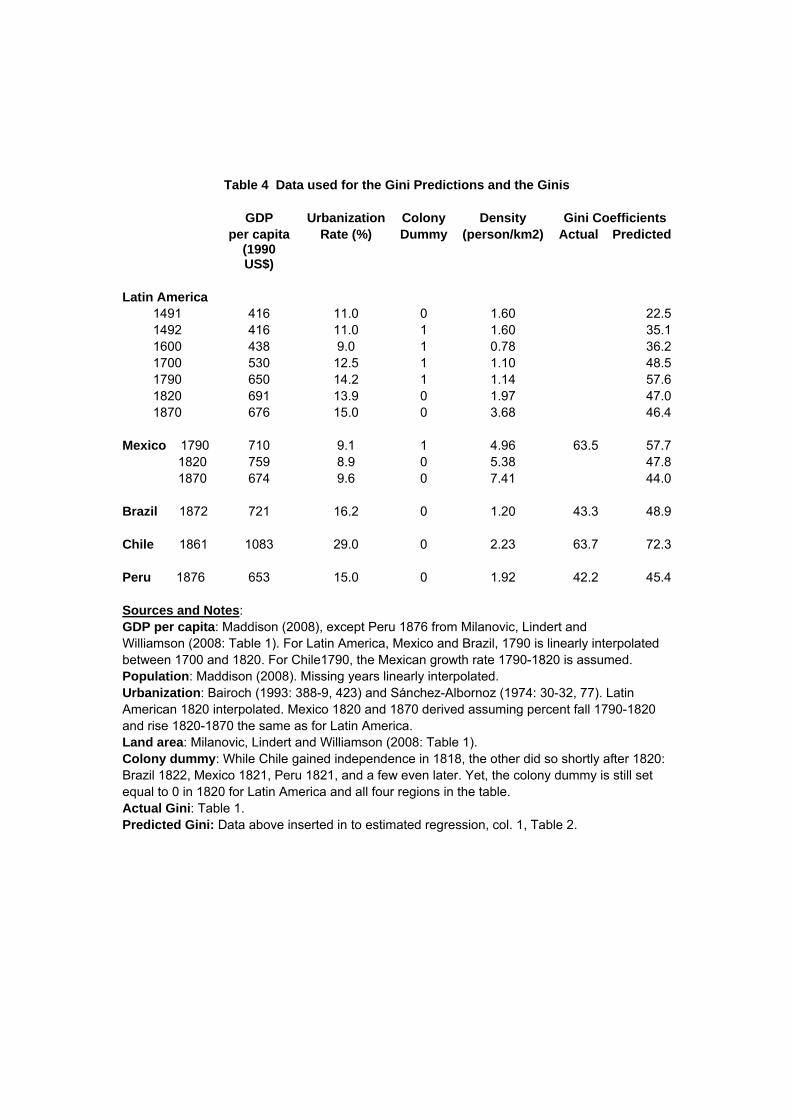
Table 4 Data used for the Gini Predictions and the Ginis GDP Urbanization Colony Density Gini Coefficients per capita Rate (%) Dummy (person/km2) Actual Predicted
(1990 US$)
Latin America
1491 416 11.0 0 1.60 22.51492 416 11.0 1 1.60 35.11600 438 9.0 1 0.78 36.21700 530 12.5 1 1.10 48.51790 650 14.2 1 1.14 57.61820 691 13.9 0 1.97 47.01870 676 15.0 0 3.68 46.4
Mexico 1790 710 9.1 1 4.96 63.5 57.7 1820 759 8.9 0 5.38 47.8 1870 674 9.6 0 7.41 44.0
Brazil 1872 721 16.2 0 1.20 43.3 48.9 Chile 1861 1083 29.0 0 2.23 63.7 72.3 Peru 1876 653 15.0 0 1.92 42.2 45.4 Sources and Notes: GDP per capita: Maddison (2008), except Peru 1876 from Milanovic, Lindert and Williamson (2008: Table 1). For Latin America, Mexico and Brazil, 1790 is linearly interpolated between 1700 and 1820. For Chile1790, the Mexican growth rate 1790-1820 is assumed. Population: Maddison (2008). Missing years linearly interpolated. Urbanization: Bairoch (1993: 388-9, 423) and Sánchez-Albornoz (1974: 30-32, 77). Latin American 1820 interpolated. Mexico 1820 and 1870 derived assuming percent fall 1790-1820 and rise 1820-1870 the same as for Latin America. Land area: Milanovic, Lindert and Williamson (2008: Table 1). Colony dummy: While Chile gained independence in 1818, the other did so shortly after 1820: Brazil 1822, Mexico 1821, Peru 1821, and a few even later. Yet, the colony dummy is still set equal to 0 in 1820 for Latin America and all four regions in the table. Actual Gini: Table 1. Predicted Gini: Data above inserted in to estimated regression, col. 1, Table 2.
26
Table 5 Latin American Inequality Trends 1870s-1920s Argentina Brazil Chile Uruguay Latin America Gini P-Gini Gini P-Gini Gini P-Gini Gini P-Gini Gini P-Gini 1870s 52.2 39.1 39.2 32.9 59.4 41.3 48.1 29.6 44.0 34.8 1920s 57.4 49.3 59.7 47.2 64.1 49.2 56.2 36.6 59.6 47.5 % change 10.0 26.1 52.3 43.5 7.9 19.1 16.8 23.6 35.5 36.5 Sources: Ginis for 1870 and 1920 from Bertola et al. (2008: Table 4). Pseudo-Ginis for 1870 and 1929, from Prados (2007: Table 12.1). Notes: The Latin America weighted Gini averages use 1900 population as weights. The P-Gini is a Pseudo-Gini derived from backward projection. See Prados de la Escosura (2007: Table 12.2).
27
Figure 1 Ancient Inequalities: Estimated Gini Coefficients, and the Inequality Possibility Frontiers
0
10
20
30
40
50
60
70
80
90
0 300 600 900 1200 1500 1800 2100 2400
GDI per capita (in 1990 $PPP)
Gin
i ind
ex
Serbia 1455
China 1880
Naples 1811
England 1290
India 1750
Byzant 1000
Rome 14
Peru 1876Brazil 1872
Java 1880
India 1947Old Castille 1752
Siam 1929
England 1688
France 1788
Chile 1861
Netherlands. 1808
England 1759
Holland 1732
England 1801
Bihar 1807 Java 1924
Nueva España 1790
Holland 1561
Florence 1427
Japan 1886Levant 1596
Kenya 1914
Kenya 1927
Note: The solid line IPF is constructed on the assumption that s=$PPP 300. See text. Source: Milanovic, Lindert and Williamson (2008: Figure 2).
28
Figure 2 Inequality Extraction Ratio for the Ancient
Society Sample and their Counterpart Modern Societies
TZA
MYS
BRA
USA
SWE
ZAF
CHN
NIG
CON
IND
050
100
150
ineq
ualit
y ex
tract
ion
ratio
1000 2000 5000 10000 20000gdp per capita in 1990 ppp
Note: Modern societies are drawn with hollow circles. Horizontal axis in logs. Inequality extraction ratio shown in percentages. Source: Milanovic, Lindert and Williamson (2008: Figure 4).
29
Figure 3. Predicting Inequality in Latin America 1491-1929
0
10
20
30
40
50
60
70
14901540
15901640
16901740
17901840
18901940
Gin
i Coe
ffici
ent
Bisher erschienene Diskussionspapiere Nr. 81: Williamson, Jeffrey G.: History without Evidence: Latin American Inequality since 1491,
Mai 2009 Nr. 80: Erdogan, Burcu: How does the European Integration affect the European Stock Markets?,
April 2009 Nr. 79: Oelgemöller, Jens; Westermeier, Andreas: RCAs within Western Europe, März 2009 Nr. 78: Blonski, Matthias; Lilienfeld-Toal, Ulf von: Excess Returns and the Distinguished Player
Paradox, Oktober 2008 Nr. 77: Lechner, Susanne; Ohr, Renate: The Right of Withdrawal in the Treaty of Lisbon: A game
theoretic reflection on different decision processes in the EU, Oktober 2008 Nr. 76: Kühl, Michael: Strong comovements of exchange rates: Theoretical and empirical cases
when currencies become the same asset, Juli 2008 Nr. 75: Höhenberger, Nicole; Schmiedeberg, Claudia: Structural Convergence of European
Countries, Juli 2008 Nr. 74: Nowak-Lehmann D., Felicitas; Vollmer, Sebastian; Martinez-Zarzoso, Inmaculada: Does
Comparative Advantage Make Countries Competitive? A Comparison of China and Mexico, Juli 2008
Nr. 73: Fendel, Ralf; Lis, Eliza M.; Rülke, Jan-Christoph: Does the Financial Market Believe in the Phillips Curve? – Evidence from the G7 countries, Mai 2008
Nr. 72: Hafner, Kurt A.: Agglomeration Economies and Clustering – Evidence from German Firms, Mai 2008
Nr. 71: Pegels, Anna: Die Rolle des Humankapitals bei der Technologieübertragung in Entwicklungsländer, April 2008
Nr. 70: Grimm, Michael; Klasen, Stephan: Geography vs. Institutions at the Village Level, Februar 2008
Nr. 69: Van der Berg, Servaas: How effective are poor schools? Poverty and educational outcomes in South Africa, Januar 2008
Nr. 68: Kühl, Michael: Cointegration in the Foreign Exchange Market and Market Efficiency since the Introduction of the Euro: Evidence based on bivariate Cointegration Analyses, Oktober 2007
Nr. 67: Hess, Sebastian; Cramon-Taubadel, Stephan von: Assessing General and Partial Equilibrium Simulations of Doha Round Outcomes using Meta-Analysis, August 2007
Nr. 66: Eckel, Carsten: International Trade and Retailing: Diversity versus Accessibility and the Creation of “Retail Deserts”, August 2007
Nr. 65: Stoschek, Barbara: The Political Economy of Enviromental Regulations and Industry Compensation, Juni 2007
Nr. 64: Martinez-Zarzoso, Inmaculada; Nowak-Lehmann D., Felicitas; Vollmer, Sebastian: The Log of Gravity Revisited, Juni 2007
Nr. 63: Gundel, Sebastian: Declining Export Prices due to Increased Competition from NIC – Evidence from Germany and the CEEC, April 2007
Nr. 62: Wilckens, Sebastian: Should WTO Dispute Settlement Be Subsidized?, April 2007 Nr. 61: Schöller, Deborah: Service Offshoring: A Challenge for Employment? Evidence from
Germany, April 2007 Nr. 60: Janeba, Eckhard: Exports, Unemployment and the Welfare State, März 2007
Nr. 59: Lambsdoff, Johann Graf; Nell, Mathias: Fighting Corruption with Asymmetric Penalties and Leniency, Februar 2007
Nr. 58: Köller, Mareike: Unterschiedliche Direktinvestitionen in Irland – Eine theoriegestützte Analyse, August 2006
Nr. 57: Entorf, Horst; Lauk, Martina: Peer Effects, Social Multipliers and Migrants at School: An International Comparison, März 2007 (revidierte Fassung von Juli 2006)
Nr. 56: Görlich, Dennis; Trebesch, Christoph: Mass Migration and Seasonality Evidence on Moldova’s Labour Exodus, Mai 2006
Nr. 55: Brandmeier, Michael: Reasons for Real Appreciation in Central Europe, Mai 2006 Nr. 54: Martínez-Zarzoso, Inmaculada; Nowak-Lehmann D., Felicitas: Is Distance a Good Proxy
for Transport Costs? The Case of Competing Transport Modes, Mai 2006 Nr. 53: Ahrens, Joachim; Ohr, Renate; Zeddies, Götz: Enhanced Cooperation in an Enlarged EU,
April 2006 Nr. 52: Stöwhase, Sven: Discrete Investment and Tax Competition when Firms shift Profits, April
2006 Nr. 51: Pelzer, Gesa: Darstellung der Beschäftigungseffekte von Exporten anhand einer Input-
Output-Analyse, April 2006 Nr. 50: Elschner, Christina; Schwager, Robert: A Simulation Method to Measure the Tax Burden on
Highly Skilled Manpower, März 2006 Nr. 49: Gaertner, Wulf; Xu, Yongsheng: A New Measure of the Standard of Living Based on
Functionings, Oktober 2005 Nr. 48: Rincke, Johannes; Schwager, Robert: Skills, Social Mobility, and the Support for the
Welfare State, September 2005 Nr. 47: Bose, Niloy; Neumann, Rebecca: Explaining the Trend and the Diversity in the Evolution of
the Stock Market, Juli 2005 Nr. 46: Kleinert, Jörn; Toubal, Farid: Gravity for FDI, Juni 2005 Nr. 45: Eckel, Carsten: International Trade, Flexible Manufacturing and Outsourcing, Mai 2005 Nr. 44: Hafner, Kurt A.: International Patent Pattern and Technology Diffusion, Mai 2005 Nr. 43: Nowak-Lehmann D., Felicitas; Herzer, Dierk; Martínez-Zarzoso, Inmaculada; Vollmer,
Sebastian: Turkey and the Ankara Treaty of 1963: What can Trade Integration Do for Turkish Exports, Mai 2005
Nr. 42: Südekum, Jens: Does the Home Market Effect Arise in a Three-Country Model?, April 2005 Nr. 41: Carlberg, Michael: International Monetary Policy Coordination, April 2005 Nr. 40: Herzog, Bodo: Why do bigger countries have more problems with the Stability and Growth
Pact?, April 2005 Nr. 39: Marouani, Mohamed A.: The Impact of the Mulitfiber Agreement Phaseout on
Unemployment in Tunisia: a Prospective Dynamic Analysis, Januar 2005 Nr. 38: Bauer, Philipp; Riphahn, Regina T.: Heterogeneity in the Intergenerational Transmission of
Educational Attainment: Evidence from Switzerland on Natives and Second Generation Immigrants, Januar 2005
Nr. 37: Büttner, Thiess: The Incentive Effect of Fiscal Equalization Transfers on Tax Policy, Januar 2005
Nr. 36: Feuerstein, Switgard; Grimm, Oliver: On the Credibility of Currency Boards, Oktober 2004 Nr. 35: Michaelis, Jochen; Minich, Heike: Inflationsdifferenzen im Euroraum – eine
Bestandsaufnahme, Oktober 2004 Nr. 34: Neary, J. Peter: Cross-Border Mergers as Instruments of Comparative Advantage, Juli 2004
Nr. 33: Bjorvatn, Kjetil; Cappelen, Alexander W.: Globalisation, inequality and redistribution, Juli 2004
Nr. 32: Stremmel, Dennis: Geistige Eigentumsrechte im Welthandel: Stellt das TRIPs-Abkommen ein Protektionsinstrument der Industrieländer dar?, Juli 2004
Nr. 31: Hafner, Kurt: Industrial Agglomeration and Economic Development, Juni 2004 Nr. 30: Martinez-Zarzoso, Inmaculada; Nowak-Lehmann D., Felicitas: MERCOSUR-European
Union Trade: How Important is EU Trade Liberalisation for MERCOSUR’s Exports?, Juni 2004
Nr. 29: Birk, Angela; Michaelis, Jochen: Employment- and Growth Effects of Tax Reforms, Juni 2004
Nr. 28: Broll, Udo; Hansen, Sabine: Labour Demand and Exchange Rate Volatility, Juni 2004 Nr. 27: Bofinger, Peter; Mayer, Eric: Monetary and Fiscal Policy Interaction in the Euro Area with
different assumptions on the Phillips curve, Juni 2004 Nr. 26: Torlak, Elvisa: Foreign Direct Investment, Technology Transfer and Productivity Growth in
Transition Countries, Juni 2004 Nr. 25: Lorz, Oliver; Willmann, Gerald: On the Endogenous Allocation of Decision Powers in
Federal Structures, Juni 2004 Nr. 24: Felbermayr, Gabriel J.: Specialization on a Technologically Stagnant Sector Need Not Be
Bad for Growth, Juni 2004 Nr. 23: Carlberg, Michael: Monetary and Fiscal Policy Interactions in the Euro Area, Juni 2004 Nr. 22: Stähler, Frank: Market Entry and Foreign Direct Investment, Januar 2004 Nr. 21: Bester, Helmut; Konrad, Kai A.: Easy Targets and the Timing of Conflict, Dezember 2003 Nr. 20: Eckel, Carsten: Does globalization lead to specialization, November 2003 Nr. 19: Ohr, Renate; Schmidt, André: Der Stabilitäts- und Wachstumspakt im Zielkonflikt zwischen
fiskalischer Flexibilität und Glaubwürdigkeit: Ein Reform-ansatz unter Berücksichtigung konstitutionen- und institutionenökonomischer Aspekte, August 2003
Nr. 18: Ruehmann, Peter: Der deutsche Arbeitsmarkt: Fehlentwicklungen, Ursachen und Reformansätze, August 2003
Nr. 17: Suedekum, Jens: Subsidizing Education in the Economic Periphery: Another Pitfall of Regional Policies?, Januar 2003
Nr. 16: Graf Lambsdorff, Johann; Schinke, Michael: Non-Benevolent Central Banks, Dezember 2002
Nr. 15: Ziltener, Patrick: Wirtschaftliche Effekte des EU-Binnenmarktprogramms, November 2002 Nr. 14: Haufler, Andreas; Wooton, Ian: Regional Tax Coordination and Foreign Direct Investment,
November 2001 Nr. 13: Schmidt, André: Non-Competition Factors in the European Competition Policy: The
Necessity of Institutional Reforms, August 2001 Nr. 12: Lewis, Mervyn K.: Risk Management in Public Private Partnerships, Juni 2001 Nr. 11: Haaland, Jan I.; Wooton, Ian: Multinational Firms: Easy Come, Easy Go?, Mai 2001 Nr. 10: Wilkens, Ingrid: Flexibilisierung der Arbeit in den Niederlanden: Die Entwicklung
atypischer Beschäftigung unter Berücksichtigung der Frauenerwerbstätigkeit, Januar 2001 Nr. 9: Graf Lambsdorff, Johann: How Corruption in Government Affects Public Welfare – A
Review of Theories, Januar 2001 Nr. 8: Angermüller, Niels-Olaf: Währungskrisenmodelle aus neuerer Sicht, Oktober 2000 Nr. 7: Nowak-Lehmann, Felicitas: Was there Endogenous Growth in Chile (1960-1998)? A Test of
the AK model, Oktober 2000
Nr. 6: Lunn, John; Steen, Todd P.: The Heterogeneity of Self-Employment: The Example of Asians in the United States, Juli 2000
Nr. 5: Güßefeldt, Jörg; Streit, Clemens: Disparitäten regionalwirtschaftlicher Entwicklung in der EU, Mai 2000
Nr. 4: Haufler, Andreas: Corporate Taxation, Profit Shifting, and the Efficiency of Public Input Provision, 1999
Nr. 3: Rühmann, Peter: European Monetary Union and National Labour Markets, September 1999
Nr. 2: Jarchow, Hans-Joachim: Eine offene Volkswirtschaft unter Berücksichtigung des Aktienmarktes, 1999
Nr. 1: Padoa-Schioppa, Tommaso: Reflections on the Globalization and the Europeanization of the Economy, Juni 1999
Alle bisher erschienenen Diskussionspapiere zum Download finden Sie im Internet unter: http://www.uni-goettingen.de/de/60920.html.