Embed Size (px)
Citation preview

How to
Write
an
EEI
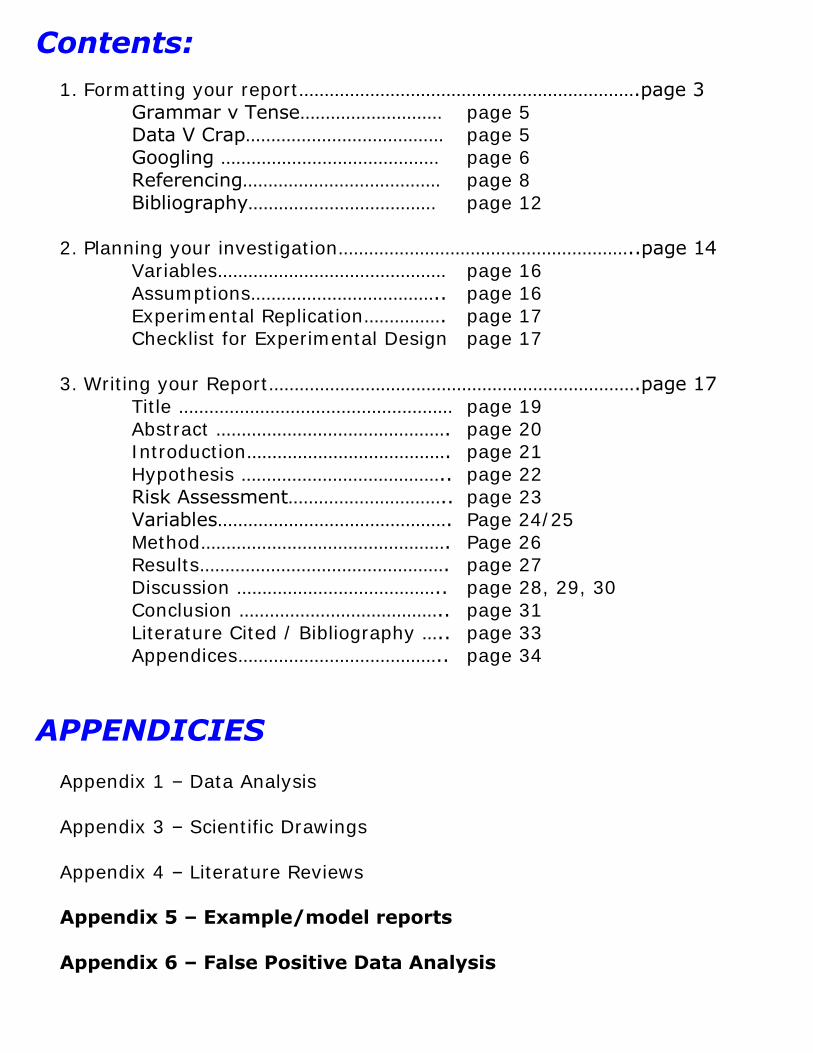
Contents:
1. Formatting your report………………………………………………………….page 3
Grammar v Tense………………………. page 5 Data V Crap………………………………… page 5 Googling ……………………………………. page 6 Referencing………………………………… page 8 Bibliography………………………………. page 12
2. Planning your investigation…………………………………………………..page 14
Variables……………………………………… page 16
Assumptions……………………………….. page 16 Experimental Replication……………. page 17 Checklist for Experimental Design page 17
3. Writing your Report……………………………………………………………….page 17
Title ……………………………………………… page 19 Abstract ………………………………………. page 20 Introduction…………………………………. page 21 Hypothesis ………………………………….. page 22
Risk Assessment………………………….. page 23 Variables………………………………………. Page 24/25 Method…………………………………………. Page 26 Results…………………………………………. page 27 Discussion ………………………………….. page 28, 29, 30 Conclusion ………………………………….. page 31 Literature Cited / Bibliography ….. page 33 Appendices………………………………….. page 34
APPENDICIES
Appendix 1 – Data Analysis
Appendix 3 – Scientific Drawings
Appendix 4 – Literature Reviews
Appendix 5 – Example/model reports Appendix 6 – False Positive Data Analysis

FORMATTING YOUR REPORT
Before you start
Grammar and Tense
Data v Crap!
Qualitative v Quantitative data
„Googling‟
How to search online
Referencing
How to cite reference within your text
Bibliography
How to write a scientific bibliography
FORM
ATTING
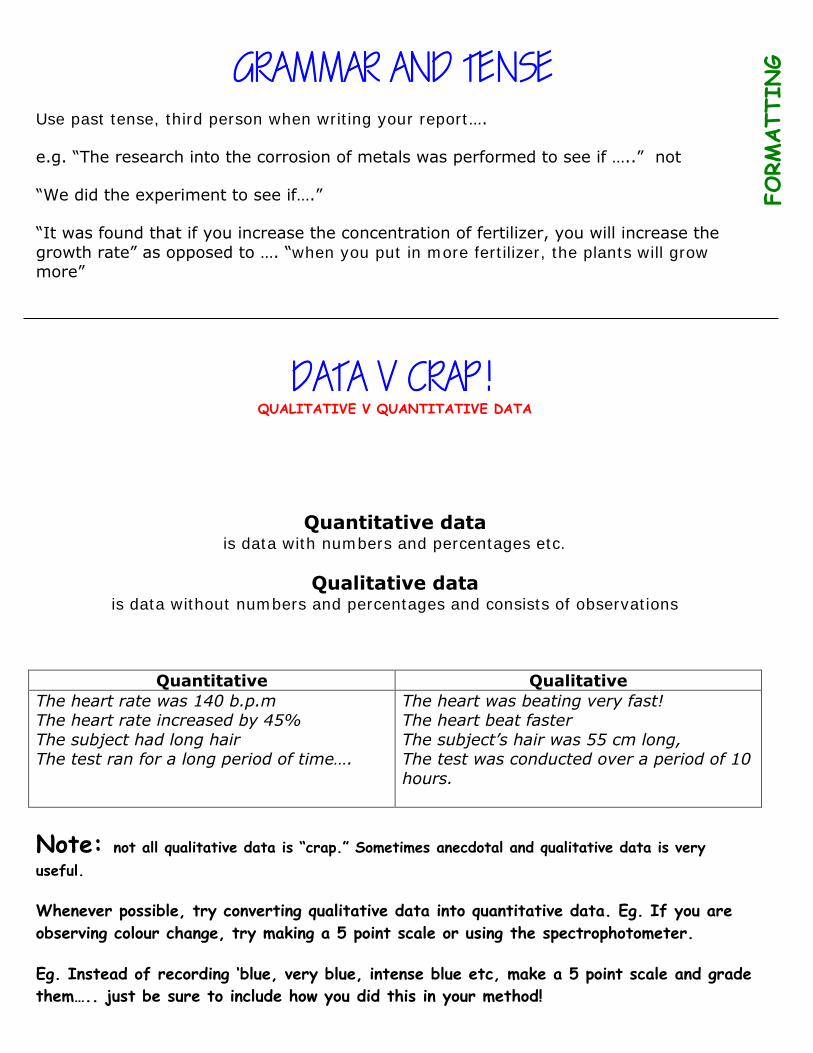
Use past tense, third person when writing your report….
e.g. “The research into the corrosion of metals was performed to see if …..” not
“We did the experiment to see if….”
“It was found that if you increase the concentration of fertilizer, you will increase the
growth rate” as opposed to …. “when you put in more fertilizer, the plants will grow more”
QUALITATIVE V QUANTITATIVE DATA
Quantitative data is data with numbers and percentages etc.
Qualitative data
is data without numbers and percentages and consists of observations
Quantitative Qualitative
The heart rate was 140 b.p.m The heart rate increased by 45%
The subject had long hair The test ran for a long period of time….
The heart was beating very fast! The heart beat faster
The subject’s hair was 55 cm long, The test was conducted over a period of 10
hours.
Note: not all qualitative data is “crap.” Sometimes anecdotal and qualitative data is very
useful.
Whenever possible, try converting qualitative data into quantitative data. Eg. If you are
observing colour change, try making a 5 point scale or using the spectrophotometer.
Eg. Instead of recording „blue, very blue, intense blue etc, make a 5 point scale and grade
them….. just be sure to include how you did this in your method!
FORM
ATTING
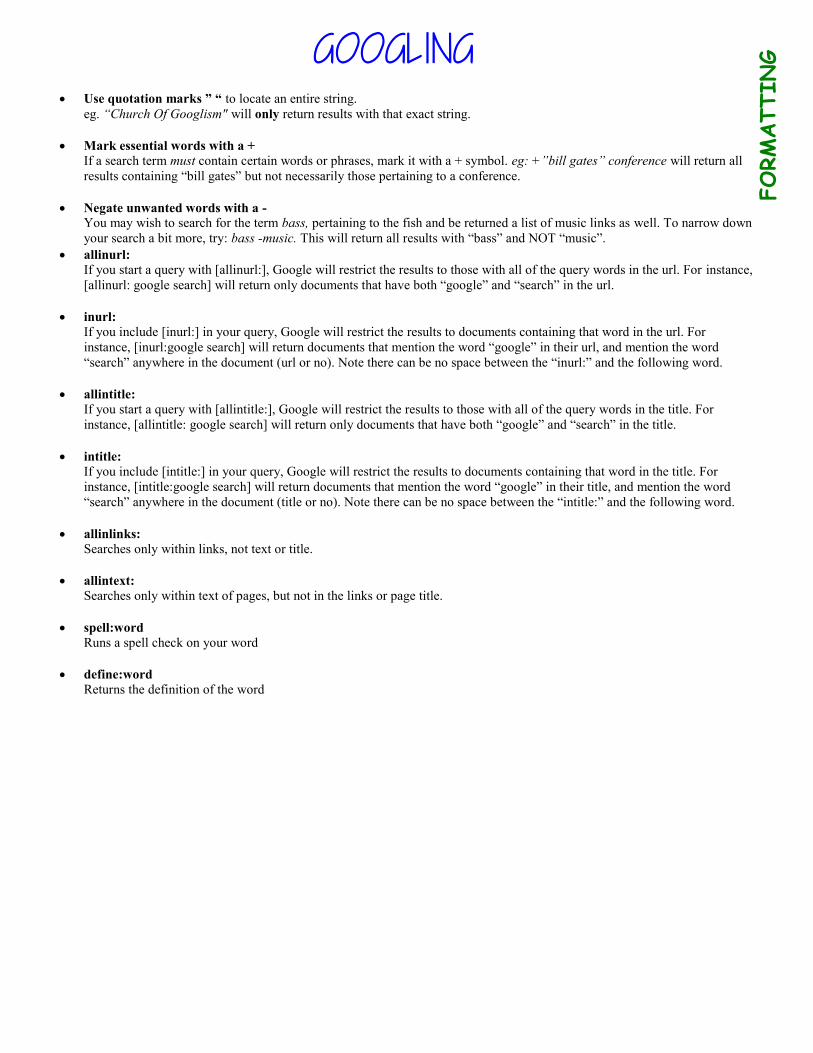
Use quotation marks ” “ to locate an entire string.
eg. “Church Of Googlism" will only return results with that exact string.
Mark essential words with a + If a search term must contain certain words or phrases, mark it with a + symbol. eg: +”bill gates” conference will return all results containing “bill gates” but not necessarily those pertaining to a conference.
Negate unwanted words with a - You may wish to search for the term bass, pertaining to the fish and be returned a list of music links as well. To narrow down your search a bit more, try: bass -music. This will return all results with “bass” and NOT “music”.
allinurl: If you start a query with [allinurl:], Google will restrict the results to those with all of the query words in the url. For instance, [allinurl: google search] will return only documents that have both “google” and “search” in the url.
inurl: If you include [inurl:] in your query, Google will restrict the results to documents containing that word in the url. For instance, [inurl:google search] will return documents that mention the word “google” in their url, and mention the word “search” anywhere in the document (url or no). Note there can be no space between the “inurl:” and the following word.
allintitle: If you start a query with [allintitle:], Google will restrict the results to those with all of the query words in the title. For instance, [allintitle: google search] will return only documents that have both “google” and “search” in the title.
intitle: If you include [intitle:] in your query, Google will restrict the results to documents containing that word in the title. For instance, [intitle:google search] will return documents that mention the word “google” in their title, and mention the word “search” anywhere in the document (title or no). Note there can be no space between the “intitle:” and the following word.
allinlinks: Searches only within links, not text or title.
allintext: Searches only within text of pages, but not in the links or page title.
spell:word Runs a spell check on your word
define:word Returns the definition of the word
FORM
ATTING
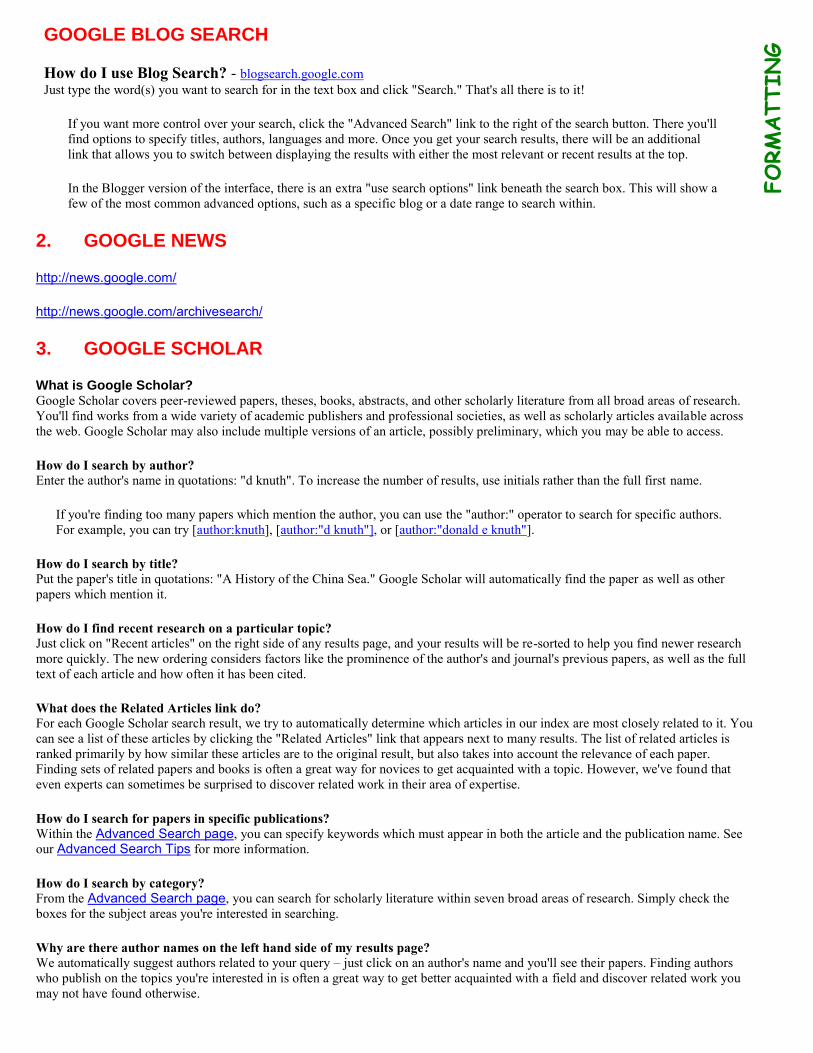
GOOGLE BLOG SEARCH
How do I use Blog Search? - blogsearch.google.com Just type the word(s) you want to search for in the text box and click "Search." That's all there is to it!
If you want more control over your search, click the "Advanced Search" link to the right of the search button. There you'll find options to specify titles, authors, languages and more. Once you get your search results, there will be an additional link that allows you to switch between displaying the results with either the most relevant or recent results at the top.
In the Blogger version of the interface, there is an extra "use search options" link beneath the search box. This will show a few of the most common advanced options, such as a specific blog or a date range to search within.
2. GOOGLE NEWS
http://news.google.com/
http://news.google.com/archivesearch/
3. GOOGLE SCHOLAR
What is Google Scholar? Google Scholar covers peer-reviewed papers, theses, books, abstracts, and other scholarly literature from all broad areas of research. You'll find works from a wide variety of academic publishers and professional societies, as well as scholarly articles available across the web. Google Scholar may also include multiple versions of an article, possibly preliminary, which you may be able to access.
How do I search by author? Enter the author's name in quotations: "d knuth". To increase the number of results, use initials rather than the full first name.
If you're finding too many papers which mention the author, you can use the "author:" operator to search for specific authors. For example, you can try [author:knuth], [author:"d knuth"], or [author:"donald e knuth"].
How do I search by title? Put the paper's title in quotations: "A History of the China Sea." Google Scholar will automatically find the paper as well as other papers which mention it.
How do I find recent research on a particular topic? Just click on "Recent articles" on the right side of any results page, and your results will be re-sorted to help you find newer research more quickly. The new ordering considers factors like the prominence of the author's and journal's previous papers, as well as the full text of each article and how often it has been cited.
What does the Related Articles link do? For each Google Scholar search result, we try to automatically determine which articles in our index are most closely related to it. You can see a list of these articles by clicking the "Related Articles" link that appears next to many results. The list of related articles is ranked primarily by how similar these articles are to the original result, but also takes into account the relevance of each paper. Finding sets of related papers and books is often a great way for novices to get acquainted with a topic. However, we've found that even experts can sometimes be surprised to discover related work in their area of expertise.
How do I search for papers in specific publications? Within the Advanced Search page, you can specify keywords which must appear in both the article and the publication name. See our Advanced Search Tips for more information.
How do I search by category? From the Advanced Search page, you can search for scholarly literature within seven broad areas of research. Simply check the boxes for the subject areas you're interested in searching.
Why are there author names on the left hand side of my results page? We automatically suggest authors related to your query – just click on an author's name and you'll see their papers. Finding authors who publish on the topics you're interested in is often a great way to get better acquainted with a field and discover related work you may not have found otherwise.
FORM
ATTING
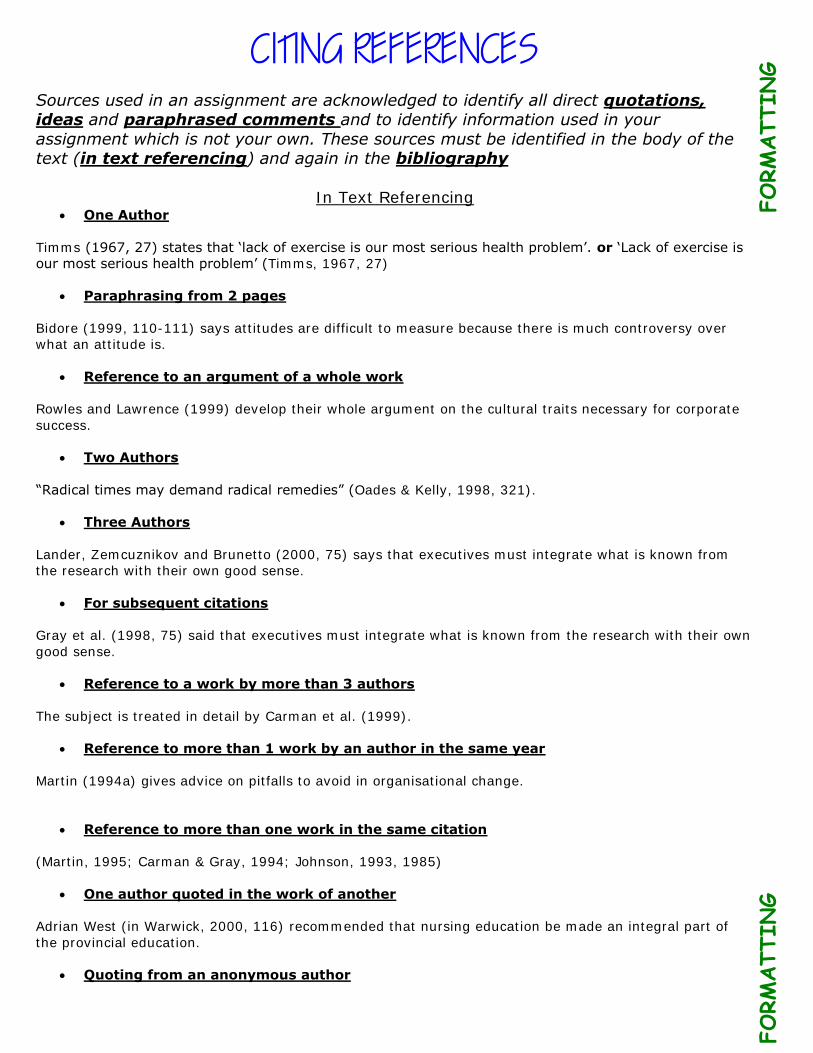
Sources used in an assignment are acknowledged to identify all direct quotations, ideas and paraphrased comments and to identify information used in your
assignment which is not your own. These sources must be identified in the body of the text (in text referencing) and again in the bibliography
In Text Referencing One Author
Timms (1967, 27) states that „lack of exercise is our most serious health problem‟. or „Lack of exercise is
our most serious health problem‟ (Timms, 1967, 27)
Paraphrasing from 2 pages
Bidore (1999, 110-111) says attitudes are difficult to measure because there is much controversy over
what an attitude is.
Reference to an argument of a whole work
Rowles and Lawrence (1999) develop their whole argument on the cultural traits necessary for corporate
success.
Two Authors
“Radical times may demand radical remedies” (Oades & Kelly, 1998, 321).
Three Authors
Lander, Zemcuznikov and Brunetto (2000, 75) says that executives must integrate what is known from
the research with their own good sense.
For subsequent citations
Gray et al. (1998, 75) said that executives must integrate what is known from the research with their own
good sense.
Reference to a work by more than 3 authors
The subject is treated in detail by Carman et al. (1999).
Reference to more than 1 work by an author in the same year
Martin (1994a) gives advice on pitfalls to avoid in organisational change.
Reference to more than one work in the same citation
(Martin, 1995; Carman & Gray, 1994; Johnson, 1993, 1985)
One author quoted in the work of another
Adrian West (in Warwick, 2000, 116) recommended that nursing education be made an integral part of
the provincial education.
Quoting from an anonymous author
FORM
ATTING
FORM
ATTING
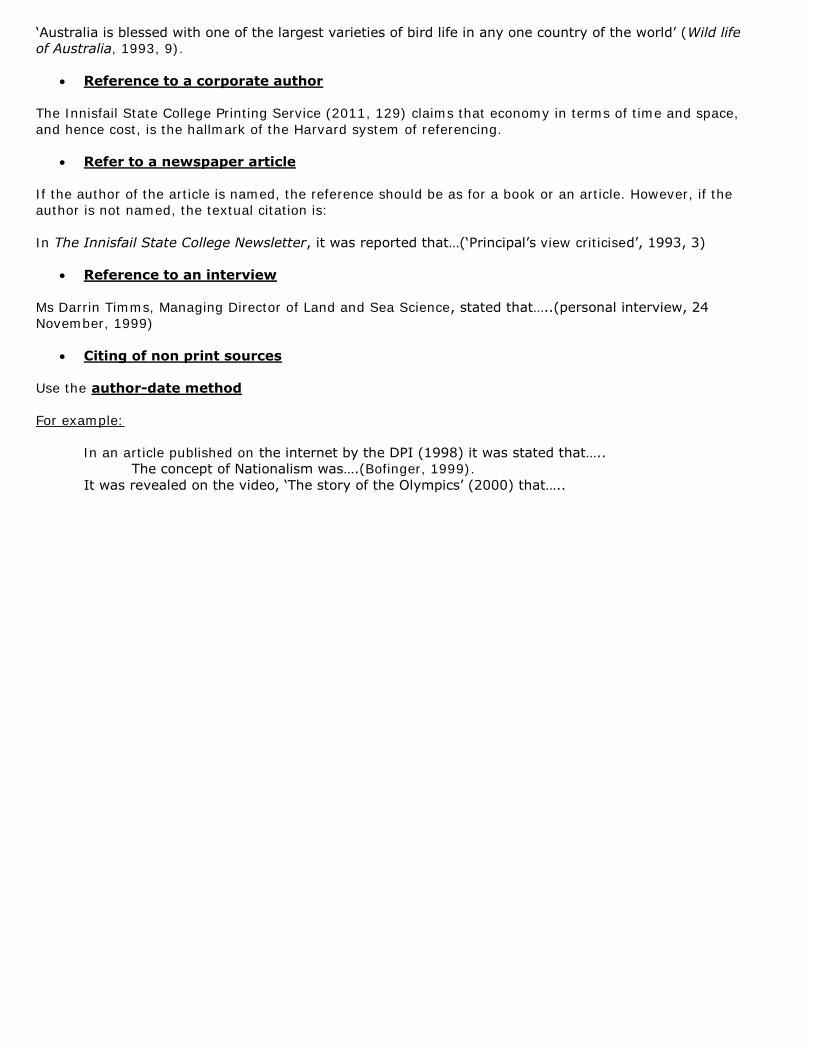
„Australia is blessed with one of the largest varieties of bird life in any one country of the world‟ (Wild life
of Australia, 1993, 9).
Reference to a corporate author
The Innisfail State College Printing Service (2011, 129) claims that economy in terms of time and space,
and hence cost, is the hallmark of the Harvard system of referencing.
Refer to a newspaper article
If the author of the article is named, the reference should be as for a book or an article. However, if the
author is not named, the textual citation is:
In The Innisfail State College Newsletter, it was reported that…(„Principal‟s view criticised‟, 1993, 3)
Reference to an interview
Ms Darrin Timms, Managing Director of Land and Sea Science, stated that…..(personal interview, 24
November, 1999)
Citing of non print sources
Use the author-date method
For example:
In an article published on the internet by the DPI (1998) it was stated that…..
The concept of Nationalism was….(Bofinger, 1999).
It was revealed on the video, „The story of the Olympics‟ (2000) that…..
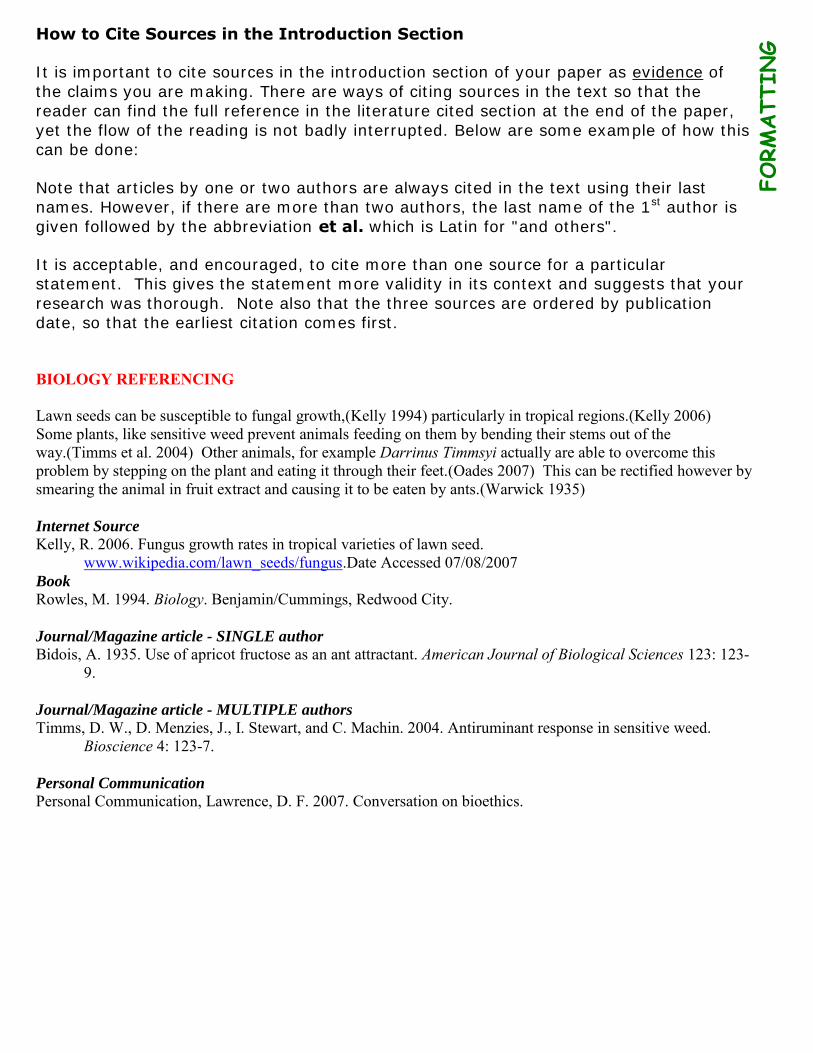
How to Cite Sources in the Introduction Section
It is important to cite sources in the introduction section of your paper as evidence of
the claims you are making. There are ways of citing sources in the text so that the reader can find the full reference in the literature cited section at the end of the paper,
yet the flow of the reading is not badly interrupted. Below are some example of how this can be done:
Note that articles by one or two authors are always cited in the text using their last names. However, if there are more than two authors, the last name of the 1st author is
given followed by the abbreviation et al. which is Latin for "and others".
It is acceptable, and encouraged, to cite more than one source for a particular statement. This gives the statement more validity in its context and suggests that your
research was thorough. Note also that the three sources are ordered by publication date, so that the earliest citation comes first.
BIOLOGY REFERENCING Lawn seeds can be susceptible to fungal growth,(Kelly 1994) particularly in tropical regions.(Kelly 2006) Some plants, like sensitive weed prevent animals feeding on them by bending their stems out of the way.(Timms et al. 2004) Other animals, for example Darrinus Timmsyi actually are able to overcome this problem by stepping on the plant and eating it through their feet.(Oades 2007) This can be rectified however by smearing the animal in fruit extract and causing it to be eaten by ants.(Warwick 1935) Internet Source
Kelly, R. 2006. Fungus growth rates in tropical varieties of lawn seed. www.wikipedia.com/lawn_seeds/fungus.Date Accessed 07/08/2007
Book
Rowles, M. 1994. Biology. Benjamin/Cummings, Redwood City. Journal/Magazine article - SINGLE author
Bidois, A. 1935. Use of apricot fructose as an ant attractant. American Journal of Biological Sciences 123: 123-9.
Journal/Magazine article - MULTIPLE authors
Timms, D. W., D. Menzies, J., I. Stewart, and C. Machin. 2004. Antiruminant response in sensitive weed. Bioscience 4: 123-7.
Personal Communication
Personal Communication, Lawrence, D. F. 2007. Conversation on bioethics.
FORM
ATTING
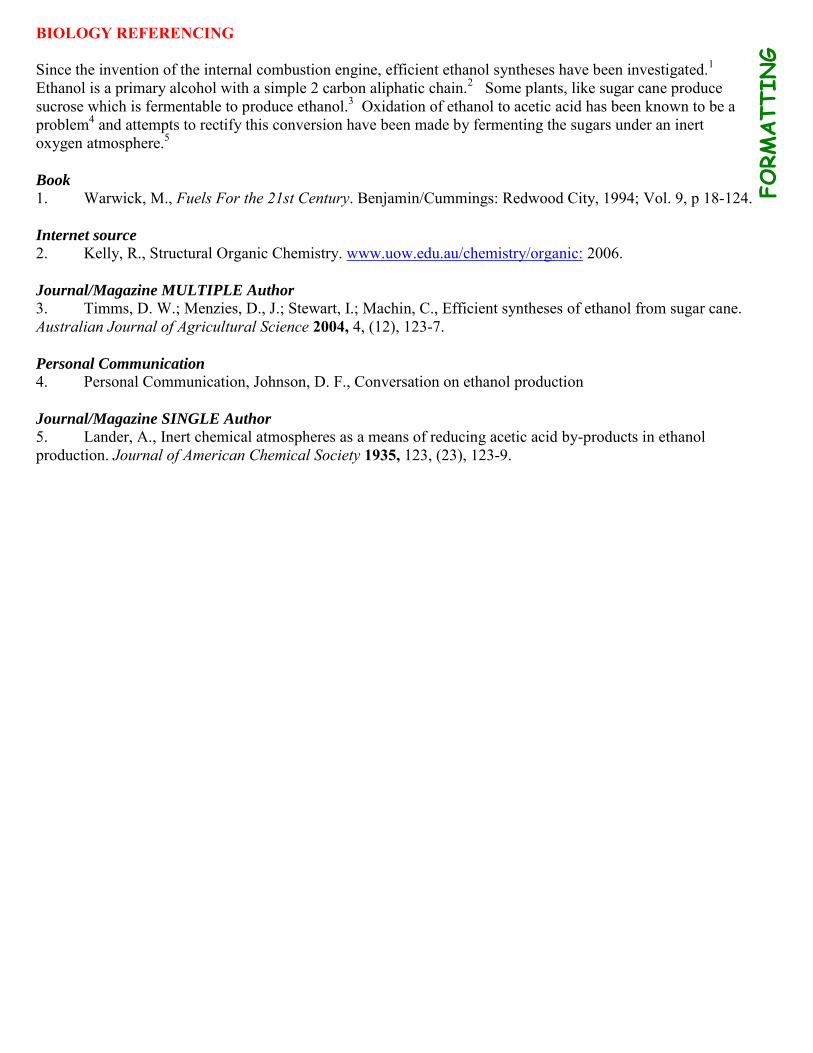
BIOLOGY REFERENCING Since the invention of the internal combustion engine, efficient ethanol syntheses have been investigated.1 Ethanol is a primary alcohol with a simple 2 carbon aliphatic chain.2 Some plants, like sugar cane produce sucrose which is fermentable to produce ethanol.3 Oxidation of ethanol to acetic acid has been known to be a problem4 and attempts to rectify this conversion have been made by fermenting the sugars under an inert oxygen atmosphere.5 Book
1. Warwick, M., Fuels For the 21st Century. Benjamin/Cummings: Redwood City, 1994; Vol. 9, p 18-124. Internet source
2. Kelly, R., Structural Organic Chemistry. www.uow.edu.au/chemistry/organic: 2006. Journal/Magazine MULTIPLE Author
3. Timms, D. W.; Menzies, D., J.; Stewart, I.; Machin, C., Efficient syntheses of ethanol from sugar cane. Australian Journal of Agricultural Science 2004, 4, (12), 123-7. Personal Communication
4. Personal Communication, Johnson, D. F., Conversation on ethanol production Journal/Magazine SINGLE Author
5. Lander, A., Inert chemical atmospheres as a means of reducing acetic acid by-products in ethanol production. Journal of American Chemical Society 1935, 123, (23), 123-9.
FORM
ATTING
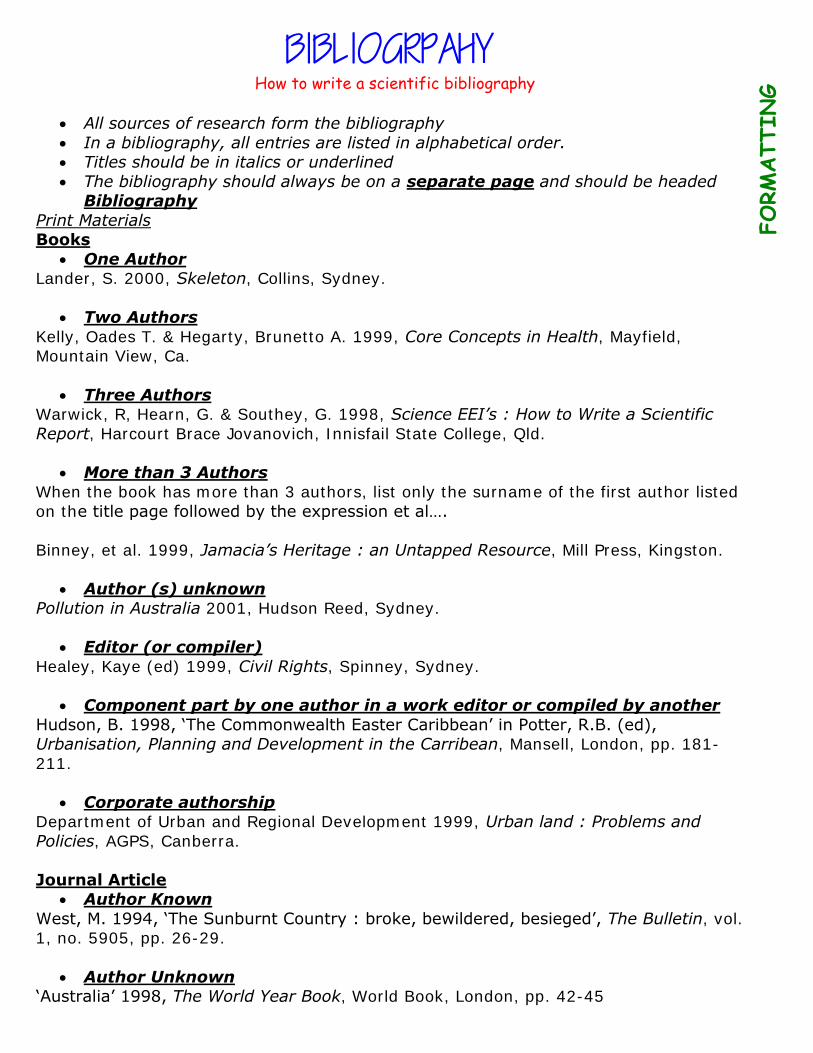
How to write a scientific bibliography
All sources of research form the bibliography
In a bibliography, all entries are listed in alphabetical order. Titles should be in italics or underlined
The bibliography should always be on a separate page and should be headed Bibliography
Print Materials Books
One Author Lander, S. 2000, Skeleton, Collins, Sydney.
Two Authors
Kelly, Oades T. & Hegarty, Brunetto A. 1999, Core Concepts in Health, Mayfield, Mountain View, Ca.
Three Authors Warwick, R, Hearn, G. & Southey, G. 1998, Science EEI’s : How to Write a Scientific
Report, Harcourt Brace Jovanovich, Innisfail State College, Qld.
More than 3 Authors When the book has more than 3 authors, list only the surname of the first author listed
on the title page followed by the expression et al….
Binney, et al. 1999, Jamacia’s Heritage : an Untapped Resource, Mill Press, Kingston.
Author (s) unknown Pollution in Australia 2001, Hudson Reed, Sydney.
Editor (or compiler)
Healey, Kaye (ed) 1999, Civil Rights, Spinney, Sydney.
Component part by one author in a work editor or compiled by another
Hudson, B. 1998, „The Commonwealth Easter Caribbean‟ in Potter, R.B. (ed), Urbanisation, Planning and Development in the Carribean, Mansell, London, pp. 181-
211.
Corporate authorship Department of Urban and Regional Development 1999, Urban land : Problems and
Policies, AGPS, Canberra.
Journal Article Author Known
West, M. 1994, „The Sunburnt Country : broke, bewildered, besieged‟, The Bulletin, vol. 1, no. 5905, pp. 26-29.
Author Unknown „Australia‟ 1998, The World Year Book, World Book, London, pp. 42-45
FORM
ATTING
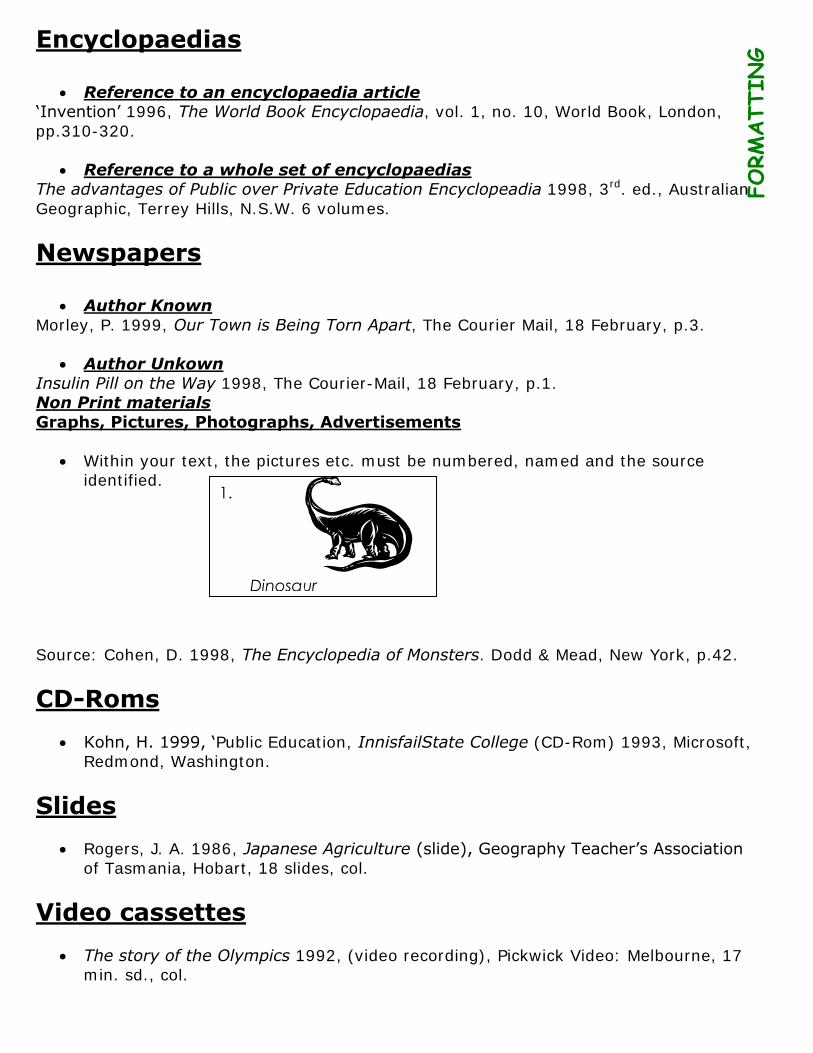
1. Dinosaur
Encyclopaedias
Reference to an encyclopaedia article „Invention‟ 1996, The World Book Encyclopaedia, vol. 1, no. 10, World Book, London,
pp.310-320.
Reference to a whole set of encyclopaedias The advantages of Public over Private Education Encyclopeadia 1998, 3rd. ed., Australian
Geographic, Terrey Hills, N.S.W. 6 volumes.
Newspapers
Author Known
Morley, P. 1999, Our Town is Being Torn Apart, The Courier Mail, 18 February, p.3.
Author Unkown
Insulin Pill on the Way 1998, The Courier-Mail, 18 February, p.1. Non Print materials
Graphs, Pictures, Photographs, Advertisements
Within your text, the pictures etc. must be numbered, named and the source identified.
Source: Cohen, D. 1998, The Encyclopedia of Monsters. Dodd & Mead, New York, p.42.
CD-Roms
Kohn, H. 1999, „Public Education, InnisfailState College (CD-Rom) 1993, Microsoft, Redmond, Washington.
Slides Rogers, J. A. 1986, Japanese Agriculture (slide), Geography Teacher‟s Association
of Tasmania, Hobart, 18 slides, col.
Video cassettes
The story of the Olympics 1992, (video recording), Pickwick Video: Melbourne, 17 min. sd., col.
FORM
ATTING
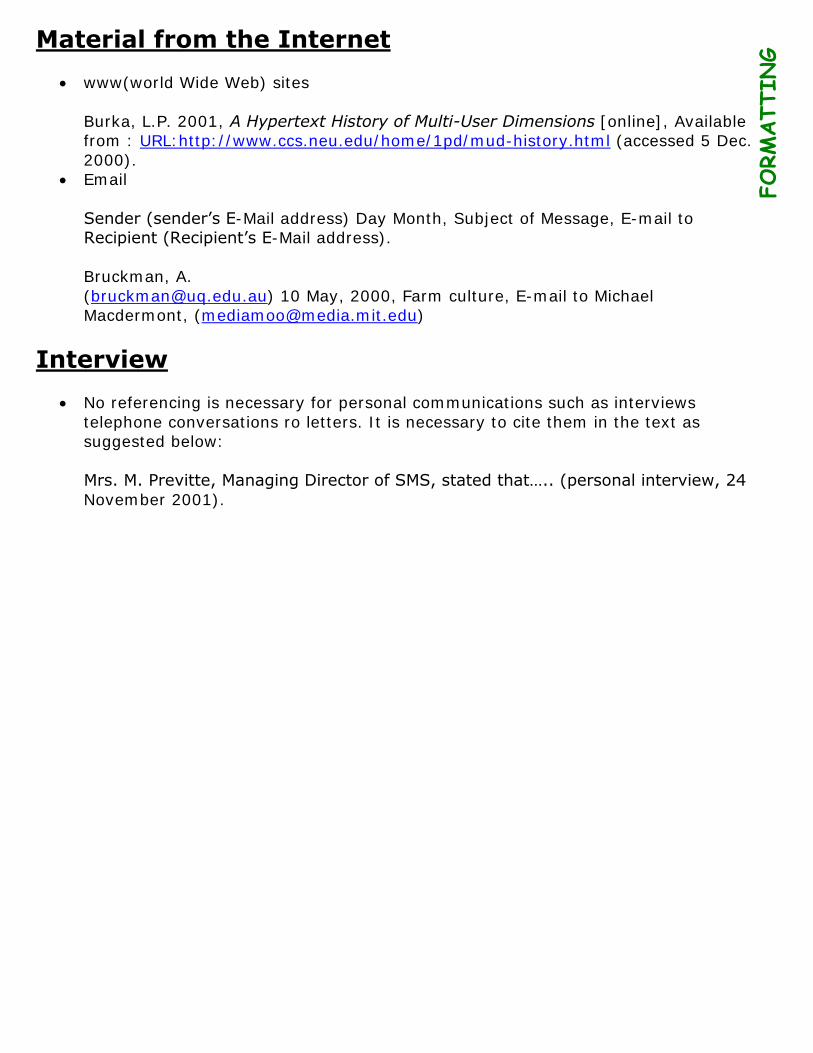
Material from the Internet
www(world Wide Web) sites
Burka, L.P. 2001, A Hypertext History of Multi-User Dimensions [online], Available from : URL:http://www.ccs.neu.edu/home/1pd/mud-history.html (accessed 5 Dec.
2000). Email
Sender (sender‟s E-Mail address) Day Month, Subject of Message, E-mail to Recipient (Recipient‟s E-Mail address).
Bruckman, A.
([email protected]) 10 May, 2000, Farm culture, E-mail to Michael Macdermont, ([email protected])
Interview No referencing is necessary for personal communications such as interviews
telephone conversations ro letters. It is necessary to cite them in the text as suggested below:
Mrs. M. Previtte, Managing Director of SMS, stated that….. (personal interview, 24
November 2001).
FORM
ATTING
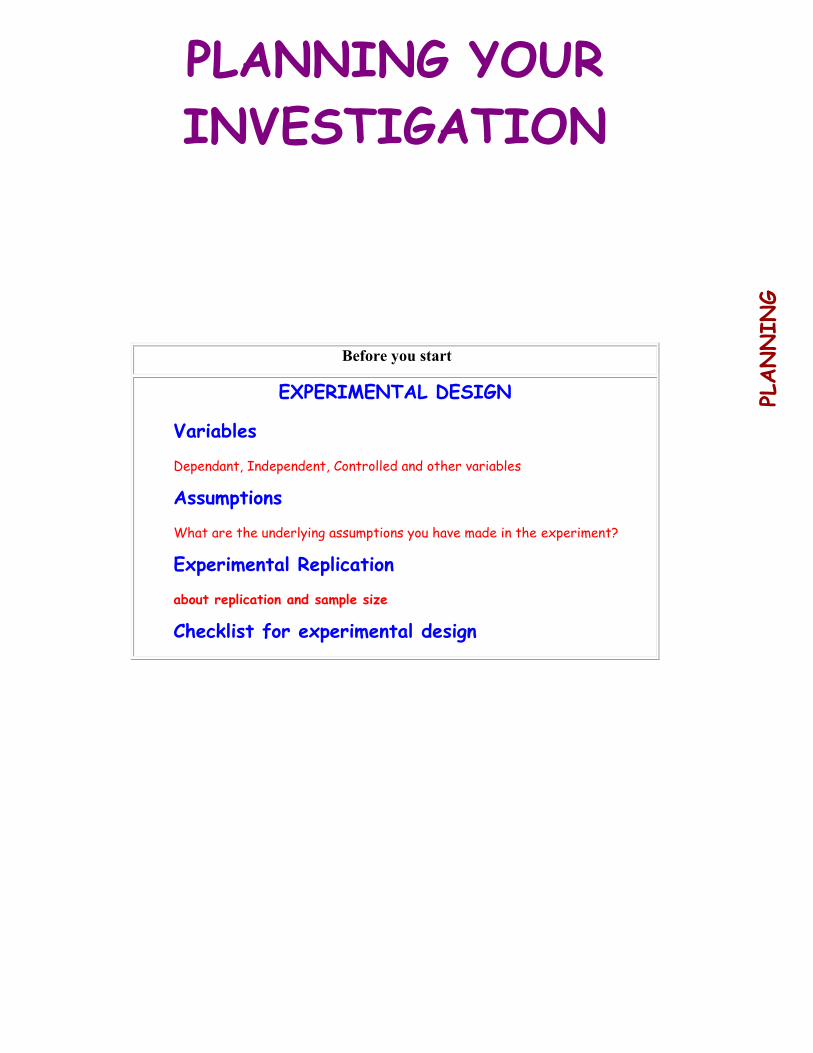
PLANNING YOUR
INVESTIGATION
Before you start
EXPERIMENTAL DESIGN
Variables
Dependant, Independent, Controlled and other variables
Assumptions
What are the underlying assumptions you have made in the experiment?
Experimental Replication
about replication and sample size
Checklist for experimental design
PLANNING
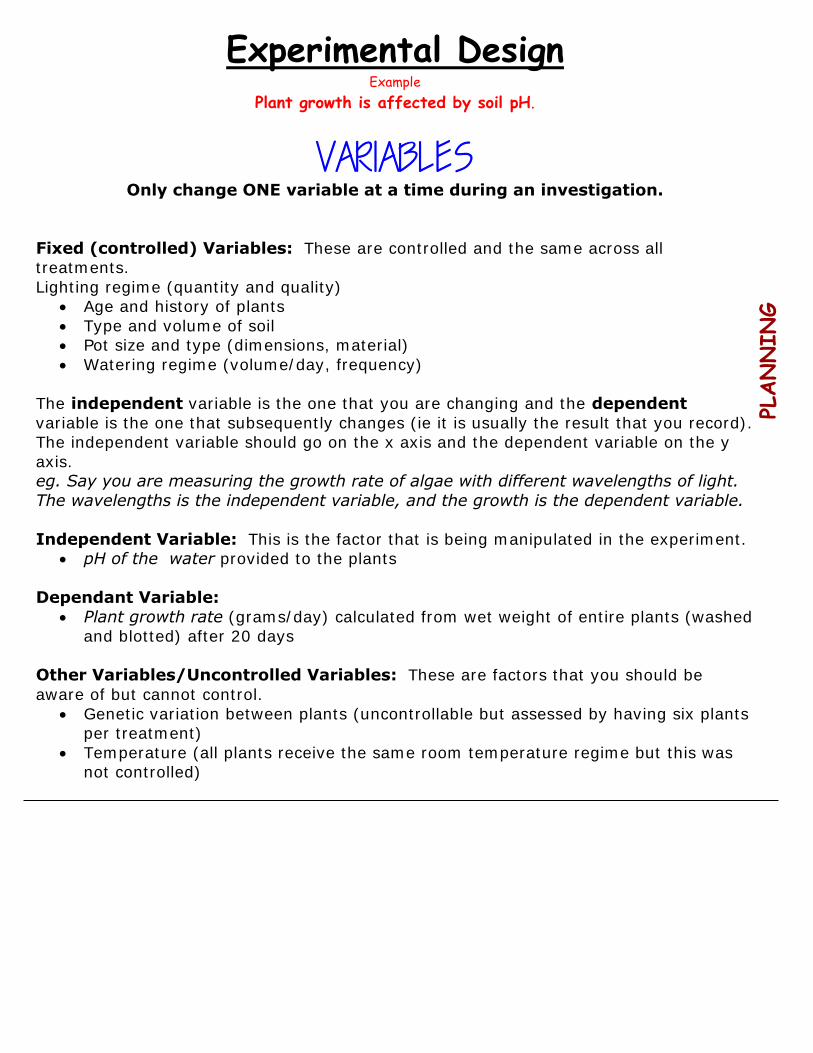
Experimental Design Example
Plant growth is affected by soil pH.
Only change ONE variable at a time during an investigation.
Fixed (controlled) Variables: These are controlled and the same across all treatments.
Lighting regime (quantity and quality) Age and history of plants
Type and volume of soil Pot size and type (dimensions, material)
Watering regime (volume/day, frequency)
The independent variable is the one that you are changing and the dependent
variable is the one that subsequently changes (ie it is usually the result that you record). The independent variable should go on the x axis and the dependent variable on the y
axis. eg. Say you are measuring the growth rate of algae with different wavelengths of light.
The wavelengths is the independent variable, and the growth is the dependent variable.
Independent Variable: This is the factor that is being manipulated in the experiment. pH of the water provided to the plants
Dependant Variable:
Plant growth rate (grams/day) calculated from wet weight of entire plants (washed and blotted) after 20 days
Other Variables/Uncontrolled Variables: These are factors that you should be
aware of but cannot control.
Genetic variation between plants (uncontrollable but assessed by having six plants per treatment)
Temperature (all plants receive the same room temperature regime but this was not controlled)
PLANNING
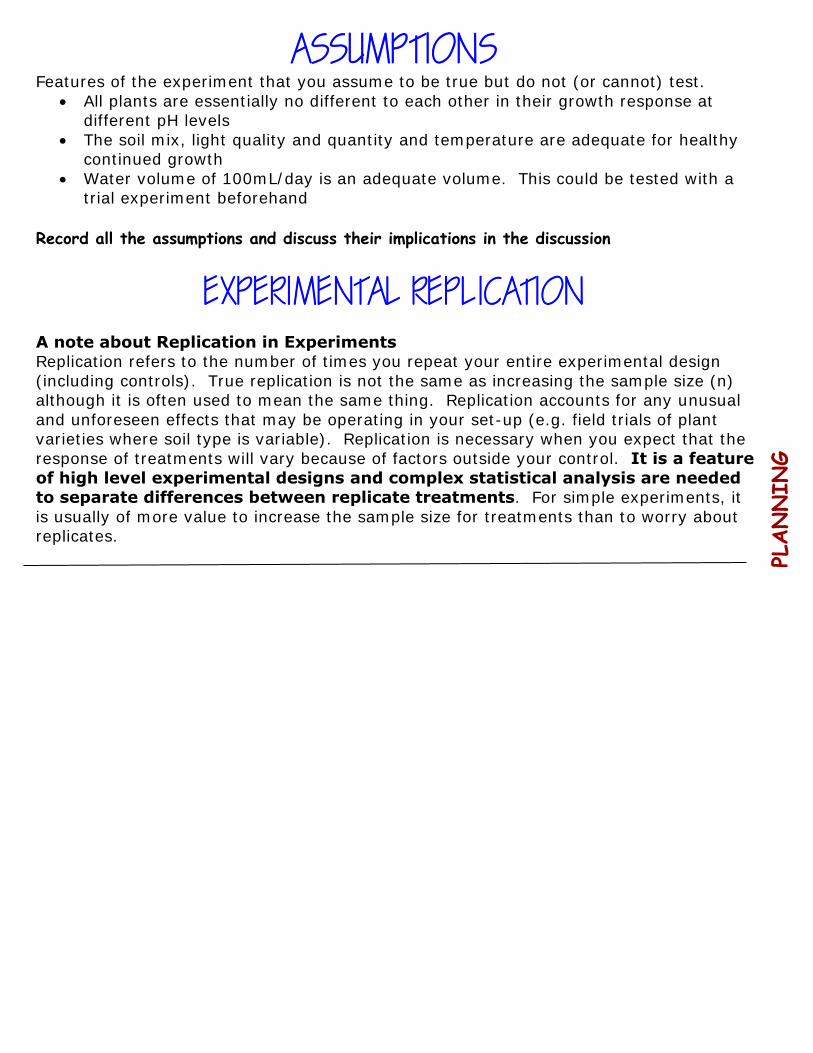
Features of the experiment that you assume to be true but do not (or cannot) test.
All plants are essentially no different to each other in their growth response at different pH levels
The soil mix, light quality and quantity and temperature are adequate for healthy continued growth
Water volume of 100mL/day is an adequate volume. This could be tested with a trial experiment beforehand
Record all the assumptions and discuss their implications in the discussion
A note about Replication in Experiments Replication refers to the number of times you repeat your entire experimental design
(including controls). True replication is not the same as increasing the sample size (n) although it is often used to mean the same thing. Replication accounts for any unusual
and unforeseen effects that may be operating in your set-up (e.g. field trials of plant varieties where soil type is variable). Replication is necessary when you expect that the
response of treatments will vary because of factors outside your control. It is a feature
of high level experimental designs and complex statistical analysis are needed to separate differences between replicate treatments. For simple experiments, it
is usually of more value to increase the sample size for treatments than to worry about replicates.
PLANNING
WRITING YOUR REPORT
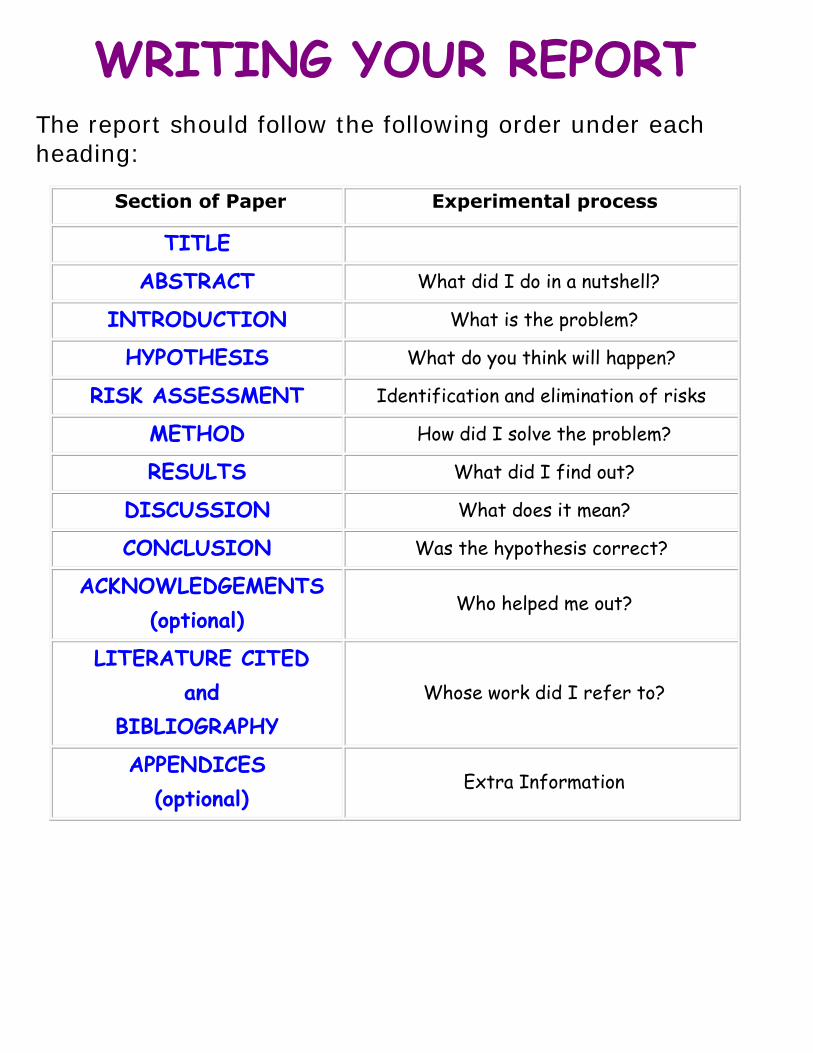
The report should follow the following order under each heading:
Section of Paper Experimental process
TITLE
ABSTRACT What did I do in a nutshell?
INTRODUCTION What is the problem?
HYPOTHESIS What do you think will happen?
RISK ASSESSMENT Identification and elimination of risks
METHOD How did I solve the problem?
RESULTS What did I find out?
DISCUSSION What does it mean?
CONCLUSION Was the hypothesis correct?
ACKNOWLEDGEMENTS
(optional) Who helped me out?
LITERATURE CITED
and
BIBLIOGRAPHY
Whose work did I refer to?
APPENDICES
(optional) Extra Information
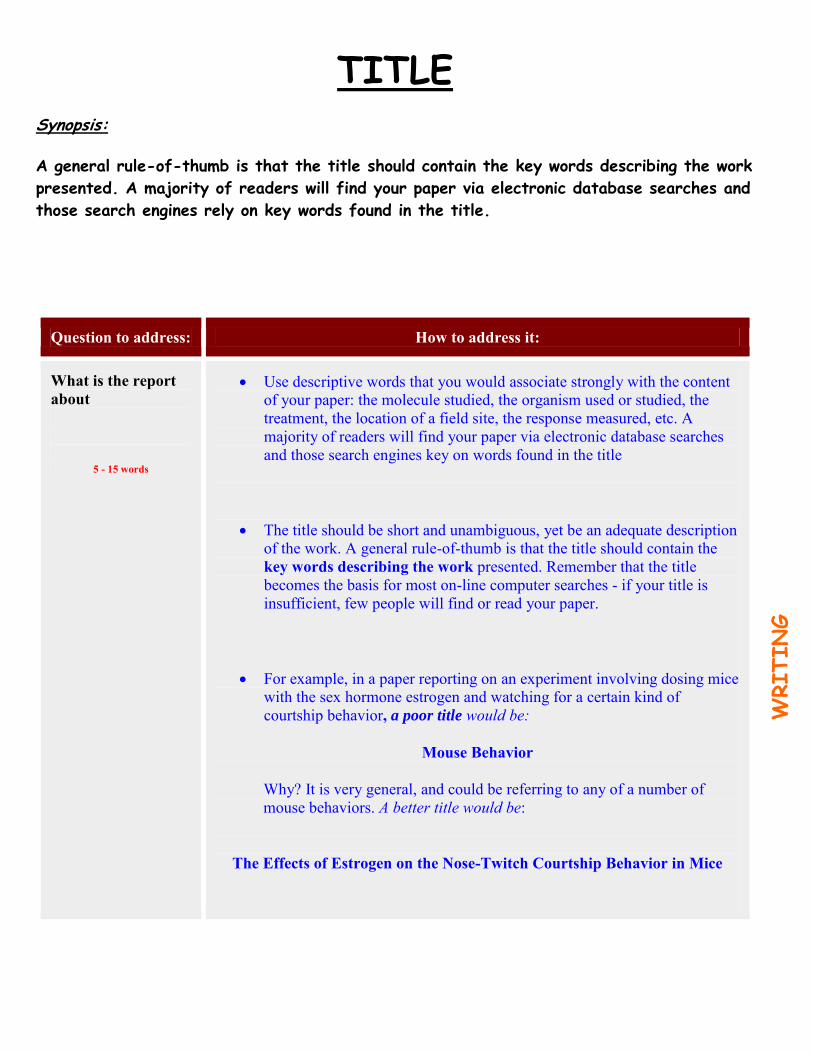
TITLE Synopsis:
A general rule-of-thumb is that the title should contain the key words describing the work
presented. A majority of readers will find your paper via electronic database searches and
those search engines rely on key words found in the title.
Question to address: How to address it:
What is the report about
5 - 15 words
Use descriptive words that you would associate strongly with the content of your paper: the molecule studied, the organism used or studied, the treatment, the location of a field site, the response measured, etc. A majority of readers will find your paper via electronic database searches and those search engines key on words found in the title
The title should be short and unambiguous, yet be an adequate description of the work. A general rule-of-thumb is that the title should contain the key words describing the work presented. Remember that the title becomes the basis for most on-line computer searches - if your title is insufficient, few people will find or read your paper.
For example, in a paper reporting on an experiment involving dosing mice with the sex hormone estrogen and watching for a certain kind of courtship behavior, a poor title would be:
Mouse Behavior
Why? It is very general, and could be referring to any of a number of mouse behaviors. A better title would be:
The Effects of Estrogen on the Nose-Twitch Courtship Behavior in Mice
WRITING
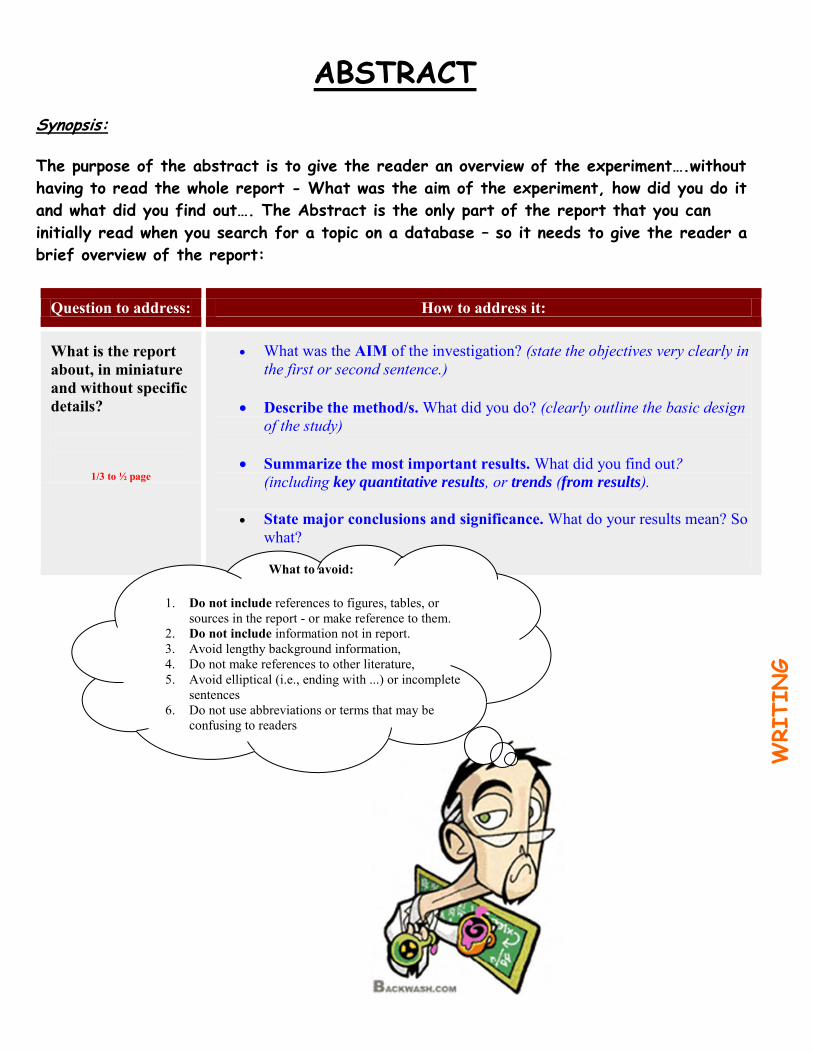
ABSTRACT Synopsis:
The purpose of the abstract is to give the reader an overview of the experiment….without
having to read the whole report - What was the aim of the experiment, how did you do it
and what did you find out…. The Abstract is the only part of the report that you can
initially read when you search for a topic on a database – so it needs to give the reader a
brief overview of the report:
Question to address: How to address it:
What is the report about, in miniature and without specific details?
1/3 to ½ page
What was the AIM of the investigation? (state the objectives very clearly in the first or second sentence.)
Describe the method/s. What did you do? (clearly outline the basic design of the study)
Summarize the most important results. What did you find out? (including key quantitative results, or trends (from results).
State major conclusions and significance. What do your results mean? So what?
What to avoid:
1. Do not include references to figures, tables, or sources in the report - or make reference to them.
2. Do not include information not in report. 3. Avoid lengthy background information, 4. Do not make references to other literature, 5. Avoid elliptical (i.e., ending with ...) or incomplete
sentences 6. Do not use abbreviations or terms that may be
confusing to readers
WRITING
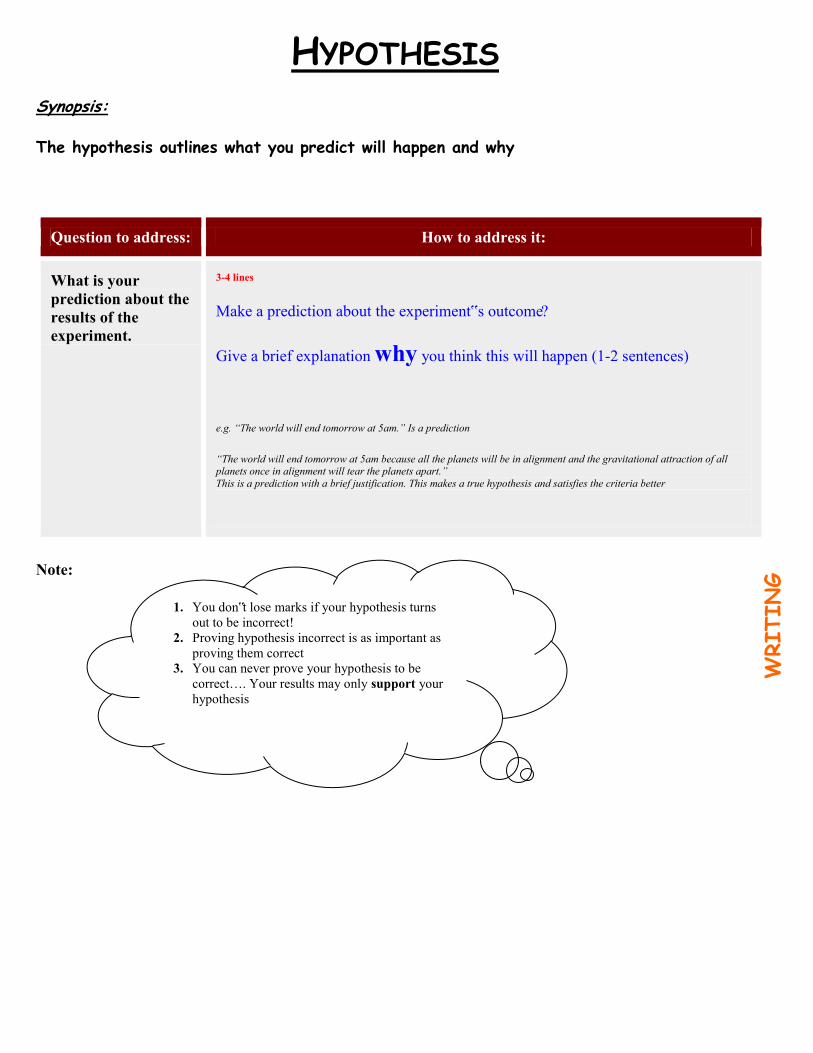
HYPOTHESIS Synopsis:
The hypothesis outlines what you predict will happen and why
Question to address: How to address it:
What is your prediction about the results of the experiment.
3-4 lines
Make a prediction about the experiment‟s outcome?
Give a brief explanation why you think this will happen (1-2 sentences)
e.g. “The world will end tomorrow at 5am.” Is a prediction
“The world will end tomorrow at 5am because all the planets will be in alignment and the gravitational attraction of all planets once in alignment will tear the planets apart.” This is a prediction with a brief justification. This makes a true hypothesis and satisfies the criteria better
Note:
WRITING
1. You don‟t lose marks if your hypothesis turns out to be incorrect!
2. Proving hypothesis incorrect is as important as proving them correct
3. You can never prove your hypothesis to be correct…. Your results may only support your hypothesis
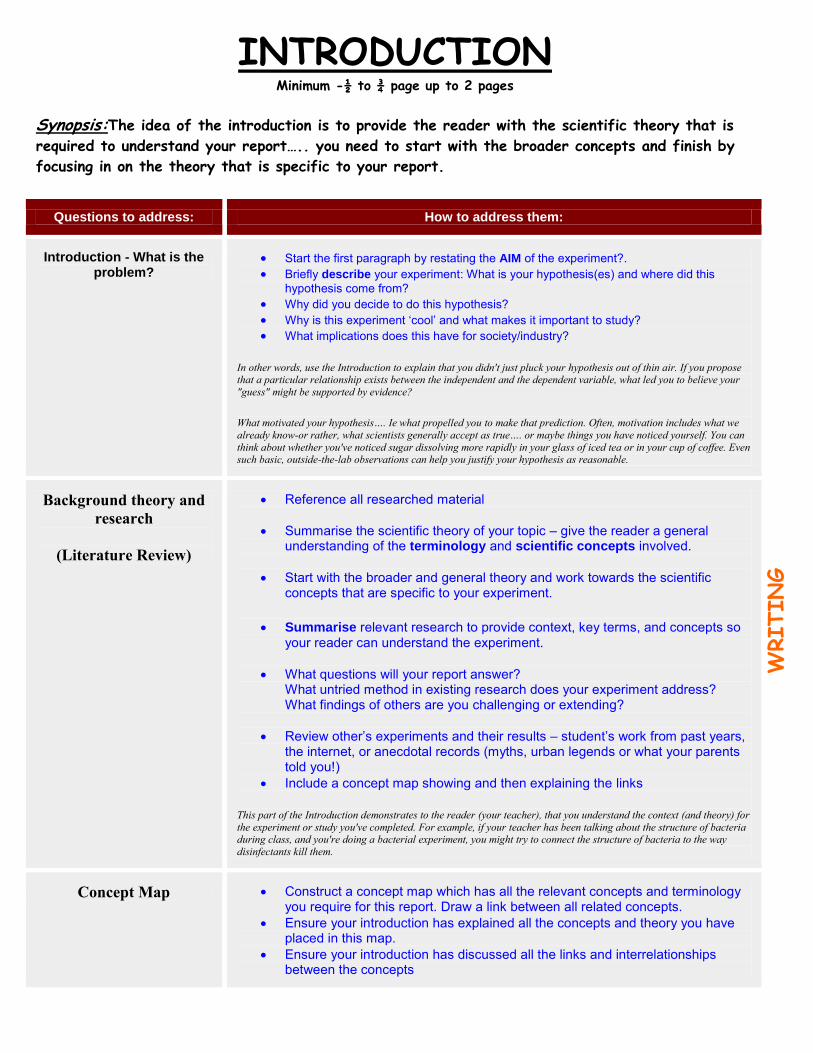
INTRODUCTION Minimum -½ to ¾ page up to 2 pages
Synopsis:The idea of the introduction is to provide the reader with the scientific theory that is
required to understand your report….. you need to start with the broader concepts and finish by
focusing in on the theory that is specific to your report.
Questions to address: How to address them:
Introduction - What is the problem?
Start the first paragraph by restating the AIM of the experiment?. Briefly describe your experiment: What is your hypothesis(es) and where did this
hypothesis come from? Why did you decide to do this hypothesis? Why is this experiment ‘cool’ and what makes it important to study? What implications does this have for society/industry?
In other words, use the Introduction to explain that you didn't just pluck your hypothesis out of thin air. If you propose that a particular relationship exists between the independent and the dependent variable, what led you to believe your "guess" might be supported by evidence?
What motivated your hypothesis…. Ie what propelled you to make that prediction. Often, motivation includes what we already know-or rather, what scientists generally accept as true…. or maybe things you have noticed yourself. You can think about whether you've noticed sugar dissolving more rapidly in your glass of iced tea or in your cup of coffee. Even such basic, outside-the-lab observations can help you justify your hypothesis as reasonable.
Background theory and research
(Literature Review)
Reference all researched material
Summarise the scientific theory of your topic – give the reader a general understanding of the terminology and scientific concepts involved.
Start with the broader and general theory and work towards the scientific concepts that are specific to your experiment.
Summarise relevant research to provide context, key terms, and concepts so your reader can understand the experiment.
What questions will your report answer? What untried method in existing research does your experiment address? What findings of others are you challenging or extending?
Review other’s experiments and their results – student’s work from past years, the internet, or anecdotal records (myths, urban legends or what your parents told you!)
Include a concept map showing and then explaining the links
This part of the Introduction demonstrates to the reader (your teacher), that you understand the context (and theory) for the experiment or study you've completed. For example, if your teacher has been talking about the structure of bacteria during class, and you're doing a bacterial experiment, you might try to connect the structure of bacteria to the way disinfectants kill them.
Concept Map Construct a concept map which has all the relevant concepts and terminology you require for this report. Draw a link between all related concepts.
Ensure your introduction has explained all the concepts and theory you have placed in this map.
Ensure your introduction has discussed all the links and interrelationships between the concepts
WRITING
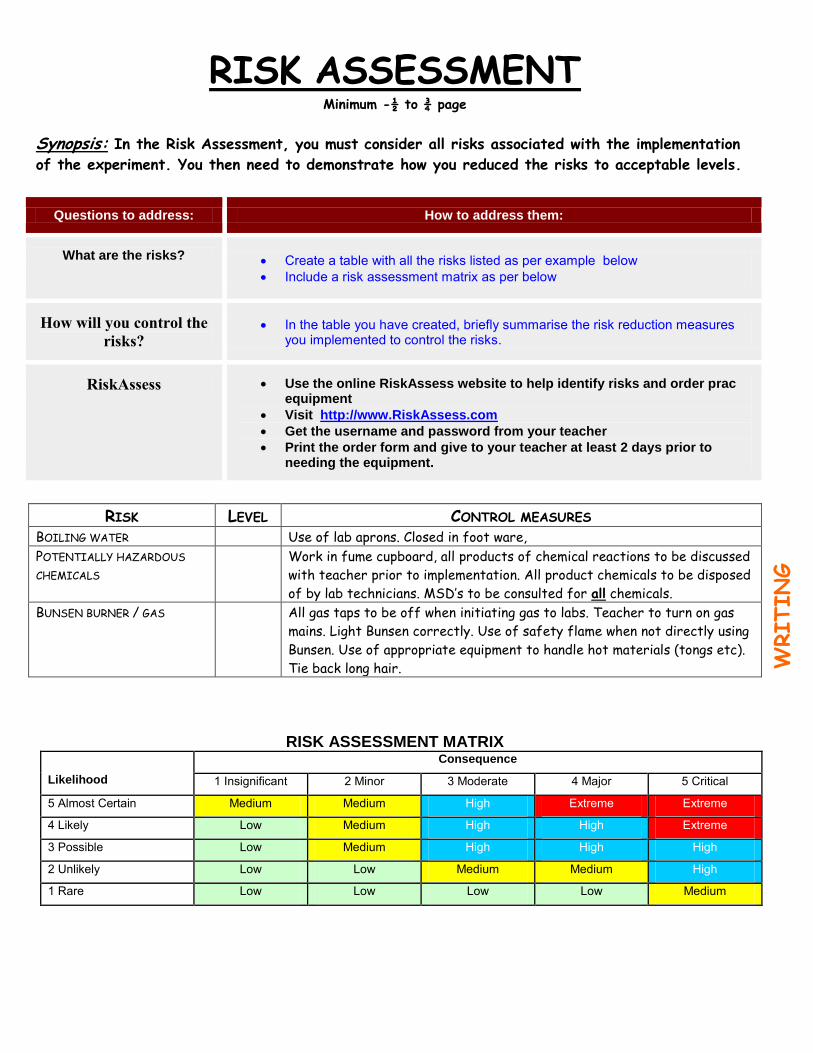
RISK ASSESSMENT Minimum -½ to ¾ page
Synopsis: In the Risk Assessment, you must consider all risks associated with the implementation
of the experiment. You then need to demonstrate how you reduced the risks to acceptable levels.
Questions to address: How to address them:
What are the risks? Create a table with all the risks listed as per example below Include a risk assessment matrix as per below
How will you control the risks?
In the table you have created, briefly summarise the risk reduction measures you implemented to control the risks.
RiskAssess Use the online RiskAssess website to help identify risks and order prac equipment
Visit http://www.RiskAssess.com
Get the username and password from your teacher
Print the order form and give to your teacher at least 2 days prior to needing the equipment.
RISK LEVEL CONTROL MEASURES
BOILING WATER Use of lab aprons. Closed in foot ware,
POTENTIALLY HAZARDOUS
CHEMICALS
Work in fume cupboard, all products of chemical reactions to be discussed
with teacher prior to implementation. All product chemicals to be disposed
of by lab technicians. MSD’s to be consulted for all chemicals.
BUNSEN BURNER / GAS All gas taps to be off when initiating gas to labs. Teacher to turn on gas
mains. Light Bunsen correctly. Use of safety flame when not directly using
Bunsen. Use of appropriate equipment to handle hot materials (tongs etc).
Tie back long hair.
RISK ASSESSMENT MATRIX
Likelihood
Consequence
1 Insignificant 2 Minor 3 Moderate 4 Major 5 Critical
5 Almost Certain Medium Medium High Extreme Extreme
4 Likely Low Medium High High Extreme
3 Possible Low Medium High High High
2 Unlikely Low Low Medium Medium High
1 Rare Low Low Low Low Medium
WRITING
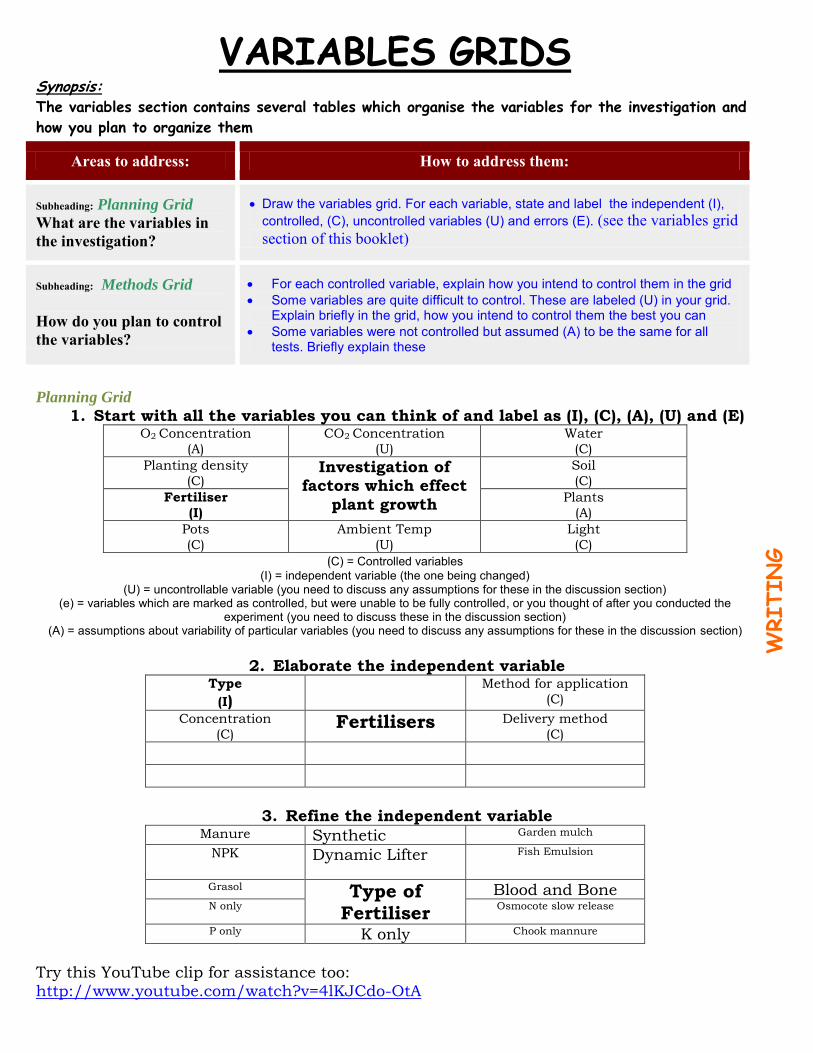
VARIABLES GRIDS Synopsis: The variables section contains several tables which organise the variables for the investigation and
how you plan to organize them
Areas to address: How to address them:
Subheading: Planning Grid What are the variables in the investigation?
Draw the variables grid. For each variable, state and label the independent (I), controlled, (C), uncontrolled variables (U) and errors (E). (see the variables grid section of this booklet)
Subheading: Methods Grid How do you plan to control the variables?
For each controlled variable, explain how you intend to control them in the grid Some variables are quite difficult to control. These are labeled (U) in your grid.
Explain briefly in the grid, how you intend to control them the best you can Some variables were not controlled but assumed (A) to be the same for all
tests. Briefly explain these
Planning Grid
1. Start with all the variables you can think of and label as (I), (C), (A), (U) and (E) O2 Concentration
(A)
CO2 Concentration
(U)
Water
(C)
Planting density
(C) Investigation of
factors which effect
plant growth
Soil
(C)
Fertiliser
(I)
Plants
(A)
Pots
(C)
Ambient Temp
(U)
Light
(C)
(C) = Controlled variables (I) = independent variable (the one being changed)
(U) = uncontrollable variable (you need to discuss any assumptions for these in the discussion section) (e) = variables which are marked as controlled, but were unable to be fully controlled, or you thought of after you conducted the
experiment (you need to discuss these in the discussion section) (A) = assumptions about variability of particular variables (you need to discuss any assumptions for these in the discussion section)
2. Elaborate the independent variable
Type
(I) Method for application
(C)
Concentration
(C) Fertilisers Delivery method
(C)
3. Refine the independent variable
Manure Synthetic Garden mulch
NPK
Dynamic Lifter Fish Emulsion
Grasol Type of Fertiliser
Blood and Bone N only Osmocote slow release
P only K only Chook mannure
Try this YouTube clip for assistance too: http://www.youtube.com/watch?v=4lKJCdo-OtA
WRITING
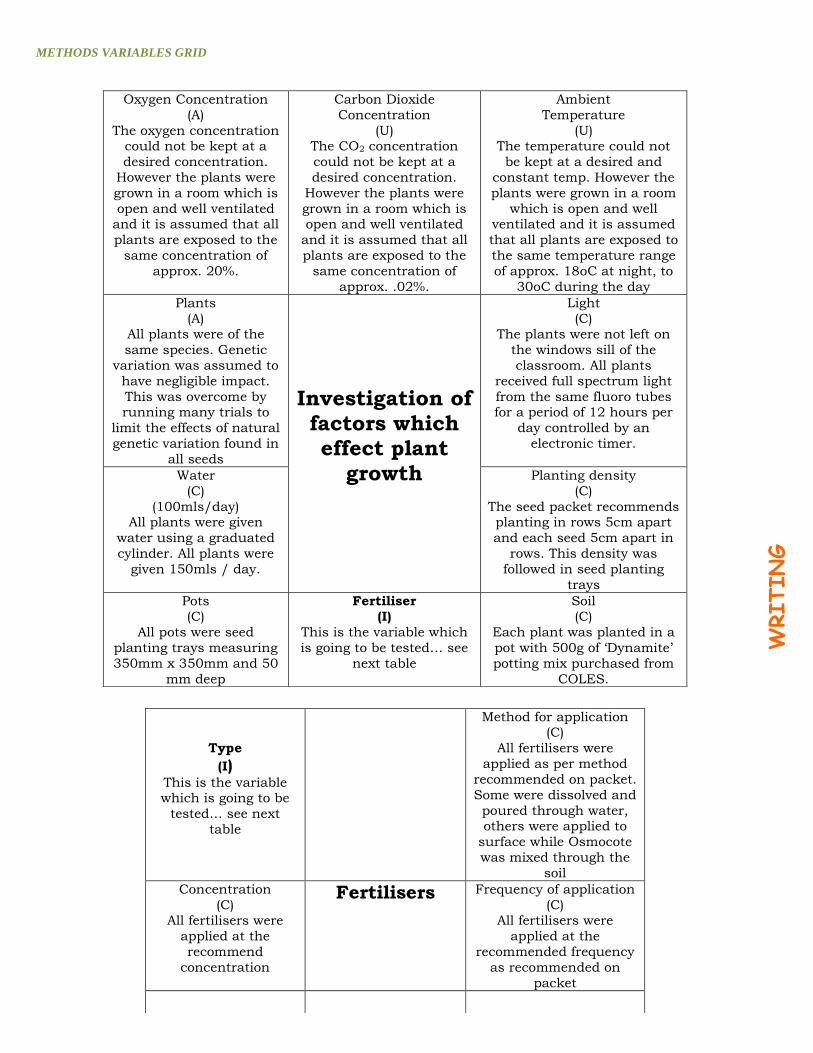
METHODS VARIABLES GRID
Oxygen Concentration
(A)
The oxygen concentration could not be kept at a
desired concentration.
However the plants were
grown in a room which is
open and well ventilated and it is assumed that all
plants are exposed to the
same concentration of
approx. 20%.
Carbon Dioxide
Concentration
(U) The CO2 concentration
could not be kept at a
desired concentration.
However the plants were
grown in a room which is open and well ventilated
and it is assumed that all
plants are exposed to the
same concentration of
approx. .02%.
Ambient
Temperature
(U) The temperature could not
be kept at a desired and
constant temp. However the
plants were grown in a room
which is open and well ventilated and it is assumed
that all plants are exposed to
the same temperature range
of approx. 18oC at night, to
30oC during the day
Plants
(A) All plants were of the
same species. Genetic
variation was assumed to
have negligible impact.
This was overcome by running many trials to
limit the effects of natural
genetic variation found in
all seeds
Investigation of
factors which effect plant
growth
Light
(C) The plants were not left on
the windows sill of the
classroom. All plants
received full spectrum light
from the same fluoro tubes for a period of 12 hours per
day controlled by an
electronic timer.
Water
(C)
(100mls/day) All plants were given
water using a graduated
cylinder. All plants were
given 150mls / day.
Planting density
(C)
The seed packet recommends planting in rows 5cm apart
and each seed 5cm apart in
rows. This density was
followed in seed planting
trays
Pots (C)
All pots were seed
planting trays measuring
350mm x 350mm and 50
mm deep
Fertiliser (I)
This is the variable which
is going to be tested… see
next table
Soil (C)
Each plant was planted in a
pot with 500g of ‘Dynamite’
potting mix purchased from
COLES.
Type
(I) This is the variable which is going to be
tested… see next
table
Method for application (C)
All fertilisers were
applied as per method
recommended on packet.
Some were dissolved and
poured through water, others were applied to
surface while Osmocote
was mixed through the
soil
Concentration
(C) All fertilisers were
applied at the
recommend
concentration
Fertilisers Frequency of application
(C) All fertilisers were
applied at the
recommended frequency
as recommended on
packet
WRITING
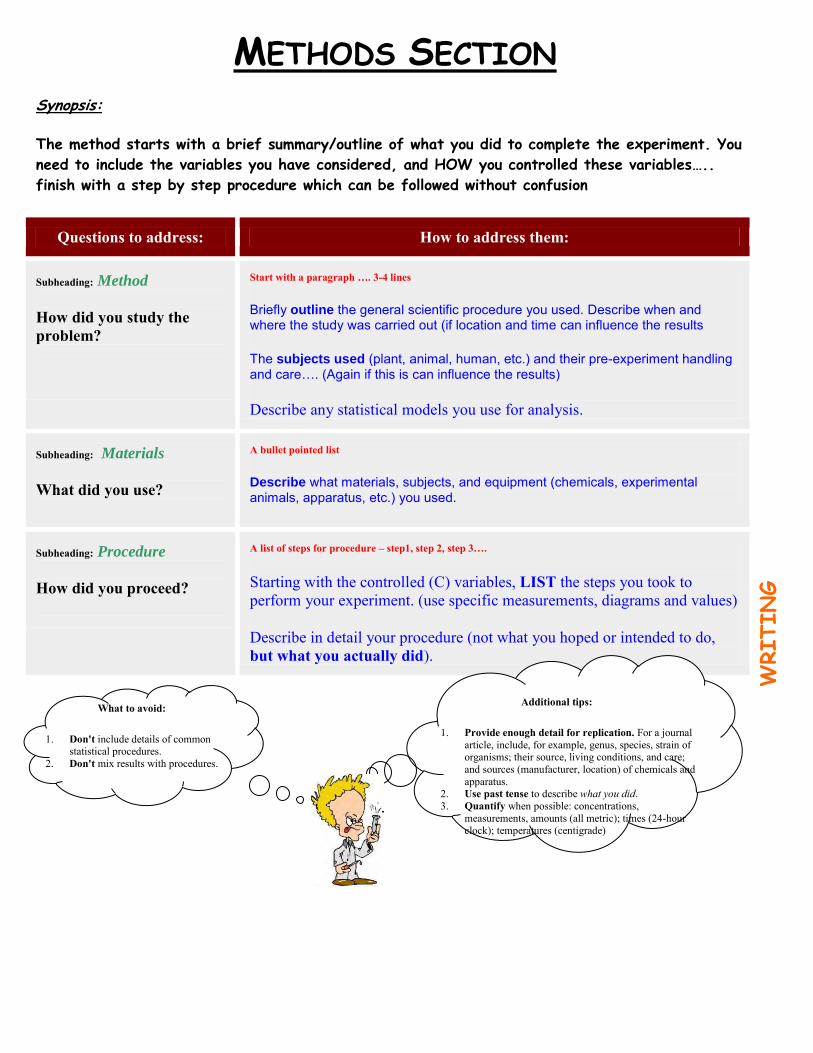
METHODS SECTION Synopsis:
The method starts with a brief summary/outline of what you did to complete the experiment. You
need to include the variables you have considered, and HOW you controlled these variables…..
finish with a step by step procedure which can be followed without confusion
Questions to address: How to address them:
Subheading: Method How did you study the problem?
Start with a paragraph …. 3-4 lines
Briefly outline the general scientific procedure you used. Describe when and where the study was carried out (if location and time can influence the results
The subjects used (plant, animal, human, etc.) and their pre-experiment handling and care…. (Again if this is can influence the results)
Describe any statistical models you use for analysis.
Subheading: Materials What did you use?
A bullet pointed list
Describe what materials, subjects, and equipment (chemicals, experimental animals, apparatus, etc.) you used.
Subheading: Procedure How did you proceed?
A list of steps for procedure – step1, step 2, step 3….
Starting with the controlled (C) variables, LIST the steps you took to perform your experiment. (use specific measurements, diagrams and values)
Describe in detail your procedure (not what you hoped or intended to do, but what you actually did).
Additional tips:
1. Provide enough detail for replication. For a journal article, include, for example, genus, species, strain of organisms; their source, living conditions, and care; and sources (manufacturer, location) of chemicals and apparatus.
2. Use past tense to describe what you did. 3. Quantify when possible: concentrations,
measurements, amounts (all metric); times (24-hour clock); temperatures (centigrade)
What to avoid:
1. Don't include details of common statistical procedures.
2. Don't mix results with procedures.
WRITING
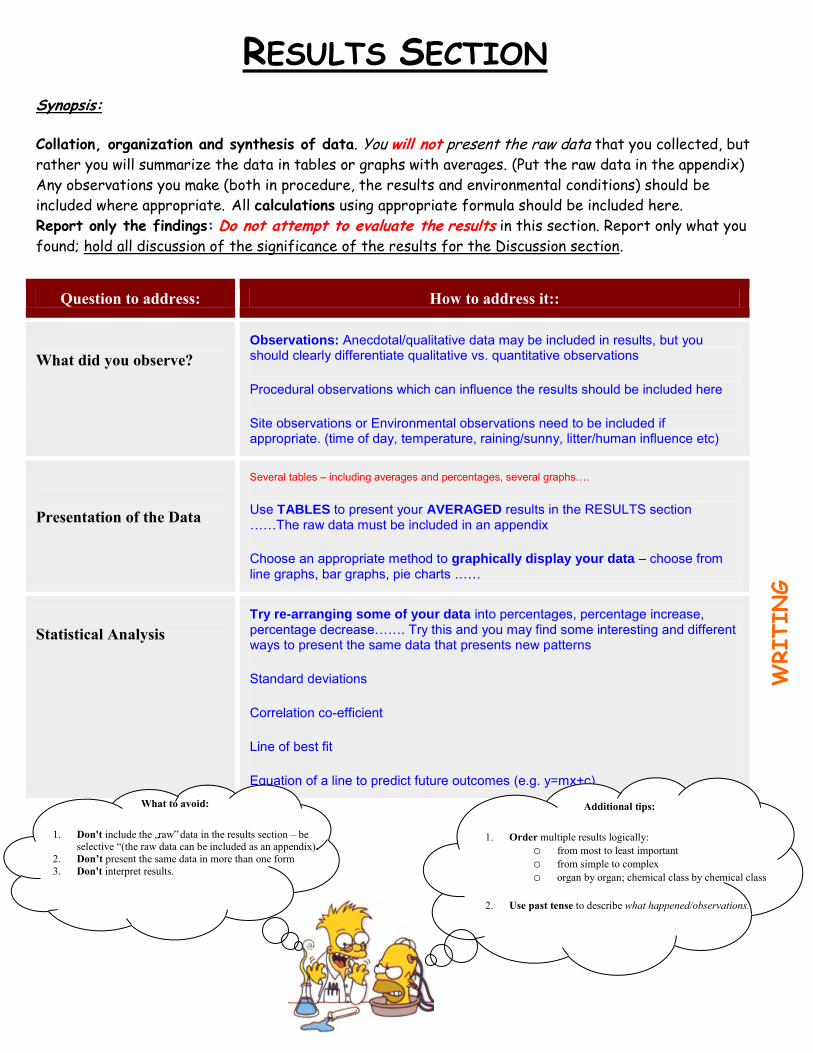
RESULTS SECTION Synopsis:
Collation, organization and synthesis of data. You will not present the raw data that you collected, but
rather you will summarize the data in tables or graphs with averages. (Put the raw data in the appendix)
Any observations you make (both in procedure, the results and environmental conditions) should be
included where appropriate. All calculations using appropriate formula should be included here.
Report only the findings: Do not attempt to evaluate the results in this section. Report only what you
found; hold all discussion of the significance of the results for the Discussion section.
Question to address: How to address it::
What did you observe?
Observations: Anecdotal/qualitative data may be included in results, but you should clearly differentiate qualitative vs. quantitative observations
Procedural observations which can influence the results should be included here
Site observations or Environmental observations need to be included if appropriate. (time of day, temperature, raining/sunny, litter/human influence etc)
Presentation of the Data
Several tables – including averages and percentages, several graphs….
Use TABLES to present your AVERAGED results in the RESULTS section ……The raw data must be included in an appendix
Choose an appropriate method to graphically display your data – choose from line graphs, bar graphs, pie charts ……
Statistical Analysis
Try re-arranging some of your data into percentages, percentage increase, percentage decrease……. Try this and you may find some interesting and different ways to present the same data that presents new patterns
Standard deviations
Correlation co-efficient
Line of best fit
Equation of a line to predict future outcomes (e.g. y=mx+c)
What to avoid:
1. Don't include the „raw‟ data in the results section – be selective “(the raw data can be included as an appendix).
2. Don’t present the same data in more than one form 3. Don't interpret results.
WRITING
Additional tips:
1. Order multiple results logically: o from most to least important o from simple to complex o organ by organ; chemical class by chemical class
2. Use past tense to describe what happened/observations.
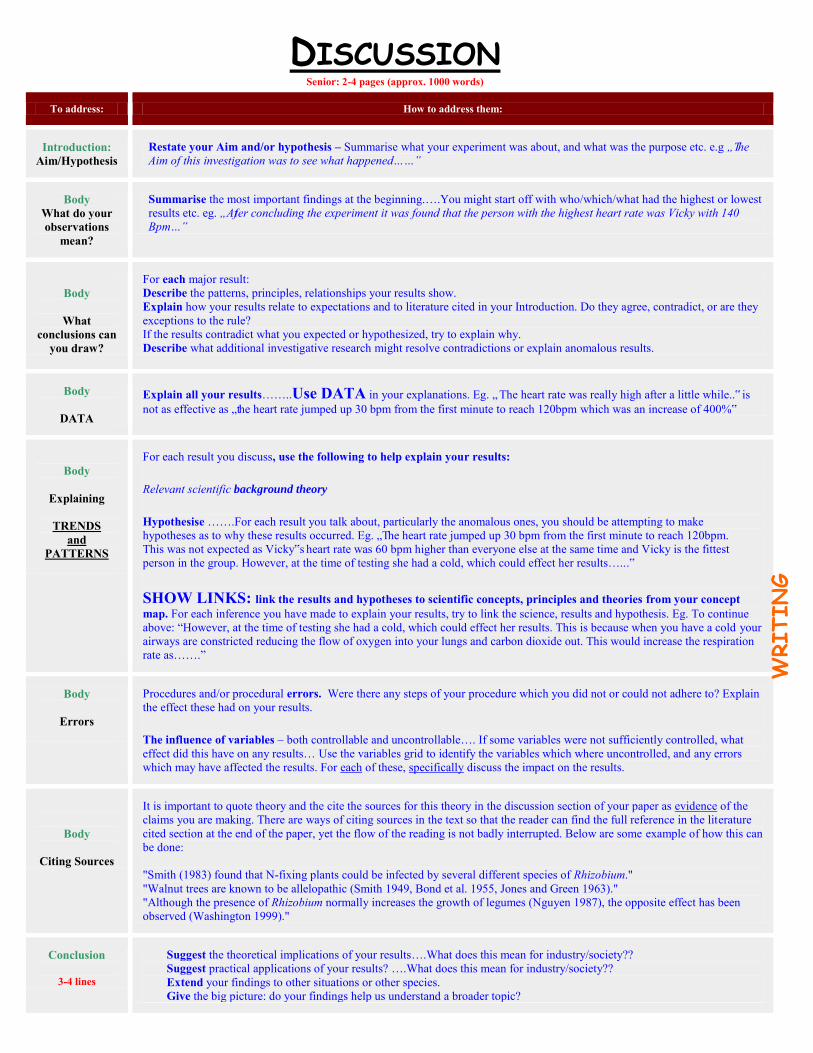
DISCUSSION Senior: 2-4 pages (approx. 1000 words)
To address: How to address them:
Introduction: Aim/Hypothesis
Restate your Aim and/or hypothesis – Summarise what your experiment was about, and what was the purpose etc. e.g „The Aim of this investigation was to see what happened……‟
Body What do your observations
mean?
Summarise the most important findings at the beginning.….You might start off with who/which/what had the highest or lowest results etc. eg. „After concluding the experiment it was found that the person with the highest heart rate was Vicky with 140 Bpm…‟
Body
What
conclusions can you draw?
For each major result: Describe the patterns, principles, relationships your results show. Explain how your results relate to expectations and to literature cited in your Introduction. Do they agree, contradict, or are they exceptions to the rule? If the results contradict what you expected or hypothesized, try to explain why. Describe what additional investigative research might resolve contradictions or explain anomalous results.
Body
DATA
Explain all your results……..Use DATA in your explanations. Eg. „ The heart rate was really high after a little while..‟ is not as effective as „the heart rate jumped up 30 bpm from the first minute to reach 120bpm which was an increase of 400%‟
Body
Explaining
TRENDS
and PATTERNS
For each result you discuss, use the following to help explain your results:
Relevant scientific background theory
Hypothesise …….For each result you talk about, particularly the anomalous ones, you should be attempting to make hypotheses as to why these results occurred. Eg. „The heart rate jumped up 30 bpm from the first minute to reach 120bpm. This was not expected as Vicky‟s heart rate was 60 bpm higher than everyone else at the same time and Vicky is the fittest person in the group. However, at the time of testing she had a cold, which could effect her results…...‟
SHOW LINKS: link the results and hypotheses to scientific concepts, principles and theories from your concept map. For each inference you have made to explain your results, try to link the science, results and hypothesis. Eg. To continue above: “However, at the time of testing she had a cold, which could effect her results. This is because when you have a cold your airways are constricted reducing the flow of oxygen into your lungs and carbon dioxide out. This would increase the respiration rate as…….”
Body
Errors
Procedures and/or procedural errors. Were there any steps of your procedure which you did not or could not adhere to? Explain the effect these had on your results.
The influence of variables – both controllable and uncontrollable…. If some variables were not sufficiently controlled, what effect did this have on any results… Use the variables grid to identify the variables which where uncontrolled, and any errors which may have affected the results. For each of these, specifically discuss the impact on the results.
Body
Citing Sources
It is important to quote theory and the cite the sources for this theory in the discussion section of your paper as evidence of the claims you are making. There are ways of citing sources in the text so that the reader can find the full reference in the literature cited section at the end of the paper, yet the flow of the reading is not badly interrupted. Below are some example of how this can be done: "Smith (1983) found that N-fixing plants could be infected by several different species of Rhizobium." "Walnut trees are known to be allelopathic (Smith 1949, Bond et al. 1955, Jones and Green 1963)." "Although the presence of Rhizobium normally increases the growth of legumes (Nguyen 1987), the opposite effect has been observed (Washington 1999)."
Conclusion
3-4 lines
Suggest the theoretical implications of your results….What does this mean for industry/society?? Suggest practical applications of your results? ….What does this mean for industry/society?? Extend your findings to other situations or other species. Give the big picture: do your findings help us understand a broader topic?
WRITING
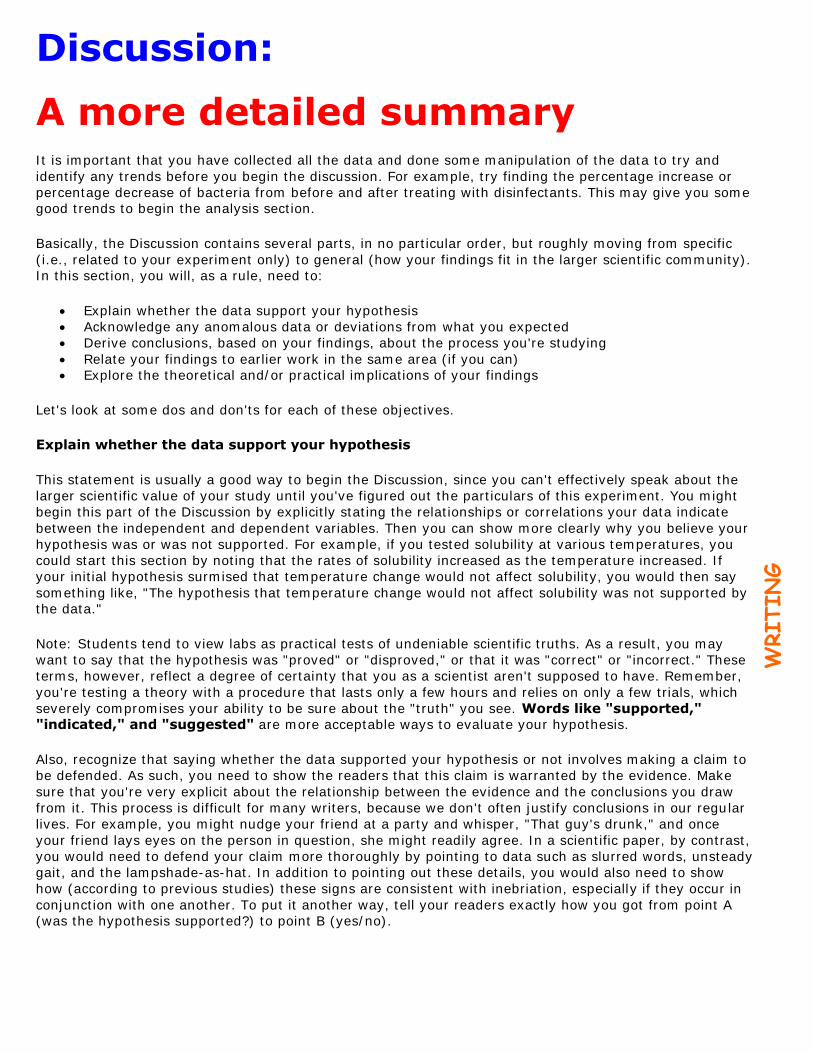
Discussion:
A more detailed summary It is important that you have collected all the data and done some manipulation of the data to try and
identify any trends before you begin the discussion. For example, try finding the percentage increase or
percentage decrease of bacteria from before and after treating with disinfectants. This may give you some good trends to begin the analysis section.
Basically, the Discussion contains several parts, in no particular order, but roughly moving from specific
(i.e., related to your experiment only) to general (how your findings fit in the larger scientific community). In this section, you will, as a rule, need to:
Explain whether the data support your hypothesis
Acknowledge any anomalous data or deviations from what you expected
Derive conclusions, based on your findings, about the process you're studying
Relate your findings to earlier work in the same area (if you can) Explore the theoretical and/or practical implications of your findings
Let's look at some dos and don'ts for each of these objectives.
Explain whether the data support your hypothesis
This statement is usually a good way to begin the Discussion, since you can't effectively speak about the
larger scientific value of your study until you've figured out the particulars of this experiment. You might
begin this part of the Discussion by explicitly stating the relationships or correlations your data indicate
between the independent and dependent variables. Then you can show more clearly why you believe your
hypothesis was or was not supported. For example, if you tested solubility at various temperatures, you
could start this section by noting that the rates of solubility increased as the temperature increased. If
your initial hypothesis surmised that temperature change would not affect solubility, you would then say
something like, "The hypothesis that temperature change would not affect solubility was not supported by the data."
Note: Students tend to view labs as practical tests of undeniable scientific truths. As a result, you may
want to say that the hypothesis was "proved" or "disproved," or that it was "correct" or "incorrect." These
terms, however, reflect a degree of certainty that you as a scientist aren't supposed to have. Remember,
you're testing a theory with a procedure that lasts only a few hours and relies on only a few trials, which
severely compromises your ability to be sure about the "truth" you see. Words like "supported," "indicated," and "suggested" are more acceptable ways to evaluate your hypothesis.
Also, recognize that saying whether the data supported your hypothesis or not involves making a claim to
be defended. As such, you need to show the readers that this claim is warranted by the evidence. Make
sure that you're very explicit about the relationship between the evidence and the conclusions you draw
from it. This process is difficult for many writers, because we don't often justify conclusions in our regular
lives. For example, you might nudge your friend at a party and whisper, "That guy's drunk," and once
your friend lays eyes on the person in question, she might readily agree. In a scientific paper, by contrast,
you would need to defend your claim more thoroughly by pointing to data such as slurred words, unsteady
gait, and the lampshade-as-hat. In addition to pointing out these details, you would also need to show
how (according to previous studies) these signs are consistent with inebriation, especially if they occur in
conjunction with one another. To put it another way, tell your readers exactly how you got from point A (was the hypothesis supported?) to point B (yes/no).
WRITING
Acknowledge any anomalous data, or deviations from what you expected
You need to take these exceptions and divergences into account, so that you qualify your conclusions
sufficiently. For obvious reasons, your readers will doubt your authority if you (deliberately or
inadvertently) overlook a key piece of data that doesn't square with your perspective on what occurred. In
a more philosophical sense, once you've ignored evidence that contradicts your claims, you've departed
from the scientific method. The urge to "tidy up" the experiment is often strong, but if you give in to it you're no longer performing good science.
Sometimes after you've performed a study or experiment, you realize that some part of the methods you
used to test your hypothesis was flawed. In that case, it's OK to suggest that, if you had the chance to
conduct your test again, you might change the design in this or that specific way in order to avoid such
and such a problem. The key to making this approach work, though, is to be very precise about the
weakness in your experiment, why and how you think that weakness might have affected your data, and
how you would alter your protocol to eliminate--or limit the effects of--that weakness. Often,
inexperienced researchers and writers feel the need to account for "wrong" data (remember, there's no
such animal), and so they speculate wildly about what might have screwed things up. These speculations
include such factors as the unusually hot temperature in the room, or the possibility that their lab partners
read the meters wrong, or the potentially defective equipment. These explanations are what scientists call
"cop-outs," or "lame"; don't indicate that the experiment had a weakness unless you're fairly certain that a) it really occurred and b) you can explain reasonably well how that weakness affected your results.
Derive conclusions, based on your findings, about the process you're studying
If, for example, your hypothesis dealt with the changes in solubility at different temperatures, then try to
figure out what you can rationally say about the process of solubility more generally. If you're doing an
undergraduate lab, chances are that the lab will connect in some way to the material you've been covering
either in lecture or in your reading, so you might choose to return to these resources as a way to help you think clearly about the process as a whole.
This part of the Discussion section is another place where you need to make sure that you're not
overreaching. Again, nothing you've found in one study would remotely allow you to claim that you now
"know" something, or that something isn't "true," or that your experiment "confirmed" some principle or
other. Hesitate before you go out on a limb-it's dangerous! Use less absolutely conclusive language, including such words as "suggest," "indicate," "correspond," "possibly," "challenge," etc.
Relate your findings to previous work in the field (if possible)
We've been talking about how to show that you belong in a particular community (such as biologists or
anthropologists) by writing within conventions that they recognize and accept. Another is to try to identify
a conversation going on among members of that community, and use your work to contribute to that
conversation. In a larger philosophical sense, scientists can't fully understand the value of their research
unless they have some sense of the context that provoked and nourished it. That is, you have to
recognize what's new about your project (potentially, anyway) and how it benefits the wider body of
scientific knowledge. On a more pragmatic level, especially for undergraduates, connecting your lab work
to previous research will demonstrate to the TA that you see the big picture. You have an opportunity, in
the Discussion section, to distinguish yourself from the students in your class who aren't thinking beyond
the barest facts of the study. Capitalize on this opportunity by putting your own work in context.
If you're just beginning to work in the natural sciences (as a first-year biology or chemistry student, say),
most likely the work you'll be doing has already been performed and re-performed to a satisfactory
degree. Hence, you could probably point to a similar experiment or study and compare/contrast your
results and conclusions. More advanced work may deal with an issue that is somewhat less "resolved,"
and so previous research may take the form of an ongoing debate, and you can use your own work to
weigh in on that debate. If, for example, researchers are hotly disputing the value of herbal remedies for
the common cold, and the results of your study suggest that Echinacea diminishes the symptoms but not
the actual presence of the cold, then you might want to take some time in the Discussion section to
recapitulate the specifics of the dispute as it relates to Echinacea as an herbal remedy. (Consider that you have probably already written in the Introduction about this debate as background research.)
WRITING
Explore the theoretical and/or practical implications of your findings
This information is often the best way to end your Discussion (and, for all intents and purposes, the
report). In argumentative writing generally, you want to use your closing words to convey the main point
of your writing. This main point can be primarily theoretical ("Now that you understand this information,
you're in a better position to understand this larger issue") or primarily practical ("You can use this
information to take such and such an action"). In either case, the concluding statements help the reader to comprehend the significance of your project and your decision to write about it.
Since a lab report is argumentative-after all, you're investigating a claim, and
judging the legitimacy of that claim by generating and collecting evidence-it's often a good idea to end your report with the same technique for establishing
your main point. If you want to go the theoretical route, you might talk about the consequences your study has for the field or phenomenon you're
investigating. To return to the examples regarding solubility, you could end by reflecting on what your work on solubility as a function of temperature tells us
(potentially) about solubility in general. (Some folks consider this type of
exploration "pure" as opposed to "applied" science, although these labels can be problematic.) If you want to go the practical route, you could end by
speculating about the medical, institutional, or commercial implications of your findings-in other words, answer the question, "What can this study help people
to do?" In either case, you're going to make your readers' experience more satisfying, by helping them see why they spent their time learning what you
had to teach them.
WRITING

Conclusion Synopsis:
You will need to conclude your findings here. Don‟t bring up new information or explain your
results…..that goes in your discussion only.
Questions to address:
How to address them:
Relate to the hypothesis
3-5 lines
Summarise the main conclusions (facts) you have found.
In one or two sentences, has your research succeeded in proving or disproving the hypothesis?
WRITING

Sources/Bibliography for this report
All the science staff at Tully SHS who have contributed to the construction of this „How to‟ booklet from 2005 – 2008 (Timms, Machin, Menzies, Perkins, Stewart, Morrison, Pawelski, Azzopardi, Baine, Reitzma, Connor. ) Several Websites including: http://192.211.16.13/curricular/bgc1998/report.tips.html http://classweb.gmu.edu/biologyresources/writingguide/index.htm http://www.wisc.edu/writing/Handbook/SciRep_Abstract.html http://abacus.bates.edu/~ganderso/biology/resources/writing/HTWsections.html

APPENDIX 4 –
APPENDIX 5 – Model Water Quality Discussion
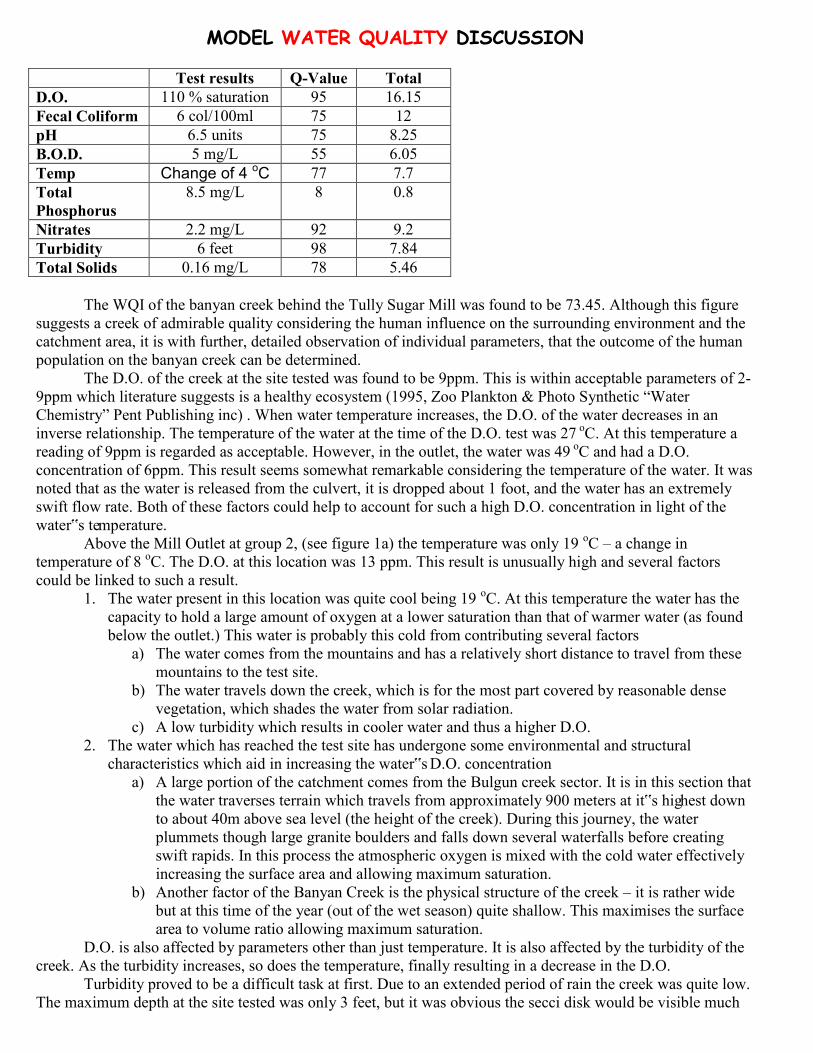
MODEL WATER QUALITY DISCUSSION Test results Q-Value Total D.O. 110 % saturation 95 16.15 Fecal Coliform 6 col/100ml 75 12 pH 6.5 units 75 8.25 B.O.D. 5 mg/L 55 6.05 Temp Change of 4 oC 77 7.7 Total Phosphorus
8.5 mg/L 8 0.8
Nitrates 2.2 mg/L 92 9.2 Turbidity 6 feet 98 7.84 Total Solids 0.16 mg/L 78 5.46
The WQI of the banyan creek behind the Tully Sugar Mill was found to be 73.45. Although this figure suggests a creek of admirable quality considering the human influence on the surrounding environment and the catchment area, it is with further, detailed observation of individual parameters, that the outcome of the human population on the banyan creek can be determined. The D.O. of the creek at the site tested was found to be 9ppm. This is within acceptable parameters of 2-9ppm which literature suggests is a healthy ecosystem (1995, Zoo Plankton & Photo Synthetic “Water Chemistry” Pent Publishing inc) . When water temperature increases, the D.O. of the water decreases in an inverse relationship. The temperature of the water at the time of the D.O. test was 27 oC. At this temperature a reading of 9ppm is regarded as acceptable. However, in the outlet, the water was 49 oC and had a D.O. concentration of 6ppm. This result seems somewhat remarkable considering the temperature of the water. It was noted that as the water is released from the culvert, it is dropped about 1 foot, and the water has an extremely swift flow rate. Both of these factors could help to account for such a high D.O. concentration in light of the water‟s temperature.
Above the Mill Outlet at group 2, (see figure 1a) the temperature was only 19 oC – a change in temperature of 8 oC. The D.O. at this location was 13 ppm. This result is unusually high and several factors could be linked to such a result.
1. The water present in this location was quite cool being 19 oC. At this temperature the water has the capacity to hold a large amount of oxygen at a lower saturation than that of warmer water (as found below the outlet.) This water is probably this cold from contributing several factors
a) The water comes from the mountains and has a relatively short distance to travel from these mountains to the test site.
b) The water travels down the creek, which is for the most part covered by reasonable dense vegetation, which shades the water from solar radiation.
c) A low turbidity which results in cooler water and thus a higher D.O. 2. The water which has reached the test site has undergone some environmental and structural
characteristics which aid in increasing the water‟s D.O. concentration a) A large portion of the catchment comes from the Bulgun creek sector. It is in this section that
the water traverses terrain which travels from approximately 900 meters at it‟s highest down to about 40m above sea level (the height of the creek). During this journey, the water plummets though large granite boulders and falls down several waterfalls before creating swift rapids. In this process the atmospheric oxygen is mixed with the cold water effectively increasing the surface area and allowing maximum saturation.
b) Another factor of the Banyan Creek is the physical structure of the creek – it is rather wide but at this time of the year (out of the wet season) quite shallow. This maximises the surface area to volume ratio allowing maximum saturation.
D.O. is also affected by parameters other than just temperature. It is also affected by the turbidity of the creek. As the turbidity increases, so does the temperature, finally resulting in a decrease in the D.O.
Turbidity proved to be a difficult task at first. Due to an extended period of rain the creek was quite low. The maximum depth at the site tested was only 3 feet, but it was obvious the secci disk would be visible much
deeper than this. Further upstream above the mill outlet, the turbidity of the creek was measured at greater than 6 feet. From visual observations where the mill outlet water rejoined the creek, it was concluded that the mill outlet‟s water was no more turbid than the water above the outlet, so this result was used for this test site also.
As was expected with a turbidity of greater than 6 feet, the temp was quite cool at this site being 19 oC – and coincided with the D.O.‟s result at this point of 13ppm
Some other interesting observations were made while at the test site a) The water temperature changed dramatically across the stream and could be easily felt while
wading across the stream. Some of these hotter rivulets within the larger volume of water measured 42 oC while the smaller ones not further than 30 cm away measured only 27 oC – a remarkable change in temperature in such a short distance. This warmer water was not tested for D.O. concentration although it could be inferred that this warmer water would have had a somewhat similar result to that of the 49 oC water in the culvert form the mill.
b) Very few plants were observed in the water at any section of the creek – and none were observed in the Bulgun creek tributary. Photosynthesis by plants increases the D.O. concentration in an aquatic community. However this distinct lack of plants does not substantiate such a high D.O. result. Such a high D.O. result it is believed can only be attributed to the aforementioned characteristics which increase the D.O. in water – particularly in the Banyan Creek and it‟s associated tributaries.
Another possible source for the results obtained was the obvious flaws in scientific procedures. In the procedure for D.O. several errors were possible:
a) Bubbles entered into the sample bottle. As was seen in one of the original tests carried out, the D.O. was measured at 14ppm. It was noted in the procedure though that a bubble was caught in the bottle after chemical one and chemical two were added but before chemical three was added. This result appeared anomalous so was discarded and the test redone. When done properly the D.O. measured 9ppm.
b) Care must be taken to ensure all the powdered reagents are poured into the bottle. In another test a considerable amount of the reagents missed the sample bottle. The test was not restarted but the result once again appeared anomalous and was discarded – measuring only 4 ppm at 22 oC.
APPENDIX 6
False Positive Data Analysis
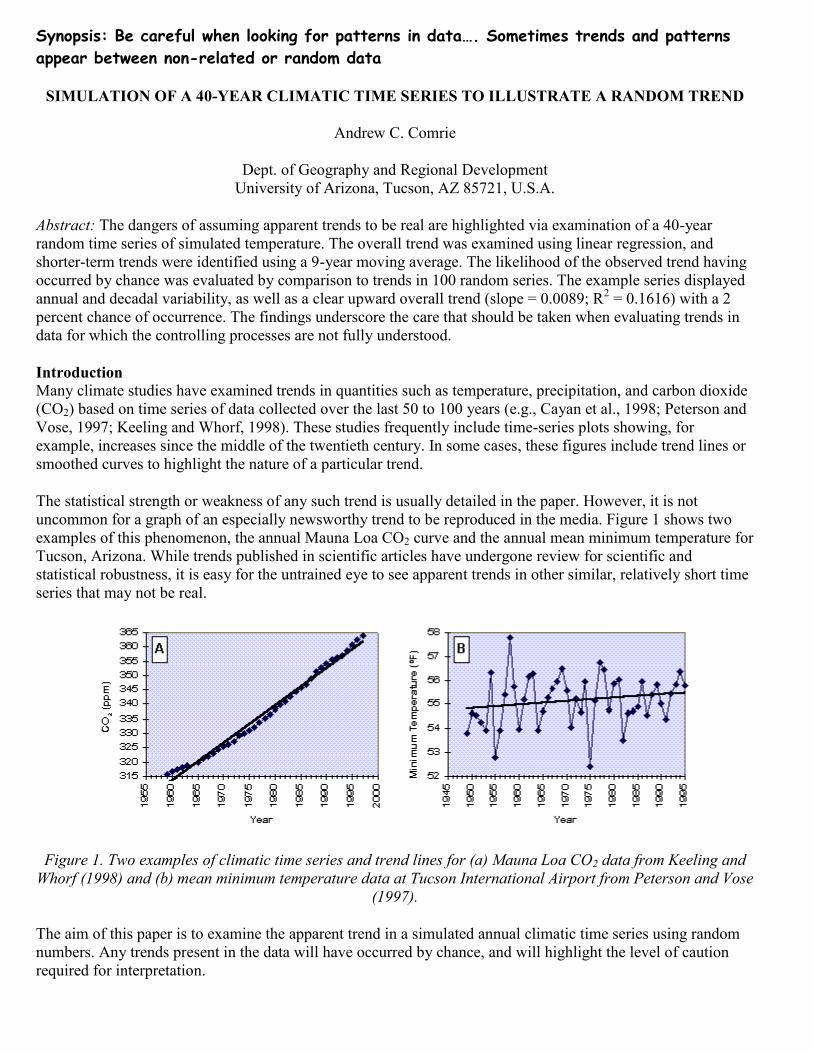
Synopsis: Be careful when looking for patterns in data…. Sometimes trends and patterns
appear between non-related or random data
SIMULATION OF A 40-YEAR CLIMATIC TIME SERIES TO ILLUSTRATE A RANDOM TREND
Andrew C. Comrie
Dept. of Geography and Regional Development University of Arizona, Tucson, AZ 85721, U.S.A.
Abstract: The dangers of assuming apparent trends to be real are highlighted via examination of a 40-year random time series of simulated temperature. The overall trend was examined using linear regression, and shorter-term trends were identified using a 9-year moving average. The likelihood of the observed trend having occurred by chance was evaluated by comparison to trends in 100 random series. The example series displayed annual and decadal variability, as well as a clear upward overall trend (slope = 0.0089; R2 = 0.1616) with a 2 percent chance of occurrence. The findings underscore the care that should be taken when evaluating trends in data for which the controlling processes are not fully understood.
Introduction Many climate studies have examined trends in quantities such as temperature, precipitation, and carbon dioxide (CO2) based on time series of data collected over the last 50 to 100 years (e.g., Cayan et al., 1998; Peterson and Vose, 1997; Keeling and Whorf, 1998). These studies frequently include time-series plots showing, for example, increases since the middle of the twentieth century. In some cases, these figures include trend lines or smoothed curves to highlight the nature of a particular trend.
The statistical strength or weakness of any such trend is usually detailed in the paper. However, it is not uncommon for a graph of an especially newsworthy trend to be reproduced in the media. Figure 1 shows two examples of this phenomenon, the annual Mauna Loa CO2 curve and the annual mean minimum temperature for Tucson, Arizona. While trends published in scientific articles have undergone review for scientific and statistical robustness, it is easy for the untrained eye to see apparent trends in other similar, relatively short time series that may not be real.
Figure 1. Two examples of climatic time series and trend lines for (a) Mauna Loa CO2 data from Keeling and Whorf (1998) and (b) mean minimum temperature data at Tucson International Airport from Peterson and Vose
(1997).
The aim of this paper is to examine the apparent trend in a simulated annual climatic time series using random numbers. Any trends present in the data will have occurred by chance, and will highlight the level of caution required for interpretation.
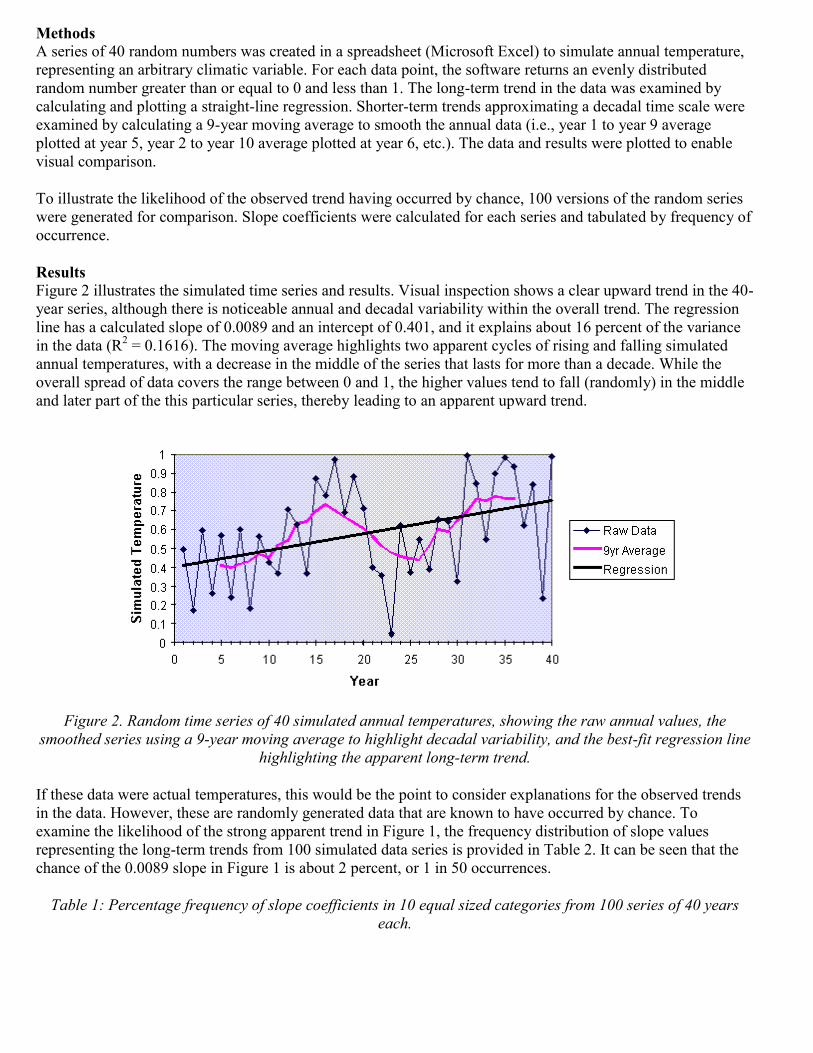
Methods A series of 40 random numbers was created in a spreadsheet (Microsoft Excel) to simulate annual temperature, representing an arbitrary climatic variable. For each data point, the software returns an evenly distributed random number greater than or equal to 0 and less than 1. The long-term trend in the data was examined by calculating and plotting a straight-line regression. Shorter-term trends approximating a decadal time scale were examined by calculating a 9-year moving average to smooth the annual data (i.e., year 1 to year 9 average plotted at year 5, year 2 to year 10 average plotted at year 6, etc.). The data and results were plotted to enable visual comparison.
To illustrate the likelihood of the observed trend having occurred by chance, 100 versions of the random series were generated for comparison. Slope coefficients were calculated for each series and tabulated by frequency of occurrence.
Results Figure 2 illustrates the simulated time series and results. Visual inspection shows a clear upward trend in the 40-year series, although there is noticeable annual and decadal variability within the overall trend. The regression line has a calculated slope of 0.0089 and an intercept of 0.401, and it explains about 16 percent of the variance in the data (R2 = 0.1616). The moving average highlights two apparent cycles of rising and falling simulated annual temperatures, with a decrease in the middle of the series that lasts for more than a decade. While the overall spread of data covers the range between 0 and 1, the higher values tend to fall (randomly) in the middle and later part of the this particular series, thereby leading to an apparent upward trend.
Figure 2. Random time series of 40 simulated annual temperatures, showing the raw annual values, the smoothed series using a 9-year moving average to highlight decadal variability, and the best-fit regression line
highlighting the apparent long-term trend.
If these data were actual temperatures, this would be the point to consider explanations for the observed trends in the data. However, these are randomly generated data that are known to have occurred by chance. To examine the likelihood of the strong apparent trend in Figure 1, the frequency distribution of slope values representing the long-term trends from 100 simulated data series is provided in Table 2. It can be seen that the chance of the 0.0089 slope in Figure 1 is about 2 percent, or 1 in 50 occurrences.
Table 1: Percentage frequency of slope coefficients in 10 equal sized categories from 100 series of 40 years each.
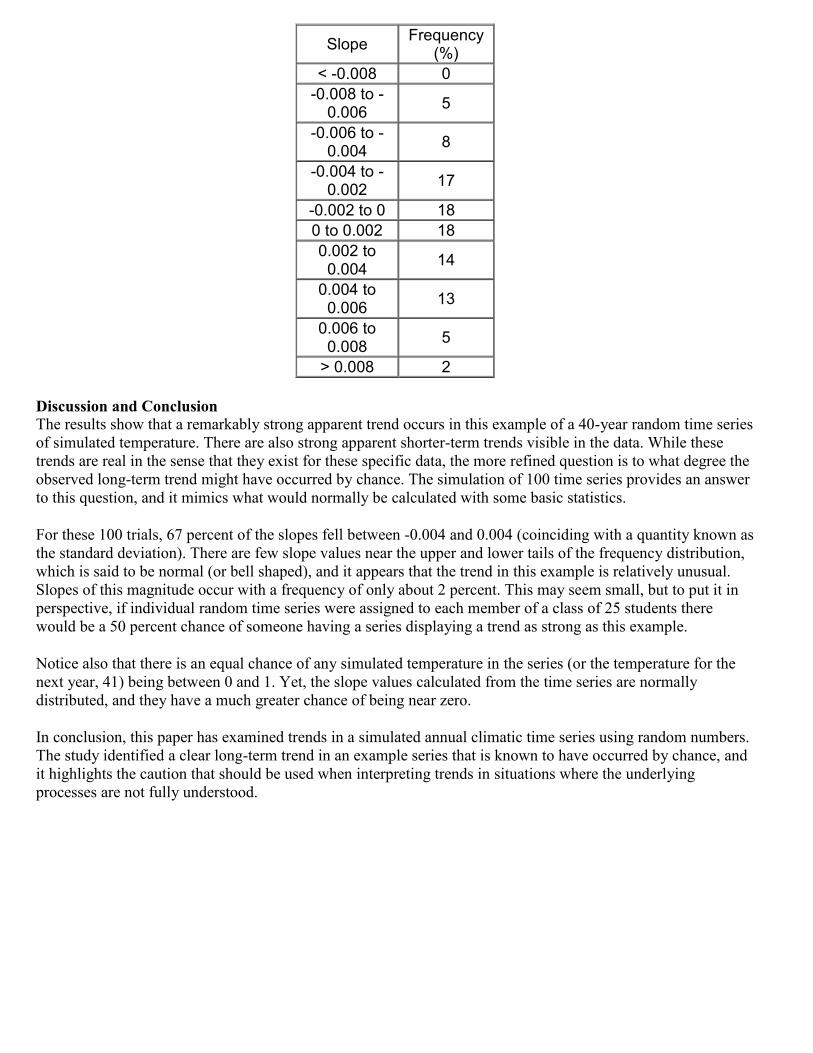
Slope Frequency (%)
< -0.008 0 -0.008 to -
0.006 5
-0.006 to -0.004 8
-0.004 to -0.002 17
-0.002 to 0 18 0 to 0.002 18 0.002 to
0.004 14
0.004 to 0.006 13
0.006 to 0.008 5
> 0.008 2
Discussion and Conclusion The results show that a remarkably strong apparent trend occurs in this example of a 40-year random time series of simulated temperature. There are also strong apparent shorter-term trends visible in the data. While these trends are real in the sense that they exist for these specific data, the more refined question is to what degree the observed long-term trend might have occurred by chance. The simulation of 100 time series provides an answer to this question, and it mimics what would normally be calculated with some basic statistics.
For these 100 trials, 67 percent of the slopes fell between -0.004 and 0.004 (coinciding with a quantity known as the standard deviation). There are few slope values near the upper and lower tails of the frequency distribution, which is said to be normal (or bell shaped), and it appears that the trend in this example is relatively unusual. Slopes of this magnitude occur with a frequency of only about 2 percent. This may seem small, but to put it in perspective, if individual random time series were assigned to each member of a class of 25 students there would be a 50 percent chance of someone having a series displaying a trend as strong as this example.
Notice also that there is an equal chance of any simulated temperature in the series (or the temperature for the next year, 41) being between 0 and 1. Yet, the slope values calculated from the time series are normally distributed, and they have a much greater chance of being near zero.
In conclusion, this paper has examined trends in a simulated annual climatic time series using random numbers. The study identified a clear long-term trend in an example series that is known to have occurred by chance, and it highlights the caution that should be used when interpreting trends in situations where the underlying processes are not fully understood.
APPENDIX 7
Model Report – Boiling Water
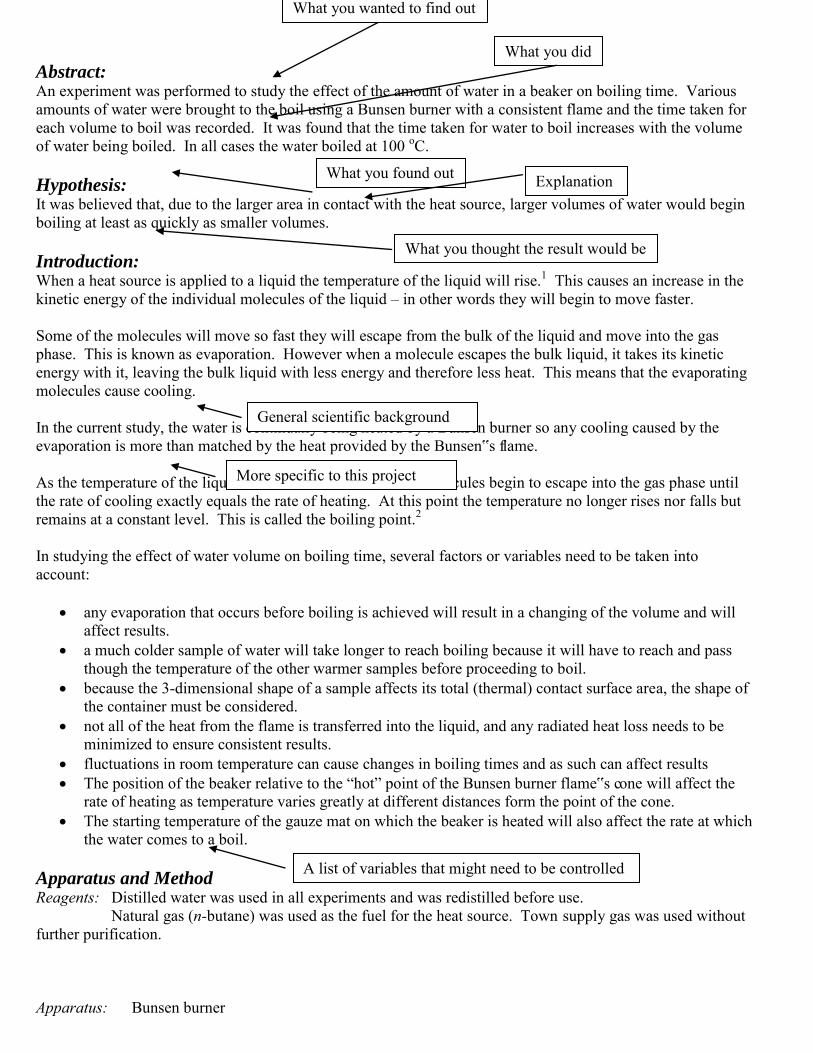
Abstract: An experiment was performed to study the effect of the amount of water in a beaker on boiling time. Various amounts of water were brought to the boil using a Bunsen burner with a consistent flame and the time taken for each volume to boil was recorded. It was found that the time taken for water to boil increases with the volume of water being boiled. In all cases the water boiled at 100 oC. Hypothesis: It was believed that, due to the larger area in contact with the heat source, larger volumes of water would begin boiling at least as quickly as smaller volumes. Introduction: When a heat source is applied to a liquid the temperature of the liquid will rise.1 This causes an increase in the kinetic energy of the individual molecules of the liquid – in other words they will begin to move faster. Some of the molecules will move so fast they will escape from the bulk of the liquid and move into the gas phase. This is known as evaporation. However when a molecule escapes the bulk liquid, it takes its kinetic energy with it, leaving the bulk liquid with less energy and therefore less heat. This means that the evaporating molecules cause cooling. In the current study, the water is continually being heated by a Bunsen burner so any cooling caused by the evaporation is more than matched by the heat provided by the Bunsen‟s flame. As the temperature of the liquid water rises, more and more molecules begin to escape into the gas phase until the rate of cooling exactly equals the rate of heating. At this point the temperature no longer rises nor falls but remains at a constant level. This is called the boiling point.2 In studying the effect of water volume on boiling time, several factors or variables need to be taken into account:
any evaporation that occurs before boiling is achieved will result in a changing of the volume and will affect results.
a much colder sample of water will take longer to reach boiling because it will have to reach and pass though the temperature of the other warmer samples before proceeding to boil.
because the 3-dimensional shape of a sample affects its total (thermal) contact surface area, the shape of the container must be considered.
not all of the heat from the flame is transferred into the liquid, and any radiated heat loss needs to be minimized to ensure consistent results.
fluctuations in room temperature can cause changes in boiling times and as such can affect results The position of the beaker relative to the “hot” point of the Bunsen burner flame‟s cone will affect the
rate of heating as temperature varies greatly at different distances form the point of the cone. The starting temperature of the gauze mat on which the beaker is heated will also affect the rate at which
the water comes to a boil. Apparatus and Method Reagents: Distilled water was used in all experiments and was redistilled before use. Natural gas (n-butane) was used as the fuel for the heat source. Town supply gas was used without further purification. Apparatus: Bunsen burner
What you wanted to find out
What you did
What you found out
More specific to this project
Explanation
What you thought the result would be
General scientific background
A list of variables that might need to be controlled
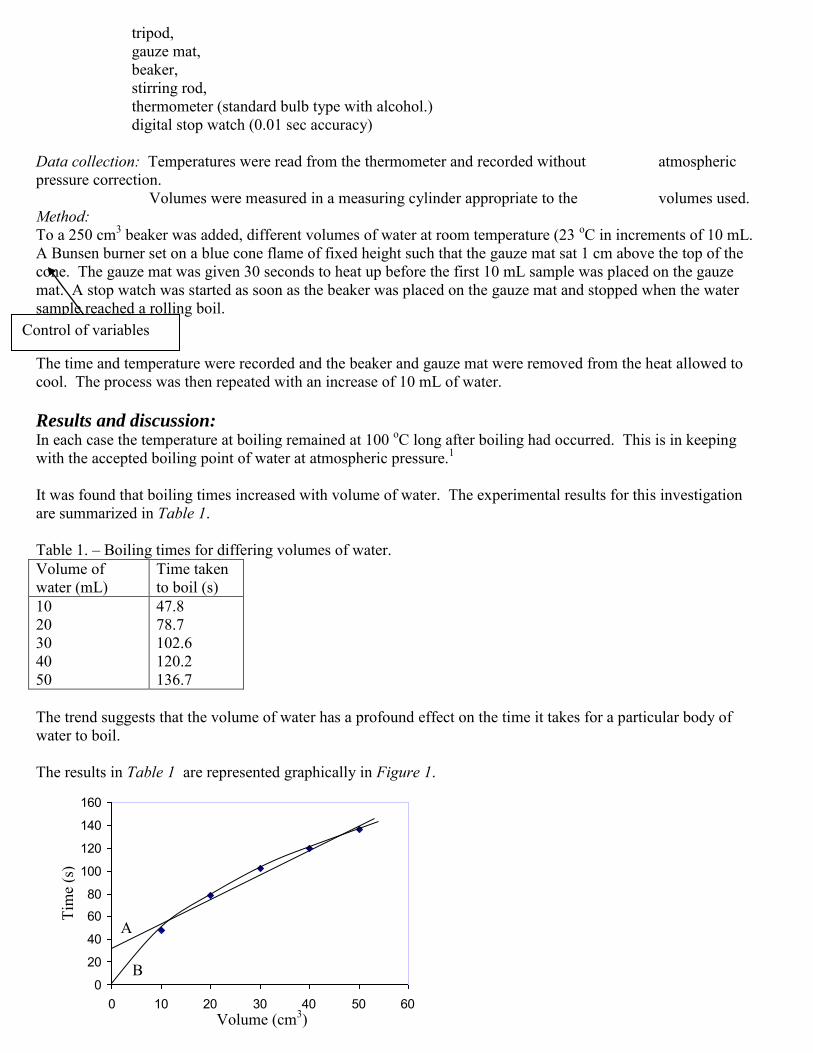
tripod, gauze mat, beaker, stirring rod, thermometer (standard bulb type with alcohol.) digital stop watch (0.01 sec accuracy) Data collection: Temperatures were read from the thermometer and recorded without atmospheric pressure correction. Volumes were measured in a measuring cylinder appropriate to the volumes used. Method: To a 250 cm3 beaker was added, different volumes of water at room temperature (23 oC in increments of 10 mL. A Bunsen burner set on a blue cone flame of fixed height such that the gauze mat sat 1 cm above the top of the cone. The gauze mat was given 30 seconds to heat up before the first 10 mL sample was placed on the gauze mat. A stop watch was started as soon as the beaker was placed on the gauze mat and stopped when the water sample reached a rolling boil. The time and temperature were recorded and the beaker and gauze mat were removed from the heat allowed to cool. The process was then repeated with an increase of 10 mL of water. Results and discussion: In each case the temperature at boiling remained at 100 oC long after boiling had occurred. This is in keeping with the accepted boiling point of water at atmospheric pressure.1 It was found that boiling times increased with volume of water. The experimental results for this investigation are summarized in Table 1. Table 1. – Boiling times for differing volumes of water. Volume of water (mL)
Time taken to boil (s)
10 20 30 40 50
47.8 78.7 102.6 120.2 136.7
The trend suggests that the volume of water has a profound effect on the time it takes for a particular body of water to boil. The results in Table 1 are represented graphically in Figure 1.
0
20
40
60
80
100
120
140
160
0 10 20 30 40 50 60Volume (cm3)
Tim
e (s
)
A
B
Control of variables
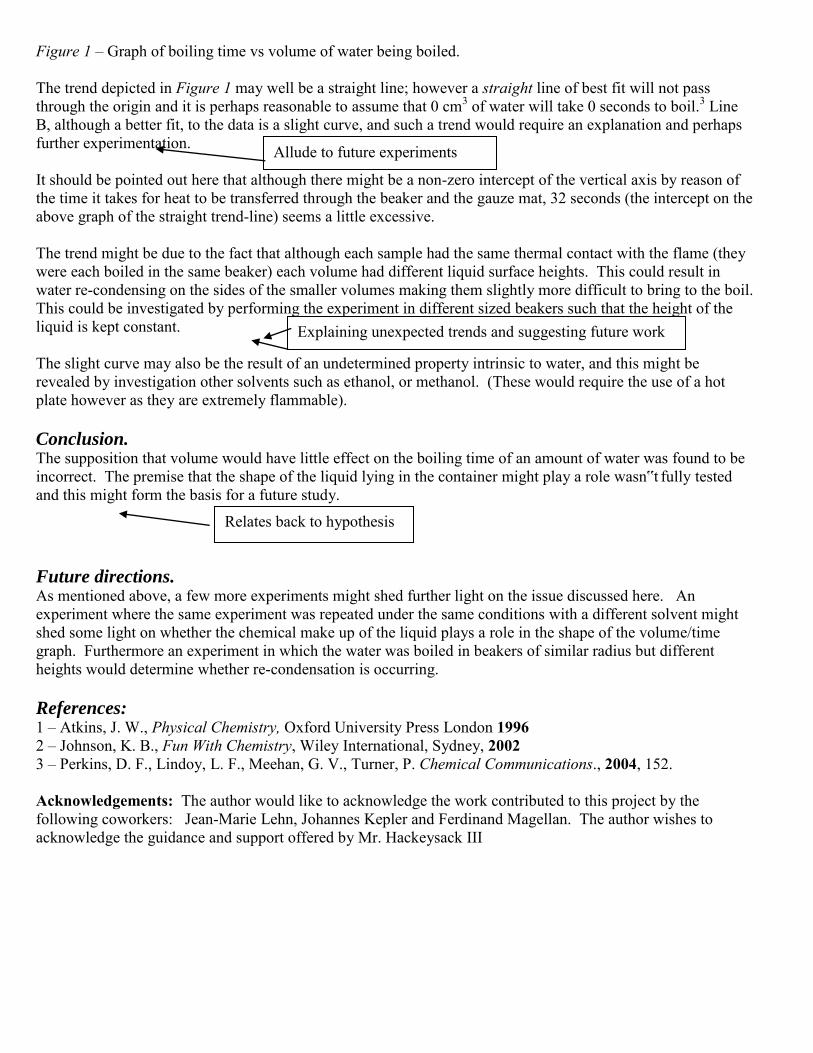
Figure 1 – Graph of boiling time vs volume of water being boiled. The trend depicted in Figure 1 may well be a straight line; however a straight line of best fit will not pass through the origin and it is perhaps reasonable to assume that 0 cm3 of water will take 0 seconds to boil.3 Line B, although a better fit, to the data is a slight curve, and such a trend would require an explanation and perhaps further experimentation. It should be pointed out here that although there might be a non-zero intercept of the vertical axis by reason of the time it takes for heat to be transferred through the beaker and the gauze mat, 32 seconds (the intercept on the above graph of the straight trend-line) seems a little excessive. The trend might be due to the fact that although each sample had the same thermal contact with the flame (they were each boiled in the same beaker) each volume had different liquid surface heights. This could result in water re-condensing on the sides of the smaller volumes making them slightly more difficult to bring to the boil. This could be investigated by performing the experiment in different sized beakers such that the height of the liquid is kept constant. The slight curve may also be the result of an undetermined property intrinsic to water, and this might be revealed by investigation other solvents such as ethanol, or methanol. (These would require the use of a hot plate however as they are extremely flammable). Conclusion. The supposition that volume would have little effect on the boiling time of an amount of water was found to be incorrect. The premise that the shape of the liquid lying in the container might play a role wasn‟t fully tested and this might form the basis for a future study.
Future directions. As mentioned above, a few more experiments might shed further light on the issue discussed here. An experiment where the same experiment was repeated under the same conditions with a different solvent might shed some light on whether the chemical make up of the liquid plays a role in the shape of the volume/time graph. Furthermore an experiment in which the water was boiled in beakers of similar radius but different heights would determine whether re-condensation is occurring. References: 1 – Atkins, J. W., Physical Chemistry, Oxford University Press London 1996 2 – Johnson, K. B., Fun With Chemistry, Wiley International, Sydney, 2002 3 – Perkins, D. F., Lindoy, L. F., Meehan, G. V., Turner, P. Chemical Communications., 2004, 152. Acknowledgements: The author would like to acknowledge the work contributed to this project by the following coworkers: Jean-Marie Lehn, Johannes Kepler and Ferdinand Magellan. The author wishes to acknowledge the guidance and support offered by Mr. Hackeysack III
Allude to future experiments
Explaining unexpected trends and suggesting future work
Relates back to hypothesis