Embed Size (px)
Citation preview

HSBC Holdings plc 4Q17 ResultsPresentation to Investors and Analysts
2017 Full Year
highlights
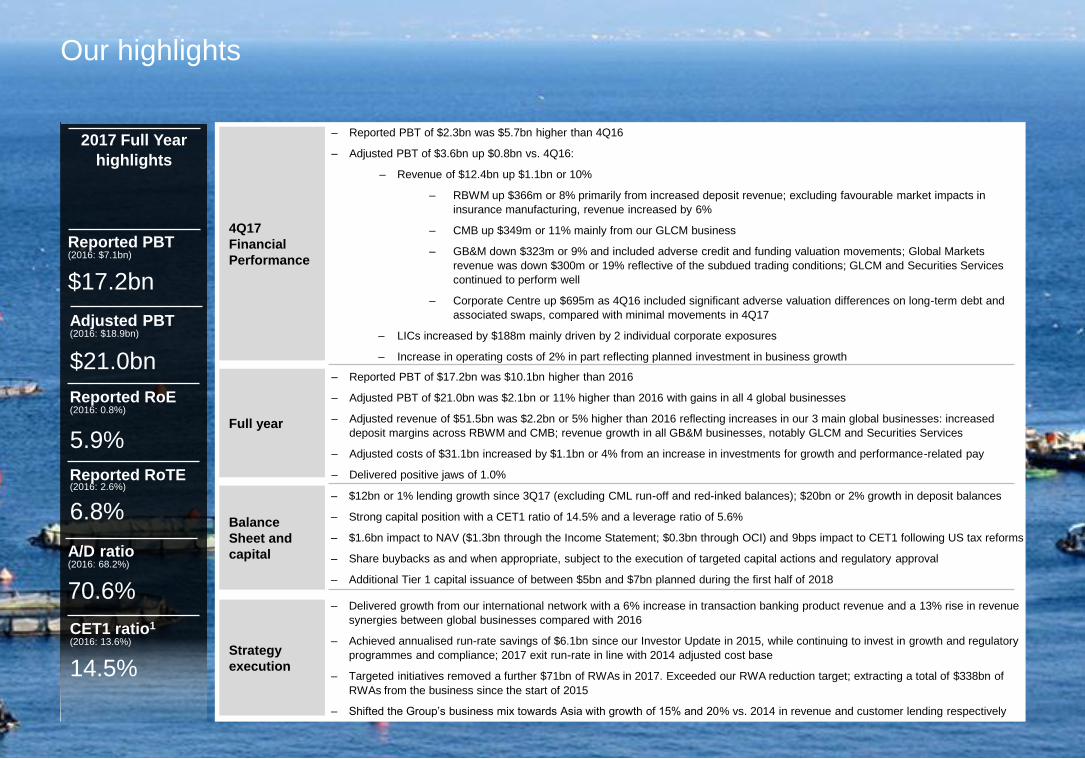
Reported PBT(2016: $7.1bn)
$17.2bn
4Q17
Financial
Performance
Balance
Sheet and
capital
Strategy
execution
Adjusted PBT(2016: $18.9bn)
$21.0bn
Reported RoE(2016: 0.8%)
5.9%
Reported RoTE(2016: 2.6%)
6.8%
CET1 ratio1
(2016: 13.6%)
14.5%
A/D ratio(2016: 68.2%)
70.6%
‒ $12bn or 1% lending growth since 3Q17 (excluding CML run-off and red-inked balances); $20bn or 2% growth in deposit balances
‒ Strong capital position with a CET1 ratio of 14.5% and a leverage ratio of 5.6%
‒ $1.6bn impact to NAV ($1.3bn through the Income Statement; $0.3bn through OCI) and 9bps impact to CET1 following US tax reforms
‒ Share buybacks as and when appropriate, subject to the execution of targeted capital actions and regulatory approval
‒ Additional Tier 1 capital issuance of between $5bn and $7bn planned during the first half of 2018
‒ Delivered growth from our international network with a 6% increase in transaction banking product revenue and a 13% rise in revenue
synergies between global businesses compared with 2016
‒ Achieved annualised run-rate savings of $6.1bn since our Investor Update in 2015, while continuing to invest in growth and regulatory
programmes and compliance; 2017 exit run-rate in line with 2014 adjusted cost base
‒ Targeted initiatives removed a further $71bn of RWAs in 2017. Exceeded our RWA reduction target; extracting a total of $338bn of
RWAs from the business since the start of 2015
‒ Shifted the Group’s business mix towards Asia with growth of 15% and 20% vs. 2014 in revenue and customer lending respectively
‒ Reported PBT of $2.3bn was $5.7bn higher than 4Q16
‒ Adjusted PBT of $3.6bn up $0.8bn vs. 4Q16:
‒ Revenue of $12.4bn up $1.1bn or 10%
‒ RBWM up $366m or 8% primarily from increased deposit revenue; excluding favourable market impacts in
insurance manufacturing, revenue increased by 6%
‒ CMB up $349m or 11% mainly from our GLCM business
‒ GB&M down $323m or 9% and included adverse credit and funding valuation movements; Global Markets
revenue was down $300m or 19% reflective of the subdued trading conditions; GLCM and Securities Services
continued to perform well
‒ Corporate Centre up $695m as 4Q16 included significant adverse valuation differences on long-term debt and
associated swaps, compared with minimal movements in 4Q17
‒ LICs increased by $188m mainly driven by 2 individual corporate exposures
‒ Increase in operating costs of 2% in part reflecting planned investment in business growth
Full year
‒ Reported PBT of $17.2bn was $10.1bn higher than 2016
‒ Adjusted PBT of $21.0bn was $2.1bn or 11% higher than 2016 with gains in all 4 global businesses
‒ Adjusted revenue of $51.5bn was $2.2bn or 5% higher than 2016 reflecting increases in our 3 main global businesses: increased
deposit margins across RBWM and CMB; revenue growth in all GB&M businesses, notably GLCM and Securities Services
‒ Adjusted costs of $31.1bn increased by $1.1bn or 4% from an increase in investments for growth and performance-related pay
‒ Delivered positive jaws of 1.0%
Our highlights
2
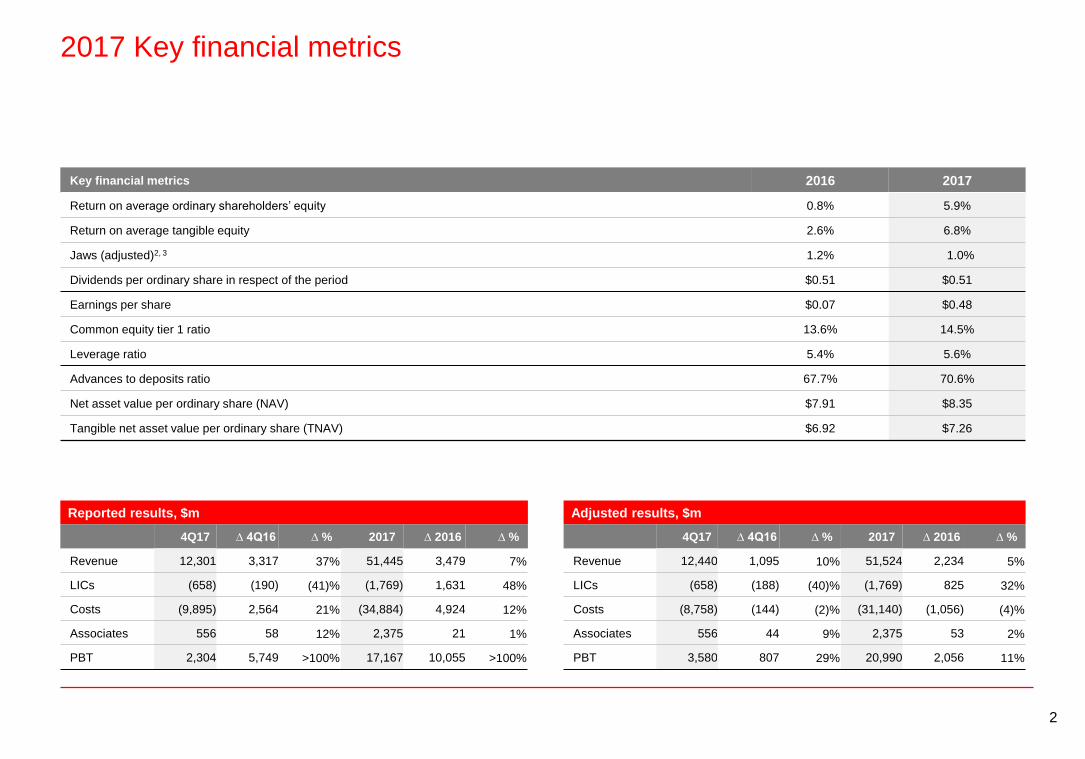
2017 Key financial metrics
Key financial metrics 2016 2017
Return on average ordinary shareholders’ equity 0.8% 5.9%
Return on average tangible equity 2.6% 6.8%
Jaws (adjusted)2, 3 1.2% 1.0%
Dividends per ordinary share in respect of the period $0.51 $0.51
Earnings per share $0.07 $0.48
Common equity tier 1 ratio 13.6% 14.5%
Leverage ratio 5.4% 5.6%
Advances to deposits ratio 67.7% 70.6%
Net asset value per ordinary share (NAV) $7.91 $8.35
Tangible net asset value per ordinary share (TNAV) $6.92 $7.26
Reported results, $m
4Q17 ∆ 4Q16 ∆ % 2017 ∆ 2016 ∆ %
Revenue 12,301 3,317 37% 51,445 3,479 7%
LICs (658) (190) (41)% (1,769) 1,631 48%
Costs (9,895) 2,564 21% (34,884) 4,924 12%
Associates 556 58 12% 2,375 21 1%
PBT 2,304 5,749 >100% 17,167 10,055 >100%
Adjusted results, $m
4Q17 ∆ 4Q16 ∆ % 2017 ∆ 2016 ∆ %
Revenue 12,440 1,095 10% 51,524 2,234 5%
LICs (658) (188) (40)% (1,769) 825 32%
Costs (8,758) (144) (2)% (31,140) (1,056) (4)%
Associates 556 44 9% 2,375 53 2%
PBT 3,580 807 29% 20,990 2,056 11%
3
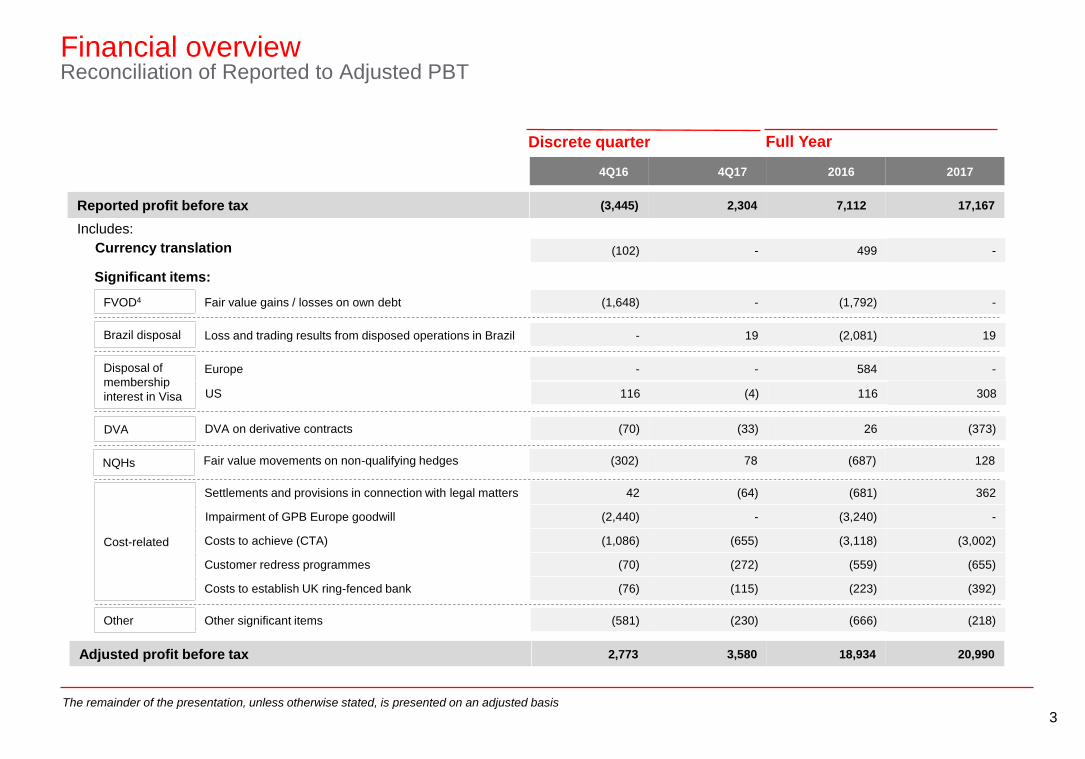
Financial overviewReconciliation of Reported to Adjusted PBT
The remainder of the presentation, unless otherwise stated, is presented on an adjusted basis
Discrete quarter
FVOD4
Brazil disposal
Cost-related
Other
Loss and trading results from disposed operations in Brazil - 19 (2,081) 19
Fair value gains / losses on own debt (1,648) - (1,792) -
Settlements and provisions in connection with legal matters 42 (64) (681) 362
Impairment of GPB Europe goodwill (2,440) - (3,240) -
Costs to achieve (CTA) (1,086) (655) (3,118) (3,002)
Customer redress programmes (70) (272) (559) (655)
Costs to establish UK ring-fenced bank (76) (115) (223) (392)
Significant items:
Currency translation (102) - 499 -
Other significant items (581) (230) (666) (218)
Reported profit before tax (3,445) 2,304 7,112 17,167
Adjusted profit before tax 2,773 3,580 18,934 20,990
Includes:
4Q16 4Q17 2016 2017
DVA DVA on derivative contracts (70) (33) 26 (373)
NQHs Fair value movements on non-qualifying hedges (302) 78 (687) 128
Full Year
Disposal of
membership
interest in Visa
Europe - - 584 -
US 116 (4) 116 308
4
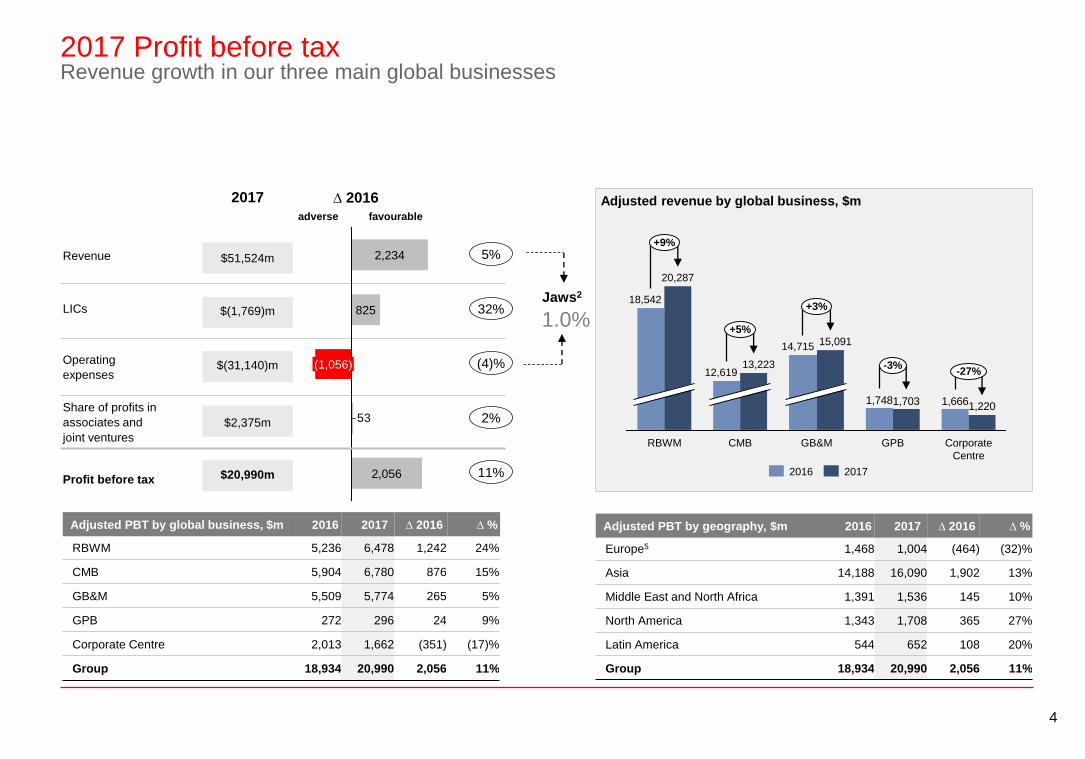
2017 Profit before taxRevenue growth in our three main global businesses
Revenue
LICs
Operating
expenses
Share of profits in
associates and
joint ventures
Profit before tax
$51,524m
2017 ∆ 2016
$(1,769)m
$(31,140)m
$2,375m
$20,990m
53
2,056
(1,056)
825
2,234
11%
5%
32%
2%
(4)%
adverse favourable
Jaws2
1.0%
RBWM 5,236 6,478 1,242 24%
CMB 5,904 6,780 876 15%
GB&M 5,509 5,774 265 5%
GPB 272 296 24 9%
Corporate Centre 2,013 1,662 (351) (17)%
Group 18,934 20,990 2,056 11%
Europe5 1,468 1,004 (464) (32)%
Asia 14,188 16,090 1,902 13%
Middle East and North Africa 1,391 1,536 145 10%
North America 1,343 1,708 365 27%
Latin America 544 652 108 20%
Group 18,934 20,990 2,056 11%
Adjusted PBT by global business, $m 2016 2017 ∆ 2016 ∆ % Adjusted PBT by geography, $m 2016 2017 ∆ 2016 ∆ %
1,6661,7481,2201,703
18,542
-27%-3%
+3%
+5%
12,619
RBWM
20,287
+9%
GB&M Corporate
Centre
GPB
15,09114,715
CMB
13,223
20172016
Adjusted revenue by global business, $m
5
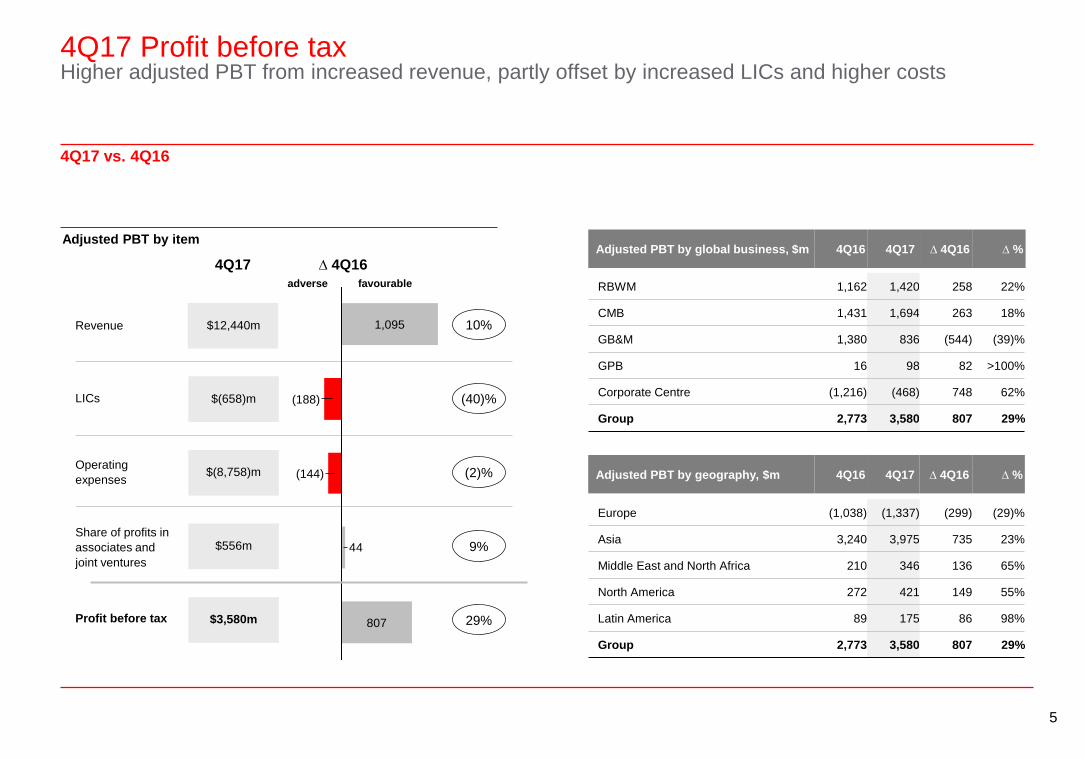
4Q17 Profit before taxHigher adjusted PBT from increased revenue, partly offset by increased LICs and higher costs
RBWM 1,162 1,420 258 22%
CMB 1,431 1,694 263 18%
GB&M 1,380 836 (544) (39)%
GPB 16 98 82 >100%
Corporate Centre (1,216) (468) 748 62%
Group 2,773 3,580 807 29%
Europe (1,038) (1,337) (299) (29)%
Asia 3,240 3,975 735 23%
Middle East and North Africa 210 346 136 65%
North America 272 421 149 55%
Latin America 89 175 86 98%
Group 2,773 3,580 807 29%
Revenue
LICs
Operating
expenses
Share of profits in
associates and
joint ventures
Profit before tax
$12,440m
4Q17 ∆ 4Q16
$(658)m
$(8,758)m
$556m
$3,580m
44
(144)
(188)
1,095
807 29%
10%
(40)%
9%
Adjusted PBT by global business, $m 4Q16 4Q17 ∆ 4Q16 ∆ %
Adjusted PBT by geography, $m 4Q16 4Q17 ∆ 4Q16 ∆ %(2)%
adverse favourable
4Q17 vs. 4Q16
Adjusted PBT by item
6
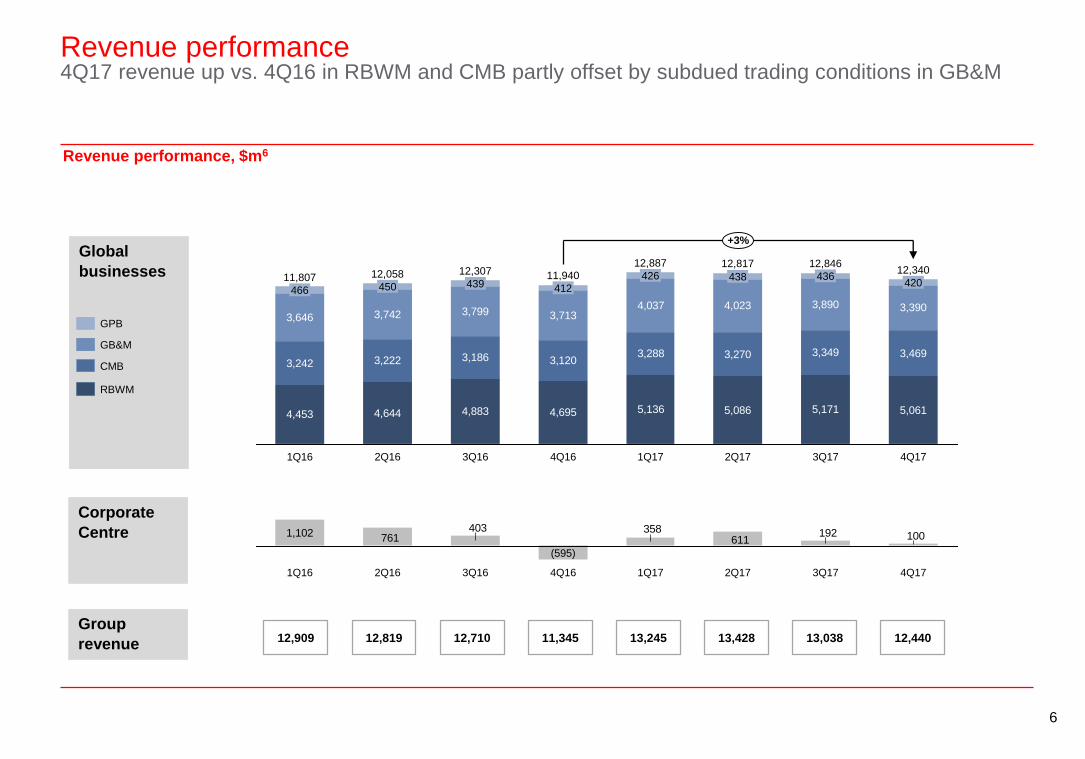
Revenue performance4Q17 revenue up vs. 4Q16 in RBWM and CMB partly offset by subdued trading conditions in GB&M
4,453 4,644 4,883 4,695 5,136 5,086 5,171 5,061
3,242 3,222 3,186 3,1203,288 3,270 3,349 3,469
3,646 3,742 3,799 3,7134,037 4,023 3,890 3,390
12,817
+3%
4Q17
12,340
420
3Q17
12,846
436
2Q17
438
1Q17
12,887
426
4Q16
11,940
412
3Q16
12,307
439
2Q16
12,058
450
1Q16
11,807
466
1,102 100192611
358403761
4Q173Q172Q171Q174Q16
(595)
3Q162Q161Q16
12,710 13,24512,909 12,819 11,345
Global
businesses
Corporate
Centre
Group
revenue
GPB
GB&M
CMB
RBWM
13,428 13,038 12,440
Revenue performance, $m6
7
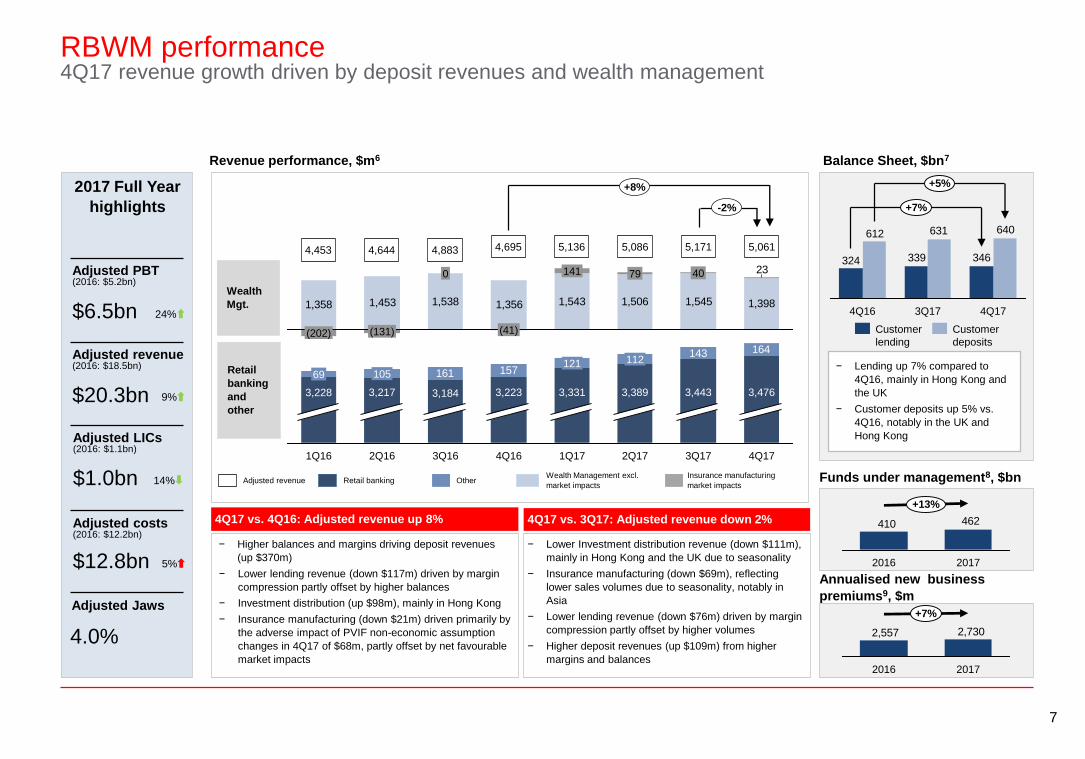
RBWM performance4Q17 revenue growth driven by deposit revenues and wealth management
Adjusted PBT(2016: $5.2bn)
$6.5bn
Adjusted revenue(2016: $18.5bn)
$20.3bn
Adjusted LICs(2016: $1.1bn)
$1.0bn
Adjusted costs(2016: $12.2bn)
$12.8bn
Adjusted Jaws
4.0%
2017 Full Year
highlights
Wealth Management excl.
market impactsRetail banking Other
Insurance manufacturing
market impacts
Wealth
Mgt.
Retail
banking
and
other
Adjusted revenue
4Q17 vs. 4Q16: Adjusted revenue up 8%
− Higher balances and margins driving deposit revenues
(up $370m)
− Lower lending revenue (down $117m) driven by margin
compression partly offset by higher balances
− Investment distribution (up $98m), mainly in Hong Kong
− Insurance manufacturing (down $21m) driven primarily by
the adverse impact of PVIF non-economic assumption
changes in 4Q17 of $68m, partly offset by net favourable
market impacts
4Q17 vs. 3Q17: Adjusted revenue down 2%
− Lower Investment distribution revenue (down $111m),
mainly in Hong Kong and the UK due to seasonality
− Insurance manufacturing (down $69m), reflecting
lower sales volumes due to seasonality, notably in
Asia
− Lower lending revenue (down $76m) driven by margin
compression partly offset by higher volumes
− Higher deposit revenues (up $109m) from higher
margins and balances
Revenue performance, $m6
4,644 4,8834,453
+8%
-2%
161 157
143 164
3,476
3Q17
3,443
2Q17
3,389
112
1Q17
3,331
121
4Q17
3,223
3Q16
3,184
2Q16 4Q16
105
1Q16
3,228
69
3,217
1,538 1,543 1,506 1,545 1,3981,358 1,453 1,356
234079141
(41)
0
(131)(202)
5,136 5,0864,695 5,171 5,061
Balance Sheet, $bn7
− Lending up 7% compared to
4Q16, mainly in Hong Kong and
the UK
− Customer deposits up 5% vs.
4Q16, notably in the UK and
Hong Kong
346339324
640631612
+7%
+5%
4Q173Q174Q16
Customer
deposits
Customer
lending
462410
+13%
20172016
Funds under management8, $bn
Annualised new business
premiums9, $m
2,7302,557
2016
+7%
2017
24%
9%
14%
5%
8
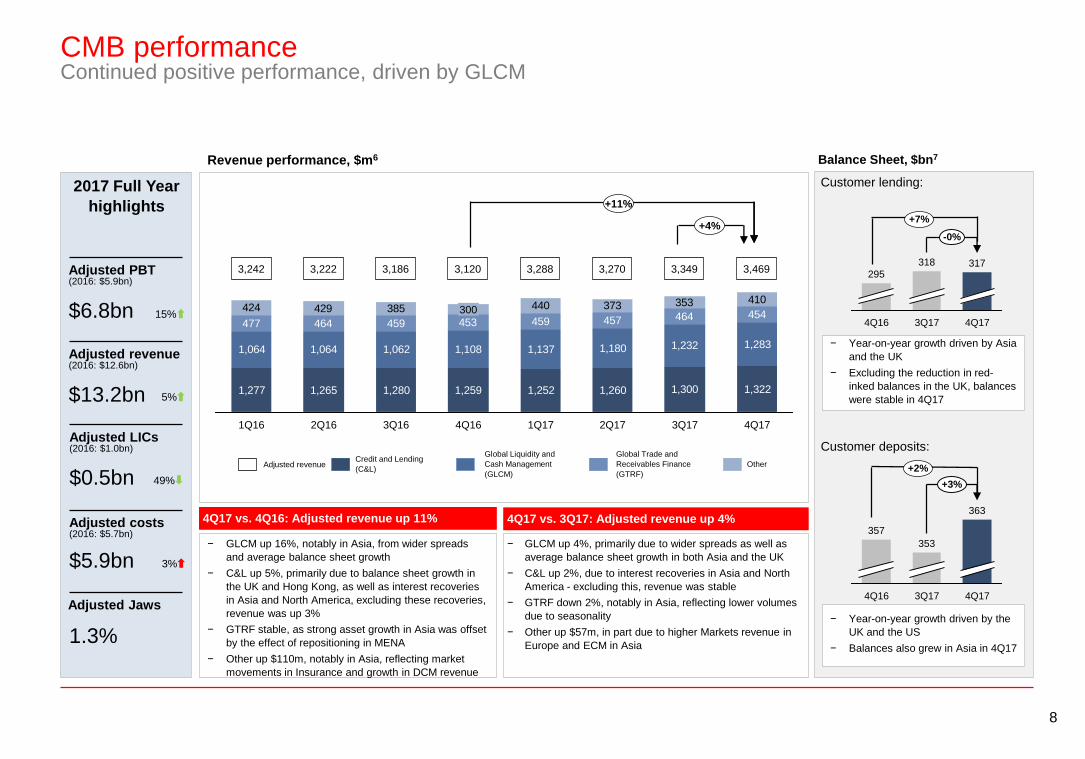
CMB performanceContinued positive performance, driven by GLCM
Adjusted PBT(2016: $5.9bn)
$6.8bn
Adjusted revenue(2016: $12.6bn)
$13.2bn
Adjusted LICs(2016: $1.0bn)
$0.5bn
Adjusted costs(2016: $5.7bn)
$5.9bn
Adjusted Jaws
1.3%
2017 Full Year
highlights
4Q17 vs. 4Q16: Adjusted revenue up 11%
− GLCM up 16%, notably in Asia, from wider spreads
and average balance sheet growth
− C&L up 5%, primarily due to balance sheet growth in
the UK and Hong Kong, as well as interest recoveries
in Asia and North America, excluding these recoveries,
revenue was up 3%
− GTRF stable, as strong asset growth in Asia was offset
by the effect of repositioning in MENA
− Other up $110m, notably in Asia, reflecting market
movements in Insurance and growth in DCM revenue
4Q17 vs. 3Q17: Adjusted revenue up 4%
− GLCM up 4%, primarily due to wider spreads as well as
average balance sheet growth in both Asia and the UK
− C&L up 2%, due to interest recoveries in Asia and North
America - excluding this, revenue was stable
− GTRF down 2%, notably in Asia, reflecting lower volumes
due to seasonality
− Other up $57m, in part due to higher Markets revenue in
Europe and ECM in Asia
Revenue performance, $m6
1,277 1,265 1,280 1,259 1,252 1,260 1,300 1,322
1,064 1,064 1,062 1,108 1,137 1,180 1,232 1,283
477 464 459 453 459 457 464 454424 429 385 440 373 353 410
4Q173Q172Q171Q174Q16
300
3Q162Q161Q16
Other
Global Trade and
Receivables Finance
(GTRF)
Global Liquidity and
Cash Management
(GLCM)
Credit and Lending
(C&L)
+11%
+4%
Adjusted revenue
3,222 3,288 3,2703,186 3,1203,242 3,349 3,469
Balance Sheet, $bn7
Customer lending:
Customer deposits:
− Year-on-year growth driven by Asia
and the UK
− Excluding the reduction in red-
inked balances in the UK, balances
were stable in 4Q17
317
3Q17
318
4Q16
295
-0%
4Q17
353
363
4Q17
+3%
3Q17
357
4Q16
− Year-on-year growth driven by the
UK and the US
− Balances also grew in Asia in 4Q17
+2%
+7%
15%
5%
49%
3%
9
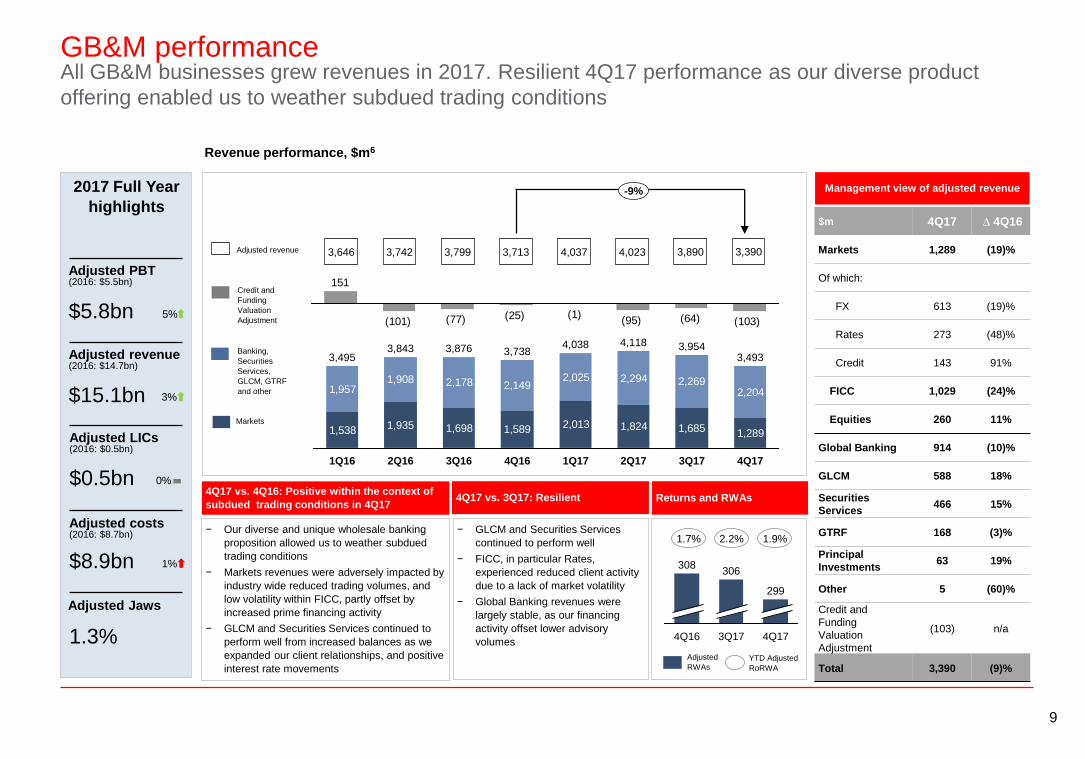
GB&M performanceAll GB&M businesses grew revenues in 2017. Resilient 4Q17 performance as our diverse product
offering enabled us to weather subdued trading conditions
Management view of adjusted revenue
Revenue performance, $m6
3,742 4,037 4,023
1,538 1,935 1,698 1,589 2,013 1,824 1,685 1,289
1,9571,908 2,178 2,149
2,025 2,294 2,2692,204
4Q17
3,493
3Q17
3,954
2Q17
4,118
1Q17
4,038
4Q16
3,738
3Q16
3,876
2Q16
3,843
1Q16
3,495
(103)(64)(95)(1)(25)(77)(101)
151Credit and
Funding
Valuation
Adjustment
Markets
Adjusted revenue
Banking,
Securities
Services,
GLCM, GTRF
and other
3,799 3,7133,646
4Q17 vs. 4Q16: Positive within the context of
subdued trading conditions in 4Q17
− Our diverse and unique wholesale banking
proposition allowed us to weather subdued
trading conditions
− Markets revenues were adversely impacted by
industry wide reduced trading volumes, and
low volatility within FICC, partly offset by
increased prime financing activity
− GLCM and Securities Services continued to
perform well from increased balances as we
expanded our client relationships, and positive
interest rate movements
− GLCM and Securities Services
continued to perform well
− FICC, in particular Rates,
experienced reduced client activity
due to a lack of market volatility
− Global Banking revenues were
largely stable, as our financing
activity offset lower advisory
volumes
4Q17 vs. 3Q17: Resilient
3,890
-9%
Returns and RWAs
4Q16 4Q17
306
299
3Q17
308
1.7% 2.2% 1.9%
Adjusted
RWAsYTD Adjusted
RoRWA
Adjusted PBT(2016: $5.5bn)
$5.8bn
Adjusted revenue(2016: $14.7bn)
$15.1bn
Adjusted LICs(2016: $0.5bn)
$0.5bn
Adjusted costs(2016: $8.7bn)
$8.9bn
Adjusted Jaws
1.3%
2017 Full Year
highlights
3,390
$m 4Q17 ∆ 4Q16
Markets 1,289 (19)%
Of which:
FX 613 (19)%
Rates 273 (48)%
Credit 143 91%
FICC 1,029 (24)%
Equities 260 11%
Global Banking 914 (10)%
GLCM 588 18%
Securities
Services466 15%
GTRF 168 (3)%
Principal
Investments63 19%
Other 5 (60)%
Credit and
Funding
Valuation
Adjustment
(103) n/a
Total 3,390 (9)%
5%
3%
0%
1%
10
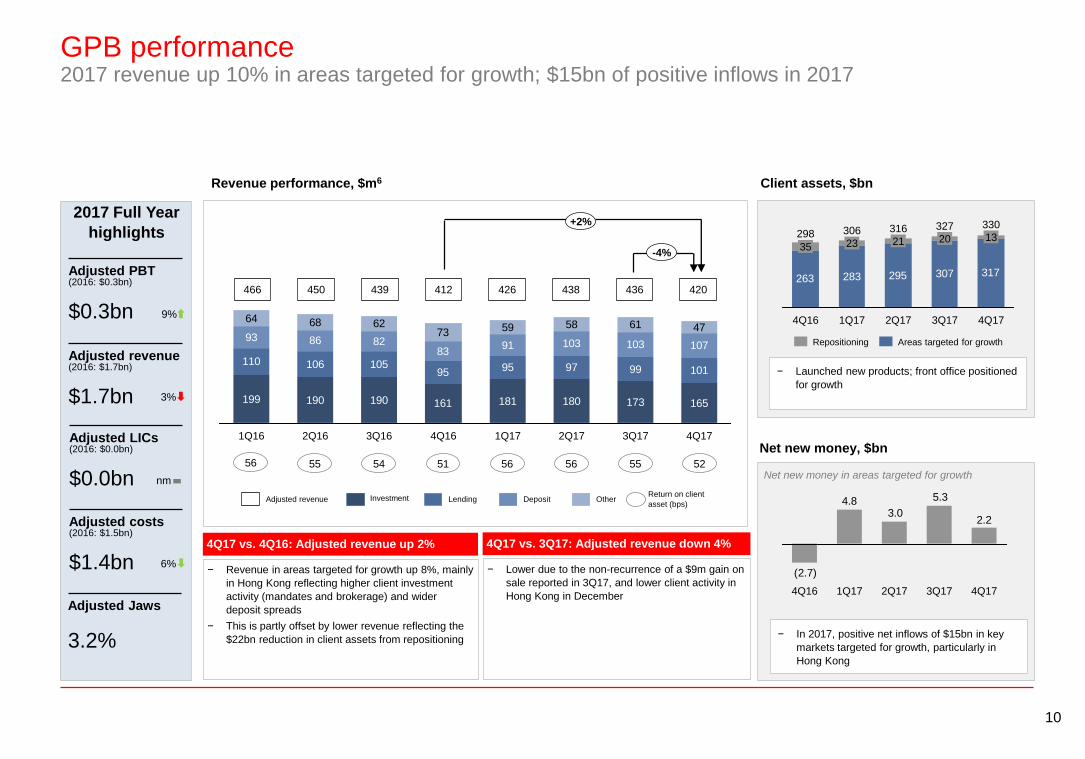
GPB performance2017 revenue up 10% in areas targeted for growth; $15bn of positive inflows in 2017
Adjusted PBT(2016: $0.3bn)
$0.3bn
Adjusted revenue(2016: $1.7bn)
$1.7bn
Adjusted LICs(2016: $0.0bn)
$0.0bn
Adjusted costs(2016: $1.5bn)
$1.4bn
Adjusted Jaws
3.2%
Client assets, $bn
263 283 295 317307
4Q17
330
13
3Q17
327
20
2Q17
316
21
1Q17
306
23
4Q16
298
35
− In 2017, positive net inflows of $15bn in key
markets targeted for growth, particularly in
Hong Kong
Net new money, $bn
Net new money in areas targeted for growth
2.2
5.3
3.04.8
(2.7)
4Q173Q172Q171Q174Q16
199 190 190 161 181 180 173 165
110 106 10595 95 97 99 101
93 86 8283
91 103 103 107
64 68 6273 59 58 61 47
2Q171Q174Q163Q162Q16 4Q173Q171Q16
Revenue performance, $m6
OtherDepositLendingInvestment
4Q17 vs. 4Q16: Adjusted revenue up 2%
− Revenue in areas targeted for growth up 8%, mainly
in Hong Kong reflecting higher client investment
activity (mandates and brokerage) and wider
deposit spreads
− This is partly offset by lower revenue reflecting the
$22bn reduction in client assets from repositioning
Return on client
asset (bps)
450 426 438439 412
4Q17 vs. 3Q17: Adjusted revenue down 4%
− Lower due to the non-recurrence of a $9m gain on
sale reported in 3Q17, and lower client activity in
Hong Kong in December
− Launched new products; front office positioned
for growth
55 5154 56 56 55
+2%
Areas targeted for growthRepositioning
436
52
-4%
Adjusted revenue
420
9%
3%
nm
6%
2017 Full Year
highlights
466
56
11
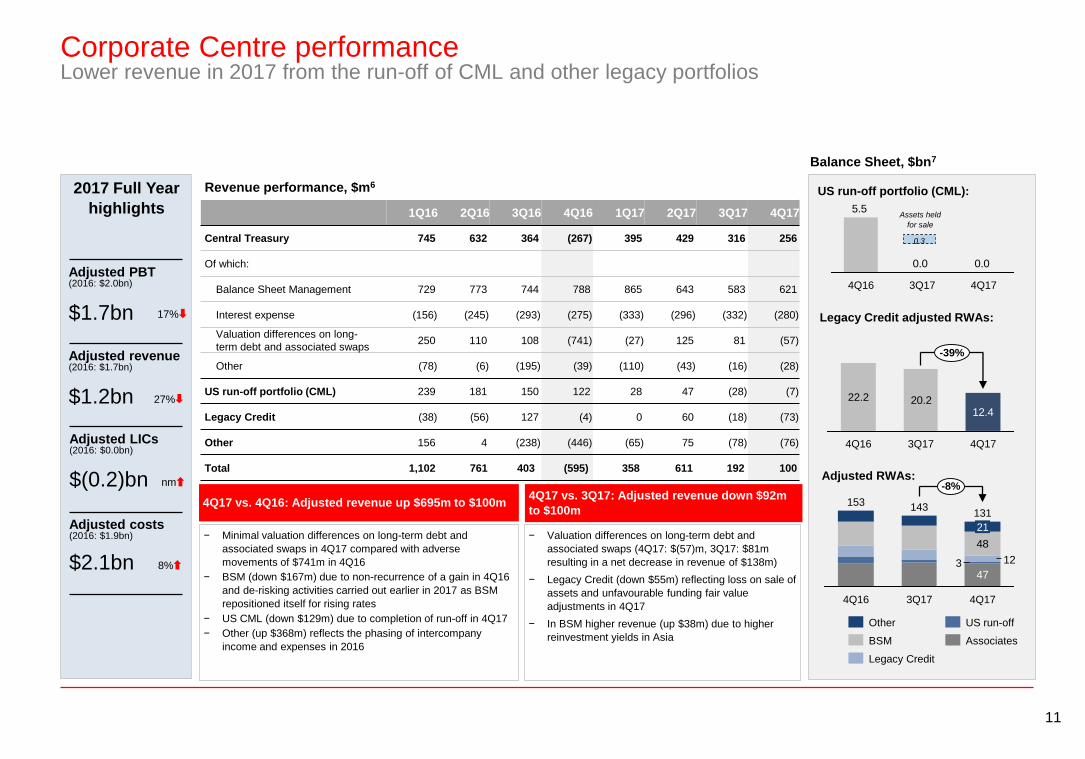
Corporate Centre performanceLower revenue in 2017 from the run-off of CML and other legacy portfolios
Adjusted PBT(2016: $2.0bn)
$1.7bn
Adjusted revenue(2016: $1.7bn)
$1.2bn
Adjusted LICs(2016: $0.0bn)
$(0.2)bn
Adjusted costs(2016: $1.9bn)
$2.1bn
2017 Full Year
highlights
Revenue performance, $m6
1Q16 2Q16 3Q16 4Q16 1Q17 2Q17 3Q17 4Q17
Central Treasury 745 632 364 (267) 395 429 316 256
Of which:
Balance Sheet Management 729 773 744 788 865 643 583 621
Interest expense (156) (245) (293) (275) (333) (296) (332) (280)
Valuation differences on long-
term debt and associated swaps250 110 108 (741) (27) 125 81 (57)
Other (78) (6) (195) (39) (110) (43) (16) (28)
US run-off portfolio (CML) 239 181 150 122 28 47 (28) (7)
Legacy Credit (38) (56) 127 (4) 0 60 (18) (73)
Other 156 4 (238) (446) (65) 75 (78) (76)
Total 1,102 761 403 (595) 358 611 192 100
Balance Sheet, $bn7
US run-off portfolio (CML):
Legacy Credit adjusted RWAs:
Adjusted RWAs:
0.00.0
5.5
4Q173Q174Q16
22.2 20.212.4
-39%
4Q173Q174Q16
47
12
48
-8%
4Q17
131
3
21
3Q17
143
4Q16
153
US run-off
Associates
Legacy Credit
BSM
Other
4Q17 vs. 4Q16: Adjusted revenue up $695m to $100m4Q17 vs. 3Q17: Adjusted revenue down $92m
to $100m
− Minimal valuation differences on long-term debt and
associated swaps in 4Q17 compared with adverse
movements of $741m in 4Q16
− BSM (down $167m) due to non-recurrence of a gain in 4Q16
and de-risking activities carried out earlier in 2017 as BSM
repositioned itself for rising rates
− US CML (down $129m) due to completion of run-off in 4Q17
− Other (up $368m) reflects the phasing of intercompany
income and expenses in 2016
− Valuation differences on long-term debt and
associated swaps (4Q17: $(57)m, 3Q17: $81m
resulting in a net decrease in revenue of $138m)
− Legacy Credit (down $55m) reflecting loss on sale of
assets and unfavourable funding fair value
adjustments in 4Q17
− In BSM higher revenue (up $38m) due to higher
reinvestment yields in Asia
Assets held
for sale
0.3
17%
27%
nm
8%
12
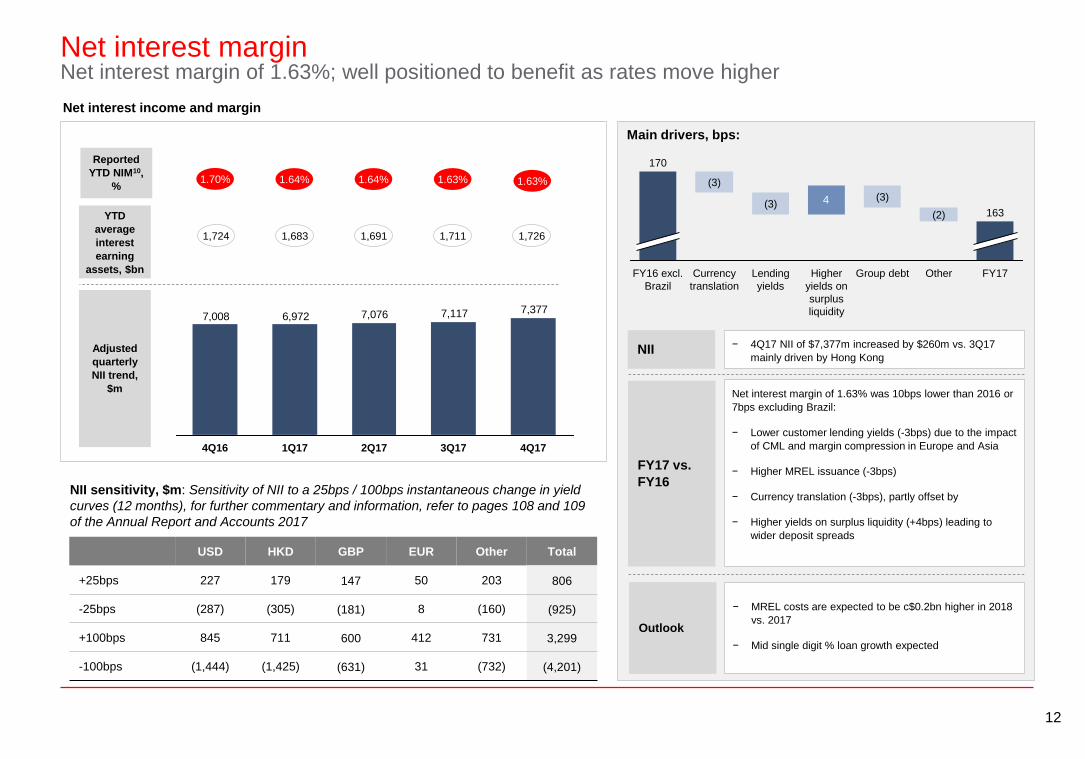
Main drivers, bps:
Net interest marginNet interest margin of 1.63%; well positioned to benefit as rates move higher
Net interest income and margin
1.64%
1,724 1,683
1.70%
FY17 vs.
FY16NII sensitivity, $m: Sensitivity of NII to a 25bps / 100bps instantaneous change in yield
curves (12 months), for further commentary and information, refer to pages 108 and 109
of the Annual Report and Accounts 2017
1.64%
1,691
Net interest margin of 1.63% was 10bps lower than 2016 or
7bps excluding Brazil:
− Lower customer lending yields (-3bps) due to the impact
of CML and margin compression in Europe and Asia
− Higher MREL issuance (-3bps)
− Currency translation (-3bps), partly offset by
− Higher yields on surplus liquidity (+4bps) leading to
wider deposit spreads
1.63%
1,711
NII − 4Q17 NII of $7,377m increased by $260m vs. 3Q17
mainly driven by Hong Kong
4
FY16 excl.
Brazil
170
(3)
FY17
163
Other
(2)
Group debt
(3)
Higher
yields on
surplus
liquidity
Lending
yields
Currency
translation
(3)
1,726
1.63%
Outlook
− MREL costs are expected to be c$0.2bn higher in 2018
vs. 2017
− Mid single digit % loan growth expected
Adjusted
quarterly
NII trend,
$m
7,3777,1177,0766,9727,008
4Q173Q174Q16 2Q171Q17
Reported
YTD NIM10,
%
YTD
average
interest
earning
assets, $bn
USD HKD GBP EUR Other Total
+25bps 227 179 147 50 203 806
-25bps (287) (305) (181) 8 (160) (925)
+100bps 845 711 600 412 731 3,299
-100bps (1,444) (1,425) (631) 31 (732) (4,201)
13
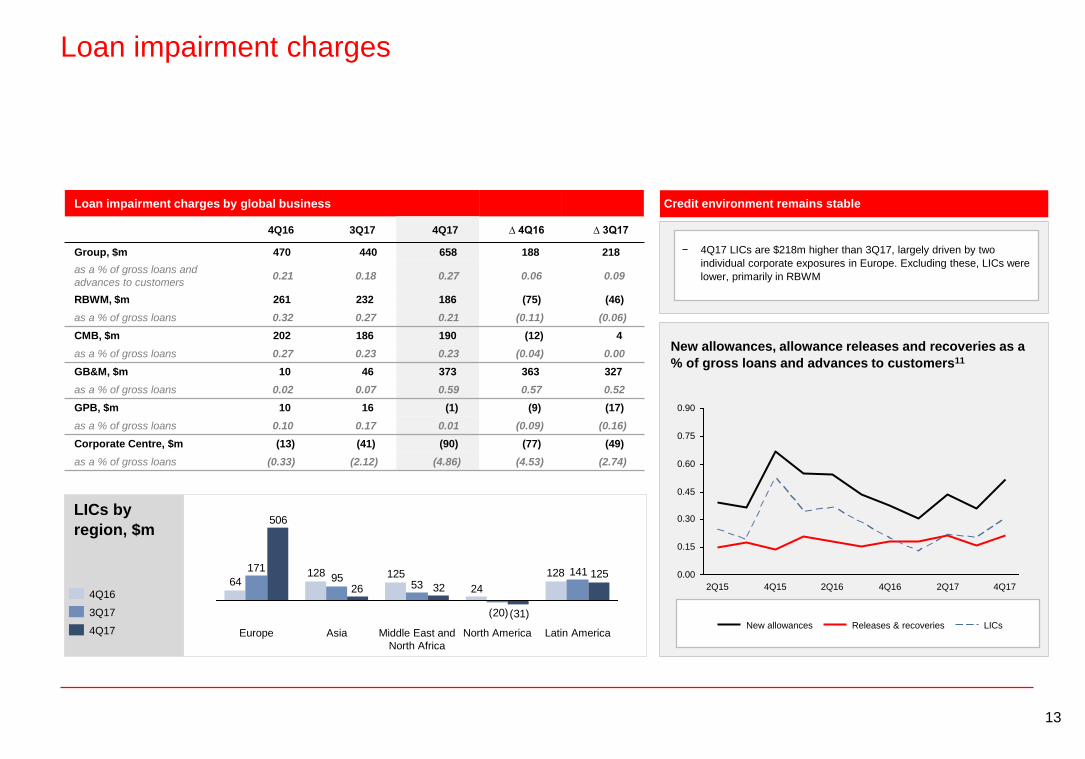
Loan impairment charges
− 4Q17 LICs are $218m higher than 3Q17, largely driven by two
individual corporate exposures in Europe. Excluding these, LICs were
lower, primarily in RBWM
LICs by
region, $m
Loan impairment charges by global business
4Q16 3Q17 4Q17 ∆ 4Q16 ∆ 3Q17
Group, $m 470 440 658 188 218
as a % of gross loans and
advances to customers0.21 0.18 0.27 0.06 0.09
RBWM, $m 261 232 186 (75) (46)
as a % of gross loans 0.32 0.27 0.21 (0.11) (0.06)
CMB, $m 202 186 190 (12) 4
as a % of gross loans 0.27 0.23 0.23 (0.04) 0.00
GB&M, $m 10 46 373 363 327
as a % of gross loans 0.02 0.07 0.59 0.57 0.52
GPB, $m 10 16 (1) (9) (17)
as a % of gross loans 0.10 0.17 0.01 (0.09) (0.16)
Corporate Centre, $m (13) (41) (90) (77) (49)
as a % of gross loans (0.33) (2.12) (4.86) (4.53) (2.74)
128
24
12512864
141
(20)
5395
171125
(31)
3226
506
Latin AmericaNorth AmericaMiddle East and
North Africa
AsiaEurope
Credit environment remains stable
0.45
0.60
0.75
0.90
0.00
0.15
0.30
2Q17 4Q174Q162Q15 4Q15 2Q16
New allowances Releases & recoveries LICs
New allowances, allowance releases and recoveries as a
% of gross loans and advances to customers11
4Q16
4Q17
3Q17
14
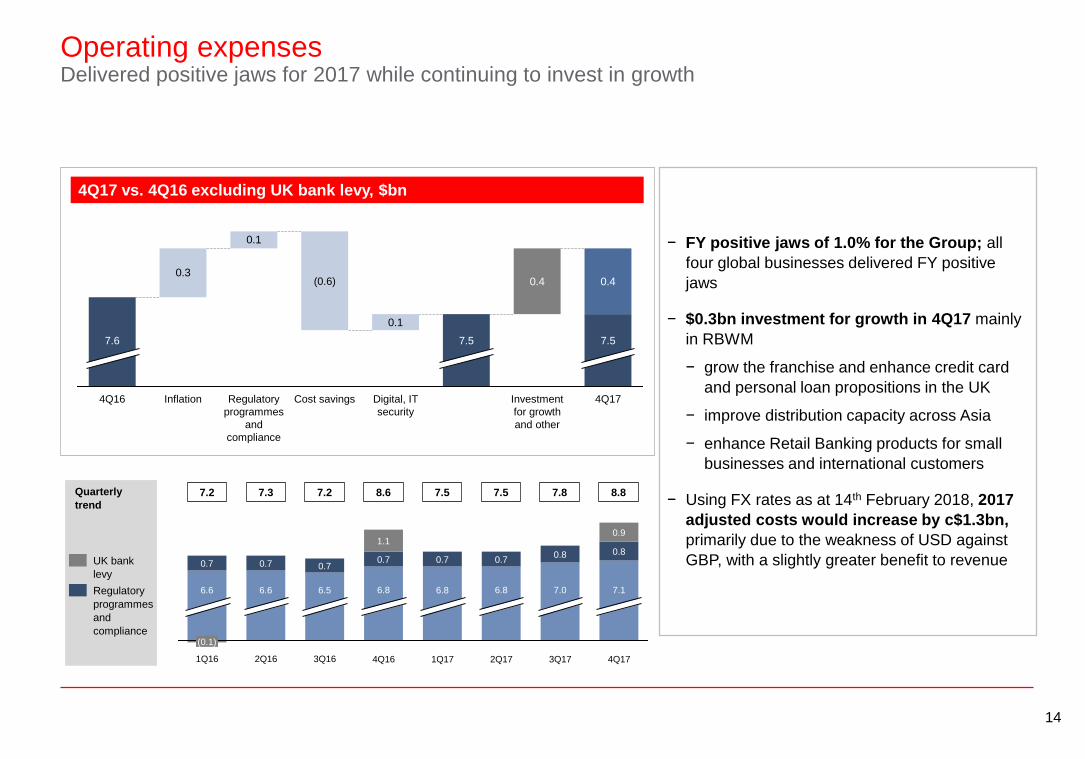
Operating expensesDelivered positive jaws for 2017 while continuing to invest in growth
0.9
4Q17
7.0
3Q16
0.7
6.8
2Q16
0.8
3Q172Q171Q174Q161Q16
6.8
0.7
6.8
0.7
1.1
6.5
0.7
6.6
0.7
6.6
0.7
(0.1)
7.1
0.8
Quarterly
trend
UK bank
levy
Regulatory
programmes
and
compliance
4Q17 vs. 4Q16 excluding UK bank levy, $bn
7.2 7.3 7.2 8.6 7.5 7.5 7.8
− FY positive jaws of 1.0% for the Group; all
four global businesses delivered FY positive
jaws
− $0.3bn investment for growth in 4Q17 mainly
in RBWM
− grow the franchise and enhance credit card
and personal loan propositions in the UK
− improve distribution capacity across Asia
− enhance Retail Banking products for small
businesses and international customers
− Using FX rates as at 14th February 2018, 2017
adjusted costs would increase by c$1.3bn,
primarily due to the weakness of USD against
GBP, with a slightly greater benefit to revenue
0.3
0.1
0.1
0.4 0.4
Cost savingsRegulatory
programmes
and
compliance
Inflation4Q16
7.5
4Q17
(0.6)
Investment
for growth
and other
7.5
Digital, IT
security
7.6
8.8
15
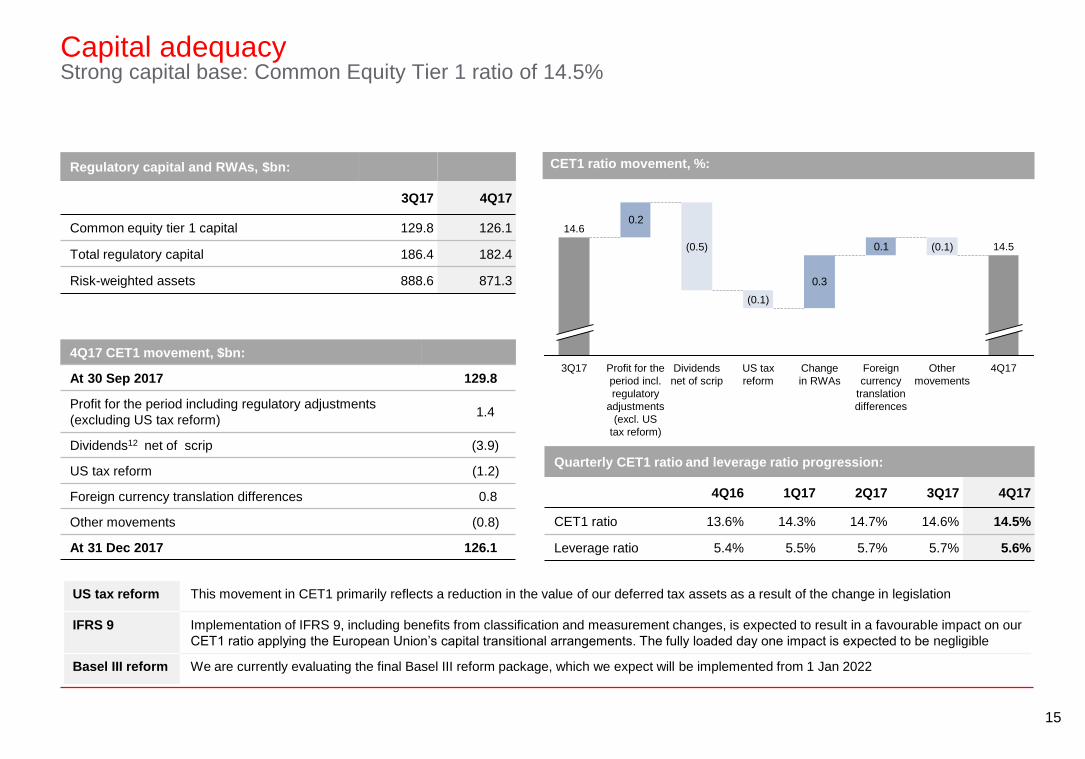
Capital adequacyStrong capital base: Common Equity Tier 1 ratio of 14.5%
CET1 ratio movement, %:
4Q17 CET1 movement, $bn:
At 30 Sep 2017 129.8
Profit for the period including regulatory adjustments
(excluding US tax reform)1.4
Dividends12 net of scrip (3.9)
US tax reform (1.2)
Foreign currency translation differences 0.8
Other movements (0.8)
At 31 Dec 2017 126.1
Regulatory capital and RWAs, $bn:
3Q17 4Q17
Common equity tier 1 capital 129.8 126.1
Total regulatory capital 186.4 182.4
Risk-weighted assets 888.6 871.3
Quarterly CET1 ratio and leverage ratio progression:
4Q16 1Q17 2Q17 3Q17 4Q17
CET1 ratio 13.6% 14.3% 14.7% 14.6% 14.5%
Leverage ratio 5.4% 5.5% 5.7% 5.7% 5.6%
0.1
0.3
0.2
4Q17
14.5
Other
movements
(0.1)
Foreign
currency
translation
differences
Change
in RWAs
US tax
reform
(0.1)
Dividends
net of scrip
(0.5)
Profit for the
period incl.
regulatory
adjustments
(excl. US
tax reform)
3Q17
14.6
US tax reform This movement in CET1 primarily reflects a reduction in the value of our deferred tax assets as a result of the change in legislation
IFRS 9 Implementation of IFRS 9, including benefits from classification and measurement changes, is expected to result in a favourable impact on our
CET1 ratio applying the European Union’s capital transitional arrangements. The fully loaded day one impact is expected to be negligible
Basel III reform We are currently evaluating the final Basel III reform package, which we expect will be implemented from 1 Jan 2022
16
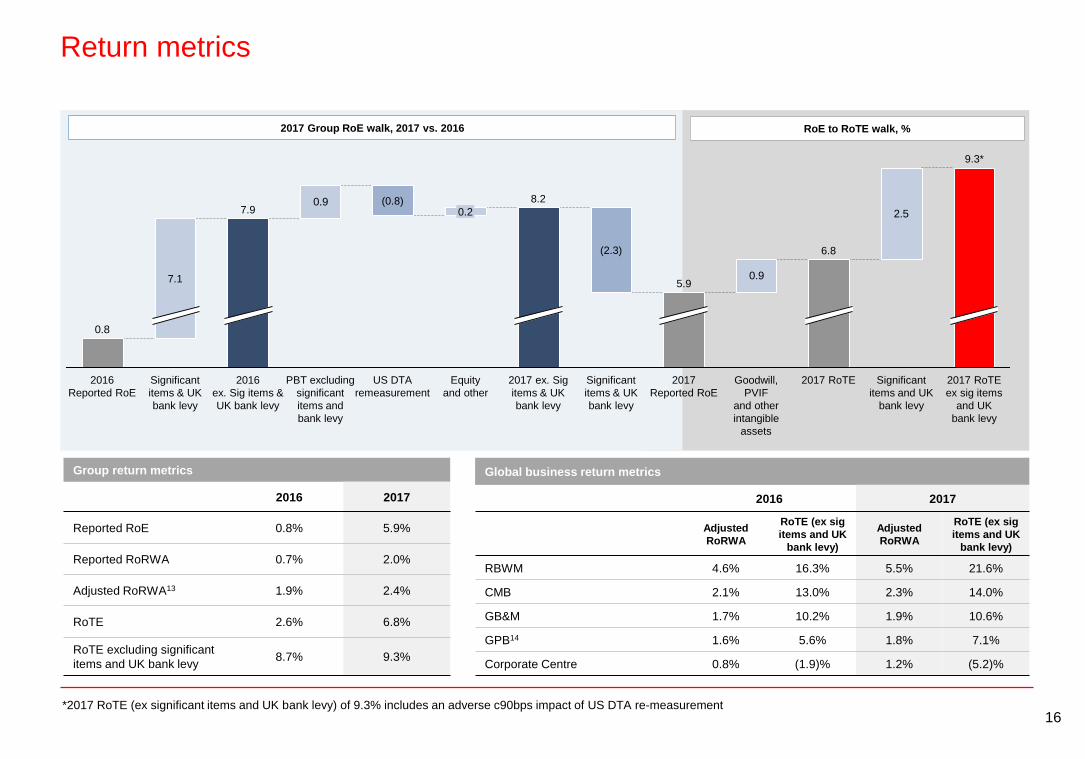
Return metrics
2.5
0.9
0.9
0.8
2016
Reported RoE
2017 ex. Sig
items & UK
bank levy
8.2
Equity
and other
0.2
US DTA
remeasurement
(0.8)
PBT excluding
significant
items and
bank levy
2016
ex. Sig items &
UK bank levy
Goodwill,
PVIF
and other
intangible
assets
Significant
items & UK
bank levy
7.1
2017 RoTE Significant
items and UK
bank levy
9.3*
6.8
2017
Reported RoE
5.9
Significant
items & UK
bank levy
2017 RoTE
ex sig items
and UK
bank levy
(2.3)
7.9
2017 Group RoE walk, 2017 vs. 2016 RoE to RoTE walk, %
Group return metrics
2016 2017
Reported RoE 0.8% 5.9%
Reported RoRWA 0.7% 2.0%
Adjusted RoRWA13 1.9% 2.4%
RoTE 2.6% 6.8%
RoTE excluding significant
items and UK bank levy8.7% 9.3%
Global business return metrics
2016 2017
Adjusted
RoRWA
RoTE (ex sig
items and UK
bank levy)
Adjusted
RoRWA
RoTE (ex sig
items and UK
bank levy)
RBWM 4.6% 16.3% 5.5% 21.6%
CMB 2.1% 13.0% 2.3% 14.0%
GB&M 1.7% 10.2% 1.9% 10.6%
GPB14 1.6% 5.6% 1.8% 7.1%
Corporate Centre 0.8% (1.9)% 1.2% (5.2)%
*2017 RoTE (ex significant items and UK bank levy) of 9.3% includes an adverse c90bps impact of US DTA re-measurement

Strategy Update
18
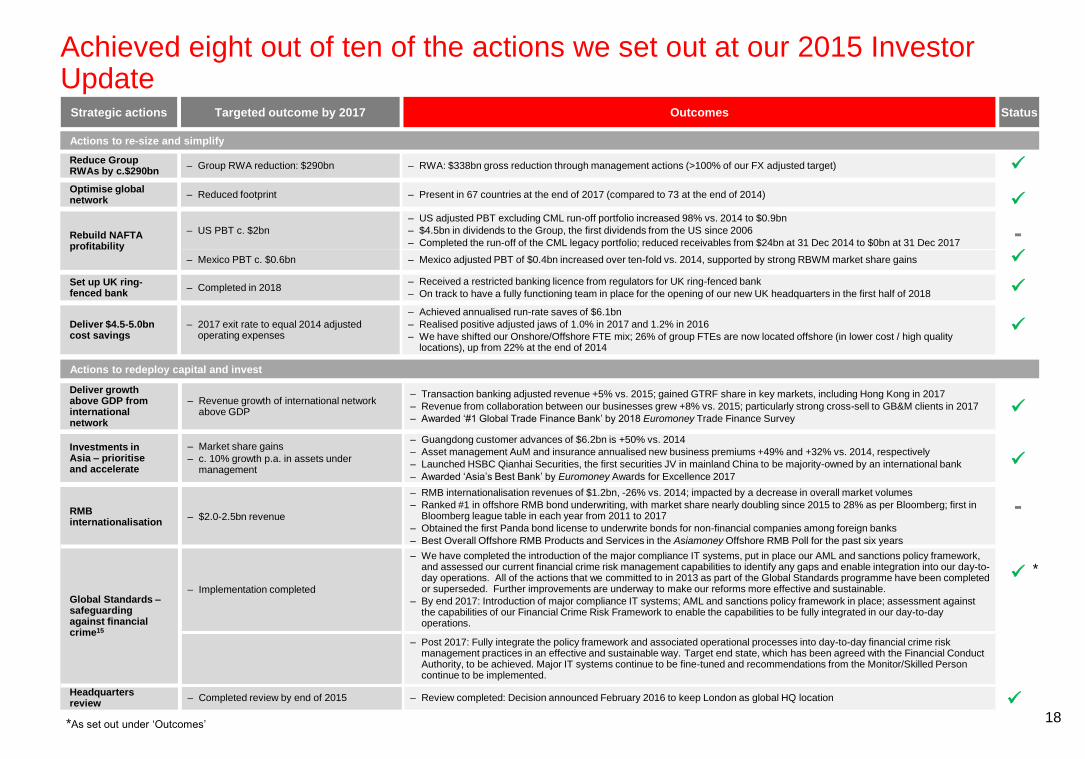
Deliver growth above GDP from international network
‒ Revenue growth of international network above GDP
‒ Transaction banking adjusted revenue +5% vs. 2015; gained GTRF share in key markets, including Hong Kong in 2017
‒ Revenue from collaboration between our businesses grew +8% vs. 2015; particularly strong cross-sell to GB&M clients in 2017
‒ Awarded ‘#1 Global Trade Finance Bank’ by 2018 Euromoney Trade Finance Survey
Investments in Asia – prioritise and accelerate
‒ Market share gains
‒ c. 10% growth p.a. in assets under management
‒ Guangdong customer advances of $6.2bn is +50% vs. 2014
‒ Asset management AuM and insurance annualised new business premiums +49% and +32% vs. 2014, respectively
‒ Launched HSBC Qianhai Securities, the first securities JV in mainland China to be majority-owned by an international bank
‒ Awarded ‘Asia’s Best Bank’ by Euromoney Awards for Excellence 2017
RMB internationalisation
‒ $2.0-2.5bn revenue
‒ RMB internationalisation revenues of $1.2bn, -26% vs. 2014; impacted by a decrease in overall market volumes
‒ Ranked #1 in offshore RMB bond underwriting, with market share nearly doubling since 2015 to 28% as per Bloomberg; first in Bloomberg league table in each year from 2011 to 2017
‒ Obtained the first Panda bond license to underwrite bonds for non-financial companies among foreign banks
‒ Best Overall Offshore RMB Products and Services in the Asiamoney Offshore RMB Poll for the past six years
Global Standards –safeguarding against financialcrime15
‒ Implementation completed
‒ We have completed the introduction of the major compliance IT systems, put in place our AML and sanctions policy framework, and assessed our current financial crime risk management capabilities to identify any gaps and enable integration into our day-to-day operations. All of the actions that we committed to in 2013 as part of the Global Standards programme have been completed or superseded. Further improvements are underway to make our reforms more effective and sustainable.
‒ By end 2017: Introduction of major compliance IT systems; AML and sanctions policy framework in place; assessment against the capabilities of our Financial Crime Risk Framework to enable the capabilities to be fully integrated in our day-to-day operations.
‒ Post 2017: Fully integrate the policy framework and associated operational processes into day-to-day financial crime risk management practices in an effective and sustainable way. Target end state, which has been agreed with the Financial Conduct Authority, to be achieved. Major IT systems continue to be fine-tuned and recommendations from the Monitor/Skilled Person continue to be implemented.
Headquarters review
‒ Completed review by end of 2015 ‒ Review completed: Decision announced February 2016 to keep London as global HQ location
Reduce Group RWAs by c.$290bn
‒ Group RWA reduction: $290bn ‒ RWA: $338bn gross reduction through management actions (>100% of our FX adjusted target)
Optimise global network
‒ Reduced footprint ‒ Present in 67 countries at the end of 2017 (compared to 73 at the end of 2014)
Rebuild NAFTA profitability
‒ US PBT c. $2bn
‒ US adjusted PBT excluding CML run-off portfolio increased 98% vs. 2014 to $0.9bn
‒ $4.5bn in dividends to the Group, the first dividends from the US since 2006
‒ Completed the run-off of the CML legacy portfolio; reduced receivables from $24bn at 31 Dec 2014 to $0bn at 31 Dec 2017
‒ Mexico PBT c. $0.6bn ‒ Mexico adjusted PBT of $0.4bn increased over ten-fold vs. 2014, supported by strong RBWM market share gains
Set up UK ring-fenced bank
‒ Completed in 2018‒ Received a restricted banking licence from regulators for UK ring-fenced bank
‒ On track to have a fully functioning team in place for the opening of our new UK headquarters in the first half of 2018
Deliver $4.5-5.0bn cost savings
‒ 2017 exit rate to equal 2014 adjusted operating expenses
‒ Achieved annualised run-rate saves of $6.1bn
‒ Realised positive adjusted jaws of 1.0% in 2017 and 1.2% in 2016
‒ We have shifted our Onshore/Offshore FTE mix; 26% of group FTEs are now located offshore (in lower cost / high quality locations), up from 22% at the end of 2014
Strategic actions Outcomes
Actions to re-size and simplify
Actions to redeploy capital and invest
Targeted outcome by 2017
Achieved eight out of ten of the actions we set out at our 2015 Investor Update
-
-
Status
*
*As set out under ‘Outcomes’
19
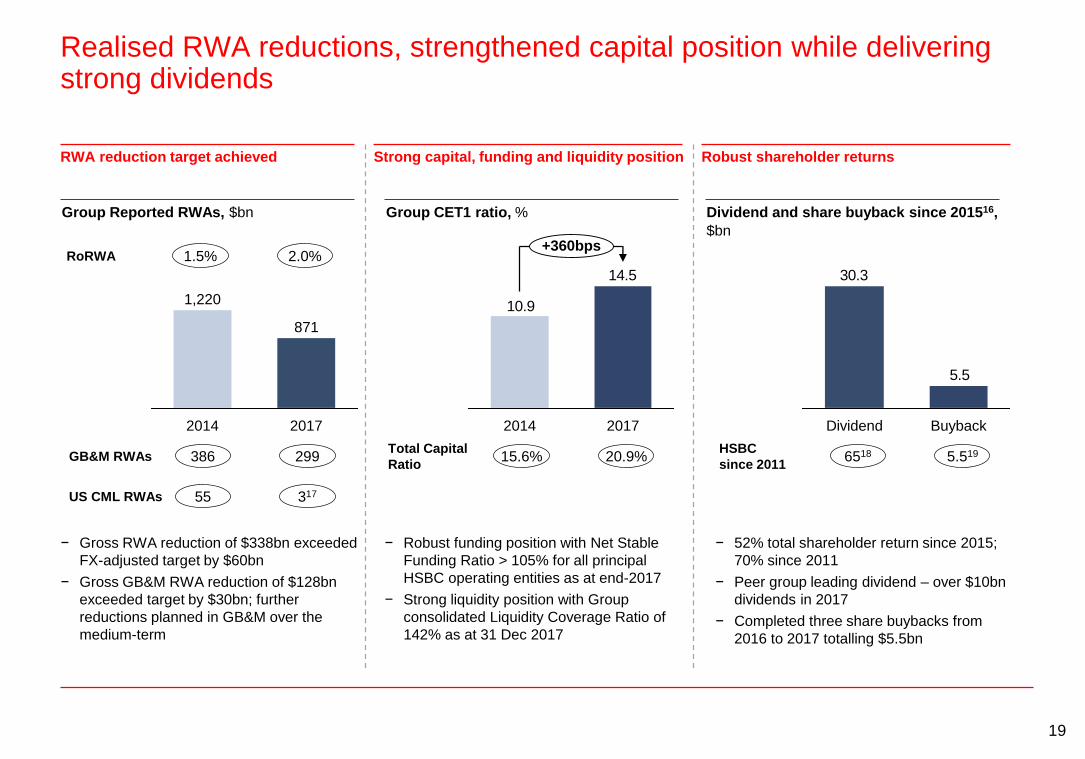
Realised RWA reductions, strengthened capital position while delivering strong dividends
20172014
871
1,220
− Gross RWA reduction of $338bn exceeded
FX-adjusted target by $60bn
− Gross GB&M RWA reduction of $128bn
exceeded target by $30bn; further
reductions planned in GB&M over the
medium-term
10.9
14.5
+360bps
20172014
− Robust funding position with Net Stable
Funding Ratio > 105% for all principal
HSBC operating entities as at end-2017
− Strong liquidity position with Group
consolidated Liquidity Coverage Ratio of
142% as at 31 Dec 2017
20.9%15.6%Total Capital
Ratio 299386GB&M RWAs
31755US CML RWAs
RWA reduction target achieved
Group Reported RWAs, $bn Group CET1 ratio, %
Strong capital, funding and liquidity position
5.5
30.3
BuybackDividend
Dividend and share buyback since 201516,
$bn
Robust shareholder returns
− 52% total shareholder return since 2015;
70% since 2011
− Peer group leading dividend – over $10bn
dividends in 2017
− Completed three share buybacks from
2016 to 2017 totalling $5.5bn
HSBC
since 20115.5196518
2.0%1.5%RoRWA
20
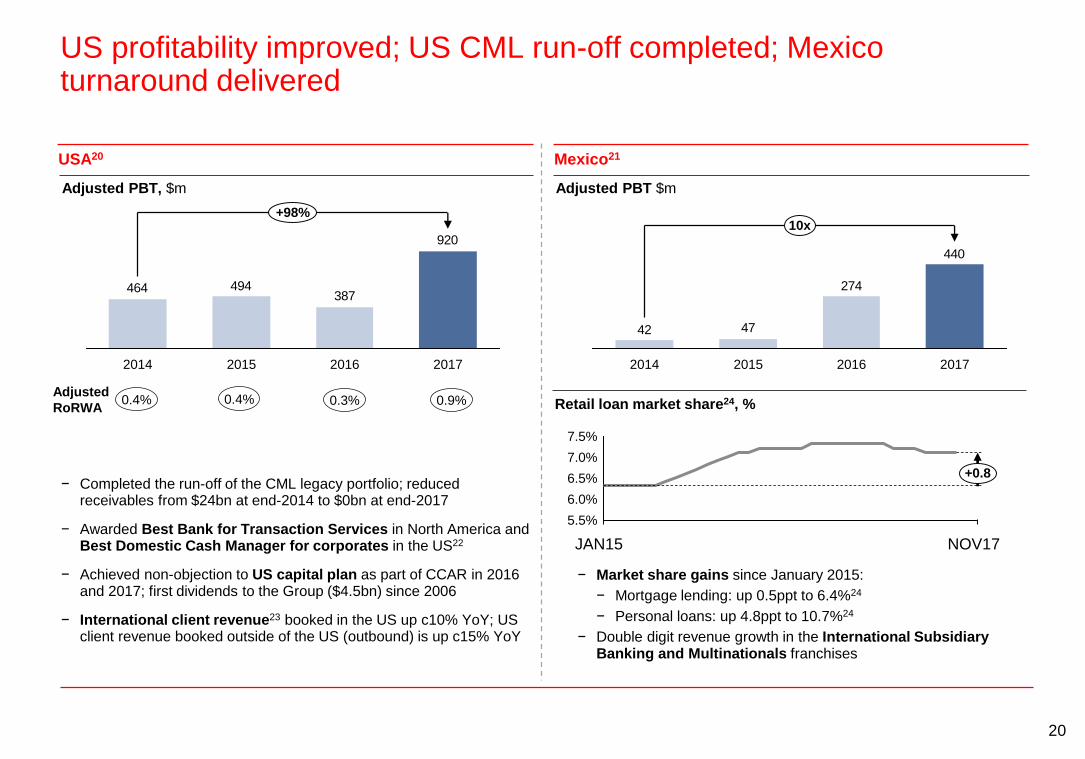
US profitability improved; US CML run-off completed; Mexico turnaround delivered
− Completed the run-off of the CML legacy portfolio; reduced receivables from $24bn at end-2014 to $0bn at end-2017
− Awarded Best Bank for Transaction Services in North America and Best Domestic Cash Manager for corporates in the US22
− Achieved non-objection to US capital plan as part of CCAR in 2016 and 2017; first dividends to the Group ($4.5bn) since 2006
− International client revenue23 booked in the US up c10% YoY; US client revenue booked outside of the US (outbound) is up c15% YoY
− Market share gains since January 2015:
− Mortgage lending: up 0.5ppt to 6.4%24
− Personal loans: up 4.8ppt to 10.7%24
− Double digit revenue growth in the International Subsidiary Banking and Multinationals franchises
5.5%
6.5%
7.0%
6.0%
7.5%
+0.8
JAN15 NOV17
Mexico21USA20
Adjusted PBT, $m Adjusted PBT $m
Retail loan market share24, %
387494464
920
+98%
2017201620152014
0.4%Adjusted
RoRWA0.4% 0.3% 0.9%
440
274
4742
20162015 2017
10x
2014
21
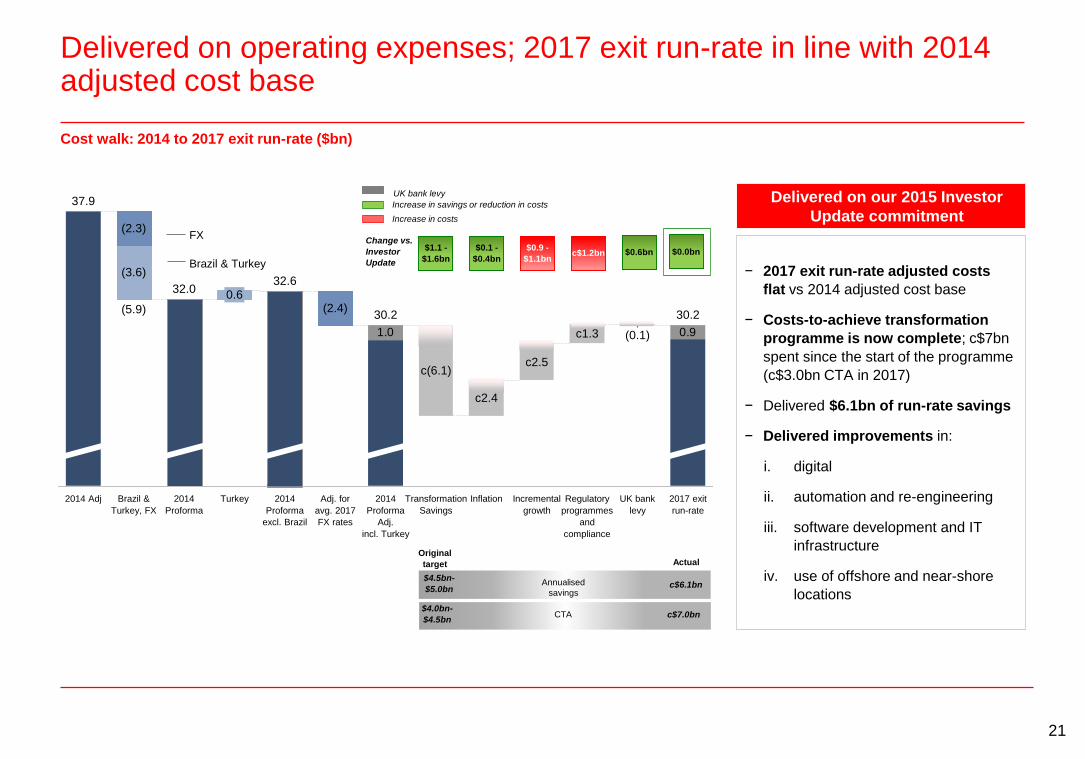
Delivered on operating expenses; 2017 exit run-rate in line with 2014 adjusted cost base
Cost walk: 2014 to 2017 exit run-rate ($bn)
0.91.0 (0.1)
Regulatory
programmes
and
compliance
30.2
2017 exit
run-rate
c1.3
Incremental
growth
c2.5
Inflation
c2.4
2014
Proforma
32.0
Brazil &
Turkey, FX
(5.9)
(3.6)
(2.3)
2014 Adj 2014
Proforma
excl. Brazil
UK bank
levy
Adj. for
avg. 2017
FX rates
30.2
32.6
Turkey
(2.4)
2014
Proforma
Adj.
incl. Turkey
c(6.1)
Transformation
Savings
0.6
37.9
FX
Brazil & Turkey
Original
target Actual
CTA c$7.0bn
c$6.1bn$4.5bn-
$5.0bn
$4.0bn-
$4.5bn
Annualised
savings
$1.1 -
$1.6bn
$0.1 -
$0.4bn
$0.9 -
$1.1bnc$1.2bn $0.6bn
Change vs.
Investor
Update
$0.0bn
Increase in savings or reduction in costs
Increase in costs
UK bank levy
− 2017 exit run-rate adjusted costs
flat vs 2014 adjusted cost base
− Costs-to-achieve transformation
programme is now complete; c$7bn
spent since the start of the programme
(c$3.0bn CTA in 2017)
− Delivered $6.1bn of run-rate savings
− Delivered improvements in:
i. digital
ii. automation and re-engineering
iii. software development and IT
infrastructure
iv. use of offshore and near-shore
locations
Delivered on our 2015 Investor
Update commitment
22
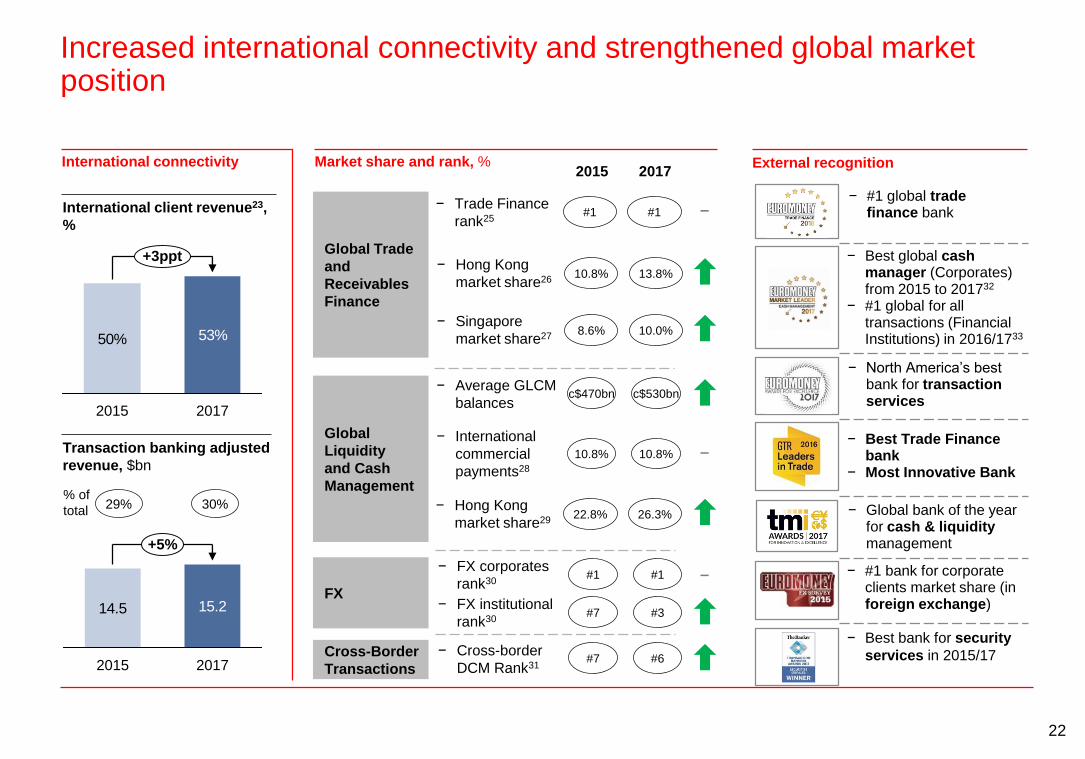
Increased international connectivity and strengthened global market position
29%% of
total
International connectivity
International client revenue23,
%
Transaction banking adjusted
revenue, $bn
15.214.5
+5%
20172015
53%50%
+3ppt
20172015
FX
Cross-Border
Transactions
Global
Liquidity
and Cash
Management
Global Trade
and
Receivables
Finance
Market share and rank, %
− Hong Kong
market share26
− Average GLCM
balances
− Trade Finance
rank25
− Cross-border
DCM Rank31
− International
commercial
payments28
− FX corporates
rank30
− Singapore
market share27
20172015
13.8%10.8%
c$530bnc$470bn
#1#1 –
#6#7
10.8%10.8%
#1#1 –
10.0%8.6%
30%
External recognition
–
− Hong Kong
market share2926.3%22.8% − Global bank of the year
for cash & liquiditymanagement
− North America’s best bank for transaction services
− Best global cash manager (Corporates) from 2015 to 201732
− #1 global for all transactions (Financial Institutions) in 2016/1733
− Best bank for security
services in 2015/17
− Best Trade Finance bank
− Most Innovative Bank
− #1 bank for corporate clients market share (in foreign exchange)
− #1 global trade finance bank
− FX institutional
rank30#3#7
23
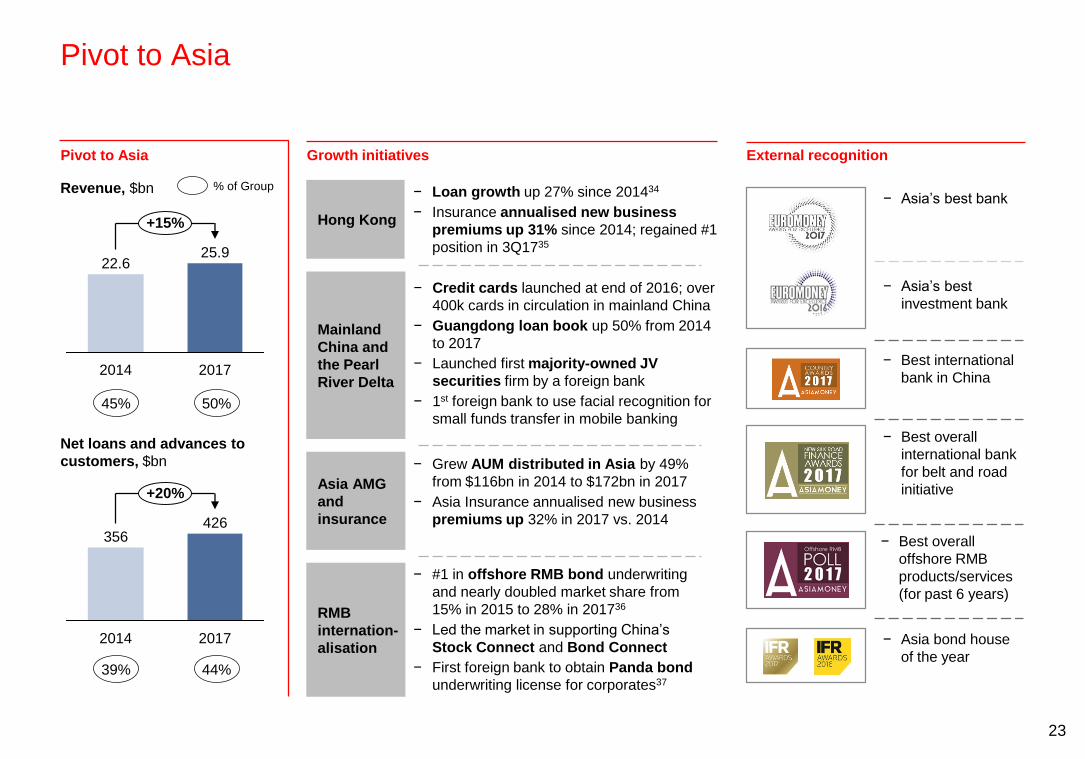
Pivot to Asia
Pivot to Asia
25.9
+15%
20172014
22.6
Revenue, $bn− Asia’s best bank
− Best international
bank in China
− Best overall
international bank
for belt and road
initiative
− Best overall
offshore RMB
products/services
(for past 6 years)
− Asia bond house
of the year
− Asia’s best
investment bank
+20%
426
20172014
356
Net loans and advances to
customers, $bn
External recognition
50%45%
44%39%
% of Group
Mainland
China and
the Pearl
River Delta
Growth initiatives
Hong Kong
Asia AMG
and
insurance
− Credit cards launched at end of 2016; over
400k cards in circulation in mainland China
− Guangdong loan book up 50% from 2014
to 2017
− Launched first majority-owned JV
securities firm by a foreign bank
− 1st foreign bank to use facial recognition for
small funds transfer in mobile banking
− Grew AUM distributed in Asia by 49%
from $116bn in 2014 to $172bn in 2017
− Asia Insurance annualised new business
premiums up 32% in 2017 vs. 2014
RMB
internation-
alisation
− #1 in offshore RMB bond underwriting
and nearly doubled market share from
15% in 2015 to 28% in 201736
− Led the market in supporting China’s
Stock Connect and Bond Connect
− First foreign bank to obtain Panda bond
underwriting license for corporates37
− Loan growth up 27% since 201434
− Insurance annualised new business
premiums up 31% since 2014; regained #1
position in 3Q1735
24
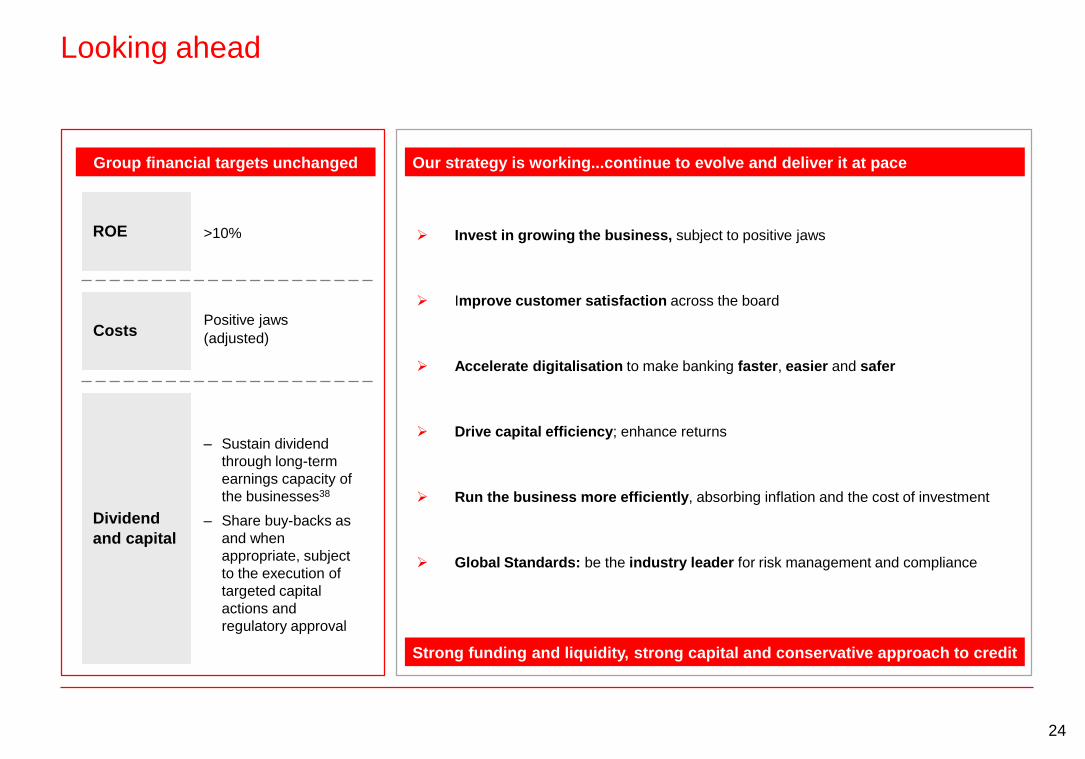
Looking ahead
CostsPositive jaws
(adjusted)
Dividend
and capital
ROE >10%
Group financial targets unchanged
‒ Sustain dividend
through long-term
earnings capacity of
the businesses38
‒ Share buy-backs as
and when
appropriate, subject
to the execution of
targeted capital
actions and
regulatory approval
Invest in growing the business, subject to positive jaws
Improve customer satisfaction across the board
Accelerate digitalisation to make banking faster, easier and safer
Drive capital efficiency; enhance returns
Run the business more efficiently, absorbing inflation and the cost of investment
Global Standards: be the industry leader for risk management and compliance
Our strategy is working...continue to evolve and deliver it at pace
Strong funding and liquidity, strong capital and conservative approach to credit

Appendix
26
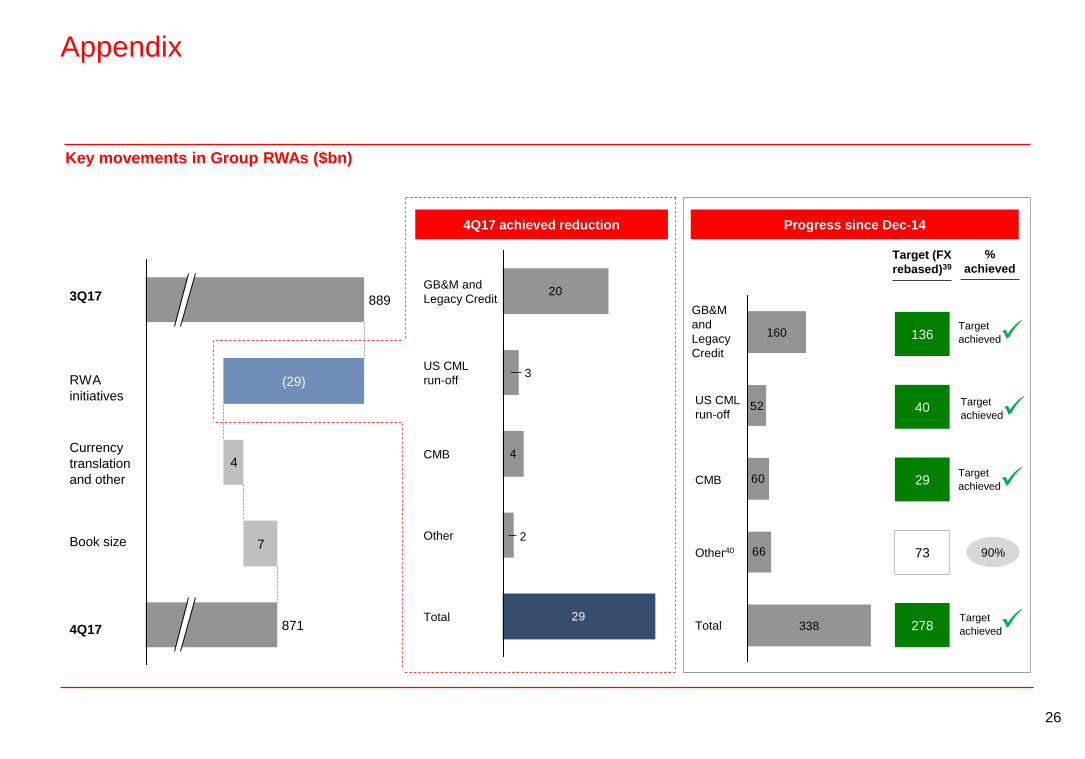
Appendix
Key movements in Group RWAs ($bn)
4Q17 achieved reduction Progress since Dec-14
136
278
73
29
40
GB&M
and
Legacy
Credit
Total
Other40
CMB
US CML
run-off
60
66
52
338
160
Target (FX
rebased)39
Target
achieved
20
4
2
3
29Total
Other
CMB
US CML
run-off
GB&M and
Legacy Credit
7
4
(29)
871
8893Q17
Book size
4Q17
Currency
translation
and other
%
achieved
90%
RWA
initiatives Target
achieved
Target
achieved
Target
achieved
27
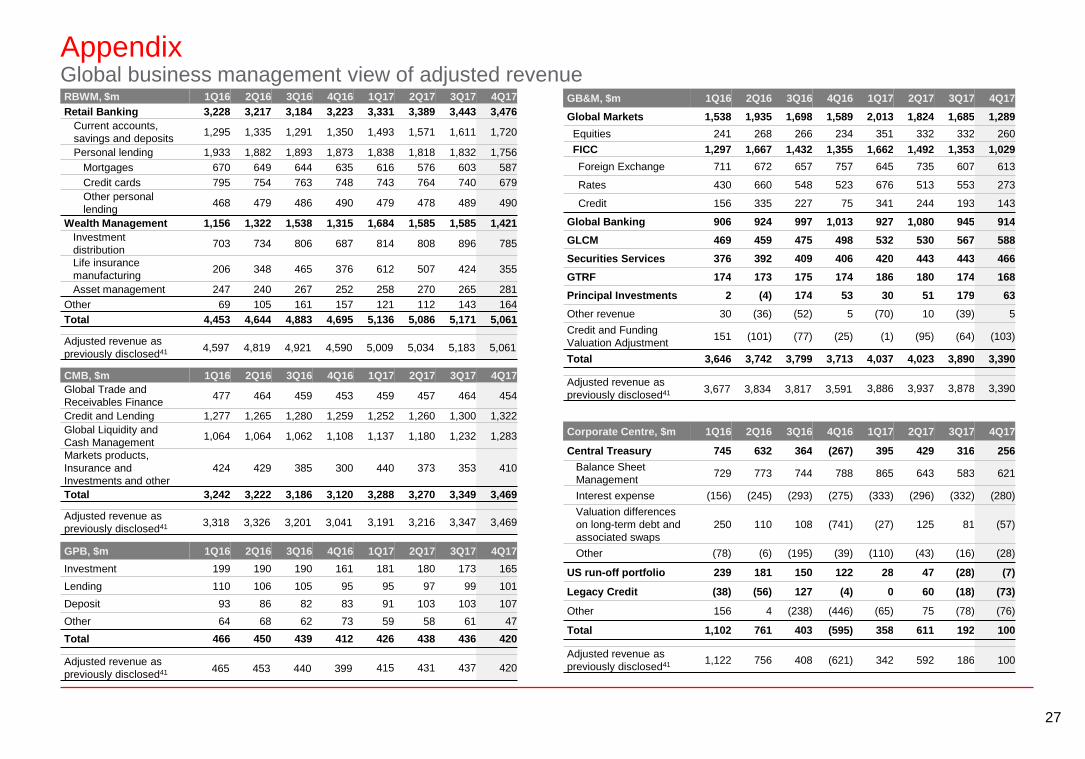
AppendixGlobal business management view of adjusted revenue
GB&M, $m 1Q16 2Q16 3Q16 4Q16 1Q17 2Q17 3Q17 4Q17
Global Markets 1,538 1,935 1,698 1,589 2,013 1,824 1,685 1,289
Equities 241 268 266 234 351 332 332 260
FICC 1,297 1,667 1,432 1,355 1,662 1,492 1,353 1,029
Foreign Exchange 711 672 657 757 645 735 607 613
Rates 430 660 548 523 676 513 553 273
Credit 156 335 227 75 341 244 193 143
Global Banking 906 924 997 1,013 927 1,080 945 914
GLCM 469 459 475 498 532 530 567 588
Securities Services 376 392 409 406 420 443 443 466
GTRF 174 173 175 174 186 180 174 168
Principal Investments 2 (4) 174 53 30 51 179 63
Other revenue 30 (36) (52) 5 (70) 10 (39) 5
Credit and Funding
Valuation Adjustment151 (101) (77) (25) (1) (95) (64) (103)
Total 3,646 3,742 3,799 3,713 4,037 4,023 3,890 3,390
Adjusted revenue as
previously disclosed41 3,677 3,834 3,817 3,591 3,886 3,937 3,878 3,390
RBWM, $m 1Q16 2Q16 3Q16 4Q16 1Q17 2Q17 3Q17 4Q17
Retail Banking 3,228 3,217 3,184 3,223 3,331 3,389 3,443 3,476
Current accounts,
savings and deposits1,295 1,335 1,291 1,350 1,493 1,571 1,611 1,720
Personal lending 1,933 1,882 1,893 1,873 1,838 1,818 1,832 1,756
Mortgages 670 649 644 635 616 576 603 587
Credit cards 795 754 763 748 743 764 740 679
Other personal
lending468 479 486 490 479 478 489 490
Wealth Management 1,156 1,322 1,538 1,315 1,684 1,585 1,585 1,421
Investment
distribution703 734 806 687 814 808 896 785
Life insurance
manufacturing206 348 465 376 612 507 424 355
Asset management 247 240 267 252 258 270 265 281
Other 69 105 161 157 121 112 143 164
Total 4,453 4,644 4,883 4,695 5,136 5,086 5,171 5,061
Adjusted revenue as
previously disclosed41 4,597 4,819 4,921 4,590 5,009 5,034 5,183 5,061
CMB, $m 1Q16 2Q16 3Q16 4Q16 1Q17 2Q17 3Q17 4Q17
Global Trade and
Receivables Finance477 464 459 453 459 457 464 454
Credit and Lending 1,277 1,265 1,280 1,259 1,252 1,260 1,300 1,322
Global Liquidity and
Cash Management1,064 1,064 1,062 1,108 1,137 1,180 1,232 1,283
Markets products,
Insurance and
Investments and other
424 429 385 300 440 373 353 410
Total 3,242 3,222 3,186 3,120 3,288 3,270 3,349 3,469
Adjusted revenue as
previously disclosed41 3,318 3,326 3,201 3,041 3,191 3,216 3,347 3,469
GPB, $m 1Q16 2Q16 3Q16 4Q16 1Q17 2Q17 3Q17 4Q17
Investment 199 190 190 161 181 180 173 165
Lending 110 106 105 95 95 97 99 101
Deposit 93 86 82 83 91 103 103 107
Other 64 68 62 73 59 58 61 47
Total 466 450 439 412 426 438 436 420
Adjusted revenue as
previously disclosed41 465 453 440 399 415 431 437 420
Corporate Centre, $m 1Q16 2Q16 3Q16 4Q16 1Q17 2Q17 3Q17 4Q17
Central Treasury 745 632 364 (267) 395 429 316 256
Balance Sheet
Management729 773 744 788 865 643 583 621
Interest expense (156) (245) (293) (275) (333) (296) (332) (280)
Valuation differences
on long-term debt and
associated swaps
250 110 108 (741) (27) 125 81 (57)
Other (78) (6) (195) (39) (110) (43) (16) (28)
US run-off portfolio 239 181 150 122 28 47 (28) (7)
Legacy Credit (38) (56) 127 (4) 0 60 (18) (73)
Other 156 4 (238) (446) (65) 75 (78) (76)
Total 1,102 761 403 (595) 358 611 192 100
Adjusted revenue as
previously disclosed41 1,122 756 408 (621) 342 592 186 100
28
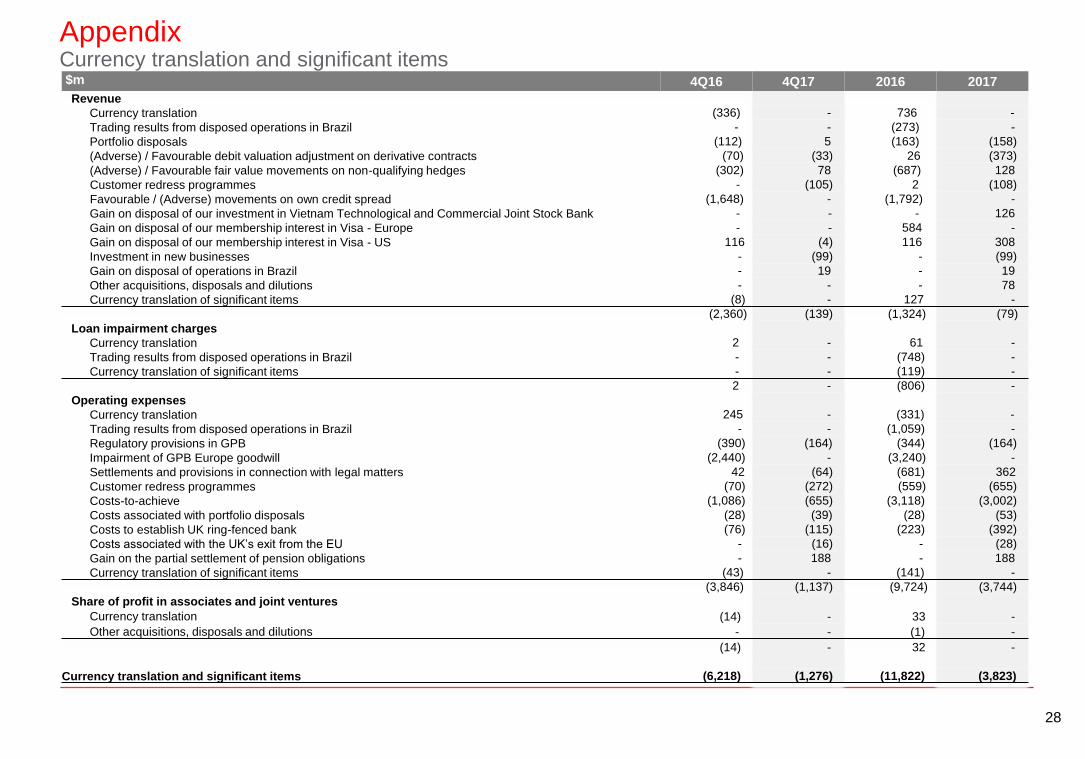
AppendixCurrency translation and significant items$m 4Q16 4Q17 2016 2017
Revenue
Currency translation (336) - 736 -
Trading results from disposed operations in Brazil - - (273) -
Portfolio disposals (112) 5 (163) (158)
(Adverse) / Favourable debit valuation adjustment on derivative contracts (70) (33) 26 (373)
(Adverse) / Favourable fair value movements on non-qualifying hedges (302) 78 (687) 128
Customer redress programmes - (105) 2 (108)
Favourable / (Adverse) movements on own credit spread (1,648) - (1,792) -
Gain on disposal of our investment in Vietnam Technological and Commercial Joint Stock Bank - - - 126
Gain on disposal of our membership interest in Visa - Europe - - 584 -
Gain on disposal of our membership interest in Visa - US 116 (4) 116 308
Investment in new businesses - (99) - (99)
Gain on disposal of operations in Brazil - 19 - 19
Other acquisitions, disposals and dilutions - - - 78
Currency translation of significant items (8) - 127 -
(2,360) (139) (1,324) (79)
Loan impairment charges
Currency translation 2 - 61 -
Trading results from disposed operations in Brazil - - (748) -
Currency translation of significant items - - (119) -
2 - (806) -
Operating expenses
Currency translation 245 - (331) -
Trading results from disposed operations in Brazil - - (1,059) -
Regulatory provisions in GPB (390) (164) (344) (164)
Impairment of GPB Europe goodwill (2,440) - (3,240) -
Settlements and provisions in connection with legal matters 42 (64) (681) 362
Customer redress programmes (70) (272) (559) (655)
Costs-to-achieve (1,086) (655) (3,118) (3,002)
Costs associated with portfolio disposals (28) (39) (28) (53)
Costs to establish UK ring-fenced bank (76) (115) (223) (392)
Costs associated with the UK’s exit from the EU - (16) - (28)
Gain on the partial settlement of pension obligations - 188 - 188
Currency translation of significant items (43) - (141) -
(3,846) (1,137) (9,724) (3,744)
Share of profit in associates and joint ventures
Currency translation (14) - 33 -
Other acquisitions, disposals and dilutions - - (1) -
(14) - 32 -
Currency translation and significant items (6,218) (1,276) (11,822) (3,823)
29
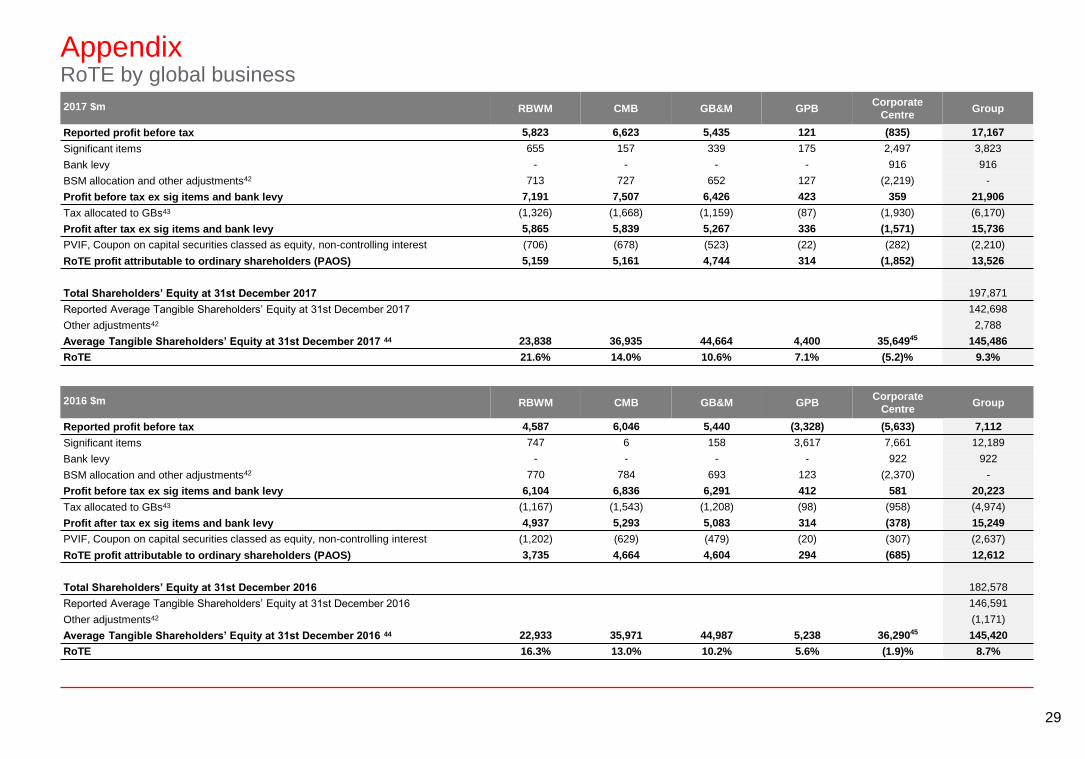
AppendixRoTE by global business
2017 $m RBWM CMB GB&M GPBCorporate
CentreGroup
Reported profit before tax 5,823 6,623 5,435 121 (835) 17,167
Significant items 655 157 339 175 2,497 3,823
Bank levy - - - - 916 916
BSM allocation and other adjustments42 713 727 652 127 (2,219) -
Profit before tax ex sig items and bank levy 7,191 7,507 6,426 423 359 21,906
Tax allocated to GBs43 (1,326) (1,668) (1,159) (87) (1,930) (6,170)
Profit after tax ex sig items and bank levy 5,865 5,839 5,267 336 (1,571) 15,736
PVIF, Coupon on capital securities classed as equity, non-controlling interest (706) (678) (523) (22) (282) (2,210)
RoTE profit attributable to ordinary shareholders (PAOS) 5,159 5,161 4,744 314 (1,852) 13,526
Total Shareholders’ Equity at 31st December 2017 197,871
Reported Average Tangible Shareholders’ Equity at 31st December 2017 142,698
Other adjustments42 2,788
Average Tangible Shareholders’ Equity at 31st December 2017 44 23,838 36,935 44,664 4,400 35,64945 145,486
RoTE 21.6% 14.0% 10.6% 7.1% (5.2)% 9.3%
2016 $m RBWM CMB GB&M GPBCorporate
CentreGroup
Reported profit before tax 4,587 6,046 5,440 (3,328) (5,633) 7,112
Significant items 747 6 158 3,617 7,661 12,189
Bank levy - - - - 922 922
BSM allocation and other adjustments42 770 784 693 123 (2,370) -
Profit before tax ex sig items and bank levy 6,104 6,836 6,291 412 581 20,223
Tax allocated to GBs43 (1,167) (1,543) (1,208) (98) (958) (4,974)
Profit after tax ex sig items and bank levy 4,937 5,293 5,083 314 (378) 15,249
PVIF, Coupon on capital securities classed as equity, non-controlling interest (1,202) (629) (479) (20) (307) (2,637)
RoTE profit attributable to ordinary shareholders (PAOS) 3,735 4,664 4,604 294 (685) 12,612
Total Shareholders’ Equity at 31st December 2016 182,578
Reported Average Tangible Shareholders’ Equity at 31st December 2016 146,591
Other adjustments42 (1,171)
Average Tangible Shareholders’ Equity at 31st December 2016 44 22,933 35,971 44,987 5,238 36,29045 145,420
RoTE 16.3% 13.0% 10.2% 5.6% (1.9)% 8.7%
30
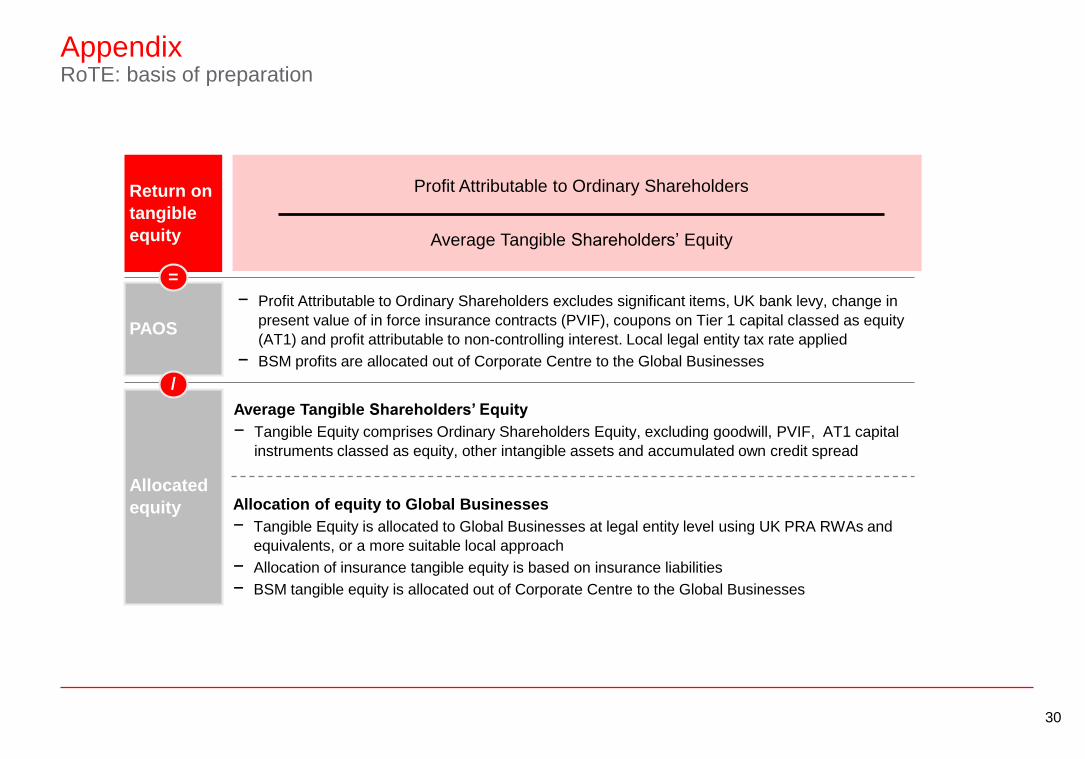
AppendixRoTE: basis of preparation
PAOS
Allocated
equity
Return on
tangible
equity
/
=
Profit Attributable to Ordinary Shareholders
Average Tangible Shareholders’ Equity
− Profit Attributable to Ordinary Shareholders excludes significant items, UK bank levy, change in
present value of in force insurance contracts (PVIF), coupons on Tier 1 capital classed as equity
(AT1) and profit attributable to non-controlling interest. Local legal entity tax rate applied
− BSM profits are allocated out of Corporate Centre to the Global Businesses
Average Tangible Shareholders’ Equity
− Tangible Equity comprises Ordinary Shareholders Equity, excluding goodwill, PVIF, AT1 capital
instruments classed as equity, other intangible assets and accumulated own credit spread
Allocation of equity to Global Businesses
− Tangible Equity is allocated to Global Businesses at legal entity level using UK PRA RWAs and
equivalents, or a more suitable local approach
− Allocation of insurance tangible equity is based on insurance liabilities
− BSM tangible equity is allocated out of Corporate Centre to the Global Businesses
31
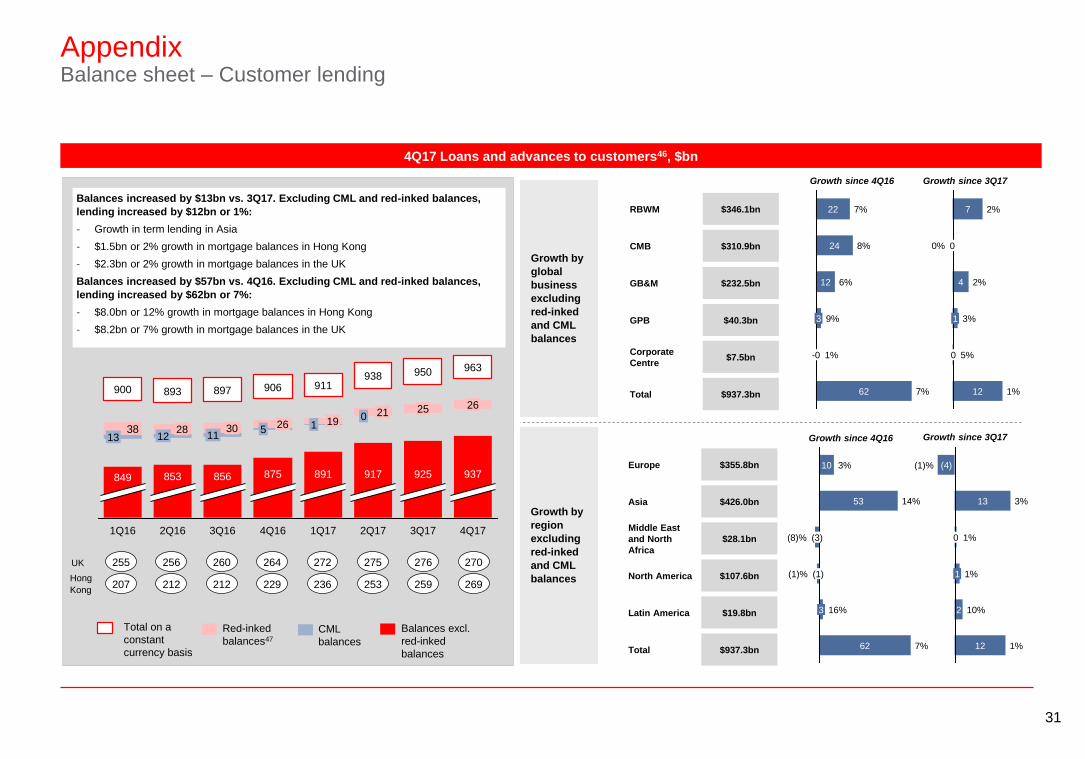
AppendixBalance sheet – Customer lending
3813
900
925
19
911
4Q16
875
5 26
3Q17
25
950
2Q17
917
906
3Q16
856
1130
897
2Q16
853
1228
893
1Q16
849
0 21
938
1Q17
891
1
4Q17
937
26
963
Balances excl.
red-inked
balances
Total on a
constant
currency basis
Red-inked
balances47
CML
balances
255 256 260 264 272 275UK
207 212 212 229 236 253Hong
Kong
276
259
4Q17 Loans and advances to customers46, $bn
Balances increased by $13bn vs. 3Q17. Excluding CML and red-inked balances,
lending increased by $12bn or 1%:
- Growth in term lending in Asia
- $1.5bn or 2% growth in mortgage balances in Hong Kong
- $2.3bn or 2% growth in mortgage balances in the UK
Balances increased by $57bn vs. 4Q16. Excluding CML and red-inked balances,
lending increased by $62bn or 7%:
- $8.0bn or 12% growth in mortgage balances in Hong Kong
- $8.2bn or 7% growth in mortgage balances in the UK
270
269
RBWM
CMB
GB&M
GPB
Corporate
Centre
Total 7%62
1%-0
9%3
6%12
8%24
7%22$346.1bn
$310.9bn
$232.5bn
$40.3bn
$7.5bn
$937.3bn
Europe
Asia
Middle East
and North
Africa
North America
Latin America
Total
$355.8bn
$426.0bn
$28.1bn
$107.6bn
$19.8bn
$937.3bn
Growth by
global
business
excluding
red-inked
and CML
balances
Growth by
region
excluding
red-inked
and CML
balances
3%1
2%4
0% 0
2%7
1%12
5%0
Growth since 4Q16 Growth since 3Q17
(1)% (1)
(8)% (3)
14%53
3%10
7%62
16%3
1%
1
1%0
3%13
(1)% (4)
12
10%2
1%
Growth since 3Q17Growth since 4Q16
32
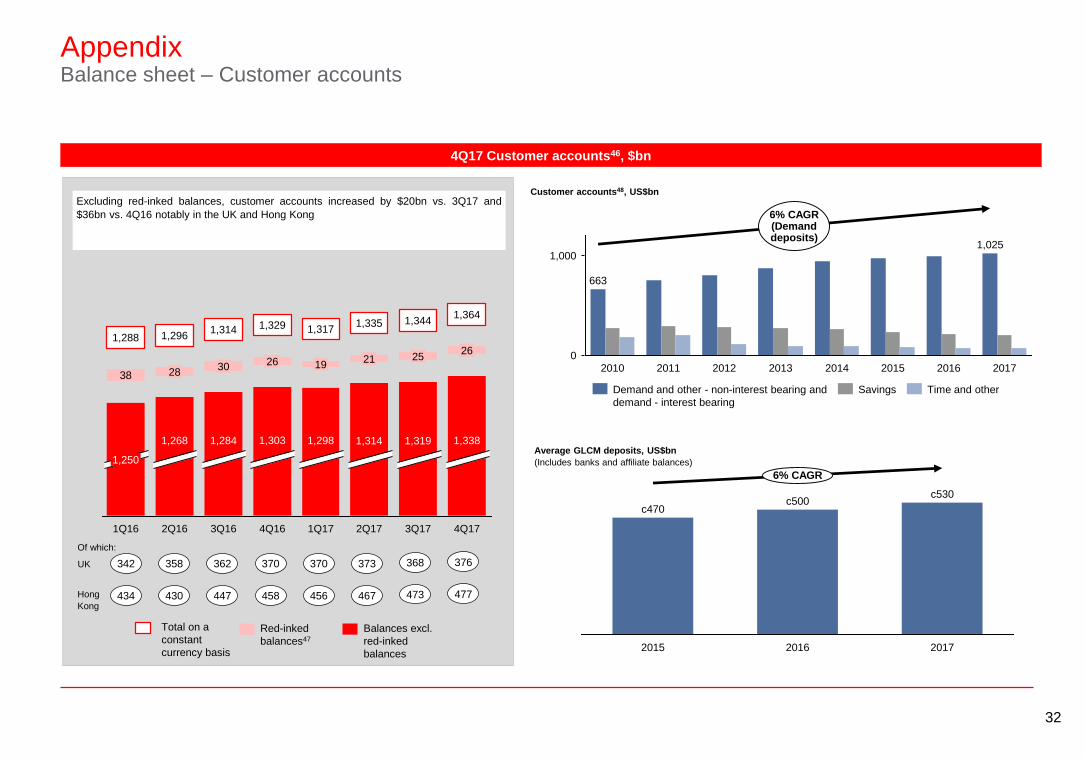
AppendixBalance sheet – Customer accounts
Balances excl.
red-inked
balances
Total on a
constant
currency basis
Red-inked
balances47
4Q17 Customer accounts46, $bn
Excluding red-inked balances, customer accounts increased by $20bn vs. 3Q17 and
$36bn vs. 4Q16 notably in the UK and Hong Kong
38
2Q17
1,314
21
1,335
1Q17
28
1,296
1Q16
1,250
1,288
19
1,317
4Q16
1,303 1,298
1,3291,364
3Q17
1,319
25
1,344
2626
3Q16
1,284
1,314
2Q16
1,268
30
4Q17
1,338
342 358 362 370 370 373UK
434 430 447 458 456 467
368
473Hong
Kong
376
477
1,000
0
6% CAGR(Demanddeposits)
2017
1,025
2016201520142013201220112010
663
Time and otherSavingsDemand and other - non-interest bearing and
demand - interest bearing
Customer accounts48, US$bn
c470
c530
2016
c500
2015
6% CAGR
2017
Average GLCM deposits, US$bn
(Includes banks and affiliate balances)
Of which:
33
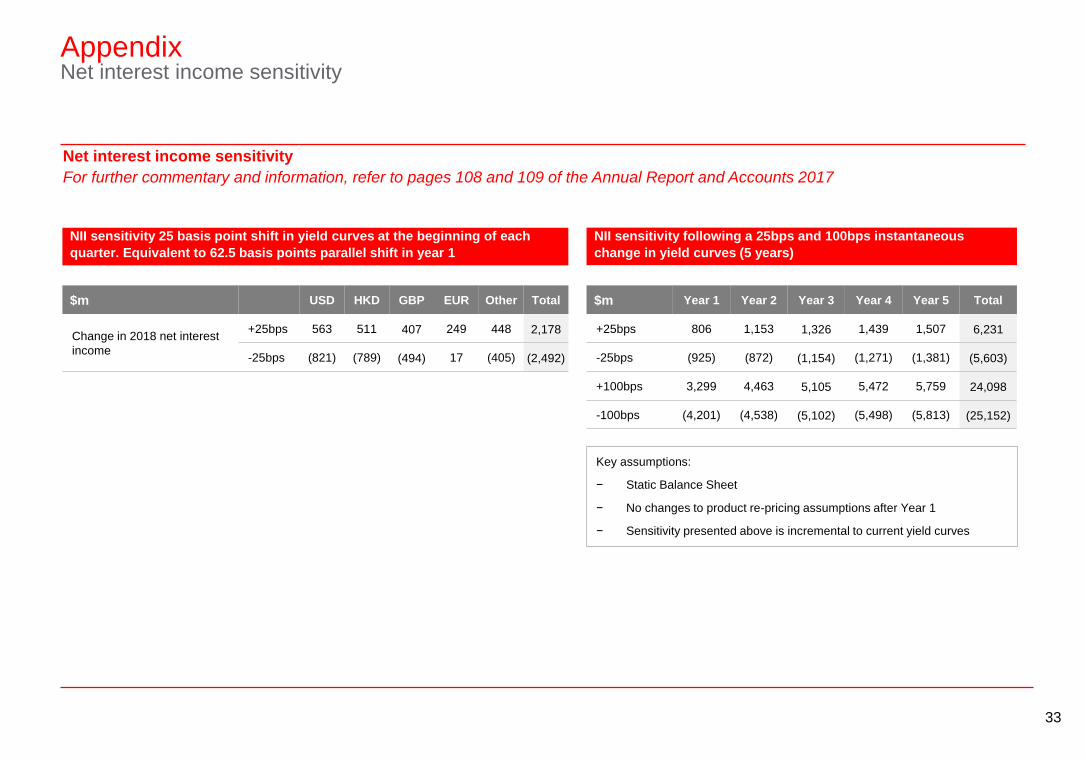
AppendixNet interest income sensitivity
NII sensitivity 25 basis point shift in yield curves at the beginning of each
quarter. Equivalent to 62.5 basis points parallel shift in year 1
NII sensitivity following a 25bps and 100bps instantaneous
change in yield curves (5 years)
Key assumptions:
− Static Balance Sheet
− No changes to product re-pricing assumptions after Year 1
− Sensitivity presented above is incremental to current yield curves
$m Year 1 Year 2 Year 3 Year 4 Year 5 Total
+25bps 806 1,153 1,326 1,439 1,507 6,231
-25bps (925) (872) (1,154) (1,271) (1,381) (5,603)
+100bps 3,299 4,463 5,105 5,472 5,759 24,098
-100bps (4,201) (4,538) (5,102) (5,498) (5,813) (25,152)
$m USD HKD GBP EUR Other Total
Change in 2018 net interest
income
+25bps 563 511 407 249 448 2,178
-25bps (821) (789) (494) 17 (405) (2,492)
Net interest income sensitivity
For further commentary and information, refer to pages 108 and 109 of the Annual Report and Accounts 2017
34
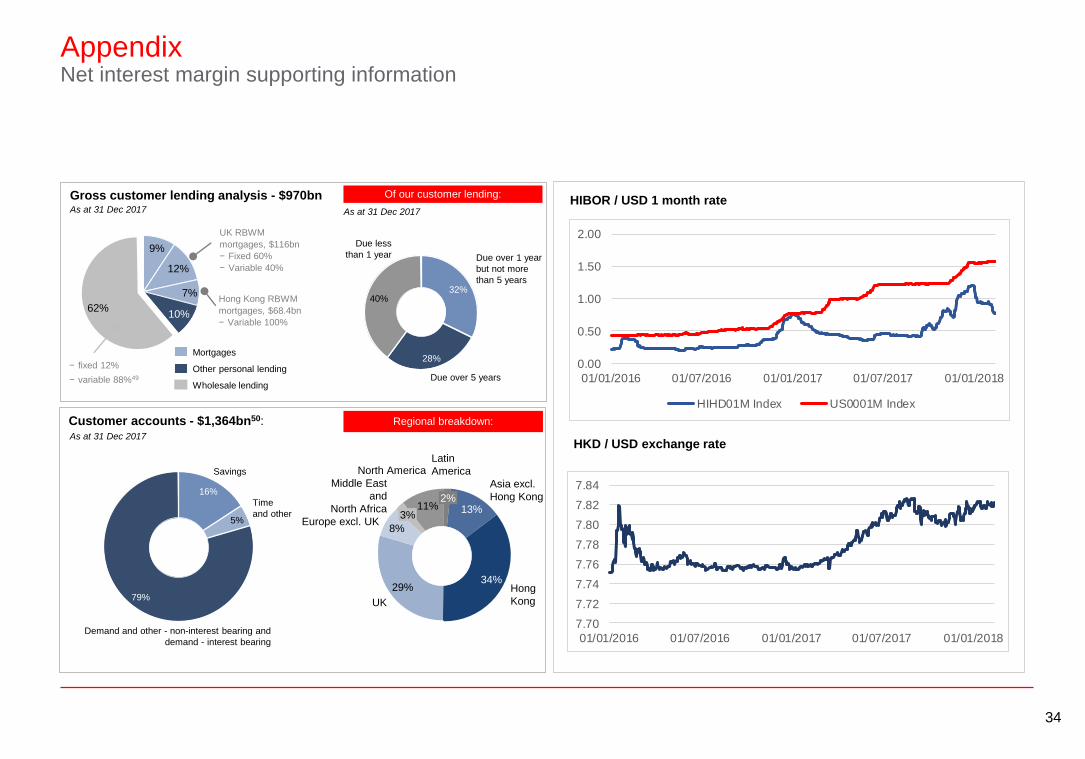
AppendixNet interest margin supporting information
Gross customer lending analysis - $970bn
9%
7%
10%62%
12%
− fixed 12%
− variable 88%49
Hong Kong RBWM
mortgages, $68.4bn
− Variable 100%
UK RBWM
mortgages, $116bn
− Fixed 60%
− Variable 40%
Due over 5 years
28%
Due over 1 year
but not more
than 5 years32%
Due less
than 1 year
40%
Of our customer lending:HIBOR / USD 1 month rate
HKD / USD exchange rate
Customer accounts - $1,364bn50:
Time
and other5%
Savings
16%
Demand and other - non-interest bearing and
demand - interest bearing
79%Hong
Kong
34%
Asia excl.
Hong Kong
13%
Latin
America
2%
North America
11%
Middle East
and
North Africa3%
Europe excl. UK8%
UK
29%
Regional breakdown:
Other personal lending
Mortgages
Wholesale lending
As at 31 Dec 2017As at 31 Dec 2017
0.00
0.50
1.00
1.50
2.00
01/01/2016 01/07/2016 01/01/2017 01/07/2017 01/01/2018
HIHD01M Index US0001M Index
7.70
7.72
7.74
7.76
7.78
7.80
7.82
7.84
01/01/2016 01/07/2016 01/01/2017 01/07/2017 01/01/2018
As at 31 Dec 2017
35
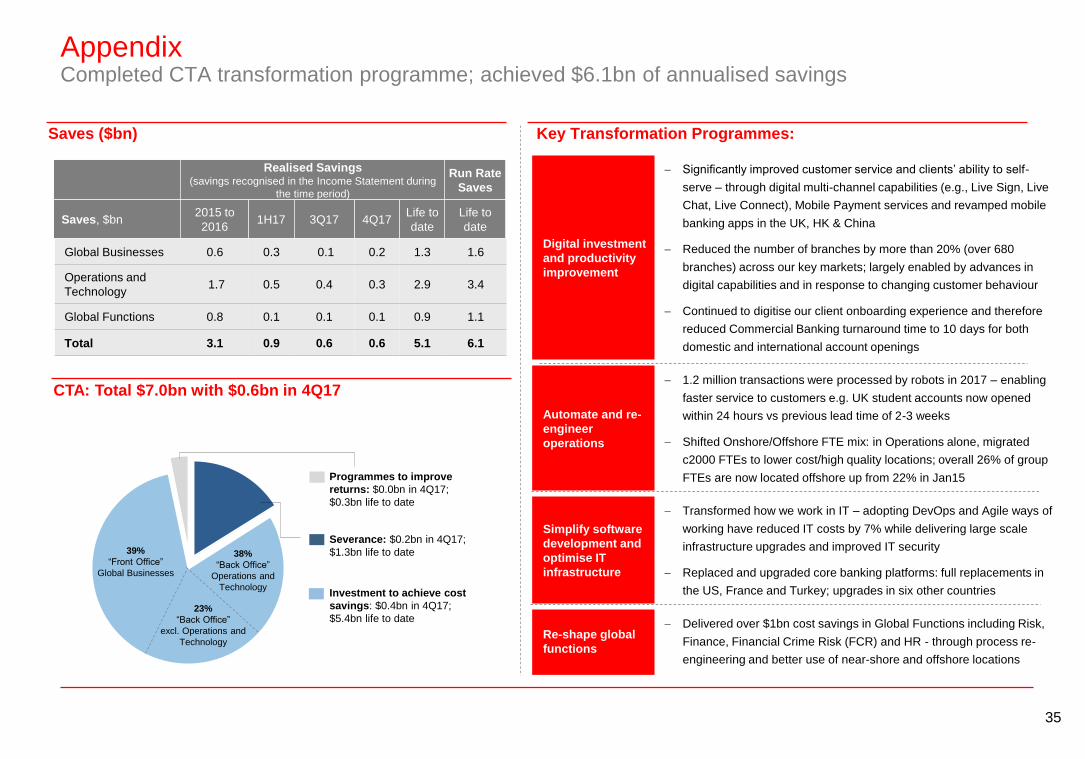
AppendixCompleted CTA transformation programme; achieved $6.1bn of annualised savings
Global Businesses 0.6 0.3 0.1 0.2 1.3 1.6
Operations and
Technology1.7 0.5 0.4 0.3 2.9 3.4
Global Functions 0.8 0.1 0.1 0.1 0.9 1.1
Total 3.1 0.9 0.6 0.6 5.1 6.1
Realised Savings(savings recognised in the Income Statement during
the time period)
Run Rate
Saves
Saves, $bn2015 to
20161H17 3Q17 4Q17
Life to
date
Life to
date
Saves ($bn) Key Transformation Programmes:
Digital investment
and productivity
improvement
Significantly improved customer service and clients’ ability to self-
serve – through digital multi-channel capabilities (e.g., Live Sign, Live
Chat, Live Connect), Mobile Payment services and revamped mobile
banking apps in the UK, HK & China
Reduced the number of branches by more than 20% (over 680
branches) across our key markets; largely enabled by advances in
digital capabilities and in response to changing customer behaviour
Continued to digitise our client onboarding experience and therefore
reduced Commercial Banking turnaround time to 10 days for both
domestic and international account openings
Automate and re-
engineer
operations
1.2 million transactions were processed by robots in 2017 – enabling
faster service to customers e.g. UK student accounts now opened
within 24 hours vs previous lead time of 2-3 weeks
Shifted Onshore/Offshore FTE mix: in Operations alone, migrated
c2000 FTEs to lower cost/high quality locations; overall 26% of group
FTEs are now located offshore up from 22% in Jan15
Simplify software
development and
optimise IT
infrastructure
Transformed how we work in IT – adopting DevOps and Agile ways of
working have reduced IT costs by 7% while delivering large scale
infrastructure upgrades and improved IT security
Replaced and upgraded core banking platforms: full replacements in
the US, France and Turkey; upgrades in six other countries
Re-shape global
functions
Delivered over $1bn cost savings in Global Functions including Risk,
Finance, Financial Crime Risk (FCR) and HR - through process re-
engineering and better use of near-shore and offshore locations
CTA: Total $7.0bn with $0.6bn in 4Q17
Investment to achieve cost
savings: $0.4bn in 4Q17;
$5.4bn life to date
Severance: $0.2bn in 4Q17;
$1.3bn life to date
Programmes to improve
returns: $0.0bn in 4Q17;
$0.3bn life to date
23%
“Back Office”
excl. Operations and
Technology
38%
“Back Office”
Operations and
Technology
39%
“Front Office”
Global Businesses
36
AppendixEquity drivers
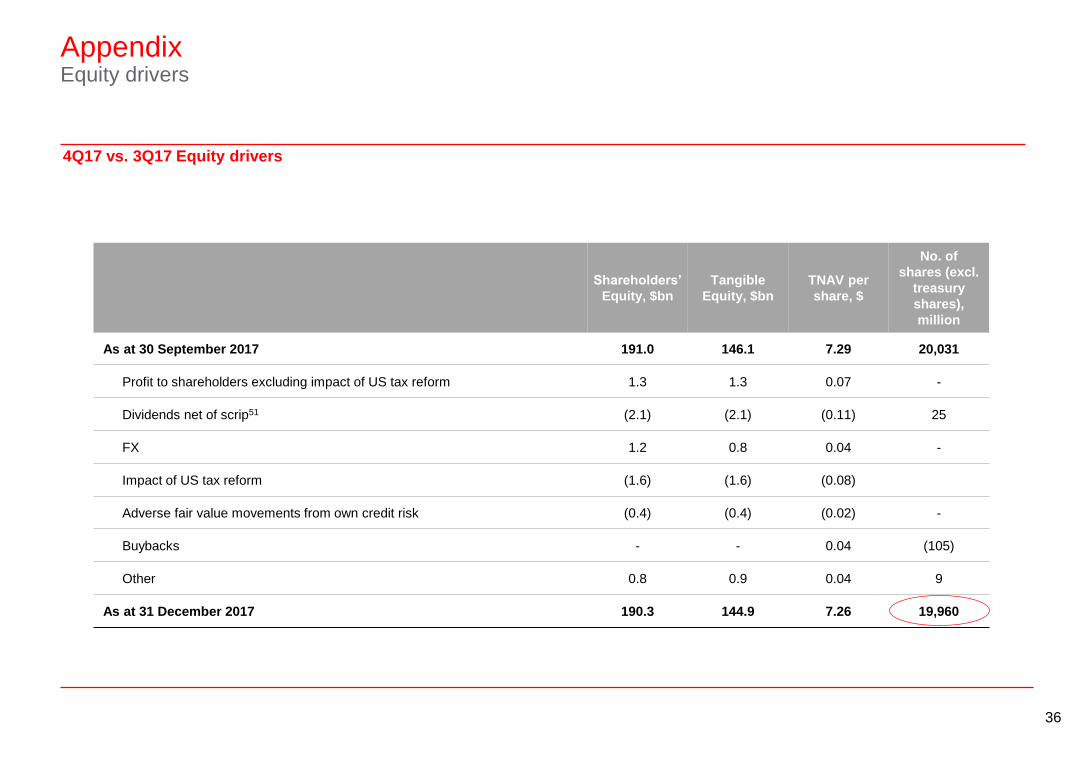
4Q17 vs. 3Q17 Equity drivers
Shareholders’
Equity, $bn
Tangible
Equity, $bn
TNAV per
share, $
No. of
shares (excl.
treasury
shares),
million
As at 30 September 2017 191.0 146.1 7.29 20,031
Profit to shareholders excluding impact of US tax reform 1.3 1.3 0.07 -
Dividends net of scrip51 (2.1) (2.1) (0.11) 25
FX 1.2 0.8 0.04 -
Impact of US tax reform (1.6) (1.6) (0.08)
Adverse fair value movements from own credit risk (0.4) (0.4) (0.02) -
Buybacks - - 0.04 (105)
Other 0.8 0.9 0.04 9
As at 31 December 2017 190.3 144.9 7.26 19,960
37
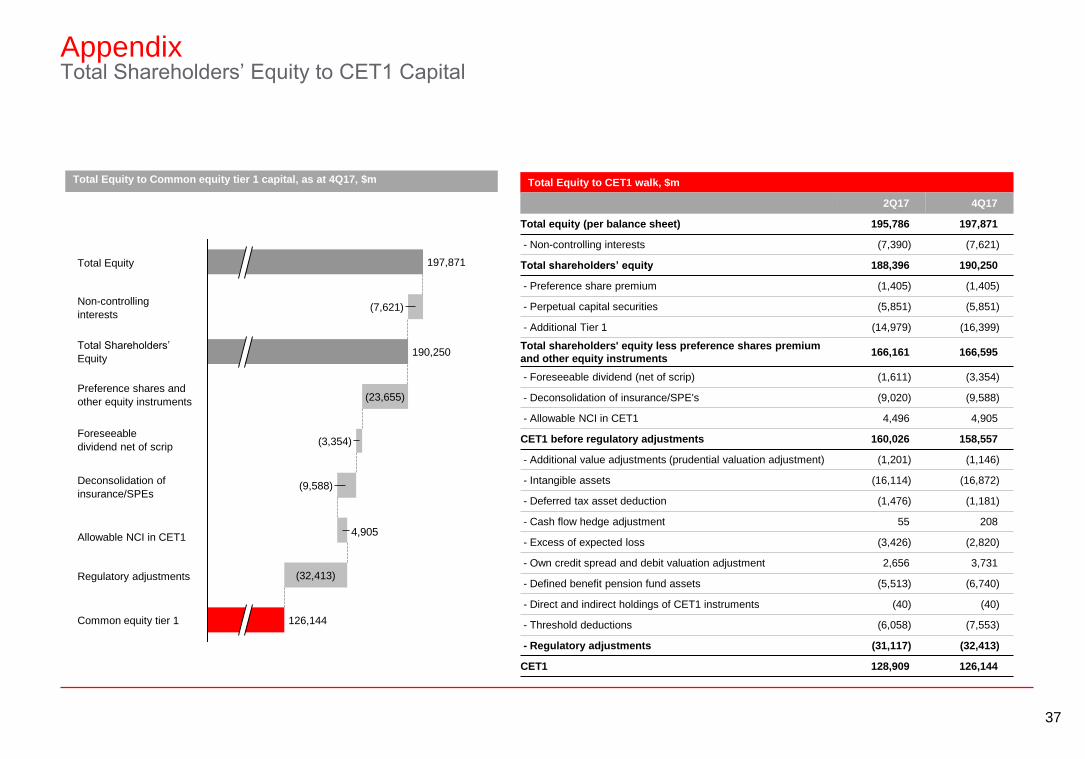
AppendixTotal Shareholders’ Equity to CET1 Capital
Total Equity to CET1 walk, $m
2Q17 4Q17
Total equity (per balance sheet) 195,786 197,871
- Non-controlling interests (7,390) (7,621)
Total shareholders’ equity 188,396 190,250
- Preference share premium (1,405) (1,405)
- Perpetual capital securities (5,851) (5,851)
- Additional Tier 1 (14,979) (16,399)
Total shareholders' equity less preference shares premium
and other equity instruments166,161 166,595
- Foreseeable dividend (net of scrip) (1,611) (3,354)
- Deconsolidation of insurance/SPE's (9,020) (9,588)
- Allowable NCI in CET1 4,496 4,905
CET1 before regulatory adjustments 160,026 158,557
- Additional value adjustments (prudential valuation adjustment) (1,201) (1,146)
- Intangible assets (16,114) (16,872)
- Deferred tax asset deduction (1,476) (1,181)
- Cash flow hedge adjustment 55 208
- Excess of expected loss (3,426) (2,820)
- Own credit spread and debit valuation adjustment 2,656 3,731
- Defined benefit pension fund assets (5,513) (6,740)
- Direct and indirect holdings of CET1 instruments (40) (40)
- Threshold deductions (6,058) (7,553)
- Regulatory adjustments (31,117) (32,413)
CET1 128,909 126,144
4,905
197,871
(3,354)
(32,413)
(9,588)
(23,655)
(7,621)
190,250
126,144
Total Equity
Non-controlling
interests
Preference shares and
other equity instruments
Foreseeable
dividend net of scrip
Regulatory adjustments
Common equity tier 1
Total Shareholders’
Equity
Deconsolidation of
insurance/SPEs
Allowable NCI in CET1
Total Equity to Common equity tier 1 capital, as at 4Q17, $m
38
AppendixUK credit quality
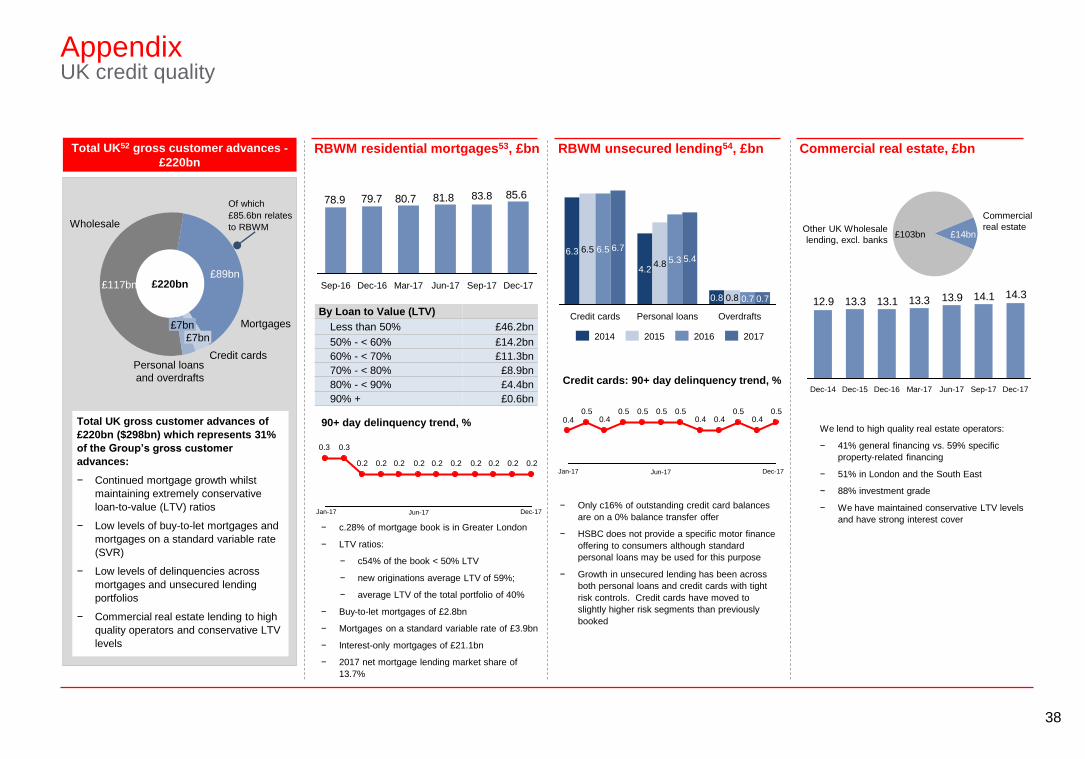
Total UK52 gross customer advances -
£220bnRBWM residential mortgages53, £bn
Personal loans
and overdrafts
£7bn
Credit cards
£7bn
Mortgages
£89bn
Wholesale
£117bn £220bn
Total UK gross customer advances of
£220bn ($298bn) which represents 31%
of the Group’s gross customer
advances:
− Continued mortgage growth whilst
maintaining extremely conservative
loan-to-value (LTV) ratios
− Low levels of buy-to-let mortgages and
mortgages on a standard variable rate
(SVR)
− Low levels of delinquencies across
mortgages and unsecured lending
portfolios
− Commercial real estate lending to high
quality operators and conservative LTV
levels
RBWM unsecured lending54, £bn Commercial real estate, £bn
By Loan to Value (LTV)
Less than 50% £46.2bn
50% - < 60% £14.2bn
60% - < 70% £11.3bn
70% - < 80% £8.9bn
80% - < 90% £4.4bn
90% + £0.6bn
90+ day delinquency trend, %
Overdrafts
0.70.70.80.8
Personal loans
5.45.34.84.2
Credit cards
6.76.56.56.3
2017201620152014
Commercial
real estate£14bn
Other UK Wholesale
lending, excl. banks£103bn
We lend to high quality real estate operators:
− 41% general financing vs. 59% specific
property-related financing
− 51% in London and the South East
− 88% investment grade
− We have maintained conservative LTV levels
and have strong interest cover
14.314.113.913.313.113.312.9
Dec-17Sep-17Jun-17Mar-17Dec-16Dec-15Dec-14
81.880.779.778.9 85.683.8
Sep-17 Dec-17Sep-16 Dec-16 Mar-17 Jun-17
0.2 0.20.2 0.20.2 0.20.2 0.20.2 0.2
0.30.3
Credit cards: 90+ day delinquency trend, %
0.50.4
0.50.4
0.50.50.4
0.5 0.50.4
0.50.4
Of which
£85.6bn relates
to RBWM
− c.28% of mortgage book is in Greater London
− LTV ratios:
− c54% of the book < 50% LTV
− new originations average LTV of 59%;
− average LTV of the total portfolio of 40%
− Buy-to-let mortgages of £2.8bn
− Mortgages on a standard variable rate of £3.9bn
− Interest-only mortgages of £21.1bn
− 2017 net mortgage lending market share of
13.7%
− Only c16% of outstanding credit card balances
are on a 0% balance transfer offer
− HSBC does not provide a specific motor finance
offering to consumers although standard
personal loans may be used for this purpose
− Growth in unsecured lending has been across
both personal loans and credit cards with tight
risk controls. Credit cards have moved to
slightly higher risk segments than previously
booked
Jan-17 Dec-17Jun-17
Jan-17 Dec-17Jun-17
39
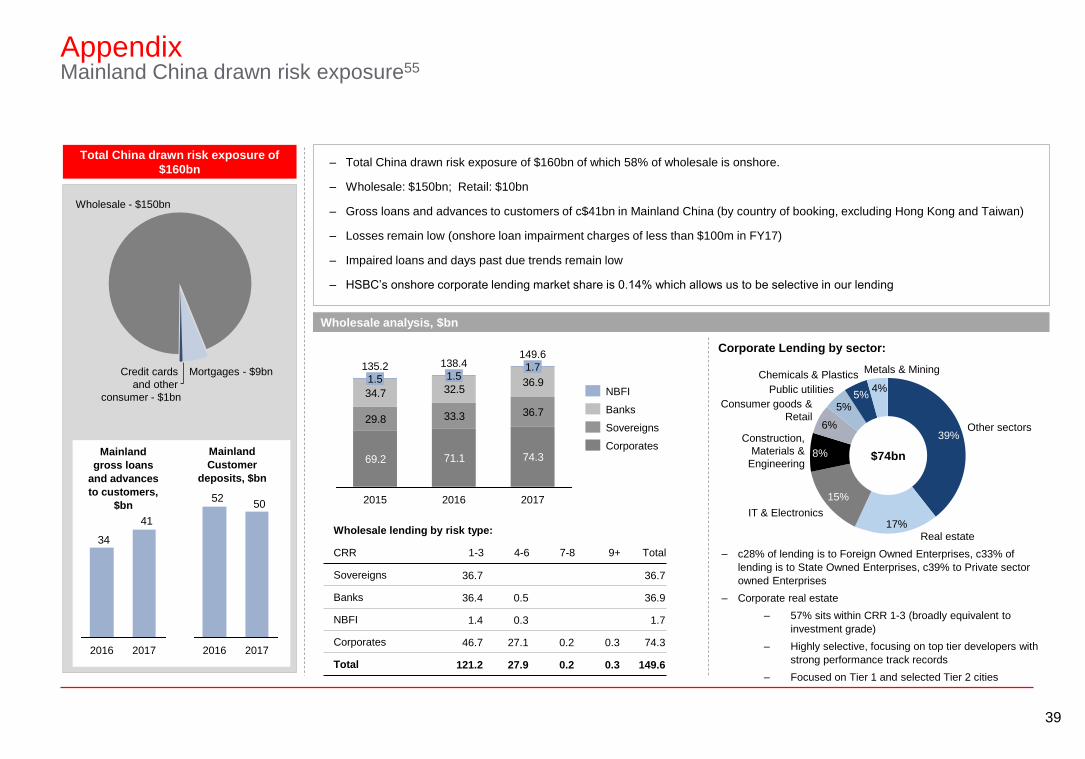
AppendixMainland China drawn risk exposure55
Total China drawn risk exposure of
$160bn
Credit cards
and other
consumer - $1bn
Mortgages - $9bn
Wholesale - $150bn
41
34
20172016
5052
20172016
‒ Total China drawn risk exposure of $160bn of which 58% of wholesale is onshore.
‒ Wholesale: $150bn; Retail: $10bn
‒ Gross loans and advances to customers of c$41bn in Mainland China (by country of booking, excluding Hong Kong and Taiwan)
‒ Losses remain low (onshore loan impairment charges of less than $100m in FY17)
‒ Impaired loans and days past due trends remain low
‒ HSBC’s onshore corporate lending market share is 0.14% which allows us to be selective in our lending
Wholesale analysis, $bn
69.2 74.3
29.8 33.3 36.7
34.7 32.536.9
71.1
1.7
2016
138.4
1.5
2015
135.2
1.5
2017
149.6
Corporates
Sovereigns
Banks
NBFI
Wholesale lending by risk type:
CRR 1-3 4-6 7-8 9+ Total
Sovereigns 36.7 36.7
Banks 36.4 0.5 36.9
NBFI 1.4 0.3 1.7
Corporates 46.7 27.1 0.2 0.3 74.3
Total 121.2 27.9 0.2 0.3 149.6
Corporate Lending by sector:
Metals & Mining
4%
Chemicals & Plastics
5%Public utilities
5%Consumer goods &
Retail6%
Construction,
Materials &
Engineering8%
IT & Electronics
15%
Real estate17%
Other sectors39%
$74bn
‒ c28% of lending is to Foreign Owned Enterprises, c33% of
lending is to State Owned Enterprises, c39% to Private sector
owned Enterprises
‒ Corporate real estate
‒ 57% sits within CRR 1-3 (broadly equivalent to
investment grade)
‒ Highly selective, focusing on top tier developers with
strong performance track records
‒ Focused on Tier 1 and selected Tier 2 cities
Mainland
gross loans
and advances
to customers,
$bn
Mainland
Customer
deposits, $bn
40
AppendixGlossary
AUM Assets under management
AMG Asset Management Group
BSM Balance Sheet Management
CET1 Common Equity Tier 1
CMB Commercial Banking, a global business
CML Consumer Mortgage Lending portfolio
CTA Costs-to-Achieve
CVA Credit Valuation Adjustment
DCM Debt Capital Markets
DPA Deferred Prosecution Agreement
DVA Debit Valuation Adjustment
FICC Fixed Income, Currencies and Commodities
FVOD Fair Value of Own Debt
GB&M Global Banking and Markets, a global business
GLCM Global Liquidity and Cash Management
GPB Global Private Banking, a global business
GTRF Global Trade and Receivables Finance
IFRS International Financial Reporting Standard
JawsA ratio which measures the difference between the rates of
change for revenue and costs
LICs Loan Impairment charges and other credit risk provisions
MENA Middle East and North Africa
MREL Minimum requirement for own funds and eligible liabilities
NAV Net Asset Value
NIM Net interest margin
nm Not meaningful
NQH Non-qualifying hedges
PBT Profit before tax
PRD Pearl River Delta
PVIF Present value of in-force insurance contracts
RBWM Retail Banking and Wealth Management, a global business
RMB Renminbi
RoE Return on Equity
RoRWA Return on average Risk-Weighted Assets
RoTE Return on Tangible Equity
RWA Risk-Weighted Asset
TNAV Tangible Net Asset Value
Transaction BankingProducts including Foreign Exchange, GLCM, GTRF and
Securities Services
41
AppendixFootnotes
1. Unless otherwise stated, risk-weighted assets and capital are calculated and presented on a transitional CRD IV basis as implemented in the UK by the Prudential Regulation Authority
2. Includes the impact of UK bank levy
3. 2016 jaws as reported in our 2016 Results
4. ‘Own credit spread’ includes the fair value movements on our long-term debt attributable to credit spread where the net result of such movements will be zero upon maturity of the debt. On 1
January 2017, HSBC adopted the requirements of IFRS 9 relating to the presentation of gains and losses on financial liabilities designated at fair value. As a result, the effects of changes in
those liabilities’ credit risk is presented in other comprehensive income
5. Europe’s adjusted 2017 profit of $1.0bn includes a number of items incurred centrally on behalf of the Group as a whole, but which are disclosed in the Europe segment, including consolidation
adjustments and Holdings costs such as interest costs on Group debt and the UK bank levy
6. Where a quarterly trend is presented on the Income Statement, all comparatives are re-translated at average 4Q17 exchange rates
7. Where a quarterly trend is presented on the Balance sheet, all comparatives are re-translated at 31 Dec 2017 exchange rates
8. Global Asset Management funds under management. Total Group funds under management of $943bn at 31 Dec 2017 vs. $831bn at 31 Dec 2016
9. Represents annualised new business premiums in Insurance Manufacturing, related to RBWM.
10. 2016 Reported NIM of 1.73%, excluding Brazil NIM was 1.70%
11. In the 1Q17 Results Presentation, new individually assessed and collectively assessed allowances were presented as new allowances; in the current disclosure new allowances includes new
individually assessed allowances and new collectively assessed allowances net of allowance releases
12. This includes dividends on ordinary shares, dividends on preference shares and coupons on capital securities, classified as equity
13. Adjusted RoRWA is calculated using annualised profit before tax and reported average risk-weighted assets at constant currency, adjusted for the effects of significant items
14. Due to the nature of its business, GPB measures the performance of its business through other measures including Net New Money and Return on Client Assets
15. Further detail on the Monitor can be found on page 78 of the Annual Report and Accounts 2017
16. Total dividend declared in cash and scrip
17. RWAs consist of current tax, deferred tax and operational risk
18. Date range 01/01/2011 - 31/12/2017; Includes dividends in respect of 4Q17
19. Date range 01/01/2011 - 31/12/2017
20. Results for US Principal: 2017 Adjusted results: Revenue $4,737m, LICs $118m, Costs $(3,936)m, PBT $920m; 2016 Adjusted results: Revenue $4,698m, LICs $(503)m, Costs $(3,808)m,
PBT $387m; 2017 Adjusted revenue by global business: RBWM $1,194m, CMB $947m, GB&M $1,951m, GPB $317m, Corporate Centre $328m; 2017 Adjusted PBT by global business:
RBWM $(58)m, CMB $432m, GB&M $527m, GPB $64m, Corporate Centre $(45)m; 2016 Adjusted revenue by global business: RBWM $1,161m, CMB $981m, GB&M $1,979m, GPB $303m,
Corporate Centre $274m; 2016 Adjusted PBT by global business: RBWM $(81)m, CMB $341m, GB&M $100m, GPB $67m, Corporate Centre $(40)m; Customer advances: 2017 $65.2bn,
2016 $69.1bn; Mortgages: 2017 $17.4bn, 2016 $17.3bn; 2017 Adjusted RWAs by global business: RBWM $11.0bn, CMB $25.1bn, GB&M $45.2bn, GPB $4.2bn, Corporate Centre $10.0bn;
2016 Adjusted RWAs by global business: RBWM $11.0bn, CMB $26.8bn, GB&M $48.3bn, GPB $4.1bn, Corporate Centre $13.6bn
21. Results for Mexico: 2017 Adjusted results: Revenue $2,164m, LICs $(473)m, Costs $(1,251)m, PBT $440m; 2016 Adjusted results: Revenue $1,949m, LICs $(450)m, Costs $(1,225)m, PBT
$274m; 2017 Adjusted revenue by global business: RBWM $1,442m, CMB $350m, GB&M $284m, GPB $0m, Corporate Centre $88m; 2017 Adjusted PBT by global business: RBWM $147m,
CMB $105m, GB&M $162m, GPB $0m, Corporate Centre $26m; 2016 Adjusted revenue by global business: RBWM $1,285m, CMB $336m, GB&M $217m, GPB $13m, Corporate Centre
$98m; 2016 Adjusted PBT by global business: RBWM $100m, CMB $83m, GB&M $79m, GPB $5m, Corporate Centre $7m; Customer advances: 2017 $15.2bn, 2016 $13.5bn; Mortgages:
2017 $2.1bn, 2016 $1.9bn; 2017 Adjusted RWAs by global business: RBWM $6.9bn, CMB $5.9bn, GB&M $8.3bn, GPB $0.0bn, Corporate Centre $2.8bn; 2016 Adjusted RWAs by global
business: RBWM $6.4bn, CMB $6.3bn, GB&M $6.7bn, GPB $0.0bn, Corporate Centre $1.7bn
42
AppendixFootnotes
22. Awarded Best Domestic Cash Manager for Corporates in the US by Euromoney Market Leader Cash Management 2017; awarded Best Bank for Transactions Services in North America by
Euromoney Awards for Excellence 2017
23. Revenue from international clients is derived from an allocation of Adjusted revenue based on internal management information. International clients are businesses and individuals with an
international presence
24. Source: CNBV (National Banking and Securities Commission), market share based on 6 major banks in Mexico
25. Source: Oliver Wyman analysis, Trade Finance Global Ranking is for 2014 & 2016
26. Source: Hong Kong Monetary Authority statistics, Monthly Statistical Bulletin; December 2015 & November 2017
27. Source: Monetary Authority of Singapore, Monthly Statistical Bulletin; December 2015 & November 2017
28. Market share of SWIFT payments, 2015 & 2017
29. Source: Oliver Wyman analysis, 26.3% refers to 2016 market share. Both periods include Hang Seng
30. Source: Greenwich Survey; G10 + EM countries for 2015 and 2016; FX Corporates rank is based on total penetration of all accounts; FX institutional rank is based on total penetration of top
tier accounts
31. Source: Dealogic; Cross- Border DCM excludes all Domestic Deals
32. As voted by corporates
33. As voted by financial institutions
34. Constant currency basis
35. Measured by annualised new business premiums market share
36. Bloomberg offshore RMB bond underwriting league tables as of the end of each year from 2011 to 2017
37. Non-financial companies
38. Dividend per share
39. Investor day target of $290bn rebased for exchange rates at 31 Dec 2017
40. Includes BSM
41. 3Q17 as reported at 3Q17 Results; 2Q17 as reported at 2Q17 Results; 1Q17 as reported at 1Q17 Results; 1Q16 to 4Q16 included in the ‘4Q 2016 Global Business Management View of
Income’ published at 2016FY Results
42. BSM profits and equity are allocated from the Corporate Centre to the Global Businesses; ‘Other adjustments’ in Equity include movements on accumulated own credit spreads
43. Allocated tax for RoTE includes the reported tax charge, as well as the tax impact of significant items. The Group reported tax charge was $5.3bn for FY17 and $3.7bn for FY16
44. Tangible Equity is allocated to global businesses at a legal entity level, using RWAs, or a more suitable local approach, where appropriate.
45. Includes associates, mainly BoCom and Saudi British Bank, as well as the equity relating to the US run-off and legacy credit portfolios
46. Balances presented by quarter are on a constant currency basis. Reported equivalents for ‘Loans and advances to customers’ are as follows: 1Q16: $920bn, 2Q16: $888bn, 3Q16: $881bn,
4Q16: $862bn, 1Q17: $876bn, 2Q17: $920bn, 3Q17: $945bn. Reported equivalents for ‘Customer Accounts’ are as follows: 1Q16: $1,315bn, 2Q16: $1,291bn, 3Q16: $1,296bn, 4Q16:
$1,272bn, 1Q17: $1,273bn, 2Q17: $1,312bn, 3Q17: $1,337bn
47. Red-inked balances relate to corporate customers in the UK, who settle their overdraft and deposit balances on a net basis. CMB red-inked balances: 1Q16: $10bn, 2Q16: $10bn, 3Q16:
$10bn, 4Q16: $8bn, 1Q17: $5bn, 2Q17: $5bn, 3Q17: $7bn and 4Q17: $6bn; GB&M red-inked balances: 1Q16: $28bn, 2Q16: $18bn, 3Q16: $20bn, 4Q16: $18bn, 1Q17: $13bn, 2Q17: $16bn,
3Q17: $19bn and 4Q17: $20bn.
48. Source: Form 20-F; Average balances on a reported basis
43
AppendixFootnotes
49. Assumes the 2017 split of fixed and variable for commercial lending including lending to banks with greater than 1 year maturity as published in ‘Form 20-F’
50. Customer accounts as at 31 December 2017
51. Includes dividends to preference shareholders and other equity holders and scrip issuances relating to the third interim dividend in 2017
52. Where the country of booking is the UK
53. Includes First Direct balances
54. Includes First Direct, M&S and John Lewis Financial Services
55. Retail drawn exposures represent retail lending booked in Mainland China; wholesale drawn exposures represents wholesale lending where the ultimate parent or beneficial owner is Chinese
44
AppendixImportant notice and forward-looking statements
Important notice
The information, statements and opinions set out in this presentation and subsequent discussion do not constitute a public offer for the purposes of any applicable law or an offer tosell or solicitation of any offer to purchase any securities or other financial instruments or any advice or recommendation in respect of such securities or other financial instruments.
The information contained in this presentation and subsequent discussion, which does not purport to be comprehensive nor render any form of financial or other advice, has beenprovided by the Group and has not been independently verified by any person. No responsibility, liability or obligation (whether in tort, contract or otherwise) is accepted by the Groupor any member of the Group or any of their affiliates or any of its or their officers, employees, agents or advisers (each an “Identified Person”) as to or in relation to this presentationand any subsequent discussions (including the accuracy, completeness or sufficiency thereof) or any other written or oral information made available or any errors contained thereinor omissions therefrom, and any such liability is expressly disclaimed.
No representations or warranties, express or implied, are given by any Identified Person as to, and no reliance should be placed on the accuracy or completeness of any informationcontained in this presentation, any other written or oral information provided in connection therewith or any data which such information generates. No Identified Person undertakes, oris under any obligation, to provide the recipient with access to any additional information, to update, revise or supplement this presentation or any additional information or to remedyany inaccuracies in or omissions from this presentation.
Forward-looking statements
This presentation and subsequent discussion may contain projections, estimates, forecasts, targets, opinions, prospects, results, returns and forward-looking statements with respectto the financial condition, results of operations, capital position and business of the Group (together, “forward-looking statements”). Any such forward-looking statements are not areliable indicator of future performance, as they may involve significant assumptions and subjective judgements which may or may not prove to be correct and there can be noassurance that any of the matters set out in forward-looking statements are attainable, will actually occur or will be realised or are complete or accurate. Forward-looking statementsare statements about the future and are inherently uncertain and generally based on stated or implied assumptions. The assumptions may prove to be incorrect and involve knownand unknown risks, uncertainties, contingencies and other important factors, many of which are outside the control of the Group. Actual achievements, results, performance or otherfuture events or conditions may differ materially from those stated, implied and/or reflected in any forward-looking statements due to a variety of risks, uncertainties and other factors(including without limitation those which are referable to general market conditions or regulatory changes). Any such forward-looking statements are based on the beliefs, expectationsand opinions of the Group at the date the statements are made, and the Group does not assume, and hereby disclaims, any obligation or duty to update, revise or supplement them ifcircumstances or management’s beliefs, expectations or opinions should change. For these reasons, recipients should not place reliance on, and are cautioned about relying on, anyforward-looking statements. No representations or warranties, expressed or implied, are given by or on behalf of the Group as to the achievement or reasonableness of anyprojections, estimates, forecasts, targets, prospects or returns contained herein. Additional detailed information concerning important factors that could cause actual results to differmaterially is available in our Annual Report and Accounts on Form 20-F for the fiscal year ended 31 December 2016 filed with the Securities and Exchange Commission on 21February 2017 and our Annual Report and Accounts 2017, as well as in our Annual Report and Accounts on Form 20-F for the fiscal year ended 31 December 2017 which we expectto file with the Securities and Exchange Commission on 20 February 2018.
This presentation contains non-GAAP financial information. The primary non-GAAP financial measure we use is ‘adjusted performance’ which is computed by adjusting reportedresults for the period-on-period effects of foreign currency translation differences and significant items which distort period-on-period comparisons. Significant items are those itemswhich management and investors would ordinarily identify and consider separately when assessing performance in order to better understand the underlying trends in the business.Reconciliations between non-GAAP financial measurements and the most directly comparable measures under GAAP are provided in our Annual Report and Accounts 2017 and theReconciliations of Non-GAAP Financial Measures document which are both available at www.hsbc.com.
Information in this presentation was prepared as at 19 February 2018.

4545
Issued by HSBC Holdings plc
Group Investor Relations
8 Canada Square
London E14 5HQ
United Kingdom
www.hsbc.com
Cover image: Guangzhou is located at the heart of China’s Pearl River Delta, one of the
country’s fastest growing economic regions.
Photography: Getty Images


![MAJU PERAK HOLDINGS BERHADPB] MAJUPERAK HOLDINGS BERHAD (585389-X) ANNUAL REPORT 2011 [1] MAJU PERAK HOLDINGS BERHAD MAJUPERAK HOLDINGS BERHAD (585389-X) ANNUAL REPORT LAPORAN TAHUNAN](https://img.pdfslide.tips/doc/110x75/5ce7dc9688c993e8488bfd86/maju-perak-holdings-pb-majuperak-holdings-berhad-585389-x-annual-report-2011.jpg)