Embed Size (px)
Citation preview

Human Population IssuesHuman Population IssuesUnit 4: Unit 4: 人口与环境人口与环境

Population Characteristics
• Population - Group of individuals inhabiting the same area simultaneously.
– Natality and MortalityNatality - Number of individuals added through reproduction.
Birth Rate (Humans born / 1000)Mortality - Number of individuals removed via death.
Death Rate (Humans Died / 1000)

Effect of Birthrate and Death Rate on Population SizeEffect of Birthrate and Death Rate on Population Size For a population to grow, the birthrate must exceed the death rate for a period of time. These three human populations illustrate how the combined effects of births and deaths would change population size if birthrates and death rates were maintained for a five-year period.

Types of Survivorship Curves Types of Survivorship Curves
(a) The DallDall sheepsheep is a large mammal that produces relatively few young. Most of the young survive, and more susceptible to predation and disease.
(b) The curve shown for the whitewhite--crowned crowned sparrowsparrow is typical of that for many kinds of birds. After a period of high mortality among the young the mortality rate is about equal fro all ages of adult birds.
(c) Many small animals small animals and plantsand plants produce enormous numbers of offspring. Mortality is very high in the younger individuals, and few individuals reach old age.
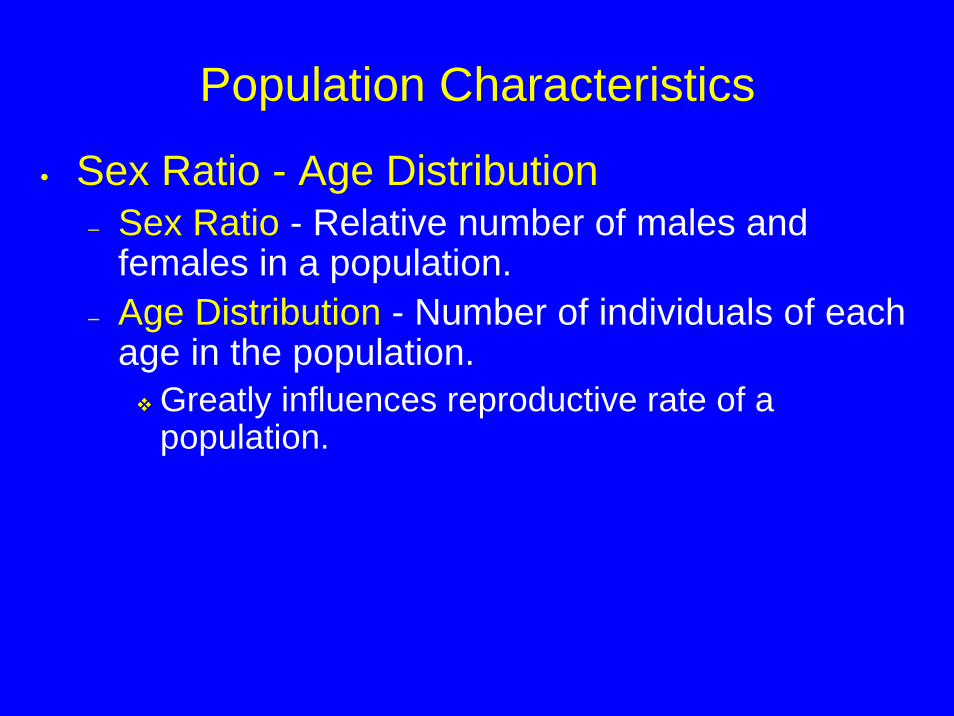
Population Characteristics
• Sex Ratio - Age Distribution– Sex Ratio - Relative number of males and
females in a population.– Age Distribution - Number of individuals of each
age in the population.Greatly influences reproductive rate of a population.

Age Distribution in Human PopulationsAge Distribution in Human Populations The relative numbers of individuals in each of the three categories are good clues to the future growth of a population.
Population Density and Spatial Distribution
• Population Density - Number of individuals per unit area.
– Dispersal - Movement of individuals from densely populated locations to new areas.
Emigration - Out movementImmigration - In Movement

Population Growth Curve
• Biotic Potential - Inherent reproductive capacity.
– Generally, biotic potential is much above replacement level.
Natural tendency for increase.– All living populations follow an exponential
growth curve.

Biotic Potential Biotic Potential The ability of a species to reproduce greatly exceeds the number necessary to replace those who die. Here are some examples of the prodigious reproductive abilities of some species

Exponential Growth Curve
• Lag Phase - First portion of the curve - slow population growth.
• Exponential Growth Phase - More organisms reproducing causing accelerated growth -continues as long as birth rate exceeds death rate.
• Stable Equilibrium Phase - Death rate and birth rate equilibrate - population stops growing.

A Typical Population Growth Curve A Typical Population Growth Curve In this mouse population, there is little growth during the lag phase. During the exponential growth phase, the population rises rapidly as increasing numbers of individuals reach reproductive age. Eventually, the population reaches a stable equilibrium phase, during which the birthrate equals the death rate.

Carrying Capacity
• Carrying Capacity - Number of individuals of a species that can be indefinitely sustained in a given area.
• Environmental Resistance – The combination of factors that sets the carrying capacity for an area. Four main factors:
– Raw material availability– Energy availability– Waste accumulation and disposal– Organism interaction

Carrying Capacity Carrying Capacity A number of factors in the environment, such as oxygen supply, food supply, diseases, predators, and space, determine the number of organisms that can survive in a given area – the carrying capacity of that area. The environmental factors that limit populations are known collectively as environmental resistance.

A Bacterial Growth Curve A Bacterial Growth Curve The initial change in population size follows a typical population growth curve until waste products become lethal. The buildup of waste products lowers the carrying capacity. When a population begins to decline, it enters the death phase.

Interaction of PredatorInteraction of Predator--Prey Population Prey Population Interaction between predator and prey species is complex and often difficult to interpret. These data show that the two populations fluctuate with about 10 years between successive high populations. The change in the lynx population usually followed changes in the varying hare population

Reproductive Strategies and Population Fluctuations
• Not all species reach a stable carrying capacity.
• Species can be broadly lumped into two categories:
– K- strategists– R-strategists

K - Strategists
• Characteristics– Large organisms - long-lived.– Produce few offspring.– Provide substantial parental care.– Populations typically stabilize at a carrying capacity.– Reproductive strategy is to invest in a few, quality
offspring.– Limited by density - dependent population controls.
Factors that become more severe as the population grows in size. (Diseases)
• Examples– Deer - Lions - Humans
R - Strategists
• Characteristics– Small organisms - Short-lived.– Produce many offspring.– Little if any parental care.– Usually do not reach carrying capacity (boom-bust
cycles).– Reproductive strategy is to produce large numbers of
offspring to overcome high mortality.– Limited by density-independent population controls.
Populations size is irrelevant to the limiting factor (weather conditions).
• Examples– Grasshoppers - Gypsy Moths - Mice

Human Population Growth
• Major reason for increasing human population growth rate is an increase in medical care, and a consequential decrease in death rates.
• Doubling Time of a population (years) :
70 / Population Growth Rate (%)
( 70 / 2.0% = 35 years )

The Historical Human Population Curve The Historical Human Population Curve From A. D. 1930, the number of humans doubled from 1 billion to 2 billion and then doubled again by 1975 and could double again by the year 2025. How long can this pattern contiue begorethe Earth’s ultimate carrying capacity is reached?

Doubling Time for the Human Population Doubling Time for the Human Population This graph shows the relationship between the rate of annual increase in percent and doubling time. A population growth rate of 1 per year would result in the doubling of the population in about 70 years. A population growth rate of 3 percent per year would result in a population doubling in about 23 year.

Human Population Trends and Implications
• World population stands at about 6 billion.– Expect 7.8 billion by 2025.
• Largest increase expected in poor, underdeveloped countries.
• Wide economic gap exists both between and within countries.

Population Growth in the World (2002) Population Growth in the World (2002) The population of the world is not evenly distributed. Currently, over 82 percent of the world’s population is in Latin America, and Asia. These areas have the highest rates of increase and are generally considered less developed. Because of the high birthrates, they are likely to remain less developed and will constitute over 87 percent of the world’s population by the year of 2050.

Trends and Implications
• Several factors determine the impact of a society on natural resources.
– Population SizeLarger demand on resources.
– Population DensityHigher density causes more problems.
– Degree of Technological DevelopmentAffluence and increased resource use.

Factors That Influence Population Growth
• Biological Factors– Demography - study of populations and their
characteristics.Birth rate usually exceeds death rate. There is an ultimate carrying capacity for the human population.Unlike other organisms, we have accumulated knowledge and can adjust our lifestyles and impacts accordingly.


Biological Factors
• Total Fertility Rate (TFR) - Number of children a woman has during her lifetime.
• Replacement Level Fertility - Number of children needed to replace everyone in the population.
– Varies between regions (2.1).• Zero Population Growth - Birth rate equals death
rate.• Age Distribution - Number of people of each age
in the population.

Social Factors
• Reducing fertility rates would be advantageous, especially in LDC’s.
– Not everyone agrees.• Major social factor determining family size
is the role of women in society.– In male dominated cultures, traditional role of
women is to marry and raise children.• Lack of education opportunities for women
reduces their options.

Social Factors
• Early marriages foster high fertility rates.• When level of education increases, fertility
rates fall. • Some cultures (women) desire large
families:– High infant mortality rates - pension– Young children can bring in income.
Underdeveloped world: children are an economic gain.Developed world: children are an economic drain.

Relationship Between Literacy, Fertility, and Economic WellRelationship Between Literacy, Fertility, and Economic Well--Being Being The literacy rate of a population is directly correlated with the fertility rate and economic well-being.

Political Factors• Governments can either reward or punish high
fertility rates.– Several European countries are concerned about low
birth rates.Polices to encourage children.
Funded maternity leave.Childcare facilities.
– Most developing countries are concerned that population growth is too rapid.
Programs to limit growth.Family PlanningAge of First MarriageOne-Child Policy
Political Factors
• Immigration Policies– Developed countries are under intense
pressure to accept immigrants.– Upheaval in one region strains other regions as
well.

Population Changes in China Population Changes in China China has had a long history of actively promoting population control. This graph shows the changes that have occurred in birthrates, death rates, and total population as a result of significant policy initiatives.

Population Growth and Standard of Living
• Appears to be inverse relationship between country’s growth rate and standard of living.
• Standard of living difficult to quantify since various cultures have different desires.
– Economic well-being.– Health conditions.– Social status and mobility.– Gross National Product (GNP).
Total value of good and services generated within a country.

Standard of Living and Standard of Living and Population Growth in 3 Population Growth in 3 Countries Countries Standard of living is a measure of how well one lives. It is not possible to get a precise definition, but when we compare the 3 countries, it is obvious that there are great differences in how the people in these countries live.

Population and Poverty - A Viscous Cycle
• Poor People:– Cannot afford birth control.– Need multiple avenues to obtain money.– Have little access to health care.
• Women in poor countries are usually poorly educated and are monetarily dependent on husbands.
• High infant mortality rates spur desire for large numbers of offspring.

Hunger, Food Production and Environmental Degradation
• As human population grows so does demand for food.
• Most people in developed countries must purchase their own food.
• Most people in less-developed countries must grow their own food.
• Human populations can increase in size if only other plant and animal populations decrease in size.

Hunger, Food Production and Environmental Degradation
• People in less-developed countries generally feed at lower trophic levels than those in developed world.
• Long-term environmental health may be sacrificed for short-term population needs.
• Humanitarian Food Aid– Temporary relief of symptoms.– Works against self-reliance.

Population and Population and TrophicTrophic Levels Levels The larger a population, the more energy it takes to sustain the populations. Every time one organism is eaten by another organism, approximately 90% of the energy is lost. Therefore, when countries are densely populated they usually feed at the herbivore trophic level. The same amount of grain can support 10 times more people at the herbivore level than at the carnivore level.

The Demographic Transition Concept
• Demographic Transition - Model of population growth based on historical, social, and economic development of Europe and N. America.
– Stable pop. (high birth and death rates)– Death rate falls, population grows– Industrialization - birth rate falls– Death rates and birth rates equilibrate

Demographic Transition Demographic Transition The demographic transition model suggests that as a country develops technologically, it automatically experiences a drop in the birthrate.

The Demographic Transition Concept
• Comfortable - This is a comfortable model, because it suggests that industrialization will naturally lead to stabilization of the population.
– Problem - Can a model developed in Europe and NA be applied to less-developed countries ?
Resources are no longer abundant.Human pop. is growing much faster.

United States Population Picture
• US population has a post-war baby boom period, significantly affecting pop. trends.
– 1947 - 1961– By 2030, 20% of US pop will be >65.

Changing Age Distribution of U.S. Population (1970Changing Age Distribution of U.S. Population (1970--2000) 2000) These graphs show the number of people in the USA at each age level.

U.S. Population Growth U.S. Population Growth The population of the United States has grown continuously since colonization. The graph indicates that the size of the population was about 275 million people in 2000. It will reach about 404 million by 2050. This is an increase of nearly 50 percent in 50 years.

Baby Boomers
• BB encouraged growth of industries needed by young families.
• Today these babies are having babies of their own.
• People are now living longer.• Growing need now for services for the
elderly.

Immigration• US population is still growing 1.1% per year.
– 0.6% natural increase– 0.5% immigration
Immigration projected to be 50% of population growth by 2050.
• Immigration policy sends mixed signals:– Illegal immigrants add to state education and health
care costs.– Some segments of US economy heavily use immigrant
workers.– US policy allows reuniting families of US residents.

Anticipated Changes with Continued Population Growth
• Differences in Standard of Living between developed and less-developed countries will remain significant.
– Most population increase in tropical, developing nations.
• Developed countries may have to choose:– Helping developing nations.– Isolation from problems of developing nations.

Summary• A population is a group of organisms of the same
species that inhabits an area. Population growth is determined by he combined effects of birthrate and death rate.
• Age distribution and sex ratio have a profound impact on population growth.
• Interactions among individuals in a population, such as competition, predation, and parasitism, are important in determining population size.
• A typical population growth curve: a lag phase + exponential growth phase + stable equilibrium phase at the carrying capacity.
– Carrying capacity: determined by many limiting factors known as environmental resistance.

Summary• Reproductive Strategies
– K-strategists: large, long-lived organisms that reach a stable population at the carrying capacity.
– r-strategists: small, short-lived organisms that reproduce very quickly.
• Human Population Growth are determined by– Biological factors such as birthrate and death rate– Sociological and economic factors that affect the number of
children desired by women– Political factors such as one-child policy in China
• The demographic transition model suggests the as a country becomes industrialized, its population begins to stabilize.
– Enough energy and natural resources for industrialization of allcountries?
– Application of the model derived from developed nations to the whole word?

Key Terms•• Age distributionAge distribution
the number of individuals of each age in the population which influences greatly the rate of population growth.
•• Carrying capacityCarrying capacitythe number of individuals of a species that can be
maintained in an area, over time, without harming the habitat.
•• Environmental resistanceEnvironmental resistancethe combination of factors that sets the carrying capacity
for an area, such as the availability of raw materials and energy, the accumulation of waste products, and interactions among organisms.
•• Exponential growth phaseExponential growth phasethe stage on a typical population growth curve when the
offspring of a species begin to mate and have young while the parents may be producing a second set of offspring, which results in a population increase at an accelerating rate.

Key Terms
•• KK--strategistsstrategistsorganisms that typically reach a stable population as the
population reaches the carrying capacity.•• rr--strategistsstrategists
organisms that typically exploits unstable environments.•• Limiting factorLimiting factor
a particular factor as a key component that limits the size of a population.
•• Demographic transitionDemographic transitiona model which suggests that as a country develops
technologically, it automatically experiences a drop in the birthrate.

Key Terms
•• Gross national income (GNI)Gross national income (GNI)an index that measures the total goods and services
generated within a country as well as income earned by citizens of the country who are living in other countries.
•• Population densityPopulation densitythe number of people per unit of land area, which relates
the size of the population to the resources available.•• Total fertility rateTotal fertility rate
the number of children born per woman in her lifetime.

Review Questions
• How is biotic potential related to the rate at which a population will grow?
• List four factors that could determine the carrying capacity of an animal species.
• How do the concepts of birthrate and population growth differ?
• How do r-strategists and K-strategists differ?

Review Questions
• All successful organisms overproduce. What advantage does this provide for the species? What disadvantages may occur?
• What does the age distribution of a population mean?
• List the changes you might anticipate if world population were to double in the next 50 years.
• What role does the status of women play in determining population growth rates?