Embed Size (px)
Citation preview

Hyundai Powertech Co., Ltd.Financial StatementsDecember 31, 2012 and 2011

Hyundai Powertech Co., Ltd.IndexDecember 31, 2012 and 2011
Page(s)
Report of Independent Auditors……………………......................................................... 1 - 2
Financial Statements
Statements of Financial Position…….........................................................……………. 3
Statements of Income……............................................................................................ 4
Statements of Comprehensive Income….…………….……………………........... …… 5
Statements of Changes in Equity.................................................................................. 6
Statements of Cash Flows........................................................................................... 7
Notes to Financial Statements....................................................................................... 8 - 45
Report of Independent Accountant’s Review of Internal Accounting Control System 46 – 47

Report of Independent Auditors
To the Shareholders and Board of Directors of
Hyndai Poewrtech Co., Ltd.
We have audited the accompanying statements of financial position of Hyndai Powertech Co., Ltd. as
of December 31, 2012 and 2011, and the related statements of income, comprehensive income,
changes in equity and cash flows for the years then ended, expressed in Korean won. These financial
statements are the responsibility of the Company's management. Our responsibility is to express an
opinion on these financial statements based on our audit.
We conducted our audits in accordance with auditing standards generally accepted in the Republic of
Korea. Those standards require that we plan and perform the audit to obtain reasonable assurance
about whether the financial statements are free of material misstatement. An audit includes
examining, on a test basis, evidence supporting the amounts and disclosures in the financial
statements. An audit also includes assessing the accounting principles used and significant estimates
made by management, as well as evaluating the overall financial statement presentation. We believe
that our audits provide a reasonable basis for our opinion.
In our opinion, the financial statements, referred to above, present fairly, in all material respects, the
financial position of Hyndai Powertech Co., Ltd. as of December 31, 2012 and 2011, and its financial
performance and cash flows for the years then ended, in accordance with International Financial
Reporting Standards as adopted by the Republic of Korea (“Korean IFRS”).

2
Auditing standards and their application in practice vary among countries. The procedures and
practices used in the Republic of Korea to audit such financial statements may differ from those
generally accepted and applied in other countries. Accordingly, this report is for use by those who are
informed about Korean auditing standards and their application in practice.
Seoul, Korea
March 13, 2013
This report is effective as of March 13, 2013, the review report date. Certain subsequent events or
circumstances, which may occur between the review report date and the time of reading this report,
could have a material impact on the accompanying financial statements and notes thereto.
Accordingly, the readers of the audit report should understand that there is a possibility that the
above audit report may have to be revised to reflect the impact of such subsequent events or
circumstances, if any.

Hyndai Powertech Co., LtdStatements of Financial Position
December 31, 2012 and 2011
(in thousands of Korean won) Notes 2012 2011
Assets
Current assets
Cash and cash equivalents 5 \ 103,620,585 \ 112,486,491
Short-term financial instruments 5 2,000,000 -
Trade receivables 5,6,28 498,722,283 303,993,251
Other receivables 5,28 34,163,235 33,856,109
Derivative financial assets 4,5,17 1,598,555 5,994,970
Inventories 8 156,988,254 149,181,961
Other current notes receivables 5 8,129,434 1,985,993
Other current assets 2,903,936 496,853
808,126,282 607,995,628
Non-current assets
Investments in associates 9 67,468,433 55,962,509
Property, plant and equipment 10,12,28 1,058,971,252 1,063,579,258
Intangible assets 11,12 55,394,778 47,739,734
Deferred income tax assets 16 22,319,631 11,286,355
Other non-current notes receivables 5,7 5,004,270 4,666,072
1,209,158,364 1,183,233,928Total assets 2,017,284,646 1,791,229,556
Liabilities
Current liabilities
Trade payables 4,5,28 359,625,185 324,113,252
Short-term borrowings 4,5,6,13 29,050,633 6,564,995
Other payables 4,5,28 152,146,608 193,486,213
Advances received 11,490,298 9,192,921
Accrued expenses 5 21,234,269 11,951,430
Provisions 15 21,231,922 15,737,792Provisions 15 21,231,922 15,737,792
Income tax payable 26,032,262 12,448,375
Derivative financial liabilities 4,5,17 - 916,198
Current portion of long-term borrowings 4,5,13 20,340,400 62,578,498
Current portion of debentures 4,5,13 39,964,889 109,909,567
Other current liabilities 4,5 7,876,928 2,213,080
688,993,394 749,112,321
Non-current liabilities
Debentures 4,5,13 432,213,581 246,805,182
Long-term borrowings 4,5,13 25,525,800 45,866,200
Defined benefit obligations 14 7,345,483 2,628,407
Provisions 15 38,528,065 36,150,586
Long-term non-trade payables 4,5 159,000 -Derivative financial liabilities 4,5,17 3,345,281 839,444
507,117,210 332,289,819
Total liabilities 1,196,110,604 1,081,402,140
Equity
Capital stock 1,18 458,906,000 458,906,000
Other components of equity 19 (6,506,911) (3,567,688)
Retained earnings 20 368,774,953 254,489,104
Total equity 821,174,042 709,827,416Total liabilities and equity 2,017,284,646 1,791,229,556
The accompanying notes are an integral part of these financial statements.
3

Hyndai Powertech Co., LtdStatements of Income
Years Ended December 31, 2012 and 2011
Notes 2012 2011
Sales 21,28 \ 2,954,851,860 \ 2,803,987,769
Cost of sales 21,23,28 (2,685,094,496) (2,577,045,642)
Gross profit 269,757,364 226,942,127
Selling and administrative expenses 22,23 (135,993,263) (114,123,058)
Operating income 133,764,101 112,819,069
Other income 24 45,330,868 48,353,045
Other expenses 24 (44,825,074) (38,487,429)
Finance income 25 36,339,247 14,390,138
Finance expenses 25 (31,230,503) (22,137,116)
Gain(loss) on equity method 9 2,369,208 (2,052,603)
Profit before income tax 141,747,847 112,885,104
Income tax expense 16 (23,931,463) (14,328,080)
Profit for the year 117,816,384 98,557,024
Earnings per share 26 1,284 1,074
(in thousands of Korean won,except per share amounts)
The accompanying notes are an integral part of these financial statements.
4

Hyndai Powertech Co., LtdStatements of Comprehensive Income
Years Ended December 31, 2012 and 2011
2012 2011
Profit for the year \ 117,816,384 \ 98,557,024
Other comprehensive loss
Gain (loss) on valuation of derivatives 985,849 (322,572)
Share of other comprehensive income of associates (3,927,970) 1,649,335
Actuarial loss on defined benefit liability (3,527,637) (2,768,856)
Other comprehensive loss (6,469,758) (1,442,093)
Total comprehensive income for the year 111,346,626 97,114,931
(in thosands of Korean won)
The accompanying notes are an integral part of these financial statements.
5

Hyndai Powertech Co., Ltd
Statements of Changes in Equity
Years Ended December 31, 2012 and 2011
Other Total
(in thousands of Korean won) Paid-in Capital Components of Equity Retained Earnings Equity
Balance at January 1, 2011 \ 458,906,000 \ (4,897,348) \ 158,703,833 \ 612,712,485- - -
Comprehensive income
Profit for the year - - 98,557,024 98,557,024
Loss on valuation of derivatives - (322,572) - (322,572)
Share of other comprehensive income of associates - 1,649,335 - 1,649,335
Actuarial loss on defined benefit obligations - - (2,768,856) (2,768,856)
Total comprehensive income for the year - 1,326,763 95,788,168 97,114,931
Amortization of discounts on stock issuuance - 2,897 (2,897) -
Balance at December 31, 2011 458,906,000 (3,567,688) 254,489,104 709,827,416
Balance at January 1, 2012 458,906,000 (3,567,688) 254,489,104 709,827,416-
Comprehensive income
Profit for the year - - 117,816,384 117,816,384
Gain on valuation of derivatives - 985,849 - 985,849
Share of other comprehensive income of associates - (3,927,970) - (3,927,970)
Actuarial loss on defined benefit obligations - - (3,527,637) (3,527,637)
Total comprehensive income for the year - (2,942,121) 114,288,747 111,346,626
Amortization of discounts on stock issuuance - 2,898 (2,898) -
Balance at December 31, 2012 458,906,000 (6,506,911) 368,774,953 821,174,042
The accompanying notes are an integral part of these financial statements.
6
Hyndai Powertech Co., Ltd
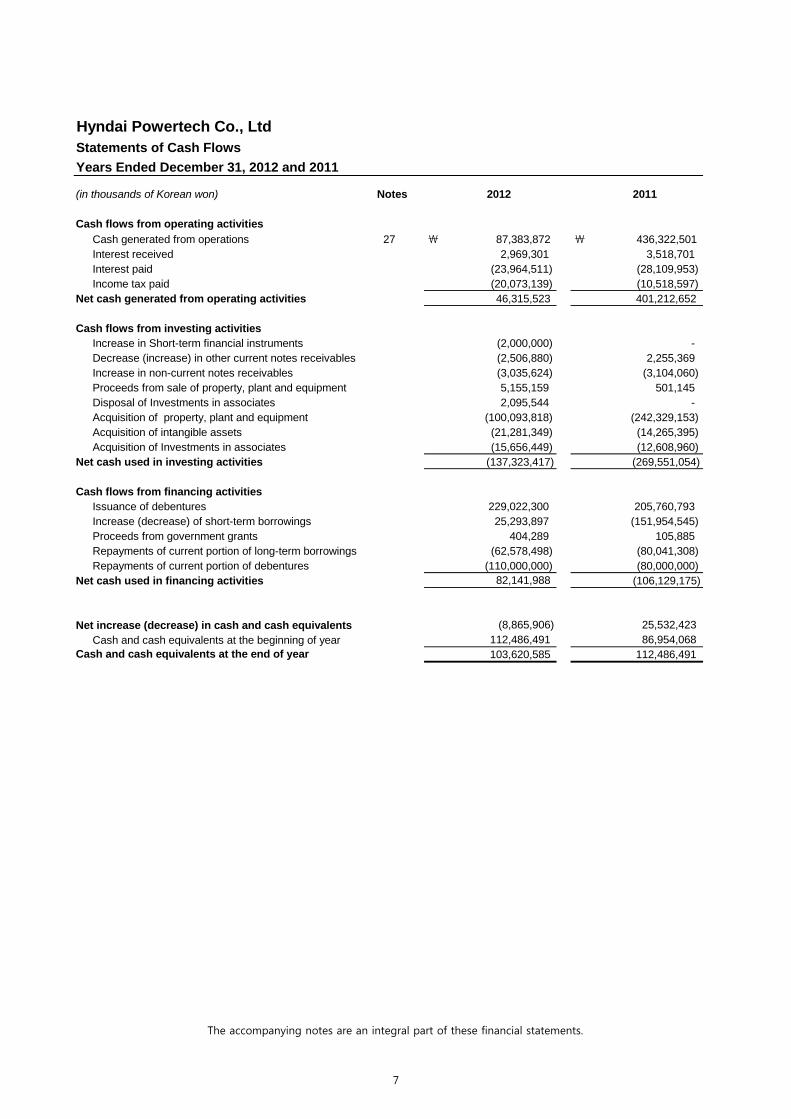
Statements of Cash Flows
Years Ended December 31, 2012 and 2011
(in thousands of Korean won) Notes 2012 2011
Cash flows from operating activities
Cash generated from operations 27 \ 87,383,872 \ 436,322,501
Interest received 2,969,301 3,518,701
Interest paid (23,964,511) (28,109,953)
Income tax paid (20,073,139) (10,518,597)
Net cash generated from operating activities 46,315,523 401,212,652
Cash flows from investing activities
Increase in Short-term financial instruments (2,000,000) -
Decrease (increase) in other current notes receivables (2,506,880) 2,255,369
Increase in non-current notes receivables (3,035,624) (3,104,060)
Proceeds from sale of property, plant and equipment 5,155,159 501,145
Disposal of Investments in associates 2,095,544 -
Acquisition of property, plant and equipment (100,093,818) (242,329,153)
Acquisition of intangible assets (21,281,349) (14,265,395)
Acquisition of Investments in associates (15,656,449) (12,608,960)
Net cash used in investing activities (137,323,417) (269,551,054)
Cash flows from financing activities
Issuance of debentures 229,022,300 205,760,793
Increase (decrease) of short-term borrowings 25,293,897 (151,954,545)
Proceeds from government grants 404,289 105,885
Repayments of current portion of long-term borrowings (62,578,498) (80,041,308)
Repayments of current portion of debentures (110,000,000) (80,000,000)
Net cash used in financing activities 82,141,988 (106,129,175)Net cash used in financing activities 82,141,988 (106,129,175)
Net increase (decrease) in cash and cash equivalents (8,865,906) 25,532,423
Cash and cash equivalents at the beginning of year 112,486,491 86,954,068
Cash and cash equivalents at the end of year 103,620,585 112,486,491
The accompanying notes are an integral part of these financial statements.
7

Hyundai Powertech Co., Ltd.Notes to Financial StatementsDecember 31, 2012 and 2011
8
1. General Information
Hyundai Powertech Co., Ltd. (the “Company”) was established on March 14, 2001, to engage inmanufacturing and sale of automative transmission and other vehicle related parts. As of December31, 2012, the Company’s headquarter and plant are located in Seosan, Chungcheong-namdo, Korea,and the Company has two manufacturing corporations, Powertech America, Inc. (PTA) and HyundaiPowertech (Shandong) Co., Ltd. (PTC), are located in the U.S. and China. The Company supplies itsproducts to Hyundai Motor Co., Ltd., Kia Motor Co., Ltd., Hyundai Mobis Co., Ltd.,, Hyundai Glovis Co.,Ltd., Hyundai Wia Co., Ltd. and others.
As of December 31, 2012, the total paid-in capital of the Company is ₩458,906 million.
Shareholders of the Company as of December 31, 2012 and 2011 are summarized below:
Shareholders Number of shares Percentage of ownership (%)
Hyundai Motor Co., Ltd. 34,487,891 37.58
Kia Motor Co.,Ltd 34,487,891 37.58
Hyundai Mobis Co.,Ltd 22,805,418 24.84
91,781,200 100.00
2. Significant Accounting Policies
The principal accounting policies applied in the preparation of these separate financial statements areset out below. These policies have been consistently applied to all the periods presented, unlessotherwise stated.
2.1 Basis of Preparation
The Company maintains its accounting records in Korean won and prepares statutory financialstatements in the Korean language (Hangul) in accordance with the International Financial ReportingStandards as adopted by the Republic of Korea (“Korean IFRS”). The accompanying separatefinancial statements have been condensed, restructured and translated into English from the Koreanlanguage financial statements.
Certain information attached to the Korean language financial statements, but not required for a fairpresentation of the Company's financial position, financial performance or cash flows, is not presentedin the accompanying financial statements.
The Company’s financial statements for the annual period beginning on January 1, 2011, have beenprepared in accordance with Korean IFRS. These are the standards, subsequent amendments andrelated interpretations issued by the International Accounting Standards Board ("IASB") that havebeen adopted by the Republic of Korea.
The preparation of the financial statements requires the use of certain critical accounting estimates. Italso requires management to exercise judgment in the process of applying the Company’s accountingpolicies. The areas involving a higher degree of judgment or complexity, or areas where assumptionsand estimates are significant to the financial statements are disclosed in Note 3.
Hyundai Powertech Co., Ltd.Notes to Financial StatementsDecember 31, 2012 and 2011
9
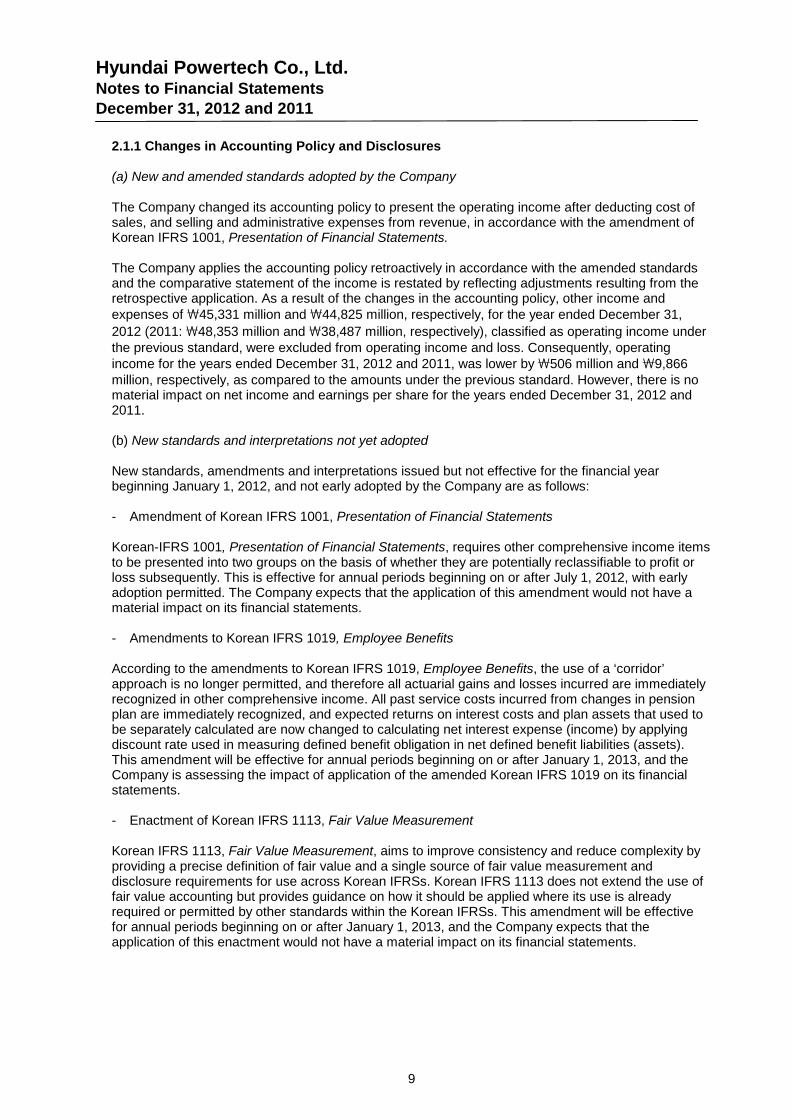
2.1.1 Changes in Accounting Policy and Disclosures
(a) New and amended standards adopted by the Company
The Company changed its accounting policy to present the operating income after deducting cost ofsales, and selling and administrative expenses from revenue, in accordance with the amendment ofKorean IFRS 1001, Presentation of Financial Statements.
The Company applies the accounting policy retroactively in accordance with the amended standardsand the comparative statement of the income is restated by reflecting adjustments resulting from theretrospective application. As a result of the changes in the accounting policy, other income andexpenses of \45,331 million and \44,825 million, respectively, for the year ended December 31,
2012 (2011: \48,353 million and \38,487 million, respectively), classified as operating income underthe previous standard, were excluded from operating income and loss. Consequently, operatingincome for the years ended December 31, 2012 and 2011, was lower by\506 million and \9,866million, respectively, as compared to the amounts under the previous standard. However, there is nomaterial impact on net income and earnings per share for the years ended December 31, 2012 and2011.
(b) New standards and interpretations not yet adopted
New standards, amendments and interpretations issued but not effective for the financial yearbeginning January 1, 2012, and not early adopted by the Company are as follows:
- Amendment of Korean IFRS 1001, Presentation of Financial Statements
Korean-IFRS 1001, Presentation of Financial Statements, requires other comprehensive income itemsto be presented into two groups on the basis of whether they are potentially reclassifiable to profit orloss subsequently. This is effective for annual periods beginning on or after July 1, 2012, with earlyadoption permitted. The Company expects that the application of this amendment would not have amaterial impact on its financial statements.
- Amendments to Korean IFRS 1019, Employee Benefits
According to the amendments to Korean IFRS 1019, Employee Benefits, the use of a ‘corridor’approach is no longer permitted, and therefore all actuarial gains and losses incurred are immediatelyrecognized in other comprehensive income. All past service costs incurred from changes in pensionplan are immediately recognized, and expected returns on interest costs and plan assets that used tobe separately calculated are now changed to calculating net interest expense (income) by applyingdiscount rate used in measuring defined benefit obligation in net defined benefit liabilities (assets).This amendment will be effective for annual periods beginning on or after January 1, 2013, and theCompany is assessing the impact of application of the amended Korean IFRS 1019 on its financialstatements.
- Enactment of Korean IFRS 1113, Fair Value Measurement
Korean IFRS 1113, Fair Value Measurement, aims to improve consistency and reduce complexity byproviding a precise definition of fair value and a single source of fair value measurement anddisclosure requirements for use across Korean IFRSs. Korean IFRS 1113 does not extend the use offair value accounting but provides guidance on how it should be applied where its use is alreadyrequired or permitted by other standards within the Korean IFRSs. This amendment will be effectivefor annual periods beginning on or after January 1, 2013, and the Company expects that theapplication of this enactment would not have a material impact on its financial statements.

Hyundai Powertech Co., Ltd.Notes to Financial StatementsDecember 31, 2012 and 2011
10
- Enactment of Korean IFRS 1110, Consolidated Financial Statements
Korean IFRS 1110, Consolidated Financial Statements, builds on existing principles by identifying theconcept of control as the determining factor in whether an entity should be included in the consolidatedfinancial statements of the Parent Company. An investor controls an investee when it is exposed, orhas rights, to variable returns from its involvement with the investee and has the ability to affect thosereturns through its power over the investee. The standard provides additional guidance to assist in thedetermination of control where this is difficult to assess. This enactment will be effective for annualperiods beginning on or after January 1, 2013, and the Company is reviewing the impact of thisstandard.
- Enactment of Korean IFRS 1112, Disclosures of Interests in Other Entities
Korean IFRS 1112, Disclosures of Interests in Other Entities, provides the disclosure requirements forall forms of interests in other entities, including a subsidiary, a joint arrangement, an associate, aseparate structured entity and an unconsolidated structured entity. This enactment will be effective forannual periods beginning on or after January 1, 2013, and the Company is reviewing the impact of thisstandard.
2.2 Associates
Associates are all entities over which the Company has significant influence but not control, generallyaccompanying a shareholding of between 20% and 50% of the voting rights. Investments inassociates are accounted for using the equity method of accounting. Under the equity method, theinvestment is initially recognized at cost, and the carrying amount is increased or decreased torecognize the investor’s share of the profit or loss of the investee after the date of acquisition. TheCompany’s investment in associates includes goodwill identified on acquisition, net of anyaccumulated impairment loss.
If the ownership interest in an associate is reduced but significant influence is retained, only aproportionate share of the amounts previously recognized in other comprehensive income isreclassified to profit or loss where appropriate.
The Company’s share of post-acquisition profit or loss is recognized in the statement of income, andits share of post-acquisition movements in other comprehensive income is recognized in othercomprehensive income with a corresponding adjustment to the carrying amount of the investment.When the Company’s share of losses in an associate equals or exceeds its interest in the associate,including any other unsecured receivables, the Company does not recognize further losses, unless ithas incurred legal or constructive obligations or made payments on behalf of the associate.
The Company determines at each reporting date whether there is any objective evidence that theinvestment in the associate is impaired. If this is the case, the Company calculates the amount ofimpairment as the difference between the recoverable amount of the associate and its carrying valueand recognizes the amount as ‘impairment loss on investment in an associate’ in the statement ofincome.
Unrealized gains on transactions between the Company and its associates are eliminated to the extentof the Company’s interest in the associates. Unrealized losses are also eliminated unless thetransaction provides evidence of an impairment of the asset transferred. Accounting policies ofassociates have been changed where necessary to ensure consistency with the policies adopted bythe Company. Dilution gains and losses arising in investments in associates are recognized in theprofit or loss.

Hyundai Powertech Co., Ltd.Notes to Financial StatementsDecember 31, 2012 and 2011
11
2.3 Segment Reporting
Operating segments are reported in a manner consistent with the internal reporting provided to thechief operating decision-maker. The chief operating decision-maker is responsible for allocatingresources and assessing performance of the operating segments. The company combines automativetransmission manufacturing and sales into a single operating unit.
2.4 Foreign Currency Translation
(a) Functional and presentation currency
Items included in the financial statements of each of the Company’s entities are measured using thecurrency of the primary economic environment in which the entity operates ‘the functional currency’.The financial statements are presented in Korean won, which is the Company’s functional andpresentation currency.
(b) Functional and presentation currency
Foreign currency transactions are translated into the functional currency using the exchange ratesprevailing at the dates of the transactions or valuation where items are re-measured. Foreignexchange gains and losses resulting from the settlement of such transactions and from the translationat year-end exchange rates of monetary assets and liabilities denominated in foreign currencies arerecognized in the profit or loss, except when deferred in other comprehensive income as qualifyingcash flow hedges.
Foreign exchange gains and losses that relate to borrowings and cash and cash equivalents arepresented in the statement of income within ‘finance income (expenses)’. All other foreign exchangegains and losses are presented in the statement of income within ‘other income (expenses)’.
Changes in the fair value of monetary securities denominated in foreign currency classified asavailable-for-sale are analyzed between translation differences resulting from changes in theamortized cost of the security and other changes in the carrying amount of the security. Translationdifferences related to changes in amortized cost are recognized in profit or loss, and other changes incarrying amount are recognized in other comprehensive income.
Translation differences on non-monetary financial assets and liabilities such as equities held at fairvalue through profit or loss are recognized in profit or loss as part of the fair value gain or loss.Translation differences on non-monetary financial assets, such as equities classified asavailable-for-sale, are included in other comprehensive income.
2.5 Cash and Cash Equivalents
Cash and cash equivalents include cash on hand, deposits in banks, and other short-term highly liquidinvestments with original maturities of three months or less.
2.6 Financial Assets
2.6.1 Classification
The Company classifies its financial assets in the following categories: financial assets at fair valuethrough profit or loss, loans and receivables, available-for-sale financial assets, and held-to-maturityinvestments. The classification depends on the purpose for which the financial assets were acquiredand the nature of the assets. Management determines the classification of its financial instruments atinitial recognition.

Hyundai Powertech Co., Ltd.Notes to Financial StatementsDecember 31, 2012 and 2011
12
(a) Financial assets at fair value through profit or loss
Financial assets at fair value through profit or loss are financial instruments held for trading. A financialinstrument is classified in this category if acquired principally for the purpose of selling in the shortterm. Derivatives including bifurcated derivatives from financial instruments containing embeddedderivatives are also categorized as held for trading unless they are designated as hedges. Financialassets at fair value through profit or loss are classified as current assets.
(b) Loans and receivables
Loans and receivables are non-derivative financial assets with fixed or determinable payments thatare not quoted in an active market. They are included in current assets, except for maturities greaterthan 12 months after the end of the reporting period. These are classified as non-current assets. TheCompany’s loans and receivables comprise ‘cash and cash equivalents’, ‘trade receivables’, ‘otherreceivables’ and ‘other notes receivables’ in the statement of financial position.
(c) Available-for-sale financial assets
Available-for-sale financial assets are non-derivatives that are either designated in this category or notclassified in any of the other categories. They are included in non-current assets unless theinvestment matures or management intends to dispose of it within 12 months after the end of thereporting period.
(d) Held-to-maturity investments
Held-to-maturity investments are non-derivative financial assets with fixed or determinable paymentsand fixed maturities that the Company intends and is able to hold to maturity. If the Company were tosell other than an insignificant amounts of held-to-maturity investments, the whole category would betainted and reclassified as available-for-sale. Held-to-maturity investments are included in non-currentassets, except for those with maturities of less than 12 months after the end of the reporting period,which are classified as current assets.
2.6.2 Recognition and Mesurement
Regular purchases and sales of financial assets are recognized on the trade date. Investments areinitially recognized at fair value plus transaction costs for all financial assets not carried at fair valuethrough profit or loss. Financial assets carried at fair value through profit or loss is initially recognizedat fair value, and transaction costs are expensed in the statement of income. Available-for-salefinancial assets and financial assets at fair value through profit or loss are subsequently carried at fairvalue. Loans and receivables, and held-to-maturity investments are subsequently carried at amortizedcost using the effective interest rate method.
Gains or losses arising from changes in the fair value of the financial assets carried at fair valuethrough profit or loss, including interest income, are presented in statement of income within ‘otherincome and expenses’ in the period in which they arise. Dividend income from financial assets at fairvalue through profit or loss is recognized in the statement of income as part of ‘other income’ when theCompany’s right to receive dividend payments is established.
Changes in the fair value of monetary and non-monetary securities classified as available-for-sale arerecognized in other comprehensive income. When securities classified as available-for-sale are soldor impaired, the accumulated fair value adjustments recognized in equity are reported in the statementof income as ‘other income and expenses’.
Interest on available-for-sale and held-to-maturity securities calculated using the effective interestmethod is recognized in the statement of income as part of ‘other income’. Dividends onavailable-for-sale equity instruments are recognized in statement of income as part of ‘other income’when the Company’s right to receive dividend payments is established.

Hyundai Powertech Co., Ltd.Notes to Financial StatementsDecember 31, 2012 and 2011
13
2.6.3 Offsetting financial instruments
Financial assets and liabilities are offset and the net amount reported in the statement of financialposition when there is a legally enforceable right to offset the recognized amounts and there is anintention to settle on a net basis or realize the asset and settle the liability simultaneously.
2.6.4 Derecognition
Financial assets are derecognized when the contractual rights to receive cash from the investmentshave expired or have been transferred, and the Company has substantially transferred all risks andrewards of ownership or when the risk and rewards of ownership of transferred assets have not beensubstantially retained or transferred and the Company has not retained control over these assets.
Collaterals (trade receivables and other) provided in transactions of discount and factoring of tradereceivables do not meet the requirements for asset derecognition if risks and rewards do notsubstantially transfer in the event the debtor defaults. Financial liabilities recognized in relation to thesetransactions are included as ‘borrowings’ in the Company’s statement of financial position.
2.7 Impairment of Financial Assets
(a) Assets carried at amortized cost
The Company assesses at the end of each reporting period whether there is objective evidence that afinancial asset or a Company of financial assets is impaired. A financial asset or a group of financialassets is impaired and impairment losses are incurred only if there is objective evidence of impairmentas a result of one or more events that occurred after the initial recognition of the asset (a ‘loss event’)and that loss event (or events) has an impact on the estimated future cash flows of the financial assetor a Company of financial assets that can be reliably estimated.
The criteria that the Company uses to determine that there is objective evidence of an impairment lossinclude:
Significant financial difficulty of the issuer or obligor; A breach of contract, such as a default or delinquency in interest or principal payments; For economic or legal reasons relating to the borrower’s financial difficulty, granting to the
borrower a concession that the lender would not otherwise consider; It becomes probable that the borrower will enter bankruptcy or other financial reorganisation; The disappearance of an active market for that financial asset because of financial difficulties; or Observable data indicating that there is a measurable decrease in the estimated future cash flows
from a portfolio of financial assets since the initial recognition of those assets, although thedecrease cannot yet be identified with the individual financial assets in the portfolio, including:(i) adverse changes in the payment status of borrowers in the portfolio;(ii) national or local economic conditions that correlate with defaults on the assets in the
portfolio.
Impairment loss is measured as the difference between the assets’ carrying amount and the presentvalue of estimated future cash flows (excluding future credit losses that have not been incurred)discounted at the financial asset’s original effective interest rate. The carrying amount of the asset isreduced by the impairment loss amount and the amount of the loss is recognized in the statement ofincome. If a financial asset has a variable interest rate, the discount rate for measuring anyimpairment loss is the current effective interest rate determined under the contract. In practice, theCompany may measure impairment loss based on the fair value of financial asset using an observablemarket price.
If, in a subsequent period, the amount of impairment loss decreases and the decrease can be relatedobjectively to an event occurring after the impairment was recognized (for example, an improvementin debtor’s credit rating), the reversal of the previously recognized impairment loss is recognized in the

Hyundai Powertech Co., Ltd.Notes to Financial StatementsDecember 31, 2012 and 2011
14
statement of income
(b) Assets classified as available-for-sale
The Company assesses at the end of each reporting period whether there is objective evidence that afinancial asset or a group of financial assets is impaired. For debt securities, the Company uses thecriteria referred to in (a) above. In the case of equity investments classified as available-for-sale, asignificant or prolonged decline in the fair value of the security below its cost is also evidence that theasset is impaired. If any such evidence exists for available-for-sale financial assets, the cumulativeloss – measured as the difference between the acquisition cost and the current fair value, less anyimpairment loss on that financial asset previously recognized in profit or loss – is removed from equityand recognized in the statement of income. Impairment losses recognized in the statement of incomeon equity instruments are not reversed through the statement of income. If, in a subsequent period,the fair value of a debt instrument classified as available-for-sale increases and the increase can beobjectively related to an event occurring after the impairment loss was recognized in profit or loss, theimpairment loss is reversed through statement of income.
2.8 Derivative Financial Instruments
Derivatives are initially recognized at fair value on the date a derivative contract is entered into and aresubsequently re-measured at their fair value. The method of recognizing the resulting gain or lossdepends on whether the derivative is designated as a hedging instrument, and if so, the nature of theitem being hedged. The resulting gain or loss is recognized in 'finance income (expenses)' accordingto the nature of transactions.
The Company designates certain derivatives as either:
hedges of the fair value of recognized assets or liabilities or a firm commitment (fair value hedge); hedges of a particular risk associated with a recognized asset or liability or a highly probable
forecast transaction (cash flow hedge).
The Company documents at the inception of the transaction the relationship between hedginginstruments and hedged items, as well as its risk management objectives and strategy for undertakingvarious hedging transactions. The Company also documents its assessment, both at hedge inceptionand on an ongoing basis, of whether the derivatives that are used in hedging transactions are highlyeffective in offsetting changes in fair values or cash flows of hedged items.
The fair values of various derivative instruments used for hedging purposes and movements on thehedging reserve in other comprehensive income are disclosed in Note 17. The full fair value of ahedging derivative is classified as a non-current asset or liability when the remaining hedged item ismore than 12 months, and as a current asset or liability when the remaining maturity of the hedgeditem is less than 12 months. Trading derivatives are classified as a current asset or liability.
(a) Fair value hedge
Changes in the fair value of derivatives that are designated and qualify as fair value hedges arerecorded in the statement of income, together with any changes in the fair value of the hedged assetor liability that are attributable to the hedged risk. Changes in fair value of hedging instruments andhedged item attributable to the hedged risk are recognized with the same line item related to hedgeditem in the statement of income.
If the hedge no longer meets the criteria for hedge accounting, the adjustment to the carrying amountof a hedged item for which the effective interest method is used is amortized to profit or loss over theperiod to maturity.

Hyundai Powertech Co., Ltd.Notes to Financial StatementsDecember 31, 2012 and 2011
15
(b) Cash flow hedge
The effective portion of changes in the fair value of derivatives that are designated and qualify as cashflow hedges is recognized in other comprehensive income. The gain or loss relating to the ineffectiveportion is recognized immediately in the statement of income within ‘finance income and expenses’.
When a hedging instrument expires or is sold, or when a hedge no longer meets the criteria for hedgeaccounting, any cumulative gain or loss existing in equity at that time remains in equity and isrecognized when the forecast transaction is ultimately recognized in the statement of income. When aforecast transaction is no longer expected to occur, the cumulative gain or loss that was reported inequity is immediately transferred to the statement of income within ‘finance income and expenses’
2.9 Trade Receivables
Trade receivables are amounts due from customers for merchandise sold or services performed in theordinary course of business. If collection is expected in one year or less, they are classified as currentassets. If not, they are presented as non-current assets. Trade receivables are recognized initially atfair value, less provision for impairment.
2.10 Inventories
Inventories are stated at the lower of cost and net realizable value. Cost is determined using theweighted-average method, except for inventories in-transit and supplies which are determined usingthe specific identification method and moving average method. The cost of finished goods and work inprogress consists of raw materials, direct labor, other direct costs and related production overheads(based on normal operating capacity). It excludes borrowing costs. Net realizable value is theestimated selling price in the ordinary course of business, less applicable selling expenses.
2.11 Property, Plant and Equipment
All property, plant and equipment are stated at historical cost less depreciation. Historical cost includesexpenditures directly attribute to the acquisition of the items. Subsequent costs are included in theasset’s carrying amount or recognized as a separate asset, as appropriate, only when it is probablethat future economic benefits associated with the item will flow to the Company and the cost of theitem can be measured reliably. The carrying amount of the replaced part is derecognized. All otherrepairs and maintenance are charged to the statement of income during the financial period in whichthey are incurred.
Land is not depreciated. Depreciation on other assets is calculated using the straight-line method toallocate the difference between their cost and their residual values over their estimated useful lives, asfollows:
Buildings 20 ~ 40 years
Structures 20
Machinery 10
Others 5
The assets’ residual values and useful lives are reviewed, and adjusted if appropriate, at the end ofeach reporting period. An asset’s carrying amount is written down immediately to its recoverableamount if the asset’s carrying amount is greater than its estimated recoverable amount. Gains andlosses on disposals are determined by comparing the proceeds with the carrying amount and arerecognized within ‘other income and expenses’ in the statement of income.

Hyundai Powertech Co., Ltd.Notes to Financial StatementsDecember 31, 2012 and 2011
16
2.12 Intangible Assets
(a) Research and Development costs
Research Costs are recognized as an expense as incurred. Development costs which are individuallyidentifiable and directly related to a new technology or to new products which carry probable futurebenefits are capitalized as intangible assets when the following criteria are met:
it is technically feasible to complete intangible assets so that it will be available for use;
management intends to complete intangible assets and use or sell it;
there is an ability to use or sell intangible assets;
it can be demonstrated how intangible assets will generate probable future economic benefits;
adequate technical, financial and other resources to complete the development and to use or sell
intangible assets are available; and
the expenditure attributable to intangible assets during its development can be reliably measured.
Other development expenditures that do not meet these criteria are recognized as an expense asincurred. Development costs previously recognized as an expense are not recognized as an asset in asubsequent period. Capitalized development costs recognized as intangible assets are amortized overtheir estimated useful lives of five years with the straight-line method, and impairment test isperformed.
(b) Industrial property rights
Industrial property rights are shown at historical cost. Industrial property rights have a finite useful lifeand are carried at cost less accumulated amortization. Amortization is calculated using thestraight-line method to allocate the cost of industrial property rights over their estimated useful lives offive years.
(c) Other intangible assets
Other intangible assets are comprised of indefinite-live memberships and initial royalty paid inaccordance with an agreement of technical cooperation. The presented amount of the initial royalty iscalculated by deducting accumulated amortization from acquisition cost, and amortized in proportionto the volume of related units produced.
2.13 Borrowing Costs
General and specific borrowing costs directly attributable to the acquisition, construction or productionof qualifying assets, which are assets that necessarily take a substantial period of time to get ready fortheir intended use or sale, are added to the cost of those assets, until such time as the assets aresubstantially ready for their intended use or sale. Investment income earned on the temporaryinvestment of specific borrowings pending their expenditure on qualifying assets is deducted from theborrowing costs eligible for capitalization. All other borrowing costs are recognized in profit or loss inthe period in which they are incurred.
2.14 Government Grants
Grants from a government are recognized at their fair value where there is a reasonable assurancethat the grant will be received and the Company will comply with all attached conditions.
Government grants relating to property, plant and equipment are presented as a deduction of relatedassets and are credited to depreciation over the expected lives of the related assets.
Government grants relating to costs are deferred and recognized in the statement of income over the

Hyundai Powertech Co., Ltd.Notes to Financial StatementsDecember 31, 2012 and 2011
17
period necessary to match them with the costs that they are intended to compensate.
2.15 Impairment of Non-financial Assets
Intangible assets with indefinite useful lives are not subject to amortization and are tested annually forimpairment. Assets that are subject to amortization are reviewed for impairment whenever events orchanges in circumstances indicate that the carrying amount may not be recoverable. An impairmentloss is recognized for the amount by which the asset’s carrying amount exceeds its recoverableamount. The recoverable amount is the higher of an asset’s fair value less costs to sell and value inuse. For the purposes of assessing impairment, assets are grouped at the lowest levels for whichthere are separately identifiable cash flows (cash-generating units). Non-financial assets that sufferedimpairment are reviewed for possible reversal of the impairment at each reporting date.
2.16 Financial Liabilities
(a) Financial liabilities at fair value through profit or loss
The Company’s financial liabilities at fair value through profit or loss are financial instruments held fortrading. Financial liabilities are classified in this category if incurred principally for the purpose ofrepurchasing them in the near term. Derivatives including bifurcated derivatives from financialinstruments containing embedded derivatives are also categorized as held-for-trading unless they aredesignated as hedges.
(b) Financial liabilities carried at amortized cost
The Company classifies non-derivative financial liabilities, except for financial liabilities at fair valuethrough profit or loss, financial guarantee contracts and financial assets that arise when a transfer offinancial assets does not qualify for derecognition, as financial liabilities carried at amortized cost.Financial liabilities carried at amortized cost are included in non-current liabilities, except for liabilitieswith maturities within 12 months after the end of the reporting period, which are classified as currentliabilities.
2.17 Trade Payables
Trade payables are obligations to pay for goods or services that have been acquired in the ordinarycourse of business from suppliers. Trade payables are classified as current liabilities if payment is duewithin one year or less. If not, they are presented as non-current liabilities. Trade payables arerecognized initially at fair value and subsequently measured at amortized cost using the effectiveinterest method.
2.18 Financial Guarantee Contracts
Financial guarantee contracts are contracts that require the issuer to make specified payments toreimburse the holder for a loss it incurs because a specified debtor fails to make payments when due,in accordance with the original or modified terms of a debt instrument.
Financial guarantees are initially measured at fair value on the date the guarantee was given.Subsequent to initial recognition, the Company’s liabilities under such guarantees are measured at thehigher of the amounts below and recognized as ‘other liabilities’.
the amount determined in accordance with Korean IFRS 1037, Provisions, ContingentLiabilities and Contingent Assets; or
the initial amount, less accumulated amortization recognized in accordance with KoreanIFRS1018, Revenue.

Hyundai Powertech Co., Ltd.Notes to Financial StatementsDecember 31, 2012 and 2011
18
2.19 Borrowings
Borrowings are recognized initially at fair value, net of transaction costs incurred. Borrowings aresubsequently carried at amortized cost; any difference between the proceeds (net of transaction costs)and the redemption value is recognized in the statement of income over the period of the borrowingsusing the effective interest method. Borrowings are classified as current liabilities unless the Companyhas an unconditional right to defer the settlement of the borrowings for at least 12 months after theend of the reporting period.
2.20 Provisions
Provisions are recognized when: the Company has a present legal or constructive obligation as aresult of past events; it is probable that an outflow of resources will be required to settle the obligation;and the amount has been reliably estimated. Provisions are not recognized for future operating losses.
Provisions are measured at the present value of the expenditures expected to be required to settle theobligation using a pre-tax rate that reflects current market assessments of the time value of moneyand the risks specific to the obligation. The increase in the provision due to passage of time isrecognized as interest expense.
2.21 Current and Deferred Income Tax
The tax expense for the period comprises current and deferred tax. Tax is recognized in the statementof income, except to the extent that it relates to items recognized in other comprehensive income ordirectly in equity. In this case, the tax is also recognized in other comprehensive income or directly inequity.
The current income tax charge is calculated on the basis of the tax laws enacted or substantivelyenacted at the statement of financial position date in the country where the Company operate andgenerate taxable income. Management periodically evaluates positions taken in tax returns withrespect to situations in which applicable tax regulation is subject to interpretation. It establishesprovisions where appropriate on the basis of amounts expected to be paid to the tax authorities.
Deferred income tax is recognized, using the liability method, on temporary differences arisingbetween the tax bases of assets and liabilities and their carrying amounts in the financial statements.However, deferred tax assets and liabilities are not recognized if they arise from initial recognition ofan asset or liability in a transaction other than a business combination that at the time of thetransaction affects neither accounting nor taxable profit or loss. Deferred income tax is determinedusing tax rates and laws that have been enacted or substantially enacted by the statement of financialposition date and are expected to apply when the related deferred income tax asset is realized or thedeferred income tax liability is settled.
Deferred income tax assets are recognized only to the extent that it is probable that future taxableprofit will be available against which the temporary differences can be utilized.
Deferred income tax is provided on temporary differences arising on investments in subsidiaries andassociates, except for deferred income tax liability where the timing of the reversal of the temporarydifference is controlled by the Company and it is probable that the temporary difference will notreverse in the foreseeable future.
Deferred income tax assets and liabilities are offset when there is a legally enforceable right to offsetcurrent tax assets against current tax liabilities and when the deferred income taxes assets andliabilities relate to income taxes levied by the same taxation authority on either the same taxable entityor different taxable entities where there is an intention to settle the balances on a net basis.

Hyundai Powertech Co., Ltd.Notes to Financial StatementsDecember 31, 2012 and 2011
19
2.22 Employee Benefits
(a) Defined benefit liability
The Company has defined benefit plans. A defined benefit plan is a pension plan that is not a definedcontribution plan. Typically defined benefit plans define an amount of pension benefit that anemployee will receive on retirement, usually dependent on one or more factors such as age, years ofservice and compensation. The liability recognized in the statement of financial position in respect ofdefined benefit pension plans is the present value of the defined benefit obligation at the end of thereporting period less the fair value of plan assets, together with adjustments for unrecognizedpast-service costs. The defined benefit obligation is calculated annually by independent actuariesusing the projected unit credit method. The present value of the defined benefit obligation isdetermined by discounting the estimated future cash outflows using interest rates of high-qualitycorporate bonds that are denominated in the currency in which the benefits will be paid, and that haveterms to maturity approximating to the terms of the related pension obligation.
Actuarial gains and losses arising from experience adjustments and changes in actuarial assumptionsare charged or credited to equity in other comprehensive income in the period in which they arise.Past-service costs are recognized immediately in income, while costs are amortized over the vestingperiod.
(b) Long-term employee benefits
The Company provides long-term employee benefits, which are entitled to employees with serviceperiod for ten years and above. The expected costs of these benefits are accrued over the period ofemployment using the same accounting methodology as used for defined benefit pension plans.Actuarial gains and losses arising from experience adjustments and changes in actuarial assumptionsare recognized in the statement of income in the period in which they arise. These obligations arevalued annually by independent qualified actuaries.
2.23 Share Capital
Equity is comprised of the Company's common stock only. Where the Company purchases its ownequity share capital (treasury shares), the consideration paid, including any directly attributableincremental costs is deducted from equity attributable to the Company’s equity holders until the sharesare cancelled or reissued. Where such ordinary shares are subsequently reissued, any considerationreceived is included in equity attributable to the Company’s equity holders.
2.24 Revenue Recognition
Revenue is measured at the fair value of the consideration received or receivable, and representsamounts receivable for goods and services supplied, stated net of discounts, returns and value addedtaxes, after elimination of intra-company transactions.
The Company recognizes revenue when the amount of revenue can be reliably measured; when it isprobable that future economic benefits will flow to the entity; and when specific criteria have been metfor each of the Company’s activities, as described below. The revenue can be reliably measured onlywhen any contingency related to sales is resolved. The Company bases its estimate on historicalresults, taking into consideration the type of customer, the type of transaction and the specifics of eacharrangement.

Hyundai Powertech Co., Ltd.Notes to Financial StatementsDecember 31, 2012 and 2011
20
(a) Sales of goods
The Company manufactures and sells automotive transmission products that are necessary toautomobile manufacturing. Sales of goods are recognized when products are delivered to thepurchaser. Delivery does not occur until the products have been shipped to the specified location, therisks of obsolescence and loss have been transferred to the customer, and either the purchaser hasaccepted the products in accordance with the sales contract, the acceptance provisions have lapsedor the Company has objective evidence that all criteria for acceptance have been satisfied.
(b) Interest income
Interest income is recognized using the effective interest method according to the time passed. Whena loan and receivable is impaired, the Company reduces the carrying amount to its recoverableamount and continues unwinding the discount as interest income. Interest income on impaired loanand receivables is recognized using the original effective interest rate.
(c) Royalty income
Royalty income is recognized on an accrual basis in accordance with the substance of the relevantagreements.
2.25 Dividend Distribution
Dividend distribution to the Company’s shareholders is recognized as a liability in the financialstatements in the period in which the dividends are approved by the Company’s shareholders.
2.26 Approval of Issuance of the Financial Statements
The issuance of the December 31, 2012 financial statements of the Company was approved by theBoard of Directors on February 26, 2013.
3. Critical Accounting Estimates and Judgments
The Company makes estimates and assumptions concerning the future. The resulting accountingestimates will, by definition, seldom equal the related actual results. Estimations and assumptions arecontinuously evaluated with consideration to factors such as events reasonably predictable in theforeseeable future within the present circumstance according to historical experience. The estimatesand assumptions that have a significant risk of causing a material adjustment to the carrying amountsof assets and liabilities within the next financial year are addressed below.
(a) Income taxes
The Company recorded, based on its best estimate, current taxes and deferred taxes that theCompany will be liable in the future for the operating results as of the financial year end. However, thefinal tax outcome in the future may be different from the amounts that were initially recorded. Suchdifferences will impact the current and deferred income tax assets and liabilities in the period in whichsuch determination is made.
(b) Provisions
As described in Note 15, the Company recognizes sales warranty provisions for repairs and returnsand other provisions as of the reporting date. The amounts are estimated based on historical data.
Hyundai Powertech Co., Ltd.Notes to Financial StatementsDecember 31, 2012 and 2011
21
(c) Defined benefit liability
The present value of the defined benefit liability depends on a number of factors that are determinedon an actuarial basis using a number of assumptions. The assumptions used in determining the netcost (income) for pensions include the discount rate. Any changes in these assumptions will impactthe carrying amount of the defined benefit liability. The Company determines the appropriate discountrate at the end of each year. This is the interest rate that is used to determine the present value ofestimated future cash outflows expected to be required to settle the defined benefit liability. Indetermining the appropriate discount rate, the Company considers the interest rates of high-qualitycorporate bonds that are denominated in the currency in which the pension benefits will be paid, andthat have terms to maturity approximating to the terms of the related pension liability. Other keyassumptions for defined benefit liability are based in part on current market conditions. Additionalinformation is disclosed in Note 14.
4. Financial Risk Management
4.1 Financial Risk Factors
The Company’s activities expose it to a variety of financial risks: market risk (including foreignexchange risk, interest rate risk), credit risk and liquidity risk. The Company’s financial riskmanagement (“FRM”) policy supports each business division to achieve excellent performance solidlyand continuously against market risk, credit risk and liquidity risk. In addition, FRM helps the Companyto enhance cost competitiveness through cost-efficient financing cost by improving financial structureand effective cash management.
While cooperating with other divisions, the finance team in the Company mainly implements FRM.This involves setting-up risk management policies and recognizing, evaluating and hedging risks froma global point of view.
The Company mitigates the adverse effects from financial risk by monitoring the risk periodically andupdating FRM policy each year.
(a) Market risk
i) Foreign currency exchange risk
The Company is mainly exposed to foreign exchange risk on US Dollar. Foreign exchange risk arisesfrom future commercial transactions, recognized assets and liabilities. The purpose of foreignexchange risk management is to maximize the Company’s value by minimizing the uncertainty andvolatility of foreign exchange gains and losses from foreign exchange rate fluctuations.
The Company manages foreign exchange risk by matching inflow and outflow of each currencyperforming Leading & Lagging. The Company hedges its remaining exposure with derivative financialinstruments such as forward exchange.

Hyundai Powertech Co., Ltd.Notes to Financial StatementsDecember 31, 2012 and 2011
22
Details of monetary assets and liabilities denominated in foreign currencies of December 31, 2012 and2011, are as follows:
(in millions of Korean won,
in thousand of US dollar)
USDKorean won
equivalentsUSD
Korean won
equivalents
Foreign currency assets
Cash and cash equivalents 197 211 - -
Trade receivables 224,464 240,423 14,655 16,901
Other receivables 3,306 3,541 2,396 2,764
227,967 244,175 17,051 19,665
Foreign currency debts
Other payables 36,703 39,312 22,993 26,517
Accrued expenses 28 30 1,069 1,232
Short-term borrowings 27,122 29,051 5,692 6,565
Long-term borrowings - - 36,666 42,287
Debentures 50,000 53,555 49,862 57,506
Provisions 1,191 1,276 66 77
115,044 123,224 116,348 134,184
2012 2011
As of December 31, 2012 and 2011, if the foreign exchange rate of the Korean won fluctuated by 10%while other variables were fixed, the effects on profit(loss) before tax would have been ₩12,095
million (2011: ₩11,452 million) changed.
ii) Interest rate risk
The Company is exposed to interest rate risk through changes in interest-bearing liabilities or assets.The risk mainly arises from borrowings and financial deposits with variable interest rates linked tomarket interest rate changes in the future. The objective of interest rate risk management lies inmaximizing the Company’s value by minimizing uncertainty caused by fluctuations in interest rates andminimizing net interest expense.
To mitigate interest rate risk, the Company manages interest rate risk proactively by: minimizingexternal borrowings by maximizing internal cash sharing, reducing borrowings with high interest rates,maintaining an adequate mix between short-term and long-term liabilities and between fixed andvariable interest rates and monitoring weekly and monthly interest rate trends in domestic andinternational markets.
As of December 31, 2012 and 2011, if interest rates fluctuate by 0.1% without other variableschanging, the effects on income and expenses related to borrowings and financial deposits withvariable interest rates are as follows:
(in millions of Korean won)
0.1% increase 0.1% decrease 0.1% increase 0.1% decrease
Interest expenses (45) 45 (108) 108
Interest revenues 102 (102) 112 (112)
2012 2011

Hyundai Powertech Co., Ltd.Notes to Financial StatementsDecember 31, 2012 and 2011
23
(b) Credit risk
Credit risk is the risk of suffering financial loss should any of the Company’s customers, clients ormarket counterparties fail to fulfill their contractual obligations to the Company. The Companymanages credit risk by assessing the credit quality of customers and other counterparties to set creditlimit in considering their financial conditions, past activities and other factors. Credit risks of cash andcash equivalents, deposits with financial institutions and derivative financial instruments are limited inaccordance with making transactions with highly credit rated financial institutions by international creditrating agencies.
As of December 31, 2012 and 2011, details of financial assets that are exposed to credit risk are asfollows:
(in millions of Korean won) 2012 2011
Neither past due nor impaired 653,224 462,967
Past due and non-impaired - -
Impaired - -
653,224 462,967
(*) The maximum exposure amount of the above financial assets’ credit risk is the book value.
Classification of the above financial assets is summarized below:
(in millions of Korean won) 2012 2011
Hyndai Motor Group1
267,040 297,247
Associates 225,919 16,415
Financial institutions 107,289 118,519
Employees 5,561 5,192
Others 47,415 25,594
653,224 462,967
1Hyundai Motor Group in accordance with Fair Trade Act
(c) Liquidity risk
Liquidity risk is defined as the risk that the Company is unable to meet its short-term paymentobligations on time due to deterioration of its business performance or inability to access financing.The Company forecasts its cash flow and liquidity status and sets action plans on a regular base tomanage liquidity risk proactively. Accordingly, the Company’s finance and treasury departmentsconduct continuous monitoring liquidity forecasts to manage borrowing limits and agreements tosupport operating activities. Funding plans, agreement terms, the Company’s targeted financial ratiosand regulatory requirements are considered in order to forecast liquidity.
Hyundai Powertech Co., Ltd.Notes to Financial StatementsDecember 31, 2012 and 2011
24
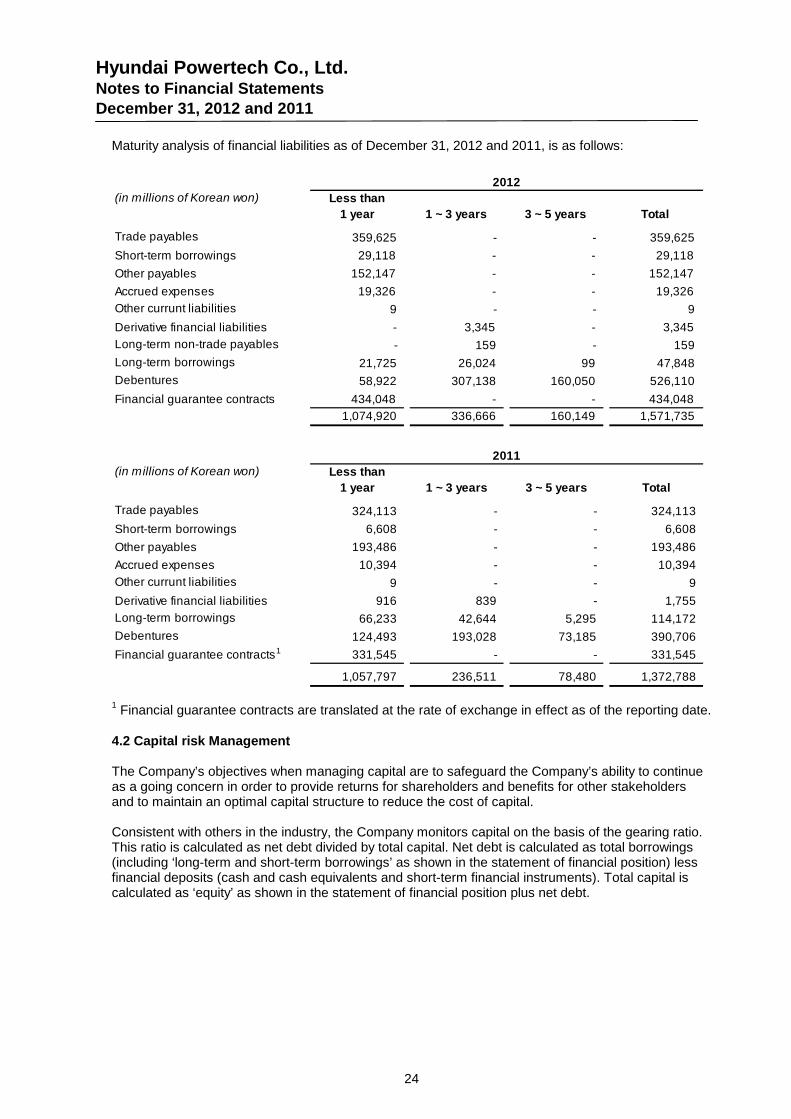
Maturity analysis of financial liabilities as of December 31, 2012 and 2011, is as follows:
(in millions of Korean won) Less than
1 year 1 ~ 3 years 3 ~ 5 years Total
Trade payables 359,625 - - 359,625
Short-term borrowings 29,118 - - 29,118
Other payables 152,147 - - 152,147
Accrued expenses 19,326 - - 19,326
Other currunt liabilities 9 - - 9
Derivative financial liabilities - 3,345 - 3,345
Long-term non-trade payables - 159 - 159
Long-term borrowings 21,725 26,024 99 47,848
Debentures 58,922 307,138 160,050 526,110
Financial guarantee contracts 434,048 - - 434,048
1,074,920 336,666 160,149 1,571,735
2012
(in millions of Korean won) Less than
1 year 1 ~ 3 years 3 ~ 5 years Total
Trade payables 324,113 - - 324,113
Short-term borrowings 6,608 - - 6,608
Other payables 193,486 - - 193,486
Accrued expenses 10,394 - - 10,394
Other currunt liabilities 9 - - 9
Derivative financial liabilities 916 839 - 1,755
Long-term borrowings 66,233 42,644 5,295 114,172
Debentures 124,493 193,028 73,185 390,706
Financial guarantee contracts1 331,545 - - 331,545
1,057,797 236,511 78,480 1,372,788
2011
1Financial guarantee contracts are translated at the rate of exchange in effect as of the reporting date.
4.2 Capital risk Management
The Company’s objectives when managing capital are to safeguard the Company’s ability to continueas a going concern in order to provide returns for shareholders and benefits for other stakeholdersand to maintain an optimal capital structure to reduce the cost of capital.
Consistent with others in the industry, the Company monitors capital on the basis of the gearing ratio.This ratio is calculated as net debt divided by total capital. Net debt is calculated as total borrowings(including ‘long-term and short-term borrowings’ as shown in the statement of financial position) lessfinancial deposits (cash and cash equivalents and short-term financial instruments). Total capital iscalculated as ‘equity’ as shown in the statement of financial position plus net debt.
Hyundai Powertech Co., Ltd.Notes to Financial StatementsDecember 31, 2012 and 2011
25
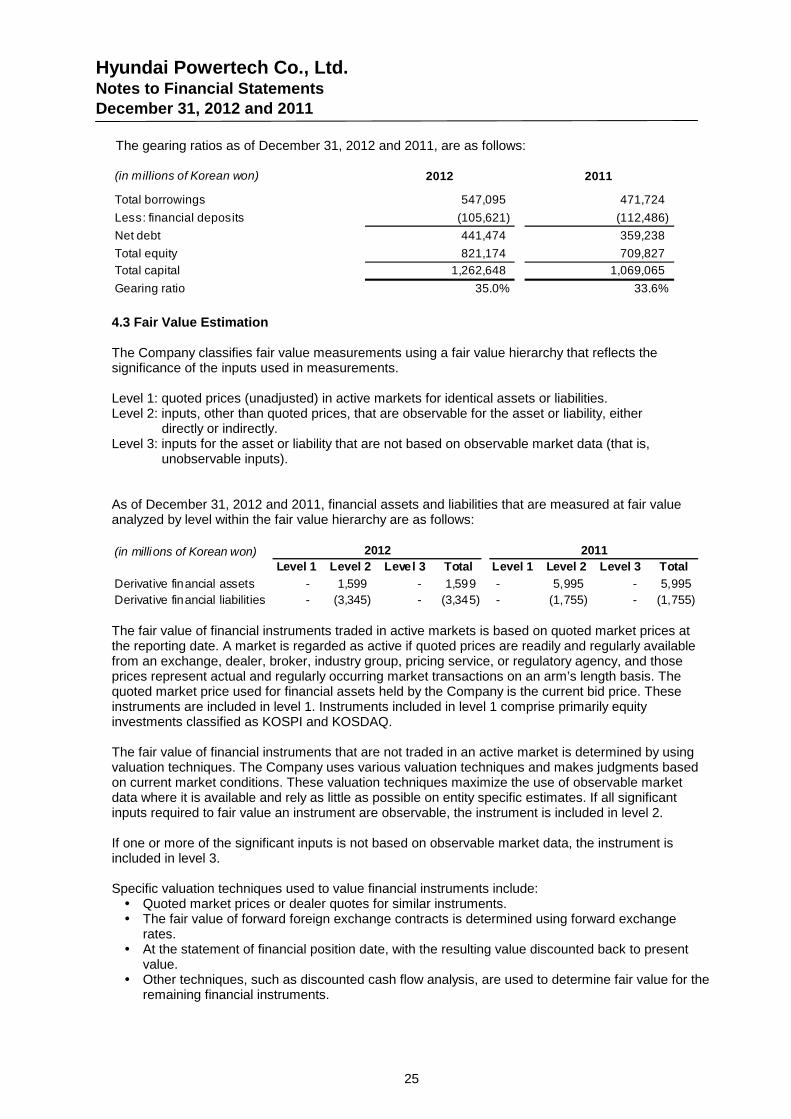
The gearing ratios as of December 31, 2012 and 2011, are as follows:
(in millions of Korean won) 2012 2011
Total borrowings 547,095 471,724
Less: financial deposits (105,621) (112,486)
Net debt 441,474 359,238
Total equity 821,174 709,827
Total capital 1,262,648 1,069,065
Gearing ratio 35.0% 33.6%
4.3 Fair Value Estimation
The Company classifies fair value measurements using a fair value hierarchy that reflects thesignificance of the inputs used in measurements.
Level 1: quoted prices (unadjusted) in active markets for identical assets or liabilities.Level 2: inputs, other than quoted prices, that are observable for the asset or liability, either
directly or indirectly.Level 3: inputs for the asset or liability that are not based on observable market data (that is,
unobservable inputs).
As of December 31, 2012 and 2011, financial assets and liabilities that are measured at fair valueanalyzed by level within the fair value hierarchy are as follows:
(in millions of Korean won)Level 1 Level 2 Level 3 Total Level 1 Level 2 Level 3 Total
Derivative financial assets - 1,599 - 1,599 - 5,995 - 5,995
Derivative financial liabilities - (3,345) - (3,345) - (1,755) - (1,755)
2012 2011
The fair value of financial instruments traded in active markets is based on quoted market prices atthe reporting date. A market is regarded as active if quoted prices are readily and regularly availablefrom an exchange, dealer, broker, industry group, pricing service, or regulatory agency, and thoseprices represent actual and regularly occurring market transactions on an arm’s length basis. Thequoted market price used for financial assets held by the Company is the current bid price. Theseinstruments are included in level 1. Instruments included in level 1 comprise primarily equityinvestments classified as KOSPI and KOSDAQ.
The fair value of financial instruments that are not traded in an active market is determined by usingvaluation techniques. The Company uses various valuation techniques and makes judgments basedon current market conditions. These valuation techniques maximize the use of observable marketdata where it is available and rely as little as possible on entity specific estimates. If all significantinputs required to fair value an instrument are observable, the instrument is included in level 2.
If one or more of the significant inputs is not based on observable market data, the instrument isincluded in level 3.
Specific valuation techniques used to value financial instruments include: Quoted market prices or dealer quotes for similar instruments. The fair value of forward foreign exchange contracts is determined using forward exchange
rates. At the statement of financial position date, with the resulting value discounted back to present
value. Other techniques, such as discounted cash flow analysis, are used to determine fair value for the
remaining financial instruments.

Hyundai Powertech Co., Ltd.Notes to Financial StatementsDecember 31, 2012 and 2011
26
5. Financial Instruments by Category
Categorizations of financial assets as of December 31, 2012 and 2011, are as follows:
(in millions of Korean won)
Financial assets Loans and receivables
Fair value hedging
finacial assets Total
Cash and cash equivalents 103,607 - 103,607
Short-term financial instruments 2,000 - 2,000
Trade receivables 498,722 - 498,722
Other receivables 34,163 - 34,163
Other current notes receivables 8,129 - 8,129
Other non-current notes receivables 5,004 - 5,004
Derivative financial assets - 1,599 1,599
651,625 1,599 653,224
2012
(in millions of Korean won)
Financial assets Loans and receivables
Fair value hedging
finacial assets
Cash flow hedging
finacial assets Total
Cash and cash equivalents 112,471 - - 112,471
Trade receivables 303,993 - - 303,993
Other receivables 33,856 - - 33,856
Other current notes receivables 1,986 - - 1,986
Other non-current notes receivables 4,666 - - 4,666
Derivative financial assets - 27 5,968 5,995
456,972 27 5,968 462,967
2011
Categorizations of financial liabilities as of December 31, 2012 and 2011, are as follows:
(in millions of Korean won)
Financial liabilities
Financial liabilities at
amortized cost
Cash flow hedging
finacial liabilities Total
Trade payables 359,625 - 359,625
Short-term borrowings 29,051 - 29,051
Other payables 152,147 - 152,147
Accrued expenses 19,326 - 19,326
Other current liabilities 9 - 9
Derivative financial liabilities - 3,345 3,345
Long-term non-trade payables 159 - 159
Long-term borrowings 45,866 - 45,866
Debentures 472,178 - 472,178
1,078,361 3,345 1,081,706
2012

Hyundai Powertech Co., Ltd.Notes to Financial StatementsDecember 31, 2012 and 2011
27
(in milli ons of Korean won)
Financial liabilities
Financial liabilities
at amortized cost
Cash flow hedging
finac ial liabilities Total
Trade payables 324 ,113 - 324,113
Short-term borrowings 6 ,565 - 6,565
Other payables 193 ,486 - 193,486
Accrue d expe nses 10 ,394 - 10,394
Other current liabilities 9 - 9
Derivative fin ancial liabilities - 1,755 1,755
Long-term borrowings 108 ,445 - 108,445
Debentu res 356 ,715 - 356,715
999 ,727 1,755 1,001,482
2011
Income and loss of financial instruments by category for the years ended December 31, 2012 and2011, are as follows:
(in millions of Korean won)
Interest
income
Interest
expense
Other revenue
and gains
Other
comprehensive
income
Loans and receivables 3,908 - (7,031) -
Financial assets at fair value through proift or loss - - 12,157 -
Derivatives assets held for hedging - - (6,286) 318
Financial liabilities at amortized cost - (15,249) 8,191 -
Derivatives liabilities held for hedging - - (2,572) 983
3,908 (15,249) 4,459 1,301
2012
(in millions of Korean won)
Interest
income
Interest
expense
Other revenue
and gains
Other
comprehensive
income
Loans and receivables 3,485 - (4,002) -
Financial assets at fair value through proift or loss - - (2,048) -
Derivatives assets held for hedging - - (3,788) 1,668
Financial liabilities at amortized cost - (13,979) 5,399 -
Derivatives liabilities held for hedging - - 1,763 (2,114)
3,485 (13,979) (2,676) (446)
2011
6. Transfers of Financial Assets
Trade receivables have been discounted through factoring agreements with banks. In case theCompany has an obligation to pay the related amount to the bank due to customers’ default, thistransaction, treated as a transaction with recourse, has been accounted for as a collateralizedborrowing (Note13).
Transferred financial assets that are not derecognized in their entirety and related liabilities as ofDecember 31, 2012 and 2011, are as follows:
(in millions of Korean won) Loans and receivables
Carrying amount of the transferred assets 4,344
Carrying amount of the associated liabil ities1 4,336
1Net amount after deducting prepaid interest

Hyundai Powertech Co., Ltd.Notes to Financial StatementsDecember 31, 2012 and 2011
28
7. Restricted Financial Instruments
Restricted financial instruments As of December 31, 2012, and 2011, are as follows:
(in thousands of Korean won) 2012 2011 Remarks
Other non-current notes Maintaing deposit for
receivables 11,500 11,500 checking accounts
8. Inventories
Details of inventories as of December 31, 2012 and 2011, are as follows:
(in thousands of Korean won) 2012 2011
Goods 51,018,561 46,634,188
Part finished product 26,163,298 30,121,669
Merchandise 7,095,658 4,515,486
Work-in process 1,687,895 4,648,624
Raw materials 26,410,689 28,433,553
Supplies 30,428,292 26,964,960
Meterials in transit 14,183,861 7,863,481
156,988,254 149,181,961
The cost of inventories recognized as expense and included in ‘cost of sales’ amounted to₩2,429,002 million (2011: ₩2,297,915 million).
9. Associates
Investment in associates as of December 31, 2012 and 2011, is as follows:
(in thousand of Korean won)
Associates Country
Percentage of
ownership (%)
Acquisition
Cost
Net Asset
Value Book Value
Acquisition
Cost
Net Asset
Value Book Value
Pow ertech America, Inc. USA 40.0 35,736,719 32,711,687 27,169,150 35,736,719 31,948,732 25,779,810
Hyundai Pow ertech
(Shandong) Co., Ltd. China 35.0 40,780,289 42,372,143 40,299,283 25,123,840 28,193,038 28,104,982
Mutual cooperation new
technology fund 1 Korea - - - - 2,000,000 2,077,717 2,077,717
76,517,008 75,083,830 67,468,433 62,860,559 62,219,487 55,962,509
20112012
1The Company recognized gain on disposal amounting to \17,827 thousand resulting from thecompletion of dissolution of the associate during the year ended December 31, 2012.

Hyundai Powertech Co., Ltd.Notes to Financial StatementsDecember 31, 2012 and 2011
29
Changes in investments in associates for the years ended December 31, 2012 and 2011, are asfollows:
(in thousands of Korean won)
Powertech Hyundai Powertech Mutual coorperation
America INC. (Shandong) Co., Ltd. new technology fund Total
Beginning balance 25,779,810 28,104,982 2,077,717 55,962,509
Acquisition - 15,656,449 - 15,656,449
Disposal - - (2,077,717) (2,077,717)
Gain(loss) on equity method 3,824,763 (1,473,382) - 2,351,381
Other comprehensive income ¹ (2,435,423) (1,988,766) - (4,424,189)
Ending balance 27,169,150 40,299,283 - 67,468,433
2012
(in thousands of Korean won)
Powertech Hyundai Powertech Mutual coorperation
America INC. (Shandong) Co., Ltd. new technology fund Total
Beginning balance 28,478,988 12,838,140 2,014,587 43,331,715
Acquisition - 12,608,960 - 12,608,960
Gain(loss) on equity method (3,111,998) 996,265 63,130 (2,052,603)
Other comprehensive income ¹ 412,820 1,661,617 - 2,074,437
Ending balance 25,779,810 28,104,982 2,077,717 55,962,509
2011
1Before the tax effect of ₩496,219 thousand (2011: ₩425,103 thousand).
The key financial information of the Company’s associates as of December 31, 2012 and 2011, is asfollows:
(in thousands of Korean won)
Assets Liabilities Equity Sales Net income
Poertech America, INC. 397,994,805 자산316,215,587 자본81,779,218 974,955,107 7,995,948
Hyundai Powertech
(Shandong) Co., Ltd. 511,392,715 390,329,449 121,063,266 474,357,806 1,461,203
2012
(in thousands of Korean won)
Assets Liabilities Equity Sales Net income
Poertech America, INC. 319,089,704 239,217,874 79,871,830 737,548,037 1,251,654
Hyundai Powertech
(Shandong) Co., Ltd. 186,944,335 106,392,797 80,551,538 80,800 3,098,062
Mutual coorperation new
technology fund 56,098,353 - 56,098,353 2,255,385 1,704,511
2011

Hyundai Powertech Co., Ltd.Notes to Financial StatementsDecember 31, 2012 and 2011
30
10. Property, Plant and Equipment
Changes in property, plant and equipment for the years ended December 31, 2012 and 2011, are asfollows:
(in thousands ofKorean won)
Buildings and Tools and Construction-
Land Structures Machinery Equipments Molds Others in-progress Total
Beginning balance 4,194,511 242,801,444 503,368,543 10,562,552 39,092,307 9,352,177 254,207,724 1,063,579,258
Acquisit ion 2,873,797 486,792 - 255,238 80,000 1,317,516 120,635,232 125,648,575
Capitalizat ion of
borrowing cos t - - - - - - 8,766,582 8,766,582
Disposal - - (5,174,931) (619,846) (6) (1,811) - (5,796,594)
Transfer - 58,122,203 115,506,524 10,683,594 10,212,385 3,793,296 (198,563,292) (245,290)
Depreciat ion - (8,555,206) (99,021,820) (4,065,517) (12,160,408) (3,178,691) - (126,981,642)
Impairment loss - - (494,415) - (5,505,222) - - (5,999,637)
Ending balance 7,068,308 292,855,233 514,183,901 16,816,021 31,719,056 11,282,487 185,046,246 1,058,971,252
Acquisit ion c ost 7,068,308 348,975,665 1,070,187,712 37,573,876 80,564,113 25,143,576 185,046,246 1,754,559,496
Accumulated
depreciation - (56,120,432) (553,980,115) (20,757,855) (40,706,165) (13,783,318) - (685,347,885)
Accumulated
impairment loss - - (1,790,348) - (8,138,892) - - (9,929,240)
Government grants - - (233,348) - - (77,771) - (311,119)
2012
(in thousands ofKorean won)
Buildings and Tools and Construction-
Land Structures Machinery Equipments Molds Others in-progress Total
Beginning balance 3,499,889 229,463,734 490,300,750 7,235,584 29,445,996 5,316,975 171,858,513 937,121,441
Acquisit ion 694,622 4,426,665 - 406,900 1,199,600 3,884,270 231,717,096 242,329,153
Capitalizat ion of
borrowing cos t - - - - - - 8,858,100 8,858,100
Disposal - - (586,037) (29,344) (2,920,194) (38,235) - (3,573,810)
Transfer - 16,476,627 107,289,057 6,267,864 25,337,897 2,748,655 (158,225,985) (105,885)
Depreciat ion - (7,565,582) (92,339,294) (3,318,452) (11,337,322) (2,559,488) - (117,120,138)
Impairment loss - - (1,295,933) - (2,633,670) - - (3,929,603)
Ending balance 4,194,511 242,801,444 503,368,543 10,562,552 39,092,307 9,352,177 254,207,724 1,063,579,258
Acquisit ion c ost 4,194,511 290,366,669 962,539,143 27,675,444 72,037,514 20,842,939 254,207,724 1,631,863,944
Accumulated
depreciat ion - (47,565,225) (457,874,667) (17,112,892) (30,311,537) (11,391,814) - (564,256,135)
Accumulated
impairment loss - - (1,295,933) - (2,633,670) - - (3,929,603)
Government grants - - - - - (98,948) - (98,948)
2011
Distribution of depreciation cost for the years ended December 31, 2012 and 2011, are as follow:
2012 2011
124,744,542 114,916,074
Development cost 1,273,243 1,127,478
816,929 741,125
Others 146,928 335,461
126,981,642 117,120,138
(in thousands of Korean won)
Cost of goods manufactured
Selling and administrative expenses
Borrowings from Korea Development Bank are secured on land, buildings and machinery for the valueof ₩410,000 million (Note 13).

Hyundai Powertech Co., Ltd.Notes to Financial StatementsDecember 31, 2012 and 2011
31
11. Intangible Assets
Changes in intangible assets for the years ended December 31, 2012 and 2011, are as follows:
(in thousands of Korean won)
Industrial property
rights
Development
costs
Other intengible
asstes Total
Beginning balance 183,923 36,675,300 10,880,511 47,739,734
Acquisition 59,265 20,048,778 2,110,482 22,218,525
Capitalization of borrow ing cost - 1,147,159 - 1,147,159
Amortization (29,412) (5,439,925) (116,909) (5,586,246)
Impairment loss - (10,124,394) - (10,124,394)
Ending balance 213,776 42,306,918 12,874,084 55,394,778
2012
(in thousands of Korean won)
Industrial property
rights
Development
costs
Other intengible
asstes Total
Beginning balance 195,946 27,792,604 10,986,035 38,974,585
Acquisition 13,467 12,196,558 2,055,370 14,265,395
Capitalization of borrow ing cost - 798,315 - 798,315
Amortization (25,490) (4,112,177) (659,780) (4,797,447)
Impairment loss - - (1,501,114) (1,501,114)
Ending balance 183,923 36,675,300 10,880,511 47,739,734
2011
Details of intangible assets as of December 31, 2012 and 2011, are as follows:
(in thousands of Korean won) 2012 2011
Development costs 6 speed automatic transmission for rear wheel 9,232,034 9,494,259
Development costs 8 speed automatic transmission for rear wheel 7,182,440 5,616,083
Development costs Development of transmission for export to A company 7,644,374 -
Other intangible assets Technical coordination contract for automatic transmission - 116,909
24,058,848 15,227,251
Details
Distribution of amortization cost for the years ended December 31, 2012 and 2011, is as follow:
(in thousands of Korean won) 2012 2011
Selling and administrative expenses 1,405,378 1,298,328
Cost of goods manufactured 4,177,847 3,487,742
Development cost 3,021 11,377
5,586,246 4,797,447

Hyundai Powertech Co., Ltd.Notes to Financial StatementsDecember 31, 2012 and 2011
32
12. Capitalized Borrowing Cost
An acquisition cost of property, plant and equipment and development costs includes ₩9,914 million
of capitalized borrowing cost (2011: ₩9,656 million) calculated at an average borrowing interest rateof 4.67%.
13. Borrowings
Details of short-term borrowings as of December 31, 2012 and 2011, are as follows:
(in thousands of Korean won) Annual
Interest
Creditor Remarks rate (%) 2012 2011
Shinhan bank and others Bankers' Usance 0.84~1.88 24,706,751 6,564,995
NH BankFactoring of Trade receivables
in foreign currency - 4,343,882 -
29,050,633 6,564,995
Details of long-term borrowings as of December 31, 2012 and 2011, are as follows:
(in thousands of Korean won) Annual
Interest
Creditor Purpose rate (%) 2012 2011
The Korea Development Bank Facility fund 4.02 45,000,000 107,286,898
The Korea Development Bank Energy utilization 1.75 866,200 1,157,800
Total 45,866,200 108,444,698
Less : Current portion of long-term liabilities (20,340,400) (62,578,498)
25,525,800 45,866,200
Borrowings from Korea Development Bank are secured on land, buildings and machinery for the valueof ₩410,000 million (Note 10).

Hyundai Powertech Co., Ltd.Notes to Financial StatementsDecember 31, 2012 and 2011
33
Details of debentures as of December 31, 2012 and 2011, are as follows:
(in thousands of Korean won) Issurance Maturity Interest
date date rate(%) 2012 2011
20th non-guaranteed public bonds 2009.04.20 2012.04.20 6.95 - 40,000,000
21st non-guaranteed public bonds 2009.04.20 2012.04.20 6.95 - 20,000,000
22nd non-guaranteed public bonds 2009.09.24 2012.09.24 6.15 - 50,000,000
23rd
non-guaranteed public bonds 2010.07.02 2013.07.02 4.78 40,000,000 40,000,000
24th
non-guaranteed public bonds 2011.03.18 2014.03.18 4.59 53,555,000 57,665,000
25th
non-guaranteed public bonds 2011.05.27 2014.05.27 4.25 80,000,000 80,000,000
26th
non-guaranteed public bonds 2011.10.28 2015.10.28 4.55 70,000,000 70,000,000
27th
non-guaranteed public bonds 2012.02.01 2015.02.01 4.00 80,000,000 -
28th non-guaranteed public bonds 2012.10.11 2017.10.11 3.35 150,000,000 -
473,555,000 357,665,000
Less: Current portion Nominal value 40,000,000 110,000,000
Discount (35,111) (90,433)
Book value 39,964,889 109,909,567
Non-current debentures Nominal value 433,555,000 247,665,000
Discount (1,341,419) (859,818)
Book value 432,213,581 246,805,182
14. Defined Benefit Liability
Defined benefit liability recognized on the statements of finance position as of December 31, 2012 and2011, is as follows:
(in thousands of Korean won) 2012 2011
Present value of funded defined benefit obligations 35,279,686 23,810,451
Fair value of plan assets (27,934,203) (21,182,044)
7,345,483 2,628,407
Changes in the carrying amount of defined benefit liability for the years ended December 31, 2012 and2011, are as follows:
(in thousands of Korean won) 2012 2011
Beginning balance 23,810,451 15,717,991
Current service cost 7,494,527 5,903,987
Interest expense 1,138,545 882,532
Actualrial gain 4,665,798 2,770,941
Benefits paid (1,829,635) (1,465,000)
Ending balance 35,279,686 23,810,451

Hyundai Powertech Co., Ltd.Notes to Financial StatementsDecember 31, 2012 and 2011
34
The movements in the fair value of plan assets for the years ended December 31, 2012 and 2011, areas follows:
(in thousands of Korean won) 2012 2011
Beginning balance 21,182,044 14,700,894
Employer contribution 7,500,000 6,700,000
Expected return on plan assets¹ 877,824 877,824
Actualrial gain (loss) 11,922 (219,189)
Benefits paid (1,637,587) (877,485)
Ending balance 27,934,203 21,182,044
1The actual return on plan assets for the year ended December 31, 2012, was ₩888,746 thousand
(2011: ₩658,635 thousand).
The amounts recognized on the statements of comprehensive income for the years ended December31, 2012 and 2011, are as follows:
(in thousands of Korean won) 2012 2011
Current service cost 7,494,527 5,903,987
Interest expense 1,138,545 882,532
Expected return on plan assets (877,824) (877,824)
Wages and salaries 7,755,248 5,908,695
Actuarial loss 1 (4,653,876) (3,673,790)
1The amounts of accumulated actuarial loss is before income tax effect, which amounts to₩1,126,238 thousand (2011: ₩904,934 thousand). And accumulated actuarial loss recognized
through other comprehensive loss before income tax amounted to ₩6,859,410 thousand for the year
ended December 31, 2012 (2011: ₩3,331,772 thousand).
The amounts recognized in retirement benefit for the years ended December 31, 2012 and 2011, areas follows:
(in thousands of Korean won) 2012 2011
Manufacturing costs 6,258,553 4,727,633
Selling and administrative expenses 895,166 818,631
Others 601,529 362,431
7,755,248 5,908,695
The principal actuarial assumptions as of December 31, 2012 and 2011, were as follows:
(in thousands of Korean won) 2012 2011
Discount rate 4.04 4.90
Expected return on plan assets 4.19 4.73
Future salary increases 5.00 5.00
The sensitivity of the overall pension liability to changes in the weighted principal assumptions is:
Changes in principal assumption Impact on overall liability
Discount rate 0.5% increases(decreases) 7.9%decreases/8.8%increases
Salary growth rate 0.5% increases(decreases) 8.9% increases/8.0%decreases

Hyundai Powertech Co., Ltd.Notes to Financial StatementsDecember 31, 2012 and 2011
35
Plan assets as of December 31, 2012 and 2011, consist of the following:
(in thousands of Korean won) 2012 2011
Installment deposits 27,934,203 21,182,044
Adjustments for the differences between initial assumptions and actual figures as of December 31,2012 and 2011, are as follows:
(in thousands of Korean won) 2012 2011
Present value of defined benefit obligations 35,279,686 23,810,451
Fair value of plan assets (27,934,203) (21,182,044)
Deficit of the funded plans 7,345,483 2,628,407
Defined benefit obligations adjustments 56,933 847,906
15. Provisions for Liabilities and Charges
Details and changes of provisions for liabilities and charges as of December 31, 2012 and 2011, areas follows:
(in thousands of Korean won)
Provisions for
sales warranty Others Total
Beginning balance 37,485,007 14,403,371 51,888,378
Addition 32,089,277 3,402,588 35,491,865
Used during year (23,444,949) (3,440,775) (26,885,724)
Reversal - (709,822) (709,822)
Others - (24,710) (24,710)
Ending balance 46,129,335 13,630,652 59,759,987
Less: current (17,687,039) (3,544,883) (21,231,922)
Non-current 28,442,296 10,085,769 38,528,065
2012
(in thousands of Korean won)
Provisions for
sales warranty Others Total
Beginning balance 36,957,935 3,894,795 40,852,730
Addition 20,023,378 10,912,235 30,935,613
Used during year (19,496,306) (268,866) (19,765,172)
Reversal - (135,751) (135,751)
Others - 958 958
Ending balance 37,485,007 14,403,371 51,888,378
Less: current (12,360,626) (3,377,166) (15,737,792)
Non-current 25,124,381 11,026,205 36,150,586
2011

Hyundai Powertech Co., Ltd.Notes to Financial StatementsDecember 31, 2012 and 2011
36
16. Deferred Income Tax
The analysis of deferred tax assets and deferred tax liabilities as of December 31, 2012 and 2011, isas follows:
(In millions of Korean won) 2012 2011
Deferred tax assets
Deferred tax asset to be recovered after more than 12 months 16,753,184 16,246,086
Deferred tax asset to be recovered wi thin 12 months 12,825,956 8,119,680
29,579,140 24,365,766
Deferred tax liabilities
Deferred tax liability to be recovered after more than 12 months (6,246,336) (10,685,757)
Deferred tax liability to be recovered within 12 months (1,013,173) (2,393,654)
(7,259,509) (13,079,411)
Deferred tax assets (liabili ties), net 22,319,631 11,286,355
The gross movement on the deferred income tax account for the years ended December 31, 2012and 2011, is as follows:
(In millions of Korean won) 2012 2011
Beginning balance 11,286,355 7,537,987
Deferred tax charge to the income statement 9,725,562 3,144,897
Tax charge / (credit) relating to components of other
comprehensive income 1,307,714 603,471
Ending balance 22,319,631 11,286,355
Income tax expense for the years ended December 31, 2012 and 2011, consists of:
(in thousands of Korean won) 2012 2011
Current tax on profits for the year 33,657,025 17,472,977
Origination and reversal of temporary differences (9,725,562) (3,875,701)
Impact of change in Korean tax rate - 730,804
Income tax expense 23,931,463 14,328,080

Hyundai Powertech Co., Ltd.Notes to Financial StatementsDecember 31, 2012 and 2011
37
The movements in deferred income tax assets and liabilities as of December 31, 2012 and 2011, areas follows:
(in thousands of Korean won)
Beginning Statement Ending
balance of income Equity balance
Defined benefit liability 4,321,597 1,532,686 1,126,238 6,980,521
Plan assets of defined
benefit liability (4,321,597) (1,907,055) - (6,228,652)
Provision for sales warranty 9,071,372 2,091,927 - 11,163,299
Property, plant, and equipment (3,917,980) 5,475,583 - 1,557,603
Intangible assets (33,724) 3,934,423 - 3,900,699
Derivatives 612,957 (28,512) (314,743) 269,702
Investment in associates 1,809,145 (1,496,920) 496,219 808,444
Other Provisions 3,485,616 (186,998) - 3,298,618
Accrued expenses 377,005 84,828 - 461,833
Others (118,036) 225,600 - 107,564
11,286,355 9,725,562 1,307,714 22,319,631
2012
(in thousands of Korean won)
Beginning Statement Ending
balance of income Equity balance
Defined benefit liability 2,417,932 998,731 904,934 4,321,597
Plan assets of defined
benefit liability (2,417,932) (1,903,665) - (4,321,597)
Provision for sales warranty 8,313,401 757,971 - 9,071,372
Property, plant, and equipment (3,167,516) (750,464) - (3,917,980)
Intangible assets 9,665 (43,389) - (33,724)
Derivatives 428,317 61,000 123,640 612,957
Investment in associates 544,289 1,689,959 (425,103) 1,809,145
Other Provisions 996,547 2,489,069 - 3,485,616
Accrued expenses 317,530 59,475 - 377,005
Others 95,754 (213,790) - (118,036)
7,537,987 3,144,897 603,471 11,286,355
2011

Hyundai Powertech Co., Ltd.Notes to Financial StatementsDecember 31, 2012 and 2011
38
Profit before tax differs from theoretical amount that would arise using the statutory tax rate applicableto profits for the years ended December 31, 2012 and 2011, as follow:
(in thousands of Korean won) 2012 2011
Income before income tax 141,747,847 112,885,105
Tax calculated at domestic tax rates applicable to profits 32,809,184 24,810,723
Tax effects of:
Expenses not deductible for tax purposes 207,243 2,853,124
Impact of tax credit (10,352,191) (11,838,446)
Others 1,267,227 (1,497,321)
Tax charge 23,931,463 14,328,080
The income tax (charged)/credited directly to equity as of December 31, 2012 and 2011, is as follows:
(in thousands of Korean won)
Before
income
taxes
Effect of
income tax
After
income
taxes
Before
income
taxes
Effect of
income tax
After
income
taxes
Gain or loss on valuation of deritives (1,050,281) 254,168 (796,113) (2,350,873) 568,911 (1,781,962)
Actuarial gains and losses (9,049,354) 2,189,944 (6,859,410) (4,395,477) 1,063,705 (3,331,772)
Changes in equity method (5,707,901) - (5,707,901) (1,283,712) (496,219) (1,779,931)
2012 2011
Realization of the future tax benefits related to deferred tax assets is dependent on many factors,including the Company’s ability to generate taxable income within the period during which thetemporary differences reverse, the outlook of the Korean economic environment, and the overallfuture industry outlook. Management periodically considers these factors in reaching its conclusion. Asof December 31, 2012, the Company did not recognize deferred income tax assets relatedinvestments in associates amounting to ₩1,381 million in unrealizable deductible tax benefits and theamount could be modified if the estimation for future taxable income be changed.
17. Derivatives
Details of the changes in valuation gain or loss on derivatives during year ended December 31, 2012and 2011, are as follows:
(in thousands of Korean won)
Book value 2012 2011 2012 2011
Derivatieves assets
Foreign currency swaps - - 422,392 318,004 1,668,174
Foreign currency forward 1,598,555 1,598,555 26,955 - -
Derivatieves liabilities
Foreign currency swaps 3,345,281 (4,110,000) 1,920,598 982,588 (2,114,387)
(2,511,445) 2,369,945 1,300,592 (446,213)
Gain and Losses Other comprehensive income1
1Before tax effect of ₩(-)314,743 thousand(2011: ₩123,641 thousand)

Hyundai Powertech Co., Ltd.Notes to Financial StatementsDecember 31, 2012 and 2011
39
Currency swap -
The company enters into currency swap contracts with banks to manage the exposure to changes incurrency exchange rates and interest rate, and the contract is accounted for as cash flow hedge.Details of currency swap contracts as of December 31, 2012, are as follows:
(in thousands of Korean won, Transaction Maturity Amounts of contracted
in thousands of USD) date date Receive(\) Bid rate exchange rate
Mizuho Corporate Bank, Ltd. 2011-03-04 2014-03-18 55,850,000 USD 50,000 3M LIBOR + 1.20% 4.59% 1,117.00
Ask rateAmounts of
pay
Currency forward -
The Company enters into foreign currency forward contracts with Kookmin Bank to manage theexposure to changes in currency exchange rates, and the contract is accounted for as tradingpurposes. Details of foreign currency exchange contracts As of December 31, 2012, are as follows:
(in thousands of Korean won,
in thousand of USD)
Amounts of Receive Amounts of pay
Forward
exchange rate
Hana bank and 4 other financial
institutions 174,251,680 USD 160,700 1,077.20 ~ 1,110.40
18. Capital stock
Details of capital stock as of December 31, 2012, are as follows:
(in Korean won) Details
Number of authorized shares 150,000,000 shares
Par value per share 5,000
Total number of common stocks issued 91,781,200 shares
Common stock 458,906,000,000
19. Other components of equity
Details of Other components of equity As of December 31, 2012 and 2011, consist of:
(in thousands of Korean won) 2012 2011
Discounts on stocks issuance (2,897) (5,795)
Changes in equity method investments (5,707,901) (1,779,931)
Gain and loss on valuation of derivatives (796,113) (1,781,962)
(6,506,911) (3,567,688)
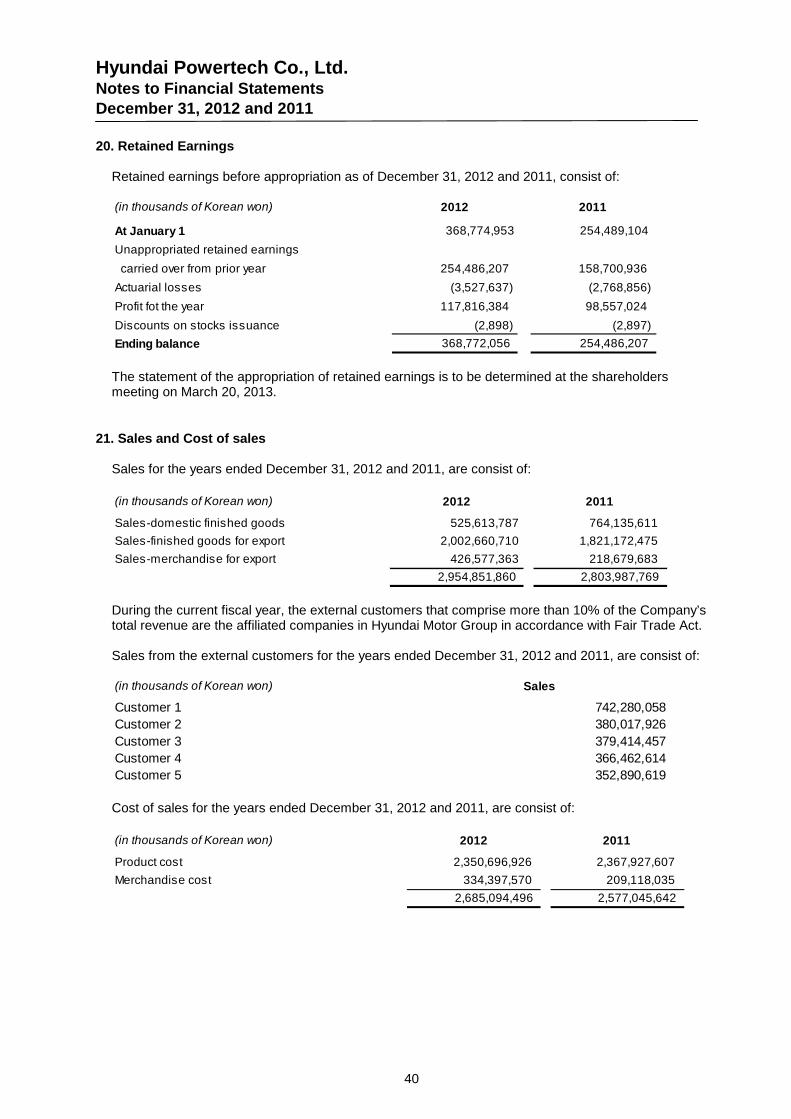
Hyundai Powertech Co., Ltd.Notes to Financial StatementsDecember 31, 2012 and 2011
40
20. Retained Earnings
Retained earnings before appropriation as of December 31, 2012 and 2011, consist of:
(in thousands of Korean won) 2012 2011
At January 1 368,774,953 254,489,104
Unappropriated retained earnings
carried over from prior year 254,486,207 158,700,936
Actuarial losses (3,527,637) (2,768,856)
Profit fot the year 117,816,384 98,557,024
Discounts on stocks issuance (2,898) (2,897)
Ending balance 368,772,056 254,486,207
The statement of the appropriation of retained earnings is to be determined at the shareholdersmeeting on March 20, 2013.
21. Sales and Cost of sales
Sales for the years ended December 31, 2012 and 2011, are consist of:
(in thousands of Korean won) 2012 2011
Sales-domestic finished goods 525,613,787 764,135,611
Sales-finished goods for export 2,002,660,710 1,821,172,475
Sales-merchandise for export 426,577,363 218,679,683
2,954,851,860 2,803,987,769
During the current fiscal year, the external customers that comprise more than 10% of the Company’stotal revenue are the affiliated companies in Hyundai Motor Group in accordance with Fair Trade Act.
Sales from the external customers for the years ended December 31, 2012 and 2011, are consist of:
(in thousands of Korean won) Sales
Customer 1 742,280,058
Customer 2 380,017,926
Customer 3 379,414,457
Customer 4 366,462,614
Customer 5 352,890,619
Cost of sales for the years ended December 31, 2012 and 2011, are consist of:
(in thousands of Korean won) 2012 2011
Product cost 2,350,696,926 2,367,927,607
Merchandise cost 334,397,570 209,118,035
2,685,094,496 2,577,045,642

Hyundai Powertech Co., Ltd.Notes to Financial StatementsDecember 31, 2012 and 2011
41
22. Selling and Administrative Expenses
Selling and administrative expenses for the years ended December 31, 2012 and 2011, are as follows:
(in thousands of Korean won) 2012 2011
Wages and salaries 11,556,135 8,087,630
Severance benefits 895,166 818,631
Employee benefits 2,103,461 2,229,194
Service fees 1,559,497 837,534
Sales commission 23,791,857 20,198,797
Exports expenses 51,353,071 36,777,310
Warranty expense 32,089,277 20,023,378
Amotization 1,405,378 1,298,328
Depreciation expenses 816,929 741,125
Transprotation expenses 7,107,076 10,624,616
Others 3,315,416 12,486,515
135,993,263 114,123,058
23. Expenses by Nature
Expenses by nature for the years ended December 31, 2012 and 2011, are as follows:
(in thousands of Korean won) 2012 2011
Usage of inventories 2,381,318,125 2,297,914,538
Wages and salaries 117,063,741 95,358,842
Depreciation 126,981,642 117,120,138
Amotization 5,586,246 4,797,447
Exports expenses 51,353,071 36,777,310
Estimated warranty expense 32,089,277 20,023,378
Others 106,695,657 119,177,047
2,821,087,759 2,691,168,700
The above total amount is equal to a sum cost of sales and selling and administrative expenses in thestatements of income.
24. Other Income, Other Expenses
Other income for the years ended December 31, 2012 and 2011, consists of:
(in thousands of Korean won) 2012 2011
Other income
Gains on foreign currency transaction 12,061,782 7,624,615
Miscellaneous revenues 31,955,562 40,460,111
Others 1,313,525 268,319
45,330,869 48,353,045

Hyundai Powertech Co., Ltd.Notes to Financial StatementsDecember 31, 2012 and 2011
42
Other expenses for the years ended December 31, 2012 and 2011, consist of:
(in thousands of Korean won) 2012 2011
Other expenses
Gains on foreign currency transaction 22,546,189 9,785,594
Impairment of Property, plant and equipment 5,999,637 3,929,603
Impairment of Intangible assets 9,769,987 1,501,114
Loss on disposal of trade receivables 1,466,140 3,266,321
Loss on disposal of Property, plant and
equipment1,296,406 3,205,233
Loss on disposal of Intangible assets 172,771 -
Others 3,573,943 16,799,564
44,825,073 38,487,429
25. Finance income and Costs
Finance income and costs for the years ended December 31, 2012 and 2011, are as follows:
(in thousands of Korean won) 2012 2011
Finance income
Gain on foreign currency assets and liabilities 13,916,761 8,502,334
Interest income 3,908,435 3,485,190
Gain on derivatives 18,514,051 2,402,614
36,339,247 14,390,138
(in thousands of Korean won) 2012 2011
Financial expense
Loss on foreign currency assets and liabilities 766,133 1,681,851
Interest expense 15,249,351 13,979,146
Loss on derivatives 15,215,019 6,476,119
31,230,503 22,137,116
26. Earnings per Share
Earnings per share for the years ended December 31, 2012 and 2011, are as follows:
(in Korean won) 2012 2011
Profit attributable to ordinary shares 117,816,384,109 98,557,024,182
Weighted-average number of common stock
outstanding 1
91,778,200 shares 91,778,200 shares
Basic earnings per share 1,284 1,074
As there are no diluted securities outstanding as of December 31, 2012 and 2011, Diluted earningsper share are identical to the basic earnings per share.

Hyundai Powertech Co., Ltd.Notes to Financial StatementsDecember 31, 2012 and 2011
43
27. Cash Generated from Operations
Cash generated from operations for the years ended December 31, 2012 and 2011, is as follow:
(in thousands of Korean won) 2012 2011
Profit for the year 117,816,384 98,557,024
Adjustment for:
Interest income (3,908,435) (3,485,190)
Interest expense 15,249,351 13,979,146
Income tax expense 23,931,463 14,328,080
Depreciation 126,981,642 117,120,138
Amortization 5,586,246 4,797,447
Severance benefits 7,755,248 5,908,695
Estimated warranty expense 32,089,277 20,023,378
Loss in equity method 1,473,382 3,111,998
Loss on disposal of trade receivable 1,466,140 3,266,321
Loss on disposal of property, plant and equipment 1,296,406 3,205,233
Impairment of property, plant and equipment 5,999,637 3,929,603
Impairment of intangible assets 9,769,987 1,501,114
Loss on disposal of intangible assets 172,771 -
Addition to other provisions 3,402,588 10,912,235
Gain on disposal of property, plant and equipment (603,702) (132,568)
Gain on disposal of investment in associates (17,827) -
Gain on equity method (3,824,763) (1,059,395)
Reversal of provisions (709,822) (135,751)
Gain(loss) on valuation of derivatives 2,511,445 (2,369,945)
Gain (loss) on foreign currency translation (6,141,763) 1,464,624
Others 181,637 (683,982)
222,660,908 195,681,181
Changes in working capital
Trade receivables (200,379,055) 83,644,033
Other receivables (235,972) (5,602,250)
Inventories (7,857,561) (35,077,519)
Trade payables 35,511,932 93,353,023
Other payables (64,372,737) 20,247,155
Advances received 2,297,377 3,355,983
Accrued expenses 8,638,402 245,766
Provisions (26,885,724) (19,765,172)
Severance benefits paid (192,048) (587,515)
Plan assets (7,500,000) (6,700,000)
Other assets and liabilities 7,881,966 8,970,792
(253,093,420) 142,084,296
Cash generated from operation 87,383,872 436,322,501

Hyundai Powertech Co., Ltd.Notes to Financial StatementsDecember 31, 2012 and 2011
44
Significant transactions not affecting cash flows are as follows:
(in thousands of Korean won) 2012 2011
Reclassification to current portion from debentures 40,000,000 110,000,000
Reclassification to current portion from long-term borrowings 20,340,400 62,050,507
Reclassification to property, plant and equipments from
construction-in-progress 198,563,292 158,225,985
28. Related Party Transactions
Details of the subsidiaries as of December 31, 2012 and 2011, are as follows:
Companies
Investors exercise significant influence Hyundai Motor Co., Ltd. and subsidiaries
Kia Motor Co., Ltd. and subsidiaries
Hyundai Mobis Co., Ltd. and subsidiaries
Equity method investees Powertech America, Inc.(PTA)
Powertech America Sales, LLC. ¹
Hyundai Powertech(Shandong) Co., Ltd.
Other affiliated companies Other affiliated companies in Hyundai Motor Group with Fair Trade Act
1Subsidiary of Powertech America Inc. (PTA).
Significant transactions with related parties for the years ended December 31, 2012 and 2011, are asfollows:
(in thousands of Korean won)
Sales and Purchase and Sales and Purchase and
others others others others
Investors exercise
significant influence 1,006,321,291 123,872,059 1,589,095,542 115,862,058
Equity method investees 1,234,774,838 2,454,880 589,876,134 3,051,398
Other affiliated companies 686,066,371 264,793,035 613,952,424 284,080,794
2,927,162,500 391,119,974 2,792,924,100 402,994,250
2012 2011
Significant receivables and payables with related parties as of December 31, 2012 and 2011, are asfollows:
(in thousands of Korean won)
Receivables Payables Receivables Payables
Investors exercise
significant influence 165,540,591 48,796,720 183,026,327 66,302,043
Equity method investees 225,919,201 17,356,787 16,414,883 357,213
Other affiliated companies 110,418,027 92,761,928 121,117,290 94,582,900
501,877,819 158,915,435 320,558,500 161,242,156
2012 2011
Other related parties acquired ₩30 billion of debentures issued by the Company for the years endedDecember 31, 2012.

Hyundai Powertech Co., Ltd.Notes to Financial StatementsDecember 31, 2012 and 2011
45
The compensation paid or payable to key management for the years ended December 31, 2012 and2011, are as follows:
(in Korean won) 2012 2011
Wages and salaries 5,114,091 3,321,393
Severance benefits 683,348 686,393
5,797,439 4,007,786
29. Commitments and Contingencies
As of December 31, 2012, the Company has provided the payment guarantee for the borrowings(USD 435,000 thousand and CNY 500,000 thousand) of its associated corporate, Powertech America,Inc. and another company, of the principal and interest (guaranteed amount: USD 189,410 thousandand CNY 60,000 thousand) added.
Details of Commitments and Contingencies as of December 31, 2012 and 2011, are as follows:
(in thousands of Korean
won, in USD) Creditor
Factoring loans¹ Kookmin bank and 3 others 290,000,000 -
D/A¹ Shinhan bank and 12 others USD 520,000,000 USD 119,411,038
L/C(Usance, Sight) Shinhan bank and 11 others USD 200,000,000 USD 59,194,527
Borrowings Hana bank and another bank 30,000,000 -
Bank overedrafts Shinhan bank and 3 others 30,000,000 -
Electronic bill Shinhan bank and 5 others 173,000,000 -
Commercial paper Shinhan bank and 1 others 40,000,000 -
Maximum amount Used amount
1Including the amount ₩270,000 million and USD 200,000 thousands without the right of recourse
Other than the above agreements, the company has been provided with performance guaranteeamounting to\272 million from Seoul Guarantee Insurance.
The Company signed a technological collaboration contract with JATCO in regards to the automatictransmission on February 28, 2002. In accordance with the collaboration contract, the initial royaltyamount paid was recognized as other intangible assets and fully amortized as of December 31, 2012.In addition, the running royalty which is payable when the number of sales of the related products areless than one million (to be paid equally in three years from 2012), was recognized as other provisionsamounting to ₩5,614 million as of December 31, 2012.

46
Report of Independent Accountants'
Review of Internal Accounting Control System
To the President of
HYUNDAI POWERTECH CO., LTD.
We have reviewed the accompanying management’s report on the operations of the Internal
Accounting Control System (“IACS”) of HYUNDAI POWERTECH CO., LTD. (the “Company”) as of
December 31, 2012. The Company’s management is responsible for designing and operating IACS
and for its assessment of the effectiveness of IACS. Our responsibility is to review the management’s
report on the operations of the IACS and issue a report based on our review. The management’s
report, which is attached in the Korean Audit Report but not in this English Audit Report, on the
operations of the IACS of the Company states that “based on its assessment of the operations of the
IACS as of December 31, 2012, no material weaknesses are identified as of December 31, 2012, in
all material respects, in accordance with the IACS standards established by the Internal Accounting
Control System Operations Committee (IACSOC) of the Korea Listed Companies Association.”
Our review was conducted in accordance with the IACS review standards established by the
Korean Institute of Certified Public Accountants. Those standards require that we plan and
perform, in all material respects, the review of management’s report on the operations of the
IACS to obtain a lower level of assurance than an audit. A review is to obtain an
understanding of a company’s IACS and consists principally of inquiries of management and,
when deemed necessary, a limited inspection of underlying documents, which is
substantially less in scope than an audit. However, in accordance with Chapter 5, Application
for small- and medium-sized companies of the IACS standards, the design, operation and
assessment of its IACS are limited compared with those of public large-sized companies as
the Company is a non-public large- sized company. As such, we performed our review in
accordance with Chapter 14, Review standards for small- and medium-sized companies.

47
A company’s IACS is a system to monitor and operate those policies and procedures
designed to provide reasonable assurance regarding the reliability of financial reporting and
the preparation of financial statements for external purposes in accordance with Korean-
IFRS.
Because of its inherent limitations, IACS may not prevent or detect a material misstatement
of the financial statements. Also, projections of any evaluation of effectiveness to future
periods are subject to the risk that controls may become inadequate because of changes in
conditions, or that the degree of compliance with the policies or procedures may deteriorate.
Based on our review, nothing has come to our attention that causes us to believe that
management’s report on the operations of the IACS, referred to above, is not presented fairly,
in all material respects, in accordance with Chapter 5, Application for small- and medium-
sized companies’, of the IACS standards established by IACSOC. Our review is based on
the Company’s IACS as of December 31, 2012, and we did not review management’s
assessment of its IACS subsequent to December 31, 2012. This report has been prepared
pursuant to the Acts on External Audit for Stock Companies in Korea and may not be
appropriate for other purposes or for other users.
Samil PricewaterhouseCoopers
March 13, 2013