Embed Size (px)
Citation preview
I 662,11. ¡ 7iJ:P ...... ·(~00J1f C' 2. I f~" ~ I ---------~--------.--~---- : Q,:'"'
I
I . COU((tON IlIS10~KA
I I I I I I I I I I I I ; I I I I
I I I I I I I I I I I I I I I I I I I
Teléfono: (57-2)445-0000 Fax: (57-2)445-0273
Correo electr6nlco (E-mol/): CIAT@CGNET,COM Dirección : AA. 671 , Colombia
rl-~----"
t r;.;:¿ r?n¡ir? "I':.~U ..... 1, L./''.;'Jf \...::Jul.JU .
ii;;;;,!'
1 bf»2.11 e.t.1 I WUHIOI¡ ¡¡¡,lOtO i L.. .. -- • RJpO'"t of a 4 l\1onths practical experience
Quiricn van Oirschot
71 02 21 617 040
011
r<,'-·'~' l.
1 ,'o ,- :'- ''\.
~.~. ,F.f'-' ·~;'k·
The effect of pruning of cassava on root. deterioration and starch quality
\.'
, ~PCrYisi(Jn: CcranlllO'Bricn (CIAT)
n"lIIiniquc ])lIfour (CIAT/CIRAD) Jozcl" Linsscn (LantlbouwlIuiycrsiteit Wageningen)
I 1
Vaklroep Levensmlddelentechnologle Sectie levensmiddelentechnologie en -microbiologie
I ¡
Lan dbouwu n ive rs iteit Wageningen

I I I I I I I I I I I I I I I I I I I
ACKNOWLEDGEMENT
In this report 1 present the results of my 4 months practical ex-perience. The research has been done
at the Centro lnternacional de Agricultura Tropical (CIAT), Cali, Colombia.
lt was great to have the chance to do sorne research at an lnstitute as CIAT. First, because it gave me
the chance to have a look in the 'WorId of Science' and the 'Science of the World', which was very
learnsome.
Secondly, because of the tropical warmth 1 found, in the cIimate but also in the people.
l' d like to thank sorne of the people, who made my 'Colombian experience' to an unforgettable time.
In the first place Gerry ü'Brien , for their critical advise, the talks and the beers, and their helpfulness,
and being a great supervisor.
and Dominique Dufour, for giving the green light to me to come here, for the talks and the wine, and
creating always a níce atmosphere.
Further,
Stella: for bringing my mail every monday
Priscille: for my introduction into Cali
Enna: for the help with the starch and amylose analyses
Luzmilla: for the sugar analysis and the real 'arroz con pollo'
üswaldo: for all the other desayunos caIled 'arroz con pollo'
William: for aIlways singing a suitable song
Valencia and Lopez: for harvesting even in the weekend
Jairo (Chuky): for aIlways calling me Chuky
Jhon Jairo and Chucho: for the evaluations in the 22.00 bus
Medardo: for getting rid of sorne of my cigarettes
Freddy: for all the jokes 1 did not understand
Teresa: for everything else
EspeciaIly 1 want to thank Karl M. Müller-Siimann, for the conversations about possible uses of pruning,
Mabrouk A. EI-Sharkawy for the inspiring talks about plant-physiology, and Martin Moreno for the
informatíon on starch processing plants.
Very special thanks to Colin McLachlan, for everything incIuding a lot of edit work.
INDEX
ACKNOWLEDGEMENT
INDEX
ABSTRACT ....................................................... 5
1 INTRODUCTION ................................................. " 6
2 MA TERIALS AND METHODS ......................................... 8
2.1 Plan! selection ................................................ 8
2.2 Pruning and harvesting .......................................... 8
2.3 Processing of the cassava roots into samples . . . . . . . . . . . . . . . . . . . . . . . . . .. 8
2.3.1 Starch extraction ........................................ 10
2.3.2 Freeze-dried milled cassava flour ............................ 10
2.3.3 Cassava extrac!s ........................................ 10
2.4 Determination of dry matter content (%DM) ..... . . . . . . . . . . . . . . . . . . . .. 10
2.5 Oetermination of the cassava cyanogen conten! .. . . . . . . . . . . . . . . . . . . . . .. 11
2.5.1 Total cyanogen analysis .. . . . . . . . . . . . . . . . . . . . . . . . . . . . . . . . .. 11
2.5.2 Non-glycosidic cyanogen analysis . . . . . . . . . . . . . . . . . . . . . . . . . . .. 11
2.6 Total and reducing sugar contents (TS and RS) . . . . . . . . . . . . . . . . . . . . . . .. 11
2.6.1 Extraction of the sugars ................................... 11
2.6.2 Determination of tbe total sugar content ....................... 11
2.6.3 Determination of the reducing sugar content .................... 12
2.7 Enzymatic determination of starch content ........................... 12
2.7.1 First hydrolysation . . . . . . . . . . . . . . . . . . . . . . . . . . . . . . . . . . . . . .. 12
2.7.2 Second hydrolysation . . . . . . . . . . . . . . . . . . . . . . . . . . . . . . . . . . . .. 12
2.8 Determination of amy10se content ................................. 13
2.9 Oetermination of starch rheological properties . . . . . . . . . . . . . . . . . . . . . . . .. 13
2.10 Oetermination of post-harvest physiological deterioration (PPO) ............ 14
I I I I I I I I I I I I I I I I I I I
I I I I I I I I I I I I I I I I I I I
3 RESULTS AND DISCUSSION " ............................... " 15
3.1 Preliminary experiment, selection of plants ................... . . . . . . .. 15
3.2 Agronomic characteristics ....................................... 16
3.2.1 Plant weight and number of roots . . . . . . . . . . . . . . . . . . . . . . . . . . . . . . . . .. 16
3.2.2 New shoots and leaves . . . . . . . . . . . . . . . . . . . . . . . . . . . . . . . . . . .. 17
3.2.3 DM-content ........................................... 17
3.3 Cyanogens. . . . . . . . . . . . . . . . . . . . . . . . . . . . . . . . . . . . . . . . . . . . . . . . .. 18
3.3.1 Total cyanogen content ................................... 18
3.3.2 Non glycosidic cyanogen content ............................ 18
3.4 Effect of pruning on carbohydrate content . . . . . . . . . . . . . . . . . . . . . . . . . . .. 19
3.4.1 Starch content ......................................... 19
3.4.2 Total sugars (TS) ..... -. . . . . . . . . . . . . . . . . . . . . . . . . . . . . . . . . .. 21
3.4.3 Reducing sugars (RS) .................................... 21
3.5 Starch properties . . . . . . . . . . . . . . . . . . . . . . . . . . . . . . . . . . . . . . . . . . . . .. 23
3.5.1 Amylose.............................................. 23
3.5.2 Pasting properties ....................................... 25
3.5.3 Rheological properties in relation to pruning .................... 26
3.5.4 Role of physicochemical properties in organoleptic changes ......... 27
3.6 Influence of pruning on PPD. .................................... 28
3.7 Influences of clone characteristics upon PPD-susceptibility . . . . . . . . . . . . . . .. 29
3.7.1 PPO and OM content . . . . . . . . . . . . . . . . . . . . . . . . . . . . . . . . . . . .. 30
3.7.2 PPO and cyanogen content . . . . . . . . . . . . . . . . . . . . . . . . . . . . . . . .. 30
3.7.3 PPO and carbohydrates ................................... 31
CONCLUSION .................................................... 33
SUGGESTIONS FOR FURTHER RESEARCH ............................. 35
REFERENCES .................................................... 36
APPENDIX
I I I I I I I I I I I I I I I I I I I
ABSTRACT
Plants of six cassava clones \\ere harveslecl (i) withollt pruning, and (ii) 2,4,6,8, ID, 15,20,25,28,
and 39 days afier pruning, anel the elfeets of pruning on sorne root quality aspects were investigated,
No significant effects were noted \\'ilh reg,ml lo mean root weight or mean number of roots per plant,
or root parenchymal cyanogen contenL Rools of all six clones, harvested at the indicated post-pruning
intervals, were stored for 5 days, and suseeplibility to post-harvest physiological deterioration (PPD)
was delermined, At la days after pruning, substanti"l reductions in PPD-susceptibility were noted in
all six clones (48-87% recllletian). allel minimum values were reachecl (\ess than 20% PPD) between day
25 and day 39.
Whilst a slight overall decren,e in elr)' maller eo"tent (DM) was observed in most of the clones during
!he post-pruning period, the dO\VllIvard tem!eney -was not constant, and the results obtained suggest that
careful timing of the harvest arter pruning can minimise, or even nullify, lhis effect in those clones.
An almost linear decrease in slareh eonknt (dry malter basis) was observed afier pruning, wilh
minimum values on days 20-25. \\'hil5t lhe stareh content decreased, the total sugar content increased
during !he post-pruning period, rcaching a Ill;JXil1111m at day 20. Despite reductions in starch content,
there was no clear relationship foune! bet"ecn lhe rheological properties ofthe starch itself and pruning.
This finding would appear to ravour Ihe use oC prc-harvest pruning as a PPD-inhibiting tool for cassava
roots destined for starch productil'n.
1t was noted that rools with h igh slIgar content und low starch content had a relatively low PPD
susceptibility, perhaps indieatillg sUlIle I-c/ationship between the starch/sugar ratio and PPD
susceptibility.
5
1 INTRODUCTION
Cassava is a major food source in South America, Africa and Asia. It is the principal carbohydrate
souree for 500 million people. (Cock, 1985). The world production in 1994 was about 152 million tons
of roots (F AO, 1995). Cassava is traditionally cultivated by smalI farmers. Over 40% produced is
destined for human consumption and more than half of this is eaten in a processed form, principally
fIour. A third of the production is used at the farm level as animal feed. Around 10% is employed in
industrial uses, principally in the form of extracted cassaYa starch (Best et al. 1990).
The cultivation of cassava is relatively easy. It is drought-tolerant, can recover from most pests and
diseases, can be cultivated on poor soils and hárvested within a wide range of harvest time. (Grnce
1977,Onweare 1978)
The uses of cassava continue to increase (Asaoka et al. 1992). There is growing ¡nterest in applications
of cassava starch in different kirtds of food and non-food products (Rickard, 1990).
Cassava despite its advantages, has two major constraints. One of these is the presence (in varying
quantities) of toxic cyanogen compounds. In "bitter" varieties (which have high levels of cyanogens),
the cyanogenic content may (in most cases) be reduced to innocuous levels by means of post harvest
processing (O'Brien et al ¡ 992)
The o!her major constraint upon cassava as a commercial crop is its perishability. Post-harvest
physiological deterioration (PPD) is a recognized problem (Wenham, 1995). In urban areas, where
cassava is used for human consumption !he risk of deteriorated cassava dominates !he price (Janssen
and WheatIey 1985). Sorne starch factories don't produce on mondays as the cassava availab1e, which
was probably harvested before the weekend, is ofbad quality. (Moreno, M. personnal communication).
Sorne varieties begin to deteriorate within as little as 1 day, and very few varieties have a shelf-Iife of
more than seven days. The identification of deteriorntion-resistant clones or varieties is greatly hindered
by the faet that edaphoclimatic and environmental faetors play an important role, the nature of which
ís far from certain (Wheatley el al 1983, Iglesias et al 1994).
6
I I I I I I I I I I I I I I I I I I I
I I I I I I I I I I I I I I I I I I I
Several methods have been developed to minimize the effecl of PPD: in polyethylene and PVC bags
for example, the roots could be stored 5-8 days longer before deteriorating (Janssen and Wheatley 1985,
Wheatley and Schwabe, 1985), while waxing the roots offers protection to the roots from the effect of
O, thereby increasing the storage life to 20-30 days. (Zapata and Riveros, 1979). A disadvantage ofthis
method is the high cost involved. Burying the roots in soil (RH>80%) has been reported to extend
postharvest shelf-Jife to 3 weeks. (Hirose and Data '82, Rickard and Courtsey 'SI)
It ís has been demonstrated that pruning (the elimination of the green part of the cassava plant) sorne
time before harvesting, slows down the deterioration process (Wheatley 1980, Lozano et al 1978, Hirose
and Data 1982), though just as lhe biochemistry of PPD ís nol fully understood, neither is the
mechanism by which pruning inhibits the process.
The pruning of cassava, in addilion lo reducing PPD susceptibility, may have a nurnber of olher
advantages. These could inelude the possibility of íntercropping (sowing fresh altemate crops between
the cassava rows at an earlier-lhan-normal stage offering advantages in terms of diminished soi! erosiono
The f1exibility offered by su eh an arrangernent rnight also enable farrners to take maximum advantage
of climate season (e.g. sowing during the last month ofthe rainy season). A further functional advantage
is that pruning greatly favors the adoption of mechanical harvesting of cassava roots (Müller-Siímann,
K.M., personal communication).
Before pruning treatment could be used in different markets, it is necessary to emphasize the effects
pruning has on other quality aspects.
In this research the effect of pruning of cassava on sorne cassava quality aspects like was investigated.
Agronomic characteristics were investígated, including susceptibility to post-harvest physiological
deterioration (PPD), yield, root-nurnber and DM content as well as the followíng physícochemical
properties: cyanogen content, starch content, total and reducing sugar contents, amylose content and
gelatinization characteristics.
lnvestigations were performed using 6 cassava clones.
Frequent sampling (0, 2, 4, 6, 8, 10, 15, 20, 25, 28 and 39 days after pruning) was adopted to permit
a more thorough examination of possible relationships than previous research had alIowed.
7
2 MATERIALS AND METHODS
2.1 Plant selection
Plants of ten cassava clones, at nine months maturity, were selected from the CIAT core collectíon (a
collectíon of 630 cassava clones, representatíve of the complete global gennplasm colJection of 5169
clones held at CIA T).
Afier an initial trial of susceptibility (see 'Results' § 4.1) to post-harvest physiological deterioration
(PPD), 6 clones were selected to represent the 10, M Col 22, M Col 72, M Ven 77, M Bra 337, M Pee
245, CM 627-5.
2.2 Pruning aud harvesting
Plants weee pruned leaving 30 cm of the stem and harvested al 0, 2, '4, 6, 8, 10, 15, 20, 25 and 30 days
afiee pruning. S plants per clone weee harvested 00 each day.
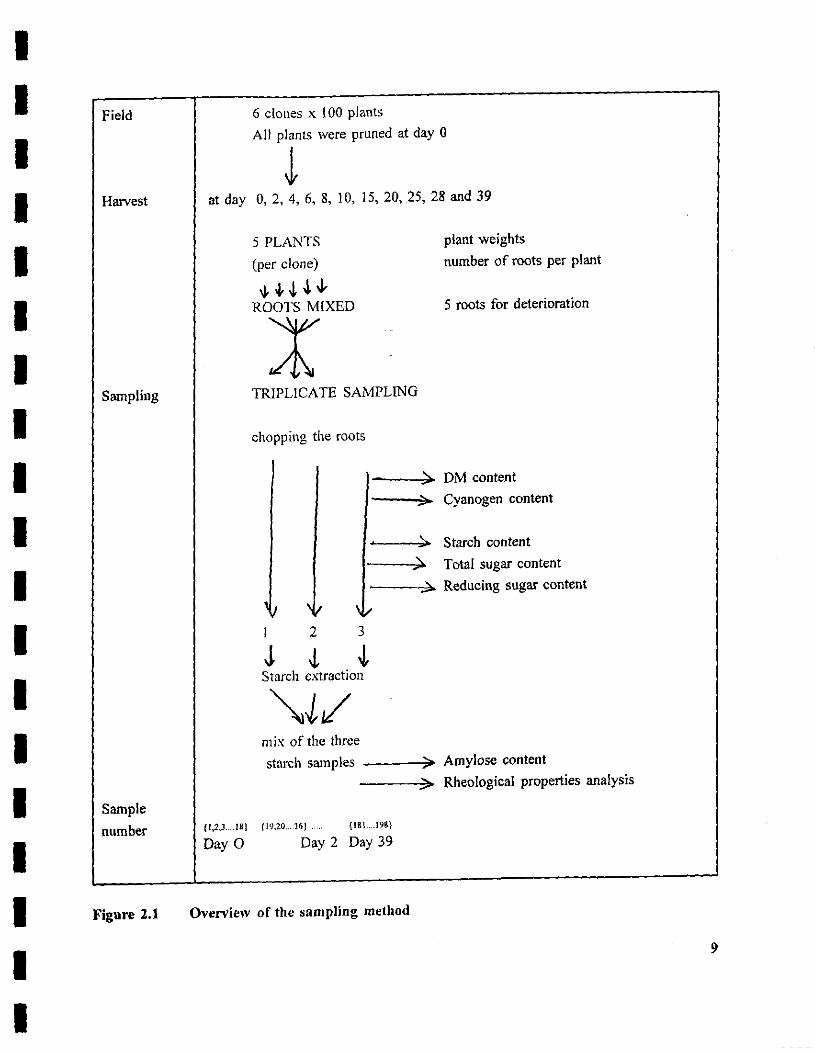
2.3 Processing oC the cassava roots iuto samples
Fígure 2.1 peesents ao overview af processing of cassava-roots into samples.
Roots were weíghed and the total number and number of commercial roots were couoted per plant
The roots within each variety were then mixed. Seven cornrnercíalJy-sízed roots wíth a mínimum length
of 18 cm, without mechanical damage other than severing incurred by harvest ítself and with no visible
pre-harvest rotting, were chosen for evaluation of PPO susceptibility (§ 3.10) and for analysis of
scopoletin content (§ 3.lI).
The remaining roots were divided ioto three different groups, so that sampIing for one variety could
be carried out in triplicate.
The roots were peeled, washed and chopped and different samples were prepaeed for analysis within
1 hour of harvest to overcome enzymatic activity and the effects of mechanical ¡njuey.
8
I I I I I I I I I I I I I I I I I I I
I I I I I I I I I I I I I I I I I I I
Field
Harvest
Sampling
Sample
number
Figure 2.1
6 clones x 100 plants
Al! plants were pruned at day O
J at day 0,2,4,6, 8, 10, 15,20,25,28 and 39
(1,2.L.I8}
Day O
5 PLANTS
(per clone)
,¡. H H, ROOTS MIXED
X TRIPLICATE SAMPLING
chopping the rools
plant weights
number of roots per plant
5 roots for deterioration
----,;),~ DM content
/---..,:>;.. Cyanogen content
~---,,2;.;.. Starch conten!
I---.~;" Total sugar content
~--::~~ Reducing sugar content
'J '/ \i.I I 2 3
J J, ~ Starch extraction
~~/ mix of lhe three starch samples ___ ...;>¡.. Amylose content
___ ...;:>~ Rheological properties analysis
(19,20 .. l6J ... " {IRL.198}
Day 2 Day 39
Overview of the sampling method
9
2.3.1 Starcb extraction
Cassava parenchyma was chopped, washed and homogenized in water using a Waring blender at
maximum speed. This homogenate was passed through a sieve (80 Mesh). The residual aqueous starchy
suspension was transferred lo basíns. After I hr of starch sedimentation, the aqueous supernatant was
removed. The cassava starch was air dried within 48 hrs at room temperature. The amylose content was
determioed and measurements of rheologieal properties made. Details of these analysis are given in §
3.8 and § 3.9 respectively)
2.3.2 Freeze-dried milled cassava flour
Cassava parenchyma (± 30 g) was chopped prior to freeze drying (SBS Freeze dryer; -40 oC, 0.2 mm
Hg) for 24 hours. The samples were milled to afine powder in a Cyclotec Sample MilI. The resulting
flour was analyzed lo determine total and reducing sugar and starch contents (§ 3.6 and § 3.7
respectively).
2.3.3 Cassava extracts
Extracts were made for parenchymal cyanogen assay (§ 3.5) as follows: Chopped cassava parenchyma
(60.0 g) was homogenized in a Waring blender (max. speed) fOf 30 s with 150 mI of cyanogeo
extractioo medium (O.l M ortho-phosphoric aeid containiog 25% (v/v) ethanol). The homogenate was
filtered using a Buchner funnel (Whatmann glass microfibre filter GFIA, 15 cm diameter). The blender
was rinsed with 50 mI of the extraetion medium which was then filtered in the same way and
ineorporated into the extracto The extraet was transferred into small screw-cap bottles and stored at 4
oC until assay 3.5.
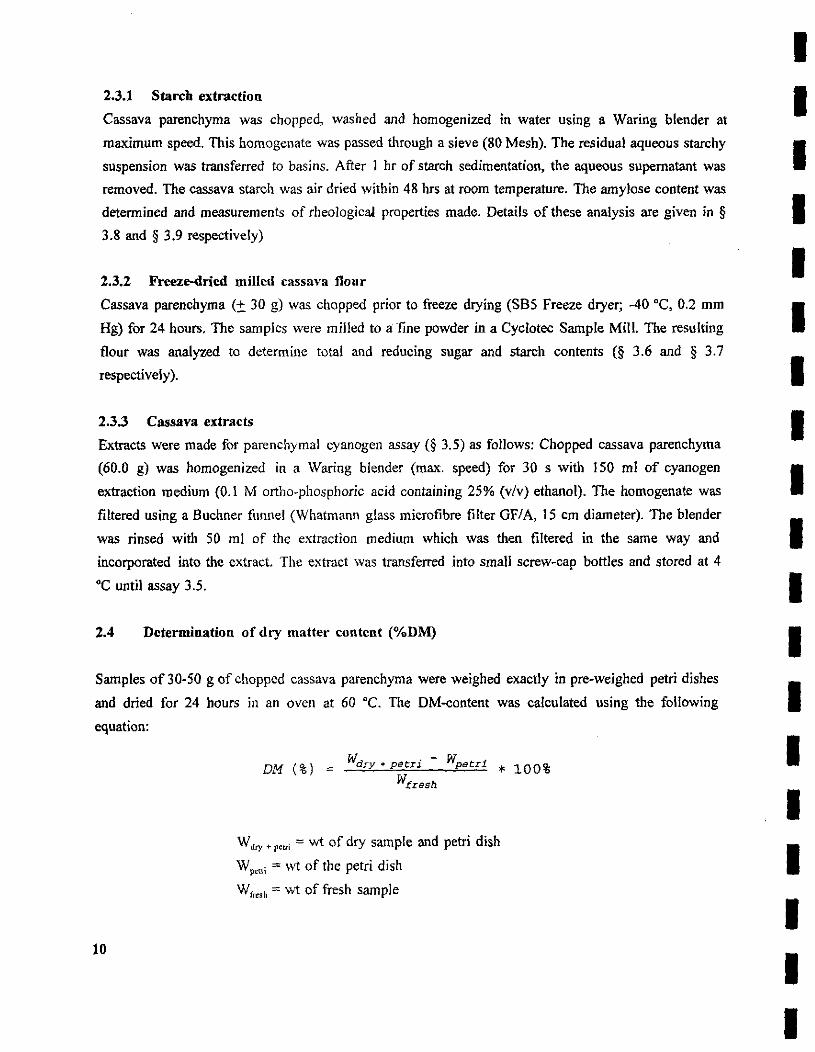
2.4 Determinatíon oí dry matter content (%DM)
Samples of 30-50 g of chopped cassava parenchyma were weighed exaetly in pre-weighed petri dishes
and dried for 24 hours in an oven at 60 oc. rhe DM-content was calculated using the following
equation:
10
DM (%) ~ Wdry • petr; - WpetIi * 100% Wfresh
Wd'Y' p"'¡ ~ wt of dry sample and petri dish
W p,"¡ = wt of the petri dish
W''''h = wt of fresh sample
I I I I I I I I I I I I I I I I I I I
I I I I I I I I I I I I I I I I I I I
2.5 Determination of the cassava cyanogen content
The colorimetric method described below is the method by Essers et al. (1992). There are three forms
ofcyanogens in cassava: the glycosidic (,bound') for, the hydroxynitriles (cyanohydrins) and free HCN.
2.5.1 Total cyanogen analysis
Cyanogen extracts were diluted with fresh extraction medium prior to assay. An aliquot (0.1 mI) oflhe
diluted extraet was added to 0.4 mI phosphate buffer (0.1 M, pH 7.0) in a stoppered Quickfit test tube.
Linamarase preparation (0.1 mI to give an activity of at least 0.3 units, Appendix 1) was then added,
under incubation conditions at 30 oC. Afier 15 minutes incubation 0.6 mI NaOH (0.2 M) was added,
followed 5 min Jater by 2.8 mI pH 6.0 phosphate buffer (0.1 M).
Chloramine T reagent (0.1 mI 1% w/v) was then added and mixed, followed by 0.6 mI colour reagent
(Appendix 1) before mixing and storing for 10 minutes. Absorbance was measured at 605 nm.
Calibration curves were prepared daily using a KCN-stock solution. CaIculations were performed as
described in appendix l.
2.5.2 Noo-glycosidic cyanogeo analysis
As in § 2.5.1, except that no linamarase enzyme was used and no incubation was necessary.
2.6 Total aod reducing sugar contents (TS and RS)
2.6.1 Extraetioo of the sugars
Samples of 2 g eassava parenchyma were aeeurately weighed in thimbles and extracted with 85%
ethanol (150 mI) in a Soxhlet extractor. The sugar solution was passed to a collecting vessel. Afier 3.5
hours of extraetion lhe sample residue was removed for stareh content analysis.
From !he ethanolfwaterlsugar solution in the collecting vessel (A), ethanol was evaporated off. Distilled
water (50 mi) was added and the remaining ethanol was evaporated off, leaving only lhe aqueous
solution of sugars, which was then diluted with distilled water to a total volume of 100 mI.
2.6.2 Determination of the total sugar eontent
Analyses were performed in duplicate.
Aqueous sugar extract (0.5 mI) was aliquoted into 50 mI stoppered- tubes. Distilled water (2.0 mI) and
1 mI Hel (0.1 M) were added. The tubes were placed in a waterbath at IDO ·C for 7 minutes and then
cooled. One drop of phenolphthalein (1 %) and two drops of concentrated Na,CO, (Appendix 2) were
11
added to tbe tubes and mixed. Copper reagent (2.0 mi, Appendix 2) was tben added and the tubes
shaken and placed once more in the waterbath for 14 minutes. Afier cooling 1 mI of the arseno
molybdate reagent (Appendix 2) was added and mixed. The tubes were made up to 50 mI with distilIed
water, and analyzed spectrophotometrícalIy at 520 nm.
Calculations were performed according to the calibration curve (Appendix 2)
2.6.3 Determination of the reducíng sugar content
The determination of the reducing sugar content was carried out in a similar way as for total sugar
content, without addition of 1 mI of Hel (0.1 M).
2.7 Enzymatic determination of starch content
2.7.1 First hydrolysation
Sample residue (0.25 g), removed as previously s!ated (3.6.1) was added to 50 mi double-distilled water
in 125 mI volumetric flasks. To the suspension, 0.1 mi ofa-amylase (Termamyl 120L KNU/G, Novo
Nordisk, Denmark) was added and mixed in a Ultraturax homogenizer at 9500 min" (Ultra Turrax T25,
Janke & Kunkel, ¡KA Labortechnik). The flasks were incubated for 1 hour at 90 oC, during which time
they were shaken once afier 30 minutes.
After tbe samples were cooled, the solutions were filtered over filter paper (Whatman, #1) and diluted
to a total volume of 100 mi with double-distílled water.
2.7.2 Second bydrolysation
The solutions were diluted (l/50) and 0.75 mI aliquots were transferred to tubes. 0.2 mI sodium acetate
buffer (2 M, pH 4.8) was added followed by 0.05 mI of an amylo-glucosidase solution (App. 3). Tubes
were incubated for 2 hours at 60 oC. Afier cooling to room temperature, 2 mI of double-distiIJed water
and 2 mi of tbe colour reagent (App. 3) were added and tbe tubes stored in a dark place for 30 mino
The absorbance of the samples was measured at 560 nm. Calculations were performed using a
calibration curve of glucose standards as described in Appendix 3.
12
I I I I I I I I I I I I I I I I I I I
I I I I I I I I I I I I I I I I I I I
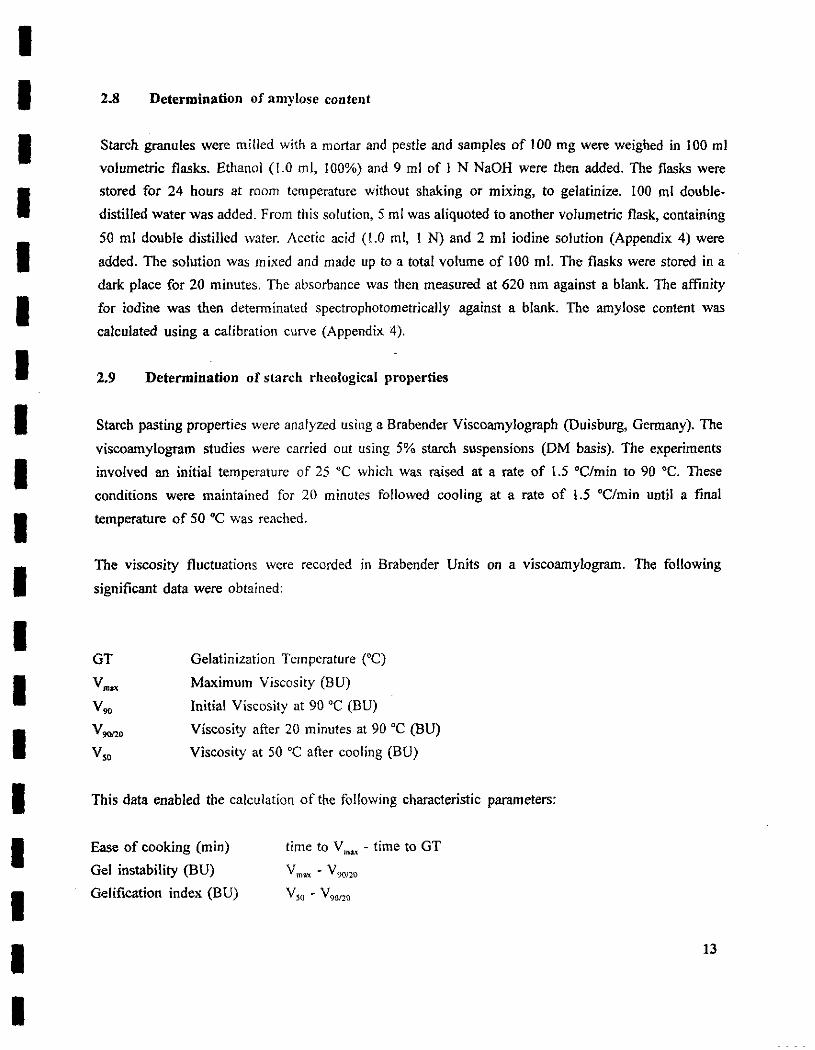
2.8 Determination of amylose content
Starch granules were milled with a mortar and pestle and samples of 100 mg were weighed in 100 mI
volumetric flasks. Ethanol (LO mI, 100%) and 9 mI of I N NaOH were then added. The flasks were
stored for 24 hours at room temperature without shaking or mixíng, lo gelatinize. 100 mI double
distilled water was added. From this solution, 5 mI was aliquoted to anolher volumetríc flask, containing
50 mI double distilled water. Acetie acid (l.O mI, 1 N) and 2 mI iodíne solution (Appendix 4) were
added. The solution was mixed and made up to a total volume of 100 mI. The flasks were stored in a
dark place for 20 minutes. The absorban ce was !hen measured at 620 nm agains! a blank. The affiníty
for iodine was lhen determínated spectrophotometrícally against a blank. The amylose conten! was
calculated using a calibration curve (Appendíx 4).
2.9 Determination of stareh rheological properties
Starch pastíng propertíes were analyzed using a Brabender Viscoamylograph (Duísburg, Germany). The
viscoamylogram studies were carried out using 5% starch suspensions (DM basís). The experiments
involved an initial temperature of 25 ·C which was raised at arate of 1.5 'C/min to 90 ·C. These
conditions were maintained for 20 minutes followed coolíng at arate of 1.5 'C/min until a final
temperature of 50 oC was reached.
The víscosity fluctuations were recorded in Brabender Uníts on a viscoamylogram. The following
significant data were obtained:
GT Gelatinizatíon Temperature ("C)
Maximum Viscosity (BU)
lnitial Viscosity at 90 oC (BU)
Viscosity after 20 minutes al 90 'C (BU)
Viscosity at 50 oC after cooling (BU)
This data enabled lhe calculation of the following characteristic parameters:
Ease of cooking (m in)
Gel instability (BU)
Gelification index (BU)
time to V m", - time to GT
Vmllx - V')(l/20
Vso - V9M20
13
2.10 Determination of post-harvest physiological deterioration (PPD)
The metbod described below was developed by tbe CIATiTDRI Cassava Storage Projeet (Wheatley et
al, 1985)
From five of tbe commercíally-sized roots chasen in § 3.2 the proximal and distal root ends were cut
off. The distal end was eovered by a square of cling-film in arder to maintain the moisture content of
the distal root tissue, inhibiting lhe development of PPD from the distal end and tbereby promoting PPD
only from tbe proximal cut end of the seetion. The roots were stored for 5 days in a place protected
from direct sun rain and rodents, but exposed to ambient airo
To eva1uate PPD 7 slices of 2 cm thiekness were·cut along the root starting from tbe proximal end. For
each slice a value on a seale of O to 10 was assigned, according to the degree of PPD on the proximal
side of each sliee. The values on the seale corresponded to the percentage of lhe surface deterioraled
(1 = 10%, 2 = 20%, etc., as described by Wheatley et al. 1985)
The mean of tbe seven scores per root sectiol1 and the mean for tbe individual section scores for each
group of 5 roots were calculated.
14
I I I I I I I I I I I I I I I I I I I
I I I I I I I I I I I I I I I I I I I
•
3 RESULTS AND DISCUSSION
The effects of pruning upon cassava plants harvested 0, 2, 4, 6, 8, 10, 15, 20, 25, 28, 39 days after
pruning was investigated. lnvestigations included:
3.1
Agronomic data (yield, number of roots)
Physicochemical data (starch and sugar content)
Starch characteristics (amylose, rheological properties)
Postharvest physiological deterioration (PPD)
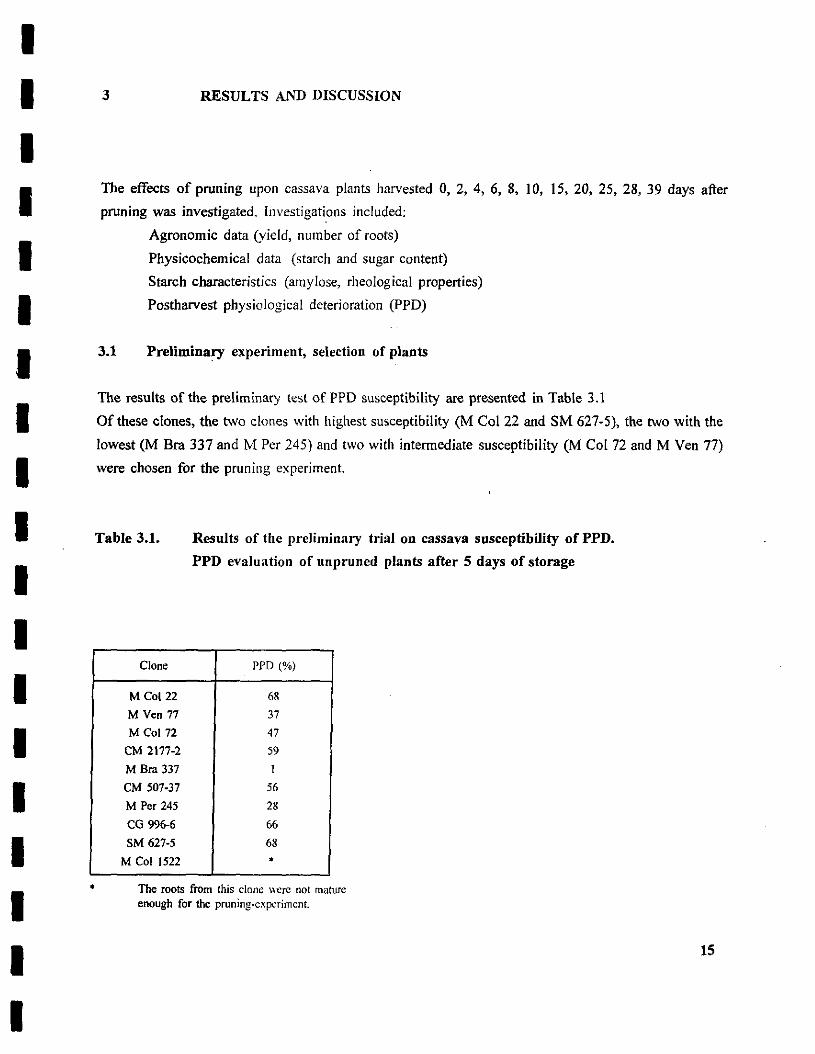
Preliminary experiment, selection of plants
The results of the preliminary test of PPO susceptibility are presented in Table 3.1
Of these clones, the two clones with highest susceptibilíty (M Col 22 and SM 627-5), the two with the
lowest (M Bra 337 and M Per 245) and two with intermediate susceptibílity (M Col 72 and M Ven 77)
were chosen for the pruning experiment.
Table 3.1.
Clone
M Col 22
M Ven 77
M Col 72
CM 2177·2
M Bra 337
CM 507·37
M Per 245
CG 996-6
SM 627·5
M Col 1522
Results of the preliminary tria) on cassava snsceptibility of PPD.
PPD eva)uation of unpruned plants after 5 days of storage
PPD (%)
68
37
47
59
I
56
28
66
68
•
The roots from this clone wcrc nN matUTe
enough for the pruning-cxperiment.
15
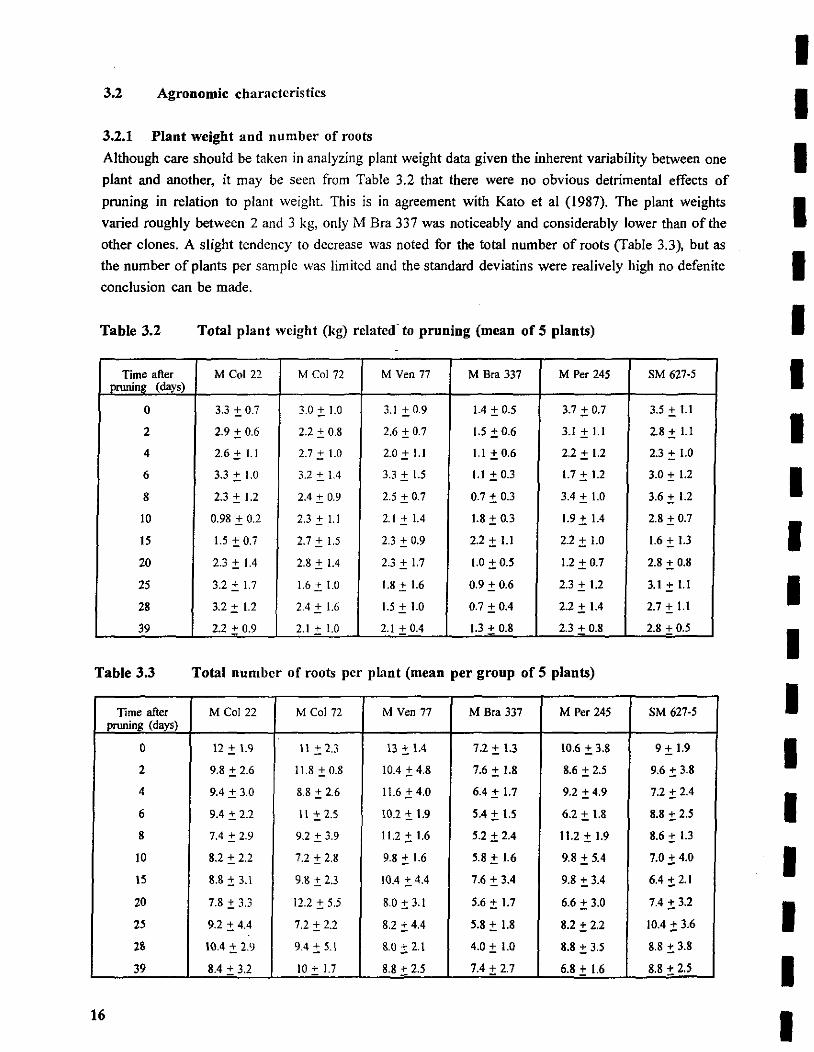
3.2 Agronomic characleris!ics
3.2.1 Plant weight and number of roots
Although care should be taken in analyzing plant weight data given the inherent variability between one
plant and another, it may be seeo from Table 3.2 that there were no obvious detnmental effects of
pruning in relation to plant weighl. This is in agreement with Kato et al (1987). The plant weights
varied roughly between 2 and 3 kg, only M Bra 337 was noticeably and considerably lower than ofthe
other clones. A slight tendency to decrease Was noted for the total number of roots (Table 3.3), but as
the number of plants per sample was limited and the standard deviatins were realively high no defenite
conclusion can be made.
Table 3.2 Total plant weight (kg) related' to pruning (mean oC 5 plants)
Time after M Col 22 M Col 72 M Ven 77 M Bra 337 M Per 245 SM 627-5 pnming (days)
O 3.3 ± 0.7 3.0 ± 1.0 3.1 ± 0.9 1.4 ± 0.5 3.7 ± 0.7 3.5 ± 1.1
2 2.9 ± 0.6 2.2 ± 0.8 2.6 ± 0.7 1.5 ± 0.6 3.1 ± 1.1 2.8 ± 1.1
4 2.6 ± 1.1 2.7 ± 1.0 2.0 ± 1.1 1.1 ± 0.6 2.2 ± 1.2 2.3 ± 1.0
6 3.3 ± 1.0 3.2 ± 1.4 3.3 ± 1.5 1.1 ± 0.3 1.7 ± 1.2 3.0 ± 1.2
8 2.3 ± 1.2 2.4 ± 0.9 2.5 ± 0.7 0.7 ± 0.3 3.4 ± 1.0 3.6 ± 1.2
10 0.98 ± 0.2 2.3 ± 1.1 2.1±1.4 1.8 ± 0.3 1.9±1.4 2.8 ± 0.7
15 1.5 ±0.7 2.7 ± 1.5 2.3 ± 0.9 2.2 ± 1.1 2.2 ± 1.0 1.6 ± 1.3
20 2.3 ± 1.4 2.8 ± lA 2.3 ± 1.7 1.0 ± 0.5 1.2 ± 0.7 2.8 ± 0.8
25 3.2 ± 1.7 1.6 ± 1.0 1.8 ± 1.6 0.9 ± 0.6 2.3 ± 1.2 3.1±1.I
28 3.2 ± 1.2 2.4 ± 1.6 1.5 ± 1.0 0.7 ± 0.4 2.2 ± 1.4 2.7 ± 1.1
39 2.2 + 0.9 2.1 + 1.0 2.1 +004 1.3 ± 0.8 2.3 + 0.8 2.8 + 0.5
Table 3.3 Total number oC roo!s per plant (mean per group of 5 plants)
Time after M Col 22 M Col 72 M Ven 77 M Bra 337 M Per 245 SM 627-5 ¡mmin8, (days)
O 12 ± 1.9 11 ± 2.3 13 ± \04 7.2± 1.3 10.6 ± 3.8 9 ± 1.9
2 9.8 ± 2.6 11.8 ± 0.8 10.4 ± 4.8 7.6 ± 1.8 8.6 ± 2.5 9.6 ± 3.8
4 9.4 ± 3.0 8.8 ± 2.6 11.6 ± 4.0 6.4 ± 1.7 9.2 ± 4.9 7.2 ± 2.4
6 9.4 ± 2.2 11 ± 2.5 \0.2 ± 1.9 5.4 ± 1.5 6.2 ± 1.8 8.8 ± 2.5
8 7.4 ± 2.9 9.2 ± 3.9 11.2 ± 1.6 5.2 ± 2.4 11.2 ± 1.9 8.6 ± 1.3
10 8.2 ± 2.2 7.2 ± 2.8 9.8 ± 1.6 5.8 ± 1.6 9.8 ± 5.4 7.0 ± 4.0
\5 8.8 ± 3.\ 9.8 ± 2.3 10,4 ± 4,4 7.6 ± 3.4 9.8 ± 3.4 6.4 ±2.1
20 7.8 ± 3.3 12.2 ± 5.5 8.0 ± 3.1 5.6 ± 1.7 6.6 ± 3.0 7.4:!: 3.2
25 9.2 ± 4.4 7.2 ± 2.2 8.2 :!: 4.4 5.8 ± 1.8 8.2 ± 2.2 10.4 :!: 3.6
28 \0,4 ± 2.9 9.4 ± 5.\ 8.0 ± 2.1 4.0 ± 1.0 8.8 ± 3.5 8.8 ± 3.8
39 8.4 + 3.2 10 + 1.7 8.8 :!: 2.5 7.4 ± 2.7 6.8 ± 1.6 8.8 :!: 2.5
16
I I I I I I I I I I I I I I I I I I I
I I I I I I I I I I I I I I I I I I I
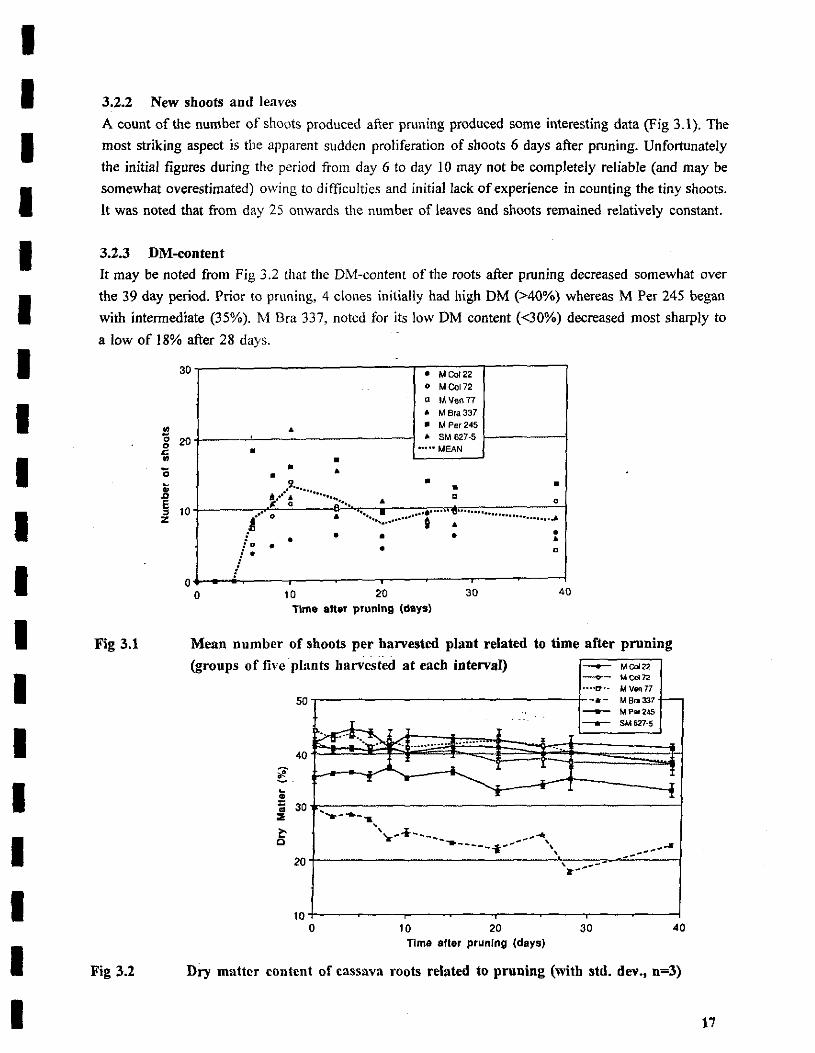
3.2.2 New shoots and leavcs
A count ofthe number of shoots produced after pruning produced some interesting data (Fig 3.1). The
most striking aspect is the apparent sud den proliferation of shoots 6 days after pruning. Unfortunately
the initial figures during the period from day 6 to day 10 may not be completely reliable (and may be
somewhat overestimated) owing to difficulties and initial lack of experience in counting the tiny shoots.
It was noted mat from day 25 onwards the number of leaves and shoots remained relatively constant.
3.2.3 DM-content
It may be noted from Fig 3.2 that the DM-content of the roots after pruning decreased somewhat over
the 39 day periodo Prior to pruniog, 4 clones initially had high DM (>40%) whereas M Per 245 began
with intermedíate (35%). M Bra 337, noted for its low DM content (<30%) decreased most sharply to
a low of 18% afier 28 days.
Fig 3.1
Fig 3.2
30~----------------------~~~~--------f • M Col 22
• •
• M Col 72
• M Ven 77
• M Bra337
• M Per245
• SM 627-5 ·····MEAN
•
10
• • • •
•
20 Time alter prunlng (days)
• •
30
• o
o
40
Mean number of shoots per harvested plant related to time aner pruning
(groups of fivc plants harvested at each interval) ~ Meo<"
l. :;; ¡¡¡ :&
~ e
->1:/"- MCd72
"'-0-', M Ven n 50...----------------+-.- MBra331-
-I. c·~ .. g. •• ~ 1. o:::. ~ .• ~ .'-,lj>'-.& .......... . ........
40
T
30
20
----• . .. 1
MPer245 SM627-5
-- ,_ .... --
10+---~--~-~---r_.-----r----~ O 10 20 30 40
Time after prunlng (days)
Dry matter content of cassava roots related to pruning (witb std. dev., 0=3)
17
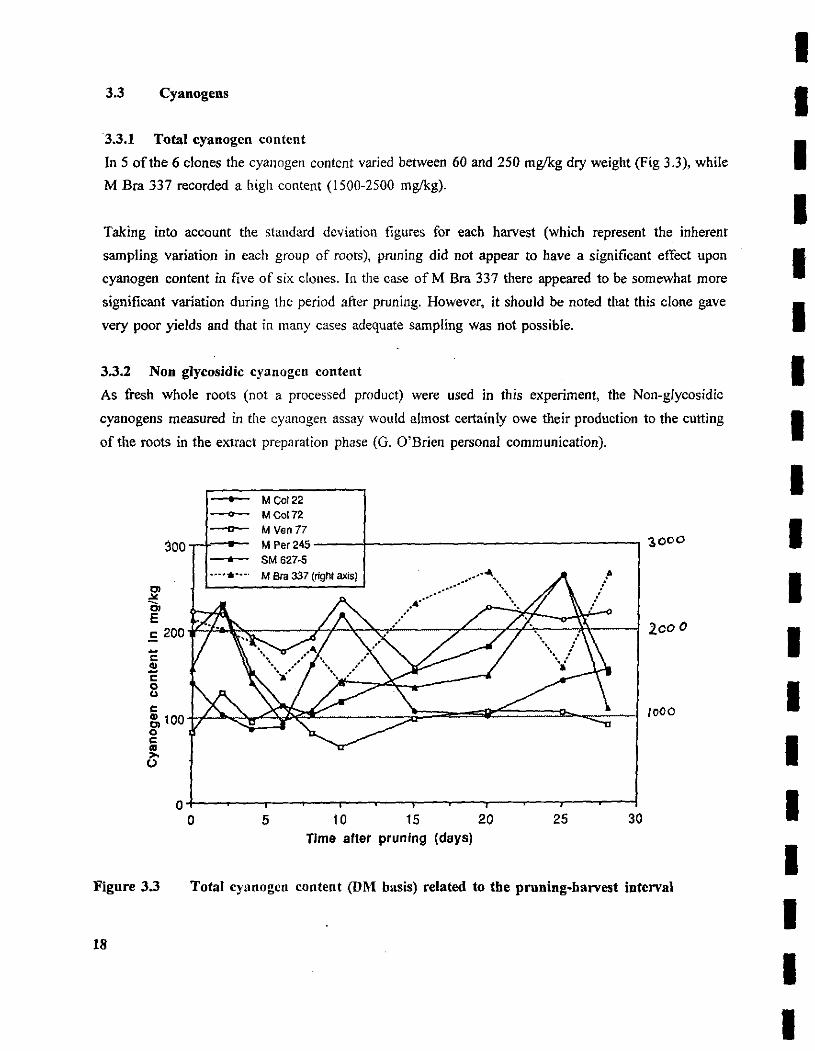
3.3 Cyanogens
3.3.1 Total cyanogen content
In 5 ofthe 6 clones the cyanogen conten! varied between 60 and 250 mglkg d¡y weight (Fig 3.3), while
M Bra 337 recorded a high content (1500-2500 mglkg).
Taking into accoun! the standard deviation figures for each harvest (which represent the inherent
sampling variation in each group of roo!s), pruning did not appear to have a significan! effect upon
cyanogen content in five of six clones. In the case of M Bra 337 there appeared to be somewhat more
significant variation during Ihe period after pruning. However, it should be noted that this clone gave
ve¡y poor yields and that in many cases adequate sampling was not possible.
3.3.2 Non glycosidic cyanogen content
As fresh whole roots (not a processed product) were used in this experiment, the Non-glycosidic
cyanogens measured in the cyanogen assay would almost certainly owe their production to the cutting
of the roots in tbe extraet preparation phase (G. O'Bríen personal communication).
- M Col 22 -- M Col 72 -o-- M Ven 77
300 M Per 245 -----4~----------------------------_, ~ooO - SM 627·5 ~.-.*--_.
2eo o
1000
o+---~~--~--,---~~--~--~--~~--~--~
O 5 10 15 20 25 30 Time after pruning (days)
Fignre 3.3 Total cyanogcn content (DM basis) related to the pruning-barvest interval
18
I I I I I I I I I I I I I I I I I I I
I I I I I I I I I I I I I I I I I I I
3.4 Effect of prnning on carbohydratc cantent
Flonr ofthe parenchyma of ¡he e"sso,'" rouls \Vas prepared immediately afier harvest. Percentage levels
of roots starch, redncing and total sllgars (RS and TS) and amylose in the starch were measured. Table
3.4 shows the initial carbohydrate cDlnposilion in ¡he six clones.
Table 3.4 Carbobydratc cunten! of cassa"a parcnchyma, 9 months matnrity, dry weight basis
M Col 21 1\ [ Col 72. i\l Ven 77 M Bra 337 M Per 245 SM 621,5
Starch 85 SI S~ 79 83 83
Arnylose 29 .:lO 28 24 28 25 (in starch)
Reducing 0.3 OA 0.2 0.6 0.43 0.41 Sugars
Total Sugars 2.8 3.6 2.9 5.1 3.0 2.7
Remainder 12.2 1 '.·1 13.1 15.3 13.40 14.3
Observations on lhe CIAT Core Colkelion coincide wilh the values found here (CIAT, 1994 in press).
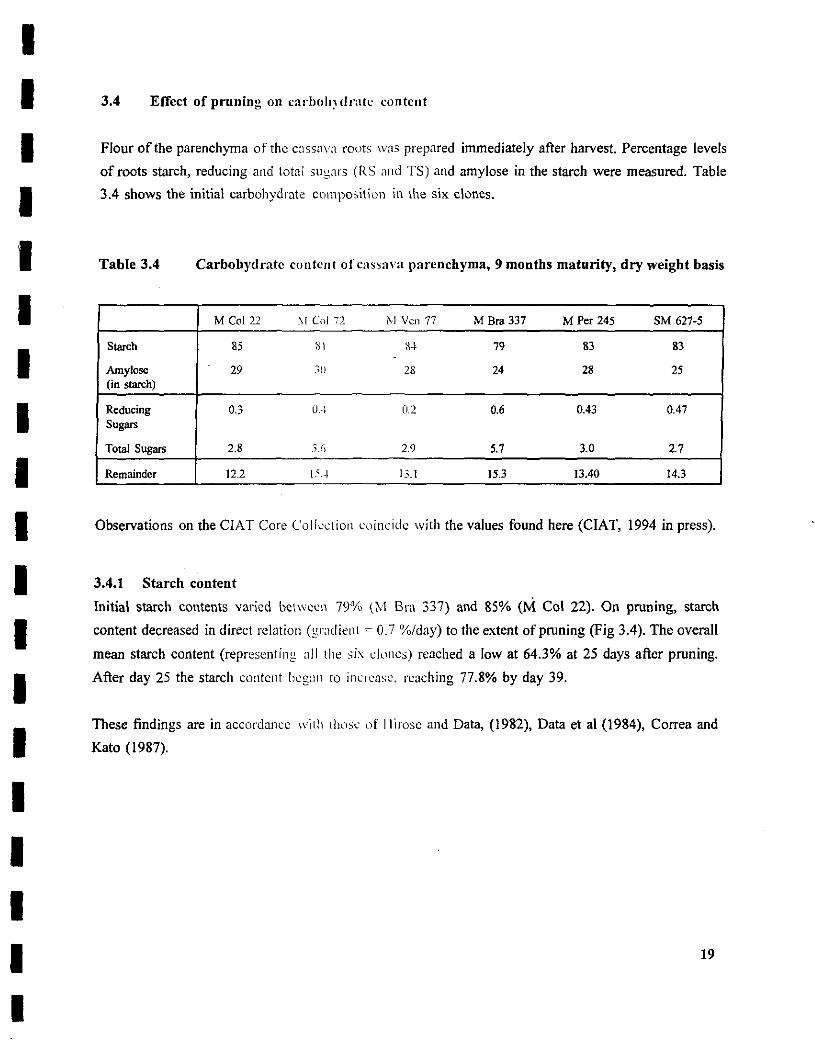
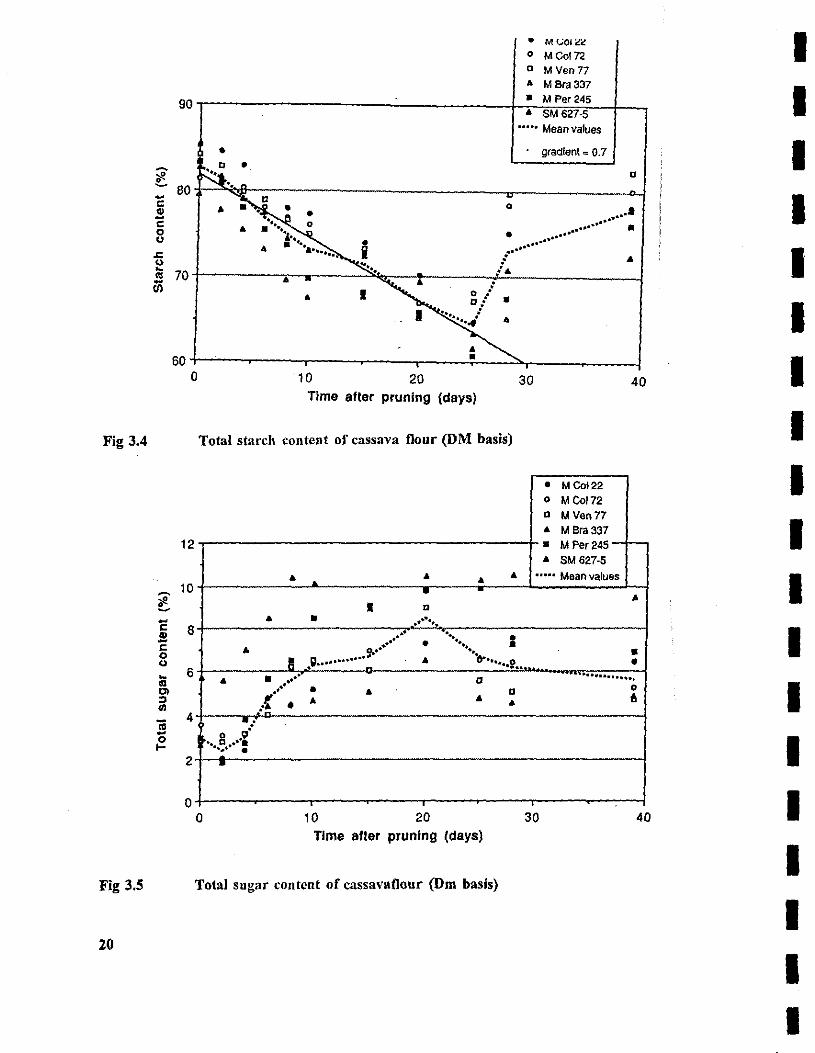
3.4,1 Starcb content
Initial starch contents varied be\wccn 79"/., (M Bra 337) and 85% (M Col 22). On pruning, starch
content decreased in direet relation (gradienl = 0.7 %/day) to the extent ofpruning (Fig 3.4). The overaIl
mean starch content (representing 011 lile si" cllmes) reached a low at 64.3% at 25 days afier pruning.
Afier day 25 the starch eontent begelll 10 inerease. reaehing 77.8% by day 39.
These findings are in aeeardancc \\'¡Ih Iho,e {)f Ilirose and Data, (1982), Data et al (1984), Correa and
Kato (1987).
19
~
>!! o ~ -e .. -e o u
oC U ~
ro -rJ)
Fig 3.4
~
¡fl ~ -e ID -e o u ~
'" CI :> .. iii -o ...
Fig 3.5
20
90
• •
80
• A
o
A
70 A
• I
o
• M (,;o,;¿:r:!
o MCol72 a M Ven 77 A M Bra 337
• M Per 245 .. SM627-5
... o .. Mean values
• gradient = 0.7
a
. ......• ....... . . . ..... .......... ... ..
lA
A
60+-~~-----r----~--~----~·~~~ ____ ~ __ ~ O 10 20 30 40
Time alter pruning (days)
Total starch content of cassava flour (DM basis)
• M Col 22 o lA eol72 a lA Ven 77 .. lA Bra 337
12 • lA Per245- -.. SM 627-5
10 .. • .. .. .. ..... Mean values
• .. I D
8
6
.. • . ........ " " .' '. • Q. ...... • ' . • A '.
I! '. • .g ............. ~ .. ~·····.i .. • .. . .' a ............... ."
" • .. a o .. ,. . .. .. .. II
4 --. ... o '" O0. c .... •• .... .
2 •
o O 10 20 30 40
Time afler prunlng (days)
Total sngar content oC cassavaflour (Dm basis)
I I I I I I I I I I I I I I I I I I I
I I I I I I I I I I I I I I I I I I I
3.4.2 Total sugars (TS)
Figure 3.5 represents the TS conten!. AH six clones folIowed lhe same pattero. On day O TS varied
between 2.67% (SM 627-5) and 5.73% CM Bra 337). The overall mean TS decreased during the first
2 days after pruning to around 80% its initial value, followed by a subsequent increase up to a
maximum overall mean value of 8.5% (280% of the initia! va!ue) at day 20. After day 20, the TS
decreased slightly.
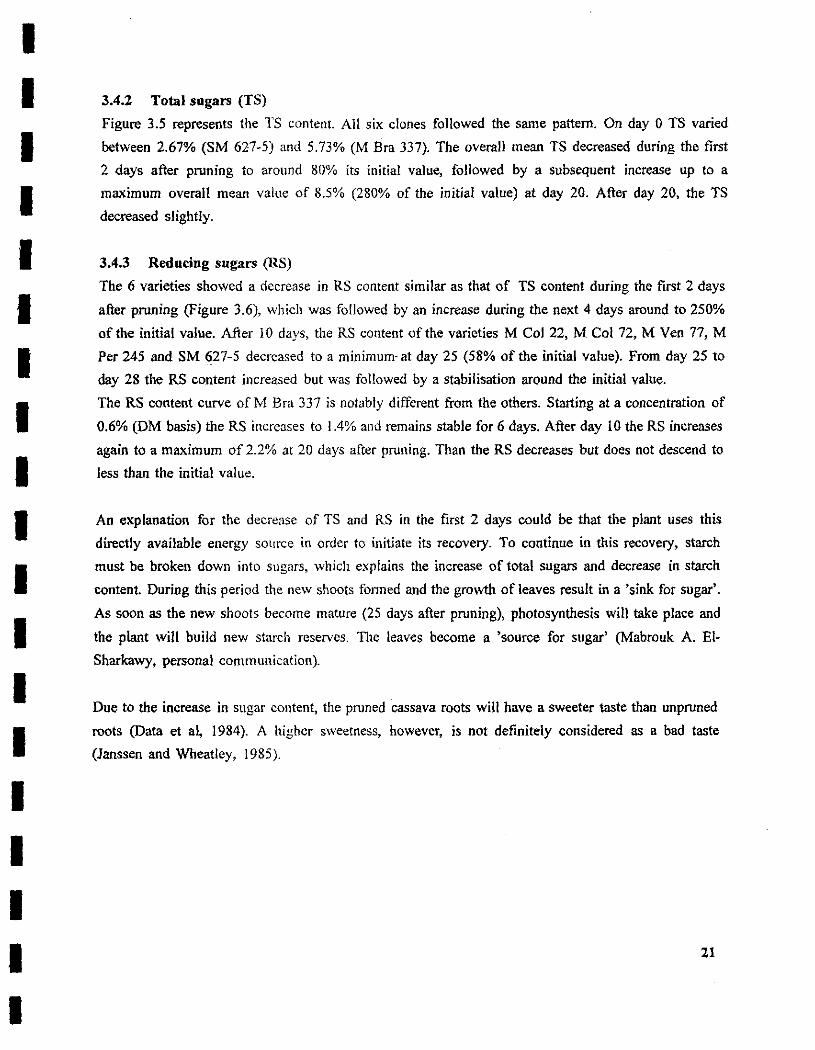
3.4.3 Reducing sugars (RS)
The 6 varieties showed a decrease in RS content similar as that of TS content during the first 2 days
after pruning (Figure 3.6), which was followed byan increase during the next 4 days around to 250%
of lhe ¡nitial value. After 10 days, the RS content of the varieties M Col 22, M Col 72, M Ven 77, M
Per 245 and SM 627-5 decreased to a minimum- at day 25 (58% of the ¡nitial value). From day 25 to
day 28 the RS content increased but was followed by a stabilisation around lhe initial value.
The RS content curve of M Bra 337 is notably different from the olhers. Starting at a concentration of
0.6% (DM basis) the RS increases to 1.4% and remains stable for 6 days. After day 10 the RS increases
again to a maximum of 2.2% al 20 days after pruning. Than lhe RS decreases but does not descend to
less than the initial value.
An explanation for the decrease of TS and RS in the first 2 days could be lhat lhe plant uses lhis
directly available energy sOllrce in order to initiate its recovery. To continue in lhis recovery, starch
must be broken down into sLlgars, which explains the increase of total sugars and decrease in starch
content. During this period the new shoots formed and the growth of leaves result in a 'sink for sugar'.
As soon as the new shoots beco me mature (25 days after pruning), photosynthesis will take place and
the plant will build new starch reserves. The leaves become a 'source for sugar' (Mabrouk A. EI
Sharkawy, personal communication).
Due to lhe increase in sugar content, the prunedcassava roots will have a sweeter taste lhan unpruned
roots (Data et al, 1984). A higher sweetness, however, is not definitely considered as abad taste
(Janssen and Wheatley, 1985).
21
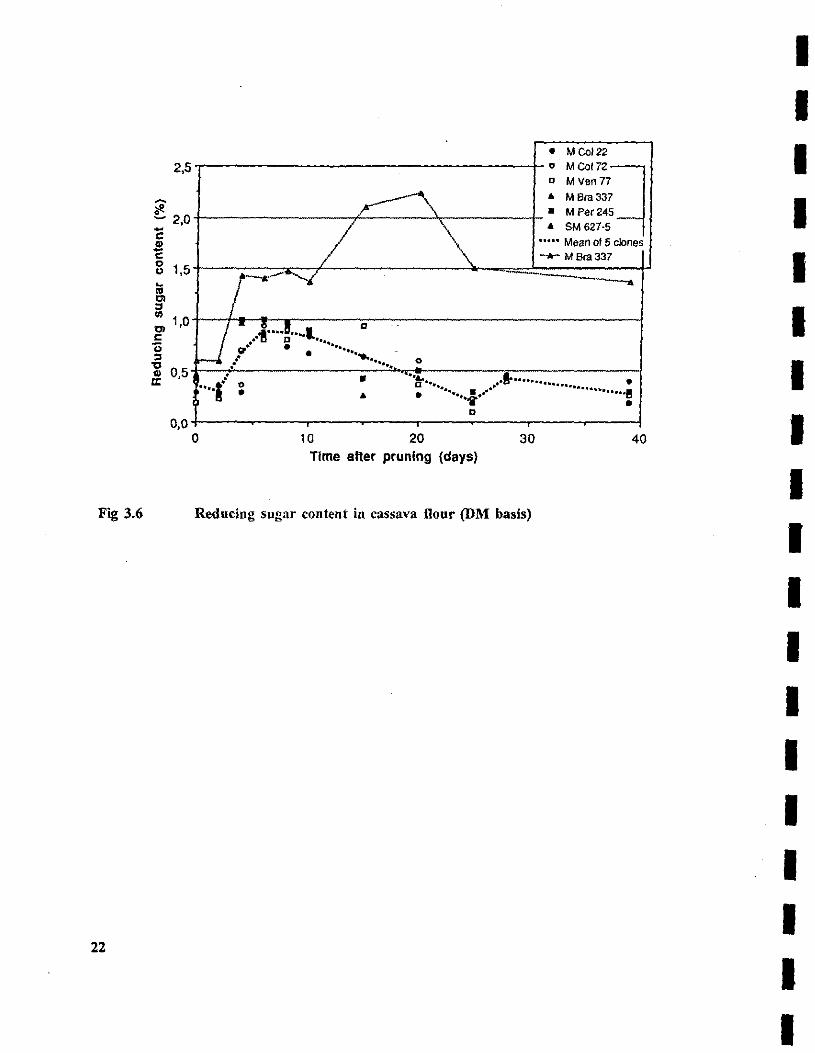
Fig 3.6
22
2,5
l2.0 -e ~ o " 1,5
~ :J ., 1 O ",,' e 'O :J
'O <1> 0,5 rr
0,0
• M Col 22 o
"~nq a M Ven 77
\ A M 8r.337 ~- • M Per245
/ \ A SM627-5
..... Mean of 5 clones -.... M 813337
./~-./~ ----"-------
U· o ,.a. a·, .! .... ····l .'" D· .... ". . ...... ,.. .. ....
o ... . ...... .... { • "6- ....... • ...... I .............................. ~ o a··. • A • .... -'i'. •
a -r -.- -r
O 10 20 30 40 Time alter prunlng (days)
Reducing sugar content in cassava flour (DM basís)
I I I I I I I I I I I I I I I I I I I
I I I I I I I I I I I I I I I I I I I
3.5 Starch properties
3.5.1 Amylose
Figure 3.7 shows tbe effeet of pruning on the amylose content of starch. Again aU 6 clones followed
a similar pattern. In the ease of arnylose eontent this was an overall decrease during the first 6 days,
followed by an increase during the next 2 weeks and !hen a second low on day 25. From day 25
onwards !he arnylose content began to inerease. In most cases, the difference between the amylose
content on day 39 and the initial value was very slight. The one notable exception was M Bra 337,
whose final arnylose content \Vas approximately 23% higher !han the original value.
The findings of Asaoka (1993) on the amylose-content at a pruning-harvest interval of 4 weeks were
in keeping with !he results on day 28 of this experience.
The decrease in arnylose content in the first 6 days suggests !hat amylose must be a more available
starch compound !han amylopectin which has a far hígher MW lhan amylose (50-100 million, as
compared to 250.000). The apparent increase in amylose content during day 6 - day 20 at a time when
no fresh starch manufacture in the roots ís indicated (Fig "starch" 3.4) would appear to imply !hat sorne
breakdown of amylopectin must have taken place. Amylopectin is constructed of branched arnylase
chains. Breaking down of amylase means an increase of arnylase (6 DA onwards).
• M Col 22 o M CoI?2
" M Ven7? .. M era 337 32 • M Per 245 -.. SM 627·5
• .. ... MEAN o o l! o o o • 30
g o o " oO"
• o ........ .6
i • . ....... • " D • ...... " ...... .. ..... ~ • .... ·S· ..~., .
.. . .. " 11······ • ~ .......... ¡. ...... .. D .. \ .. / . ..
~ .. A
28
26 • .. .. D .. " .. .. .. , I •
24
22 O 10 20 30 40
Time after prunlng (days)
Fig 3.7 Amylose canten! in cassava starch, in relation to pruning (DM basis)
23
MCo<22
M Col 72
roo~--------------------~----------------~ f-----~I20 ----o-- MVenn
500t-------------~~----------------------~ 00
90
400 80
5' e 70
~ 300 ¡¡; 60
o u .. 50 :;;
40
100t-----------mt------------------------------------~----~20
0~------~~~---r------~--~--~--~--~--~__40 o 20 40 60 80 100 120
Time (mln)
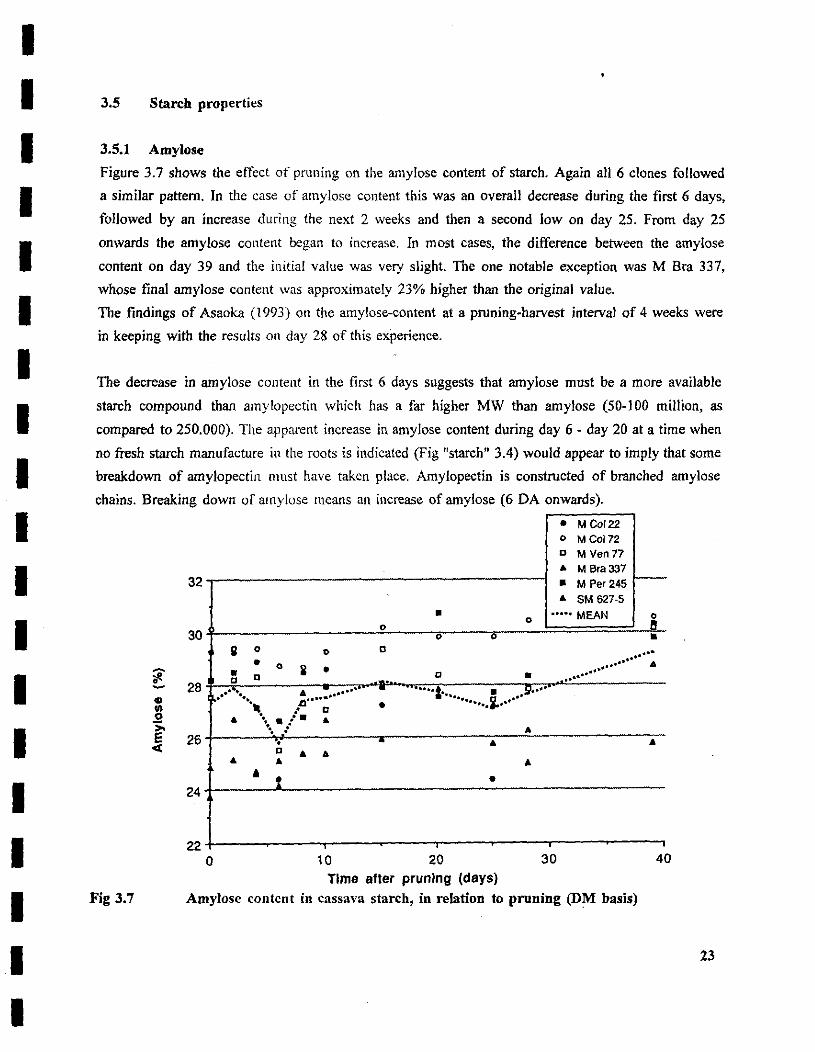
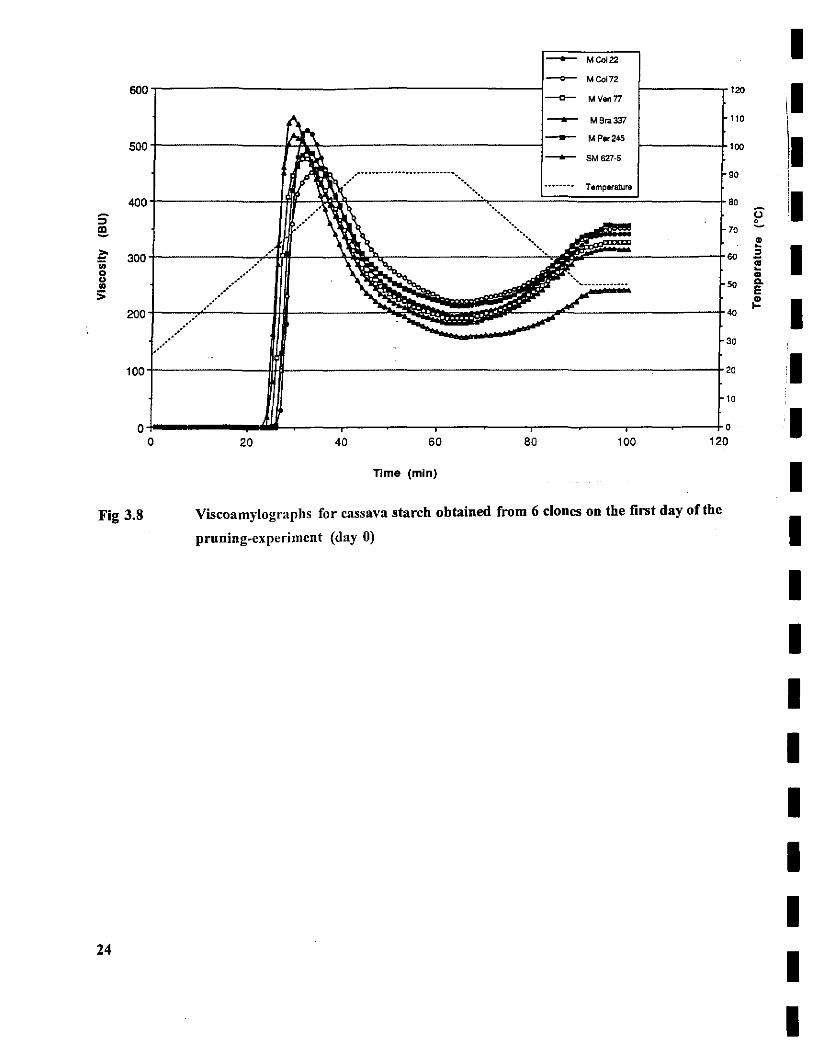
Fig 3.8 Viscoamylograpbs for cassava starch obtained from 6 clones on tbe first day oftbe
pruning-experiment (day O)
24
I
U ~ .. -" ¡;¡ -.. I a. E ~ I
I I I I I I I I I I I I I
I I I I I I I I I I I I I I I I I I I
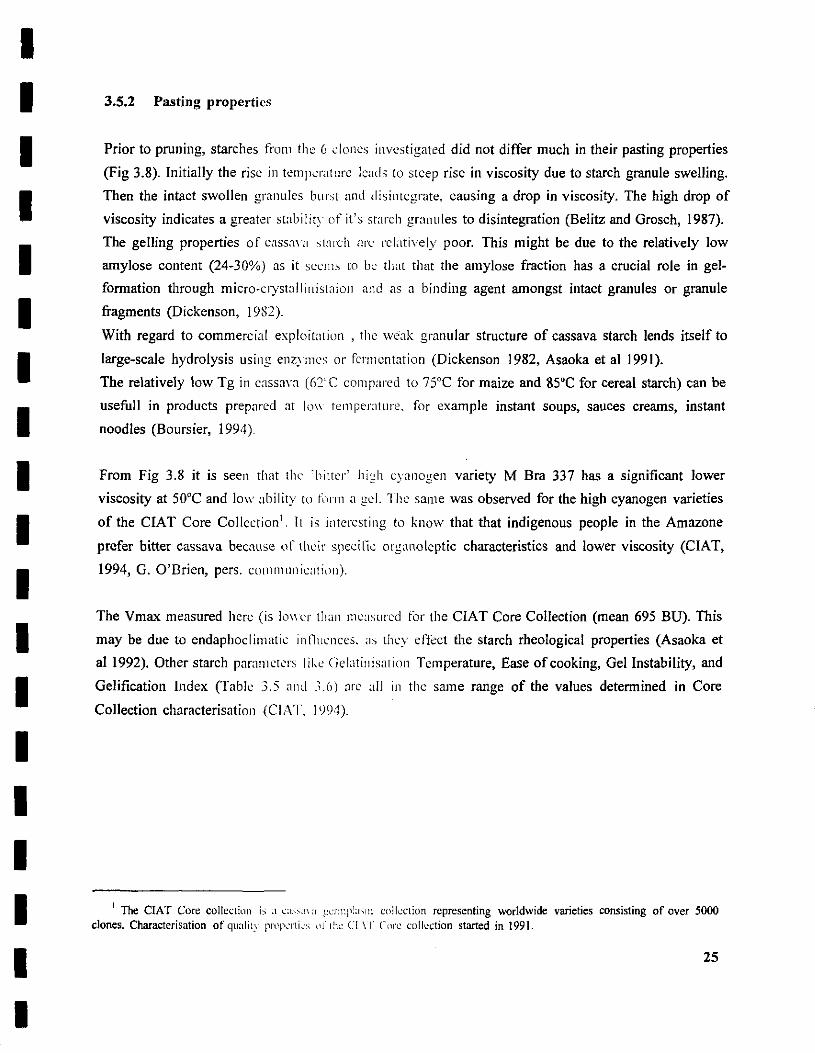
3.5.2 Pasting propertics
Prior to pruning, starehes from the 6 clones investigated did not differ mueh in their pasting properties
(Fig 3.8). Initially the rise in temperature leads to steep rise in viscosity due to starch granule swelling.
Then the intact swollen granules burst and ¡[isintegrate, causing a drop in viseosity. The high drop of
viscosity indicates a greater stabilit, of it's starch granules to disintegration (Belitz and Grosch, 1987).
The gelling properties of eaSS:l\a ,tareh arlO rclatively poor. This might be due to the relatively low
arnylose content (24-30%) as it scem, lo be lhat lhm the amylose fraction has a crucial role in gel
formation through micro-erystallinistaion ami as a binding agent arnongst intact granules or granule
fragments (Dickenson, 1982).
With regard to commereial exploitation , the weak granular structure of cassava starch lends itself to
large-scale hydrolysis using enzymes or fcrmcnlation (Dickenson 1982, Asaoka et al 1991).
The relatively low Tg in eassava (62T eOlllpared lo 75'C for maize and 85'C for cereal starch) can be
usefull in products preparcd al 10\\ tell1perature. for example instant soups, sauces crearns, instant
noodles (Boursier, 1994).
From Fig 3.8 it is seen that the 'bilter' high cyanogen variety M Bra 337 has a significant lower
viscosity at 50'C and lo\\' abilily to Il1l"l11 a gel. The same was observed for the high cyanogen varieties
of the CIAT Core Collection'. lt is intcresting to know that that indigenous people in the Amazone
prefer bitter cassava becnuse ot' lheir specillc organoleptie characteristics and lower viscosity (CIAT,
1994, G. O'Brien, pers. COillI11Ullic:Jticlll).
The Vmax measured here (is 10\\ el' th:Jll llle:lsured tor the CIAT Core ColIection (mean 695 BU). This
may be due to endaphoclimatie ill!lUl·llCCS. 'IS lhey elTeet the starch rheological properties (Asaoka et
al 1992). Other starch par:Jmclcrs I ike Ciclalill isalioll Temperature, Ease of cooking, Gel Instability, and
Gelification Index (Tabic 3.5 ami ].6) are :dl ill the same range of the values determined in Core
Collection characterisatioll (elAT. 1994).
J The CIAT Core coltcctiOll i:> ;¡ ":;L~q\:l ~~L.TIl:p!;I"I:l colkction rcprescnting worldwide varieties consisting of aver 5000 clones. Characterisation of qual ¡l.\ pI"l'p~,rti~':-; \lj" l!w C!, \ r Cure colk.'ction started in 1991.
25
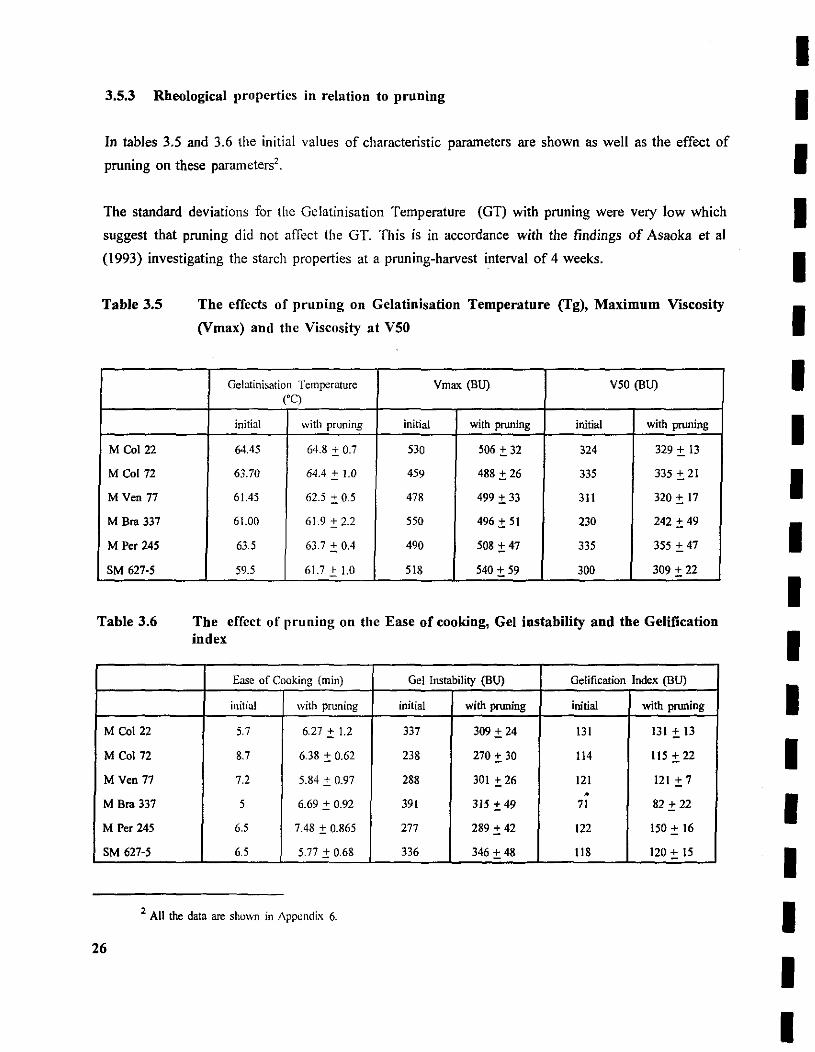
3.5.3 Rheologieal properties io relatioo to pruning
In tables 3.5 and 3.6 the initial values of characteristic parameters are showo as well as the effect of
pruoiog 00 these parameters2.
The standard deviations for the Gelatinisation Temperature (GT) with pruning were very low which
suggest !hat pruning did nol affecl lhe GT. This is in accordaoce with lhe findings of Asaoka et al
(1993) investigating the starch properties al a pruning-harvest interval of 4 weeks.
Table 3.5
M Col 22
M Col 72
M Ven 77
M Bra 337
M Per 245
SM 627·5
Table 3.6
M Col 22
M Col 72
M Ven 77
M Bra 337
M Per 245
SM 627·5
The effeets of pruning 00 Gelatioisation Temperature (Tg), Maximum Viseosity
(Vmax) and the Viseosity at V50
Gelatinisatiol1 Temperature Vmax (BU) V50 (BU) ('C)
¡nitial with pruning ¡nitial with pruning initial with pruning
64.45 64.8 :±: 0.7 530 506 :±: 32 324 329 :±: 13
63.70 64.4 :±: 1.0 459 488 :±: 26 335 335 :±: 21
61.45 62.5 :±: 0.5 478 499 :±: 33 311 320:±: 17
61.00 61.9 :±:2.2 550 496 :±: 51 230 242 :±: 49
63.5 63.7 :±: 0.4 490 508 :':: 47 335 355 :±: 47
59.5 61.7 :±: 1.0 518 540:,:: 59 300 309:±: 22
The effce! of pruning 00 tite Ease of cookiog, Gel instability and the Gelifieation index
Ease of Cooking (m in) Gel Instability (BU) Gelification (ndex (BU)
initial with pruning ¡nitial with pruning ¡nitial with pnming
5.7 6.27:,:: 1.2 337 309:,:: 24 131 l3I :':: 13
8.7 6.38 :±: 0.62 238 270:,:: 30 114 115 :':: 22
7.2 5.84 :':: 0.97 288 301 :':: 26 121 121 :':: 7 •
5 6.69:,:: 0.92 391 315 :':: 49 71 82 :,::22
6.5 7.48 :±: 0.865 277 289:,:: 42 122 150:,:: 16
6.5 5.77 :':: 0.68 336 346 + 48 118 120:,:: 15
2 AII the data are shown in J\ppcndix 6.
26
I I I I I I I I I I I I I I I I I I I
I I I I I I I I I I I I I I I I I I I
The maximum yiscosity f1uctuated with pruning-harvest interval but no link between viscosity and
pruning was observed. The maximum viscosity was relatively low and only one sample exceeded the
viscosity of 600 BU.
Until now, contradieting results have been published on fue effecl of pruning on cassava s!arch.
Results on the effeet of pruning on starch-quality of 2 cassava clones (CG 402-11 and MMEX 59),
showed with pruning an inerease in maximum viscosity exceeding even 1000 BU between 9 and 23
days after pruning. Asaoka el al (1993) however, reported a slighlly lower maximum viscosity for
cassava roots pruned 4 weeks before harvest for M Per 245.
Other parameters also fluctuated with pruning without any link. Jt might be noted that the V50 and Ihe
Gelification Index for M Bra 337 stay low wilh pruning.
The temperature at which the viscosity is maximal is reflected by the Ease of Cooking, sinee the
Gelatinisation Temperature slays stable. In this experiment the parameter 'Ease of Cooking' increased
between day 8 and day 25, which means an inerease in resistance for cooking for the starch (Vmax at
higher temperature). This is in agreement with the findings of Asaoka et al (1993) who suggested Ihat
fuis might be caused by the fas ter desintegration of the starch granules which could be partly due to
Ihe fact Ihat the size of the starch granules decrease with pruning (Asaoka et al 1993).
It is assumed Ihat the gelification process is influenced by Ihe amylose content (Rickard, 1990,
Dickenson, 1982). However, there was no relation found in this experiment between neither of the
pasting characteristics and the amyJose conten!. Probably other faetors like weak intermolecular forces
or fatty acid-amylose cOl11plexes playa role (Whistler et al, 1984).
Generally, it might be concluded tha! there must be olher non-identified factors which cause the
considerable f1uctuations in the straeh properties. It might be Ihat endaphoclimatic factors playa role,
as Ihey are known to influence (he gelatinisation properties (Asaoka et al 1992).
3.5.4 Role oC physicochcmical propcrties in organoleptic changes
Physicochemical properties 111 ight be expected to contribute to organoleptic perception. However, the
results of Ihe limited work done in this area have been ambivalent. Research by Asaoka et al (1991,
1992, 1993) with CIAT (1988) did not elucidate any relationship between organoleptic quality and
physicochemical properties.
27
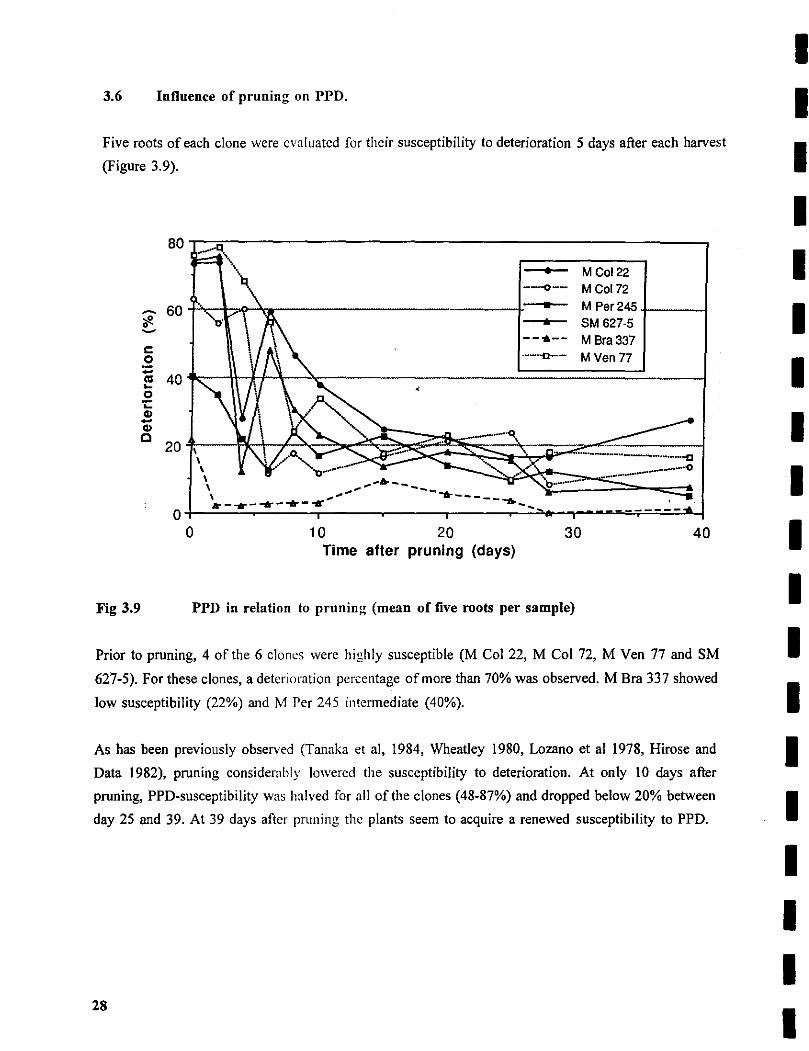
3.6 Inflnence oC prnning 00 PPD.
Five roots of each clone were evaluated for their susceptibility to deterioration 5 days after each harvest
(Figure 3.9).
c: o
80.-~------------------------------------------~
• M Col 22 ---o-- M Col 72
• M Per245
* SM 627·5 ---6-- M 8ra337 ---'-n-- M Veo 77
~ 40~~~~\-~~----------------==========~----~ o ;: CI) -CI)
e 201\\\--~~~~~~~~~~~~~~~~~~~~~_ .. ~ .... ~._=--=-_: .. _~;'._~_:._.=-.=-~;l \ __ '-'0 \ ............. . ......... _ ... -. \ \ .... ,.... ....------. k- ... - .... - .... -... .... .... _
O+-~~~----.-----~---.r---~~~-.-~~=-=--~-~-~-~-~
O 10 20 30 40 Time afler pruning (days)
Fig 3.9 PPD in relation to prnning (mean oC five roots per sample)
Prior to pruning, 4 of the 6 clones were highly susceptible CM Col 22, M Col 72, M Ven 77 and SM
627-5). For these clones, a deterioration perceotage ofmore than 70% was observed. M Bra 337 showed
low susceptibility (22%) and M Per 245 intermediate (40%).
As has been previously observed (Tanaka el al, 1984, Wheatley 1980, Lozano et al 1978, Hirose and
Data 1982), pruning considerably lowered the susceptibility to deterioration. At only 10 days afier
pruning, PPD-susceptibility was halved for aH ofthe clones (48-87%) and dropped below 20% between
day 25 and 39. At 39 days after pruning the plants seem lo acquire a renewed susceptibility to PPD.
28
I I I I I I I I I I I I I I I I I I I
I I I I I I I I I I I I I I I I I I I
Far M Bra 337, the low susceptible variety, pruning decreases PPD to less than 4% afier 6 days, and
M Per 245, which deteriorated initially 40%, lost PPD susceptibility to 10% at 6 DA.
The delay in in the deterioration process by pruning-treatment could find application for purposes where
a longer storage period is required e.g. for starch production. Another purpose could be for urban /Tesh
markets, as the risk of rapid post-harvest deterioration has still a considarable impact on the price and
availability of fresh cassava (Janssen and WheatIey, 1985). However, before adoption thorough
examination on the
effect of pruning on eating quality is required. The little work that has been done 00 this subject
revealed ambivalent results. Asaoka et al (1993) and CIAT (1988) reported unacceptable organoleptic
changes due to the hard and glassy texture in roots from pruned plants harvested 4 weeks afier pruning,
while Data et al (1984), recorded an improvement in texture, flavour and general acceptability for
cassava pruned 1 to 3 weeks befare harvest.
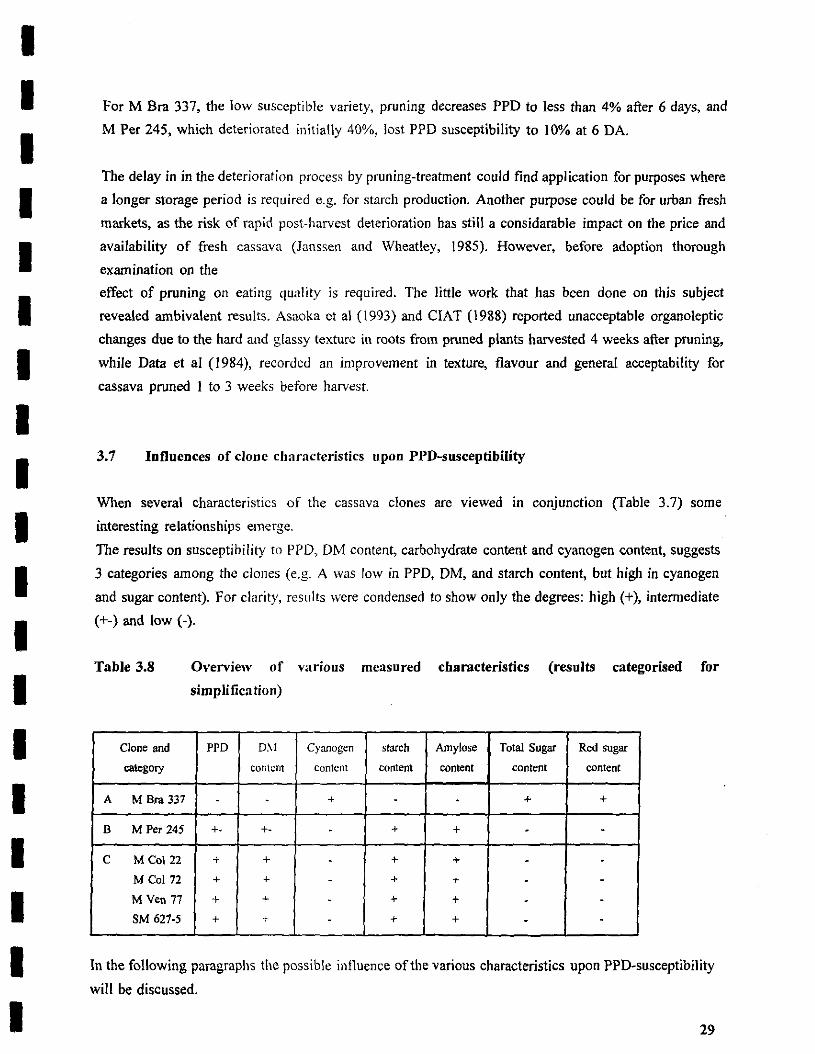
3.7 Inlluences of clone characteristics upon PPD-susceptibility
When several characteristics of the cassava clones are viewed in conjunction (Table 3.7) sorne
interesting relationships emerge.
The results on susceptibility to PPD, DM content, carbohydrate content and cyanogen content, suggests
3 categories among the clones (e.g. A was low in PPD, DM, and starch content, but high in cyanogen
and sugar content). Far clarity, rcslllts \Vere condensed to show only the degrees: high (+), intermediate
(+-) and low (-).
Table 3.8
Clone and
category
A M Bra 337
D M Per 245
C M Col 22
M Col 72
M Ven 77
SM 627·5
Overview of various rneasured characteristics (results categorised for
simplification)
PPD D~I Cyanogcn starch Amylose Total Sugar Red sugar
content contcnt content content content content
- . + - - + +
+- +. - + + . -+ + - + + - -+ + - + + . -+ + - + + - -+ + . + + - -
In the fallowing paragraphs lile passible influence ofthe various characteristics upon PPD-susceptibility
will be discussed.
29
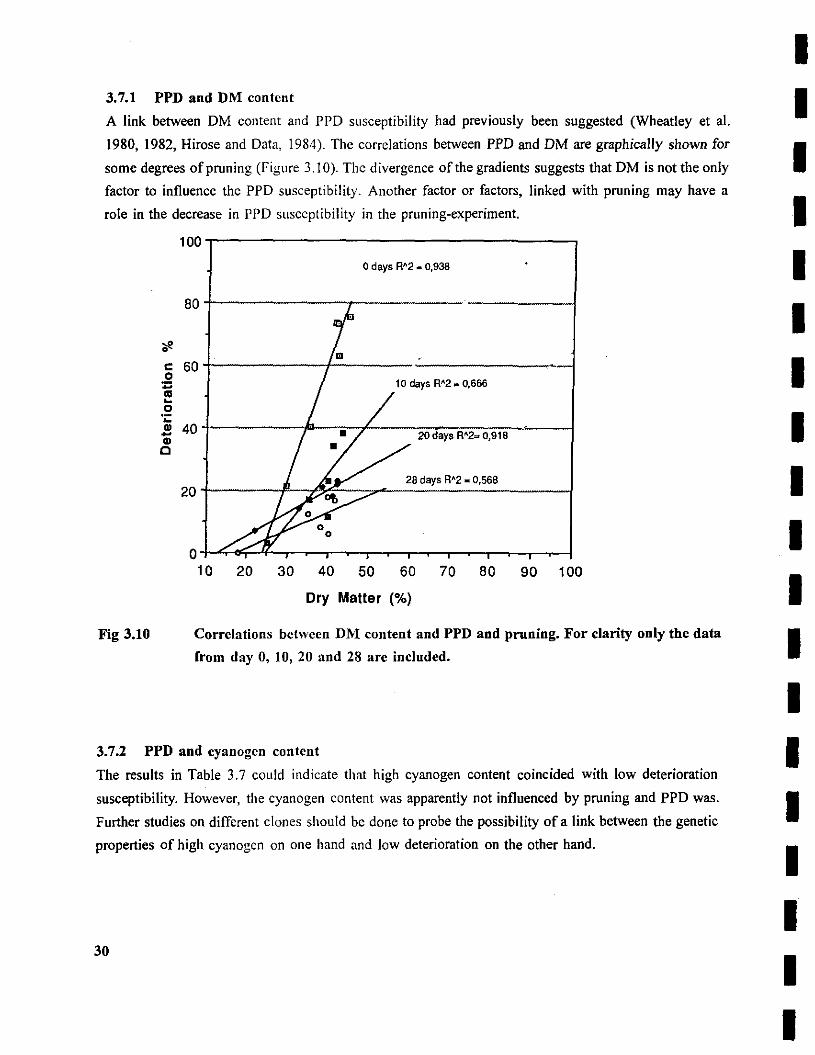
3.7.1 PPD and DM content
A link between OM content and PPO susceptibility had previously been suggested (Wheatley et al.
1980, 1982, Hirose and Data, 1984). The correlations between PPO and OM are graphically shown for
sorne degrees of pruning (Figure 3.10). The divergence of tbe gradients suggests that OM is not the only
factor to influence tbe PPD susceptibility. Another factor or factors, linked with pruning may have a
role in tbe decrease in PPO susceptibility in the pruning-experiment.
~
e o ;: al ~
o .¡: QI -QI e
Fig 3.10
100
o days R'2 _ 0.938
80
60
40 20 day. R'2= 0,918
28 days R'2 - 0.568 20
O~~~~~-.~-r~.-~~~~~~~
10 20 30 40 50 60 70 80 90 100
Dry Matter (%)
Correlations bctween DM content and PPD and pruning. For c1arity only the data
from day O, 10, 20 and 28 are included.
3.7.2 PPD and cyanogcn content
The results in Table 3.7 could indicate that high cyanogen content coincided with low deterioration
susceptibility. However, the cyanogen content was apparently not influenced by pruning and PPO was.
Further studies on different clones should be done to probe the possibility of a link between tbe genetic
properties of high cyanogen on one hand and low deterioration on the other hand.
30
I I I I I I I I I I I I I I I I I I I
I I I I I I I I I I I I I I I I I I I
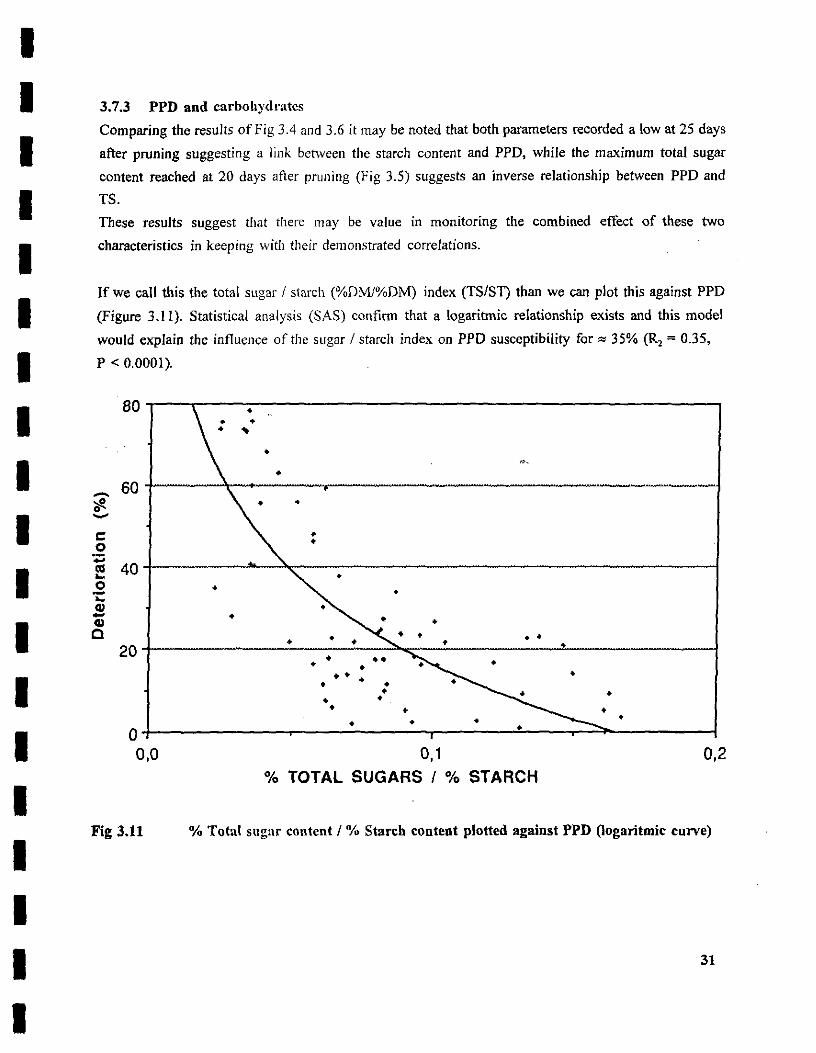
3.7.3 PPD and carbohydratcs
Comparíng the results of Fig 3.4 and 3.6 it may be noted tha! both parameters recorded a low at 25 days
after pruning suggesting a link between the starch canten! and PPO, whíle the maximum total sugar
content reached at 20 days after pruning (Fig 3.5) suggests an inverse relationship between PPO and
TS.
These results suggest that there may be value in monitoring the combined effect of these two
characteristícs in keeping with the;r demonstrated correlatíons.
If we call this the total sugar I starch (%DM/%DM) index (TS/ST) than we can plo! this against PPD
(Figure 3.11). Statistical analysis (SAS) confirm that a logaritmic relationship exists and this model
would explain the influence of the sugar I starch index on PPO susceptibility for'" 35% (R, = 0.35,
P < 0.0001).
80'-~'---~.--------------------------------------~
..... 60 ;,!! o ...... e o .. o:J 40 ~
o • -.: CII -CII e
20
• .. •
•
• •
•
• •
•
• • •
O+-----------~--~------r-----~--~~~------~ 0,0 0,1 0,2
% TOTAL SUGARS I % STARCH
Fig 3.11 % Total sllgar content I % Starch content plotted against PPD (logaritmic curve)
31
~ ~
1: O :;:: .. .. O ;: ., -., e
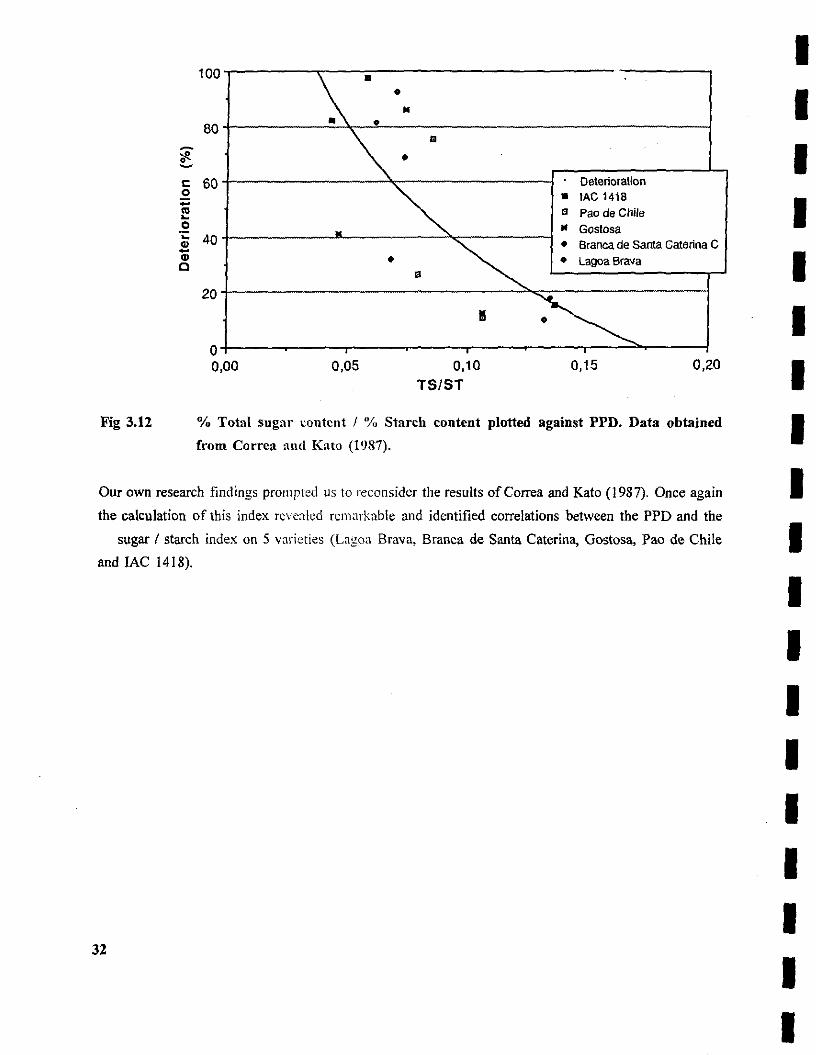
Fig 3.12
100
80
60
40
20
o 0,00
.~ •
• .. •
~ ..
•
.. ~ •
, 0,05
" ~ I!
, 0,10
TS/ST
Deterioration • IAC 1418 " Pao de Chile .. Gastosa • Branca de Santa Catertna C • Lagoa Brava
~ 0,15 0,20
% Total sugar coutent I 'Y., Starch content plotted against PPD. Data obtained
from Correa and Kato (1987).
Our own research findings prompted LIS lO reconsider the results ofCorrea and Kato (1987). Once again
the calculation of this index. revealed remarkable and identified correlations between the PPD and the
I I I I I I I I I
sugar I starch index. on 5 varicties (Lagoa Brava, Branca de Santa Caterina, Gostosa, Pao de Chile I and IAC 1418).
32
I I I I I I I I I
I I I I I I I I I I I I I I I I I I I
CONCLUSION
The experiment, which in volved lhe prc-harvest pruning of plants of six cassava clones, confinned the
long-held view that pre-harvesl pruning eonsiderably lowers post-harvest physiological deterioration
(PPD) susceptibility in cassava rools. As early as 8 days afier pruning, PPD-suceptibility was
substantially reduced or retarded in roolS of all six clones. Between day 25 and day 39, PPD
susceptibility values of less than 20% werc observed for all of the clones.
Neither the mean weight of roots nor the mean number of roots per plant was significantly influenced
by the pruning treatment, and no clear effeet of pruning upon starch rheological properties was
observed. A slight deerease in D7\l-eontent was observed with five of the six clones. This tendency was
not constant, and the results obtaíned suggest that careful timing of the harvest afier pruning can
minimise, or even nullif)r, this eneet ín those clones. The clone MBra 337, already considered a low
DMC clone, underwent more cxtreme changes, with DM-content dropping by 40%. However, a
consistent decrease in starch canten!, which reaehed minimum values at days 20-25, was observed.
In using pre-harvest pruning as a tool towards improved post-harvest storability, it would therefore be
necessary to balance foreseeabk gains (e.g. 2-3 days increased storability, or 20% more utilisable
parenchyma) against forseeablc losses (e.g. a starch content decrease of 20%). The recommended
approach would be to "fine tune" the prc-harvest pruning period in order to maximise gains and
minimise losses. Whilst further cxperimentatíon involving other clones is required in order to confinn
the results presented in this reporto an optimal interval between pruning and harvest would probably lie
somewhere between 1 and 3 \Veeks.
The use of pre-harvest pruntng ís also convenient In situations where mechanised harvesting is
practiced, and could be advanta~eolts in ccrtain intercropping systerns, although it should be applied
with great care in sorne hillside t¡lrining systems where soil erosion can be a major problem.
The observed post-pruning decrcase in starch content coincided with increased levels of total sugars,
which reached peak content at ar"ltnd day 20, roughly coinciding with the lowest starch levels. Jt was
also observed that the pruned cassava plants began to produce new leaf shoots from around day 6 afier
pruning. The most likely explanalíon of the reduction in starch levels and concomitant increase in sugars
in the pruned plant, is that, to satisfy the plan!'s increased metabolic energy requirernent in order to
produce new leaves, stareh in the stmagc roots would be hydrolysed to produce sugars.
33
Whilst there has been sorne debate regarding the importance of the DM content in determining PPD
susceptibility, a certain relationship \Vas obscrved in this experiment, between the sugar/starch ratio in
the roo! parenchyma and PPD-Sllsceptibility, regardless of pruning (R'2 =035, P < 0,001), Whilst
subject to further investigation, lhe sllgarlstarch ratio should perhaps be inc1uded as a factor in the
screening of cassava for PPD-sllsceptibility.
34
I I I I I I I I I I I I I I I I I I I
I I I I I I I I I I
I I I I I I I I I
SUGGESTIONS FOR FURTHER RESEARCH
PPD and sugarlstarch indcx
Further investigations on the sugar/slarch index and deterioration, ineluding different elimate influenees.
Pruning and plant physiology
Caleulations of biomass lransport in lhe plant afier pruning by observations and analyses of the new
shoots and leaves. This may help to elucida!e the ehanges in earbohydrate contents of (he roots.
Pruning and eatiug quality
Cooking and eating quality tests in relation to pruning.
Measurements of fiber eontent, peetin alld other eassava flour substanees. Relate fiber and peetic
substances to organoleptic properties.
Pruning flour cbaracteristics lInd baking qualities
Investigations on the qual ¡ty of cassava flour e.g. breadmaking, rheologieal and physicoehemical
properties.
Pruning application at tite farm and in the field
Experiments on applicatiol1 of prul1ing by farmer. Investigation on the yield and the efforts of the
farmer. Subjects: Intercropping and mechallised harvestlng.
Cassava starcb product development .' ort of cassava roots . v in ost-harvest physiological detenoratlOn, transp
Now !hat prunmg causeS a dela, p h d ction and develpoment of new products . 'bl Th' would enable lar"c scale cassava starc pro ti , 15 pOSSI e. 15 '"
would be nece55ary.
35
REFERENCES
Asaoka, M., Blanshard, 1.M.v. and Rickard J.E. "Effects of Cultivar and Growth Season on the
gelatinisation Properties of Cassava (Manihot esculenta) Starch", Joumal of the Science of Food and
Agriculture, Vol. 59, 1992, p. 53-58.
Asaoka, M., Blanshard, J.M.v. and Rickard J.E. "Seasonal effects on the Physicochemical Properties
of Starch from Four Cultivars of Cassava", Stareh/SUirke, Vol. 43, 1991, No. 12, p. 455-459.
Asaoka, M., Blanshard, lM. V. and Riekard J.E. "The effect of pre-harvest pruning on the quality of
saecava starch", Annals of Applied Biolo!2v, vol. 122, 1993, no. 2, p.337-344.
Belitz, H.D, and Grosch, W. rood Chemistry, p. 245-252. Springer-Verlag, Berlin, Heidelberg, 1987,
774 p.
Best, R., Wheatley, C. and Chuzel G. "A produet development approach to eassava utilization", Joumal
ofRoo! Crops ISCR Nat. Sym., Speeial, 1990, p. 237-248
Boursier, B. "Applieations alimentaires des amidons modjfiés", IAA, Septembre, 1994, p. 583-592.
CIAT, Cassava Program Anl1lwl Report 1994, Centro Internacional de Agricultura Tropical, AA 6713,
CaH, Colombia (in press).
CIAT, 1988, p. 356-35&. In: Cassava Program Report 1987-1989, Centro Internacional de Agricultura
Tropical, AA 6713, Cali, Colombia, Working document No. 91.
Cock J.H. New potential for n neglected crop Westem Press B Id e 1 . " ou er, 00,1985.
Correa H. and Kato M.S.A. "Efeito da poda na conservacao
Informe Agropecuario, 1987, Vol. 13 1987, No. 145, p. 17-18. e qualidade de raizes de mandioca" ,
Data, E.S., Quevedo, M.A, Gloria, L.A. "Pruning techniques affee!' th . harvest and subsequellt stora"e" p 127 14" 1 U.. mg e root quahty of cassava at
"',. - J. n: Tltam,I andReyes ED (d)T . Crops:postharvest physiolo!l:v and processing Tokyo Japan S~ientific S : t . p' e s romeal Root
" OCle y ress, 1984.
Dickenson E., KcKay J.E. and Thomas v.D., 1982. Viseometric st " gelatinised cassava stareh. Lebensl11ittel_ Wissenschaft udy of the dlspesTlon of whole and
und Technologie. 15 (4) 242-244.
36
I I , I I I , I I I
.. I l!!!!! .. = I = -iii --¡¡¡ ;;
I ~
""---, I I I I I
I I I I I I I I I I I I I I I I I I I
Essers, A. J. A., M. Bosveid, R. M. van der Grift and A. G. J. Voragen, 1992. A new chromatogen for
the assay of cyanogens in cassava products_ Fifth Triennial Symposium Of the International Society for
Tropical Root Crops, Africa Branch, Kampala, Uganda, Nov. 1992.
FAO (Food and Agricultural Organization ofthe United Nations) 1995 Faostat, Rome.
Grace M.R., 1977. Cassava processil1~. F.A.O., Rome, Italy. 155pp. Pp 5·11.
Hirose S. and Data E.S., 1982. Pi1ysiology of post·harvest deterioration of cassava rools. Bio·resources
investation on oroductiol1. stora~e. processing and vegetation of root croos in the trapíes. Interim reporto
p 1·21.
Hirose S. and Data E.S., 1984. Physiology ofpostharvest deterioration ofcassava roots. Tropical Root
Croos: Postharvest Phvsiolo!!v and Processing. (Uritani L & Reyes E.D., eds.) Jap. Sei. Soco Press,
Tokyo Japan. pp 37·5 l.
Iglesias C.A. Calle F., Hersl1ey C. Jaramillo G. Mesa E. 1994. Sensitivity of cassava (Manihot·Esculenta
Crantz) clones to environmental changes. Field croos Research 36 (3):213·220.
Janssen, W. and Wheatley, C. "Urban cassava markets; The impaet of fresh root storage", Food Policy,
Vol 10, 1985, No. 3, p. 265·277.
Kato, M.A., Carvalho, V.O., Corréa, H. and Pinto, J.E.B.P. "Efeito da poda na deterioraqao fisiologica
e na qualidade de raízes de mandioca (Manihot Esculenta Crantz)", Cienc. Prá!. Lavras, vol. 11, 1987,
no. 1, p. 75·84.
Lozano, J.C., Cock, J.H and Costana, 1. "Nuevos avances en el almacenamiento de yuca", Fitopatologia
Colombiana. Vol. 7, p. 2·14.
O'Brien G.M. "Modificatíon and Application of an Enzymic Assay for Cyanogens in cassa", Ph. D
thesis. University of Nottingham, UK, 1991.
Onweare LC. The tropical t"ber erops, John Wiley & Sonso Chichester, U.K., 1978, 234 pp. p. 31·33;
133· 135; 176.
Rickard, J.E. "Quality aspects ot- tropical roo! erap starches", Journal of Root Crops, ISCR Nat. Sym.
Special, 1990, p. 227·232.
37
Rickard J.E. and Coursey D.G. "Cassava storage. J. Storage of fresh cassava roots", Tropical-Science.
Vol. 23, 1981, No. 1, 1-32.
Tanaka, Y., Data, E.S., Lape V.G., Vil legas C.D., Gorgonio, M., Hirose, S. and Uritani, I. "Effect of
pruning treatment on physiologícal deteríoration in cassava roots", Agricultural and Biological
Chemistry, vol. 48, 1984a, no. 3, p. 739-743.
Wenham, J.E. Post-harvest deterioration of cassava; A biotechnology perspeetive, FAO plant produetion
and protection paper, No. 130, NRI, Chatham, UK / FAO, Rome, 1995, ISBN 92-5-103607-1, 85 p.
Wheatley C. "Studies related with the nature of post-harvest physiological deterioration in cassava
roots", CPublicationl-Centro-ínternacíonal-de·Agricultura-Tropical. AA 6713, Cali, Colombia, 1980, SE-
16-80.
Wheatley, C.C. and Schwabe, W. W. "Scopoletin involvement in post-harvest physiological deterioration
of cassava root (Manihot Escule,ua Crantz)", loumal of Experimental Botany, vol. 36, 1981, no. 166,
p. 783-791.
Wheatley, a.c., Lozano, J.C. lvIariott, 1 and Schwabe, W.W. "Pre-harvest environmental affects on
eassava root suseeptibility to post-harvest physiological deterioration", p. 419-429. In Proeeedings: sixth
symposium ofthe lnternational Society for Tropical Root Crops. Lima, Peru, 1983. Lima, Internatíonal
Potatoe Center.
Wheatley, C.C. Studies on cassava (Manihot Esculenta Crantz) root post-harvest physíological
deterioratíon. Ph.D.Thesís, Univcrsity of London, London, 1982, 246 p.
Wheatley, C.C., Lozano, C. and Gómez, G. "Post harvest deterioratíon of eassava roots", p. 655-671.
In: Cassava: Research. Production and Utilization, Preliminary Edition by Coek J.H. and Reyes l.A.
UNDP-CIAT, Editorial XYZ, Cali, Colombia, 1985,745 p.
Whistler, R.L, Benmiller, J.N. ami Paschall, E.F. "Enzymes in the hydrolysis and synthesis of stareh"
p.85-118. In:Starch: Chemistrv and Teclmology. 2nd edition, Academie press ine. London LID, 1984,
718 p.
Zapata, M.L.E. and Riveros, S.H. "Preservation of fresh cassava", Anales del Tercer Seminario
Avanzado de Tecnología de Alim~ntos, 1979, p 209-224.
38
I I I I I I I I I I I I I I I I I I I
I I I I I I I I I I I I I I I I I I I
APPENDIX 1
Reageots to determine the cyanogcn content
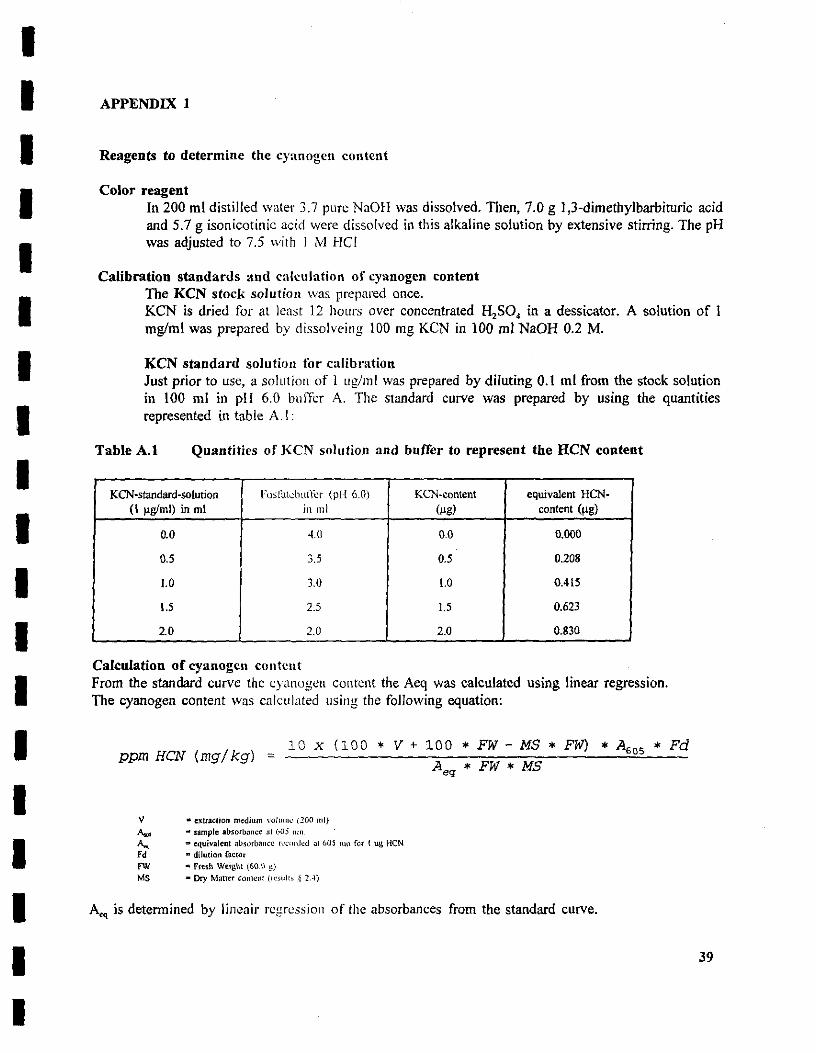
Color reageot In 200 mi distilled water 3.7 pure NaOH was dissolved. Then, 7.0 g J,3-dimethylbarbituric acid and 5.7 g isonicotinic acid were dissolved in this alkaline solution by extensive stirring. The pH was adjusted to 7.5 wilh I M HCI
Calibratioo standard s and calculation of cyanogeo cooteot The KCN stock solution was prepared once. KCN is dried for at least 12 hOllrs over concentrated H2SO, in a dessicator. A solution of I mg!ml was prepared by dissolveing 100 mg KCN in 100 mI NaOH 0.2 M.
KCN staodard solutiou for calibratíon Just prior to use, a solution of 1 ug/ml was prepared by diluting 0.1 mI trom tbe stock solution in lOO mi in pH 6.0 bllffer A. The standard curve was prepared by using the quantities represented in table A.I:
Table A.l Quantities of KCN solutíon and buffer to represent the HCN content
KCN-standard·solution Fo:;l~lk:bufrer (pI-[ 6.0) KCN·content equivalent HCN-(1 ~g1ml) in mI in 1111 (~g) content (~g)
0.0 4.0 0.0 0.000
0.5 3.5 0.5 0.208
1.0 3.0 1.0 0.415
1.5 2.5 1.5 0.623
2.0 2.0 2.0 0.830
Calculation oC cyanogcn contcnt From tbe standard curve the cyanogen content the Aeq was calculated using linear regression. The cyanogen conten! was calculated lIsin!,!; the following equation:
ppm HCN (mg/ kg) = 10 x (lOO * V + 100 * FW - MS * FW) * A6 0S * Fd
v .... A... fd fW MS
• cxtcaclion medillm \'olulIl~' (200 1111) .. Silmpre absorb<!nce ;/, 605 lun
'" equivalenl ilbsorbal1(c r~'~'III-dcd al 605 HUI for t u~ HCN .. dílu(ian (actC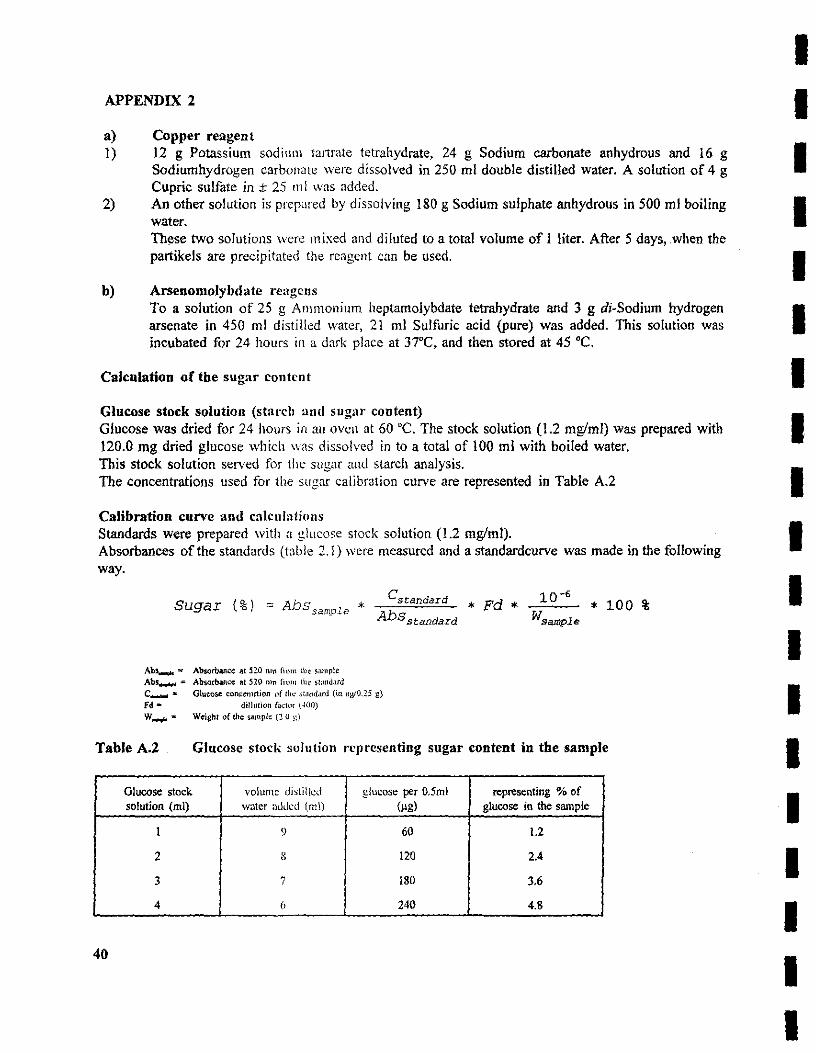
APPENDIX 2
a) 1)
2)
b)
Copper reagent 12 g Potassium sodiulll tamate tetrahydrate, 24 g Sodium carbonate anhydrous and 16 g Sodiumhydrogen carbonate were dissolved in 250 mI double distilled water. A solution of 4 g Cupric sulfate in ± 25 111 I was added. An other solution is prepared by dissolving 180 g Sodium sulphate anhydrous in 500 mI boiling water. These two solutions "ere Illixed and diJuted to a total volume of 1 liter. Afier 5 days, when the partikels are precipitated the reagent can be used.
Arsenomolybdate r~agel1s To a solutíon of 25 g All1l11onium heptamolybdate tetrahydrate and 3 g di-Sodium hydrogen arsenate in 450 mI distiUed water, 2 ¡ mi Sulfuric acid (pure) was added. This solution was incubated for 24 hours in a dark place at 37°C, and then stored at 45 oC.
CaJculation of the sugar content
Glucose stock solution (starch aUlI sugar content) Glucose was dried for 24 hours in al1 Oven al 60 oC. The stock solution (1.2 mglml) was prepared witb 120.0 mg dried glucose which \Vas dissolved in lo a total of 100 mI with boiled water. This stock solution served for Ihe sllgur and starch analysis. The concentratíons used for the sl/gar calibration curve are represented in Table A.2
Calibration curve and calculatíons Standards were prepared with a gil/cose stock solutíon (1.2 mglml). Absorbances of the standards (tnble 2. J) were measured and a standardcurve was made in lhe followíng way.
Sugar (%) = Abs sample '"
Absorbance at 520 nll1 fmm lhe- santp!e Absocban.:e lit 520 I'IJn fn.llll IIIC' 5!;ultiard
Cstandard
Abs standard
Gtueosc con~enlrt¡on ,lf fh~· ~t,l(1d<lfd (in \!glO.25 g) diUllti(ln fao;tm (-lOO)
Weisht oC the samph: (:! O S)
* Fd *
Table A.2 Glncosc stock solutíon rcprcsenting sugar content in tbe sample
Glucose stock vo!ume disti!!cd glucose per O.5ml representíng % of solution (mi) w~ter llddc-d (mI) (I'g) glucose in !he sample
I 9 60 1.2
2 8 120 2.4
3 7 180 3.6
4 (> 240 4.8
40
I I I I I I I I I I I I I I I I I I I
I I I I I I I I I I I I I I I I I I I
APPENDIX 3
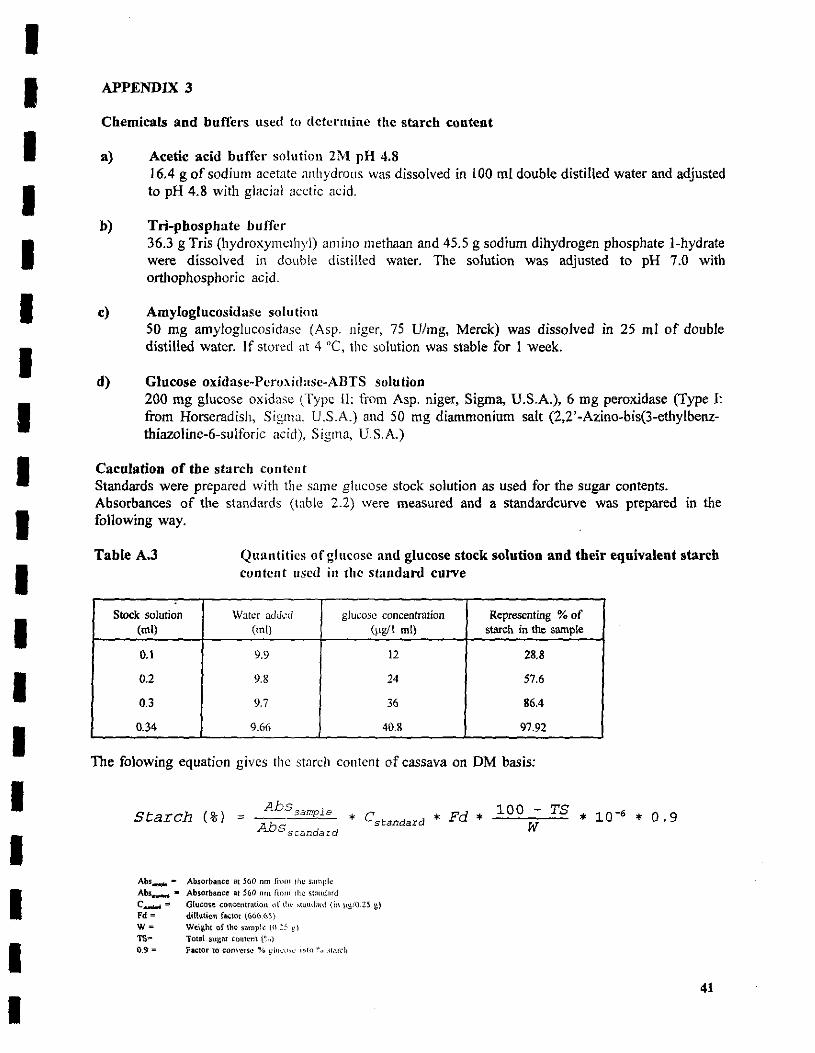
Chemieals and buffers used to determine the starch eontent
a)
b)
e)
d)
Acetie acid buffer soll1lioo 2M pH 4.8 16.4 g of sodium acetate anhydrous was dissolved in lOO mI double distiHed water and adjusted to pH 4.8 with glacial neotic acid.
Tri-phosphate buffer 36.3 g Tris (hydroxymethyl) amino methaan and 45.5 g sodium dihydrogen phosphate l-hydrate were dissolved in dOllble distilled water. The solution was adjusted to pH 7.0 with orthophosphoric acid.
Amyloglueosidase solution 50 mg amyloglllcosidasc (Asp. niger, 75 U/mg, Merck) was dissolved in 25 mI of double distilled water. If stored at 4 "C, Ihe solution was stabIe for 1 week.
Glucose oxidase-Peroxidase-ABTS solution 200 mg glucose oxidase (Typc Il: from Asp. niger, Sigma, U.S.A.), 6 mg peroxidase (Type 1: /Tom Horseradish, Sigma. U.S.A.) aud 50 mg diammonium salt (2,2'-Aziuo-bis(3-efhyIbenzfhiazoline-6-sulforic acid), Sigma, U.s.A.)
Caculation oC the starch content Standards were prepared with the same glueose stock solution as used for fhe sugar contents. Absorbances of the standards (tablo 2.2) \Vere measured and a standardcurve was prepared in the following way.
Table A.3 Quantitics ofglucosc and glucose stock solution and their equivalent starch content u"cd in the standard curve
Stock solution Water add~d gllh,::o5c concentratíon Representing % of (mi) (mi) (rlg/t mi) starch in the sample
0.\ 9.9 t2 28.8
0.2 9.8 24 57.6
0.3 9.7 36 86.4
0.34 9.66 40.8 97.92
The folowing equation gives the stareh content of cassava on DM basis:
Starch (%) = AbssamPle d * e standard * F * Abs scandard
Abs--" - AbsorbaRce at 5úO mn fWIll i!le S;lIlllllc
A~ - Absorbance al 560 nrn flom the ~(aUl!ard e ...... '" Gluc.ose c.oll<.:elttralÍO!l nI' ¡tlL- ~l,\!d;\n\ {Íl\ ~\!,;i(l.25 ¡;) Fd = l1iUutio!l fa<.:\o[ (666.65) w~
TS-0.9=
Wt.illht \)fthe Sillllpk (I\~) !'l Tot81 sugltl' Conlcnt (~,,) F.tIclor to converse '!.j, !!11I~"hL' into "" :i(;IIC)¡
100 - TS * 10-6 * 0.9 W
41
APPENDIX 4
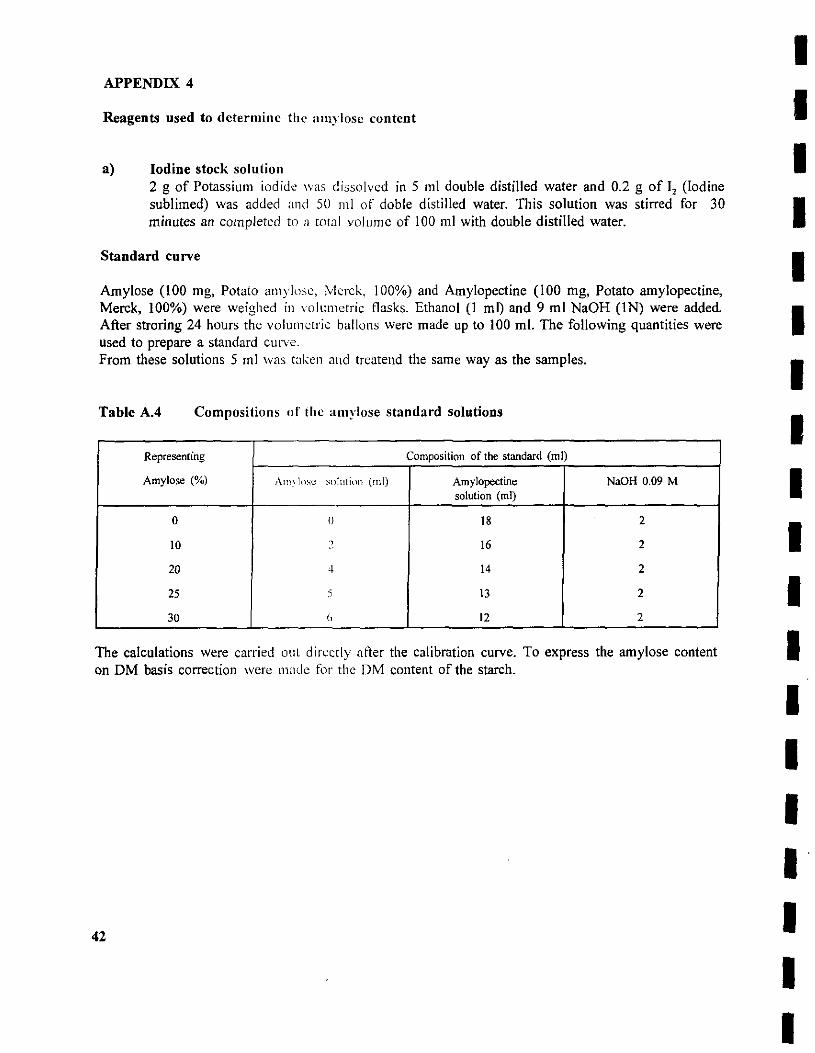
Reagents used to determine the alllylosc content
a) Iodine stock solution 2 g of Potassiulll iodide \Vas dissolved in 5 mI double distilled water and 0.2 g of 1, (Iodine sublimed) was added "nel 50 mI of doble distilled water. This solution was stirred for 30 minutes an completed to a total volume of 100 mI with double distilled water.
Standard curve
Amylose (100 mg, Patato am)'lo,e, Mcrck, 100%) and Amylopectine (100 mg, Potato amylopectine, Merek, 100%) were weighed in volumetric flasks. Ethanol (1 mI) and 9 mI NaOH (IN) were added. Afier stroring 24 hours the volul11etric ballons were made up to 100 mI. The following quantities were used to prepare a standard curve. From lhese solutions 5 mI vvas taken and treatend the same way as the samples.
Table AA Compositions ,,1' the amylose standard solutions
Representing Composition of the standard (mI)
Amylose (%) Am~ IllSC so!uti@ (mI) Arnylopectine NaOH 0.09 M solution (mI)
O O 18 2
10 2 16 2
20 ,1 14 2
25 j 13 2
30 (, 12 2
The calculations were carried out directly atter the calibration curve. To express the amylose content on DM basis correction vvere m,¡t\c lé)r the DM content of the stareh.
42
I I I I I I I I I I I I I I I I I I I
I I I I I I I I I I I I I I I I I I I
APPENDIX 5
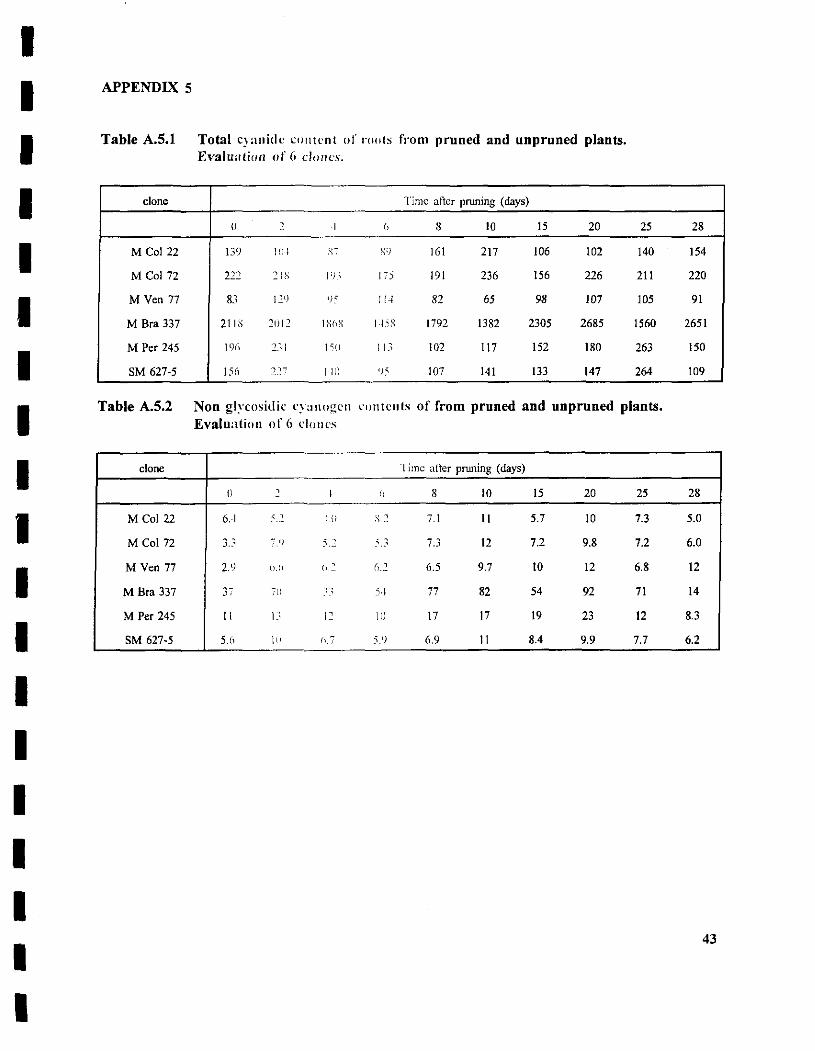
Table A.S.l Total c)"lnidc cootcnt 01" mots I"rom pruned and unpruned plants. Evaluation 01' 6 dones.
clone Time aftcr pruning (days)
U , " ~ (, 8 10 15 20 25 28
M Col 22 139 1(11- S":' Sr) 161 217 106 102 140 154
M Col 72 222 21S 1';3 175 191 236 156 226 211 220
M Ven 77 8.3 12\) ()5 ¡ l-f 82 65 98 107 105 91
M Sra 337 2110 2(}1~ lShX I~'S 1792 1382 2305 2685 1560 2651
M Per 245 1% 231 ISO 113 102 117 152 180 263 150
SM 627·5 156 'lY-;- j-HJ ()) 107 141 133 147 264 109 --
Table A.S.2 Non glycosidic "!anogen contcnts 01' from pruned and unpruned plants. Evaluatioll 01' (, dOlles
clone Time afler pruning (days)
O , ~ " 8 10 15 20 25 28 -
M Col 22 6A ' , -1.{; .'\2 n 11 5.7 10 7.3 5.0
M Col 72 .l .. ' 7.li 5.2 :'.3 7.3 12 7.2 9.8 7.2 6.0
M Ven 77 2.9 ll.ll {l.:'. (,.2 6.5 9"7 10 12 6.8 12
M Sra 337 o, - 11 . " 5 .. 1 77 82 54 92 71 14
M Per 245 I1 l.' l' 111 17 17 19 23 12 8.3
SM 627-5 5.6 jl,1 (1,; 5. 1) 6.9 11 8.4 9.9 7.7 6.2
43
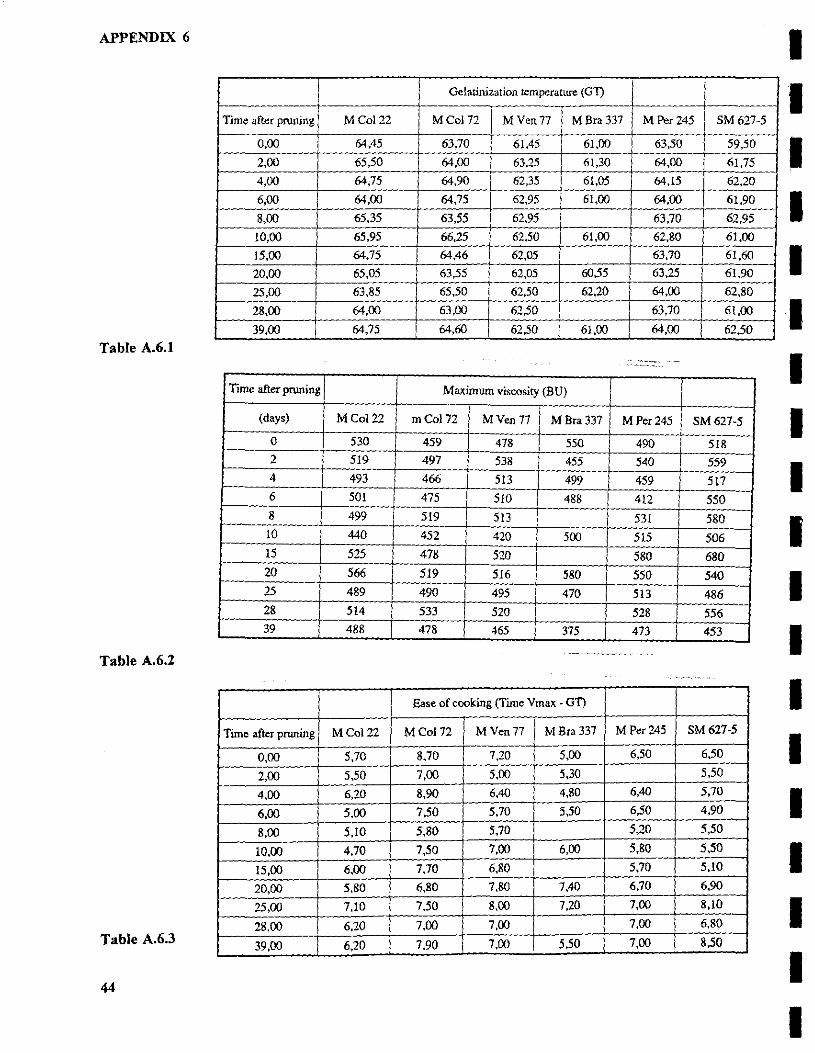
APPENDIX 6
Time after pruning M Co122
0,00 64,45
2,00 65,50
4,00 64,75
6,00 64,00
8,00 65,35
10,00 65,95
15,00 64,75
20,00 65,05
25,00 63,85
28,00 64,00
39,00 64,75
Table A.6.1
Time afier pruning
(days) M Col 22
O 530
2 519
4 493
6 501
8 499
10 440
15 525
20 566
25 489
28 514
39 488
Table A.6.2
Time after pruning M Col 22
0,00 5,70
2,00 5,50
4,00 6,20
6,00 5,00
8,00 5,10
10,00 4,70
15,00 6,00
20,00 5,80
25,00 7,10
28,00 6,20 Table A.6.3 39,00 6,20
44
Gelatinization temperature (G1)
M Col 72 M Ven 77 MBra 337 M Per245 SM 627-5
63,70 61,45 61,00 63,50 59.50
64,00 63,25 61,30 64,00 61,75
64,90 62,35 61,05 64.15 62,20
64,75 62,95 61,00 64,00 61.90
63,55 62,95 63,70 62,95
66,25 62,50 61,00 62,80 61,00
64,46 62,05 63,70 61,60
63,55 62,05 60,55 63,25 61,90
65,50 62,50 62,20 64,00 62,80
63,00 62,50 63,70 61,00
64,60 62,50 61,00 64,00 62,50
Maximum viscosity (BU)
m CoJ 72 M Ven 77 MBra337 M Per245 SM 627-5
459 478 550 490 518 497 538 455 540 559 466 513 499 459 517
475 510 488 412 550 519 513 531 580 452 420 500 515 506 478 520 580 680 519 516 580 550 540 490 495 470 513 486
533 520 528 556 478 465 375 473 453
Ease of coo!cing (Time Vma, • G1)
MCol72 M Ven 77 MBra 337 MPerZ45 SM627-5
8,70 7,20 5,00 6,50 6,50
7,00 5,00 5,30 5,50
8,90 6,40 4,80 6,40 5,70
7,50 5,70 5,50 6,50 4,90
5,80 5,70 5,20 5,50
7,50 7,00 6,00 5,80 5,50
7,70 6,80 5,70 5,10
6,80 7,80 7,40 6,70 6,90
7,50 8,00 7,20 7,00 8,10
7,00 7,00 7,00 6,80
7,90 7,00 5,50 7,00 8,50
I I I I I I I I I I I I I I I I I I I
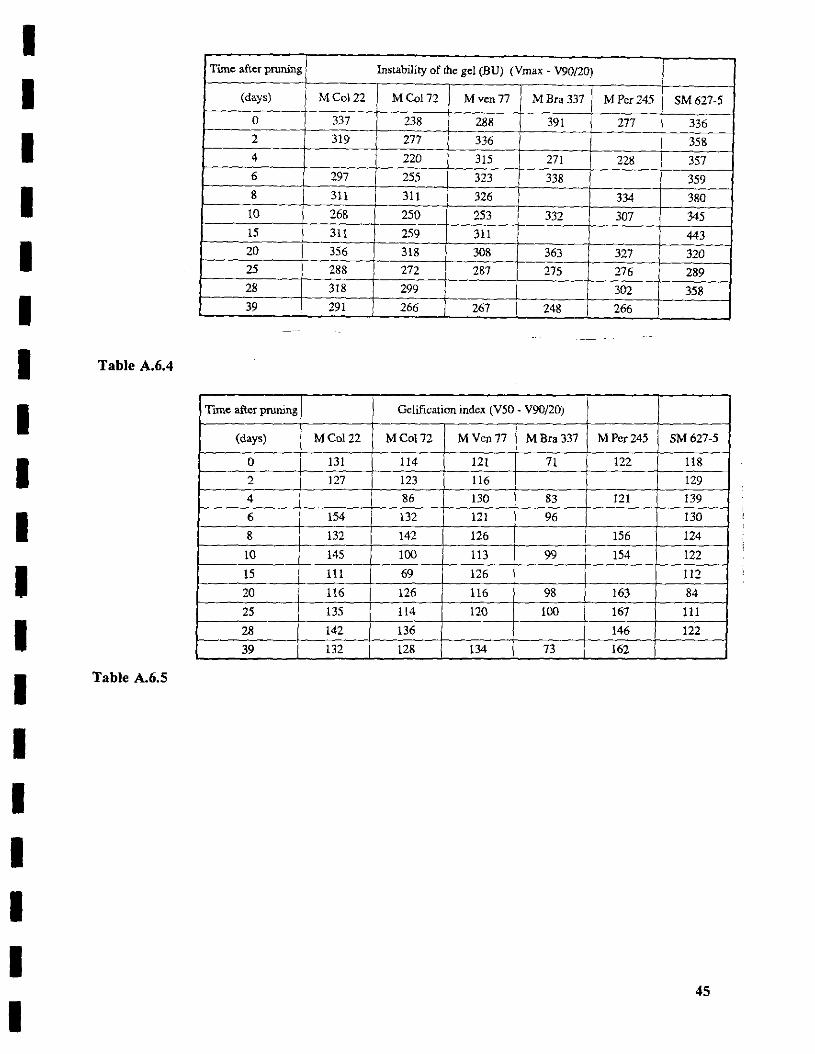
I Time after pruning Instability of fue gel (BU) (Vroax - V90/20)
I (days) MCo122 MCol72 M ven 77 M Bra 337 MPer245 SM 627-5
O 337 238 288 391 277 336
I 2 319 277 336 358 4 220 315 271 228 357 6 297 255 323 338 359
I 8 311 311 326 334 380 !O 268 250 253 I 332 307 345 15 311 259 311 443
I 20 356 318 308 363 327 320 25 288 272 287 275 276 289
I 28 318 299 302 358 39 291 266 267 248 266
I Table A.6.4
I Time afier pruníng Ge1ification index (V50 - V90J20)
(days) MCo122 MCol72 M Ven 77 MBra 337 MPer245 SM 627-5
I O 131 114 121 71 122 118 2 127 123 116 129 4 86 130 83 121 139
I 6 154 132 121 96 130
8 132 142 126 156 124
10 145 100 113 99 154 122
I 15 111 69 126 112 20 116 126 116 98 163 84
25 135 114 120 100 167 111
I 28 142 136 146 122
39 132 128 134 73 162
I Table A.6.S
I I I I I
45
I