Embed Size (px)
Citation preview
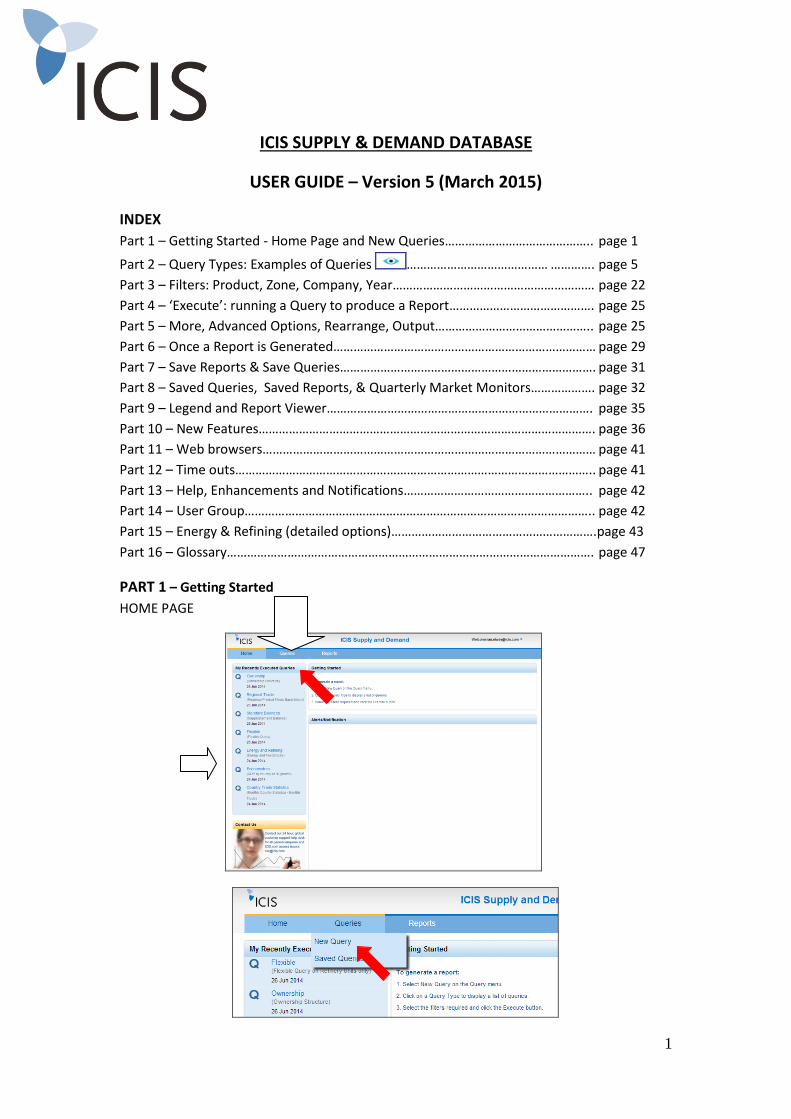
1
ICIS SUPPLY & DEMAND DATABASE
USER GUIDE – Version 5 (March 2015)
INDEX
Part 1 – Getting Started - Home Page and New Queries…………………………………….. page 1
Part 2 – Query Types: Examples of Queries …………………………………… …………. page 5
Part 3 – Filters: Product, Zone, Company, Year…………………………………………………… page 22
Part 4 – ‘Execute’: running a Query to produce a Report……………………………………. page 25
Part 5 – More, Advanced Options, Rearrange, Output……………………………………….. page 25
Part 6 – Once a Report is Generated…………………………………………………………………… page 29
Part 7 – Save Reports & Save Queries…………………………………………………………………. page 31
Part 8 – Saved Queries, Saved Reports, & Quarterly Market Monitors………………. page 32
Part 9 – Legend and Report Viewer……………………………………………………………………. page 35
Part 10 – New Features………………………………………………………………………………………. page 36
Part 11 – Web browsers……………………………………………………………………………………… page 41
Part 12 – Time outs…………………………………………………………………………………………….. page 41
Part 13 – Help, Enhancements and Notifications……………………………………………….. page 42
Part 14 – User Group………………………………………………………………………………………….. page 42
Part 15 – Energy & Refining (detailed options)…………………………………………………….page 43
Part 16 – Glossary………………………………………………………………………………………………. page 47
PART 1 – Getting Started
HOME PAGE
2
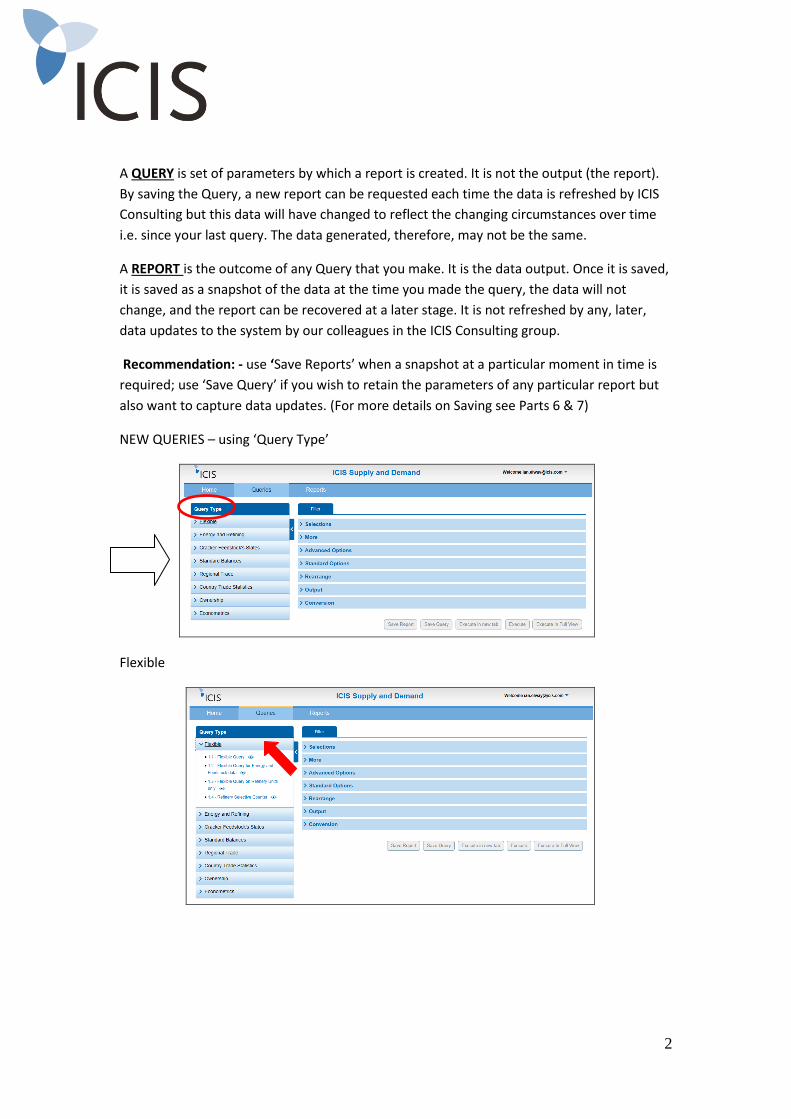
A QUERY is set of parameters by which a report is created. It is not the output (the report).
By saving the Query, a new report can be requested each time the data is refreshed by ICIS
Consulting but this data will have changed to reflect the changing circumstances over time
i.e. since your last query. The data generated, therefore, may not be the same.
A REPORT is the outcome of any Query that you make. It is the data output. Once it is saved,
it is saved as a snapshot of the data at the time you made the query, the data will not
change, and the report can be recovered at a later stage. It is not refreshed by any, later,
data updates to the system by our colleagues in the ICIS Consulting group.
Recommendation: - use ‘Save Reports’ when a snapshot at a particular moment in time is
required; use ‘Save Query’ if you wish to retain the parameters of any particular report but
also want to capture data updates. (For more details on Saving see Parts 6 & 7)
NEW QUERIES – using ‘Query Type’
Flexible

3
Energy & Refining
Note: This option is particularly detailed – see section ‘Part 15 Energy & Refining – detailed
options’.
Cracker Feedstock Slates
Standard Balances
4
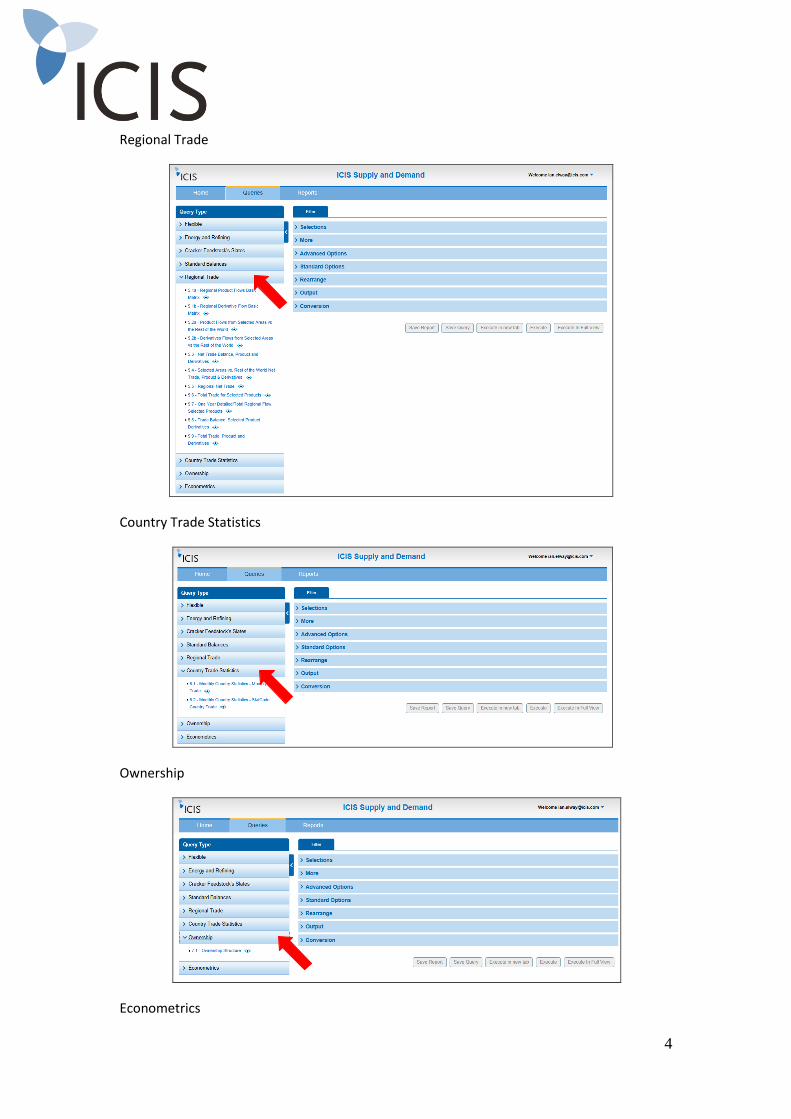
Regional Trade
Country Trade Statistics
Ownership
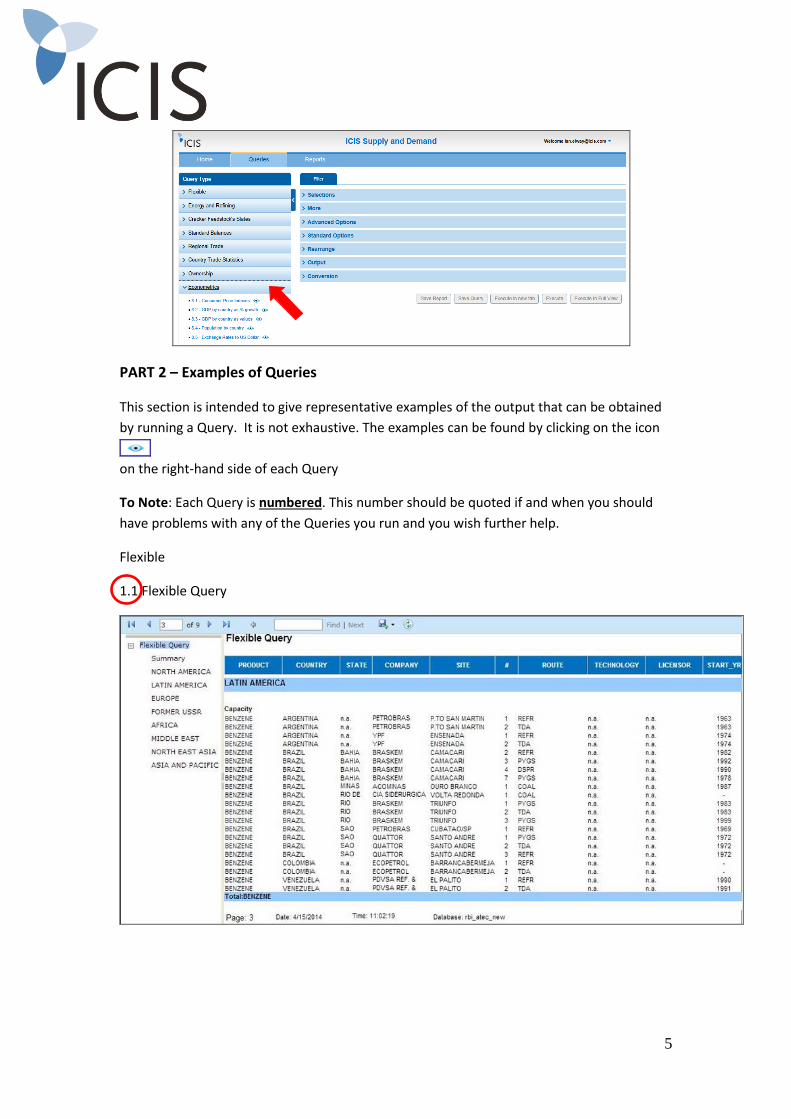
Econometrics
5
PART 2 – Examples of Queries
This section is intended to give representative examples of the output that can be obtained
by running a Query. It is not exhaustive. The examples can be found by clicking on the icon
on the right-hand side of each Query
To Note: Each Query is numbered. This number should be quoted if and when you should
have problems with any of the Queries you run and you wish further help.
Flexible
1.1 Flexible Query
6
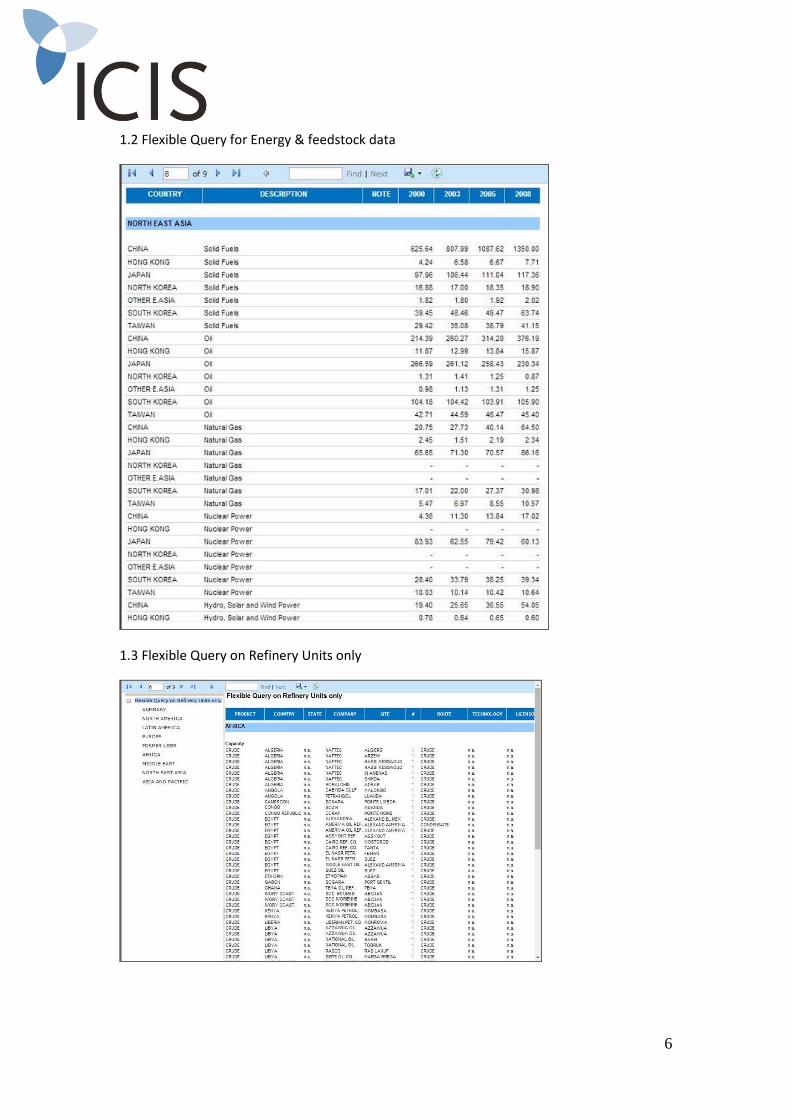
1.2 Flexible Query for Energy & feedstock data
1.3 Flexible Query on Refinery Units only
7
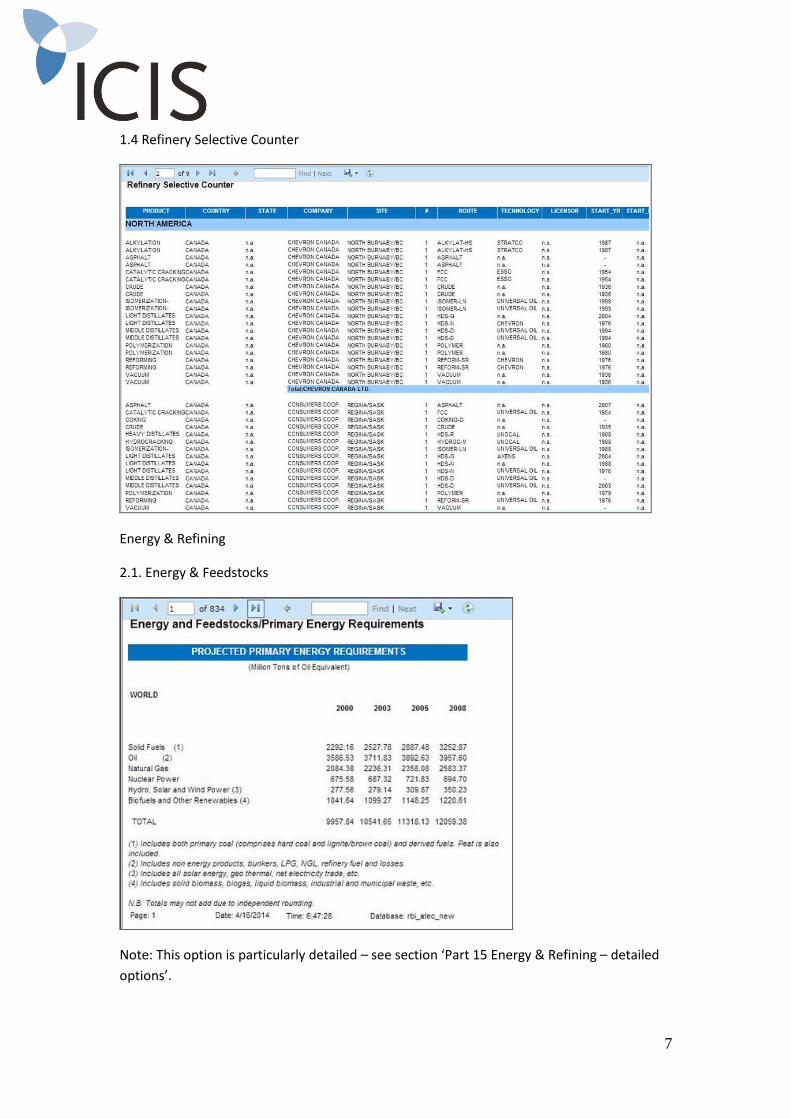
1.4 Refinery Selective Counter
Energy & Refining
2.1. Energy & Feedstocks
Note: This option is particularly detailed – see section ‘Part 15 Energy & Refining – detailed
options’.
8
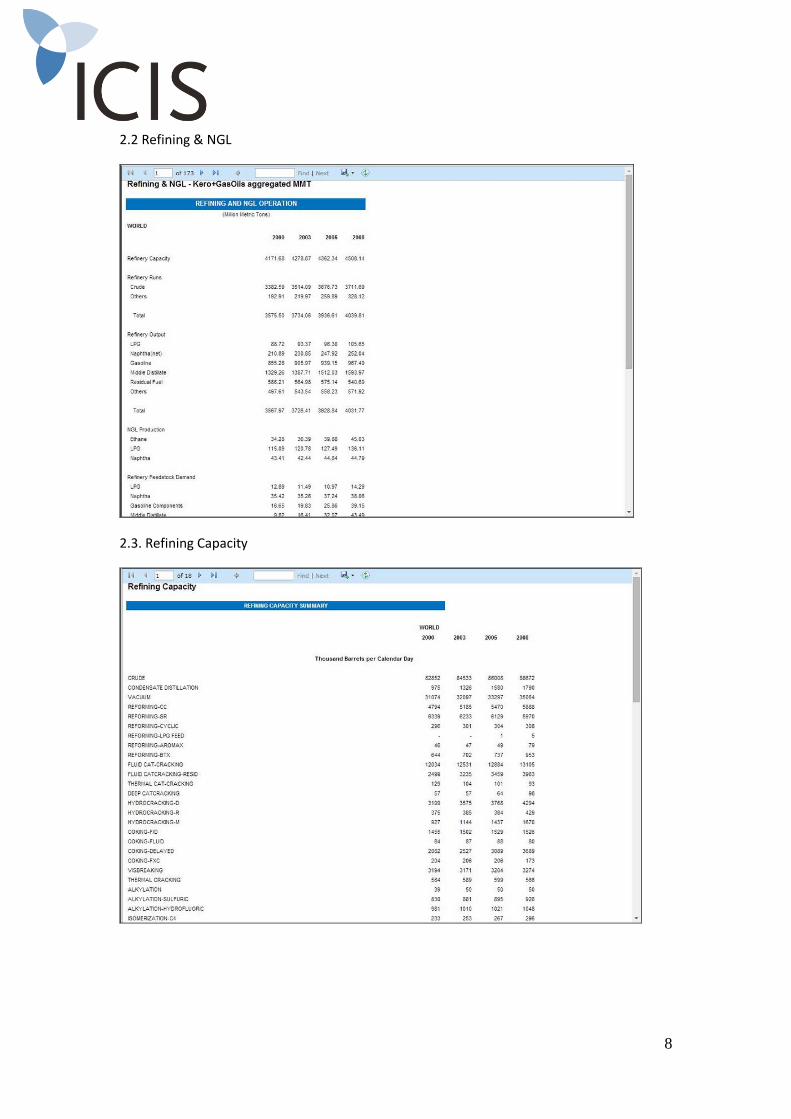
2.2 Refining & NGL
2.3. Refining Capacity
9
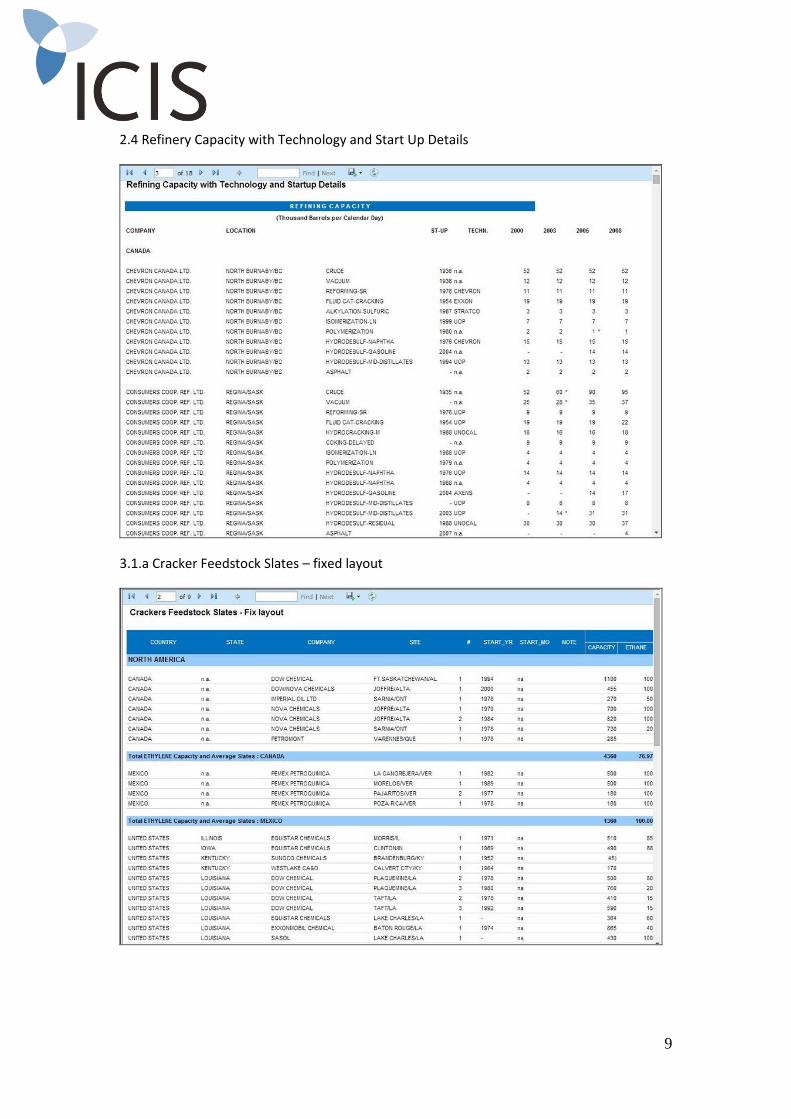
2.4 Refinery Capacity with Technology and Start Up Details
3.1.a Cracker Feedstock Slates – fixed layout
10
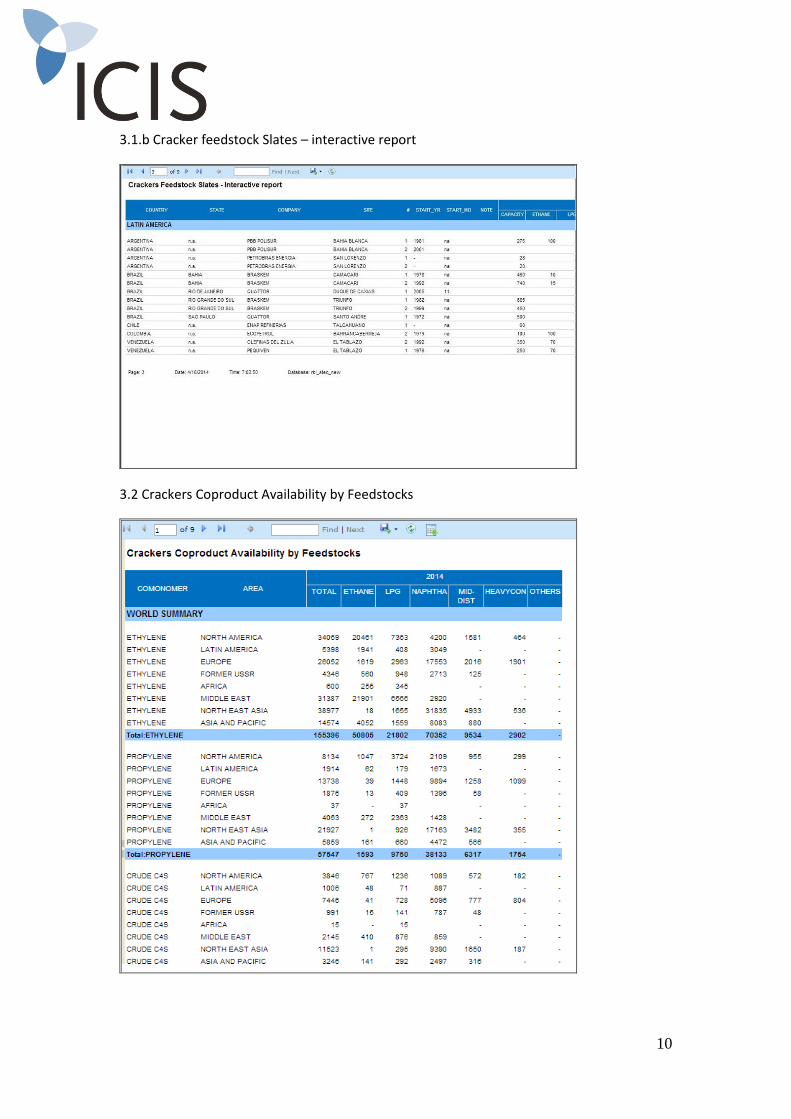
3.1.b Cracker feedstock Slates – interactive report
3.2 Crackers Coproduct Availability by Feedstocks
11
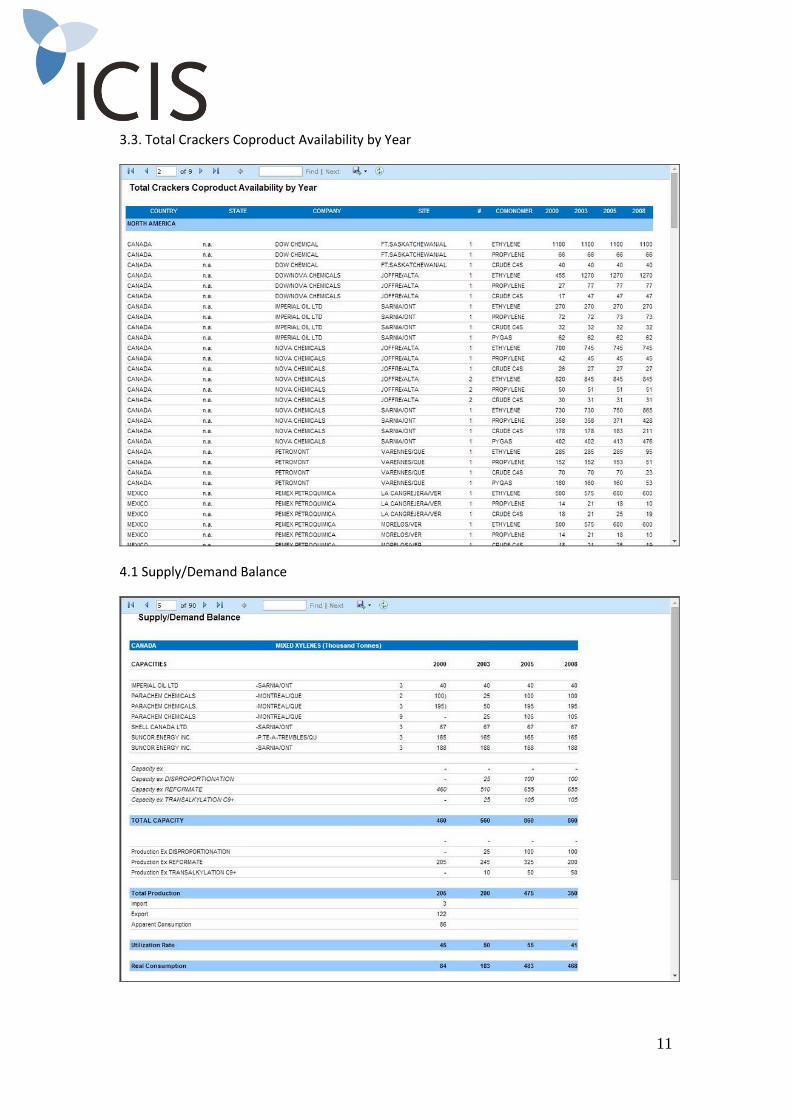
3.3. Total Crackers Coproduct Availability by Year
4.1 Supply/Demand Balance
12
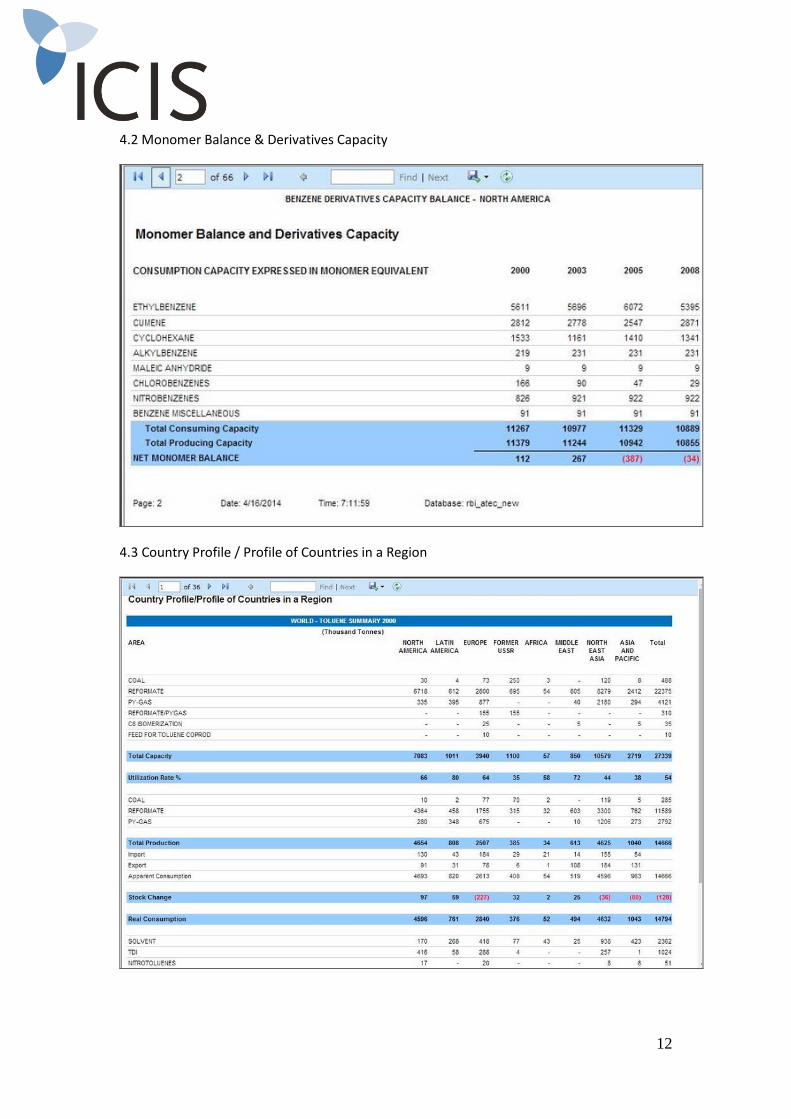
4.2 Monomer Balance & Derivatives Capacity
4.3 Country Profile / Profile of Countries in a Region
13
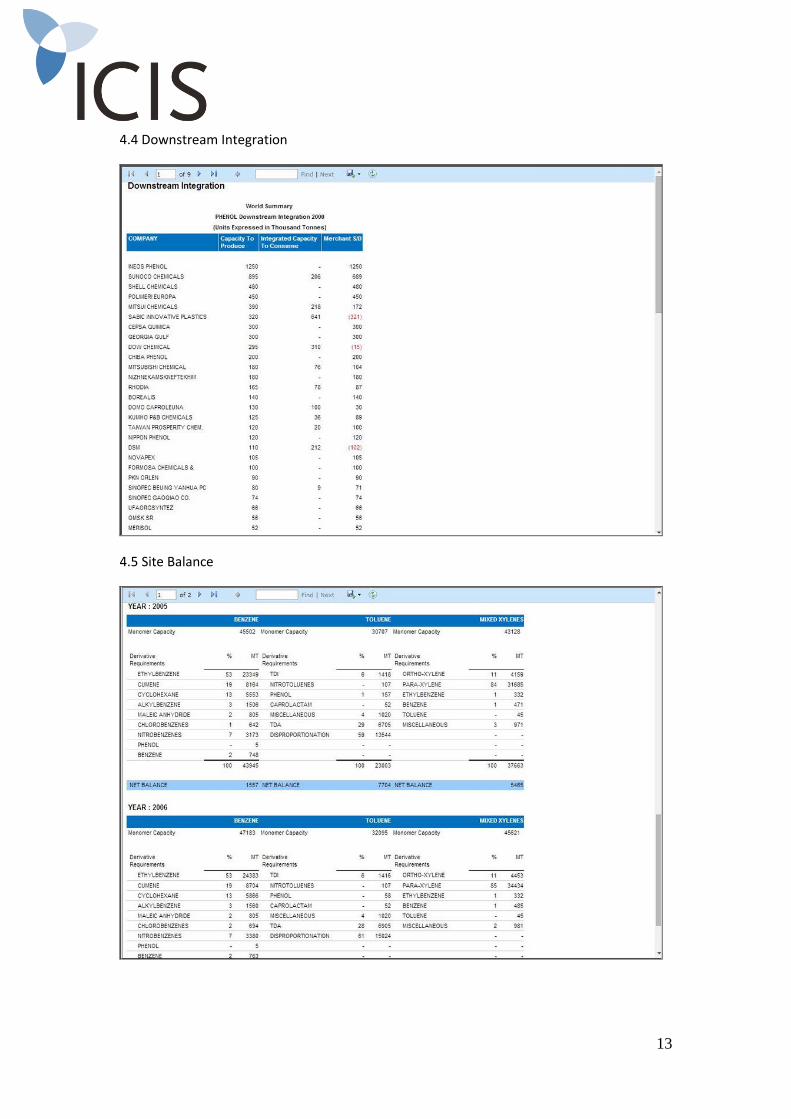
4.4 Downstream Integration
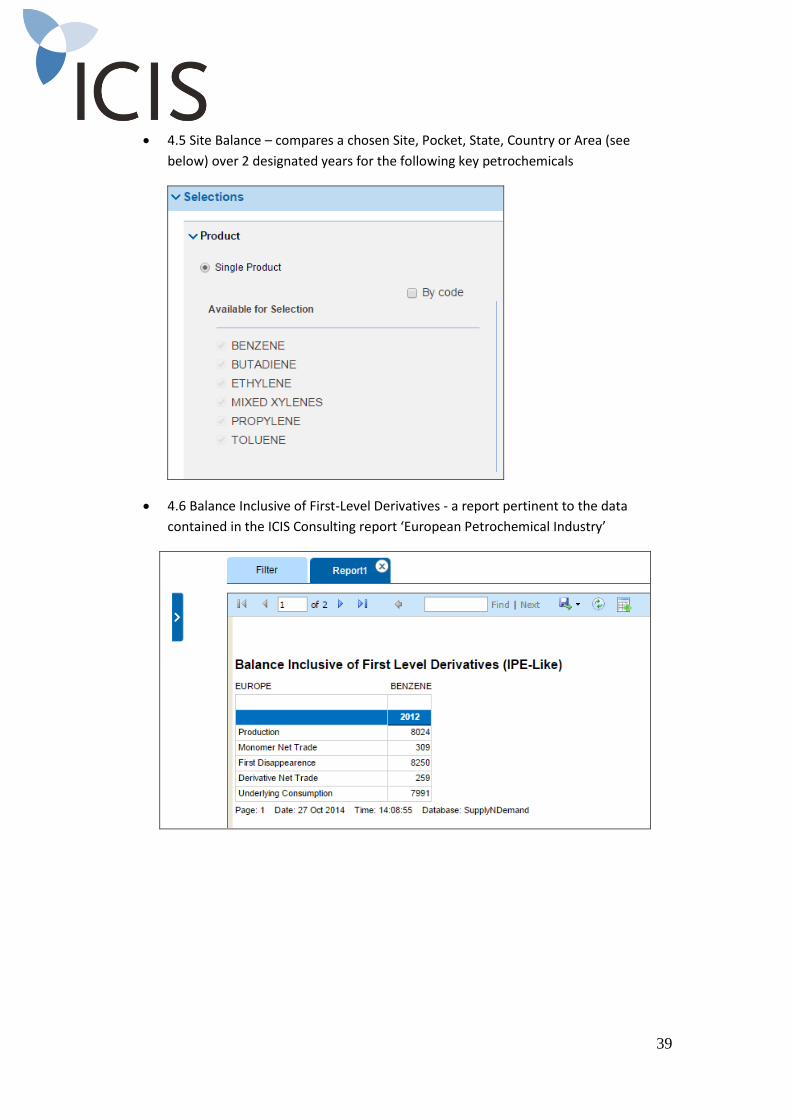
4.5 Site Balance
14
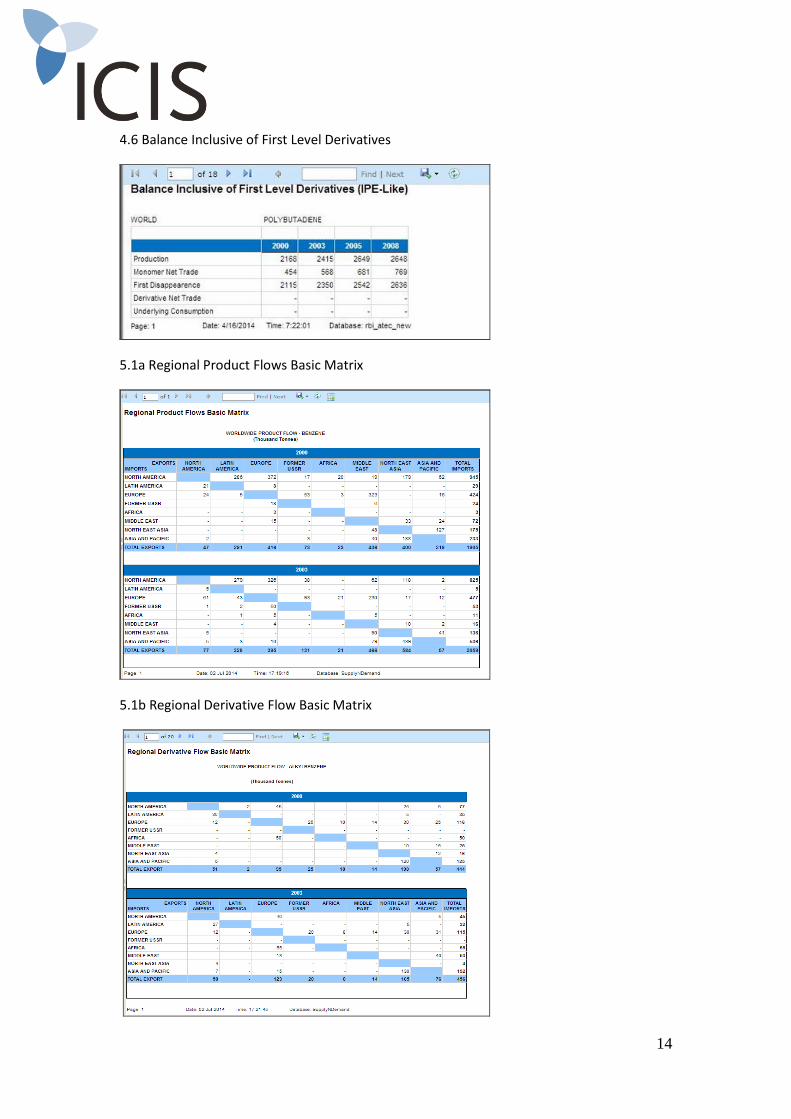
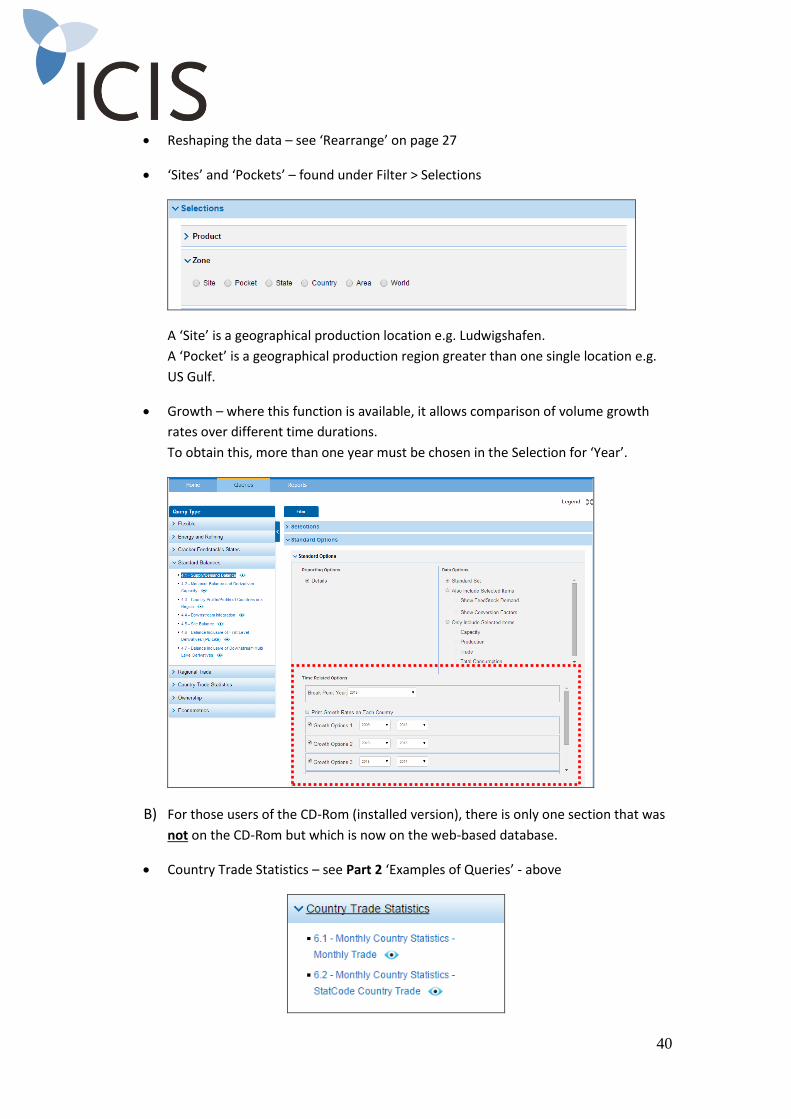
4.6 Balance Inclusive of First Level Derivatives
5.1a Regional Product Flows Basic Matrix
5.1b Regional Derivative Flow Basic Matrix
15
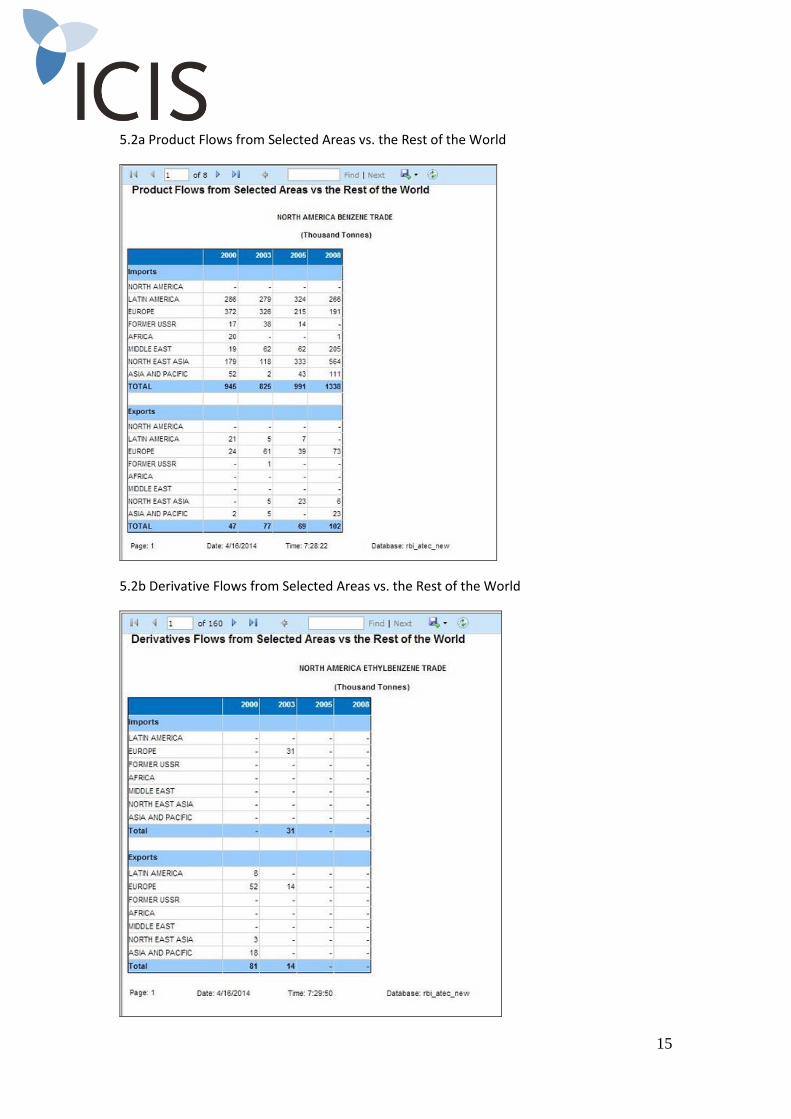
5.2a Product Flows from Selected Areas vs. the Rest of the World
5.2b Derivative Flows from Selected Areas vs. the Rest of the World
16
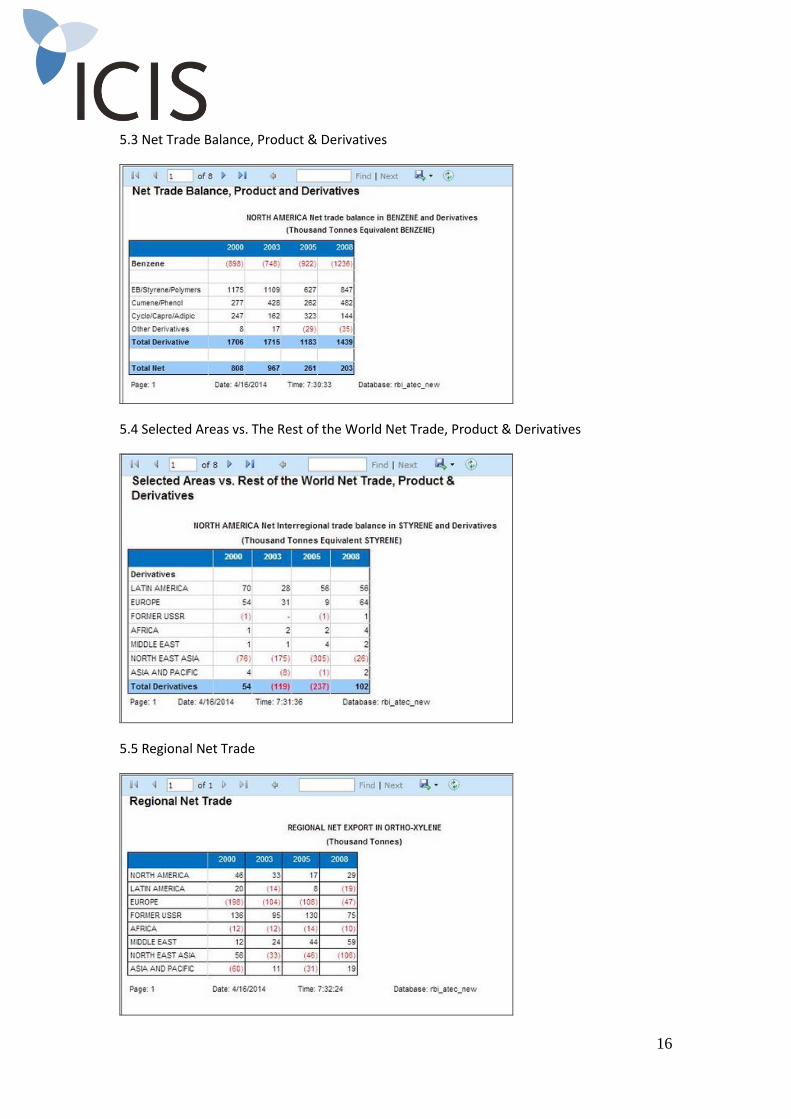
5.3 Net Trade Balance, Product & Derivatives
5.4 Selected Areas vs. The Rest of the World Net Trade, Product & Derivatives
5.5 Regional Net Trade
17
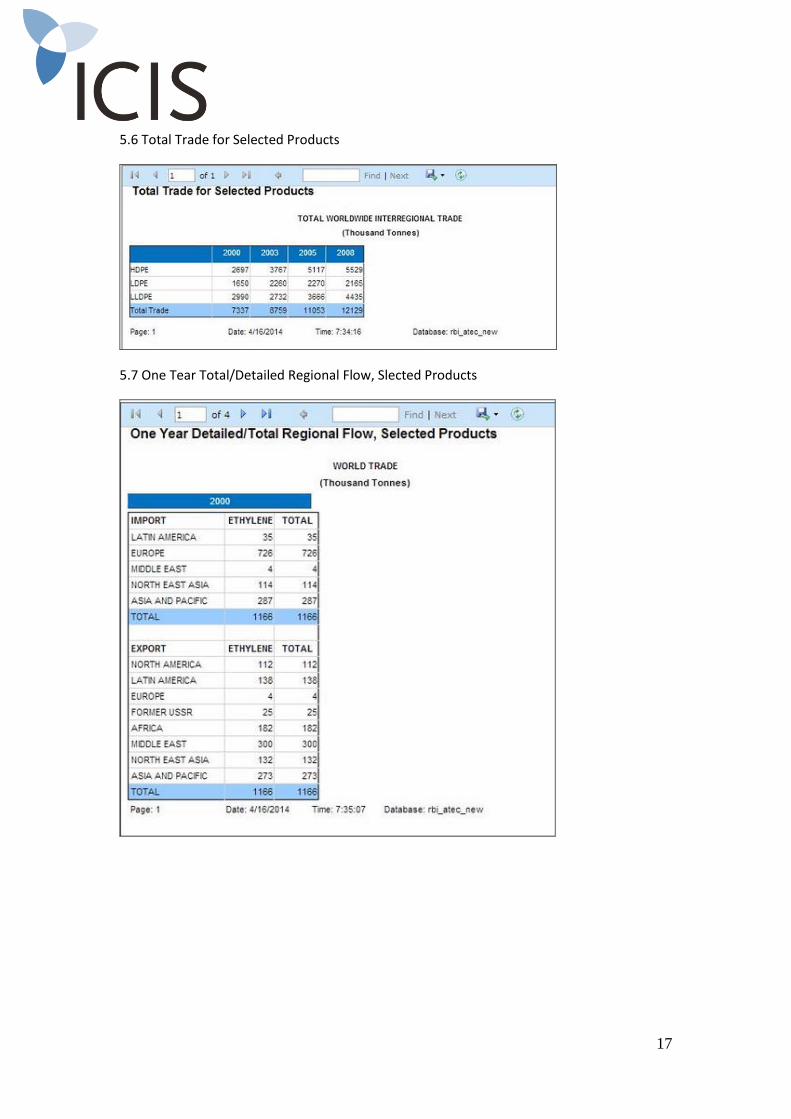
5.6 Total Trade for Selected Products
5.7 One Tear Total/Detailed Regional Flow, Slected Products
18
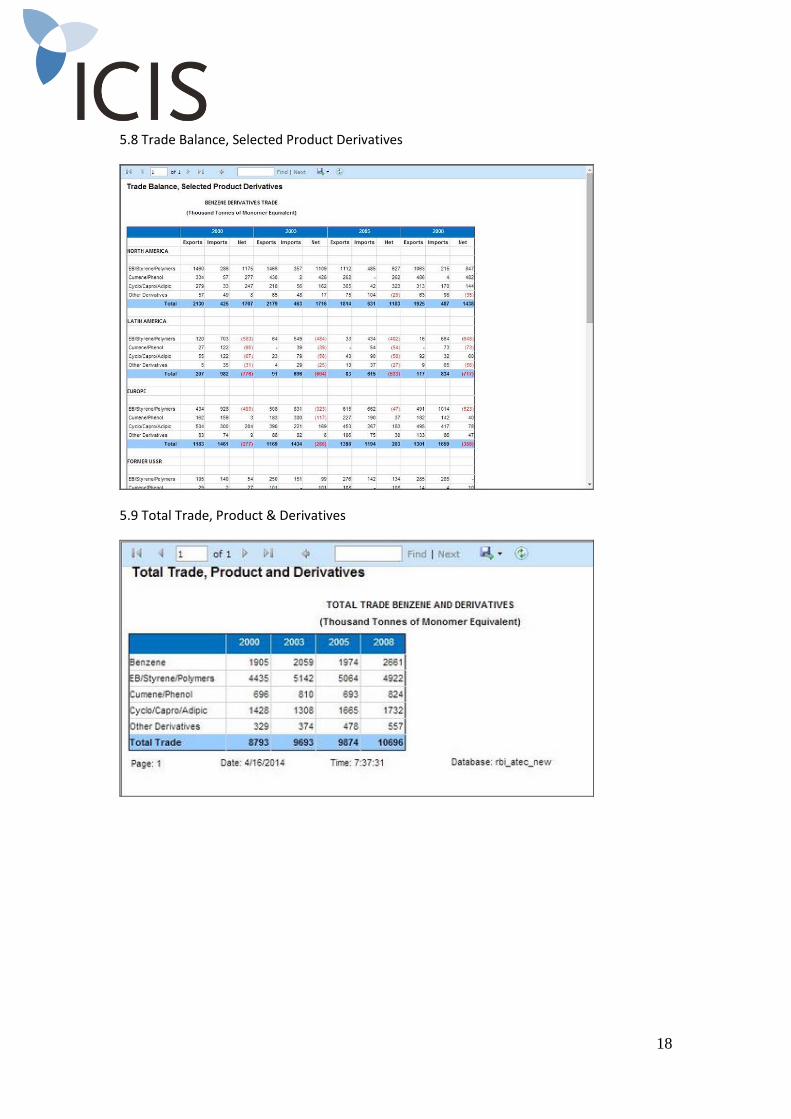
5.8 Trade Balance, Selected Product Derivatives
5.9 Total Trade, Product & Derivatives
19
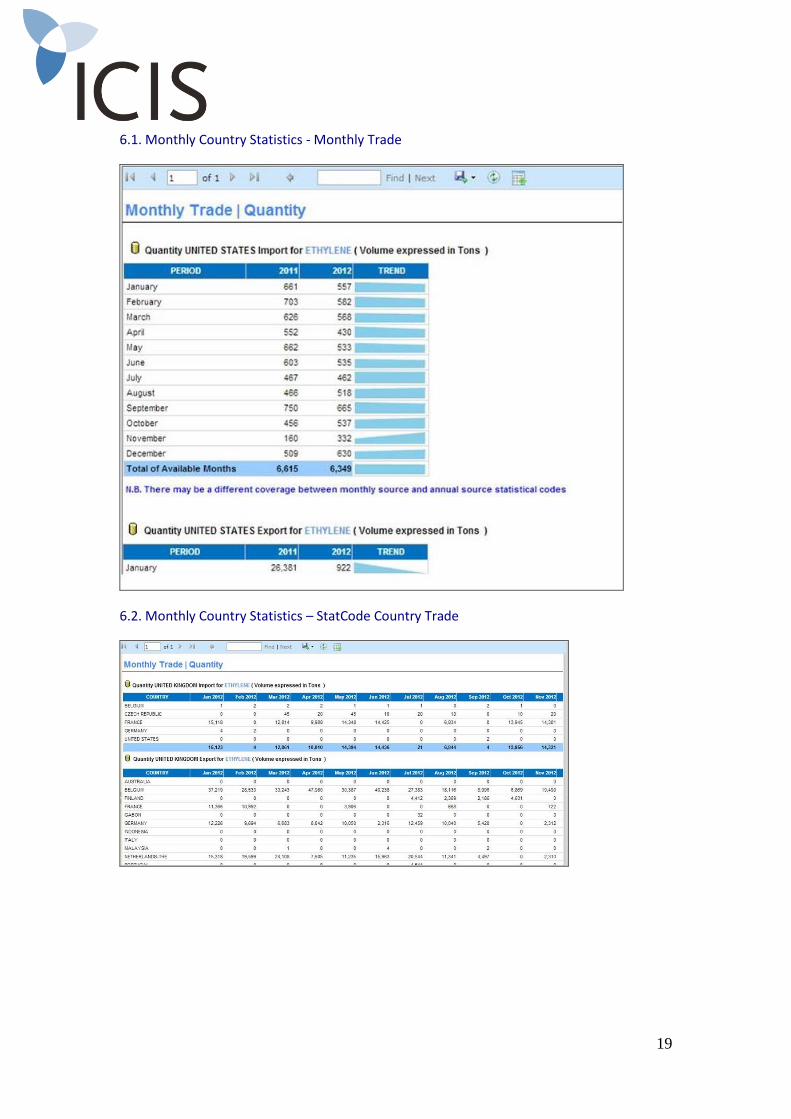
6.1. Monthly Country Statistics - Monthly Trade
6.2. Monthly Country Statistics – StatCode Country Trade
20
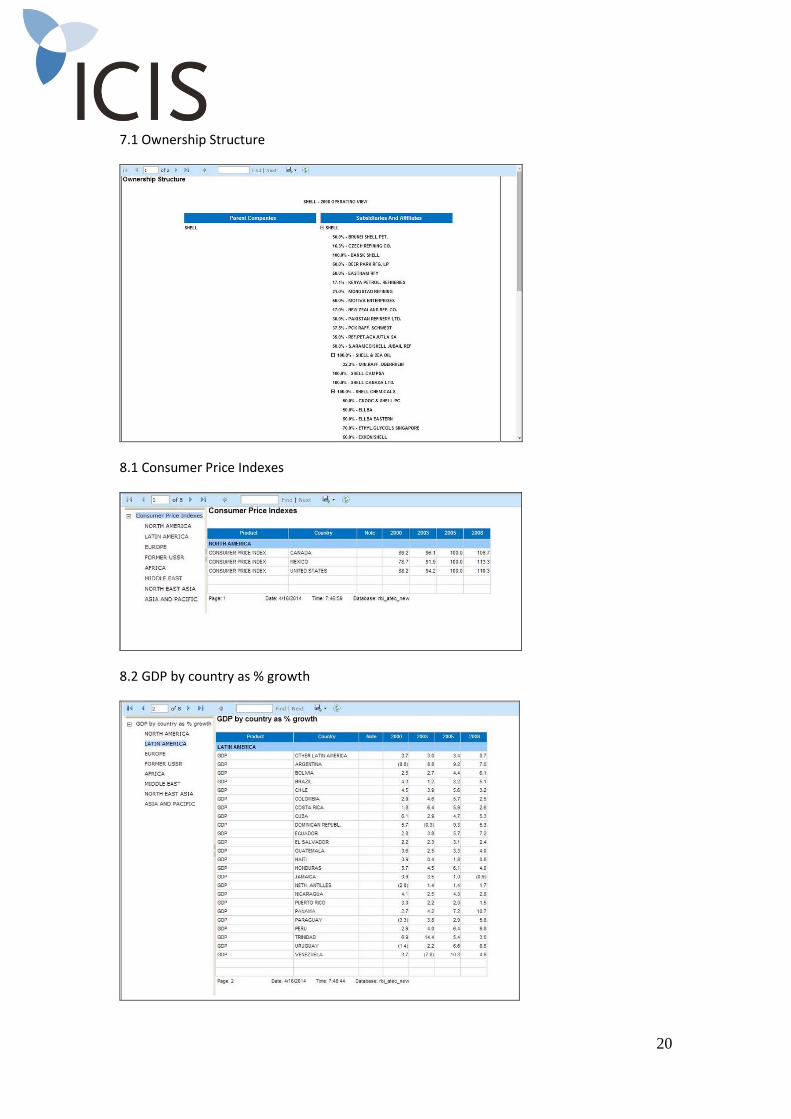
7.1 Ownership Structure
8.1 Consumer Price Indexes
8.2 GDP by country as % growth
21
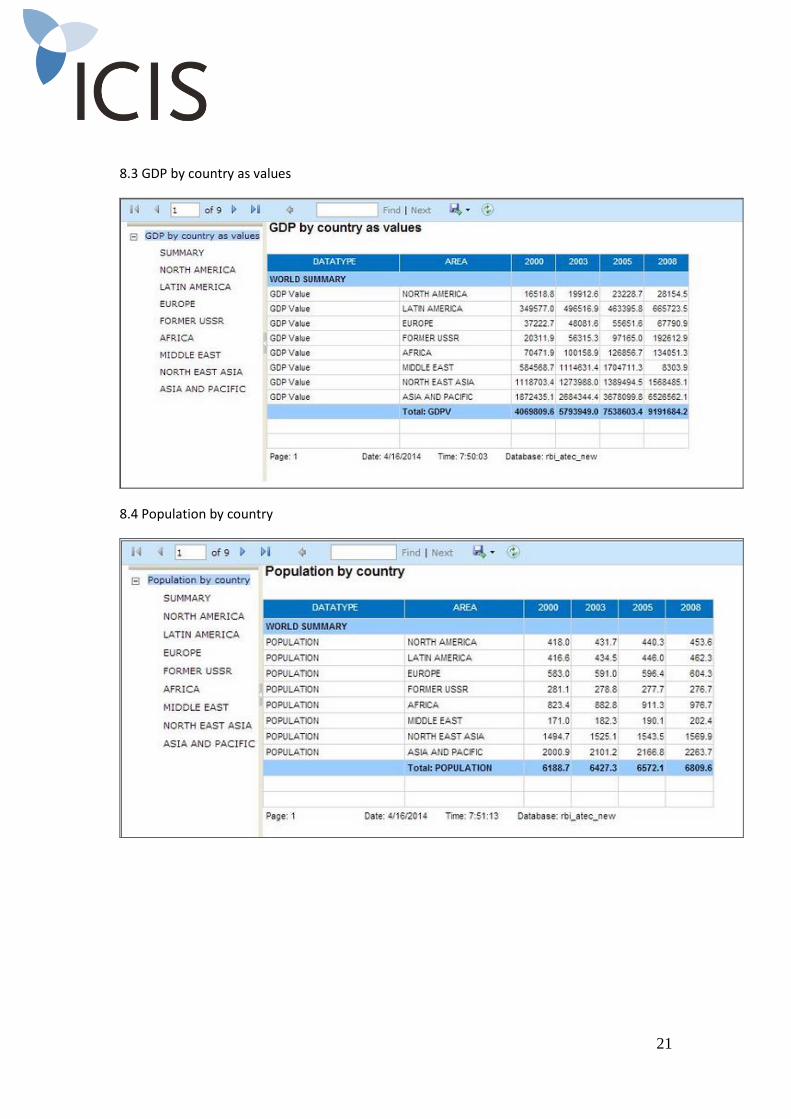
8.3 GDP by country as values
8.4 Population by country
22
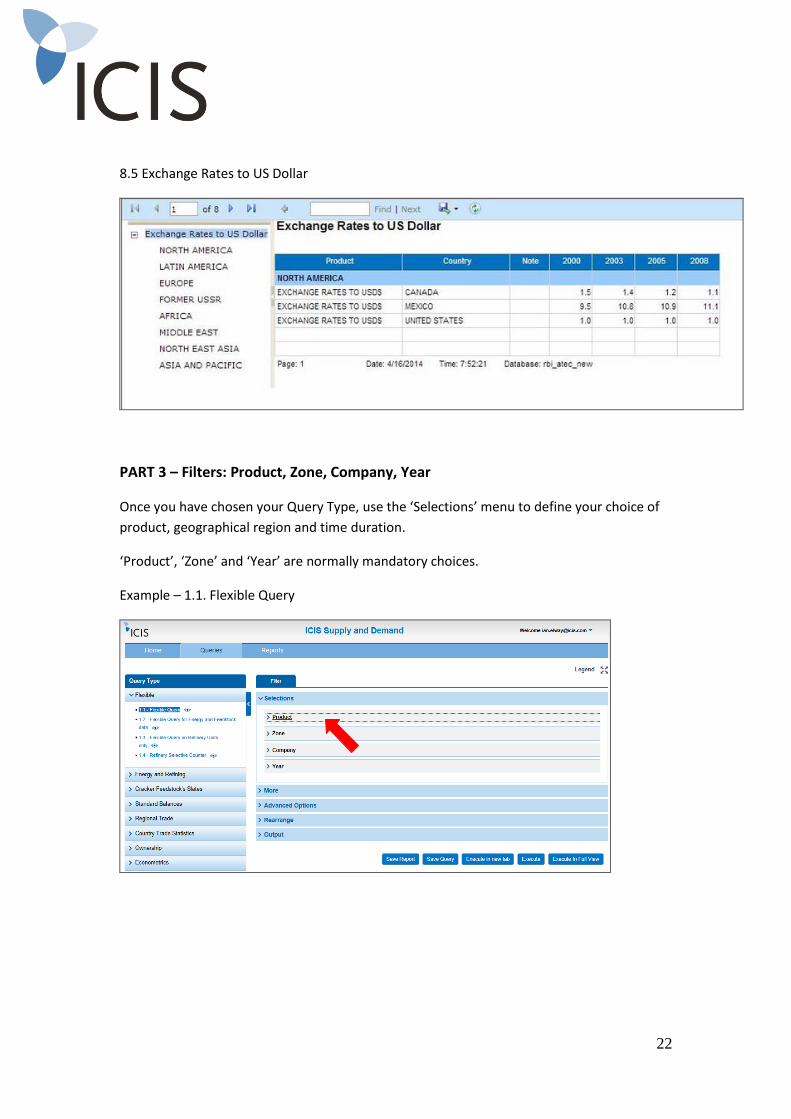
8.5 Exchange Rates to US Dollar
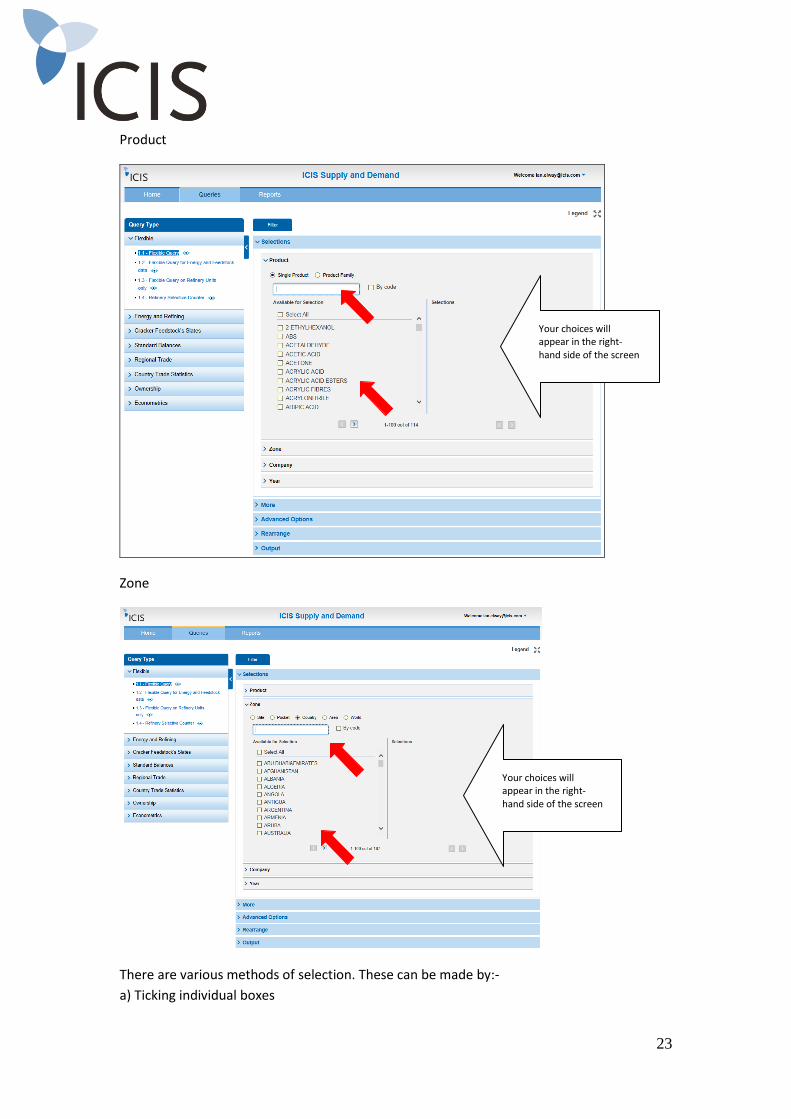
PART 3 – Filters: Product, Zone, Company, Year
Once you have chosen your Query Type, use the ‘Selections’ menu to define your choice of
product, geographical region and time duration.
‘Product’, ‘Zone’ and ‘Year’ are normally mandatory choices.
Example – 1.1. Flexible Query
23
Product
Zone
There are various methods of selection. These can be made by:-
a) Ticking individual boxes
Your choices will appear in the right-hand side of the screen
Your choices will appear in the right-hand side of the screen
24
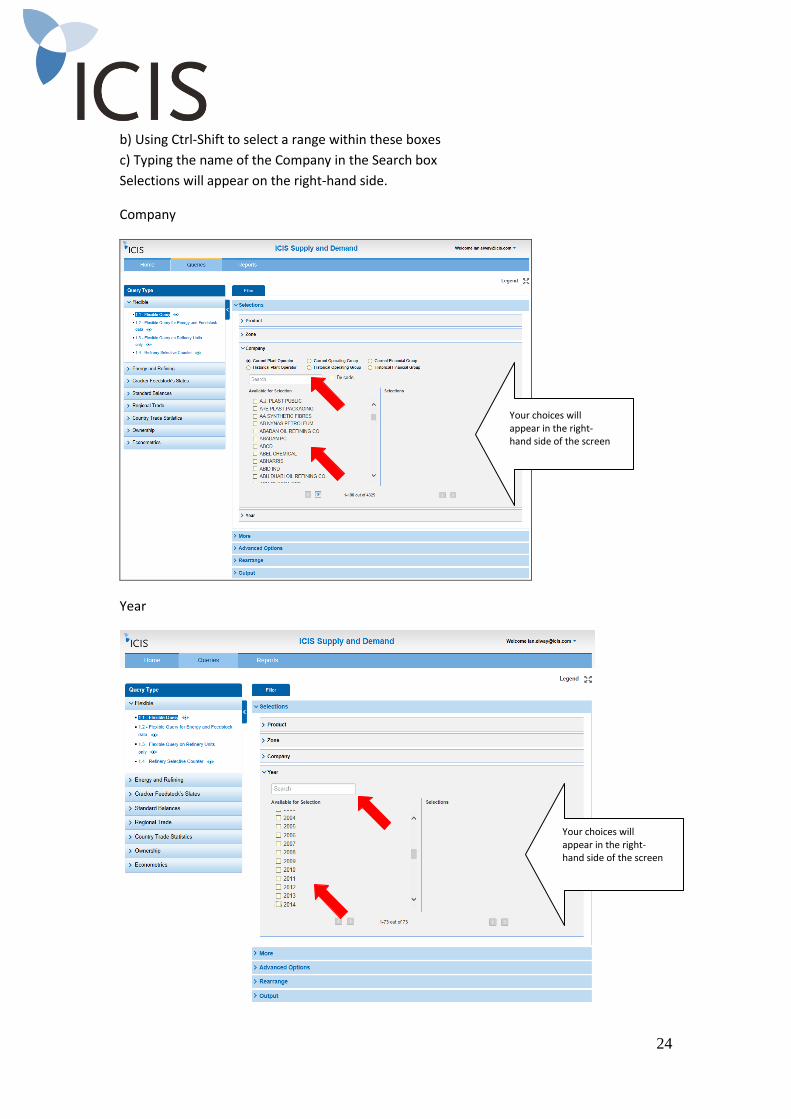
b) Using Ctrl-Shift to select a range within these boxes
c) Typing the name of the Company in the Search box
Selections will appear on the right-hand side.
Company
Year
Your choices will appear in the right-hand side of the screen
Your choices will appear in the right-hand side of the screen
25
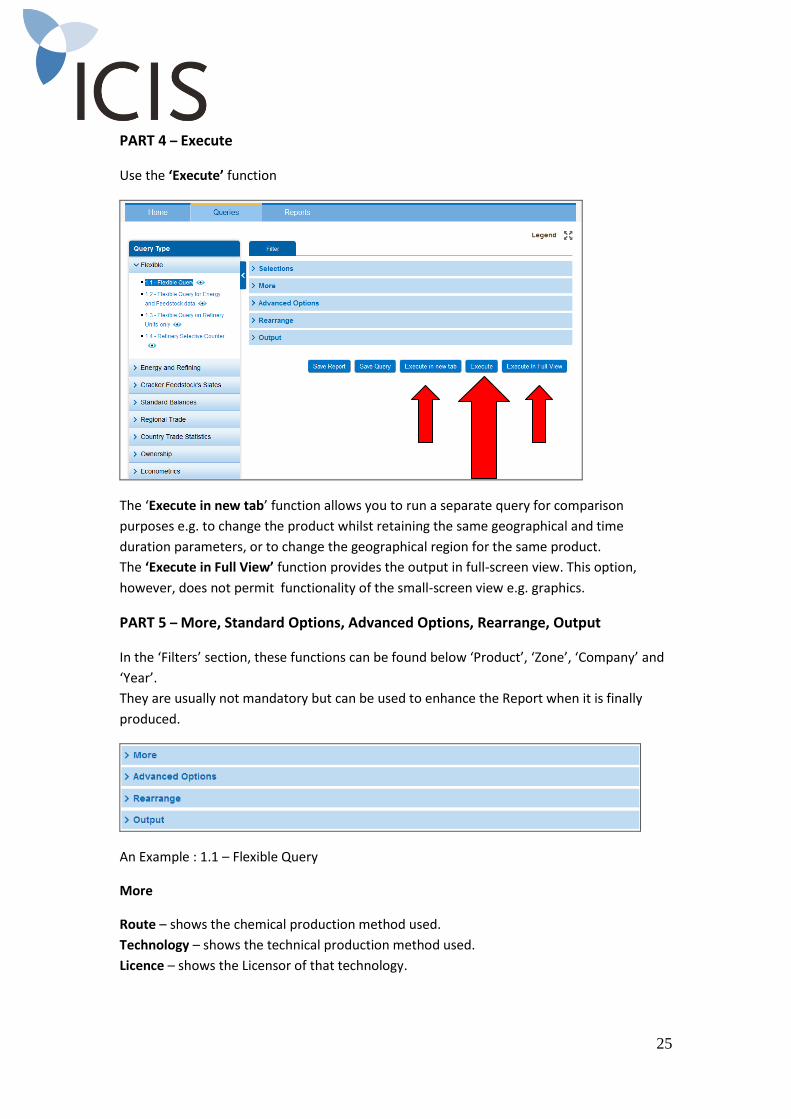
PART 4 – Execute
Use the ‘Execute’ function
The ‘Execute in new tab’ function allows you to run a separate query for comparison
purposes e.g. to change the product whilst retaining the same geographical and time
duration parameters, or to change the geographical region for the same product.
The ‘Execute in Full View’ function provides the output in full-screen view. This option,
however, does not permit functionality of the small-screen view e.g. graphics.
PART 5 – More, Standard Options, Advanced Options, Rearrange, Output
In the ‘Filters’ section, these functions can be found below ‘Product’, ‘Zone’, ‘Company’ and
‘Year’.
They are usually not mandatory but can be used to enhance the Report when it is finally
produced.
An Example : 1.1 – Flexible Query
More
Route – shows the chemical production method used.
Technology – shows the technical production method used.
Licence – shows the Licensor of that technology.
26
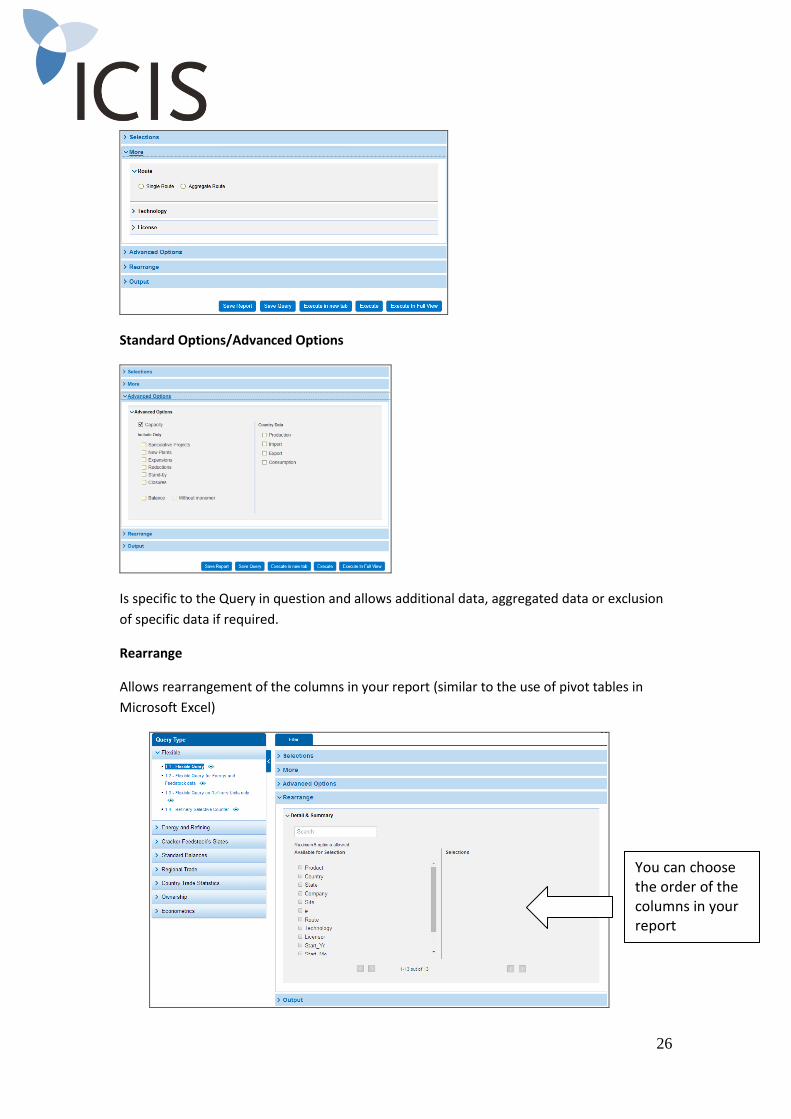
Standard Options/Advanced Options
Is specific to the Query in question and allows additional data, aggregated data or exclusion
of specific data if required.
Rearrange
Allows rearrangement of the columns in your report (similar to the use of pivot tables in
Microsoft Excel)
You can choose the order of the columns in your report
27
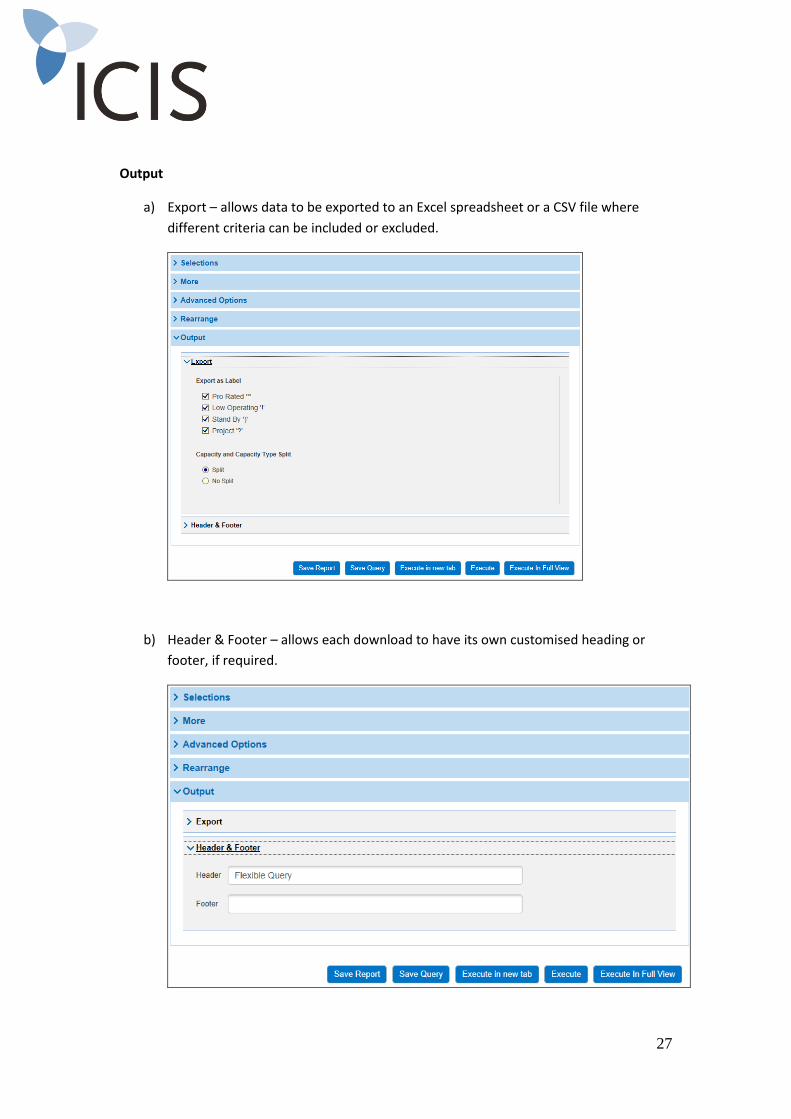
Output
a) Export – allows data to be exported to an Excel spreadsheet or a CSV file where
different criteria can be included or excluded.
b) Header & Footer – allows each download to have its own customised heading or
footer, if required.
28
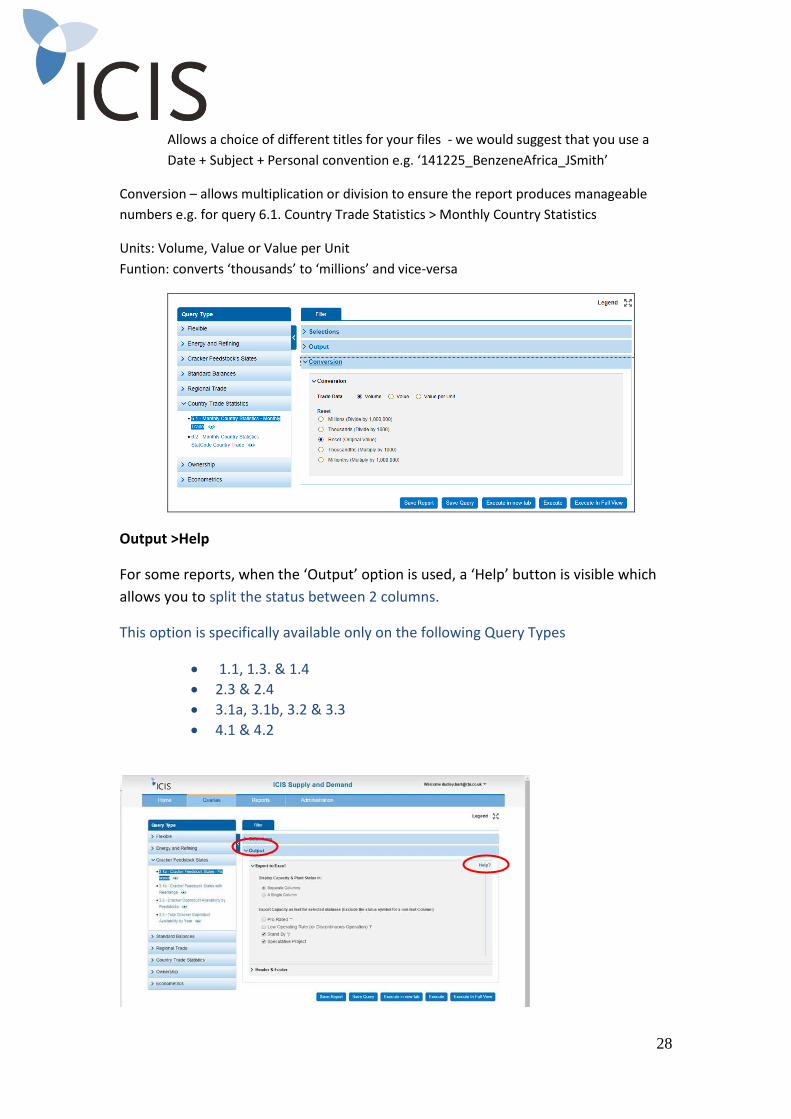
Allows a choice of different titles for your files - we would suggest that you use a
Date + Subject + Personal convention e.g. ‘141225_BenzeneAfrica_JSmith’
Conversion – allows multiplication or division to ensure the report produces manageable
numbers e.g. for query 6.1. Country Trade Statistics > Monthly Country Statistics
Units: Volume, Value or Value per Unit
Funtion: converts ‘thousands’ to ‘millions’ and vice-versa
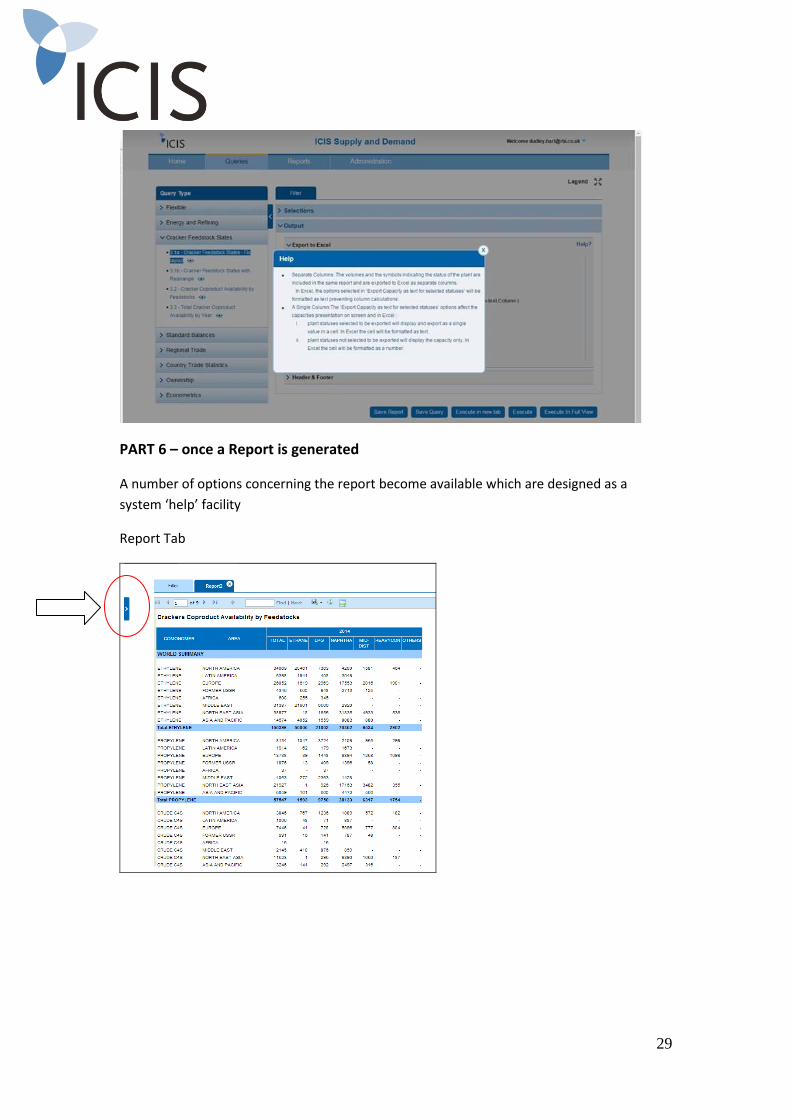
Output >Help
For some reports, when the ‘Output’ option is used, a ‘Help’ button is visible which
allows you to split the status between 2 columns.
This option is specifically available only on the following Query Types
1.1, 1.3. & 1.4
2.3 & 2.4
3.1a, 3.1b, 3.2 & 3.3
4.1 & 4.2
29
PART 6 – once a Report is generated
A number of options concerning the report become available which are designed as a
system ‘help’ facility
Report Tab
30
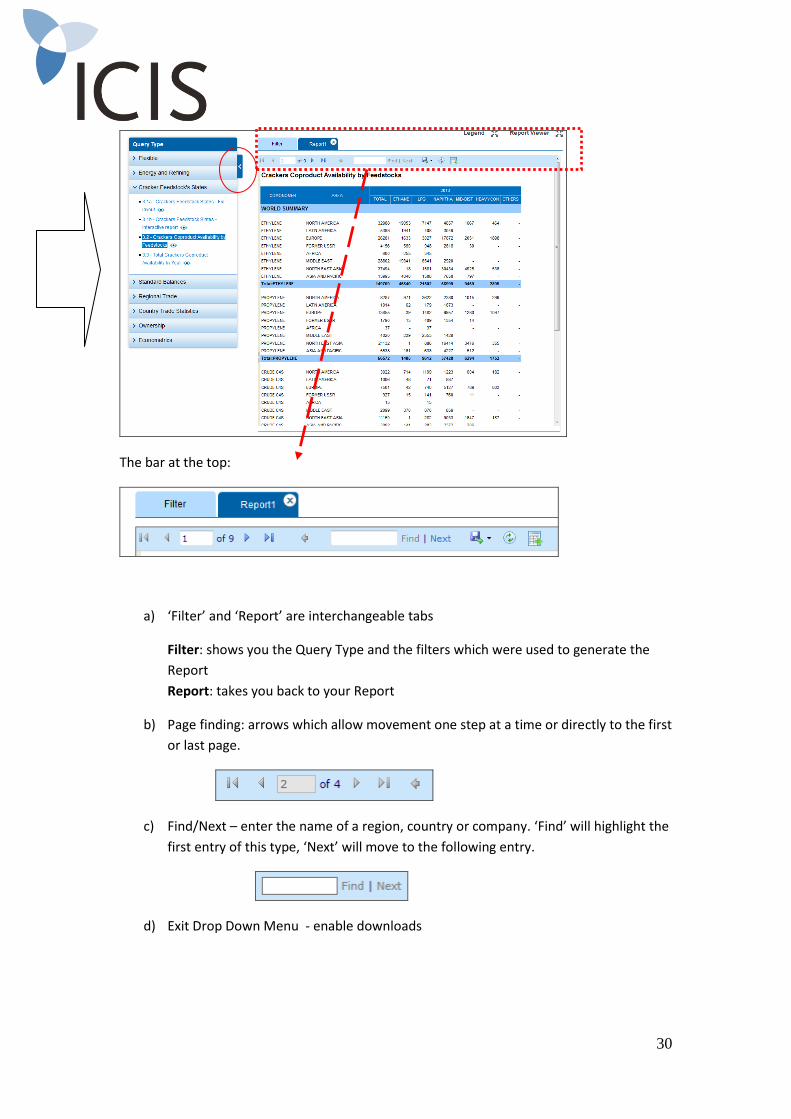
The bar at the top:
a) ‘Filter’ and ‘Report’ are interchangeable tabs
Filter: shows you the Query Type and the filters which were used to generate the
Report
Report: takes you back to your Report
b) Page finding: arrows which allow movement one step at a time or directly to the first
or last page.
c) Find/Next – enter the name of a region, country or company. ‘Find’ will highlight the
first entry of this type, ‘Next’ will move to the following entry.
d) Exit Drop Down Menu - enable downloads
31
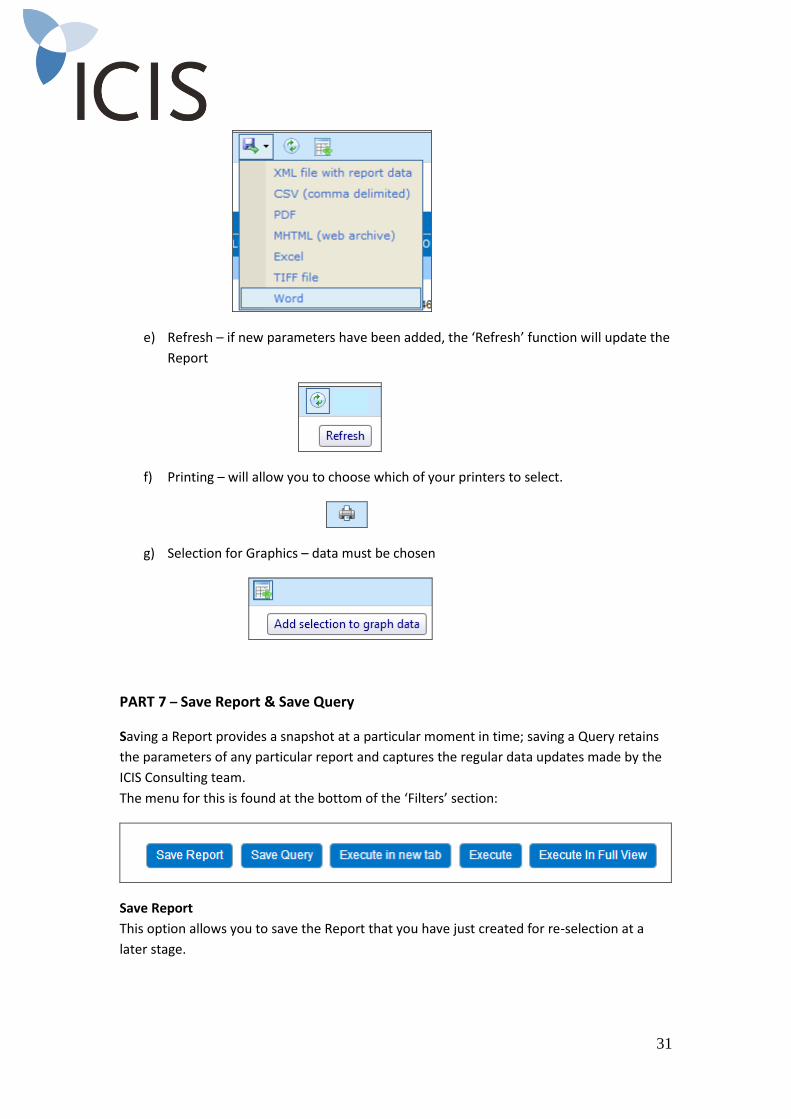
e) Refresh – if new parameters have been added, the ‘Refresh’ function will update the
Report
f) Printing – will allow you to choose which of your printers to select.
g) Selection for Graphics – data must be chosen
PART 7 – Save Report & Save Query
Saving a Report provides a snapshot at a particular moment in time; saving a Query retains
the parameters of any particular report and captures the regular data updates made by the
ICIS Consulting team.
The menu for this is found at the bottom of the ‘Filters’ section:
Save Report
This option allows you to save the Report that you have just created for re-selection at a
later stage.
32
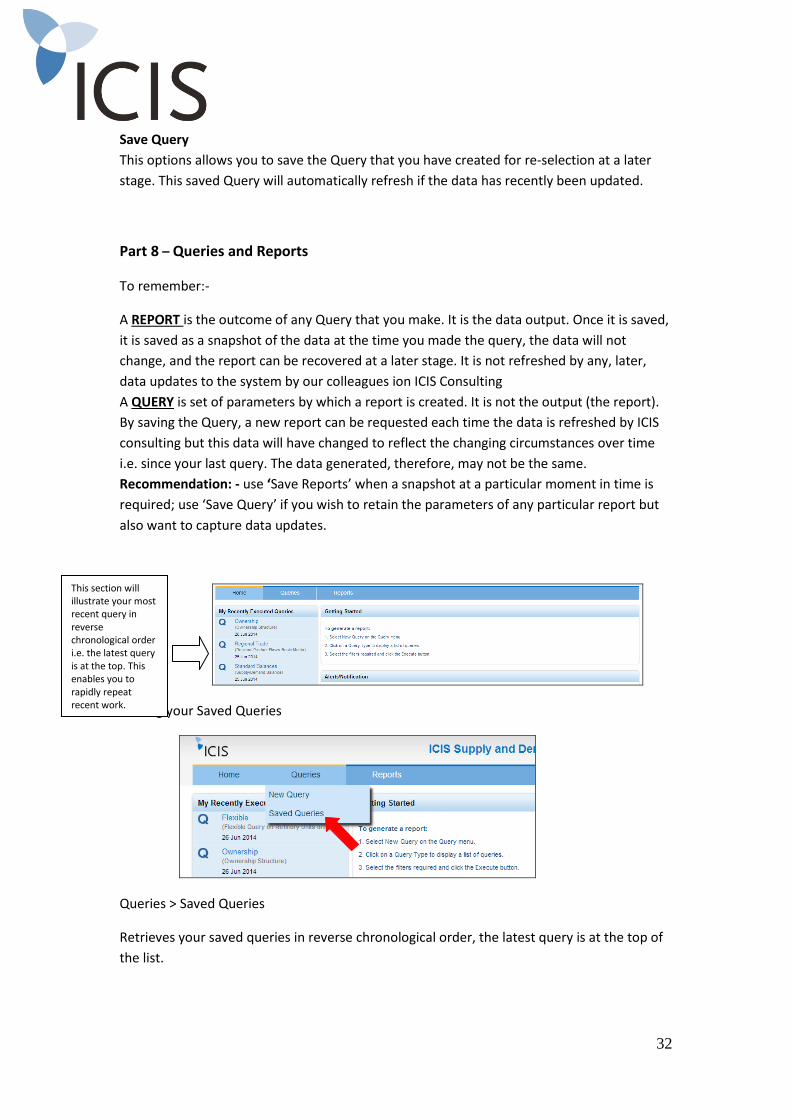
Save Query
This options allows you to save the Query that you have created for re-selection at a later
stage. This saved Query will automatically refresh if the data has recently been updated.
Part 8 – Queries and Reports
To remember:-
A REPORT is the outcome of any Query that you make. It is the data output. Once it is saved,
it is saved as a snapshot of the data at the time you made the query, the data will not
change, and the report can be recovered at a later stage. It is not refreshed by any, later,
data updates to the system by our colleagues ion ICIS Consulting
A QUERY is set of parameters by which a report is created. It is not the output (the report).
By saving the Query, a new report can be requested each time the data is refreshed by ICIS
consulting but this data will have changed to reflect the changing circumstances over time
i.e. since your last query. The data generated, therefore, may not be the same.
Recommendation: - use ‘Save Reports’ when a snapshot at a particular moment in time is
required; use ‘Save Query’ if you wish to retain the parameters of any particular report but
also want to capture data updates.
Finding your Saved Queries
Queries > Saved Queries
Retrieves your saved queries in reverse chronological order, the latest query is at the top of
the list.
This section will illustrate your most recent query in reverse chronological order i.e. the latest query is at the top. This enables you to rapidly repeat recent work.
33
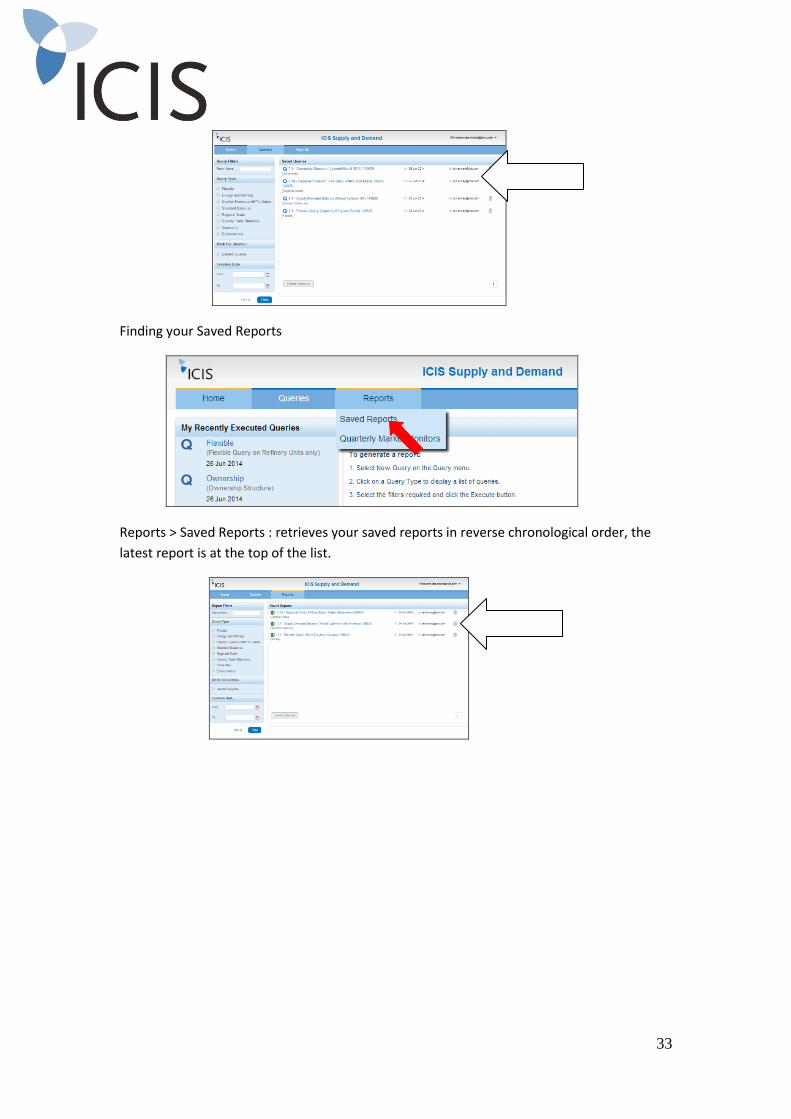
Finding your Saved Reports
Reports > Saved Reports : retrieves your saved reports in reverse chronological order, the
latest report is at the top of the list.
34
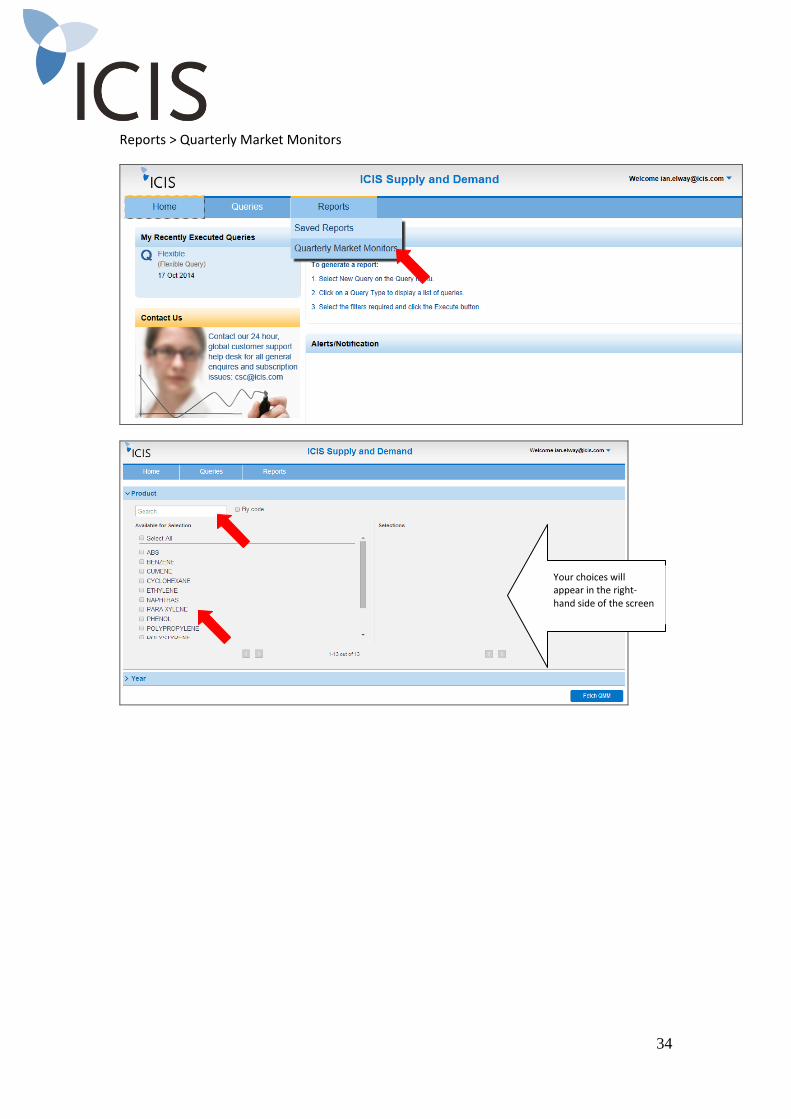
Reports > Quarterly Market Monitors
Your choices will appear in the right-hand side of the screen
35
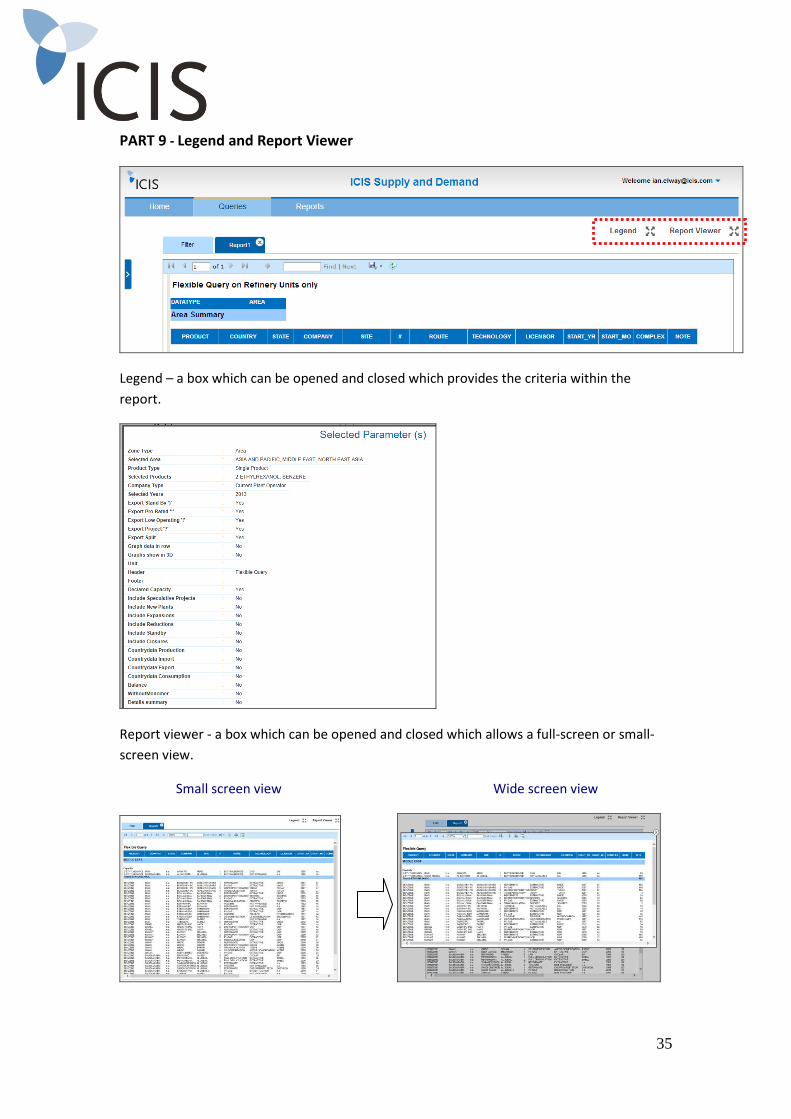
PART 9 - Legend and Report Viewer
Legend – a box which can be opened and closed which provides the criteria within the
report.
Report viewer - a box which can be opened and closed which allows a full-screen or small-
screen view.
Small screen view Wide screen view
36
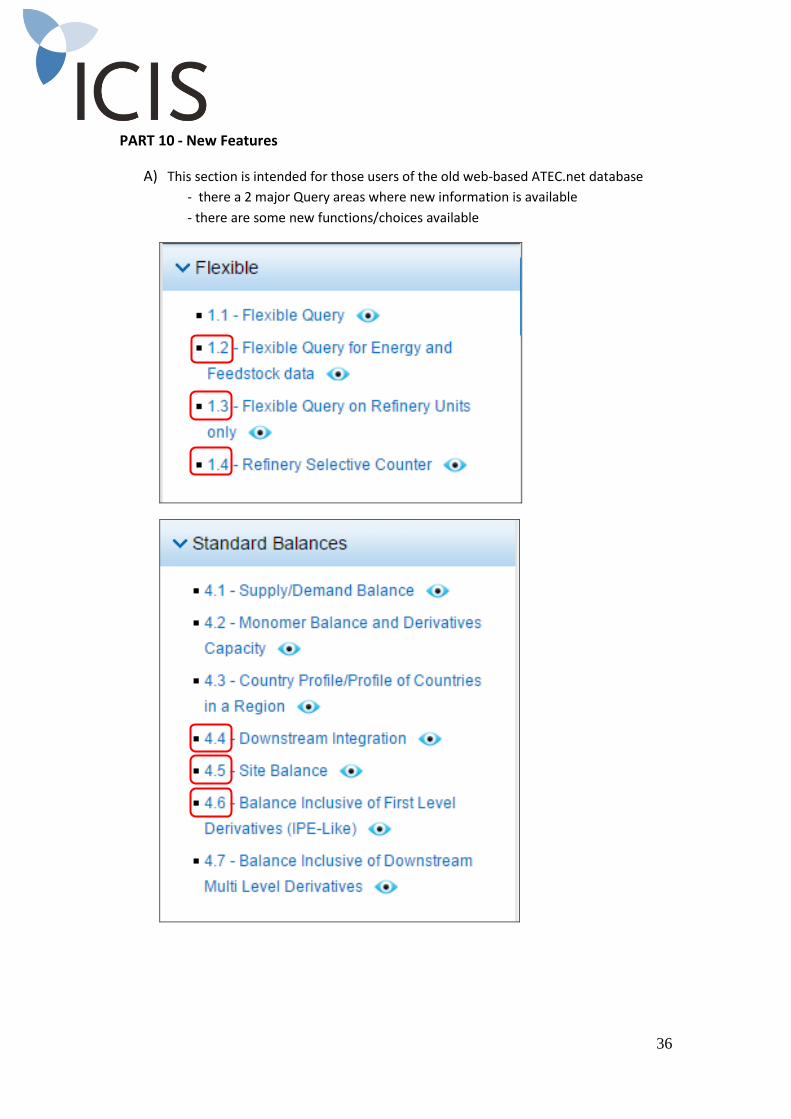
PART 10 - New Features
A) This section is intended for those users of the old web-based ATEC.net database
- there a 2 major Query areas where new information is available
- there are some new functions/choices available
37
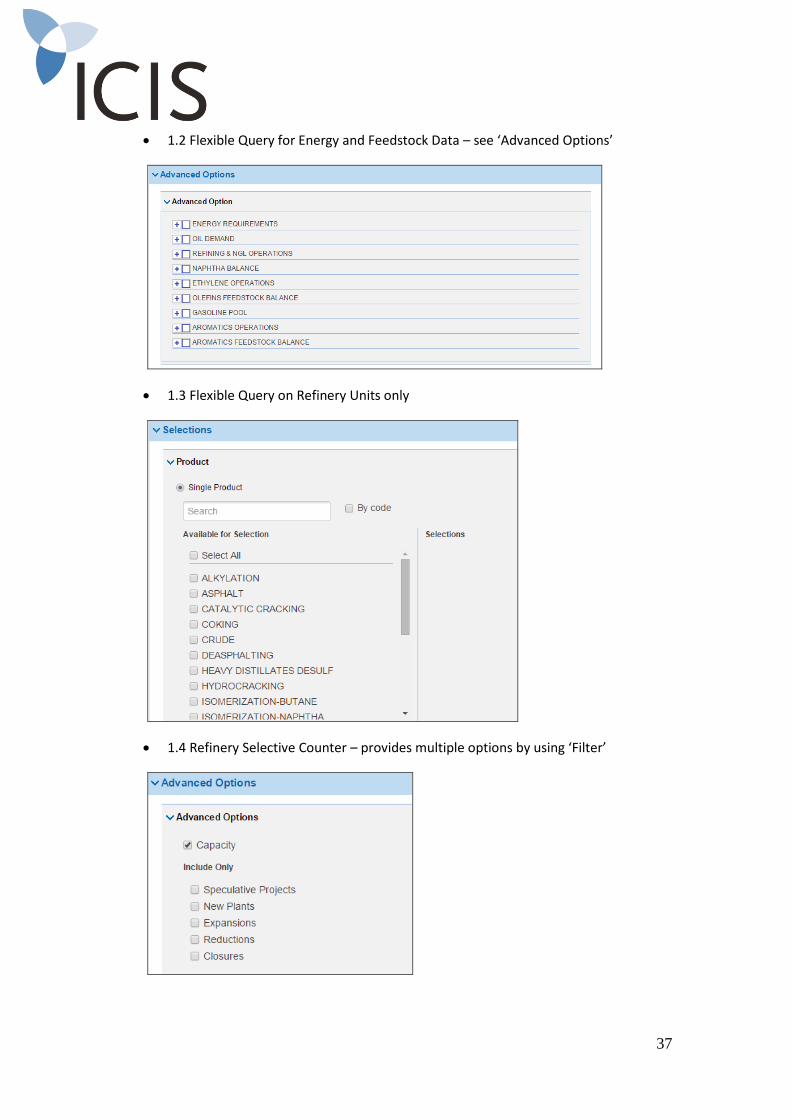
1.2 Flexible Query for Energy and Feedstock Data – see ‘Advanced Options’
1.3 Flexible Query on Refinery Units only
1.4 Refinery Selective Counter – provides multiple options by using ‘Filter’
38
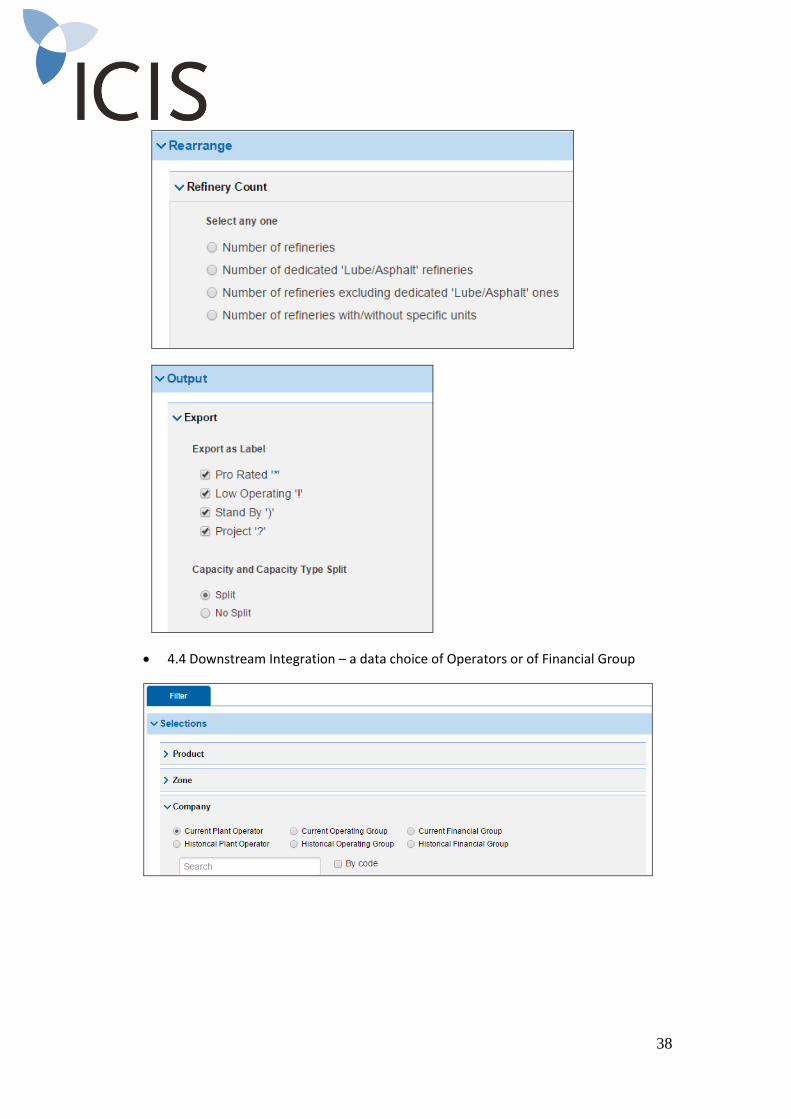
4.4 Downstream Integration – a data choice of Operators or of Financial Group
39
4.5 Site Balance – compares a chosen Site, Pocket, State, Country or Area (see
below) over 2 designated years for the following key petrochemicals
4.6 Balance Inclusive of First-Level Derivatives - a report pertinent to the data
contained in the ICIS Consulting report ‘European Petrochemical Industry’
40
Reshaping the data – see ‘Rearrange’ on page 27
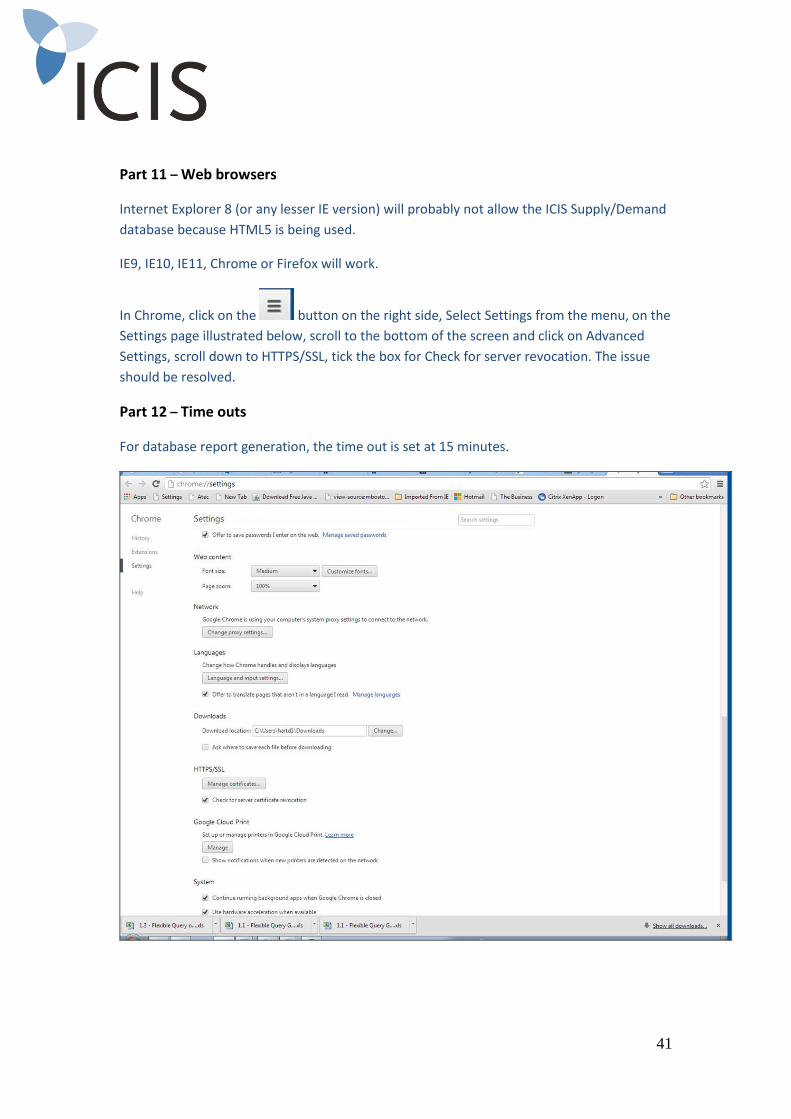
‘Sites’ and ‘Pockets’ – found under Filter > Selections
A ‘Site’ is a geographical production location e.g. Ludwigshafen.
A ‘Pocket’ is a geographical production region greater than one single location e.g.
US Gulf.
Growth – where this function is available, it allows comparison of volume growth
rates over different time durations.
To obtain this, more than one year must be chosen in the Selection for ‘Year’.
B) For those users of the CD-Rom (installed version), there is only one section that was
not on the CD-Rom but which is now on the web-based database.
Country Trade Statistics – see Part 2 ‘Examples of Queries’ - above
41
Part 11 – Web browsers
Internet Explorer 8 (or any lesser IE version) will probably not allow the ICIS Supply/Demand
database because HTML5 is being used.
IE9, IE10, IE11, Chrome or Firefox will work.
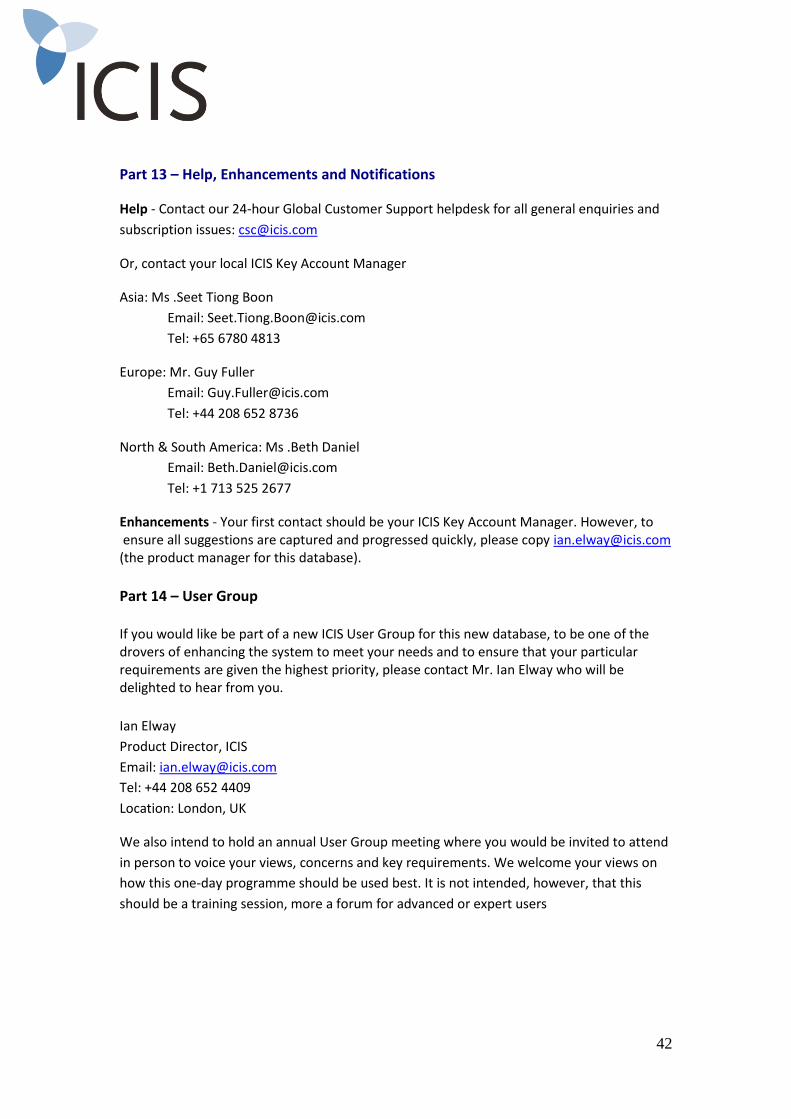
In Chrome, click on the button on the right side, Select Settings from the menu, on the
Settings page illustrated below, scroll to the bottom of the screen and click on Advanced
Settings, scroll down to HTTPS/SSL, tick the box for Check for server revocation. The issue
should be resolved.
Part 12 – Time outs
For database report generation, the time out is set at 15 minutes.
42
Part 13 – Help, Enhancements and Notifications
Help - Contact our 24-hour Global Customer Support helpdesk for all general enquiries and
subscription issues: [email protected]
Or, contact your local ICIS Key Account Manager
Asia: Ms .Seet Tiong Boon
Email: [email protected]
Tel: +65 6780 4813
Europe: Mr. Guy Fuller
Email: [email protected]
Tel: +44 208 652 8736
North & South America: Ms .Beth Daniel
Email: [email protected]
Tel: +1 713 525 2677
Enhancements - Your first contact should be your ICIS Key Account Manager. However, to ensure all suggestions are captured and progressed quickly, please copy [email protected] (the product manager for this database).
Part 14 – User Group If you would like be part of a new ICIS User Group for this new database, to be one of the drovers of enhancing the system to meet your needs and to ensure that your particular requirements are given the highest priority, please contact Mr. Ian Elway who will be delighted to hear from you.
Ian Elway
Product Director, ICIS
Email: [email protected]
Tel: +44 208 652 4409
Location: London, UK
We also intend to hold an annual User Group meeting where you would be invited to attend
in person to voice your views, concerns and key requirements. We welcome your views on
how this one-day programme should be used best. It is not intended, however, that this
should be a training session, more a forum for advanced or expert users
43
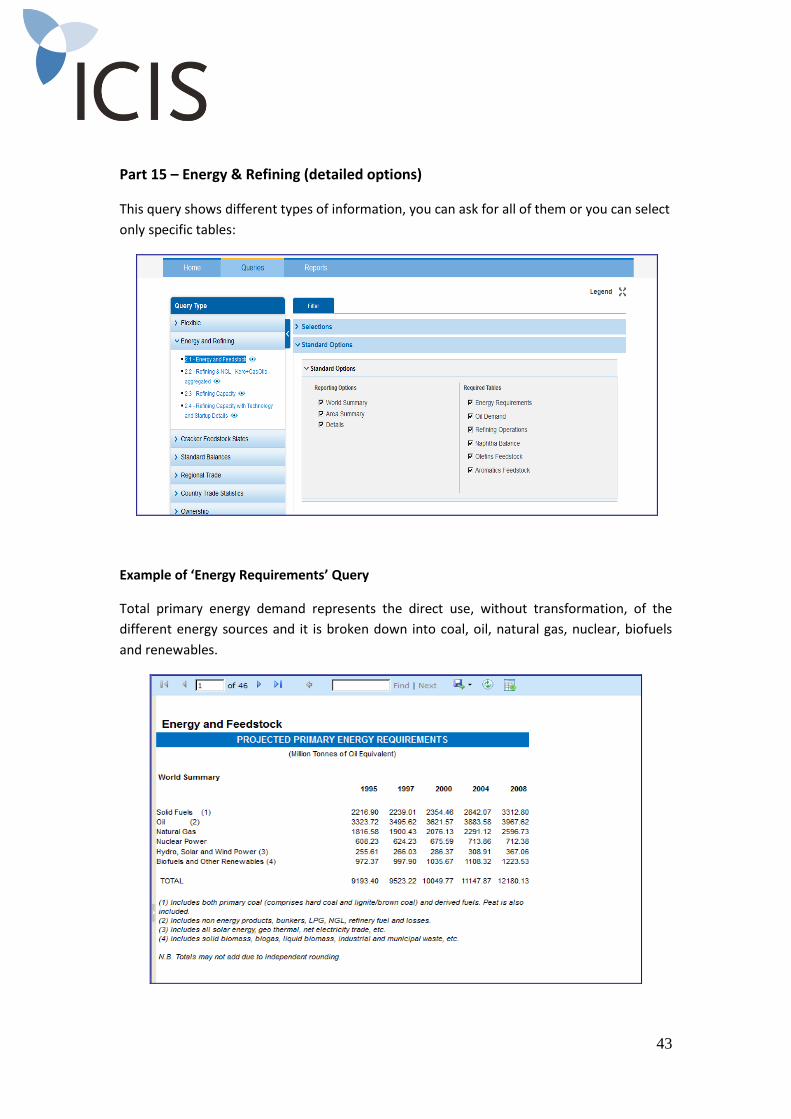
Part 15 – Energy & Refining (detailed options)
This query shows different types of information, you can ask for all of them or you can select
only specific tables:
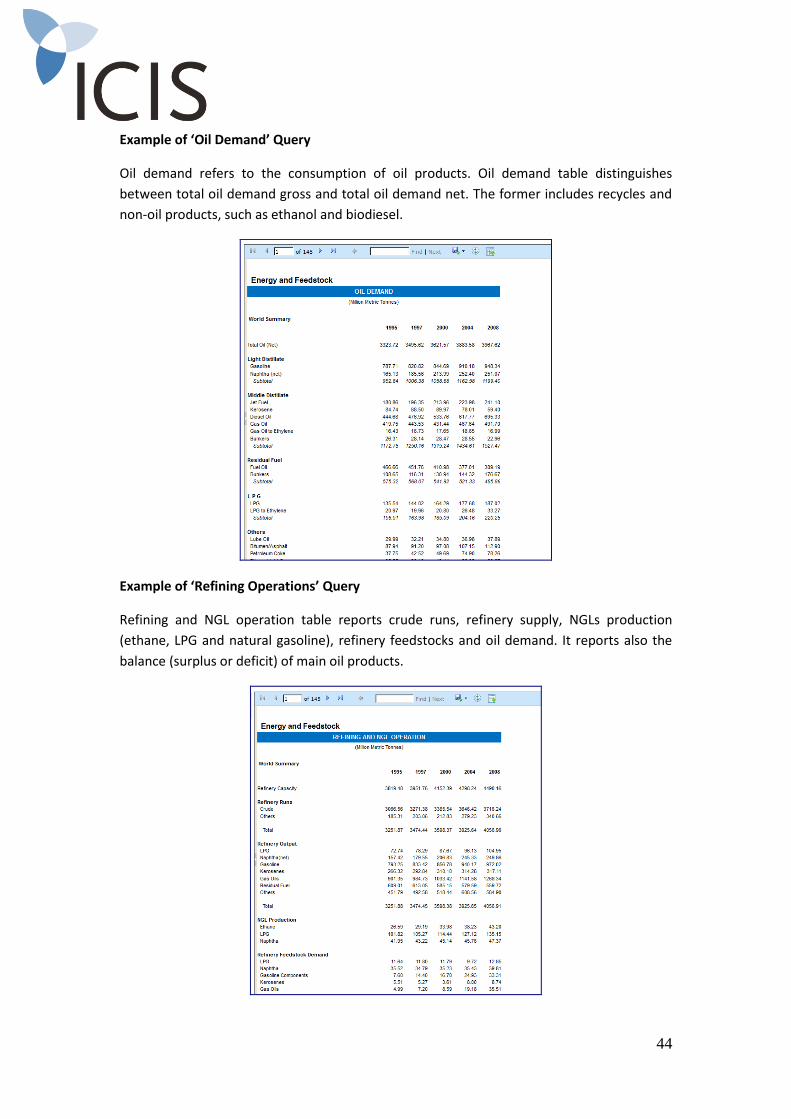
Example of ‘Energy Requirements’ Query
Total primary energy demand represents the direct use, without transformation, of the
different energy sources and it is broken down into coal, oil, natural gas, nuclear, biofuels
and renewables.
44
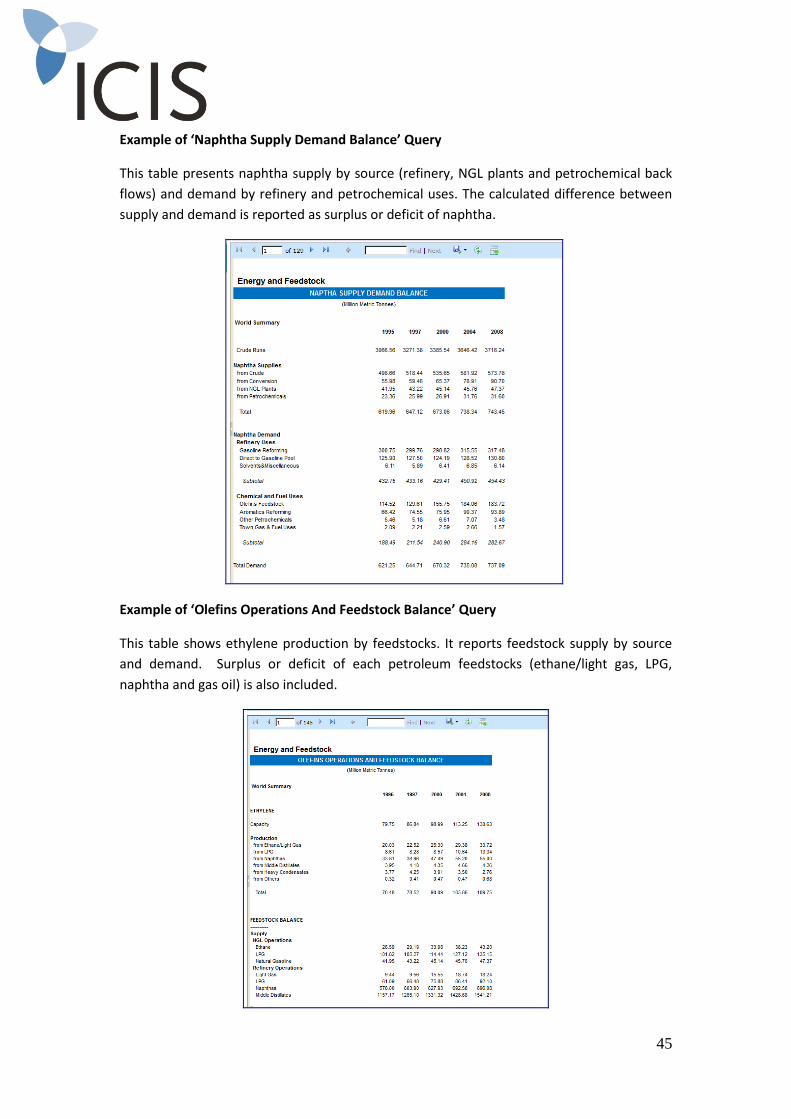
Example of ‘Oil Demand’ Query
Oil demand refers to the consumption of oil products. Oil demand table distinguishes
between total oil demand gross and total oil demand net. The former includes recycles and
non-oil products, such as ethanol and biodiesel.
Example of ‘Refining Operations’ Query
Refining and NGL operation table reports crude runs, refinery supply, NGLs production
(ethane, LPG and natural gasoline), refinery feedstocks and oil demand. It reports also the
balance (surplus or deficit) of main oil products.
45
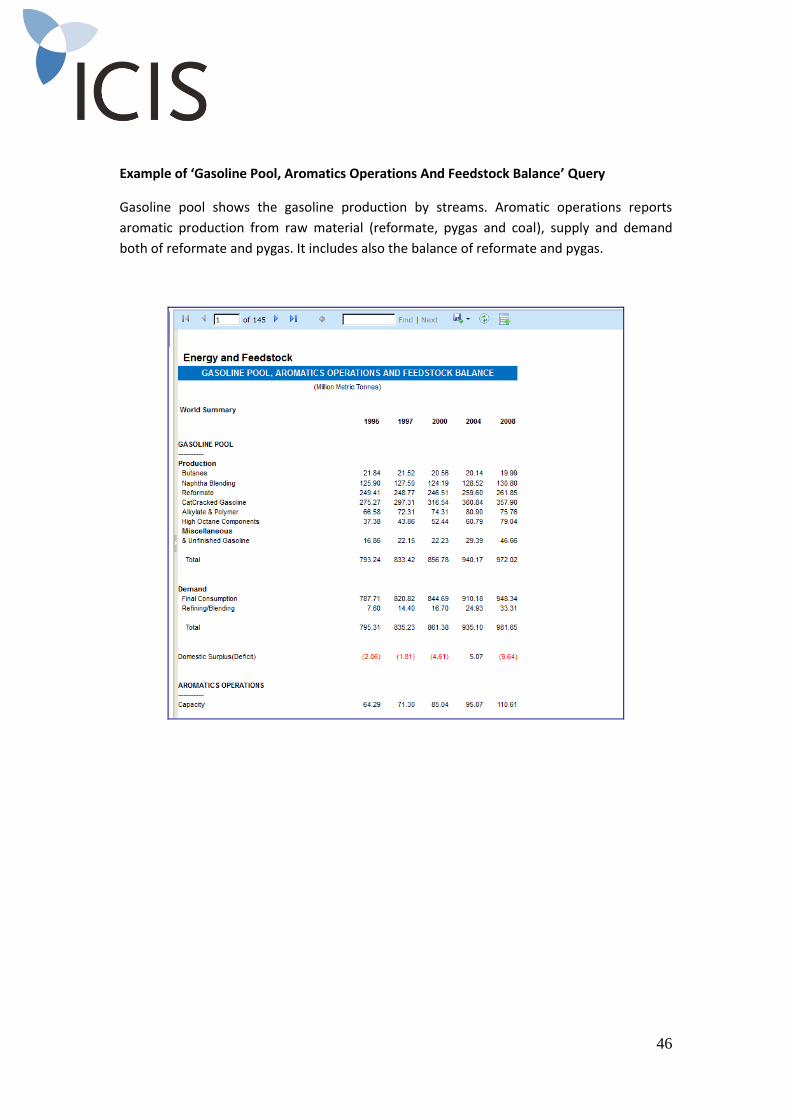
Example of ‘Naphtha Supply Demand Balance’ Query
This table presents naphtha supply by source (refinery, NGL plants and petrochemical back
flows) and demand by refinery and petrochemical uses. The calculated difference between
supply and demand is reported as surplus or deficit of naphtha.
Example of ‘Olefins Operations And Feedstock Balance’ Query
This table shows ethylene production by feedstocks. It reports feedstock supply by source
and demand. Surplus or deficit of each petroleum feedstocks (ethane/light gas, LPG,
naphtha and gas oil) is also included.
46
Example of ‘Gasoline Pool, Aromatics Operations And Feedstock Balance’ Query
Gasoline pool shows the gasoline production by streams. Aromatic operations reports
aromatic production from raw material (reformate, pygas and coal), supply and demand
both of reformate and pygas. It includes also the balance of reformate and pygas.
47
Part 16 – Glossary
Area - A group of countries selected to comprise a geographical area (i.e. Western Europe).
Ascending - A sorting method. The result is that the first row contains the lowest value, while the last
row contains the highest.
Balance - Numerical comparison that requires at least two sets of data. May include data based on
Capacity, Production, Consumption or Trade.
Capacity - Volume of production of which a plant is capable.
Complex - Combination of sites with interrelated operations.
Consumption - Quantity of product consumed.
Conversion Factor - Multiplier required to convert production into feedstock demand.
Country - Internationally recognized geographical/national state.
Database - Collection of data elements.
Delimited - A file in which values are stored separated by a comma, with alphanumeric values in
quotes.
Demand - Quantity of product required.
Derivative - Product produced from one or more other products.
Descending - A method of sorting. The result is that the first row contains the highest value, while the
last row contains the lowest.
Energy - Power as either input or output.
Export - Quantity of material, which is moved out of a country or region.
Financial Groups - Company comprised of a number of different Companies including joint-venture
participations. It may also own another Financial Group.
Import - Quantity of material, which is moved into a country or region.
Licensor - Company which licenses process technology.
Monomer - Basic petrochemical building block.
Nameplate Capacity – Officially specified capacity of the operating unit at the time of construction.
48
Operating Capacity - Officially specified production capability of the operating unit (except for pro-
rated indication of plant start-up or closure).
(Operating) Companies - Company recognized as the official operator of the production unit.
Operating Groups - Company comprised of a number of different Companies including joint-venture
participations. It may also own another Operating Group.
Plant Production - Quantity of product produced at operating unit. Note: ICIS does not supply details
on Plant Production.
Product - Independent identified material resulting from a production unit.
Product Family - Group of products, which share chemical and/or market similarities.
Production - Output from operating unit (usually shown on a country basis).
Query - Method of interrogating Database to retrieve required information.
Read-only - Capability to interact with Database is limited to a read basis.
Report - Output generated from a query on the Database.
Route - Method of production.
Severity - Degree to which an operating unit is subjected (usually applied only to steam-cracking
operations).
Severity Factor- Measure of the severity.
Site - Geographical location of a production unit, which automatically defines its country of
operation.
Sort - Method of reordering data in terms of specified parameters.
Statistical Production by Country - Quantity of product produced in the particular country.
Sub-region - Limited group of countries to represent a subset of an Area definition.
Supply - Quantity of material available.
Supply / Demand Balance - Comparison of quantity of material available with quantity required.
Technology - Method of production.
Units - Measure of quantity.
Zone - Description of area.