Embed Size (px)
Citation preview

Tinjauan Perekonomian Kabupaten Pakpak Bharat
64 Produk Domestik Regional Bruto Kabupaten Pakpak Bharat 2010
3.1 UMUM
Pertumbuhan penduduk dan
pertumbuhan angkatan kerja secara tradisional
dianggap sebagai salah satu faktor positif
memicu pertumbuhan ekonomi. Positif atau
negatifnya pertambahan penduduk bagi upaya
pembangunan ekonomi sepenuhnya tergantung
pada sistem perekonomian yang bersangkutan
untuk menyerap dan secara produktif
memanfaatkan tambahan tenaga kerja tersebut.
Selanjutnya adalah kemajuan teknologi.
Pendidikan dan kesehatan yang baik akan
mendorong kemampuan masyarakat untuk
mengadaptasi dan mempergunakan teknologi di
dalam produksi serta meningkatkan kemampuan
masyarakat untuk beradaptasi dengan perubahan
kapasitas dan teknikal teknologi dalam industri.
Kabupaten Pakpak Bharat tediri dari 8
kecamatan, yaitu: Kecamatan Salak, Kecamatan
Sitellu Tali Urang Julu, Kecamatan Pergetteng-
Getteng Sengkut, Kecamatan Pagindar,
Kecamatan Kerajaan, Kecamatan Sitellu Tali
Urang Jehe, Kecamatan Tinada dan Kecamatan
Siempat Rube. Sektor pertanian merupakan
potensi terbesar pendukung perekonomian
Pakpak Bharat sesuai dengan mata pencaharian
mayoritas penduduk adalah bertani, didukung
oleh kondisi alam dan topografinya.
3.1 GENERAL
Population growth and labor force
growth has traditionally been regarded as one
of the positive factors triggering economic
growth. Positive or negative population growth
for economic development efforts depends
entirely on the relevant economic systems to
absorb and productively utilize the additional
manpower. Next is the advancement of
technology. Education and good health will
encourage the public's ability to adapt and use
technology in production and to improve
society's ability to adapt to changing
technologies and technical capacity in the
industry.
Pakpak Bharat Regency is consists of 8
districts, that is: District Salak, District Sitellu
Tali Urang Julu, District Pergetteng-getteng
Sengkut, District Pagindar, District Kerajaan,
District Sitellu Tali Urang Jehe, District Tinada,
and District Siempat Rube. Biggest Potency
which is supporting Pakpak Bharat’s economics
society is agricultural sector according in
accordance with the livelihoods of the majority
of the population, and it is supported by natural
conditions and topography.
III. TINJAUAN PEREKONOMIAN
KABUPATEN PAKPAK BHARAT/
ECONOMIC HIGHLIGHT OF PAKPAK BHARAT REGENCY

Economic Highlight of Pakpak Bharat Regency
Gross Regional Domestic Product of Pakpak Bharat Regency 2010 65
Pada tahun 2010, pertumbuhan ekonomi
Kabupaten Pakpak Bharat mengalami
peningkatan yang cukup signifikan dari tahun
sebelumnya. Keberhasilan menaikkan
pertumbuhan ekonomi ini berimplikasi pada
kenaikan pendapatan per kapita.
Jika melihat pertumbuhan ekonomi
Sumatera Utara yang mencapai 6,35 persen,
maka pertumbuhan ekonomi Kabupaten Pakpak
Bharat lebih tinggi, sedangkan jika
dibandingkan dengan beberapa kabupaten
sekitar yaitu Kabupaten Dairi, Kabupaten Karo,
dan Kabupaten Humbang Hasundutan,
pertumbuhan ekonomi Kabupaten Pakpak
Bharat masih lebih tinggi.
In 2010, Economic growth of Pakpak
Bharat Regency experience a significant
increase from previous year. The success of
raising economic growth implies an increase in
income per capita.
By looking at the economic growth in
North Sumatera which reached 6,35 percent, the
economic growth of Pakpak Bharat Regency is
higher, while if its compared by some regents :
Dairi Regency, Karo Regency, and Humbang
Hasundutan Regency, economic growth of
Pakpak Bharat Regency is higher.
Tabel 3.1.
Pertumbuhan Ekonomi Empat Kabupaten Di Sumatera Utara Tahun 2010
Economic Growth in Four Regency in North Sumatera 2010
Kabupaten/Regency Pertumbuhan Ekonomi/Economic Growth
(1) (2)
Dairi 5,02
Humbang Hasundutan 5,45
Karo 6,03
Pakpak Bharat 6,77
Provinsi Sumatera Utara 6,35

Tinjauan Perekonomian Kabupaten Pakpak Bharat
66 Produk Domestik Regional Bruto Kabupaten Pakpak Bharat 2010
Grafik 3.1.
Pertumbuhan Ekonomi Empat Kabupaten Di Sumatera Utara Tahun 2010
Economic Growth in Four Regency in North Sumatera 2010
3.2 PDRB Tahun 2010
Produk Domestik Regional Bruto
(PDRB) Kabupaten Pakpak Bharat pada
tahun 2010 atas dasar harga berlaku sebesar
331,84 miliar rupiah dan atas dasar harga
konstan sebesar 164,88 miliar rupiah. Dari
nilai tersebut dapat diketahui peningkatan
nilai PDRB Pakpak Bharat tahun 2010 atas
dasar harga berlaku sebesar 3.54 kali dari
tahun 2000 sedang atas dasar harga konstan
sebesar 1,76 kali. Angka ini menunjukkan
peningkatan dibanding pada tahun 2009
dimana nilai PDRB atas dasar harga berlaku
naik sebesar 3,10 kali dan atas dasar harga
konstan 1,65 kali dari nilai PDRB tahun
2000.
3.2 GRDP 2010
Gross Regional Domestic Products
(GRDP) of Pakpak Bharat Regency in 2010
is 331,84 billion rupiahs based on current
prices and 164,88 billion rupiahs based on
constant prices. From that, Pakpak Bharat
Regency GRDP increase up to 3,54 times
from 2000 based on current prices and 1,76
times from 2000 based on constant prices.
That values GRDP is increased from 2009
whereas GRDP based on current price
increase 3,10 times from 2000, and GRDP
based on constant price 1,65 times from
2000.
0
1
2
3
4
5
6
7
Dairi Humbang
Hasundutan
Karo Pakpak
Bharat
Sumatera
Utara
5.02 5.45
6.03
6.77 6.35
Per
tum
bu
ha
n/G
row
th
Kabupaten/Regency

Economic Highlight of Pakpak Bharat Regency
Gross Regional Domestic Product of Pakpak Bharat Regency 2010 67
Tabel 3.2
Produk Regional Domestik Bruto Kab. Pakpak Bharat Tahun 2006-2010
Gross Domestic Regional Product of Pakpak Bharat Regency 2006-2010
Tahun/Year
PDRB Atas Dasar Harga Berlaku
GRDP at Current Price
PDRB Atas Dasar Harga Konstan
GRDP at Constant Price 2000
Jumlah (Juta Rp)/
Total (Million Rp)
Perkembangan/
Progress (%)
Jumlah (Juta Rp)/
Total (Million Rp)
Perkembangan/
Progress (%)
(1) (2) (3) (4) (5)
2006 207,589.39 221.62 130,087.76 138.88
2007 231,068.59 246.68 137,830.78 147.14
2008 258,923.60 276.42 145,915.46 155.78
2009 290,299.80 309.92 154,420.18 164.85
2010*) 331,841.14 354.26 164,878.49 176.02
*) Angka Sementara/Preliminary Figures
3.3 Pertumbuhan Ekonomi Tahun 2010
3.3.1 Pertumbuhan PDRB Atas Dasar
Harga Berlaku
Pertumbuhan PDRB atas dasar harga
berlaku sebenarnya belum bias
menggambarkan pertumbuhan yang
sebenarnya karena masih dipengaruhi oleh
perubahan harga yang naik turun. Maka untuk
mengetahui petumbuhan PDRB atau
Pertumbuhan ekonomi di suatu daerah dipakai
pertumbuhan PDRB Atas Dasar Harga
Konstan. Adapun pertumbuhan PDRB atas
dasar harga berlaku Tahun 2010 sebesar 14,31
persen. Angka ini menunjukkan adanya
kenaikan jika dibandingkan dengan
pertumbuhan tahun 2009 yang mencapai hanya
12,12 persen.
Bila dilihat per sektor, semua sektor
mempunyai perkembangan positif yang
besarnya tiap sektor berada di atas 10 persen
kecuali sektor pertambangan dan penggalian.
Sektor yang mempunyai perkembangan
3.3 Economic Growth 2010
3.3.1 GRDP Growth Based on Current
Prices
GRDP growth based on current prices
cannot descript the real growth because it’s
influenced of unstabil goods price. For shows
the GRDP or economic progress at regency
existantly, it’s admitted the growth based on
constant price. GRDP growth based on current
price in 2010 is 14,31 percent, higher than
GRDP growth in 2009 with 12,12 percent.
In sectoral, all sector have positif
progress above 10 percent except mining and
quarrying sector. The most increasing sector is
services sector with 30,54 percent progress.
Meanwhile, mining and quarrying sector had

Tinjauan Perekonomian Kabupaten Pakpak Bharat
68 Produk Domestik Regional Bruto Kabupaten Pakpak Bharat 2010
terbesar adalah jasa-jasa sebesar 30,54 persen.
Sedangkan sektor pertambangan dan
penggalian mempunyai kenaikan yang paling
kecil yaitu sekitar 8,25 persen. Secara
berurutan pertumbuhan sektor-sektor dapat
dilihat sebagai berikut:
the lowest growth with 8,25 percent. The
increasing for each sectors can described in
text below:
Grafik 3.3.1
Perkembangan Ekonomi Per Sektor Atas Dasar Harga Berlaku
Kabupaten Pakpak Bharat Tahun 2010
Economic Progress by Sectoral at Current Price in Pakpak Bharat Regency 2010
Khusus untuk sektor pertanian,
perkembangan yang paling besar terjadi pada
sub sektor tanaman bahan makanan yaitu 27,34
persen. Sedangkan persentase perkembangan
terkecil di sektor pertanian terjadi pada sub
sektor Kehutanan, yaitu sebesar minus 21,94
persen.
3.3.2 Pertumbuhan PDRB Atas Dasar
Harga Konstan
Pertumbuhan PDRB atas dasar harga
konstan lebih bisa menggambarkan
pertumbuhan yang sebenarnya jika
Specially for agriculture sector there is
big ascent in food crops 27,34 percent in 2010.
While the smallest percentage growth in the
agricultural sector is occurred in the forestry
sub sector, amounting to negative 21,94
percent.
3.3.2 GRDP Growth Based on Constant
Prices
GRDP in constant price give the real
growth than GRDP in current price, because
GRDP at constant price use the same price for
05
101520253035
Perkemban
gan/P
rog
ress
Sektor/Sectors

Economic Highlight of Pakpak Bharat Regency
Gross Regional Domestic Product of Pakpak Bharat Regency 2010 69
dibandingkan dengan pertumbuhan PDRB atas
dasar harga berlaku. Hal ini karena PDRB atas
dasar harga konstan menggunakan harga yang
tetap dari tahun ke tahun sehingga perubahan
harga tidak berpengaruh terhadap
penghitungan.
Adapun pertumbuhan ekonomi
Kabupaten Pakpak Bharat atas dasar harga
konstan pada tahun 2010 menunjukkan adanya
pertumbuhan yang lebih besar dibanding tahun
2009 yaitu dari 5,83 persen menjadi 6,77
persen di tahun 2010. Jika melihat
pertumbuhan ekonomi Kabupaten Pakpak
Bharat dari tahun ke tahun mulai tahun 2006
sampai dengan 2010 menunjukkan angka yang
berfluktuatif. Adapun persentase pertumbuhan
terbesar terjadi di tahun 2010 yang mencapai
sebesar 6,77 persen. Dan untuk persentase
pertumbuhan terkecil terjadi di tahun 2009
yang sebesar 5,83 persen. Untuk lebih jelas,
pertumbuhan ekonomi selama 5 tahun terakhir
dapat dilihat pada tabel berikut:
years so the different price every year didn’t
give any effect to enumeration.
There is higher growth of GRDP at
constant price of Pakpak Bharat Regency in
2010 compared for GRDP at constan price in
2009, from 5,83 percent to 6,77 percent in
2010. During the period 2006-2010, economic
growth of Pakpak Bharat Regency experienced
fluctuative value. The highest growth happened
in 2010 in level 6,77 percent, and the lowest
growth happened in 2009 with 5,83 percent
growth. For clearly, economic growth in last 5
years served in next table:

Tinjauan Perekonomian Kabupaten Pakpak Bharat
70 Produk Domestik Regional Bruto Kabupaten Pakpak Bharat 2010
Grafik 3.3.2
Pertumbuhan Ekonomi Kabupaten Pakpak Bharat
Economic Growth Of Pakpak Bharat Regency
Jika diperhatikan persentase
pertumbuhan per sektor atas dasar harga
konstan di tahun 2010, pertumbuhan terbesar
terjadi pada sektor jasa-jasa sebesar 24,57
persen, dan pertumbuhan terendah terjadi di
sektor pertambangan dan penggalian sebesar
1,89 persen. Adapun persentase pertumbuhan
ekonomi per sektor atas dasar harga konstan
dapat dilihat sebagai berikut:
We can see the growth in each sectors
based on constant prices in 2010, the highest
growth happened in services sector 24,57
percent, and the lowest growth is in mining
and quarrying sector with 1,89 percent.
Economic growth at constant price percentage
can be seen in next table:
6.09 5.95
5.87 5.83
6.77
5.2
5.4
5.6
5.8
6
6.2
6.4
6.6
6.8
7
2006 2007 2008 2009 2010
Pertumbuhan
/Gro
wth
Tahun/Year

Economic Highlight of Pakpak Bharat Regency
Gross Regional Domestic Product of Pakpak Bharat Regency 2010 71
Grafik 3.3.3
Pertumbuhan Ekonomi Per Sektor Atas Dasar Harga Konstan
Kabupaten Pakpak Bharat Tahun 2010
Economic Growth By Sector at Constant Price In Pakpak Bharat Regency 2010
Khusus untuk sektor pertanian,
pertumbuhan yang paling besar terjadi pada
sub sektor tanaman bahan makanan yaitu 11,78
persen. Sedangkan persentase pertumbuhan
terkecil di sektor pertanian terjadi pada sub
sektor Kehutanan, yaitu sebesar - 24,37 persen.
3.4 Struktur PDRB Kabupaten Pakpak
Bharat
Dalam struktur PDRB dapat dilihat
kontribusi atau andil tiap sektor terhadap
pertumbuhan ekonomi Kabupaten Pakpak
Bharat. Sama seperti tahun-tahun sebelumnya,
pada tahun 2010, perekonomian Kabupaten
Pakpak Bharat masih tetap mengandalkan
sektor pertanian. Hal ini ditandai dengan
distribusi Produk Domestik Regional atas dasar
Specially for agriculture sector there is
big ascent in food crops 11,78 percent in 2010.
While the smallest percentage growth in the
agricultural sector is occurred in the forestry
sub sector, amounting to - 24,37 percent.
3.4 GRDP Structure of Pakpak Bharat
Regency
The contribution of each sector to
economic growth of Pakpak Bharat Regency
can be seen in the structure of GRDP. Just like
previous years, in 2010, the economy of
Pakpak Bharat Regency is still remains relies
on agricultural sector. It is characterized by
the distribution of Regional Domestic Product
at current prices, the agricultural sector is
0
5
10
15
20
25
4.71
1.89 2.38 4.67
6.61 4.69
8.99 9.39
24.57
Pertumbuhan
/Gro
wth
Sektor/Sector

Tinjauan Perekonomian Kabupaten Pakpak Bharat
72 Produk Domestik Regional Bruto Kabupaten Pakpak Bharat 2010
harga berlaku, sektor pertanian sangat
dominan. Hal ini dikarenakan sebahagian besar
masyarakat Kabupaten Pakpak Bharat
menggantungkan hidupnya pada sektor
pertanian. Namun dari tahun ke tahun, peranan
sektor ini semakin menurun.
3.4.1 Struktur PDRB Atas Dasar Harga
Berlaku
Struktur PDRB Kabupaten Pakpak
Bharat Tahun 2010 masih sama seperti tahun-
tahun sebelumnya, yaitu didominasi oleh 3
sektor yaitu sektor pertanian, sektor
perdagangan, hotel, dan restoran, serta sektor
bangunan dengan kontribusi masing-masing
diatas 10 persen. Sedangkan sektor-sektor yang
lain memberikan kontribusi dibawah 10
persen. Untuk lebih jelasnya, kontribusi
masing-masing sektor dapat dilihat pada tabel
berikut:
very dominant. This is because of majority of
the people of Pakpak Bharat Regency rely on
the agricultural sector. But from year to year,
the role of this sector has declined.
3.4.1 GRDP Structure Based On Current
Prices
GRDP structure of Pakpak Bharat
Regency in 2010 is still the same with the
previous years which dominated by 3 sectors,
they are agricultural sector, trade, hotel, and
restaurant sector, and construction sector. This
role still the same in each year with the
contribution above 10 percent. Meanwhile the
other sectors give the contribution below 10
percent. More brief explanation, the
contribution of each sector can be seen in the
table below:
Tabel 3.4.1
Struktur Ekonomi Kabupaten Pakpak Bharat Atas Dasar Harga Berlaku
Tahun 2006 Sampai Dengan 2010
Pakpak Bharat Regency Economic Structure During 2006-2010 at Current Price
Lapangan Usaha/Industrial Origin
Kontribusi Tiap Sektor (persen)/
Contribution each sector (percent)
2006 2007 2008 2009 2010*)
(1) (2) (3) (4) (5) (6)
1. Pertanian/Agriculture 66.69 65.89 65.60 65.21 64.53
2. Pertambangan & Penggalian/Mining &
Quarrying
0.06 0.06 0.06 0.05 0.05
3. Industri Pengolahan/Industry 0.29 0.27 0.25 0.23 0.23
4. Listrik, Gas dan Air Bersih/Electricity,
Gas & Water
0.34 0.33 0.32 0.33 0.32
5. Bangunan/Construction 9.91 10.53 10.76 10.92 10.53
6. Perdagangan, Hotel dan Restoran/Trade,
Hotel and Restaurant.
12.88 12.59 12.43 12.22 12.10

Economic Highlight of Pakpak Bharat Regency
Gross Regional Domestic Product of Pakpak Bharat Regency 2010 73
7. Pengangkutan dan
Komunikasi/Transportation and
Communication
1.57 1.76 1.92 1.99 2.12
8. Keuangan, Persewaan dan Jasa
Perusahaan/Financial Institution,
Ownership and Business Services
1.15 1.52 1.54 1.58 1.60
9. Jasa-jasa/Services 7.11 7.06 7.11 7.46 8.52
PDRB/GRDP 100.00 100.00 100.00 100.00 100.00
*) Angka Sementara/Preliminary Figures
Grafik 3.4.1
Struktur Ekonomi Kabupaten Pakpak Bharat Tahun 2010
Economic Structure of Pakpak Bharat Regency 2010
3.4.2 Struktur PDRB Atas Dasar Harga
Konstan
Struktur PDRB Kabupaten Pakpak
Bharat tahun 2010 atas dasar harga konstan
sama dengan struktur PDRB atas dasar harga
berlaku, yaitu didominasi oleh 3 sektor yaitu
sektor pertanian, sektor perdagangan, hotel,
dan restoran serta sektor bangunan. Andil ini
masih sama dari tahun ke tahun dengan
kontribusi masing-masing diatas 11 persen.
Sedangkan sektor-sektor yang lain
3.4.2 GRDP Structure Based on Constant
Prices
GRDP structure of Pakpak Bharat
Regency in 2010 based on constant price is
same with GRDP structure based on the
current price, which dominated by 3 sectors,
they are agricultural sector, trade, hotel, and
restaurant sector, and construction sector.
This role still the same in each year with the
contribution above 11 percent. Meanwhile
the other sectors give the contribution below
64.53
0.05
0.23
0.32
10.53
12.1
2.12
1.6
8.52
Pertanian
Pertambangan & Penggalian
Industri Pengolahan
Listrik, Gas dan Air
Bangunan
Perdagangan, Hotel dan
Restoran
Pengangkutan dan Komunikasi
Keuangan, Persewaan dan Jasa
Perusahaan

Tinjauan Perekonomian Kabupaten Pakpak Bharat
74 Produk Domestik Regional Bruto Kabupaten Pakpak Bharat 2010
memberikan kontribusi di bawah 11 persen.
Untuk lebih jelasnya, kontribusi masing-
masing sektor dapat dilihat pada tabel
berikut:
11 percent. More brief explanation, the
contribution of each sector can be seen in
the table below:
Tabel 3.4.2
Struktur Ekonomi Kabupaten Pakpak Bharat Atas Dasar Harga Konstan 2000
Tahun 2006 Sampai Dengan 2010
Pakpak Bharat Regency Economic Structure During 2006-2010 at Constan Price
Base Year 2000
Lapangan Usaha/Industrial Origin
Kontribusi Tiap Sektor (persen)/
Contribution each sector (percent)
2006 2007 2008 2009 2010*)
(1) (2) (3) (4) (5) (6)
1. Pertanian/Agriculture 68.15 66.85 65.93 64.96 63.71
2. Pertambangan & Penggalian/Mining &
Quarrying
0.06 0.06 0.06 0.06 0.06
3. Industri Pengolahan/Industry 0.32 0.30 0.29 0.28 0.27
4. Listrik, Gas dan Air Bersih/Electricity, Gas
& Water
0.24 0.24 0.24 0.24 0.24
5. Bangunan/Construction 9.25 9.99 10.67 11.20 11.18
6. Perdagangan, Hotel dan Restoran/Trade,
Hotel and Restaurant.
11.66 11.72 11.74 11.77 11.54
7. Pengangkutan dan
Komunikasi/Transportation and
Communication
1.07 1.13 1.18 1.23 1.25
8. Keuangan, Persewaan dan Jasa
Perusahaan/Financial Institution, Ownership
and Business Services
1.09 1.45 1.49 1.52 1.56
9. Jasa-jasa/Services 8.15 8.26 8.40 8.73 10.19
PDRB/GRDP 100.00 100.00 100.00 100.00 100.00
*) Angka Sementara/Preliminary Figures

Economic Highlight of Pakpak Bharat Regency
Gross Regional Domestic Product of Pakpak Bharat Regency 2010 75
Grafik 3.4.2
Struktur Ekonomi Kabupaten Pakpak Bharat Atas Dasar Harga Konstan Tahun 2010
Pakpak Bharat Regency Economic Structure Based on Constant Price 2010
3.5 Indeks Perkembangan PDRB
Kabupaten Pakpak Bharat
Indek perkembangan digunakan
untuk mengetahui laju perkembangan
ekonomi Kabupaten Pakpak Bharat baik
secara regional maupun secara sektoral yang
telah dicapai setiap tahun jika dibandingkan
dengan tahun dasar (tahun 2000). Semakin
tinggi nilai indeknya, maka semakin tinggi
pula laju perkembangannya.
3.5.1 Indeks Perkembangan PDRB
Kabupaten Pakpak Bharat Atas
Dasar Harga Berlaku
Dengan PDRB atas dasar harga
berlaku, perkembangan PDRB secara
regional pada tahun 2010 bila dibandingkan
3.5 GRDP Improvement Index of Pakpak
Bharat Regency
Improvement index used to measure
the economic progress in Pakpak Bharat
Regency regionally or sectorally which has
been gained in each year compared by the
base year (year 2000). As long as the index
rate is getting higher this can be effected to
its improvement.
3.5.1 GRDP Improvement Index of
Pakpak Bharat Regency Based on
Current Prices
With GRDP based on current prices,
The improvement of GRDP regionally in
2010 (compare with year 2000 = 100) raise
Pertanian
64%
Pertambangan &
Penggalian
0%
Industri Pengolahan
0%
Listrik, Gas dan Air
0%
Bangunan
11%
Perdagangan, Hotel
dan Restoran
12%
Pengangkutan dan
Komunikasi
1%
Keuangan,
Persewaan dan Jasa
Perusahaan
2% Jasa-Jasa
10%
Tinjauan Perekonomian Kabupaten Pakpak Bharat
76 Produk Domestik Regional Bruto Kabupaten Pakpak Bharat 2010
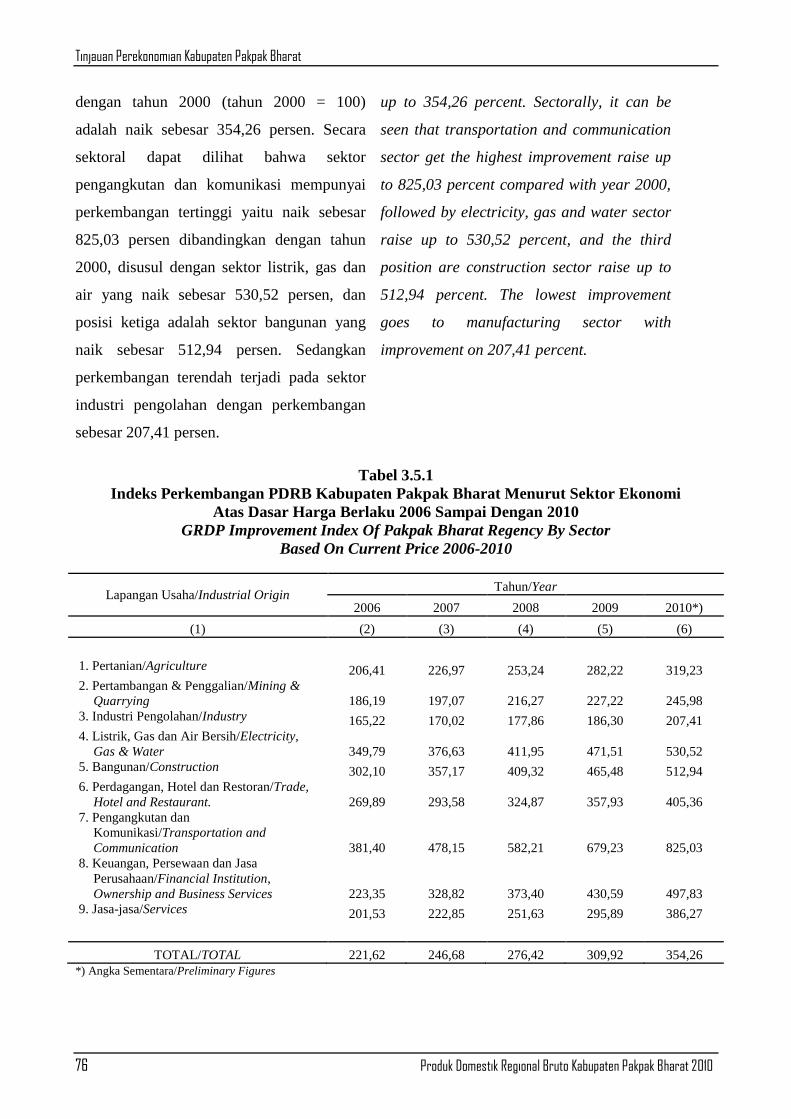
dengan tahun 2000 (tahun 2000 = 100)
adalah naik sebesar 354,26 persen. Secara
sektoral dapat dilihat bahwa sektor
pengangkutan dan komunikasi mempunyai
perkembangan tertinggi yaitu naik sebesar
825,03 persen dibandingkan dengan tahun
2000, disusul dengan sektor listrik, gas dan
air yang naik sebesar 530,52 persen, dan
posisi ketiga adalah sektor bangunan yang
naik sebesar 512,94 persen. Sedangkan
perkembangan terendah terjadi pada sektor
industri pengolahan dengan perkembangan
sebesar 207,41 persen.
up to 354,26 percent. Sectorally, it can be
seen that transportation and communication
sector get the highest improvement raise up
to 825,03 percent compared with year 2000,
followed by electricity, gas and water sector
raise up to 530,52 percent, and the third
position are construction sector raise up to
512,94 percent. The lowest improvement
goes to manufacturing sector with
improvement on 207,41 percent.
Tabel 3.5.1
Indeks Perkembangan PDRB Kabupaten Pakpak Bharat Menurut Sektor Ekonomi
Atas Dasar Harga Berlaku 2006 Sampai Dengan 2010
GRDP Improvement Index Of Pakpak Bharat Regency By Sector
Based On Current Price 2006-2010
Lapangan Usaha/Industrial Origin Tahun/Year
2006 2007 2008 2009 2010*)
(1) (2) (3) (4) (5) (6)
1. Pertanian/Agriculture 206,41 226,97 253,24 282,22 319,23
2. Pertambangan & Penggalian/Mining &
Quarrying 186,19 197,07 216,27 227,22 245,98
3. Industri Pengolahan/Industry 165,22 170,02 177,86 186,30 207,41
4. Listrik, Gas dan Air Bersih/Electricity,
Gas & Water 349,79 376,63 411,95 471,51 530,52
5. Bangunan/Construction 302,10 357,17 409,32 465,48 512,94
6. Perdagangan, Hotel dan Restoran/Trade,
Hotel and Restaurant. 269,89 293,58 324,87 357,93 405,36
7. Pengangkutan dan
Komunikasi/Transportation and
Communication 381,40 478,15 582,21 679,23 825,03
8. Keuangan, Persewaan dan Jasa
Perusahaan/Financial Institution,
Ownership and Business Services 223,35 328,82 373,40 430,59 497,83
9. Jasa-jasa/Services 201,53 222,85 251,63 295,89 386,27
TOTAL/TOTAL 221,62 246,68 276,42 309,92 354,26
*) Angka Sementara/Preliminary Figures

Economic Highlight of Pakpak Bharat Regency
Gross Regional Domestic Product of Pakpak Bharat Regency 2010 77
3.5.2 Indeks Perkembangan PDRB
Kabupaten Pakpak Bharat Atas
Dasar Harga Konstan 2000
Perkembangan PDRB secara regional
Tahun 2010 atas dasar harga konstan jika
dibanding dengan tahun 2000 adalah sebesar
176,02 persen. Jika ditinjau secara sektoral,
maka urutan pertama masih sektor bangunan
sebesar 270,65 persen, urutan kedua adalah
sektor pengangkutan dan komunikasi yaitu
sebesar 242,54 persen, dan urutan ketiga
adalah sektor keuangan, persewaan dan jasa
perusahaan sebesar 241,20 persen.
Kemudian sektor yang perkembangannya
paling rendah adalah sektor industri
pengolahan yaitu dengan perkembangan
sebesar 121,54 persen.
3.5.2 GRDP Improvement Index of
Pakpak Bharat Regency Based on
Constant Market Prices
GRDP Improvement regionally in
2010 based on constant price 2000 is 176,02
percent compared with year 2000. If its
observed sectorally, the first rank is still
same with last year, construction sector on
270,65 percent, the second rank is transport
and communication sector 242,54 percent,
and the third rank is Financial institution,
owner and business services sector on
241,20 percent. And than the lowest improve
sector is the manufacturing sector 121,54
percent.
Tabel 3.5.2
Indek Perkembangan PDRB Kabupaten Pakpak Bharat Menurut Sektor Ekonomi
Atas Dasar Harga Konstan 2006 Sampai Dengan 2010
GRDP Improvement Index Of Pakpak Bharat Regency By Sector
Based On Constant Price 2006-2010
Lapangan Usaha/Industrial Origin Tahun/Year
2006 2007 2008 2009 2010*)
(1) (2) (3) (4) (5) (6)
1. Pertanian/Agriculture 132,17 137,36 143,41 149,55 156,60
2. Pertambangan & Penggalian/Mining &
Quarrying
123,53 129,20 137,61 141,97 144,65
3. Industri Pengolahan/Industry 114,09 114,82 116,24 118,71 121,54
4. Listrik, Gas dan Air Bersih/Electricity, Gas
& Water
151,79 162,87 175,19 186,72 195,44
5. Bangunan/Construction 176,67 202,15 228,53 253,87 270,65
6. Perdagangan, Hotel dan Restoran/Trade,
Hotel and Restaurant.
153,10 163,05 172,91 183,44 192,04
7. Pengangkutan dan
Komunikasi/Transportation and
Communication
164,02 182,14 202,81 222,53 242,54
8. Keuangan, Persewaan dan Jasa
Perusahaan/Financial Institution, Ownership
and Business Services
133,43 187,77 203,27 220,50 241,20
9. Jasa-jasa/Services 144,84 155,49 167,41 184,22 229,48

Tinjauan Perekonomian Kabupaten Pakpak Bharat
78 Produk Domestik Regional Bruto Kabupaten Pakpak Bharat 2010
TOTAL/TOTAL 138,88 147,14 155,78 164,85 176,02
*) Angka Sementara/Preliminary Figures
3.6 Indeks Implisit PDRB Kabupaten
Pakpak Bharat
Indek implisit merupakan hasil bagi
PDRB atas dasar harga berlaku dengan
PDRB atas dasar harga konstan pada tahun
yang sama untuk tiap-tiap sektor. Kegunaan
indek implisit pada penghitungan PDRB
adalah untuk mengetahui tingkat kenaikan
harga dari tahun dasar 2000 untuk masing-
masing sektor.
Menurut penghitungan PDRB Tahun
2010, ternyata PDRB Kabupaten Pakpak
Bharat mengalami kenaikan harga rata-rata
sebesar 101,26 persen. Sektor dengan
kenaikan harga tertinggi terjadi pada sektor
pengangkutan dan komunikasi yang naik
sebesar 240,16 persen. Sedangkan sektor
yang mengalami kenaikan harga paling
rendah adalah sektor jasa-jasa yaitu dengan
kenaikan harga sebesar 68,32 persen. Agar
lebih jelas dapat dilihat pada tabel berikut :
3.6 GRDP Implicite Index of Pakpak
Bharat Regency
Implicite Index is the result of GRDP
based at current prices devided by GRDP
based at constant price in the same year for
each sector. This index is used to see the
increasing of good prices from based year
2000 for every sector.
According to the GRDP estimation in
2010, GRDP of Pakpak Bharat Regency
happened the fluctuation in average of
101,26 percent. Most of sectors in 2010 has
fluctuative above of average prices with the
highest fluctuation happened in
transportation and communication sector
raise up to 240,16 percent. Meanwhile, the
lowest fluctuation sector is services sector
with the fluctuation on 68,32 percent. More
brief explanation, the contribution of each
sector can be seen in the table below:

Economic Highlight of Pakpak Bharat Regency
Gross Regional Domestic Product of Pakpak Bharat Regency 2010 79
Tabel 3.6
Indek Implisit PDRB Kabupaten Pakpak Bharat Tahun 2006 sampai dengan 2010
(Tahun 2000 = 100)
GRDP Implisit Index of Pakpak Bharat Regency 2006-2010
Lapangan Usaha/Industrial Origin Tahun/Year
2006 2007 2008 2009 2010*)
(1) (2) (3) (4) (5) (6)
1. Pertanian/Agriculture 156,17 165,24 176,58 188,71 203,85
2. Pertambangan & Penggalian/Mining &
Quarrying
150,73 152,54 157,16 160,05 170,05
3. Industri Pengolahan/Industry 144,81 148,07 153,01 156,93 170,66
4. Listrik, Gas dan Air Bersih/Electricity,
Gas & Water
230,43 231,25 235,14 252,53 271,46
5. Bangunan/Construction 170,99 176,69 179,11 183,36 189,52
6. Perdagangan, Hotel dan Restoran/Trade,
Hotel and Restaurant.
176,29 180,06 187,88 195,12 211,08
7. Pengangkutan dan
Komunikasi/Transportation and
Communication
232,54 262,51 287,07 305,22 340,16
8. Keuangan, Persewaan dan Jasa
Perusahaan/Financial Institution,
Ownership and Business Services
167,39 175,12 183,70 195,28 206,40
9. Jasa-jasa/Services 139,15 143,32 150,31 160,62 168,32
TOTAL PDRB/TOTAL GRDP 159,58 167,65 177,45 187,99 201,26
*) Angka Sementara/Preliminary Figures
3.7 Pendapatan Regional Per Kapita
Kabupaten Pakpak Bharat
Pendapatan Regional adalah PDRB
dikurangi penyusutan dan pajak tak langsung
netto. Apabila Pendapatan Regional dibagi
dengan jumlah penduduk pertengahan tahun
maka dihasilkan Pendapatan Regional per
kapita. Pendapatan Regional per kapita inilah
yang biasanya disebut pendapatan
perkapita. Meski belum mencerminkan
tingkat pemerataan, pendapatan perkapita
dapat dijadikan salah satu indikator guna
melihat keberhasilan pembangunan
perekonomian di suatu wilayah.
3.7 Regional Income Per Capita of Pakpak
Bharat Regency
Regional Income is GRDP minus
depreciation and nett indirect tax. If the
regional income devided by mid year
population, so the result is the regional
income per capita. This regional income per
capita usually called as “Income Per
Capita” Although this not obviously
describes about the equality, income per
capita can be used as one of the indicator to
measure the economic development progress
in a region. Income per capita growth of
Pakpak Bharat Regency shows the positive

Tinjauan Perekonomian Kabupaten Pakpak Bharat
80 Produk Domestik Regional Bruto Kabupaten Pakpak Bharat 2010
Perkembangan pendapatan per kapita
Kabupaten Pakpak Bharat menunjukkan
perubahan yang cukup baik, dimana
pendapatan per kapita tahun 2005 sebesar
5.144.745 rupiah per tahun atau sebesar
14.095 rupiah per hari dan tahun 2008 adalah
sebesar 6.643.666 rupiah per tahun atau
18.201 rupiah per hari. Sedangkan
pendapatan perkapita Tahun 2010 sebesar
8.192.596 rupiah per tahun atau 22.445
rupiah per hari dengan kenaikan sebesar
59,24 persen dari Tahun 2005. Agar lebih
jelas dapat dilihat pada tabel berikut:
progress, where income percapita in 2005
5.144.745 rupiahs per year or 14.095
rupiahs per day, and in 2008 is at 6.643.666
rupiahs per year ar 18.201 rupiahs per day.
Income percapita in 2010 is 8.192.596
rupiahs per year or 22.445 rupiahs per day
with the improvement on 59,24 percent from
year 2005. More Brief Information of
Income per capita and its improvement, see
below :
Tabel 3.7
Pendapatan Perkapita Kabupaten Pakpak Bharat
dan Perkembangannya Tahun 2005-2010
Income Percapita and Its Improvement of Pakpak Bharat Regency 2005-2010
Tahun/Year Pendapatan Per Kapita/ Income per Capita (Rp)
Harga Berlaku/ Current Price Harga Konstan/Constant Price
(1) (2) (3)
2005 5,144,745.04 3,360,330.22
2006 5,549,479.74 3,477,631.40
2007 6,051,133.64 3,609,458.32
2008 6,643,666.08 3,744,013.98
2009 7,299,834.01 3,883,026.11
2010*) 8,192,596.93 4,070,571.27
*) Angka Sementara/Preliminary Figures