Embed Size (px)
Citation preview
Imperfect contract enforcement, �rm size,and the pattern of trade
Arnaud Costinot1
Department of EconomicsPrinceton University
November 14, 2004
Abstract
This paper analyzes the impact of imperfect contract enforcement on�rm size and the pattern of trade. We consider a world economy com-prising two large countries, with a continuum of goods and one factor ofproduction, labor. Each good is characterized by its complexity, de�nedas the number of elementary tasks that must be performed to produceone unit. There are increasing returns to scale in the performance of eachtask, which creates gains from the division of labor. When contracts arenot perfectly enforced, the trade-o¤ between these gains and transactioncosts pins down �rm size across sectors in each country. When the twocountries open up to trade, the country where �rms are larger underautarky � in e¢ ciency units of labor � specializes in the more complexgoods. In our model, it is the country where the product of institutionalquality and workers�productivity is larger. Both institutions and pro-ductivity levels are independent sources of comparative advantage. Ourmodel is consistent with a variety of stylized facts concerning �rm sizeand international trade. It predicts that when institutional improvementand productivity gains occur in developed countries, all countries gain;but that when they occur in developing countries, developed countriesmight be hurt.
Keywords Imperfect contract enforcement, Firm size, Ricardiancomparative advantage
1I am grateful to Giovanni Maggi for invaluable guidance. I would also like tothank Fernando Botelho, Alvaro Bustos, Sylvain Champonnois, Wiola Dziuda, Bent-ley MacLeod, Mark Wright, and especially Avinash Dixit and Gene Grossman forvery helpful discussions and comments.
1
1 Introduction
This paper proposes a simple theory of international trade in the pres-ence of imperfect contract enforcement. The core of the theory lies inthe impact of the quality of contract enforcement on the optimal sizeof �rms. The two key elements of the theory are: (i) gains from thedivision of labor; and (ii) transaction costs. Gains from the division oflabor depend on the complexity of the production process, which is afunction of an industry�s technology. Transaction costs depend on thequality of institutions and workers�productivity, which are characteris-tics of countries. When contracts are not perfectly enforced, the trade-o¤between these two forces pins down �rm size across industries in eachcountry. When countries open up to trade, the endogenous di¤erences inthe optimal organization of �rms across countries determine the patternof trade.
Fourteen years ago, North [1990] noted: �For 200 years, the gainsfrom trade made possible by increasing specialization and division of la-bor have been the corner stone of economic theory. [...] But the manyeconomists who built this approach into an elegant body of economictheory did so without regard to the costliness of this exchange process�.Since then, economists have been catching up. Transaction costs, andthe institutions that cope with them, have now received a great deal ofattention in topics as diverse as: the organization of the �rm, politicaleconomy, economic growth, and international trade.2 The main contri-bution of this paper is to develop a positive theory of international tradethat incorporates both institutions and their impact on the organizationof the �rm. Though simple, our theory may help explain a variety ofstylized facts concerning �rm size and international trade.
Section 2 illustrates some of the main ideas of our analysis throughan example. The formal set-up of the model is described in section 3.We consider an economy with a continuum of goods and one productivefactor, labor. The production of every good requires that a set of ele-mentary tasks be performed. Like in Smith [1776]�s pin factory, thereare increasing returns to scale in the performance of each task: beforebeing able to perform a task, workers must spend a �xed amount of timelearning it. Goods di¤er in their �complexity�, de�ned as the numberof elementary tasks that must be performed to produce one unit. Themore complex a good is, the longer it takes to learn how to perform alltasks, and the larger are the gains from the division of labor.
2See e.g. Williamson [1979], Dixit [1996], Acemoglu et al. [2001] andLevchenko [2003], respectively.
2
In each industry, production is organized by labor contracts that as-sign elementary tasks to workers. But, contract enforcement is imperfect.If the labor contract of a worker is enforced, she performs her tasks inaccordance with the terms of her contract; otherwise, she does not per-form at all. A key parameter of the model is the probability with whicha given labor contract is enforced. This probability is assumed identicalacross industries and aims to capture the �quality of institutions�, thatis the e¢ ciency of the judicial system and/or the level of trust, in a givencountry.
Section 4 characterizes the e¢ cient organization of production. Ouranalysis of �rm size builds on previous works by Becker and Mur-phy [1992] and Kremer [1993]. It predicts that �rm size increases withthe quality of institutions and the complexity of the goods, but decreaseswith the productivity of the workforce. This may help explain why coun-tries with more e¢ cient judicial systems have larger �rms and why �rmsare larger in high technology industries. Our analysis also predicts thatthe dispersion of �rm size across industries decreases with institutionalquality and workers�productivity.
Section 5 analyzes the pattern of trade between two countries, whichshare the same technology, but di¤er in the quality of their institutionsand the productivity of their workers. Because there are increasing re-turns to scale in the performance of each task, the country where �rmsare larger under autarky � in e¢ ciency units of labor � specializes inthe more complex goods under free trade. In our model, it is the countrywhere the product of institutional quality and workers�productivity islarger. Both institutions and productivity levels are independent sourcesof comparative advantage. In particular, a higher absolute productivitylevel confers comparative advantage in the more complex sectors.
The model predicts that developed countries specialize in the morecomplex sectors, and developing countries in the less complex sectors.This is consistent with the higher share of employment in primary sectorsin developing countries. In turn, international trade decreases average�rm size in developing countries, while increasing it in developed coun-tries. However, there is no simple relationship between cross-countrydi¤erences in �rm size and the pattern of trade. While institutions andproductivity a¤ect the pattern of trade in the same direction, they af-fect �rm size in opposite directions. As a result, the same cross-countrydi¤erences in �rm size may lead to opposite patterns of specialization,depending on their origins.
3
Section 6 discusses the welfare impacts of institutional improvementand productivity gains in the two countries. When institutional im-provement and productivity gains occur in the developed country, bothcountries gain. But when they occur in the developing country, thedeveloped country might be harmed. Our results echo the analysis oftechnological progress in Krugman [1986].
Section 7 extends our model to discuss the choice between familyand anonymous �rms. Family �rms are characterized by higher levels oftrust between their members; but, their size is bounded by the numberof family members. We show that �rms are family-run in the less com-plex industries, and anonymous in the more complex industries. Underautarky, the number of family �rms decreases with the quality of institu-tions and increases with workers�productivity. When the two countriesopen up to trade, di¤erences in the prevalence of family �rms acrosscountries are sharpened. The proportion of family �rms decreases in thedeveloped country and increases in the developing country.
Our paper is related to the literature on international trade and insti-tutions. In most of this literature, the quality of institutions is modeledas a tax parameter imposed on �institutionally dependent�sectors; seeBerkowitz et al. [2003] for a recent example. Di¤erences in these taxparameters across countries create the pattern of comparative advan-tage. This �Ricardian view�has been criticized by Levchenko [2003],who argues that institutional di¤erences are better modeled within theGrossman-Hart-Moore framework of contract incompleteness. However,new views on how to model institutions have not changed the startingpoint of the analysis. There exist sectors which depend more on institu-tions than others; then, e¢ cient international specialization implies thatthese sectors should be located in the country with better institutions.3
But, there is nothing in the analysis to determine what these sectors are.Our paper �lls this gap. In our model, the �institutionally dependent�industries are the more complex ones: larger gains from the division oflabor imply more workers per �rm, and so more contracts to be enforced.
From a theoretical point of view, our paper is also related to therecent literature on international trade and the theory of the �rm, seee.g. Grossman and Helpman [2002], Antras [2003], andMarin andVerdier [2003]. These papers are based on �organizational� theories
3Recent papers along these lines include: Matsuyama [2004], where the countrywith a better credit market specializes in sectors subject to bigger agency problems;and Vogel [2004], where the country with a better monitoring technology specializesin sectors more subject to moral hazard.
4

of the �rm, either Grossman and Hart [1986] or Aghion and Ti-role [1995]; by contrast, our model uses a �technological�view of the�rm.4 Instead of focusing on the allocation of property rights or author-ity within the �rm, we focus on the extent of the division of labor.
Finally, our paper is related to Grossman andMaggi [2000] whichshows that not only aggregate factor endowments, but also the dispersionof these factors across workers can be a source of comparative advan-tage. This paper shows that when there are gains from the division oflabor and imperfect contract enforcement, the factor endowment of arepresentative worker, i.e. her productivity, also matters for the patternof trade.
2 A simple example
Some of the main ideas of our analysis are best illustrated by a simpleexample. Consider an island economy with two sectors: pins and com-puters. The island is populated by many identical workers, each ableto work for 300 days. In each industry, producing one unit of outputrequires many complementary tasks to be performed; and whatever thetask is, it takes a worker 1 day to learn it and 1 more day to performit.5 But, computers are more complex than pins: it takes 10 tasks toproduce a pin, against 100 to produce a computer.
In both industries, �rms can either hire 1 or 2 workers, and then writelabor contracts that assign tasks across workers. However, such contractsare not perfectly enforced. Whenever a pin or a computer company hiresa worker, it has a 10% chance of hiring a dishonest worker, who will notful�ll any of her contractual obligations. Given the technological andinstitutional constraints of the island, what is the optimal �rm size inthe pin and computer industries, respectively?
Consider �rst the pin industry. If a �rm hires 1 worker, then thisworker needs 10 training days to learn how to produce a pin from thebeginning to the end. Instead, if a �rm hires 2 workers to produceevery pin, then each worker may specialize in only 5 tasks, and spend5 more days producing rather than learning. The 5 days that are savedfor production by adding an extra worker captures the gains from thedivision of labor. What are the associated transaction costs? Whilea �rm with a single worker has a 90% chance to produce, a �rm that
4See Kumar et al. [2003] for a detailed discussion of �organizational�and �tech-nological�theories of the �rm.
5In other words, it takes 3 days for a given worker to perform the same task twice.
5
employs 2 specialized workers needs both of them to be honest, and soproduces with probability 81%. Specialization increases the number ofcontracts that need to be simultaneously enforced, which reduces theexpected output of each �rm. In the pin industry, this latter e¤ect isdominant. If a pin company hires a single worker, this worker mayproduce for 300 � 10 = 290 days, with probability 90%. If it hires 2specialized workers, each worker may produce for 300 � 5 = 295 days,but with probability 81%. Since 0:9� 290 = 261 > 0:81� 295 = 238:95,(risk-neutral) �rms in the pin industry hire 1 worker.
Let us now turn to the computer industry. If a computer companyhires 2 workers, then each of them may save 50 training days. Whilethere are gains from the division of labor in both industries, these gainsare 10 times larger in the computer industry. Thus for given transactioncosts, computer companies ought to be larger. Indeed, if a computercompany hires a single worker, this worker may produce for 300�100 =200 days, with probability 90%; and if it hires 2 specialized workers,each worker may produce for 300 � 50 = 250 days, with probability81%. Since 0:9� 200 = 180 < 0:81� 250 = 202:5, �rms in the computerindustry hire 2 workers.
This, in a nutshell, explains why high technology �rms should belarger than low technology �rms. What does this example tell us aboutdi¤erences in �rm size across countries? Two things: (i) countries withworse institutions should have smaller �rms; and (ii) countries withhigher productivity levels should have smaller �rms. To see this, supposethat the quality of institutions in the island goes down. A given laborcontract is now enforced with a 50% chance. In this case, gains from thedivision of labor are unchanged, but transaction costs go up, and so �rmsize decreases. Since 0:5 � 200 = 100 > 0:25 � 250 = 62:5, the optimal�rm size in the computer industry goes down from 2 to 1. Similarly,suppose that workers�productivity goes up. The same 300 working daysare now worth 600 days. Then, �rm size also decreases from 2 to 1 in thecomputer industry, since 0:9� 500 = 450 > 0:81� 550 = 445:5. Again,gains from the division of labor are unchanged, but transaction costs goup � there is more to lose when contracts are not enforced � and so�rm size decreases.
Suppose now that the island opens up to trade. Its trading partnershares the same technology, but di¤ers in the quality of its institutionsand the productivity of its workforce. Which of the two islands, if any,should specialize in the computer industry? Our answer is simple: it is
6
the island where �rms are larger in e¢ ciency units under autarky, i.e.the island where the number of working days per �rm is larger.
Under autarky, we know that pin companies in the �rst island arecomposed of 1 worker, endowed with 300 working days. Hence, thereare 300 e¢ ciency units per �rm in the pin industry. Similarly, computercompanies are composed of 2 workers, and so 2 � 300 = 600 e¢ ciencyunits. Let us assume that in the second island, there are 300 e¢ ciencyunits per �rm in both industries. This may correspond to one of thesetwo cases: (i) workers in the second island are as productive as workersin the �rst island, but worse institutions have lead to �rms of size 1 inboth sectors; or (ii) workers in the second island are half as productive,but better institutions have lead to �rms of size 2. In any case, the �rstisland has a comparative advantage in the computer industry.
To see this, let us de�ne a1p and a1c as the average number of days
necessary to produce one pin and one computer in the �rst island. Sincethere is 1 worker per �rm in the pin industry, we have: a1p =
300290�0:9
10
=
11:5. In the computer industry, there are 2 workers per �rm and so:a1c =
600500�0:81
100
= 148. In turn, the relative unit labor requirement is given
by: a1ca1p= 12:8. Now, let us de�ne a2p and a
2c as the average number of
days necessary to produce one pin and one computer in the second island.Similar computation leads to: a2c
a2p= 14:5 > 12:8 = a1c
a1p. The pattern of
trade follows. In the island where �rms are larger in e¢ ciency units,�xed learning costs can be spread over larger amounts of output. As aresult, this island produces and exports computers, where learning costsare larger.
This simple example illustrates two important ideas: (i) di¤erencesin institutions and productivity levels lead to di¤erences in the optimalorganization of �rms across countries; and (ii) these endogenous di¤er-ences confer distinct comparative advantages. In particular, the countrywith larger �rms in e¢ ciency units has a comparative advantage in themore complex goods. This is an important observation, but by no meansthe end of the story. One fundamental question remains: what is thecountry with larger �rms in e¢ ciency units? The previous example onlysuggests that it might be the country with better institutions or lowerproductivity levels, because it has more workers per �rm; or on the con-trary, the country with higher productivity levels, because workers havelarger endowments in e¢ ciency units. In order to give a satisfactoryanswer to this question, we need a formal model to which we now turn.
7
3 Set-up of the model
3.1 TechnologyWe consider an economy with a continuum of goods z 2 (0; z), andone productive factor, labor. In every sector, a continuum of elementarytasks s 2 Sz must be performed to produce one unit of good z. FollowingBecker and Murphy [1992], �must be performed� is modeled by aLeontief technology:
qz = mins2Sz
q(s) (1)
where qz is the output of good z, and q(s) the output of each task s 2 Sz.The measure of Sz captures the �complexity�of the production processin sector z. The more complex a good is, the more elementary tasks arerequired in its production. For notational convenience, we assume thatgoods can be indexed so that in each sector, the measure of Sz is equalto z.
The economy is populated by a continuum of workers of mass L, eachendowed with h units of labor. The parameter h captures the produc-tivity of a representative worker in this economy. There are increasingreturns to scale in the performance of each elementary task. If a workerspends l(s) units of labor performing task s, her associated output q(s)is given by:
q(s) = max fl(s)� k(s); 0g (2)
We interpret the �xed overhead cost k(s) > 0 as the time necessaryto learn how to perform task s. In the rest of this paper, we assumethat k(s) is identical across tasks, and normalize it to one. Hence, thetotal learning costs in sector z are equal to
Rs2Sz k(s)ds = z. The more
complex a good is, the longer it takes to learn how to produce it, andthe larger are the gains from the division of labor.6
3.2 InstitutionsWe focus on a single, but crucial, function of institutions: contract en-forcement.7 The labor contract of a given worker i stipulates her output,
6We have modeled complexity in terms of the number of tasks necessary to produceone unit of output. All tasks are identical, but more complex goods require moretasks. Alternatively, we could assume that all goods require the same number oftasks, but that some tasks take more time to be learnt than others. Then, morecomplex goods would be the ones associated with more complicated tasks. Thetwo approaches are equivalent. In both cases, total learning costs determine themagnitude of the gains from specialization.
7According to North [1990]: � [enforcement] is, and has always been, the criticalobstacle to increasing specialization and division of labor�.
8
qi(s), on every elementary task s 2 Sz . However, workers are free toful�ll or ignore their contractual obligations. Suppose for simplicity thatshirking is a binary decision: worker i either performs all tasks or none.8
She will not shirk on her contract if and only if ci � �i, where ci is hercost of e¤ort and �i the expected present discounted value of her fu-ture punishments. The latter value may depend on worker i�s discountfactor and moral costs, the ability of her employer to monitor and �reher, or the legal sanctions imposed by a well-functioning state law. Inthis paper, we will not delve further into the origins of the enforcementmechanism.9 Instead, we simply assume that better institutions � ei-ther formal or informal � increase �i for all i 2 L, and so increase theprobability that a labor contract is enforced.
Formally, we call F (:) the distribution of �i � ci over the populationof workers, and assume that �i � ci is not observed by prospective em-ployers. Thus labor contracts are randomly assigned across workers andindependently enforced with probability: 1 � F (0) = e� 1
� .10 The para-meter � � 0 measures the quality of institutions, which aims to captureboth the e¢ ciency of the judicial system and/or the level of trust in agiven country. When � = 0, institutions are completely ine¢ cient andcontracts are never enforced. When � =1, institutions are perfect, andlike in the neoclassical benchmark, contracts are always enforced. Froma technical point of view, we treat imperfect contract enforcement as anadditional technological constraint: � is an exogenous parameter, not acontrol variable.11
4 The closed economy
4.1 E¢ cient organization of productionIn the previous section, we have described the technological and insti-tutional constraints of our economy. We now analyze how to organizeproduction e¢ ciently subject to these constraints. We �rst consider the
8Even if workers have the possibility to shirk only on a subset of tasks, shirkersmay always prefer to shirk all the way. In the spirit of Bernheim and Whinston[1990], this would be true for example in a repeated game where enforcement dependson the trigger strategy of the employer. Since the employer always punishes as muchas possible, the employee always shirks as much as possible.
9See e.g. Greif [1994] for an explicit model with second-party enforcement,Acemoglu and Verdier [1998] for an explicit model with third-party enforcement,and Dixit [2004] for an analysis of their interaction.10The arbitrary choice of �e�
1��rather than ���simpli�es the analytical expres-
sions of section 4.11The situation where �rms can o¤er higher wages in order to improve contract
enforcement is discussed in section 8.
9
maximization program of a benevolent social planner; and then showthat the optimal organization can be decentralized through a competi-tive equilibrium with atomistic �rms.
Let us call Lz the mass of workers in industry z. The objectiveof the social planner is to maximize total output per worker in eachindustry, conditional on Lz. The social planner has one control variableper industry: team size, which corresponds to the number of workersthat cooperate on each unit of good z. Given the team size N , eachteam member specializes in z
Ntasks, in order to minimize learning costs,
and allocates her time uniformly across these tasks.12
Let us call bqz the potential output per worker, that is the quantityof good z that they can produce were all contracts to be enforced. TheLeontief technology implies that:
bqz = 1
Lzmins2Sz
�Zi2Lz
qi(s)di
�(3)
When the team size in industry z is N , each worker has h� zNunits of
labor available to perform zNtasks, and hence qi(s) = h� z
NzN
= hNz� 1
for all i and s. Since 1 out of N workers perform a given task s in eachteam, the potential output per worker is in turn given by:
bqz = h
z� 1
N(4)
As team size increases, workers become more specialized � learningcosts per worker decrease � and the number of potential units thateach worker is able to produce increases.13
However, the Leontief technology also implies that a given team pro-duces if and only if all its members perform. When labor contracts areindependently enforced with probability e�
1� , this means that a team
of size N only produces with probability e�N� . Since the output per
worker is equal to bqz if all contracts are enforced and zero otherwise, the12For simplicity, the allocation of tasks within each team is exogenously given. This
assumption is relaxed in a previous version of the paper. When the social planneralso controls the allocation of tasks, the analysis is slightly more complicated, butdoes not provide any further insights with regards to the only variable of interest,team size.13In particular, potential output per worker is maximized when N is in�nite and
every worker only learns an in�nitesimal task. When contracts are perfectly enforced,e¢ ciency requires each skill to be used as intensively as possible. This is in the spiritof Rosen [1983].
10

N
ML
MB
z/h Nz
Figure 1: E¢ cient team size
expected output per worker in each team is given by e�N� bqz. In turn,
the total output per worker in industry z is equal to e�N� bqz, by the law
of large numbers. Specialization increases the number of contracts thatneed to be simultaneously enforced, and so reduces the expected outputof each team.
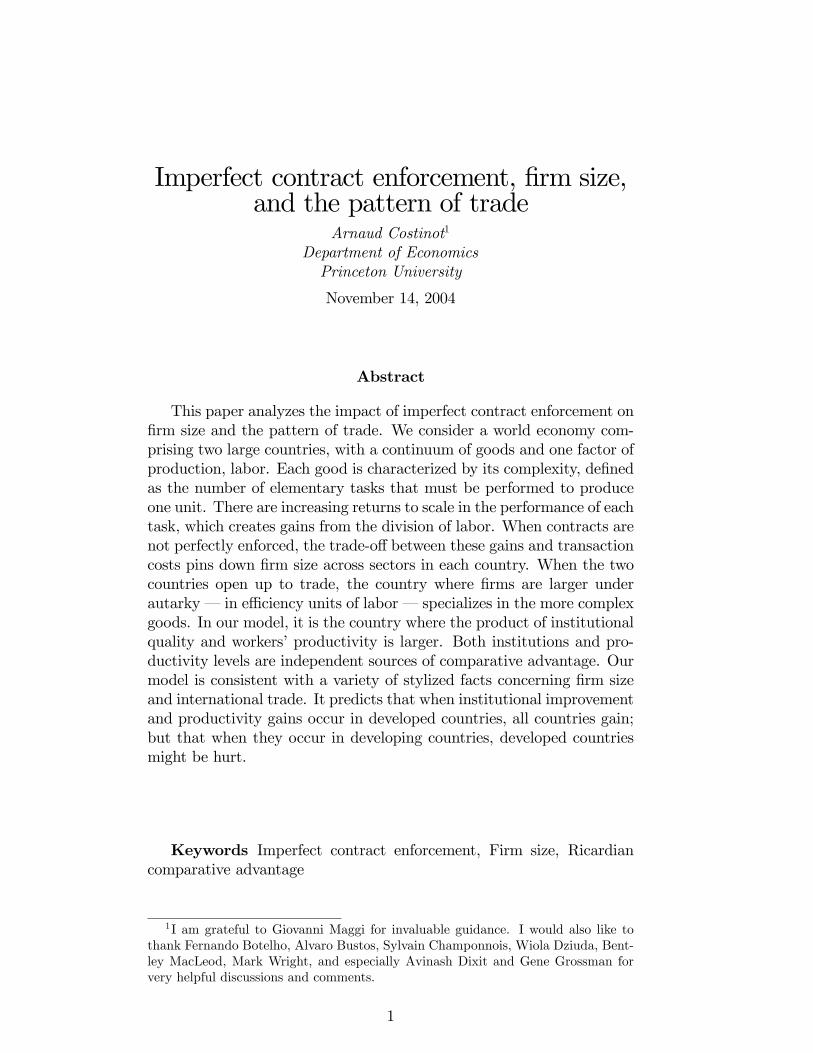
Let us now determine the e¢ cient team size, Nz, in industry z. Byde�nition, Nz must solve:
maxN
e�N�
�h
z� 1
N
�(5)
The �rst-order condition is given by:
z
N2z
=1
�
�h� z
Nz
�(6)
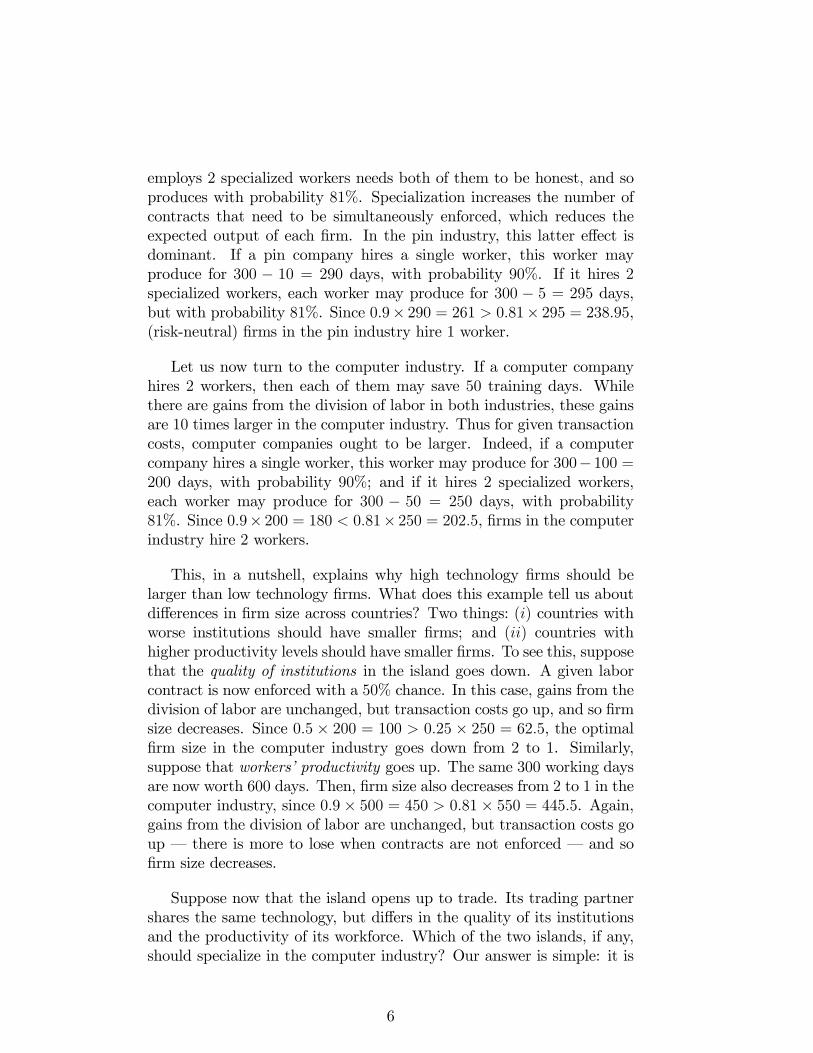
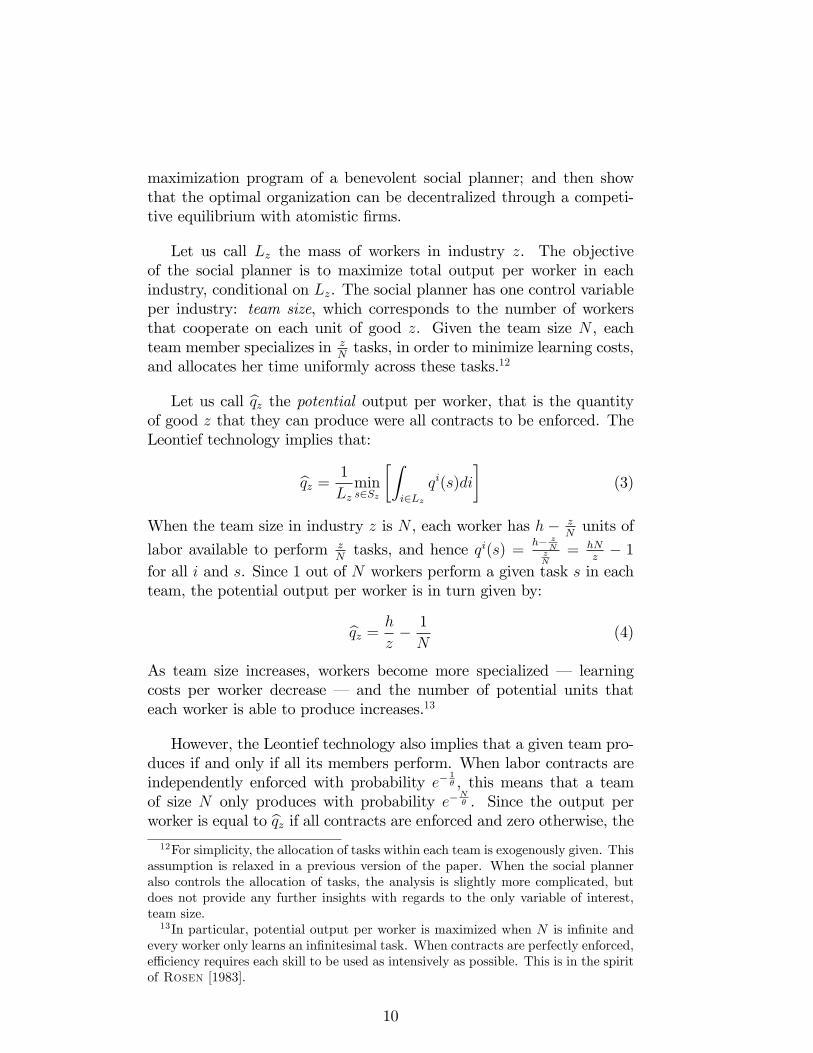
Graphically, it can be described as in �gure 1. MB = zN2 represents the
marginal bene�t of increasing team size. It is equal to the extra units oflabor that workers are able to spend performing tasks, rather than learn-ing them. ML = 1
�
�h� z
N
�represents the marginal loss from increasing
team size. It is equal to the extra units of labor that are lost whenlabor contracts are not enforced. Because more specialization impliesmore labor contracts to be enforced, increasing team size decreases theprobability that potential units get produced, and hence the expectedoutput per worker. Equation (6) states that when team size is e¢ cient,marginal gains from the division of labor are equal to the transactioncosts they create.
11
Finally, we solve equation (6) explicitly. In our model, Nz is uniquelydetermined as a function of the good�s complexity, the quality of thecountry�s institutions and its workers�productivity:
Nz =z
2h
1 +
r1 +
4�h
z
!(7)
Equation (7) implies in particular that the size of a typical team in in-dustry z does not depend on the mass of workers in that industry. Thus,there are constant returns to scale at the industry level: the output of anindustry doubles when it doubles its employment. This further impliesthe existence of a perfectly competitive equilibrium with atomistic �rms.This equilibrium entails e¢ cient resource allocation, and hence e¢ cientteam size.
What does all this tell us about �rm size? E¢ ciency requires thatall �rms in sector z must employ at least Nz workers in equilibrium.However, the model does not determine the number of teams per �rm.A natural way to break this indeterminacy is to assume that there existorganizational diseconomies of scale. As long as there exists an " costof running multiple teams within the same �rm, Nz must be the exactnumber of workers per �rm in sector z. In the rest of this paper, wemaintain this assumption and use ��rm�and �team�size equivalently,when referring to Nz.
4.2 Determinants of �rm sizeIn this section, we analyze the determinants of �rm size. Equation (7)implies that:
Proposition 1 Firm size:(i) increases with the quality of institutions;(ii) increases with the complexity of industries;(iii) decreases with workers�productivity.
In our model, �rm size depends on the trade-o¤ between gains fromspecialization and transaction costs. Graphically, the MB curve cap-tures the marginal gains of increasing �rm size, and the ML curve itsmarginal costs. When the quality of institutions improves, transactioncosts decrease at the margin � ML shifts down � and �rm size in-creases. Similarly, as the complexity of an industry increases, marginalgains from specialization increase � MB shifts up � and transaction
12
costs decrease at the margin � ML shifts down,14 which both increase�rm size. Since Nz only depends on z and h through their ratio, an in-crease in workers�productivity is equivalent to a decrease in the good�scomplexity. As a result, �rm size must decrease with the productivityof the labor force.
The trade-o¤ that determines �rm size in our model is in the spirit ofBecker and Murphy [1992], who emphasize �increasing returns fromconcentrating on a narrower set of tasks�and �coordination costs�. Ourthree exogenous parameters � institutional quality, complexity and pro-ductivity � can all be reinterpreted in these terms. Nevertheless, ourpredictions are distinct from theirs. In particular, proposition 1 predictsthat productivity gains decrease specialization by increasing transactioncosts at the margin. By contrast, Becker and Murphy [1992] predictthat an increase in �knowledge�, which is equivalent to an increase inproductivity, raises specialization by increasing the marginal gains fromthe division of labor. This relationship between knowledge and the gainsfrom the division of labor is admittedly ad hoc, but �necessary if [their]model is to explain why economic development and the growth in knowl-edge raise specialization and the division of labor�. Does it mean thatour model is inconsistent with centuries of joint increase in specializa-tion and productivity? The answer is no, if one also thinks of economicdevelopment as an increase in the complexity of the production process.Our analysis simply suggests that centuries of technological innovationshave made goods relatively more complex: z
hhas increased.15 Moreover,
unlike Becker andMurphy [1992], our predictions are also consistentwith the reemergence of small �rms in the manufacturing sectors thatoccurred over the last thirty years, see Loveman and Sengenberger[1991]. Within our model, one can think of the introduction of comput-ers as an increase in workers�productivity, which has decreased z
h, and
in turn the e¢ cient �rm size. Put (too) simply, the industrial revolu-tion is a z-revolution and the IT revolution an h-revolution, hence theiropposite e¤ects on �rm size.
Proposition 1 predicts that �rms are larger in the more complex sec-tors. This is consistent with the recent �ndings of Bartelsman et al.14More complex goods are associated with larger learning costs. So, when complex-
ity increases, potential output decreases, and the loss of expected output associatedwith a marginal increase in team size decreases as well.15Of course, for an increase in z to be actually a progress, there need to be gains
from increasing complexity. To capture this idea, one could simply change equation(2) into: q(s) = f(z)�max fl(s)� k(s); 0g, with f(z) strictly increasing in z. Then,one would obtain bqz = f(z)� �hz � 1
N
�. The e¢ cient �rm size would be unchanged,
and our argument would go through.
13
[2003]. Within a group of ten OECD countries,16 the authors �nd thatthe average �rm size in agriculture, business services and manufacturingare 5.48, 16.27 and 40.78 employees, respectively. Moreover, the in-creasing relationship between �rm size and complexity remains satis�edwithin the manufacturing sector: the cross-country average in the hightechnology industries is 126.62 against 36.40 in the low technology in-dustries.17 As our analysis also predicts, Bartelsman et al. [2003] �ndthat the distributions of �rm size consistently exhibit a country-speci�ccomponent. Namely, countries with smaller �rms in one sector tend tohave smaller �rms in all sectors.18
Proposition 1 also predicts that �rms are larger in countries withbetter institutions. In our model, the quality of institutions plays a rolesimilar to that of skill levels inKremer [1993]. In his �O-Ring Theory�,higher skill levels increase the probability that a given task is performed,and so lead to the adoption of more complicated technologies. Here, bet-ter institutions increase the probability that a given contract is enforced,and so enhance the Smithian division of labor. As a result, poor coun-tries � with less e¢ cient institutions � should have smaller �rms. Thisinstitutional view is supported empirically by Clague [1991], and morerecently by Kumar et al. [2001]. But, the latter �ndings go one stepfurther: the �stylized fact�that richer countries have larger �rms is nolonger true when one corrects for di¤erences in institutions. In partic-ular, lower skill levels do not seem to lead to smaller �rms. Again, thisis consistent with proposition 1; when institutions are identical acrosscountries, poor countries � with less productive workers � should havelarger �rms.19
As we have already mentioned in section 2, the quality of contractenforcement may have various origins: the e¢ ciency of the judicial sys-
16United States, Germany, France, Italy, United Kingdom, Canada, Denmark,Finland, the Netherlands and Portugal.17High technology sectors include: Aerospace; Computers and o¢ ce machinery;
Electronics-communications; Pharmaceuticals. Low technology sectors include: Pa-per printing; Textile and clothing; Food, beverages and tobacco; Wood and furniture.18The two best examples are the United States and Italy. Across 18 industries,
the size of US �rms is always above the OECD average, and the size of Italian �rmsbelow 16 out of 18 times.19This may explain why Bartelsman et al. [2003] �nd that Portugal is one of the
OECD countries with the largest �rms, together with the United States, France, andGermany. While the judicial system of Portugal is usually described as less e¢ cientthan the judicial systems of countries like Denmark and Finland, the average �rm sizein Portugal is 16.8, against 13.3 in Denmark, and 13.0 in Finland. Such di¤erencesare still consistent with our model if one takes into account the fact that Danish andFinnish workers are 40% to 50% more productive; see Pilat [1996].
14
tem, but also the distribution of preferences in the population, e.g. moralcosts. Let us now focus on the latter interpretation and identify � withthe level of trust in a given country. Proposition 1 implies that ceterisparibus, countries with higher levels of trust should have larger �rms.This corresponds to the main claim of Fukuyama [1995]: �One of themost immediate consequences of a culture with a high propensity forspontaneous sociability20 is the ability to form large, modern corpora-tions.�Thus, our model also provides micro-foundations to Fukuyama�sverbal argument, which has received some empirical support, see forexample La Porta et al. [1997].
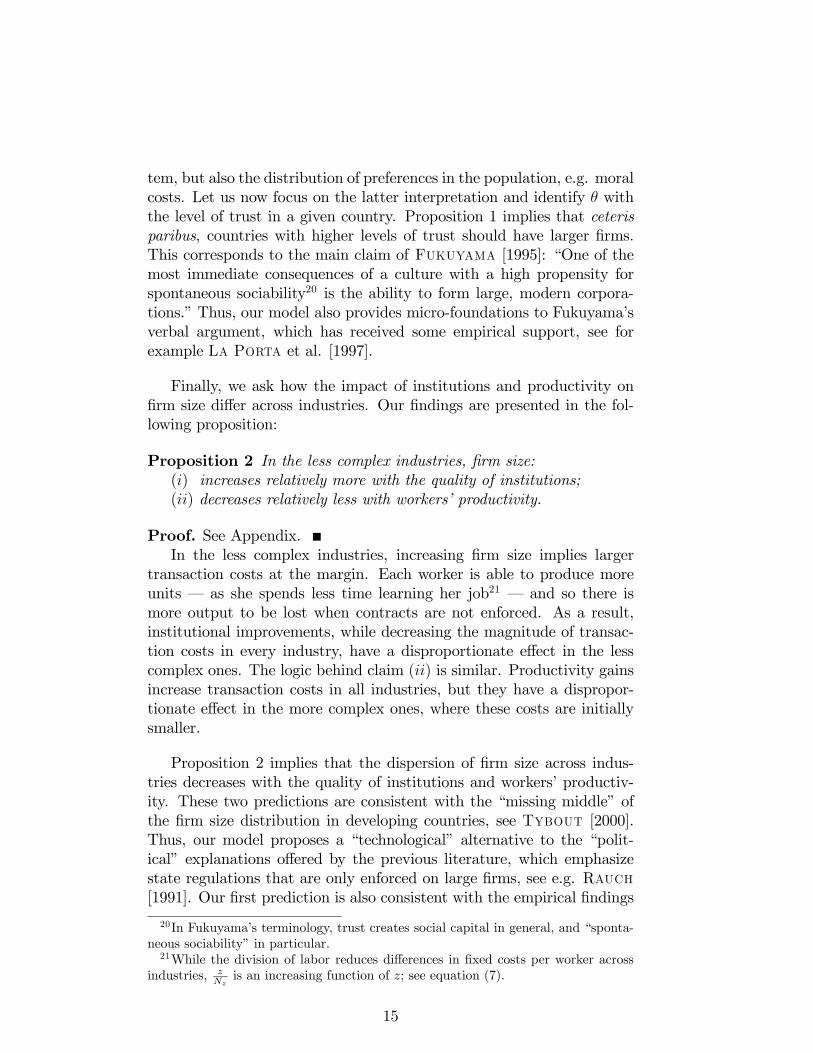
Finally, we ask how the impact of institutions and productivity on�rm size di¤er across industries. Our �ndings are presented in the fol-lowing proposition:
Proposition 2 In the less complex industries, �rm size:(i) increases relatively more with the quality of institutions;(ii) decreases relatively less with workers�productivity.
Proof. See Appendix.In the less complex industries, increasing �rm size implies larger
transaction costs at the margin. Each worker is able to produce moreunits � as she spends less time learning her job21 � and so there ismore output to be lost when contracts are not enforced. As a result,institutional improvements, while decreasing the magnitude of transac-tion costs in every industry, have a disproportionate e¤ect in the lesscomplex ones. The logic behind claim (ii) is similar. Productivity gainsincrease transaction costs in all industries, but they have a dispropor-tionate e¤ect in the more complex ones, where these costs are initiallysmaller.
Proposition 2 implies that the dispersion of �rm size across indus-tries decreases with the quality of institutions and workers�productiv-ity. These two predictions are consistent with the �missing middle�ofthe �rm size distribution in developing countries, see Tybout [2000].Thus, our model proposes a �technological� alternative to the �polit-ical� explanations o¤ered by the previous literature, which emphasizestate regulations that are only enforced on large �rms, see e.g. Rauch[1991]. Our �rst prediction is also consistent with the empirical �ndings
20In Fukuyama�s terminology, trust creates social capital in general, and �sponta-neous sociability�in particular.21While the division of labor reduces di¤erences in �xed costs per worker across
industries, zNzis an increasing function of z; see equation (7).
15

of Kumar et al. [2001] that the industries with the largest �rms tendto have relatively smaller �rms in countries with better judicial systems.
5 The open economy
We consider a world comprising two countries, North and South. Thetechnology, described by equations (1) and (2), is the same in the twocountries. North and South only di¤er in the quality of their institutions,� and ��, and the productivity of their workers, h and h�. Asterisksdenote variables relating to the South.
5.1 The pattern of comparative advantageLet us �rst describe the production possibility frontiers (PPFs) of thetwo countries in reduced form, as in Dornbusch et al. [1977]. We calla(z) the average labor cost of one unit of good z in the North:
a(z) =hLzbqze�Nz
� Lz=zhNze
Nz�
(hNz � z)(8)
where Nz is the e¢ cient �rm size under autarky in sector z;22 see equa-tion (7). Similarly, we call a�(z) the average labor cost of one unit ofgood z in the South.
Since e¢ cient production implies constant returns to scale at theindustry level, the PPFs of North and South are completely characterizedby the constant unit labor requirements � a(z) and a�(z) � in eachindustry. The relative unit labor requirement is given by:
A(z) =a�(z)
a(z)=h�N�
z eN�z�� (hNz � z)
hNzeNz� (h�N�
z � z)(9)
In the next lemma, we describe how institutions and workers�produc-tivity endogenously determine the pattern of comparative advantage be-tween the two countries:
Lemma 1 A(z) is strictly increasing in z if and only if �h > ��h�
Proof. See Appendix.The intuition behind lemma 1 is as follows. When the complexity
of a good increases, it a¤ects the unit labor requirement in two ways.First, it directly increases the average labor cost of a potential unit,
22By de�nition, when the North is on its PPF, �rm size minimizes the averagelabor cost � and so maximizes the expected output per worker � in each sector,conditional on Lz.
16
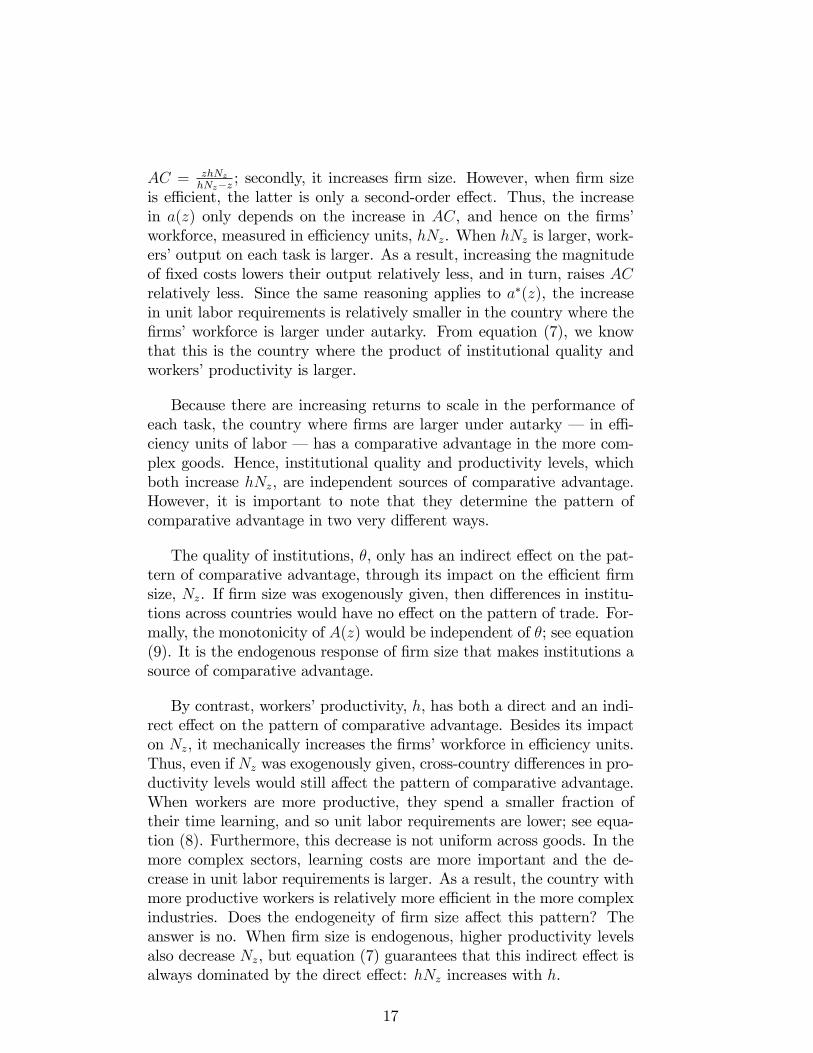
AC = zhNzhNz�z ; secondly, it increases �rm size. However, when �rm size
is e¢ cient, the latter is only a second-order e¤ect. Thus, the increasein a(z) only depends on the increase in AC, and hence on the �rms�workforce, measured in e¢ ciency units, hNz. When hNz is larger, work-ers�output on each task is larger. As a result, increasing the magnitudeof �xed costs lowers their output relatively less, and in turn, raises ACrelatively less. Since the same reasoning applies to a�(z), the increasein unit labor requirements is relatively smaller in the country where the�rms�workforce is larger under autarky. From equation (7), we knowthat this is the country where the product of institutional quality andworkers�productivity is larger.
Because there are increasing returns to scale in the performance ofeach task, the country where �rms are larger under autarky � in e¢ -ciency units of labor � has a comparative advantage in the more com-plex goods. Hence, institutional quality and productivity levels, whichboth increase hNz, are independent sources of comparative advantage.However, it is important to note that they determine the pattern ofcomparative advantage in two very di¤erent ways.
The quality of institutions, �, only has an indirect e¤ect on the pat-tern of comparative advantage, through its impact on the e¢ cient �rmsize, Nz. If �rm size was exogenously given, then di¤erences in institu-tions across countries would have no e¤ect on the pattern of trade. For-mally, the monotonicity of A(z) would be independent of �; see equation(9). It is the endogenous response of �rm size that makes institutions asource of comparative advantage.
By contrast, workers�productivity, h, has both a direct and an indi-rect e¤ect on the pattern of comparative advantage. Besides its impacton Nz, it mechanically increases the �rms�workforce in e¢ ciency units.Thus, even if Nz was exogenously given, cross-country di¤erences in pro-ductivity levels would still a¤ect the pattern of comparative advantage.When workers are more productive, they spend a smaller fraction oftheir time learning, and so unit labor requirements are lower; see equa-tion (8). Furthermore, this decrease is not uniform across goods. In themore complex sectors, learning costs are more important and the de-crease in unit labor requirements is larger. As a result, the country withmore productive workers is relatively more e¢ cient in the more complexindustries. Does the endogeneity of �rm size a¤ect this pattern? Theanswer is no. When �rm size is endogenous, higher productivity levelsalso decrease Nz, but equation (7) guarantees that this indirect e¤ect isalways dominated by the direct e¤ect: hNz increases with h.
17
~ z
ω
A(z)
B(z)
z
Figure 2: The pattern of trade
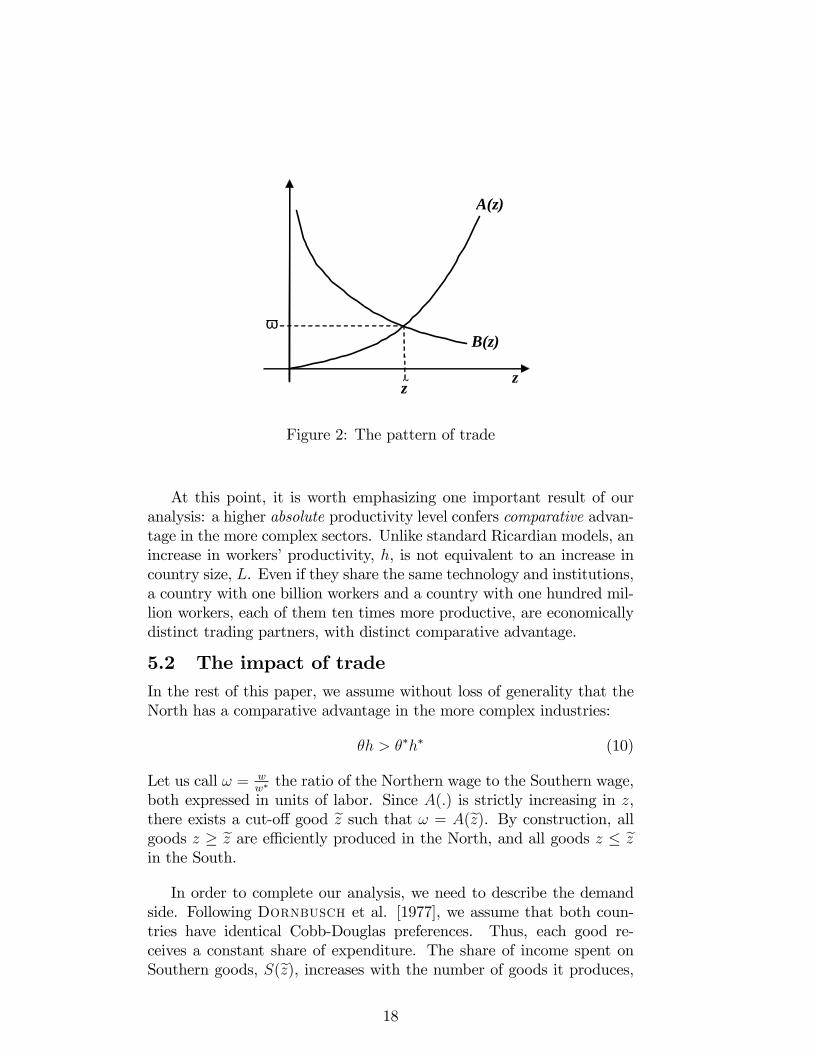
At this point, it is worth emphasizing one important result of ouranalysis: a higher absolute productivity level confers comparative advan-tage in the more complex sectors. Unlike standard Ricardian models, anincrease in workers�productivity, h, is not equivalent to an increase incountry size, L. Even if they share the same technology and institutions,a country with one billion workers and a country with one hundred mil-lion workers, each of them ten times more productive, are economicallydistinct trading partners, with distinct comparative advantage.
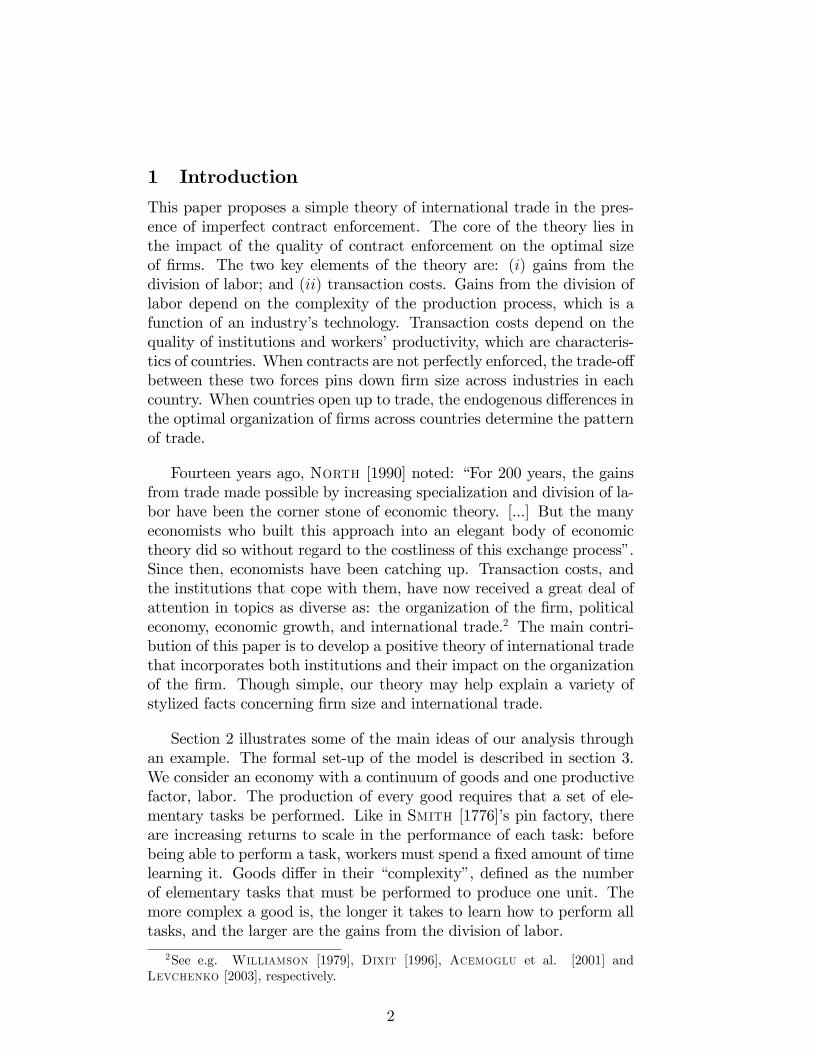
5.2 The impact of tradeIn the rest of this paper, we assume without loss of generality that theNorth has a comparative advantage in the more complex industries:
�h > ��h� (10)
Let us call ! = ww� the ratio of the Northern wage to the Southern wage,
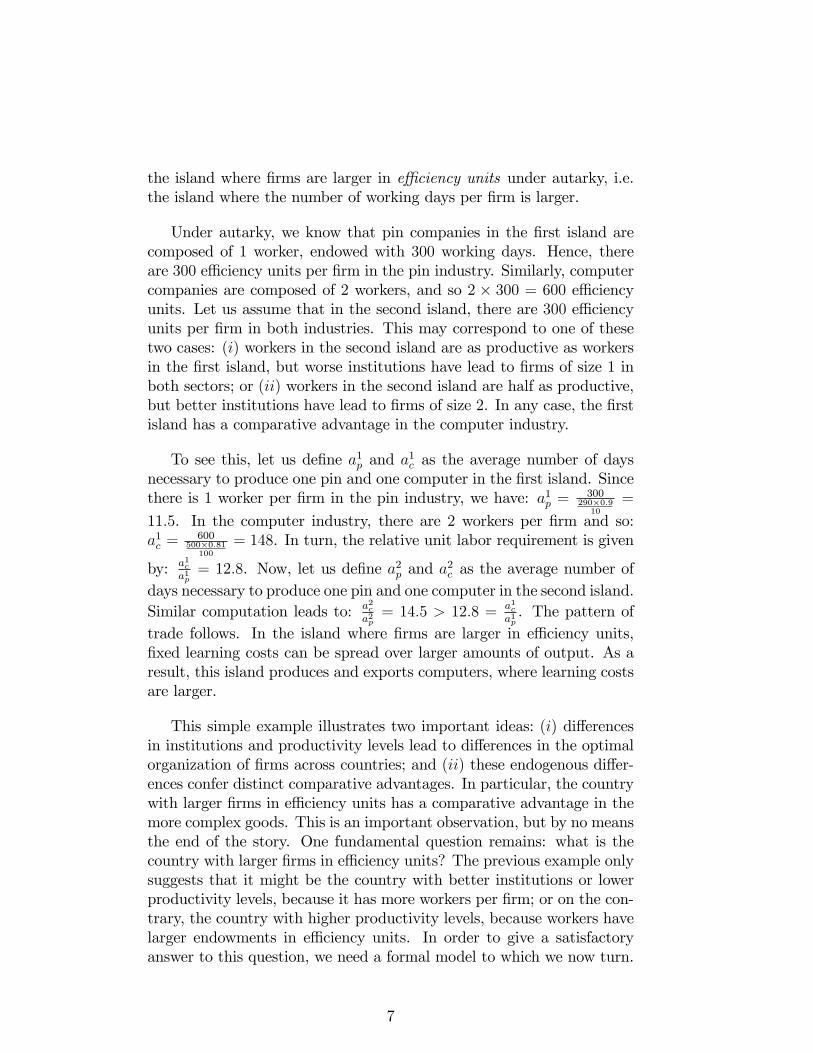
both expressed in units of labor. Since A(:) is strictly increasing in z,there exists a cut-o¤ good ez such that ! = A(ez). By construction, allgoods z � ez are e¢ ciently produced in the North, and all goods z � ezin the South.
In order to complete our analysis, we need to describe the demandside. Following Dornbusch et al. [1977], we assume that both coun-tries have identical Cobb-Douglas preferences. Thus, each good re-ceives a constant share of expenditure. The share of income spent onSouthern goods, S(ez), increases with the number of goods it produces,
18
and so increases with ez. The trade balance equilibrium is given by:! = h�L�[1�S(ez)]
hLS(ez) = B(ez). This condition and e¢ cient international spe-cialization jointly determine the relative wage and the pattern of trade;see �gure 2. An increase in the range of goods produced in the Southraises Southern exports and lowers its imports. Hence, trade balanceequilibrium requires the ratio of the Northern wage to the Southernwage to go down. On the supply-side, e¢ cient specialization requiresthe reverse.
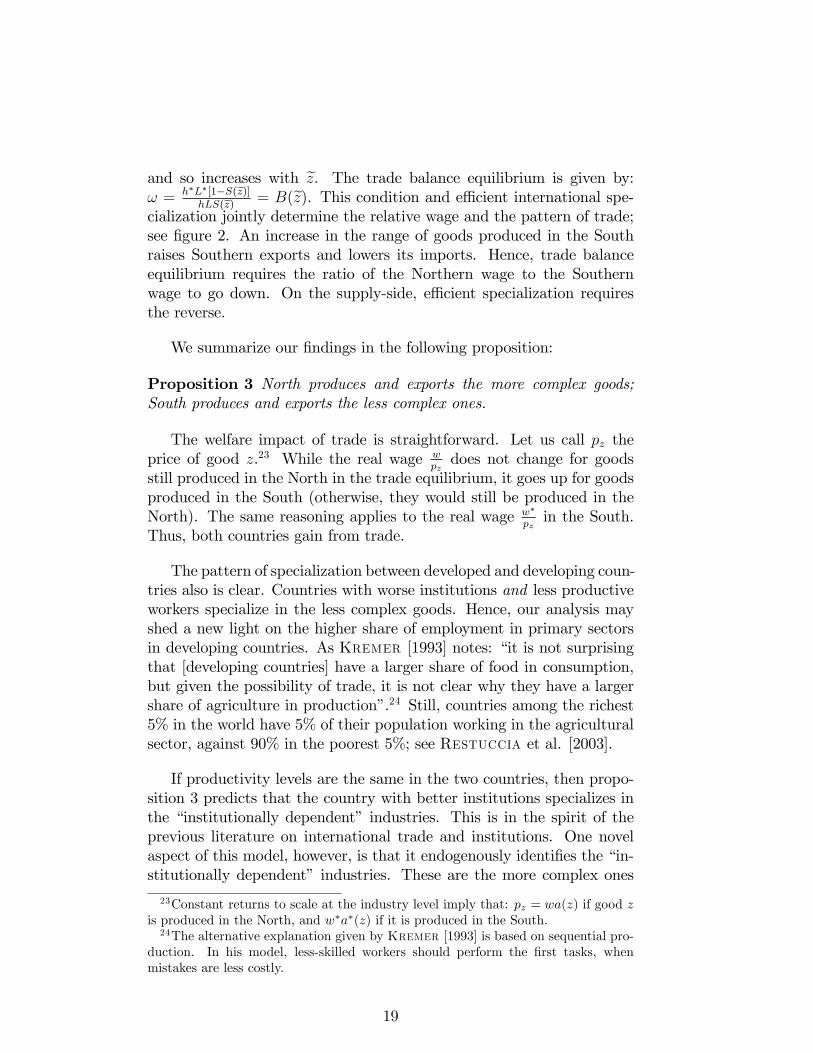
We summarize our �ndings in the following proposition:
Proposition 3 North produces and exports the more complex goods;South produces and exports the less complex ones.
The welfare impact of trade is straightforward. Let us call pz theprice of good z.23 While the real wage w
pzdoes not change for goods
still produced in the North in the trade equilibrium, it goes up for goodsproduced in the South (otherwise, they would still be produced in theNorth). The same reasoning applies to the real wage w�
pzin the South.
Thus, both countries gain from trade.
The pattern of specialization between developed and developing coun-tries also is clear. Countries with worse institutions and less productiveworkers specialize in the less complex goods. Hence, our analysis mayshed a new light on the higher share of employment in primary sectorsin developing countries. As Kremer [1993] notes: �it is not surprisingthat [developing countries] have a larger share of food in consumption,but given the possibility of trade, it is not clear why they have a largershare of agriculture in production�.24 Still, countries among the richest5% in the world have 5% of their population working in the agriculturalsector, against 90% in the poorest 5%; see Restuccia et al. [2003].
If productivity levels are the same in the two countries, then propo-sition 3 predicts that the country with better institutions specializes inthe �institutionally dependent� industries. This is in the spirit of theprevious literature on international trade and institutions. One novelaspect of this model, however, is that it endogenously identi�es the �in-stitutionally dependent� industries. These are the more complex ones
23Constant returns to scale at the industry level imply that: pz = wa(z) if good zis produced in the North, and w�a�(z) if it is produced in the South.24The alternative explanation given by Kremer [1993] is based on sequential pro-
duction. In his model, less-skilled workers should perform the �rst tasks, whenmistakes are less costly.
19
because larger gains from the division of labor imply more workers per�rm in equilibrium, and so more contracts to be enforced.
By combining propositions 1 and 3, we can also analyze the impact oftrade on �rm size. The prediction is again unambiguous: internationaltrade decreases average �rm size in developing countries, while increas-ing it in developed countries. In our model, trade does not change howgoods are produced in each country. Technological and institutional con-straints fully characterize the e¢ cient �rm size, see equation (7). But,by changing which goods are produced, trade a¤ects the overall distri-bution of �rm size in the two countries. When the two countries openup to trade, North specializes in industries where �rms are relativelylarger and South in those where they are relatively smaller. As a result,average �rm size increases in the North and decreases in the South.
However, there is no simple relationship between cross-country dif-ferences in �rm size and the pattern of international specialization. Ifdi¤erences in institutions are the source of comparative advantage �� > �� and h = h� � then the country with larger �rms specializes insectors where �rms are larger. This �tilting e¤ect�has been described byDavis and Henrekson [1999]; Sweden, which is found to have an un-usually high share of employment in large �rms, also tends to have highshares of employment in industries with larger �rms.25 By contrast, ifdi¤erences in workers�productivity are the source of comparative advan-tage � h > h� and � = �� � then the country with larger �rms special-izes in sectors where �rms are smaller.26 While institutional quality andworkers�productivity a¤ect the pattern of trade in the same direction,they a¤ect �rm size in opposite directions. Thus, the same cross-countrydi¤erences in �rm size may lead to opposite patterns of specialization,depending on the origins of these di¤erences. This may explain whyBartelsman et al. [2003] have found �very limited support� to thetilting e¤ect in the data.
6 Comparative statics
For a given pattern of comparative advantage, as captured by A(z), ourmodel is formally equivalent to Dornbusch et al. [1977]. This impliesthat changes in relative country size, demand shifts, and unilateral trans-fers, which all leave A(z) unchanged, have the same e¤ects in our model
25The authors points to the Swedish economic policy environment, and in partic-ular its tax system, as an explanation of this joint pattern.26In other words, if Portuguese �rms are large because of low productivity levels,
Portugal should specialize in the textile industry rather than the computer industry.
20
lnω
lnA(z)
A|θ,θ∗
B
A|θ+dθ,θ∗
A| θ,θ∗+dθ∗
lnA(z)~
Figure 3: Institutional improvements at home and abroad
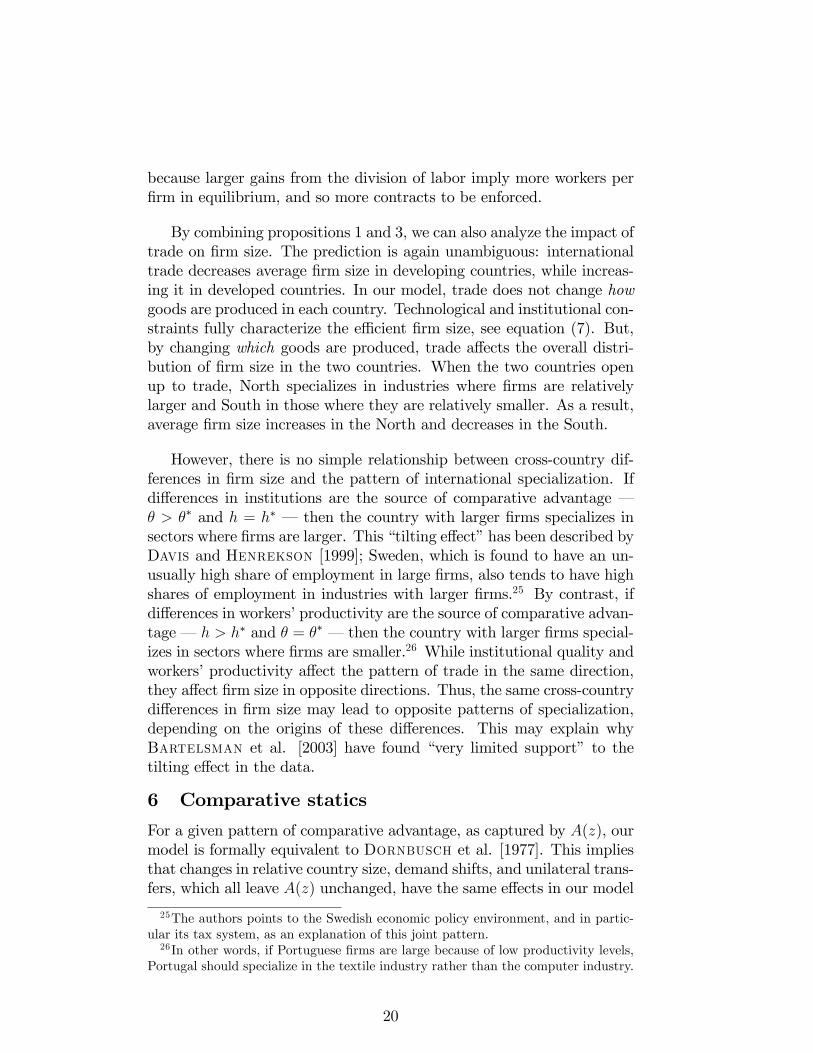
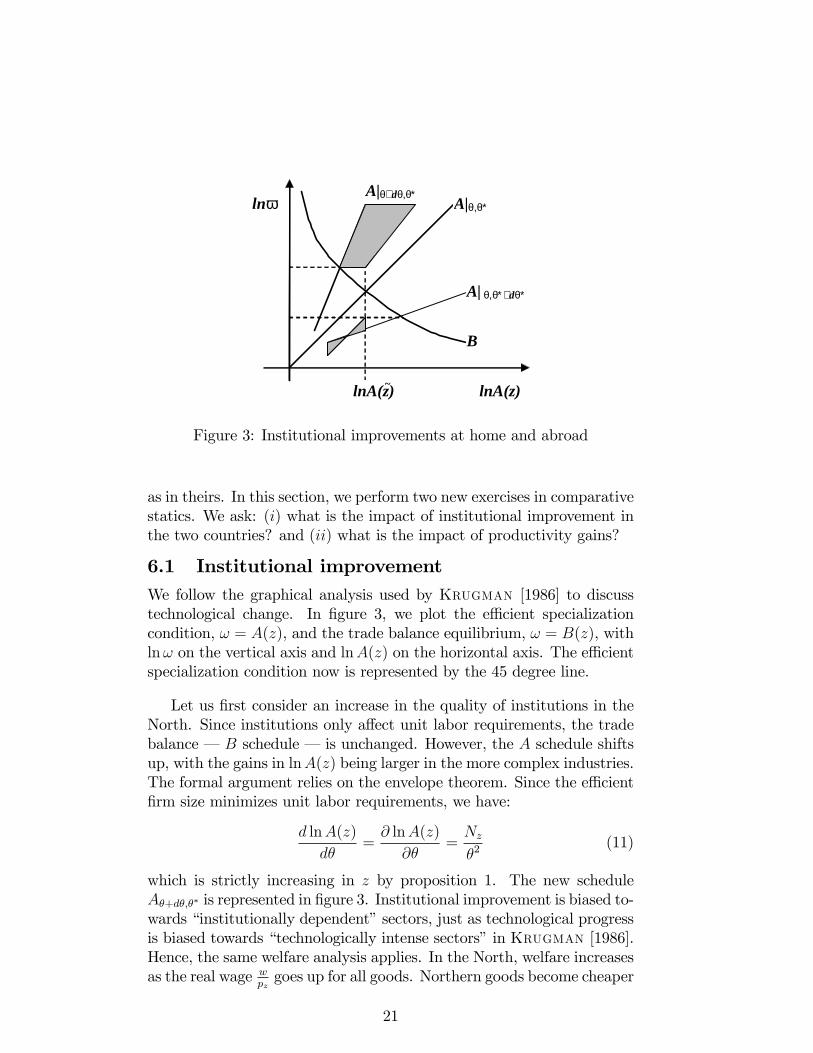
as in theirs. In this section, we perform two new exercises in comparativestatics. We ask: (i) what is the impact of institutional improvement inthe two countries? and (ii) what is the impact of productivity gains?
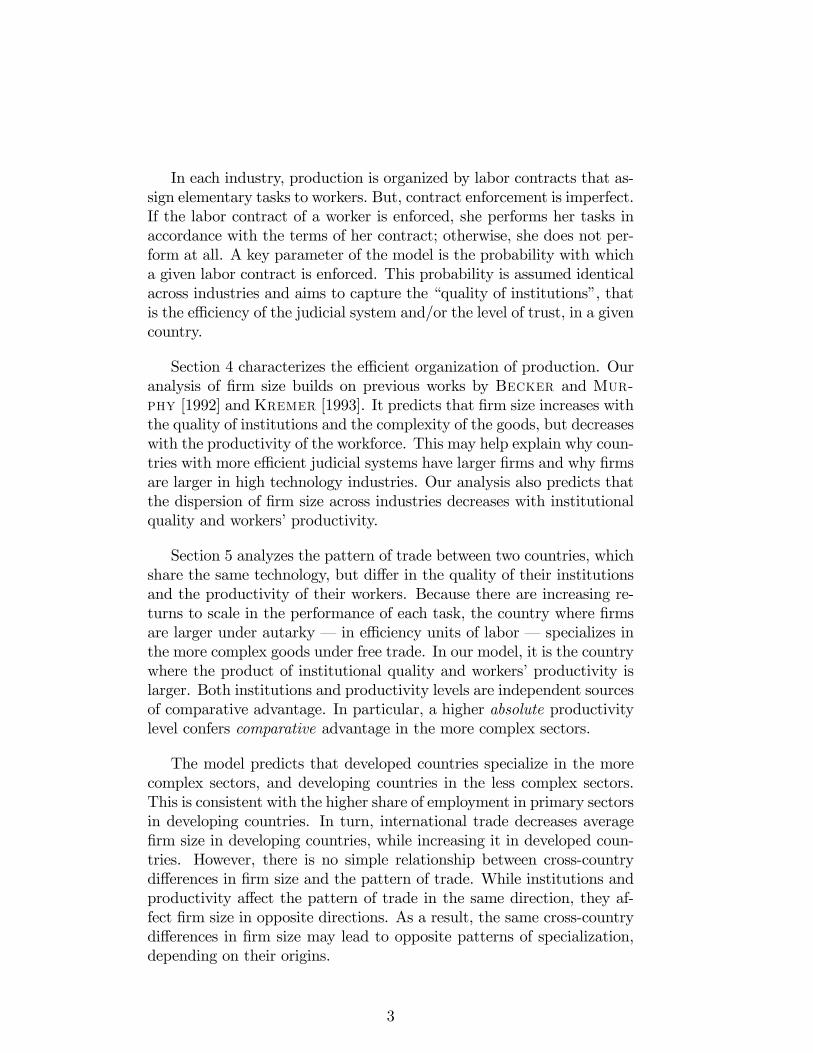
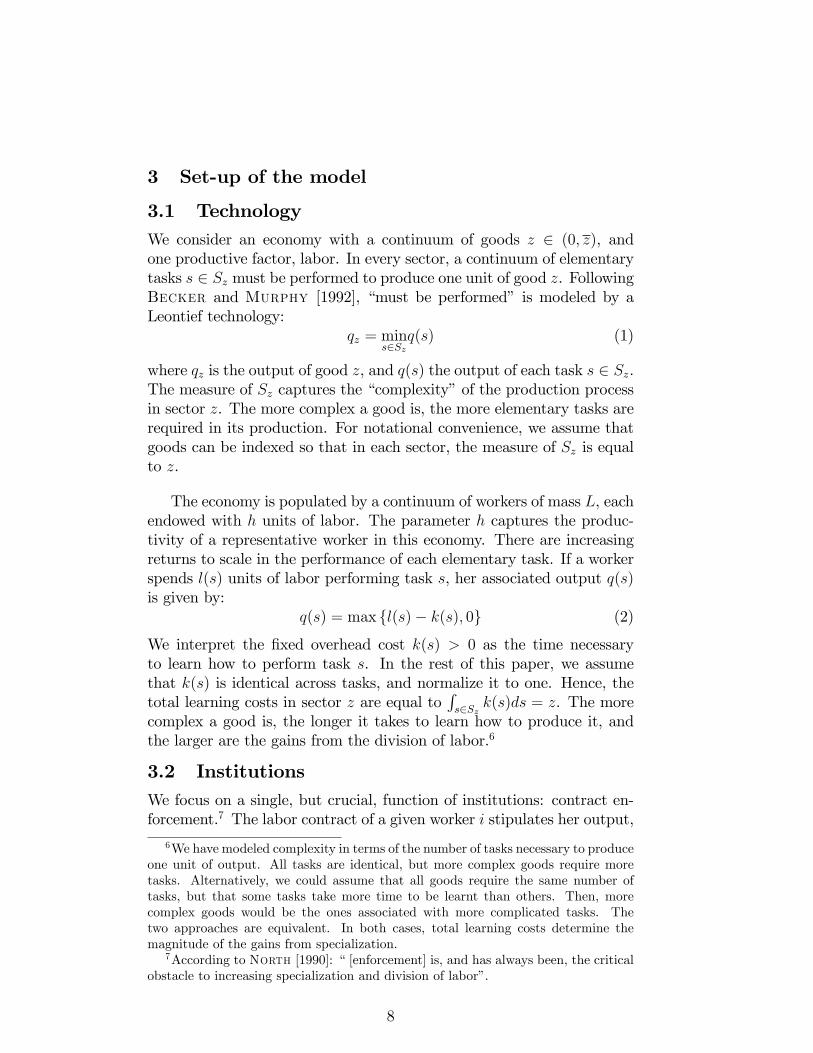
6.1 Institutional improvementWe follow the graphical analysis used by Krugman [1986] to discusstechnological change. In �gure 3, we plot the e¢ cient specializationcondition, ! = A(z), and the trade balance equilibrium, ! = B(z), withln! on the vertical axis and lnA(z) on the horizontal axis. The e¢ cientspecialization condition now is represented by the 45 degree line.
Let us �rst consider an increase in the quality of institutions in theNorth. Since institutions only a¤ect unit labor requirements, the tradebalance � B schedule � is unchanged. However, the A schedule shiftsup, with the gains in lnA(z) being larger in the more complex industries.The formal argument relies on the envelope theorem. Since the e¢ cient�rm size minimizes unit labor requirements, we have:
d lnA(z)
d�=@ lnA(z)
@�=Nz
�2(11)
which is strictly increasing in z by proposition 1. The new scheduleA�+d�;�� is represented in �gure 3. Institutional improvement is biased to-wards �institutionally dependent�sectors, just as technological progressis biased towards �technologically intense sectors�in Krugman [1986].Hence, the same welfare analysis applies. In the North, welfare increasesas the real wage w
pzgoes up for all goods. Northern goods become cheaper
21
because unit labor requirements decrease; and southern goods becomecheaper because the relative wage ! increases. In the South, the situ-ation is a priori more subtle. As ! increases, South�s share of worldincome decreases. However, the real wage in the South, w
�
pz, cannot go
down. It is unchanged for goods whose production remains in the South;and it increases for goods whose production goes from the South to theNorth (otherwise they would still be produced in the South). The key tothe analysis is that w
�
pzalso goes up for goods whose production remains
in the North. Indeed, the net e¤ect of an increase in � is an improve-ment of the South�s terms of trade. Because institutional improvementis biased towards the more complex sectors, the percent increase in !,which is lower than the percent decrease in unit labor requirements forthe cut-o¤ good ez, is also lower for all goods more complex than ez; see�gure 3.
The welfare analysis of an improvement of institutions in the Southis similar. The schedule, A�;��+d��, associated with a marginal improve-ment in the quality of Southern institutions is represented in �gure 3.Again, institutional improvement is biased towards the more complexsectors.27 Clearly, the South now gains. What happens to the North?The real wage w
pzcannot decrease for goods initially produced in the
North. It is unchanged if the production remains in the North; and itincreases if the production switches to the South because of lower laborcosts in this country. However, w
pzmay decrease for goods which are
initially produced in the South. While the percent decrease in ! is lowerthan the percent decrease in unit labor requirements for industries closeto ez, it is higher for the less complex ones; see �gure 3. As a result,welfare in the North may decrease.
We summarize our results in the following proposition:
Proposition 4 (i) Institutional improvement in the North increaseswelfare in both countries.(ii) Institutional improvement in the South increases welfare in this
country, but may decrease welfare in the North.
Our welfare analysis of institutional change echoes Krugman�s analy-sis of technological change. When the institutional gap between the twocountries increases, welfare goes up in both countries. But when thisgap narrows, the country with better institutions might be hurt. How-ever, our model is more than a reinterpretation of Krugman [1986] in
27Formally, the envelope theorem implies: d lnA(z)d�� = @ lnA(z)@�� = �N�
z
��2.
22
institutional terms. Unlike �technologically intense� sectors in Krug-man [1986], �institutionally dependent� sectors are endogenous in ourmodel. Di¤erences in the gains from the division of labor imply di¤er-ences in �rm size, and in turn di¤erences in the dependence on contractenforcement across sectors.
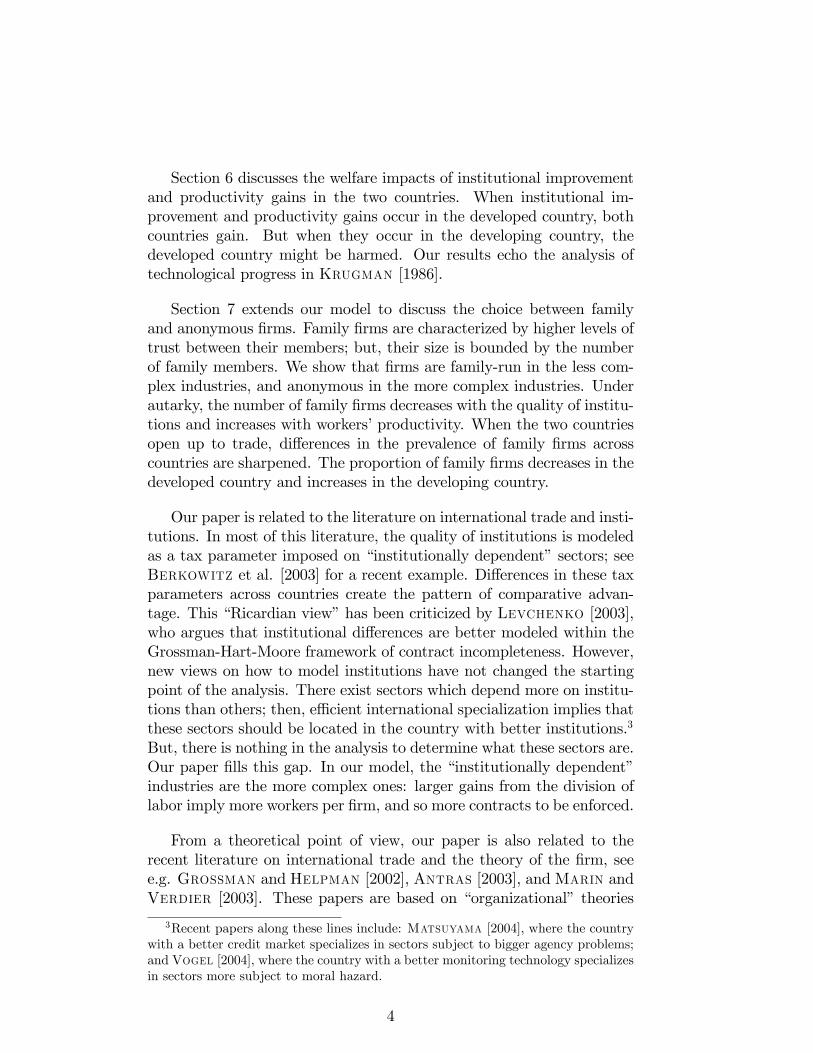
6.2 Productivity gainsUnlike Dornbusch et al. [1977], across the board productivity gainsin one country are not equivalent to a change in L�
L. In our model,
workers�productivity, like institutions, a¤ect �rm size, and so unit laborrequirements.
An increase in the workers�productivity in one country has two dis-tinct e¤ects. Like an increase in the quality of its institutions, it leadsto an increase of its comparative advantage, which is biased towards themore complex industries. But, unlike institutional improvement, pro-ductivity gains a¤ect the trade balance. Increasing the productivity ofone country creates an excess of its labor supply, which tends to decreaseits relative wage. The welfare impact of productivity gains in the twocountries are described in proposition 5:
Proposition 5 (i) Productivity gains in the North increase welfare inboth countries.(ii) If the terms of trade e¤ect is large enough, productivity gains in
the South increase welfare in both countries. Otherwise, they increasewelfare in the South, but may decrease welfare in the North.
Proof. See Appendix.When productivity gains occur in the North, the terms of trade e¤ect
does not a¤ect our qualitative results: both countries still win. In theSouth, any decrease in ! further increases the real wage w
�
pz; in the North,
any decrease in ! is always smaller than the increase in h, and the realwage per worker wh
pzincreases as well. When productivity gains occur in
the South, the terms of trade e¤ect may a¤ect our qualitative results.Indeed, if the relative wage ! increases, North unambiguously wins.
7 Family versus anonymous �rms
Up to this point, we have focused on a single dimension of �rms�orga-nization: their size. We now add the possibility for �rms to organizethemselves either as family or as anonymous �rms. Like �rm size, theprevalence of family �rms seems to vary greatly from one country toanother. Fukuyama [1995] expresses the view that these cross-country
23
di¤erences also re�ect di¤erences in levels of trust: �It would appear noaccident that three high-trust societies, Japan, Germany, and the UnitedStates, pioneered the development of large scale professionally managedenterprises. Low-trust societies like France, Italy, and noncommunistChinese states including Taiwan and Hong Kong, by contrast, were rela-tively late in moving beyond large family businesses to modern corpora-tions.�In this section, we formally investigate this idea, and show howthe trade-o¤ that determines �rm size � gains from the division of laborversus transaction costs � may also shed light on the choice betweenfamily and anonymous �rms across countries and industries.
We now assume that the population is partitioned in families of sizeNf . We say that a �rm is a family �rm if all its members belong to thesame family. Otherwise, we say that it is an anonymous �rm. Workingin a family �rm increases the punishment faced by every worker if shedecides to shirk: �if > �
i. The moral costs of cheating on a family mem-ber may be higher, or family members may have additional punishmenttools available outside of the market place. In any case, since the dis-tribution of the �ifs �rst-order stochastically dominates the distributionof the �is, the probability that any given contract is enforced must be
higher within the family �rm: e� 1�f > e�
1� . The rest of the model is
unchanged.
First, we reconsider the case of a closed economy. In which sectorsshould we observe family and anonymous �rms respectively? In ourmodel, the e¢ cient organization of production depends on the trade-o¤between gains from the division of labor and transaction costs. Thiswas true when we discussed �rm size in section 4 and it remains truehere. For family �rms, gains from specialization are limited by the sizeof the family,28 but transaction costs are relatively low. For anonymous�rms, gains from specialization are a priori unlimited, but transactioncosts are relatively high. Therefore, one should expect to observe family�rms in industries where gains from the division of labor are small, andanonymous �rms in those where they are large. This is the intuitionbehind proposition 6:
Proposition 6 Firms are family-run in the less complex industries, andanonymous in the more complex industries.
28A family �rm may decide to hire a stranger, but if it does, we assume that itbecomes an anonymous �rm. In other words, whenever �rm size goes beyond thefamily size, the quality of contract enforcement goes down from �f to �. This is inthe spirit of Dixit [2004], chapter 3; extending exchanges beyond a critical (social)distance decreases the quality of relation-based governance.
24
Proof. See Appendix.As Ben-Porath [1980] put it: �The transactional advantage of the
family cannot compensate for the fact that within its con�nes the re-turns from impersonal specialization and division of labor are not fullyrealizable�. In our model, the total learning costs, z, captures the extentof these returns in each industry. When they are small, e.g. in the agri-cultural sector, �rms are family-run; but, when gains from the divisionof labor become large enough, family �rms are no longer observed.
Next, we consider the impact of the quality of institutions and work-ers� productivity on the proportion of family �rms. Our �ndings arepresented in proposition 7:
Proposition 7 The proportion of family �rms:(i) decreases with the quality of institutions;(ii) increases with workers�productivity.
Proof. See Appendix.The proof of our �rst claim is trivial. When � increases, the output
of anonymous �rms increases in every industry. But, the output of fam-ily �rms remains unchanged. This mechanically decreases the numberof industries in which family �rms are e¢ cient. Thus, an immediateprediction of our model is that ceteris paribus, trust should increase theprevalence of anonymous �rms in a given country. Again, this rational-izes the verbal arguments of Fukuyama [1995]. The intuition behindthe second claim is the same as for proposition 1. As far as the maximiza-tion of expected output per worker is concerned, z and h only matterthrough their ratio, see equation (5). Thus, an increase in workers�pro-ductivity must have the same e¤ect on the choice between family andanonymous �rms as a decrease in complexity. From proposition 6, weknow that this extends the range of industries in which family �rms arepresent.
Finally, we can use our model to discuss the impact of internationaltrade on the prevalence of family �rms. Suppose again that the worldeconomy is made of two countries, North and South. We restrict our-selves to the case where the organization of family �rms is identical acrosscountries. Namely, we assume that the size of the families, Nf , the qual-ity of contract enforcement, �f , and the productivity of the workers, h,are the same in the two countries. North and South only di¤er in thequality of their institutions with � > ��. Our �ndings are presented inproposition 8:
25
Proposition 8 When the two countries open up to trade, the propor-tion of family �rms decreases in the country with better institutions andincreases in the country with worse institutions.
Proof. See Appendix.The addition of family �rms does not a¤ect the pattern of compar-
ative advantage; the country with better institutions still has a com-parative advantage in the more complex industries. As a result, thepattern of international specialization remains the same as in section 5.North produces and exports the more complex goods; South producesand exports the less complex ones. Since family �rms are present in theless complex industries under autarky, this destroys family �rms in theNorth and anonymous �rms in the South. Proposition 8 follows.
8 Concluding remarks
This paper analyzes the impact of imperfect contract enforcement on�rm size and the pattern of trade. When contracts are not perfectly en-forced, the trade-o¤ between gains from the division of labor and trans-action costs pins down �rm size across sectors in each country. Underautarky, the model predicts that �rm size increases with the quality ofinstitutions and the complexity of the goods, but decreases with the pro-ductivity of the labor force. It also predicts that the dispersion of �rmsize across industries decreases with the quality of institutions and work-ers�productivity. These predictions are consistent with various stylizedfacts about the distribution of �rm size across countries and industries.
When the two countries open up to trade, the country where �rmsare larger under autarky � in e¢ ciency units of labor � specializesin the more complex goods. In our model, it is the country where theproduct of institutional quality and workers�productivity is larger. Bothinstitutions and productivity levels are independent sources of compar-ative advantage. In particular, a higher absolute productivity level con-fers a comparative advantage in the more complex sectors. But whileinstitutions and productivity a¤ect the pattern of trade in the same di-rection, they a¤ect �rm size in opposite directions. Hence, the samecross-country di¤erences in �rm size may lead to opposite patterns ofspecialization, depending on their origins.
The model unambiguously predicts that developed countries special-ize in the more complex sectors, and developing countries in the lesscomplex sectors. In turn, international trade decreases �rm size and theproportion of anonymous �rms in developing countries, while increasing
26
them in developed countries. The model also predicts that when institu-tional improvement and productivity gains occur in developed countries,all countries gain; but that when they occur in developing countries, de-veloped countries might be hurt.
One important assumption of our model is that the quality of con-tract enforcement is exogenous. In practice, atomistic �rms may welltake the quality of their judicial system as given, but still try to im-prove the trustworthiness of their workers by o¤ering e¢ ciency wages.Intrinsically dishonest workers may still shirk, but the probability that agiven contract gets enforced would certainly increase. Endogenizing thequality of contract enforcement has a very appealing feature in a closedeconomy. In equilibrium, it implies that enforcement, and hence wages,di¤er across sectors. In the more complex industries where �rms arelarger, contract enforcement is more important, and so wages must belarger. This simple idea provides an appealing theoretical foundation forthe inter-industry di¤erentials in �rm size and wages, see e.g. Brownand Medoff [1989]. Its implications on the pattern of internationalspecialization in an open economy are left for future research.
Another interesting extension of our model concerns outsourcing. Insection 5, we implicitly assume that all �rms are national �rms; withineach �rm, all workers are from the same country. But if �rms can hireworkers of di¤erent countries, they may gain by assigning complicatedjobs � with large �xed costs � to workers of the developed countryand simple jobs � with small �xed costs � to workers of the devel-oping country. If it is the case, in which industries should we observeoutsourcing? Are the welfare e¤ects of outsourcing any di¤erent fromthose of trade? Do institutional improvement and productivity gains inthe developing country enhance outsourcing? These questions are alsoleft for future research.
The introduction of nontraded goods, transport costs and tari¤s areother possible extensions of our analysis. Since our model simpli�es intoDornbusch et al. [1977] for a given pattern of comparative advantage,they are all straightforward. Their main contribution with regards toDornbusch et al. [1977] would be to identify the goods which are nottraded. In our model, developing countries would export the least com-plex goods, developed countries would export the most complex goodsand goods in an intermediate range would not be traded. These resultssuggest that while the largest �rms would export in developed coun-tries, the smallest �rms � associated with the least complex industries� would export in developing countries.
27
Finally, we have developed a model of �family-run��rms, where allworkers are from the same family. It would be interesting to extend ourmodel in order to discuss �family-owned��rms, see e.g. Burkart etal. [2003], which has been the main focus of the empirical literature.One possibility would be to modify our technology so that the divisionof labor matters at the managerial level; the smaller the set of tasksassigned to a manager is, the more e¢ cient she would be, and so the moreproductive would be the workers below her. Within such a framework,we conjecture that the trade-o¤ which determines the choice betweenfamily and anonymous �rms � and hence our results � would remainthe same.
28

9 Appendix
9.1 Proof of proposition 2Proposition 2 In the less complex industries, �rm size:
(i) increases relatively more with the quality of institutions;(ii) decreases relatively less with workers�productivity.
Proof. Consider two industries z and z0, such that z < z0. We need to
show thatd
�NzNz0
�d�
> 0 andd
�NzNz0
�dh
> 0. From (7), we know that:
NzNz0
=z�1 +
q1 + 4�h
z
�z0�1 +
q1 + 4�h
z0
� (12)
Because of the symmetry between � and h, we only show thatd
�NzNz0
�d�
> 0.Let us de�ne:
f(�) =1 +
p1 + a�
1 +p1 + b�
with a > b > 0 (13)
The derivative of f with respect to � is given by:
f 0(�) =a+
pa2 + a2b� �
�b+
pb2 + b2a�
�2p1 + a�
p1 + b�
�1 +
p1 + b�
�2 (14)
Since a > b > 0 implies both a2 > b2 and a2b > b2a, we get f 0(�) > 0,which concludes our proof.
9.2 Proof of lemma 1Lemma 1 A(z) is strictly increasing in z if and only if �h > ��h�
Proof. Let us write the derivative of A(z) with respect to z as:
A0(z) =da�
dza� a� da
dz
a2(15)
Since Nz and N�z minimize a(z) and a
�(z) respectively, we can use theenvelope theorem and write:
A0(z) =@a�
@za� a� @a
@z
a2(16)
Then, simple algebra leads to:
A0(z) = �(hNz � h�N�z ) (17)
with � = h�N�z e
N�z�� �Nz
�
hNz(h�N�z�z)2
> 0. Our claim directly follows from (7).
29
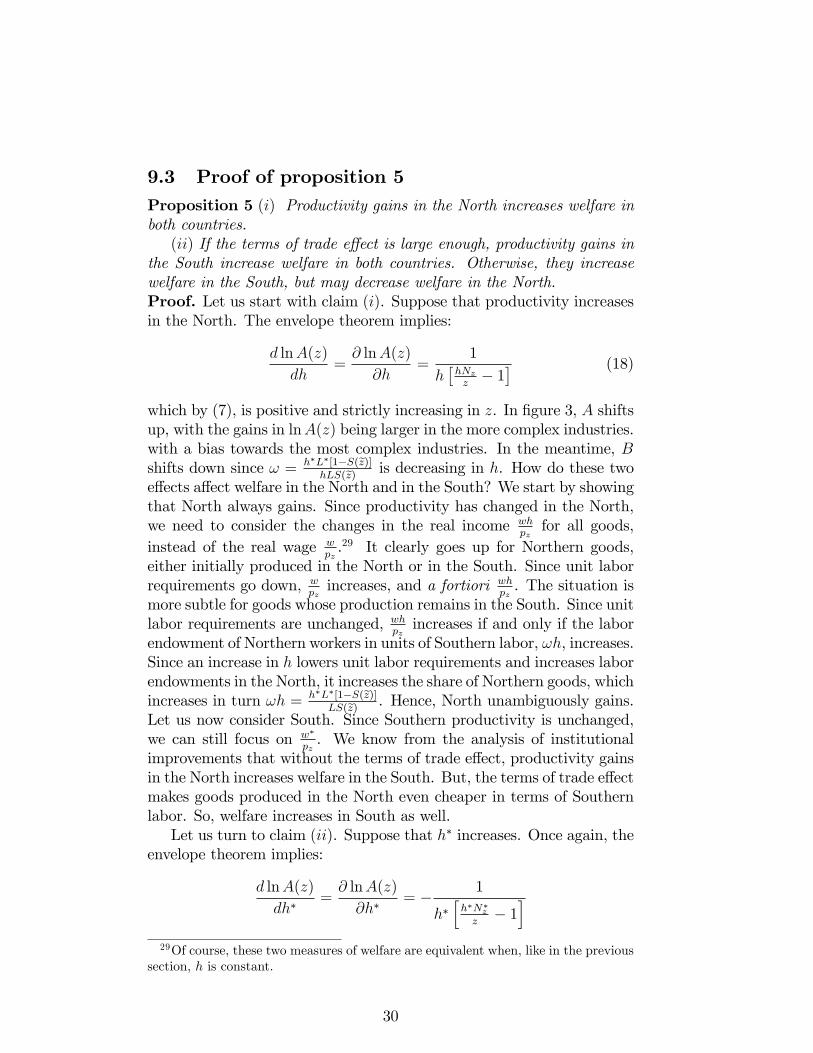
9.3 Proof of proposition 5Proposition 5 (i) Productivity gains in the North increases welfare inboth countries.(ii) If the terms of trade e¤ect is large enough, productivity gains in
the South increase welfare in both countries. Otherwise, they increasewelfare in the South, but may decrease welfare in the North.Proof. Let us start with claim (i). Suppose that productivity increasesin the North. The envelope theorem implies:
d lnA(z)
dh=@ lnA(z)
@h=
1
h�hNzz� 1� (18)
which by (7), is positive and strictly increasing in z. In �gure 3, A shiftsup, with the gains in lnA(z) being larger in the more complex industries.with a bias towards the most complex industries. In the meantime, Bshifts down since ! = h�L�[1�S(ez)]
hLS(ez) is decreasing in h. How do these twoe¤ects a¤ect welfare in the North and in the South? We start by showingthat North always gains. Since productivity has changed in the North,we need to consider the changes in the real income wh
pzfor all goods,
instead of the real wage wpz.29 It clearly goes up for Northern goods,
either initially produced in the North or in the South. Since unit laborrequirements go down, w
pzincreases, and a fortiori wh
pz. The situation is
more subtle for goods whose production remains in the South. Since unitlabor requirements are unchanged, wh
pzincreases if and only if the labor
endowment of Northern workers in units of Southern labor, !h, increases.Since an increase in h lowers unit labor requirements and increases laborendowments in the North, it increases the share of Northern goods, whichincreases in turn !h = h�L�[1�S(ez)]
LS(ez) . Hence, North unambiguously gains.Let us now consider South. Since Southern productivity is unchanged,we can still focus on w�
pz. We know from the analysis of institutional
improvements that without the terms of trade e¤ect, productivity gainsin the North increases welfare in the South. But, the terms of trade e¤ectmakes goods produced in the North even cheaper in terms of Southernlabor. So, welfare increases in South as well.Let us turn to claim (ii). Suppose that h� increases. Once again, the
envelope theorem implies:
d lnA(z)
dh�=@ lnA(z)
@h�= � 1
h�hh�N�
z
z� 1i
29Of course, these two measures of welfare are equivalent when, like in the previoussection, h is constant.
30
which by (7), is negative and strictly decreasing in z. We can analyze thewelfare impact in the South like we have analyzed the welfare impactof an increase of h in the North. The same formal argument impliesthat w�h�
pzincrease for all goods. Similarly, we can still focus on w
pzin
the North. From the analysis of institutional improvements, we knowthat without the terms of trade e¤ect, productivity gains in the Southdecrease w
pzin the least complex industries. However, if the terms of
trade e¤ect is so large that ! increases, this can no longer be true. Inthis situation, the decrease in unit labor requirements abroad impliesthat North unambiguously wins as well.
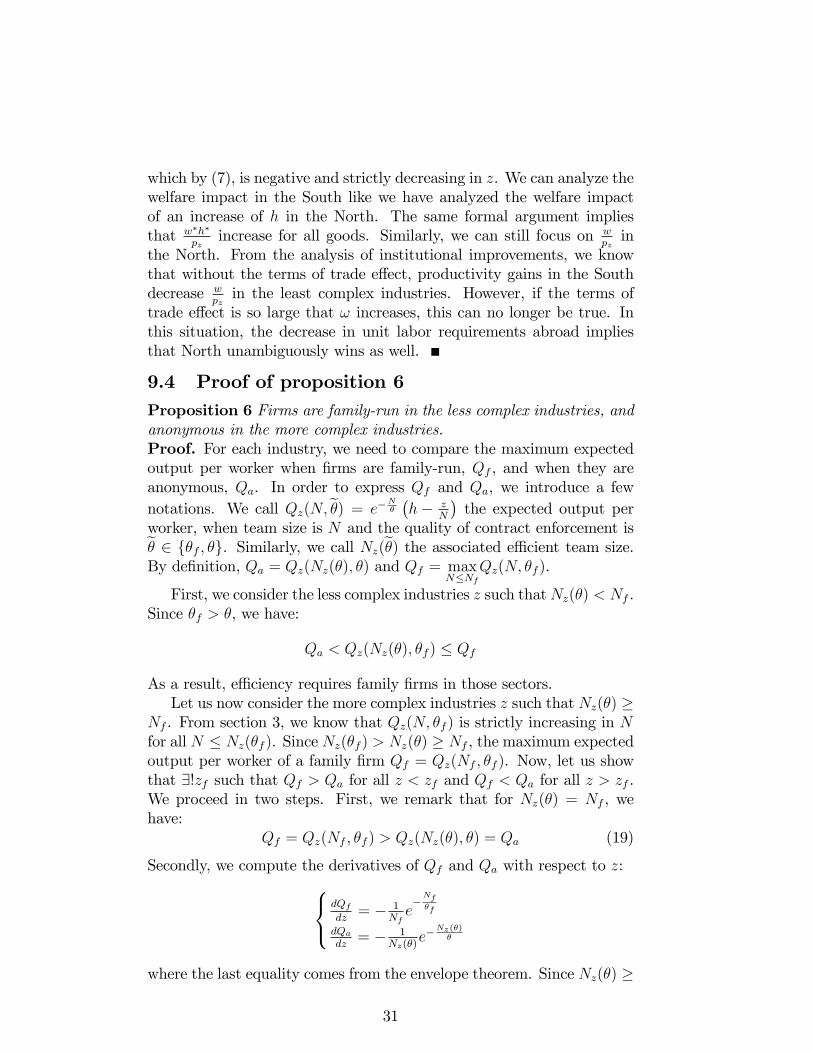
9.4 Proof of proposition 6Proposition 6 Firms are family-run in the less complex industries, andanonymous in the more complex industries.Proof. For each industry, we need to compare the maximum expectedoutput per worker when �rms are family-run, Qf , and when they areanonymous, Qa. In order to express Qf and Qa, we introduce a fewnotations. We call Qz(N;e�) = e�
N�
�h� z
N
�the expected output per
worker, when team size is N and the quality of contract enforcement ise� 2 f�f ; �g. Similarly, we call Nz(e�) the associated e¢ cient team size.By de�nition, Qa = Qz(Nz(�); �) and Qf = max
N�NfQz(N; �f ).
First, we consider the less complex industries z such thatNz(�) < Nf .Since �f > �, we have:
Qa < Qz(Nz(�); �f ) � Qf
As a result, e¢ ciency requires family �rms in those sectors.Let us now consider the more complex industries z such that Nz(�) �
Nf . From section 3, we know that Qz(N; �f ) is strictly increasing in Nfor all N � Nz(�f ). Since Nz(�f ) > Nz(�) � Nf , the maximum expectedoutput per worker of a family �rm Qf = Qz(Nf ; �f ). Now, let us showthat 9!zf such that Qf > Qa for all z < zf and Qf < Qa for all z > zf .We proceed in two steps. First, we remark that for Nz(�) = Nf , wehave:
Qf = Qz(Nf ; �f ) > Qz(Nz(�); �) = Qa (19)
Secondly, we compute the derivatives of Qf and Qa with respect to z:8<: dQfdz= � 1
Nfe�Nf�f
dQadz= � 1
Nz(�)e�
Nz(�)�
where the last equality comes from the envelope theorem. Since Nz(�) �
31

Nf and �f > �, the slope of Qf is steeper:����dQfdz���� > ����dQadz
���� (20)
The two inequalities (19) and (20) imply the existence and uniquenessof zf .
9.5 Proof of proposition 7Proposition 7 The proportion of family �rms:
(i) decreases with the quality of institutions;(ii) increases with workers�productivity.
Proof. In the proof of proposition 6, we have shown that there exists aunique zf such that:
e�Nf�f (h� zf
Nf) = e�
Nzf(�)
� (h� zfNzf (�)
) (21)
Let us �rst di¤erentiate this expression with respect to � and zf :
� 1
Nfe�Nf�f dzf = �
1
Nzf (�)e�
Nzf(�)
� dzf+1
�2e�
Nzf(�)
� (hNzf (�)�zf )d� (22)
where the RHS comes from the envelope theorem. After rearrangements,we obtain:
dzfd�
= � 1�2
e�Nzf
(�)
� (hNzf (�)� zf )�1Nfe�Nf�f � 1
Nzf (�)e�
Nzf(�)
�
� < 0 (23)
since Nzf > Nf and �f > �. Claim (i) follows.Let us now rewrite equation (21) as:
e�Nf�f (1� zf
hNf) = e�
Nzf(�)
� (1� zfhNzf (�)
) (24)
The envelope theorem implies:�1
Nfe�Nf�f � 1
Nzf (�)e�
Nzf(�)
�
�� d
�zfh
�= 0 (25)
and thus d� zfh
�= 0. Claim (ii) follows.
32
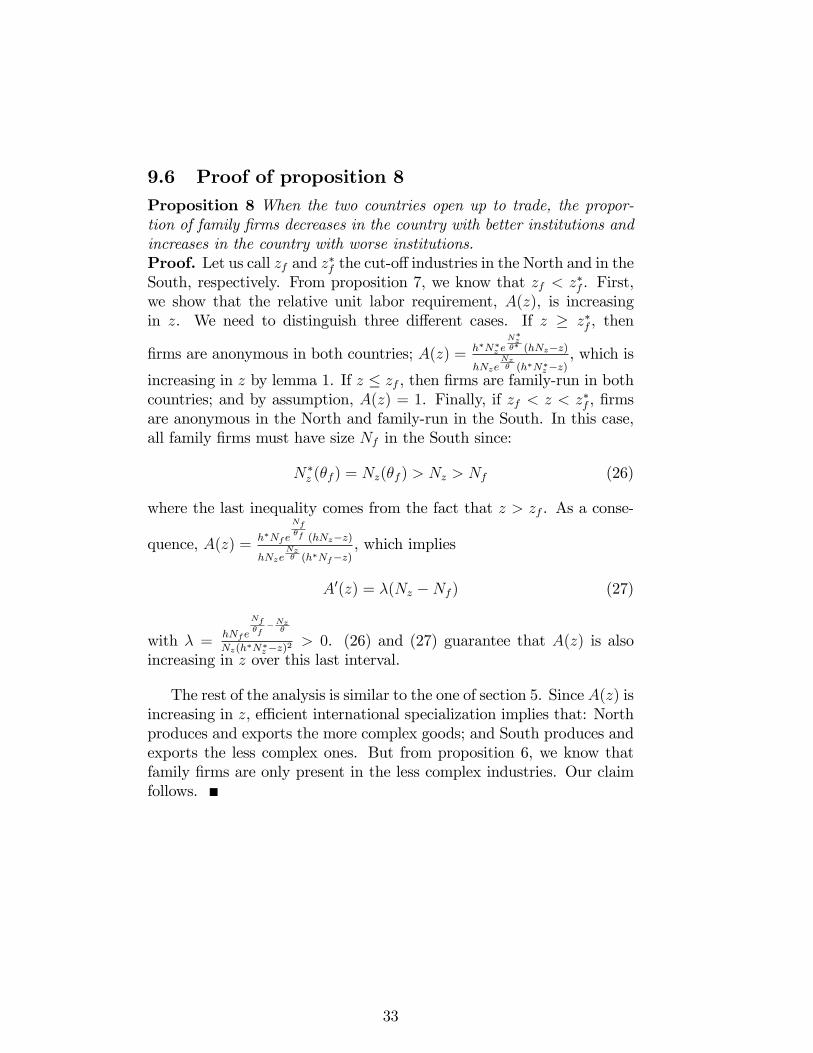
9.6 Proof of proposition 8Proposition 8 When the two countries open up to trade, the propor-tion of family �rms decreases in the country with better institutions andincreases in the country with worse institutions.Proof. Let us call zf and z�f the cut-o¤industries in the North and in theSouth, respectively. From proposition 7, we know that zf < z�f . First,we show that the relative unit labor requirement, A(z), is increasingin z. We need to distinguish three di¤erent cases. If z � z�f , then
�rms are anonymous in both countries; A(z) = h�N�z e
N�z�� (hNz�z)
hNzeNz� (h�N�
z�z), which is
increasing in z by lemma 1. If z � zf , then �rms are family-run in bothcountries; and by assumption, A(z) = 1. Finally, if zf < z < z�f , �rmsare anonymous in the North and family-run in the South. In this case,all family �rms must have size Nf in the South since:
N�z (�f ) = Nz(�f ) > Nz > Nf (26)
where the last inequality comes from the fact that z > zf . As a conse-
quence, A(z) = h�Nf e
Nf�f (hNz�z)
hNzeNz� (h�Nf�z)
, which implies
A0(z) = �(Nz �Nf ) (27)
with � = hNf e
Nf�f
�Nz�
Nz(h�N�z�z)2
> 0. (26) and (27) guarantee that A(z) is alsoincreasing in z over this last interval.
The rest of the analysis is similar to the one of section 5. Since A(z) isincreasing in z, e¢ cient international specialization implies that: Northproduces and exports the more complex goods; and South produces andexports the less complex ones. But from proposition 6, we know thatfamily �rms are only present in the less complex industries. Our claimfollows.
33
References
[1] Acemoglu, D., Johnson S. and J.Robinson [2001], The colonialorigins of comparative development: an empirical investigation, TheAmerican Economic Review, 91, p1369-1401.
[2] Acemoglu, D. and T.Verdier [1998], Property rights, corruptionand the allocation of talent: a general equilibrium approach, TheEconomic Journal, 108, p1381-1403.
[3] Aghion, P. and J. Tirole [1997], Formal and real authority inorganizations, Journal of Political Economy, 105-1, p1-29
[4] Antras, P. [2003], Firms, contracts and trade structure, The Quar-terly Journal of Economics, 118, p1375-1418.
[5] Bartelsman, E., Scarpetta, S. and F. Schivardi [2003], Com-parative analysis of �rm demographics and survival: micro-level ev-idence for the OECD countries, OECD working paper no.348.
[6] Becker, G. and K. Murphy [1992], The division of labor, coordi-nation costs, and knowledge, The Quarterly Journal of Economics,107-4, p1137-1160.
[7] Ben-Porath, Y. [1980], The F-Connection: families, friends and�rms and the organization of exchange, Population and Develop-ment Review, 6-1, p1-30.
[8] Berkowitz, D., Moenius, J. and K. Pistor [2003], Trade, lawand product complexity, Columbia Law and Economics Working Pa-per No 230.
[9] Bernheim, B. and M.Whinston, [1990],Multimarket contact andcollusive behavior, Rand Journal of Economics, 21-1, p 1-26.
[10] Brown, C. and J. Medoff [1989], The employer size-wage e¤ect,Journal of Political Economy, 97-5, p1027-1059.
[11] Burkart, M., Panunzi, F. and A. Shleifer [2003], Family �rms,The Journal of Finance, 58-5, p2167-2201.
[12] Clague, C. [1991], Factor proportions, relative e¢ ciency and de-veloping countries� trade, Journal of Development Economics, 35,p357-380.
[13] Davis, S. and M. Henrekson [1999], Explaining national di¤er-ences in the size and industry distribution of employment, SmallBusiness Economics, 12, p59-83.
[14] Dixit, A. [1996], The making of economic policy: a transaction-costpolitics perspective, MIT press.
[15] Dixit, A. [2004], Lawlessness and economics: alternative modes ofgovernance, Princeton University Press.
[16] Dornbusch, R., Fischer S. and P. Samuelson [1977], Compar-ative advantage, trade, and payments in a Ricardian model with acontinuum of goods, The American Economic Review, 67-5, p823-
34
839.[17] Fukuyama, F. [1995], Trust, Free Press, New York.[18] Greif, A. [1994], Cultural beliefs and the organization of society: a
historical and theoretical re�ection on collectivist and individualistsocieties, Journal of Political Economy, 102-5, p912-950.
[19] Grossman, S. and O. Hart [1986], The costs and bene�ts of own-ership: a theory of vertical and lateral integration, Journal of Polit-ical Economy, 94-4, p691-719
[20] Grossman, G. and E. Helpman [2002], Integration versus out-sourcing in industry equilibrium, The Quarterly Journal of Eco-nomics, 117, p85-120.
[21] Grossman, G. and G. Maggi [2000], Diversity and trade, TheAmerican Economic Review, 90-5, p1255-1275.
[22] Kremer, M. [1993], The O-Ring theory of economic development,The Quarterly Journal of Economics, 108-3, p551-575.
[23] Krugman, P. [1986], A "Technology Gap" model of internationaltrade, in Structural Adjustment in Advanced Economics, edited byK. Jugenfelt and D. Hague, MacMillan.
[24] Kumar, K., Rajan, R. and L. Zingales [2001],What determines�rm size?, mimeo GSB University of Chicago.
[25] La Porta, R., Lopez-de-Silanes, F., Shleifer A. and R.Vishny [1997], Trust in large organizations, The American Eco-nomic Review, 87-2, p333-338.
[26] Levchenko, A. [2003], Institutional quality and internationaltrade, mimeo MIT.
[27] Loveman, G. andW. Sengenberger [1991], The re-emergence ofsmall scale production: an international comparison, Small BusinessEconomics, 3, p1-37.
[28] Marin, D. and T. Verdier [2003], Globalization and the empow-erment of talent, CEPR, discussion paper.
[29] Matsuyama, K. [2004], Credit market imperfections and patternsof international trade and capital �ows, mimeo Northwestern Uni-versity.
[30] North, D. [1990], Institutions and a transaction-cost theory of ex-change, in Perspectives on Political Economy, edited by J. Alt andK. Shesple, Cambridge University Press.
[31] Pilat, D. [1996], Labor productivity levels in OECD countries: esti-mates for manufacturing and selected service sectors, OECD work-ing paper no.169.
[32] Rauch, J. [1991], Modeling the informal sector formally, Journalof Development Economics, 35, p33-47.
[33] Restuccia, D., Tao Yang, D. and X. Zhu [2003], Agriculture and
35
aggregate productivity: a quantitative cross-country analysis, mimeoUniversity of Toronto.
[34] Rosen, S. [1983], Specialization and human capital, Journal of La-bor Economics, 1-1, p43-49.
[35] Smith, A. [1776], The Wealth of Nations.[36] Tybout, J. [2000], Manufacturing �rms in developing countries:
how well do they do, and why?, Journal of Economic Literature,38-1, p11-44.
[37] Vogel, J. [2004], Institutions and moral hazard in open economies,mimeo Princeton University.
[38] Williamson, O. [1979], Transaction-cost economics: the gover-nance of contractual relations, Journal of Law and Economics, 22-2,p233-261.
36


![[ARE INS - XII] TESTATA-ARE/LARENA/INSERTI-1/12](https://img.pdfslide.tips/doc/110x75/5fbacd1e2af72c36b4713cf5/are-ins-xii-testata-arelarenainserti-112.jpg)