Embed Size (px)
Citation preview
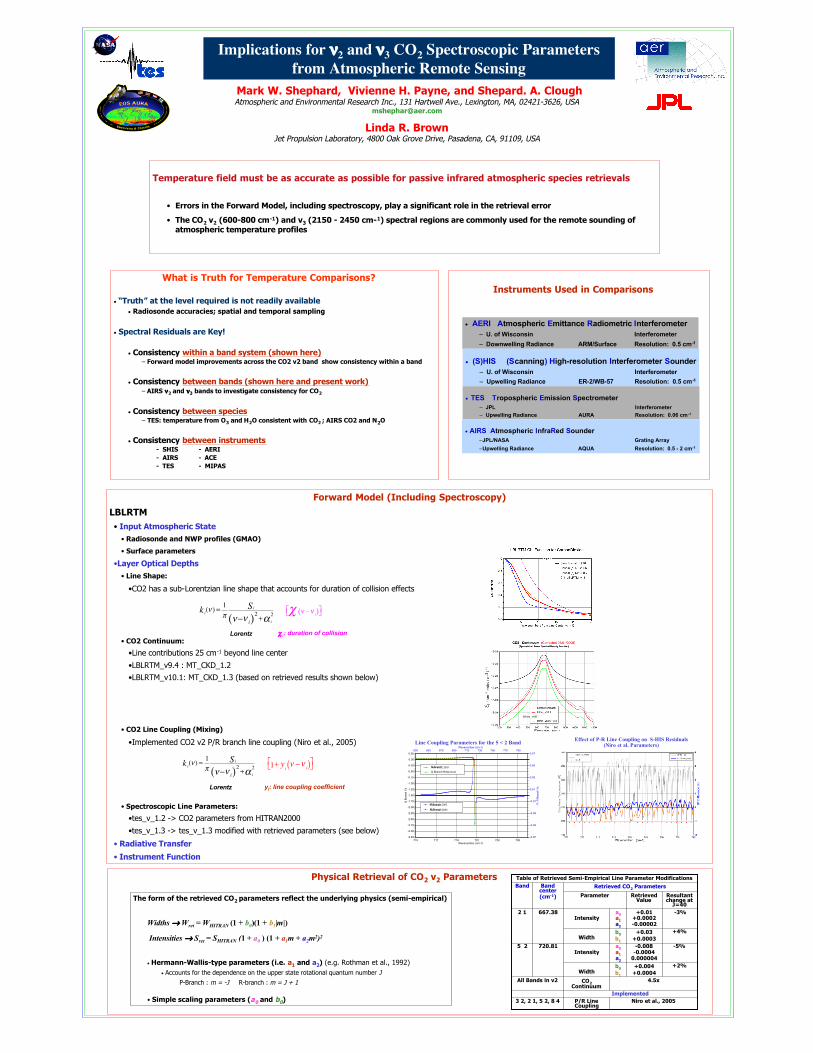
Physical Retrieval of CO2 v2 Parameters
Forward Model (Including Spectroscopy)
LBLRTM• Input Atmospheric State
• Radiosonde and NWP profiles (GMAO)
• Surface parameters
•Layer Optical Depths
• Line Shape:
•CO2 has a sub-Lorentzian line shape that accounts for duration of collision effects
• CO2 Continuum:
•Line contributions 25 cm-1 beyond line center
•LBLRTM_v9.4 : MT_CKD_1.2
•LBLRTM_v10.1: MT_CKD_1.3 (based on retrieved results shown below)
• CO2 Line Coupling (Mixing)
•Implemented CO2 v2 P/R branch line coupling (Niro et al., 2005)
• Spectroscopic Line Parameters:
•tes_v_1.2 -> CO2 parameters from HITRAN2000
•tes_v_1.3 -> tes_v_1.3 modified with retrieved parameters (see below)
• Radiative Transfer
• Instrument Function
Mark W. Shephard, Vivienne H. Payne, and Shepard. A. CloughAtmospheric and Environmental Research Inc., 131 Hartwell Ave., Lexington, MA, 02421-3626, USA
Linda R. BrownJet Propulsion Laboratory, 4800 Oak Grove Drive, Pasadena, CA, 91109, USA
Implications for ν2 and ν3 CO2 Spectroscopic Parametersfrom Atmospheric Remote Sensing
Instruments Used in Comparisons
Temperature field must be as accurate as possible for passive infrared atmospheric species retrievals
• Errors in the Forward Model, including spectroscopy, play a significant role in the retrieval error
• The CO2 v2 (600-800 cm-1) and v3 (2150 - 2450 cm-1) spectral regions are commonly used for the remote sounding ofatmospheric temperature profiles
• AERI Atmospheric Emittance Radiometric Interferometer– U. of Wisconsin Interferometer
– Downwelling Radiance ARM/Surface Resolution: 0.5 cm-1
• (S)HIS (Scanning) High-resolution Interferometer Sounder– U. of Wisconsin Interferometer
– Upwelling Radiance ER-2/WB-57 Resolution: 0.5 cm-1
• TES Tropospheric Emission Spectrometer– JPL Interferometer
– Upwelling Radiance AURA Resolution: 0.06 cm-1
• AIRS Atmospheric InfraRed Sounder–JPL/NASA Grating Array
–Upwelling Radiance AQUA Resolution: 0.5 - 2 cm-1
What is Truth for Temperature Comparisons?
• “Truth” at the level required is not readily available• Radiosonde accuracies; spatial and temporal sampling
• Spectral Residuals are Key!
• Consistency within a band system (shown here)– Forward model improvements across the CO2 v2 band show consistency within a band
• Consistency between bands (shown here and present work)– AIRS ν2 and ν3 bands to investigate consistency for CO2
• Consistency between species– TES: temperature from O3 and H2O consistent with CO2 ; AIRS CO2 and N2O
• Consistency between instruments- SHIS - AERI- AIRS - ACE- TES - MIPAS
Table of Retrieved Semi-Empirical Line Parameter Modifications
Implemented
Resultantchange at
J=40
RetrievedValue
Parameter
P/R LineCoupling
CO2Continuum
Width
Intensity
Width
Intensity
+2%+0.004+0.0004
b0b1
+4%+0.03+0.0003
b0b1
All Bands in v2
720.81
667.38
Bandcenter(cm-1)
3 2, 2 1, 5 2, 8 4
5 2
2 1
Band
Niro et al., 2005
4.5x
-5%-0.008-0.0004
0.000004
a0a1a2
-3%+0.01+0.0002-0.00002
a0a1a2
Retrieved CO2 Parameters
The form of the retrieved CO2 parameters reflect the underlying physics (semi-empirical)
Widths → Wret = WHITRAN (1 + b0)(1 + b1|m|)
Intensities → Sret = SHITRAN (1 + a0 ) (1 + a1m + a2m2)2
• Hermann-Wallis-type parameters (i.e. a1 and a2) (e.g. Rothman et al., 1992)• Accounts for the dependence on the upper state rotational quantum number J
P-Branch : m = -J R-branch : m = J + 1
• Simple scaling parameters (a0 and b0)
ik (ν) =1π
iS2ν− iν( ) + i
2αLorentz
χ ν −i
ν( )⎡⎣ ⎤⎦
χ i: duration of collision
ik (ν) =1π
iS2ν− iν( ) + i
2αLorentz
1+ iy ν − iν( )⎡⎣ ⎤⎦
yi: line coupling coefficient
Effect of P-R Line Coupling on S-HIS Residuals(Niro et al. Parameters)
lblrtm_v6.01
Line Coupling Parameters for the 5 < 2 Band
-3.25
-3.00
-2.75
-2.50
-2.25
-2.00
-1.75
-1.50
-1.25
-1.00
-0.75
-0.50
-0.25
0.00
0.25
-0.07
-0.05
-0.03
-0.01
0.01
0.03
0.05
0.07
715 717 719 721 723 725
630 650 670 690 710 730 750 770 790
Q B
ranc
h Ys
P, R
Bra
nch
Ys
Wavenumber (cm-1)
Wavenumber (cm-1)
Q Branch Hartmann et al.Q Branch Hoke et al.
P Branch Hartmann et al.R Branch Hartmann et al.Niro et al., 2005
Niro et al., 2005
Niro et al., 2005
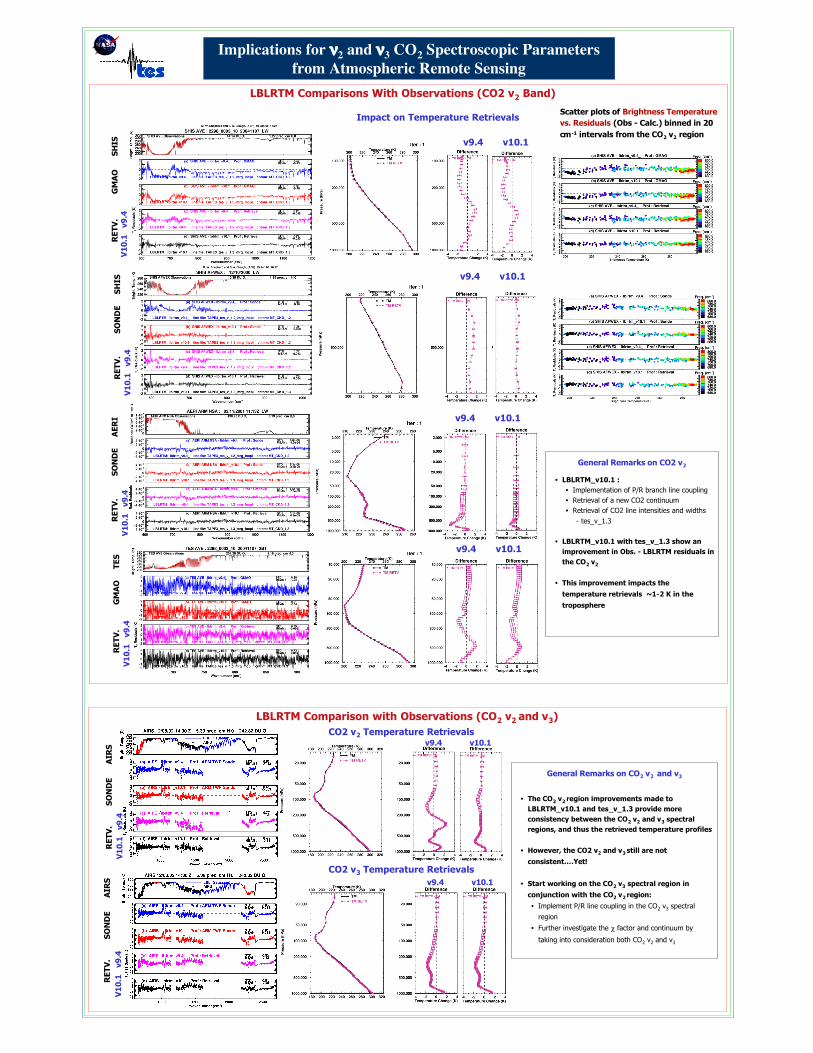
LBLRTM Comparisons With Observations (CO2 v2 Band)
Implications for ν2 and ν3 CO2 Spectroscopic Parametersfrom Atmospheric Remote Sensing
LBLRTM Comparison with Observations (CO2 v2 and v3)
Scatter plots of Brightness Temperaturevs. Residuals (Obs - Calc.) binned in 20cm-1 intervals from the CO2 v2 region
Impact on Temperature Retrievals
v9.4 v10.1
V1
0.1
v9
.4
R
ETV
.
GM
AO
SH
IS
V1
0.1
v9
.4
R
ETV
.
S
ON
DE
S
HIS
V1
0.1
v9
.4
R
ETV
.
S
ON
DE
A
ER
IV
10
.1
v9.4
RE
TV.
G
MA
O
TES
General Remarks on CO2 v2
• LBLRTM_v10.1 :• Implementation of P/R branch line coupling• Retrieval of a new CO2 continuum• Retrieval of CO2 line intensities and widths
- tes_v_1.3
• LBLRTM_v10.1 with tes_v_1.3 show animprovement in Obs. - LBLRTM residuals inthe CO2 v2
• This improvement impacts the
temperature retrievals ~1-2 K in the
troposphere
v9.4 v10.1
v9.4 v10.1
v9.4 v10.1
V1
0.1
v9
.4
R
ETV
.
S
ON
DE
AIR
S
V1
0.1
v9
.4
v9.4 v10.1
v9.4 v10.1CO2 v2 Temperature Retrievals
CO2 v3 Temperature Retrievals
RE
TV.
SO
ND
E
A
IRS
General Remarks on CO2 v2 and v3
• The CO2 v2 region improvements made toLBLRTM_v10.1 and tes_v_1.3 provide moreconsistency between the CO2 v2 and v3 spectralregions, and thus the retrieved temperature profiles
• However, the CO2 v2 and v3 still are not
consistent….Yet!
• Start working on the CO2 v3 spectral region in
conjunction with the CO2 v2 region:
• Implement P/R line coupling in the CO2 v3 spectral
region
• Further investigate the χ factor and continuum by
taking into consideration both CO2 v2 and v3