Embed Size (px)
Citation preview

Open Access Journal of Waste Management & Xenobiotics ISSN: 2640-2718
Improving Gas Permeability Measurements for Environmental Monitoring and Management J Waste Manage Xenobio
Improving Gas Permeability Measurements for Environmental
Monitoring and Management
Lucchetti C1, De Simone G2, Tuccimei P2*, Ricci T3, Finizola A4 and
Sciarra A3
1Dipartimento di Scienze della Terra, Universit{ degli Studi “La Sapienza”, Roma, Italy
2Dipartimento di Scienze, Universit{ “Roma Tre”, Roma, Italy
3Istituto Nazionale di Geofisica e Vulcanologia, Roma, Italy
4Laboratoire GéoSciences Réunion, Univerité de la Réunion, La Réunion, France
*Corresponding author: Paola Tuccimei, Dipartimento di Scienze, Universit{ “Roma Tre”, Largo San Leonardo Murialdo
1, 00146 Roma, Italy, Tel: (+39)06-57338092; Email: [email protected]
Abstract
Intrinsic permeability is a crucial parameter to interpret soil gas data recorded from monitoring stations in different
environmental settings. It is also fundamental for environmental management and pollution remediation. An improved
version of a permeameter (PRM3) recently developed for environmental applications is presented and calibrated against
a reference instrument (RADON-JOK produced by RADON v.o.s.). The innovations of this prototype are: i) the absence of
the flow meter, and ii) a membrane pump in place of a rotary vane device. Proper calculation of the permeability from
Darcy’s law is provided, as well as a modified formula for permeability determination in volcanic areas. Actually, soil gas
viscosity and permeability are affected by changing gas temperature and composition. The effects of these two
parameters on soil gas viscosity and permeability are also displayed. The second part of the paper shows the employ of
permeability measurements in environmental monitoring. The aim of these field-works was the study of lateral and
vertical variability of soil permeability at a very small scale (step of 0.25 m) and the effect of intrinsic permeability on gas
transport through the soil and on gas concentration along depth profiles. We chose 2 different test sites: Valle della
Caffarella (Roma, Italy) and Solfatara Volcano (Pozzuoli, Italy) areas. A specific protocol, designed to check any
interference among permeability measurements carried out at very close distances demonstrated that no disturbance is
occurring. Intrinsic permeability profiles resulted to be good proxy indicators for the degassing style of the two areas. In
both cases, it gave important hints to interpret environmental data and help in the management of the sites.
Keywords: Intrinsic Permeability; Soil Degassing; Environmental Monitoring and Management; Volcanic Hazard;
Hydrothermal Areas
Investigation Paper
Volume 2 Issue 2
Received Date: May 24, 2019
Published Date: June 19, 2019 DOI: 10.23880/oajwx-16000123

Open Access Journal of Waste Management & Xenobiotics
Tuccimei P, et al. Improving Gas Permeability Measurements for Environmental Monitoring and Management. J Waste Manage Xenobio 2019, 2(2): 000123.
Copyright© Tuccimei P, et al.
2
Introduction
Soil gas permeability is a key parameter to interpret geochemical data from monitoring station in volcanic or seismically active areas [1,2]. It is also crucial to define transport mechanisms of gases or volatile compounds through soils, with relevant implications in the field of soil remediation, landfill management, and agriculture and geogenic gas hazard [3-7]. Soil gas permeability, assessed by CO2 soil flux mapping, is also a key parameter in geothermal areas to identify productive geothermal reservoir [8].
Recently a permeameter to measure soil gas intrinsic
permeability for environmental applications was developed and calibrated [9]. Theoretical framework for gas permeability measurement is based on Darcy's equation, where the soil is assumed to be homogeneous and isotropic and standard conditions are considered. The instrument consists of a battery, a miniature rotary vane pump (Fürgut, moldel DC12/18FK), a vacuum gauge with digital display (SMC) and a flowmeter (Key Instruments). Since a good relationship between the air flow and the vacuum readings through soils of various degrees of
permeability was found, the authors suggested a future simplification of the instrument, without the employ of the flowmeter.
The first instrument (hereafter called PRM3.1) has
been largely used to measure soil permeability in different places [9,10] throughout the year 2015, but the Fürgut pump resulted to be problematic at times because fine mineral particles removed from the soil could get stuck to the vane, folding it and blocking the air flow. So the old device has been replaced with a membrane pump (KNF, model NMP 850 KNDC), more robust and appropriate for aspiring soil air, but with similar properties (Figure 1) in terms of flow capacity at atmospheric pressure and ultimate vacuum (4.5 L min-1 and 230 absorbed mbar), compared to the previous one (4.4 L min-1and 210 absorbed mbar). The apparatus is not equipped with a flow meter anymore since the flow value can be expressed in terms of induced negative pressure at 80 cm soil depth [9]. This new prototype (hereafter called PRM3.2) has been calibrated against RADON-JOK permeameter (Radon v.o.s, www.radon-vos.cz) in Valle della Caffarella, Guidonia and Villa Fiorita areas (Roma, Italy).
Figure 1: Flow capacity vs pressure in free air conditions for the miniature rotary vane pump (Fürgut, model DC12/18FK) and the membrane pump (KNF, model NMP 850 KNDC). The experimental curve obtained for soil gas permeability measurements using PRM3.1 is also reported.
In the second part of the paper, we introduce the
employ of permeability measurements for environmental monitoring. Firstly, the use of the permeameter in areas affected by soil degassing at high temperature is discussed, because intrinsic permeability and air viscosity are affected by gas composition and temperature.
Equations for calculating air viscosity and soil gas permeability in these cases are provided.
Furthermore, we investigated: i) the spatial
heterogeneity of soil gas permeability at very small scale, either as lateral or vertical change and ii) if any single measurement carried out with the new permeameter
Free air Fürgut GmbH
(moldel DC12/18FK)y = 3.49E-09x + 7.33E-05
0,00001
0,00002
0,00003
0,00004
0,00005
0,00006
0,00007
0,00008
-14000 -12000 -10000 -8000 -6000 -4000 -2000 0
Q (
m3
s-1)
Dp (Pa)
Experimental curveFürgut GmbH
(model DC12/18FK)y = 2.01 E-09x + 6.74E-05
Free air KNF
(moldel NMP 850 KNDC )y = 3.49E-09x + 7.33E-05

Open Access Journal of Waste Management & Xenobiotics
Tuccimei P, et al. Improving Gas Permeability Measurements for Environmental Monitoring and Management. J Waste Manage Xenobio 2019, 2(2): 000123.
Copyright© Tuccimei P, et al.
3
disturbs other determinations carried out at very close distances. A specific protocol was developed to verify if the step length reduction between measurements affects permeability values. Firstly, measurements were carried out at 2-m distance, then progressively closer at 1.75-m, 0.5-m and 0.25-m distance. This experimental approach could provide an innovative tool to examine natural variation of vertical and horizontal permeability at decimeter scale, to compare with soil gas composition and temperature in sites characterized by different degassing style.
Material and Methods
Intrinsic permeability measurements were performed in Valle della Caffarella, Vigna Fiorita and Guidonia Montecelio areas (Roma, Italy) where soils and rocks (volcanic tuffs, travertine, flysch, clays and sands) with a large interval of gas permeability outcrop. The new prototype and RADON-JOK (Figure 2) were connected to the same hollow probe (RADON v.o.s) driven to 80 cm depth, after the extrusion of a lost tip by a given distance using a punch wire [9].
Figure 2: Picture of opened PRM3.2 permeameter. 1 is the on/off switch; 2 are the batteries; 3 and 4 are respectively the vacuometer (partly hidden by the box walls) and its display; 5 is the membrane pump and 6 and 7 are namely a battery charger circuit board and a correlated switch to check the status of the batteries charge. Arrows indicates the air transport inside the instrument from the top of the hollow probe.
The principle of the permeameter consists of air withdrawal by means of negative pressure. Air is pumped out from a cylindrical cavity of known volume, created at the head of a probe (Radon v.o.s). The cavity is formed when a thin rod is pushed down inside the hollow tube, displacing the lost tip by a given distance (L = 50 mm). These probes use the approximation L > d (d = inner
diameter of the probe, 12 mm), with a shape factor F = 0.149 m. The gas permeability of soil, k (m2), has been calculated from the equation below (equation 3 in [9])
k = μ (m ΔP + c) / F ΔP (1)
where μ (Pa s) is the dynamic viscosity of air (at 10 °C, μ = 1.75 ×10⁻⁵ Pa s), m and c, are respectively the slope (2.01 x 10⁻⁹ m3 s-1 Pa-1) and the intercept (6.74 x 10⁻⁵ m3 s-
1) of the experimental curve obtained for PRM3.1 (see Figure 1), F is the shape factor of the probe (m) and ΔP (Pa) is the induced negative pressure. In other words, the term (m ΔP + c) replaces Q in the original equation for the calculation of the intrinsic permeability [11,12] and accounts for the removal of the flowmeter.
On top of the hollow probe, a fuel filter (Figure 3) has
been placed to capture soil particles which could exert an abrasive action on the components of the pump. Since this device slow down the air flow, the calibration is strictly dependent on the presence of the filter which has to be used all the time in order to get correct results. Soil CO2 was measured in situ by connecting a Dräger X-am 7000 instrument (Dräger) equipped with a built-in pump and an infrared detector to the same probe head. Soil gas was sampled from the hollow probe and then measured in laboratory by a Gas Chromatographer (Micro-GC CP-4900 - VARIAN) for CO2, O2, N2, CH4, H2, He, Ne concentration.
Figure 3: Soil gas permeability obtained with RADON-JOK permeameter (see equation 1) vs permeability obtained with PRM3.2 instrument. Limits between permeability classes on the y axis, as indicated by Neznal, et al. A fuel filter is included in the figure, to remind that the calibration has been carried out with the filter placed upstream of the air flow entering the pump and thus affecting pressure and permeability readings.
1
2
2
3
4
5
6
7
y = 1,8676x1,0441
R² = 0,9885
1,00E-13
1,00E-12
1,00E-11
1,00E-10
1,00E-13 1,00E-12 1,00E-11 1,00E-10
k R
AD
ON
-JO
K (m
2)
k PRM3.2 (m2)
4 x 10-13 m2
4 x 10-12 m2
Low
Medium
High

Open Access Journal of Waste Management & Xenobiotics
Tuccimei P, et al. Improving Gas Permeability Measurements for Environmental Monitoring and Management. J Waste Manage Xenobio 2019, 2(2): 000123.
Copyright© Tuccimei P, et al.
4
Calibration of the Permeameter
Soil intrinsic permeability (k, m2) has been measured at Valle della Caffarella, Vigna Fiorita and Guidonia Montecelio areas (Italy) using PRM3.2 (Table 1). Permeability values have been compared with those
obtained with RADON-JOK (Figure 3), a standard and well known instrument, largely employed in soil degassing studies [13,14]. RADON-JOK, whose description and use is reported in [12], makes use of Darcy equation to calculate intrinsic permeability.
Id. Location k RJ k PRM3 ΔP CO2 (Dräeger) CO2 O2 N2 CH4 H2 He Ne
* (m2) (m2) (-kPa) % % % % ppm ppm ppm ppm
1 0-20 9.50E-12 1.34E-11 -0.6 0.6 0.93 19.88 77.49 3.79 2.94 5.53 20.30 2 0-40 1.60E-11 2.67E-11 -0.3 1.2 - - - - - - - 3 0-60 5.80E-12 1.10E-11 -0.8 2 1.67 19.62 77.29 3.92 3.37 5.46 20.65 4 0-80 1.40E-11 2.67E-11 -0.3 2.6 - - - - - - - 5 0-100 7.20E-13 1.47E-12 -6.4 3.2 3.07 18.83 76.82 2.78 3.73 5.57 21.09 6 0.25-20 2.40E-12 4.41E-12 -1.9 0.8 1.23 19.83 77.54 3.23 4.2 5.2 18.87 7 0.25-40 9.80E-12 1.60E-11 -0.5 1.8 - - - - - - - 8 0.25-60 3.60E-12 6.33E-12 -1.3 2.4 - - - - - - - 9 0.25-80 1.40E-12 6.33E-12 -1.3 2.6 - - - - - - -
10 0.25-100 1.70E-12 3.07E-12 -2.8 3 3.19 18.78 76.94 3.07 3.42 5.41 19.47 11 0.5-20 2.30E-12 4.01E-12 -2.1 1.4 1.47 19.57 77.55 3.37 2.34 5.60 20.17 12 0.5-40 1.20E-11 2.01E-11 -0.4 1.6 - - - - - - - 13 0.5-60 1.50E-11 2.67E-11 -0.3 2.6 2.19 19.32 77.41 2.71 3.67 5.26 18.85 14 0.5-80 1.60E-12 2.79E-12 -3.1 2.8 - - - - - - - 15 0.5-100 8.20E-13 1.34E-12 -7.2 3.4 3.20 18.73 76.92 2.80 3.08 5.28 18.95 16 0.75-20 1.80E-12 3.28E-12 -2.6 1.8 1.90 19.37 77.47 2.62 2.96 5.46 20.11 17 0.75-40 7.80E-12 1.10E-11 -0.7 2.2 - - - - - - - 18 0.75-60 1.10E-11 2.01E-11 -0.4 3 - - - - - - - 19 0.75-80 1.40E-12 2.44E-12 -3.6 3 - - - - - - - 20 0.75-100 1.20E-12 2.08E-12 -4.3 3.6 3.42 18.64 76.90 2.50 2.93 5.37 19.42 21 1-20 9.10E-13 1.73E-12 -5.3 1.6 2.07 19.12 77.45 3.08 3.83 5.22 19.83 22 1-40 1.10E-11 1.61E-11 -0.5 2.4 - - - - - - - 23 1-60 1.50E-11 2.67E-11 -0.3 3 2.63 19.03 77.33 2.83 3.35 5.37 18.91 24 1-80 2.30E-12 3.84E-12 -2.2 3 - - - - - - - 25 1-100 4.20E-13 9.83E-13 -10.6 4 3.85 18.45 76.87 2.44 2.13 5.42 19.98 26 1.25-20 1.80E-12 3.17E-12 -2.7 2.4 2.48 18.93 77.43 2.61 1.62 5.29 18.76 27 1.25-40 9.10E-12 1.34E-11 -0.6 2.6 - - - - - - - 28 1.25-60 1.10E-11 1.61E-11 -0.5 3.4 - - - - - - - 29 1.25-80 4.80E-12 7.44E-12 -1.1 3.4 - - - - - - - 30 1.25-100 1.10E-12 1.89E-12 -4.8 3.4 4.11 18.19 76.87 2.42 4.98 5.36 19.62 31 1.50-20 3.00E-12 4.90E-12 -1.7 2.2 2.20 19.08 77.51 2.91 4.01 5.28 19.58 32 1.50-40 1.30E-11 2.01E-11 -0.4 2.8 - - - - - - - 33 1.50-60 1.20E-11 1.61E-11 -0.5 3 3.05 18.77 77.29 2.37 1.93 5.39 19.26 34 1.50-80 7.70E-12 1.34E-11 -0.6 4.4 - - - - - - - 35 1.50-100 1.80E-12 3.07E-12 -2.8 4.6 3.81 18.16 76.99 2.45 3.82 5.37 19.03 36 1.75-20 1.10E-12 2.08E-12 -4.3 2.2 2.43 18.95 77.43 2.83 3.26 5.69 20.32 37 1.75-40 7.80E-12 1.16E-11 -0.7 2.8 - - - - - - - 38 1.75-60 3.30E-12 5.90E-12 -1.4 3.8 - - - - - - - 39 1.75-80 1.60E-11 2.01E-11 -0.4 4 - - - - - - - 40 1.75-100 1.20E-11 1.61E-11 -0.5 4.6 4.41 17.98 76.83 2.55 3.00 5.41 19.95 41 2-20 5.70E-13 1.16E-12 -8.6 2.2 2.43 18.98 77.40 2.71 2.80 5.43 20.37 42 2-40 2.50E-11 4.20E-12 -2 2.8 - - - - - - -
Open Access Journal of Waste Management & Xenobiotics
Tuccimei P, et al. Improving Gas Permeability Measurements for Environmental Monitoring and Management. J Waste Manage Xenobio 2019, 2(2): 000123.
Copyright© Tuccimei P, et al.
5
43 2-60 4.10E-12 6.84E-12 -1.2 4 3.43 18.73 77.03 2.87 4.01 5.65 20.56 44 2-80 1.90E-11 2.67E-11 -0.3 4.2 - - - - - - - 45 2-100 2.30E-11 3.99E-11 -0.2 3.6 4.22 18.00 76.83 2.62 4.43 5.39 19.27 46 Gui3-20 5.60E-12 1.16E-11 -0.7 0 - - - - - - - 47 Gui4-20 5.50E-12 1.01E-11 -0.8 0 - - - - - - - 48 Gui4-80 2.30E-13 5.49E-13 -25.2 0.8 - - - - - - - 49 Gui5-20 1.90E-11 2.67E-11 -0.3 0 - - - - - - - 50 Gui6-20 6.30E-12 1.16E-11 -0.7 0 - - - - - - - 51 Gui7-20 6.90E-13 9.12E-13 -11.7 0.6 - - - - - - - 52 Gui8-20 9.10E-14 4.02E-13 -47.5 1 - - - - - - - 53 Gui9-20 6.10E-14 3.81E-13 -54.4 0 - - - - - - - 54 VF1-80 3.90E-12 5.80E-12 -1.4 5.2 - - - - - - - 55 VF2-20 3.90E-12 6.33E-12 -1.3 - - - - - - - - 56 VF2-40 8.60E-13 1.23E-12 -8 - - - - - - - - 57 VF2-60 6.00E-13 9.18E-13 -11.6 - - - - - - - - 58 VF2-80 2.10E-12 3.28E-12 -2.6 - - - - - - - - 59 VF2-100 1.20E-12 2.08E-12 -4.3 - - - - - - - - 60 VF3-40 3.30E-12 5.19E-12 -1.6 - - - - - - - - 61 VF3-60 6.40E-12 1.01E-11 -0.8 - - - - - - - -
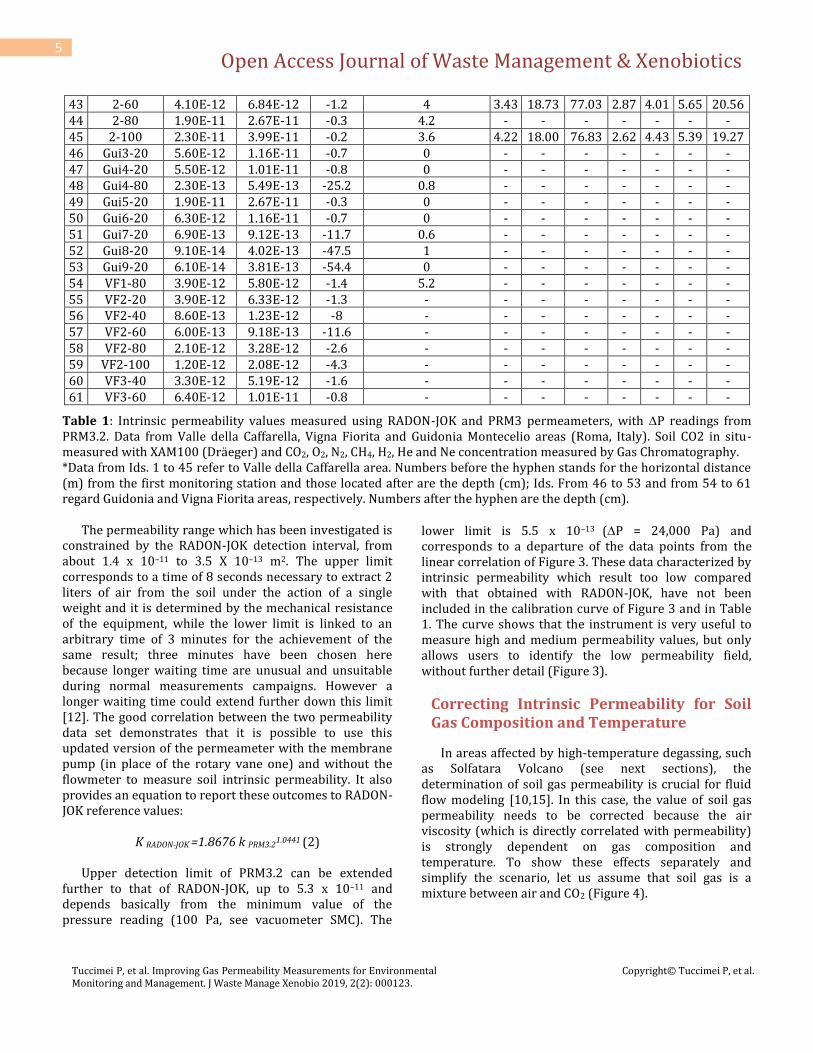
Table 1: Intrinsic permeability values measured using RADON-JOK and PRM3 permeameters, with DP readings from PRM3.2. Data from Valle della Caffarella, Vigna Fiorita and Guidonia Montecelio areas (Roma, Italy). Soil CO2 in situ-measured with XAM100 (Dräeger) and CO2, O2, N2, CH4, H2, He and Ne concentration measured by Gas Chromatography. *Data from Ids. 1 to 45 refer to Valle della Caffarella area. Numbers before the hyphen stands for the horizontal distance (m) from the first monitoring station and those located after are the depth (cm); Ids. From 46 to 53 and from 54 to 61 regard Guidonia and Vigna Fiorita areas, respectively. Numbers after the hyphen are the depth (cm).
The permeability range which has been investigated is constrained by the RADON-JOK detection interval, from about 1.4 x 10⁻¹¹ to 3.5 X 10⁻¹³ m2. The upper limit corresponds to a time of 8 seconds necessary to extract 2 liters of air from the soil under the action of a single weight and it is determined by the mechanical resistance of the equipment, while the lower limit is linked to an arbitrary time of 3 minutes for the achievement of the same result; three minutes have been chosen here because longer waiting time are unusual and unsuitable during normal measurements campaigns. However a longer waiting time could extend further down this limit [12]. The good correlation between the two permeability data set demonstrates that it is possible to use this updated version of the permeameter with the membrane pump (in place of the rotary vane one) and without the flowmeter to measure soil intrinsic permeability. It also provides an equation to report these outcomes to RADON-JOK reference values:
K RADON-JOK =1.8676 k PRM3.21.0441 (2)
Upper detection limit of PRM3.2 can be extended further to that of RADON-JOK, up to 5.3 x 10⁻¹¹ and depends basically from the minimum value of the pressure reading (100 Pa, see vacuometer SMC). The
lower limit is 5.5 x 10⁻¹³ (DP = 24,000 Pa) and corresponds to a departure of the data points from the linear correlation of Figure 3. These data characterized by intrinsic permeability which result too low compared with that obtained with RADON-JOK, have not been included in the calibration curve of Figure 3 and in Table 1. The curve shows that the instrument is very useful to measure high and medium permeability values, but only allows users to identify the low permeability field, without further detail (Figure 3).
Correcting Intrinsic Permeability for Soil Gas Composition and Temperature
In areas affected by high-temperature degassing, such as Solfatara Volcano (see next sections), the determination of soil gas permeability is crucial for fluid flow modeling [10,15]. In this case, the value of soil gas permeability needs to be corrected because the air viscosity (which is directly correlated with permeability) is strongly dependent on gas composition and temperature. To show these effects separately and simplify the scenario, let us assume that soil gas is a mixture between air and CO2 (Figure 4).
Open Access Journal of Waste Management & Xenobiotics
Tuccimei P, et al. Improving Gas Permeability Measurements for Environmental Monitoring and Management. J Waste Manage Xenobio 2019, 2(2): 000123.
Copyright© Tuccimei P, et al.
6
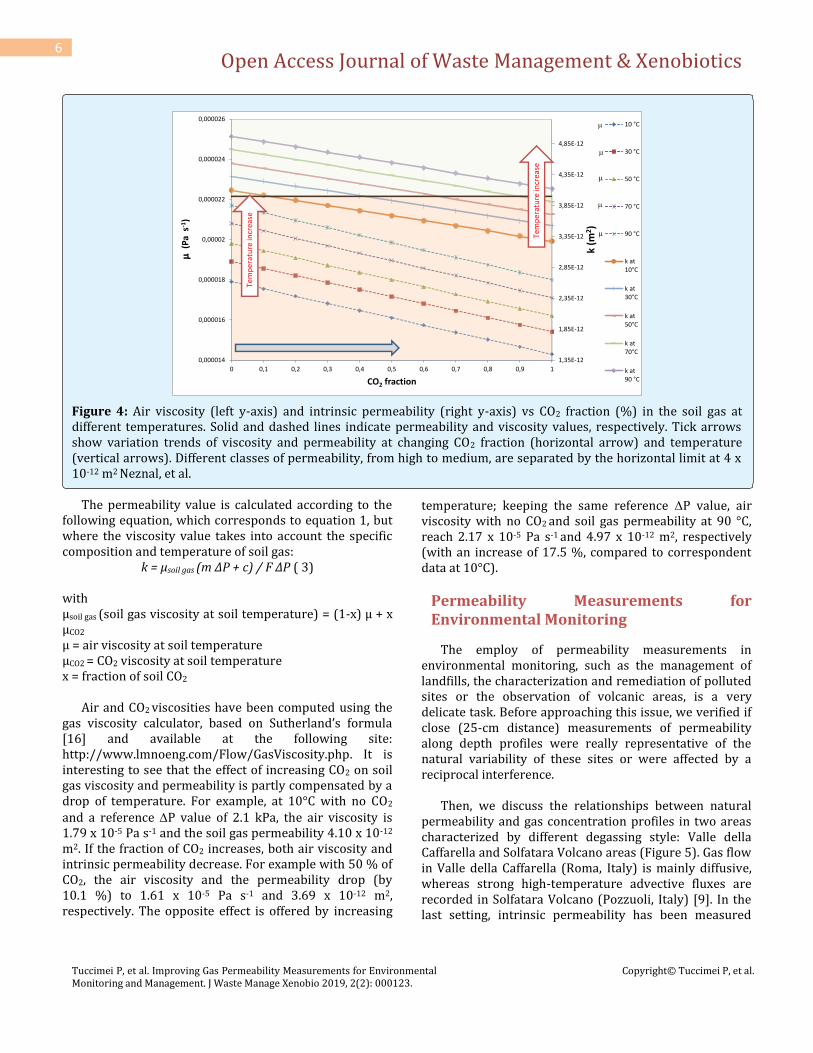
Figure 4: Air viscosity (left y-axis) and intrinsic permeability (right y-axis) vs CO2 fraction (%) in the soil gas at different temperatures. Solid and dashed lines indicate permeability and viscosity values, respectively. Tick arrows show variation trends of viscosity and permeability at changing CO2 fraction (horizontal arrow) and temperature (vertical arrows). Different classes of permeability, from high to medium, are separated by the horizontal limit at 4 x 10-12 m2 Neznal, et al.
The permeability value is calculated according to the
following equation, which corresponds to equation 1, but where the viscosity value takes into account the specific composition and temperature of soil gas:
k = μsoil gas (m ΔP + c) / F ΔP ( 3) with μsoil gas (soil gas viscosity at soil temperature) = (1-x) μ + x μCO2 μ = air viscosity at soil temperature μCO2 = CO2 viscosity at soil temperature x = fraction of soil CO2
Air and CO2 viscosities have been computed using the
gas viscosity calculator, based on Sutherland’s formula [16] and available at the following site: http://www.lmnoeng.com/Flow/GasViscosity.php. It is interesting to see that the effect of increasing CO2 on soil gas viscosity and permeability is partly compensated by a drop of temperature. For example, at 10°C with no CO2
and a reference DP value of 2.1 kPa, the air viscosity is 1.79 x 10⁻⁵ Pa s-1 and the soil gas permeability 4.10 x 10⁻¹² m2. If the fraction of CO2 increases, both air viscosity and intrinsic permeability decrease. For example with 50 % of CO2, the air viscosity and the permeability drop (by 10.1 %) to 1.61 x 10⁻⁵ Pa s-1 and 3.69 x 10⁻¹² m2, respectively. The opposite effect is offered by increasing
temperature; keeping the same reference DP value, air viscosity with no CO2 and soil gas permeability at 90 °C, reach 2.17 x 10⁻⁵ Pa s-1 and 4.97 x 10⁻¹² m2, respectively (with an increase of 17.5 %, compared to correspondent data at 10°C).
Permeability Measurements for Environmental Monitoring
The employ of permeability measurements in environmental monitoring, such as the management of landfills, the characterization and remediation of polluted sites or the observation of volcanic areas, is a very delicate task. Before approaching this issue, we verified if close (25-cm distance) measurements of permeability along depth profiles were really representative of the natural variability of these sites or were affected by a reciprocal interference.
Then, we discuss the relationships between natural permeability and gas concentration profiles in two areas characterized by different degassing style: Valle della Caffarella and Solfatara Volcano areas (Figure 5). Gas flow in Valle della Caffarella (Roma, Italy) is mainly diffusive, whereas strong high-temperature advective fluxes are recorded in Solfatara Volcano (Pozzuoli, Italy) [9]. In the last setting, intrinsic permeability has been measured
1,35E-12
1,85E-12
2,35E-12
2,85E-12
3,35E-12
3,85E-12
4,35E-12
4,85E-12
0,000014
0,000016
0,000018
0,00002
0,000022
0,000024
0,000026
0 0,1 0,2 0,3 0,4 0,5 0,6 0,7 0,8 0,9 1
k (m
2)
m(P
a s
-1)
CO2 fraction
10 °C
30 °C
50 °C
70 °C
90 °C
k at10°C
k at30°C
k at50°C
k at70°C
k at90 °C
Tem
per
atu
re in
crea
se
Tem
per
atu
rein
crea
se
m
m
m
m
m

Open Access Journal of Waste Management & Xenobiotics
Tuccimei P, et al. Improving Gas Permeability Measurements for Environmental Monitoring and Management. J Waste Manage Xenobio 2019, 2(2): 000123.
Copyright© Tuccimei P, et al.
7
with RADON-JOK which is not equipped with a motor pump and is consequently less prone to be damaged by high-temperature aggressive fluids. However, results can be confidently compared with those detected with PRM3.2.
Figure 5: Inset: location of Valle della Caffarella (1) and Solfatara Volcano (2) areas (Italy). View of the survey sites at Valle della Caffarella (A) and Solfatara Volcano (B). Gas permeability measurements with PRM3.2 (C) and RADON-JOK (D).
Small-Scale Spatial Difference of Permeability
Permeability measurements were performed in Valle della Caffarella and Solfatara Volcano areas (Tables 1 & 2, respectively) following a protocol specifically designed to investigate: i) the spatial heterogeneity of soil gas permeability at very small scale, either as lateral or vertical variation and ii) the potential interference of single measurements on others carried out at very close distances. The protocol was intended to verify if the progressive reduction of the step-length (1-m, 0.5-m and finally 0.25 m) between measurements could affect permeability values. Starting from a first reference depth profile (measurements at 0.20-, 0,40-, 0.60-. 0.80- and 1-m depths), following permeability measurements were progressively carried out along vertical profiles placed at 2, 1, 0.50, 1.50, 0.25, 0.75, 1.25 and 1.75 m from the reference station (Figures 5 & 5b). Measurements at the reference site and in other stations were repeated sometimes during the procedure to evaluate any interference produced by nearby gas sampling and pumping.
Id. Location k RJ CO2 O2 N2 CH4 H2 He Ne
* (m2) % % % ppm ppm ppm ppm
1 0-20 7.20E-12 95.83 1.05 3.12 46.21 87.03 9.50 3.56 2 0-40 2.90E-12 97.42 0.76 1.58 46.67 281.49 9.32 2.31 3 0-60 2.10E-12 97.91 0.71 1.11 47.21 419.97 8.92 2.10 4 0-80 2.40E-12 97.12 0.98 1.53 47.68 390.22 8.20 2.09 5 0-100 3.90E-12 97.36 0.96 1.25 47.95 448.37 8.44 2.95 6 0,25-20 1.20E-11 97.36 0.88 1.75 46.79 310.93 8.13 4.25 7 0,25-40 3.50E-12 98.37 0.68 0.89 47.84 395.09 8.46 2.39 8 0,25-60 2.90E-12 98.02 0.73 1.08 47.59 498.54 8.81 1.97 9 0,25-80 2.30E-12 98.09 0.67 0.86 47.62 471.40 8.57 2.79
10 0,25-100 6.10E-12 97.56 0.74 1.14 47.10 470.03 8.88 2.69 11 0,5-20 1.80E-11 82.25 4.94 12.82 36.09 31.07 7.58 10.4 12 0,5-40 3.00E-12 96.54 0.78 2.58 46.81 153.17 7.95 2.37 13 0,5-60 3.00E-12 96.41 0.79 2.62 47.24 428.08 8.99 2.31 14 0,5-80 2.20E-12 97.58 0.95 1.03 46.07 514.30 8.77 2.77 15 0,5-100 1.20E-12 97.82 0.80 0.91 47.26 524.91 8.44 1.91 16 0,75-20 3.30E-12 97.83 0.93 1.24 46.13 158.58 8.34 3.23 17 0,75-40 1.20E-12 99.01 0.50 0.47 45.64 314.07 7.23 2.44 18 0,75-60 1.90E-12 98.03 0.73 1.12 47.26 477.25 8.64 2.36 19 0,75-80 3.20E-12 97.23 0.87 1.64 46.8 543.83 9.58 3.71 20 0,75-100 4.00E-12 98.16 0.64 0.76 47.23 659.09 8.81 3.22 21 1-20 1.30E-12 80.29 2.77 16.94 37.72 73.83 7.08 9.24 22 1-40 7.90E-12 90.04 3.63 6.32 40.26 154.46 6.86 6.14 23 1-60 8.70E-13 97.37 0.97 1.65 46.61 416.99 9.05 3.72 24 1-80 2.30E-12 98.82 0.89 0.12 46.78 600.03 8.84 2.85 25 1-100 1.30E-12 97.45 0.74 1.39 47.22 671.71 9.16 2.91
A B
C D
12

Open Access Journal of Waste Management & Xenobiotics
Tuccimei P, et al. Improving Gas Permeability Measurements for Environmental Monitoring and Management. J Waste Manage Xenobio 2019, 2(2): 000123.
Copyright© Tuccimei P, et al.
8
26 1,25-20 2.10E-11 95.60 1.19 3.21 43.66 298.57 8.02 5.11 27 1,25-40 8.20E-13 97.15 0.92 1.93 44.10 457.5 6.79 2.96 28 1,25-60 1.90E-12 98.35 0.69 0.92 46.97 344.93 8.59 3.36 29 1,25-80 5.60E-13 97.86 0.76 1.20 46.75 602.27 8.20 2.69 30 1,25-100 1.20E-12 94.85 1.14 2.70 45.57 876.83 8.55 3.83 31 1,50-20 1.50E-12 79.62 2.77 16.86 33.54 55.65 6.76 10.29 32 1,50-40 4.60E-13 95.16 1.22 4.59 44.71 311.34 7.42 4.18 33 1,50-60 1.80E-12 95.59 1.21 3.86 45.46 305.26 8.72 3.55 34 1,50-80 5.10E-12 99.81 0.84 1.00 47.41 785.24 9.06 2.48 35 1,50-100 4.30E-12 95.19 1.24 4.00 44.34 1093.22 9.34 4.59 36 1,75-20 1.50E-11 90.32 2.24 7.44 39.20 257.30 7.41 7.98 37 1,75-40 1.10E-12 98.00 0.77 1.22 45.36 311.35 7.13 2.62 38 1,75-60 3.90E-12 96.61 1.03 2.25 46.07 279.34 8.93 3.13 39 1,75-80 3.20E-12 97.05 0.94 1.89 45.89 901.11 8.67 2.48 40 1,75-100 4.00E-12 97.75 1.20 2.90 46.06 546.57 8.45 3.72 41 2-20 4.10E-12 76.38 3.37 20.24 32.26 112.41 6.64 10.45 42 2-40 3.40E-12 96.94 0.97 2.08 45.92 187.21 7.53 3.20 43 2-60 6.00E-12 97.75 0.76 1.46 48.29 220.54 8.55 1.66 44 2-80 5.00E-12 98.53 0.90 0.39 46.88 567.84 8.66 2.12 45 2-100 7.40E-12 97.47 0.74 1.36 46.98 672.12 8.50 1.70
Table 2: Intrinsic permeability values measured using RADON-JOK at Solfatara Volcano (Italy). Soil CO2 in situ-measured with XAM-7000 (Dräeger) and CO2, O2, N2, CH4, H2, He and Ne concentration measured by Gas Chromatography. * Numbers before the hyphen stand for the horizontal distance (m) from the first monitoring station and those located after are the depth (cm).
Results are shown in Figure 6, where permeability values at different depths are plotted against the horizontal distance among them, with indication of the chronological order of measurements. Repetitions of
measurements at the reference profile (R in Figures 6a & b) and in other spots carried out during this sequence of analyses did not show any significant change of permeability.
Figure 6: Intrinsic permeability at different depths (m) and horizontal distances in Valle della Caffarella (A) and Solfatara Volcano (B) areas. R stands for the reference depth profile and following numbers represent the order of successive measurements along vertical stations.
0.00E+00
5.00E-12
1.00E-11
1.50E-11
2.00E-11
2.50E-11
0 0.5 1 1.5 2 2.5
k (m
2)
Horizontal distance (m)
k -0,20
k -0,40
k -0,60
k -0,80
k -1
A R 5 3 6 2 7 4 8 1 - Order of measurements
k - depth
0.00E+00
5.00E-12
1.00E-11
1.50E-11
2.00E-11
2.50E-11
0 0.5 1 1.5 2 2.5
k (m
2)
Horizontal distance (m)
k -0,20
k -0,40
k -0,60
k -0,80
k -1
B R 5 3 6 2 7 4 8 1 - Order of measurements

Open Access Journal of Waste Management & Xenobiotics
Tuccimei P, et al. Improving Gas Permeability Measurements for Environmental Monitoring and Management. J Waste Manage Xenobio 2019, 2(2): 000123.
Copyright© Tuccimei P, et al.
9
No cross-interference among measurements was thus detected in both areas. This is also supported by the small volumes of air required by soil gas pumping during permeability measurements. It follows that vertical and horizontal trends of intrinsic permeability reflect natural variability of this parameter in the two sites.
With reference to the Valle della Caffarella area (Roma,
Italy), the outcropping Pozzolane Rosse ignimbrite is characterized by medium to large intrinsic permeability (average value of 6.8 x 10⁻¹² m2). Values detected at the same depth, at 0.25-m minimum distance, are moderately variable, but show larger changes along vertical profiles (Figure 6a & Table 1), giving direct information on local soil stratigraphy. A layer of larger permeability is mostly present from 40 to 80 cm depth, but locally the permeability is reduced, with larger values at increasing depths. It turns out a scenario of small-scale heterogeneity of soil permeability. In the site of Solfatara Volcano (Pozzuoli, Italy) outcropping volcanites display much lower permeability (average value of 4.3 x 10⁻¹² m2) compared to that of ignimbrites in Valle della Caffarella area. Furthermore, a larger uniformity of values can be observed, either horizontally or vertically (Figure 6b & Table 2), except for the upper layers (at 20-cm depth). We interpret this reduction and homogenization of intrinsic
permeability at depths of 40 cm or larger, as the consequence of the alteration produced by high-temperature gases and vapors on rock-forming minerals.
Effect of Permeability on Soil Gas Concentration
As mentioned before, intrinsic permeability affects gas transport trough the soil. Consequently, gas concentration along soil profiles can be interpreted in terms of permeability vertical variations that are different in areas characterised by low temperature gas diffusion (Valle della Caffarella area) or by advective fluxes of high temperature acid gases and vapors (Solfatara Volcano area). Average vertical distributions of soil gas concentrations and soil temperature at Valle della Caffarella and Solfatara Volcano areas are then reported in Figure 7 & Table 3 and plotted against average permeability profiles. Carbon dioxide and oxygen have been chosen as representative of endogenous (with low atmospheric concentration) and atmospheric gases (with a negligible concentration of endogenous gases), respectively. The whole dataset of soil CO2 and O2 along with that of N2, CH4, H2, He and Ne is reported in Table 1 (Valle della Caffarella) and Table 2 (Solfatara Volcano).
Figure 7: Vertical profiles of soil permeability, temperature, CO2 and O2 concentration in Valle della Caffarella (A) and Solfatara Volcano (B) areas. Gas concentration was measured using gas chromatography (GC). Soil CO2 in Valle della Caffarella has been measured also by infrared detector (DräegerX-am 7000, DR).
-120
-100
-80
-60
-40
-20
0
0.00 5.00 10.00 15.00 20.00 25.00
Dep
th (
cm)
k (µm2), CO2 GC (vol.%), CO2 DR (vol.%), O2 (vol.%), T (°C)
k (µm2)
CO2 GC (vol.%)
02 ( vol.%)
CO2 DR (vol.%)
T (°C)
A
-120
-100
-80
-60
-40
-20
0
0.00 5.00 10.00 15.00 20.00 25.00
Dep
th (c
m)
k (µm2), CO2 GC (vol.%/10), O2 (vol.%), T (°C/10)
k (µm2)
CO2(vol%/10)
O2 (vol.%)
T (°C/10)
B

Open Access Journal of Waste Management & Xenobiotics
Tuccimei P, et al. Improving Gas Permeability Measurements for Environmental Monitoring and Management. J Waste Manage Xenobio 2019, 2(2): 000123.
Copyright© Tuccimei P, et al.
10
k (m2) T (°C) CO2 (Dräeger, %) CO2 (G.C., %) O2 (G.C., %)
Depth (cm) Average Dev. St. Average Dev.St. Average Dev.St. Average Dev.St. Average Dev.St.
Val
le d
ella
C
affa
rell
a
20 2.60E-12 2.70E-12 17 0.56 1.7 0.65 1.9 0.57 19.3 0.38 40 9.90E-12 3.82E-12 17.3 0.52 2.2 0.59 - - - - 60 9.00E-12 4.81E-12 17.7 0.50 3.0 0.64 2.6 0.69 19.09 0.38 80 7.60E-12 6.98E-12 17.6 0.48 3.3 0.70 - - - -
100 4.80E-12 7.74E-12 17.9 0.49 3.7 0.58 3.7 0.49 18.42 0.34
Solf
atar
a
Vo
lcan
o
20 9.27E-12 7.46E-12 63.6 14.93 - - 88.4 8.70 2.24 1.38 40 2.70E-12 2.28E-12 75.5 12.25 - - 96.5 2.67 1.14 0.96 60 2.71E-12 1.51E-12 90 3.11 - - 97.3 0.93 0.85 0.18 80 2.93E-12 1.43E-12 95 3.5 - - 95 0.92 0.87 0.10
100 3.71E-12 2.19E-12 98 3.3 - - 98 1.06 0.91 0.23
Table 3: Average data of intrinsic permeability, temperature, CO2 and O2 concentration soil profiles at Valle della Caffarella and Solfatara Volcano areas.
As reported above, the average permeability at Valle della Caffarella area is lower at surface, reaches the highest value at 40-cm depth and then progressively decreases up to 1-m depth. Temperature is constant (about 17 °C) along the profile, whereas two different trends are displayed for the gases of deep provenance and those enriched in the atmosphere. CO2 gas (either detected by infrared detector Dräeger X-am 7000 or gas chromatography) decreases towards the surface from 3.7 % to 2.0 %, whereas O2 increase from 18.4 % to 19.3 %. In both cases the contaminations with the atmosphere modify soil gas concentration at low depths (Figure 7a). Relative differences of CO2 along the depth profile are however significant (about 50 %).
Conversely, average permeability profile at Solfatara
Volcano area is much more homogenous and values are significantly reduced at depths higher than 40 cm (Figure 7b). Temperature decreases from 98 to 64 °C. Carbon dioxide concentration is much higher and constant than in the previous site (97%) and reach 88 % only at 20-cm depth. O2 stands around 0.9% along the profile except for the 20-cm datum (2.2 %). Relative changes of CO2 concentration along the depth profile is only 10 % in this case. We observe that the homogenization of soil permeability in volcanic area, likely due to high-temperature alteration of minerals, is mirrored by an enhanced constancy of soil gas concentration. This effect is also favored by high gas fluxes, 1,500 t/day of CO2 [17].
In conclusion, the use of permeability measurement
for environmental monitoring is proposed. Profiles of soil gas composition and temperature, correlated with the vertical changes of permeability give indication on the degassing style of a study area and allow detecting self-sealing phenomena in volcanic areas. A joint
mineralogical and geochemical study of soil composition at shallow depth could document these processes better.
Conclusion
The calibration of a modified and improved version of a soil gas permeameter for in situ measurements was presented here, compared with RADON-JOK. The new device is equipped with a membrane pump, more suitable for soil permeability than the original rotary vane pump. In addition, the flow meter initially present in the experimental configuration was removed, since its value in the Darcy equation can be expressed as a function of the induced negative pressure. A proper correction of soil air viscosity and permeability in the Darcy equation was proposed when working in volcanic settings.
A specific protocol, designed to check any interference
among permeability measurements carried out at very close distances (25cm), demonstrated that no disturbance is occurring either in Valle della Caffarella or Solfatara Volcano areas. Natural variability at decimeter scale was then investigated to explore how vertical permeability affects gas transport and concentration along soil profiles. Intrinsic permeability profiles resulted to be good proxy indicators for the degassing style of a given area. Low temperature and low CO2 concentration characterize sites where gas transport is mainly diffusive, such as in Valle della Caffarella site. Here high and variable values of vertical permeability are mirrored by significant changes of endogenous gases relative concentration.
More constant vertical trends of gas concentration and
temperature characterize Solfatara Volcano. Here, a strong homogenization of soil permeability due to the alteration of rock-forming minerals by strong fluxes of

Open Access Journal of Waste Management & Xenobiotics
Tuccimei P, et al. Improving Gas Permeability Measurements for Environmental Monitoring and Management. J Waste Manage Xenobio 2019, 2(2): 000123.
Copyright© Tuccimei P, et al.
11
high-temperature aggressive fluids is recognized. These distributions mark very well areas where the gas transport is mainly advective and put forward the potential of this small-scale (20-25 cm) approach in areas with relatively high temperature (around 100°C) to investigate processes relevant for volcanology, such as self-sealing. Finally, the systematic measurement of soil intrinsic permeability coupled to soil gas or soil vapor concentration is strongly recommended in studies regarding soil remediation, landfill management, and agriculture and geogenic gas hazard.
References
1. Takeuchi S, Nakashima S Tomiya A (2008) Permeability measurements of natural and experimental volcanic materials with a simple permeameter: Toward an understanding of magmatic degassing processes. Journal of Volcanology and Geothermal Research 177(2): 329-339.
2. Kendrick JE, Lavallée Y, Hessa KU, Heap MJ, Gaunt HE, et al. (2013) Tracking the permeable porous network during strain-dependent magmatic flow. Journal of Volcanology and Geothermal Research 260: 117-126.
3. Rathfelder K, Lang JR, Abriola LM (1995) Soil vapor extraction and bioventing: Applications, limitations and future research directions. Review of Geophysics 33(S2): 1067-1081.
4. Moore C, Rai IS, Lynch J (1982) Computer design of landfill methane migration control. Journal of Environmental Engineering 108: 89-107.
5. Thibodeaux LJ, Springer C, Riley LM (1982) Models and mechanisms for the vapor phase emission of hazardous chemicals from landfills. Journal of Hazardous Materials 7(1): 63-74 .
6. Gan J, Yates RS, Papiernik, S, Crowley D (1998) Application of Organic Amendments to Reduce Volatile Pesticide Emissions from soil. Environmental Science Technology 32(20): 3094-3098.
7. Mosley RB, Snoody R, Brubaker SA, Brown J (1996) Experimental evaluation of geometrical shape factor for short cylindrical probes used to measure soil permeability to air. Environment Internationa 22(1): 509-520.
8. Chiodini G, Baldini A, Barberi F, Carapezza ML, Cardellini C, et al. (2007) Carbon dioxide degassing at Latera caldera (Italy): Evidence of geothermal reservoir and evaluation of its potential energy. Journal of Geophysical Research 112(B12): 1-17.
9. Castelluccio M, De Simone G, Lucchetti, C, Moroni M, Salvati F, et al. (2015) A new technique to measure in situ soil gas permeability. Journal of Geochemical Exploration 148: 56-59.
10. Sciarra A, Mezon C, Finizola A, Ricci T, Lucchetti C, et al. (2016) Multidisciplinary investigations in the Upper Pisciarelli area, Campi Flegrei, Italy. 26th Goldschmidt Conference, Yokohama, Japan.
11. Damkjaer A, Korsbech UA (1992) A small-diameter probe for in situ measurements of gas permeability of soil. Radiation Protection Dosimetry 45(1-4): 85-89.
12. Neznal M, Neznal M, Matolin M, Barnet I, Miksova J (2004) The new method forassessing the radon risk of building sites. Czech Geological Survey Special Papers 16, Czech Geological Survey, Prague, pp: 1-94.
13. Chen J, Falcomer R, Ly J, Wierdsma J, Bergman L (2008) Long-term monitoring of soil gas radon and permeability at two reference sites. Radiation Protection Dosimetry 131(4): 503-508.
14. Lara E, Rocha, Z, Santos TO, Rios FJ, Oliveira AH (2015) Soil features and indoor radon concentration prediction: radon in soil gas, pedology, permeability and 226Ra content. Radiation Protection Dosimetry 167(1-3): 126-129.
15. Wadsworth FB, Vasseur J, Scheu B, Kendrick JE, Lavallée Y, et al. (2016) Universal scaling of fluid permeability during volcanic welding and sediment diagenesis. Geology 44(3): 219-222.
16. Sutherland W (1893) LII. The viscosity of gases and molecular force. Philosophical Magazine Series 5, 36(223): 507-531.
17. Chiodini G, Frondini F, Cardellini C, Granieri D, Marini L, et al. (2001) CO2 degassing and energy release at Solfatara volcano, Campi Flegrei, Italy. Journal of Geophysical research, Solid Earth 106(B8): 16213-16221.