Embed Size (px)
DESCRIPTION
Brief presentation and illustrative description on the prospects of oil palm plantation in Indonesia. Sustainability standards become an integral part in this growing industry.
Citation preview

INDONESIA’S PALM OIL OUTLOOK2011-2020
Suhardiyoto HaryadiSuhardiyoto Haryadi
INDONESIA’S PALM OIL OUTLOOK 2011-2020
12/6/2010Inonesia's Palm Oil Outlook 2011-20202
Edible Oil Market 3 Rising Global Demand 4 Indonesia’s Production 5 Indonesia Takes the Lead 6 World Supply and Demand 7 World Trade 8 Commodity Boom 9 Indonesia’s Major-
Producers 10
Corporate Performance 11 Indonesia’s 20 Richest 12 Promising Global-
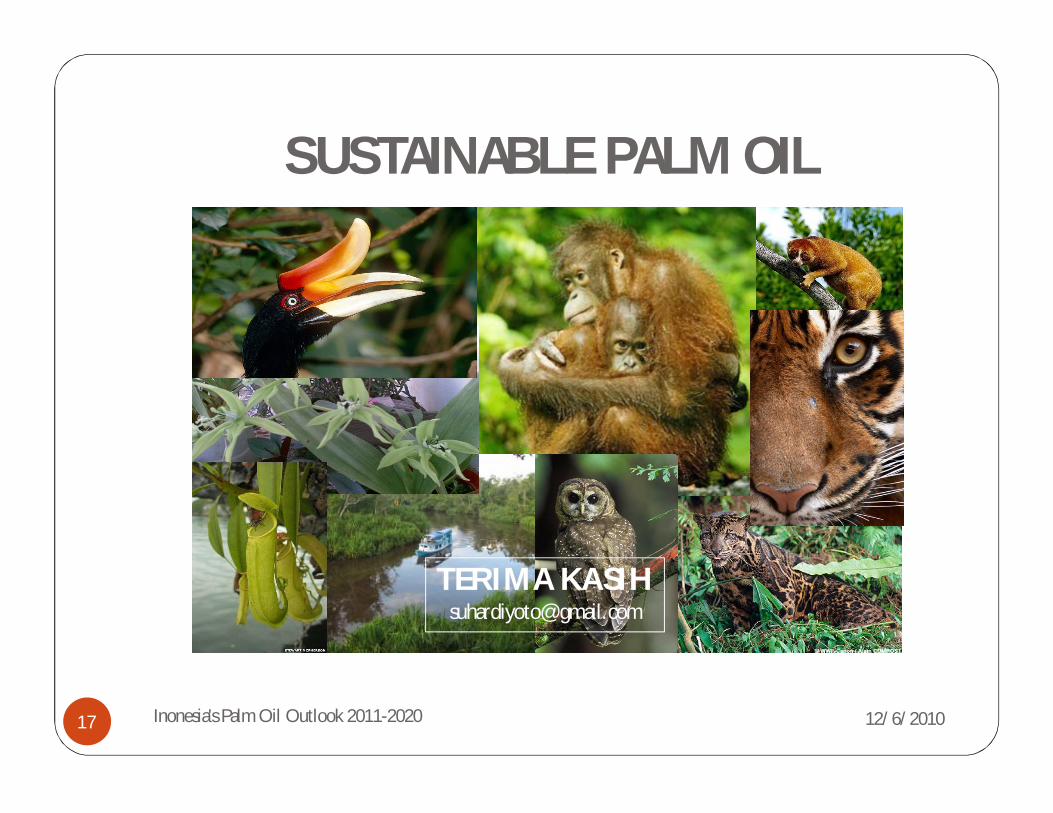
Economy 13 Price Projection 2011-2020 14 Expansion Areas 15 Controversy and Solution 16 Conclusion: Sustainable
Palm Oil 17
TABLE OF CONTENTS
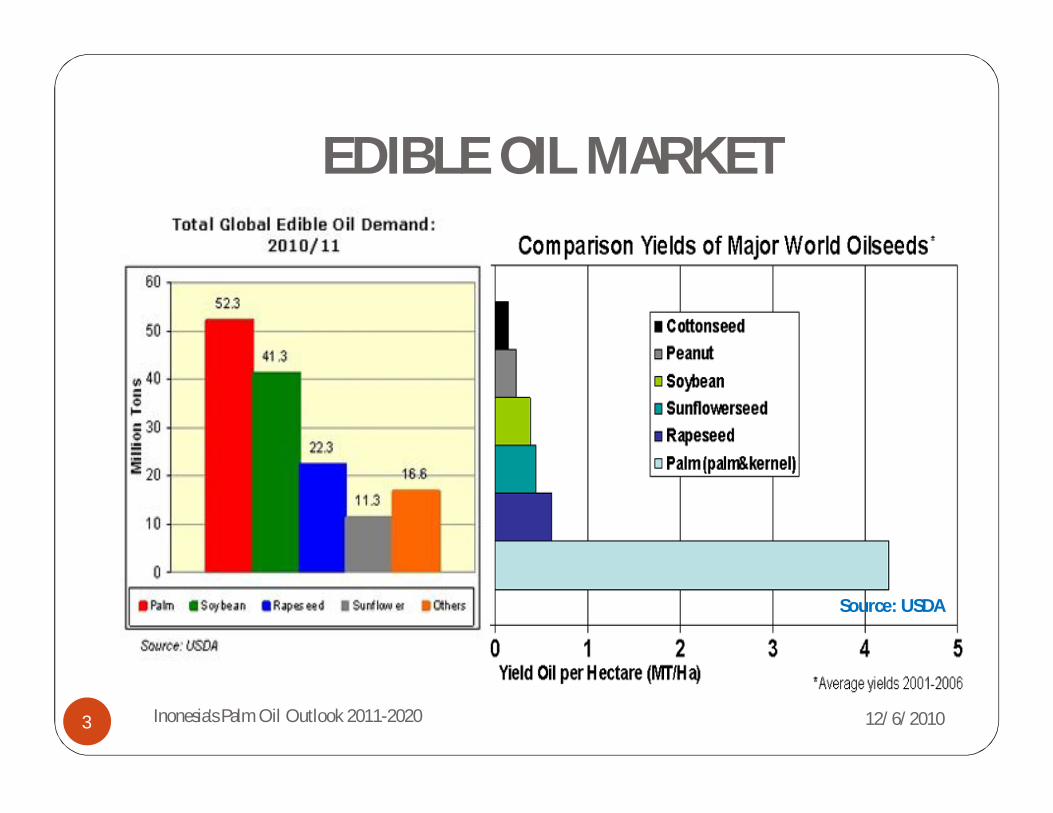
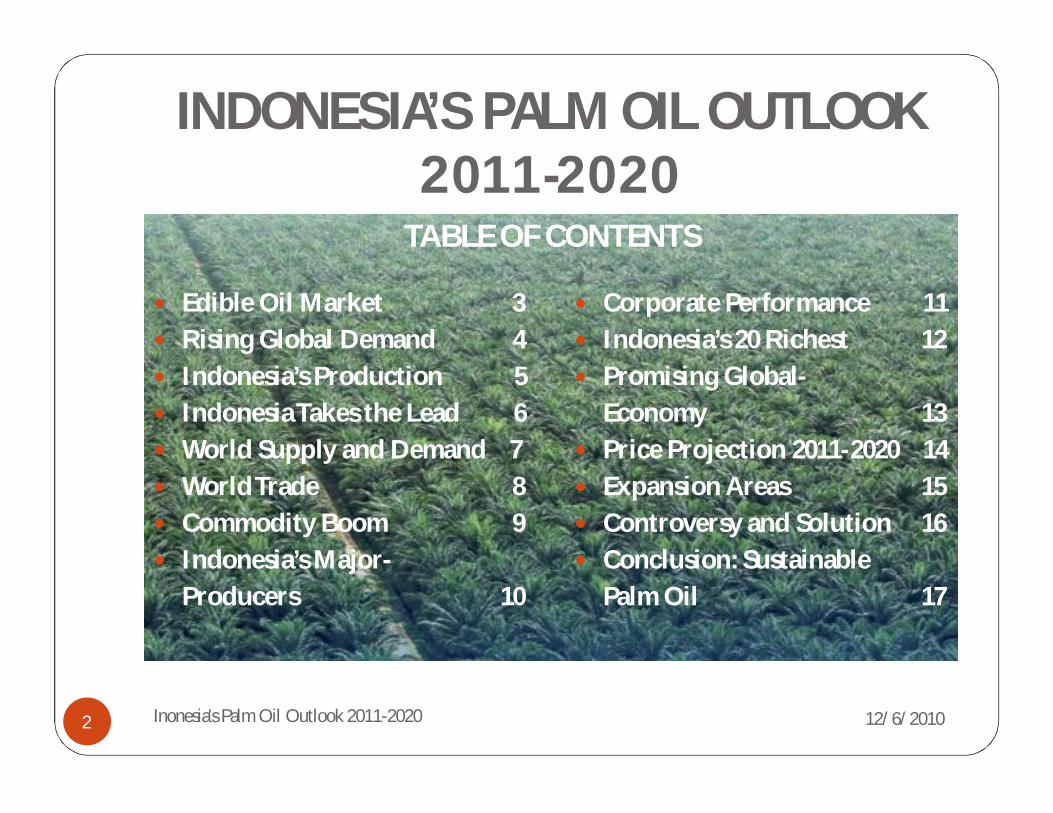
EDIBLE OIL MARKET
12/6/2010
Source: USDA
3 Inonesia's Palm Oil Outlook 2011-2020
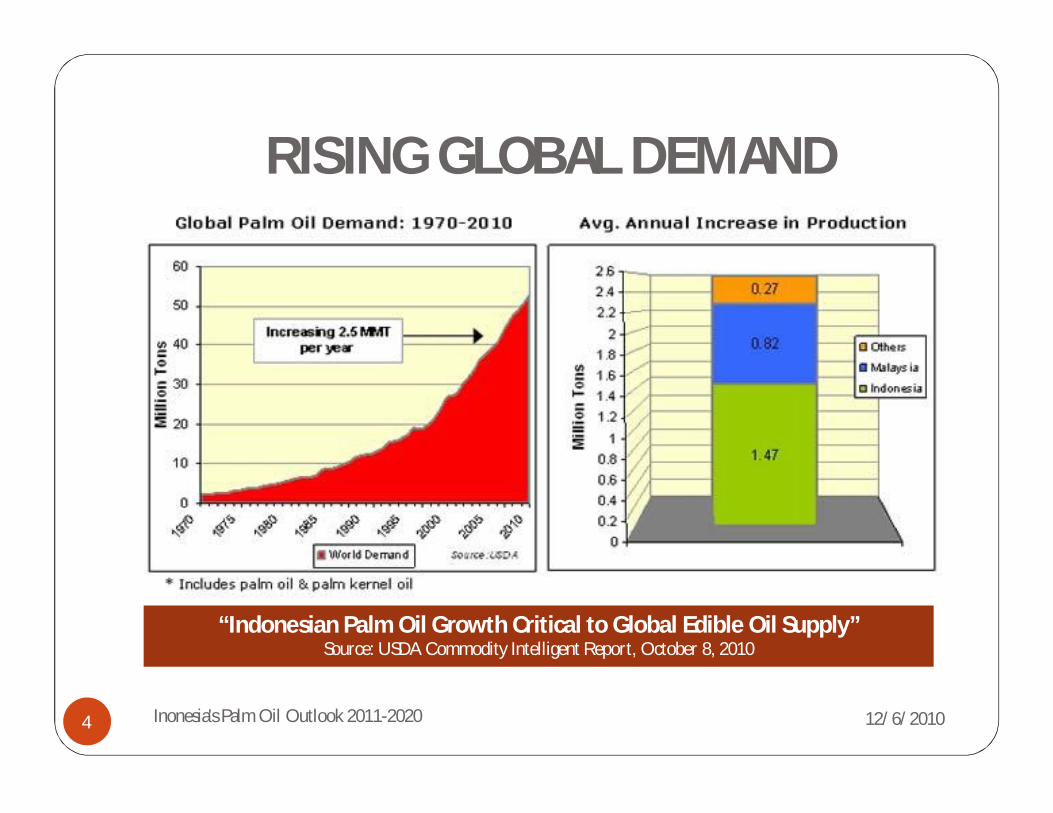
RISING GLOBAL DEMAND
12/6/2010
“Indonesian Palm Oil Growth Critical to Global Edible Oil Supply”Source: USDA Commodity Intelligent Report, October 8, 2010
4 Inonesia's Palm Oil Outlook 2011-2020
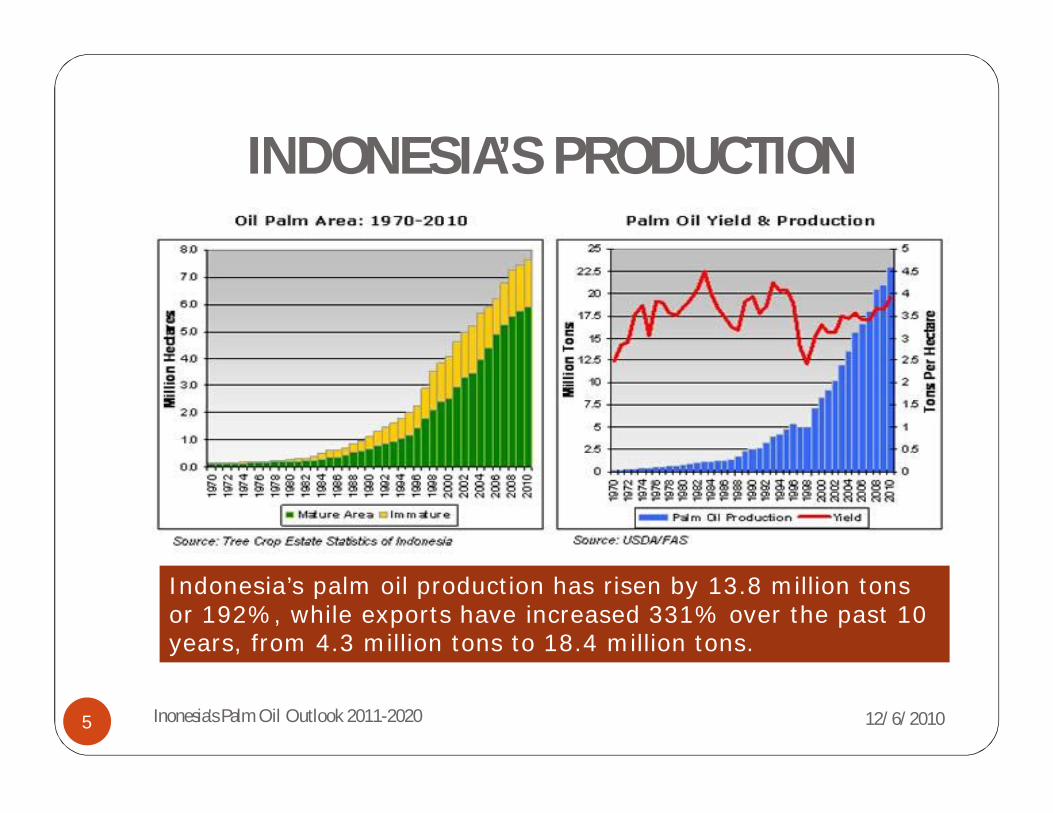
INDONESIA’S PRODUCTION
12/6/2010
Indonesia’s palm oil production has risen by 13.8 million tons or 192%, while exports have increased 331% over the past 10 years, from 4.3 million tons to 18.4 million tons.
5 Inonesia's Palm Oil Outlook 2011-2020
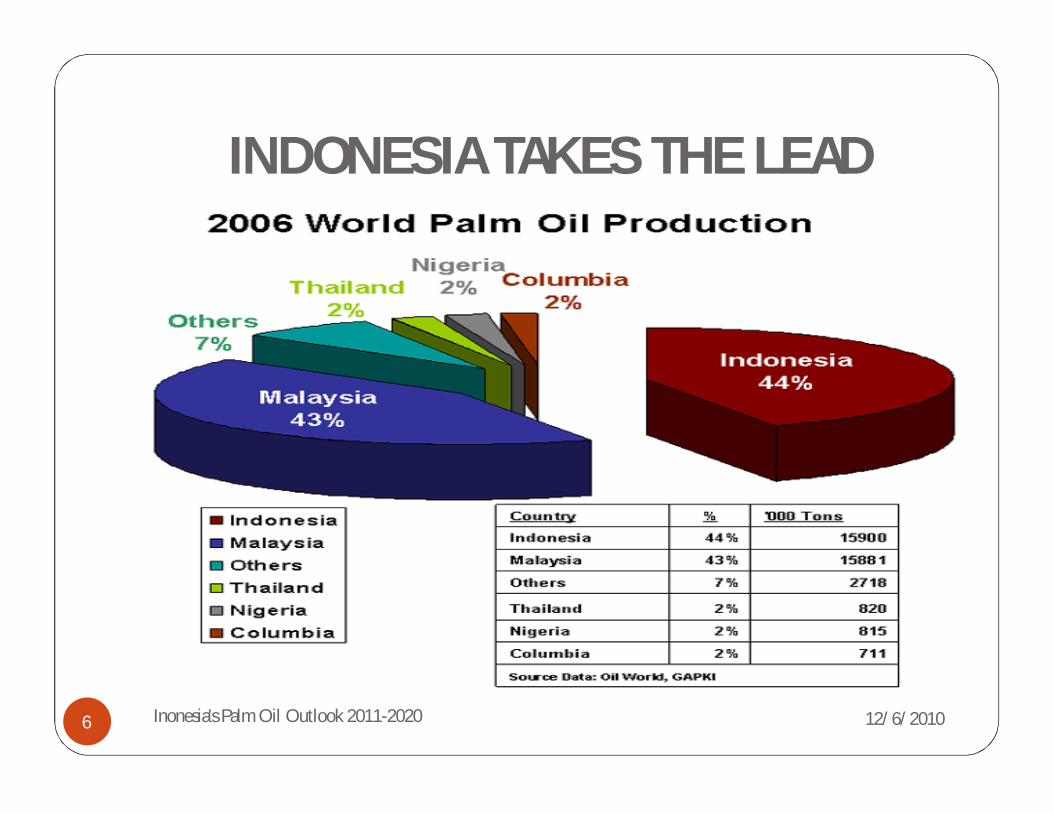
INDONESIA TAKES THE LEAD
12/6/20106 Inonesia's Palm Oil Outlook 2011-2020
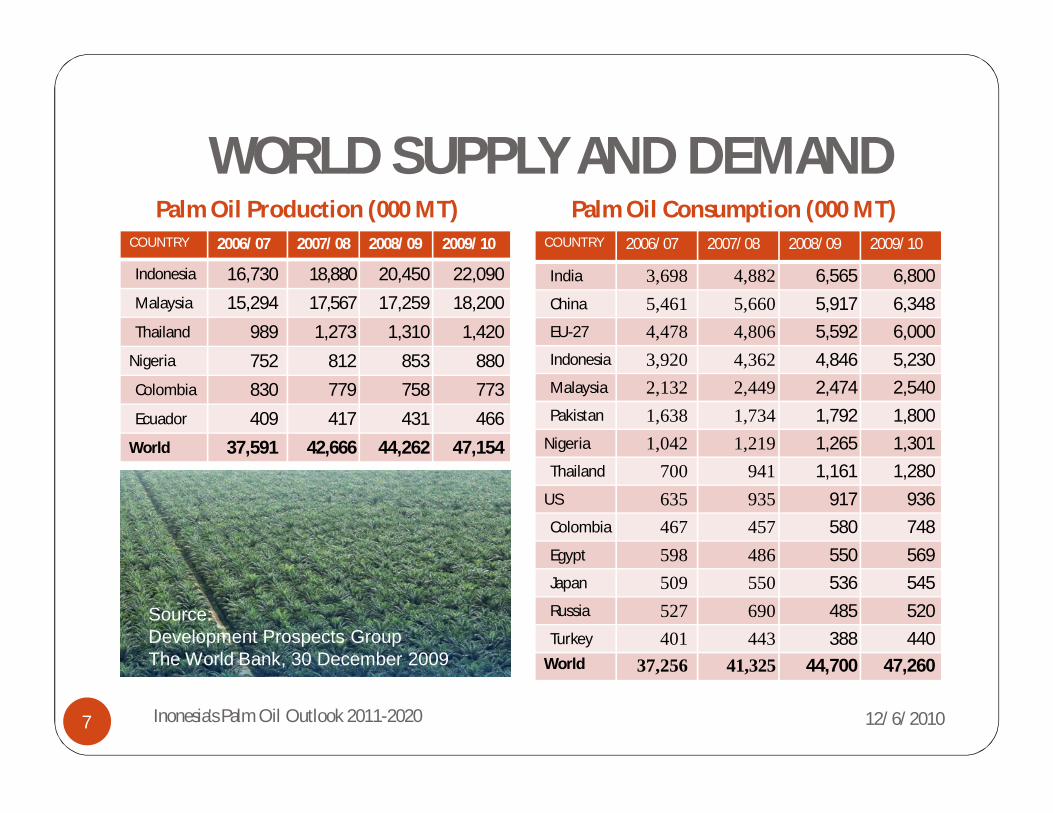
WORLD SUPPLY AND DEMANDPalm Oil Production (000 MT) Palm Oil Consumption (000 MT)
12/6/2010
COUNTRY 2006/07 2007/08 2008/09 2009/10
Indonesia 16,730 18,880 20,450 22,090
Malaysia 15,294 17,567 17,259 18,200
Thailand 989 1,273 1,310 1,420
Nigeria 752 812 853 880
Colombia 830 779 758 773
Ecuador 409 417 431 466
World 37,591 42,666 44,262 47,154
COUNTRY 2006/07 2007/08 2008/09 2009/10
India 3,698 4,882 6,565 6,800
China 5,461 5,660 5,917 6,348
EU-27 4,478 4,806 5,592 6,000
Indonesia 3,920 4,362 4,846 5,230
Malaysia 2,132 2,449 2,474 2,540
Pakistan 1,638 1,734 1,792 1,800
Nigeria 1,042 1,219 1,265 1,301
Thailand 700 941 1,161 1,280
US 635 935 917 936
Colombia 467 457 580 748
Egypt 598 486 550 569
Japan 509 550 536 545
Russia 527 690 485 520
Turkey 401 443 388 440World 37,256 41,325 44,700 47,260
Source: Development Prospects Group The World Bank, 30 December 2009
7 Inonesia's Palm Oil Outlook 2011-2020
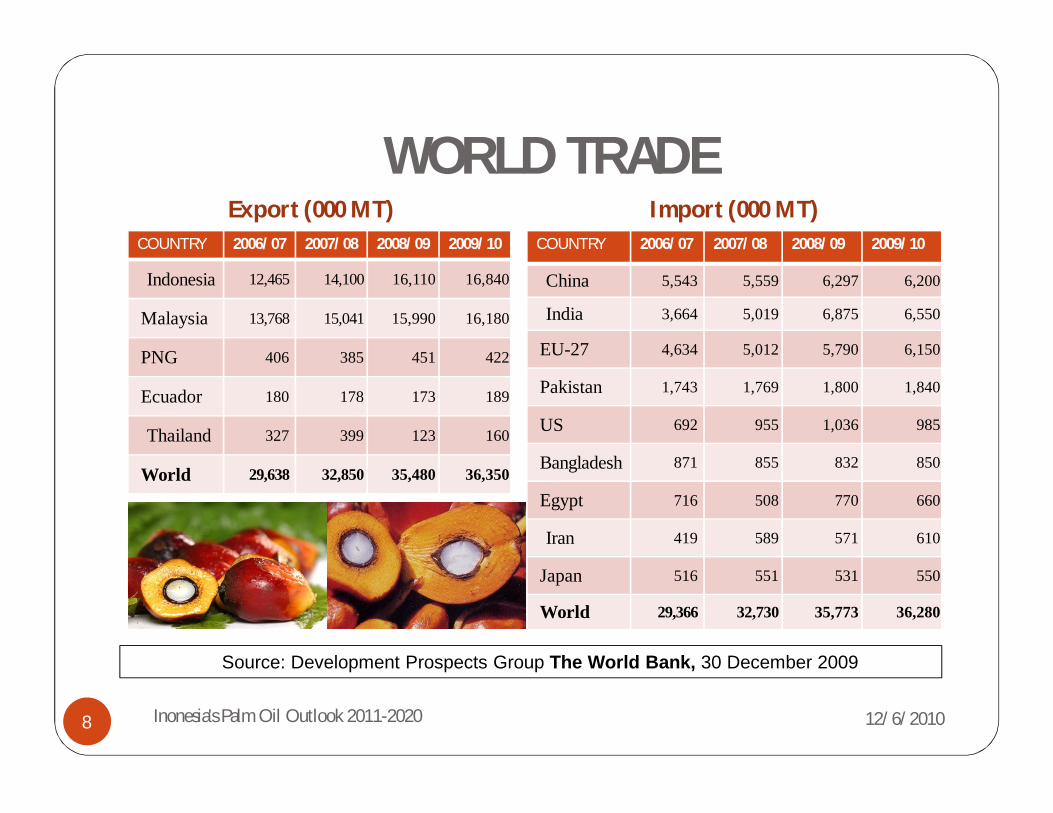
WORLD TRADEExport (000 MT) Import (000 MT)
12/6/2010
COUNTRY 2006/07 2007/08 2008/09 2009/10
Indonesia 12,465 14,100 16,110 16,840
Malaysia 13,768 15,041 15,990 16,180
PNG 406 385 451 422
Ecuador 180 178 173 189
Thailand 327 399 123 160
World 29,638 32,850 35,480 36,350
COUNTRY 2006/07 2007/08 2008/09 2009/10
China 5,543 5,559 6,297 6,200
India 3,664 5,019 6,875 6,550
EU-27 4,634 5,012 5,790 6,150
Pakistan 1,743 1,769 1,800 1,840
US 692 955 1,036 985
Bangladesh 871 855 832 850
Egypt 716 508 770 660
Iran 419 589 571 610
Japan 516 551 531 550
World 29,366 32,730 35,773 36,280
Source: Development Prospects Group The World Bank, 30 December 2009
8 Inonesia's Palm Oil Outlook 2011-2020
COMMODITY BOOM
12/6/2010
A B C
D
EF
Export of goods (USD billion)MANUFACTURECOMMODITY
Commodity Export (USD billion)RENEWABLE RESOURCESNON-RENEWABLE RESOURCES
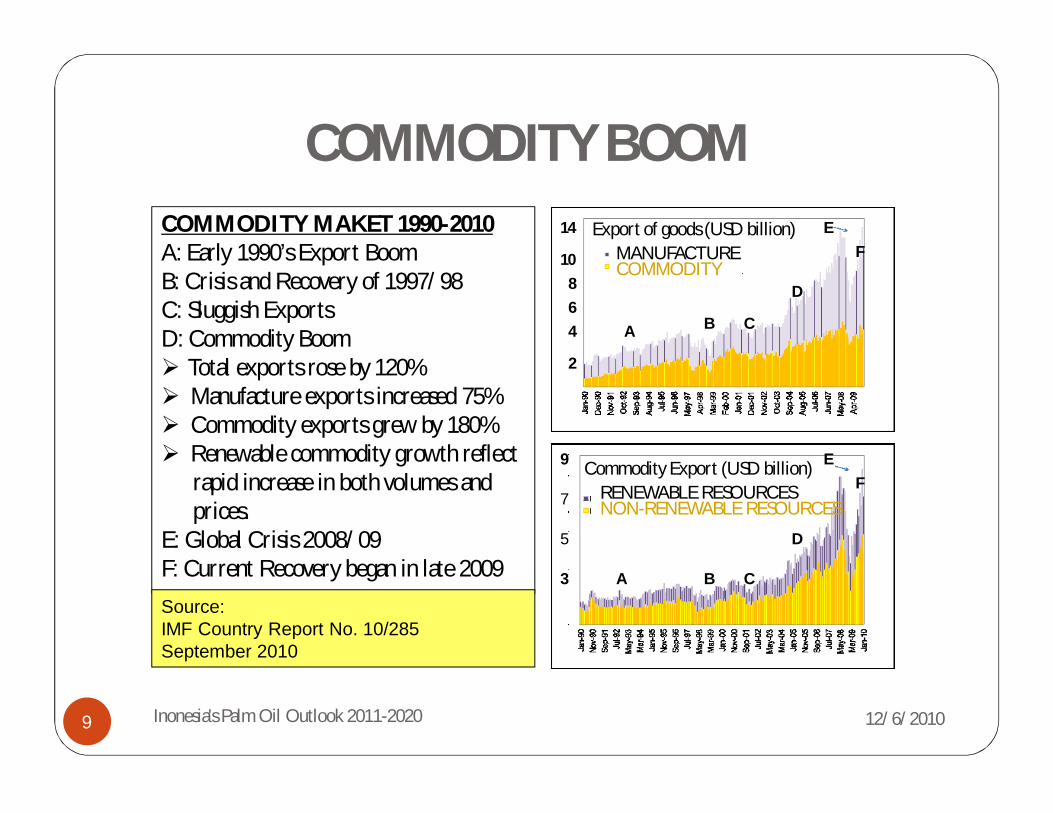
COMMODITY MAKET 1990-2010A: Early 1990’s Export BoomB: Crisis and Recovery of 1997/98 C: Sluggish ExportsD: Commodity Boom Total exports rose by 120% Manufacture exports increased 75% Commodity exports grew by 180% Renewable commodity growth reflect
rapid increase in both volumes andprices.
E: Global Crisis 2008/09F: Current Recovery began in late 2009Source:IMF Country Report No. 10/285September 2010
A B C
D
EF
14
10864
2
9
7
5
3
9 Inonesia's Palm Oil Outlook 2011-2020
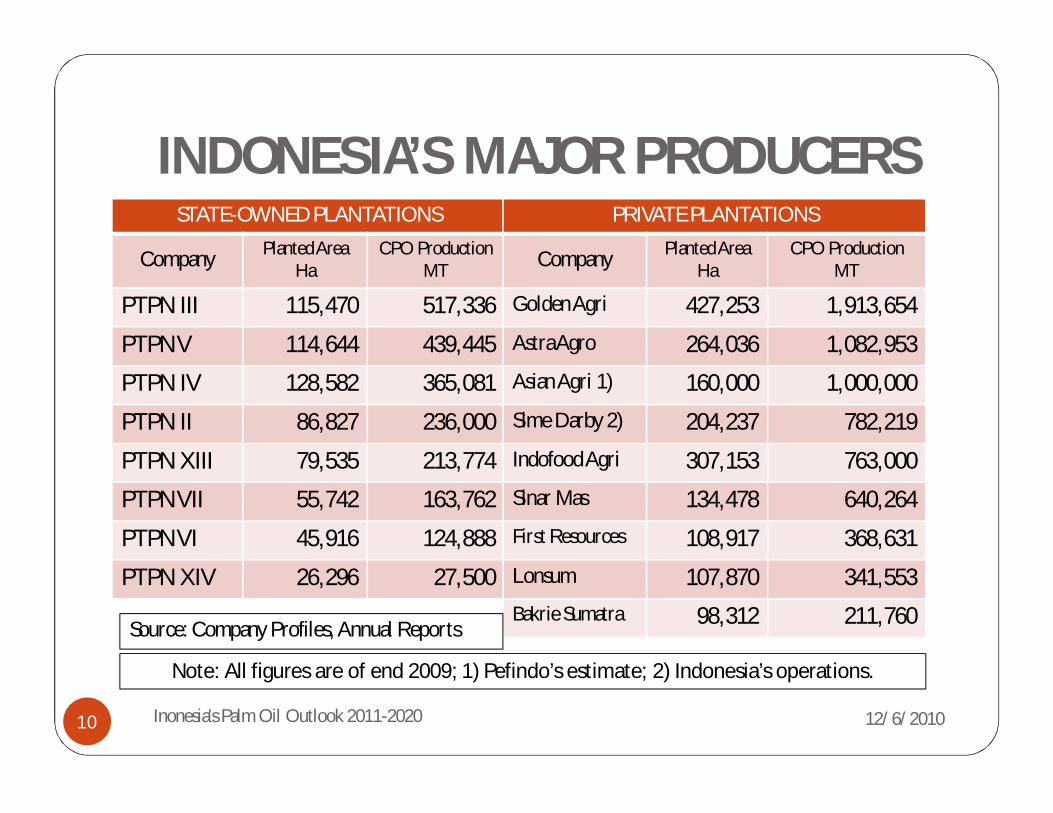
INDONESIA’S MAJOR PRODUCERS
12/6/2010
STATE-OWNED PLANTATIONS
Company Planted Area Ha
CPO Production MT
PTPN III 115,470 517,336
PTPN V 114,644 439,445
PTPN IV 128,582 365,081
PTPN II 86,827 236,000
PTPN XIII 79,535 213,774
PTPN VII 55,742 163,762
PTPN VI 45,916 124,888
PTPN XIV 26,296 27,500
PRIVATE PLANTATIONS
Company Planted Area Ha
CPO Production MT
Golden Agri 427,253 1,913,654
Astra Agro 264,036 1,082,953Asian Agri 1) 160,000 1,000,000
Sime Darby 2) 204,237 782,219
Indofood Agri 307,153 763,000Sinar Mas 134,478 640,264First Resources 108,917 368,631
Lonsum 107,870 341,553Bakrie Sumatra 98,312 211,760
Note: All figures are of end 2009; 1) Pefindo’s estimate; 2) Indonesia’s operations.
Source: Company Profiles, Annual Reports
10 Inonesia's Palm Oil Outlook 2011-2020
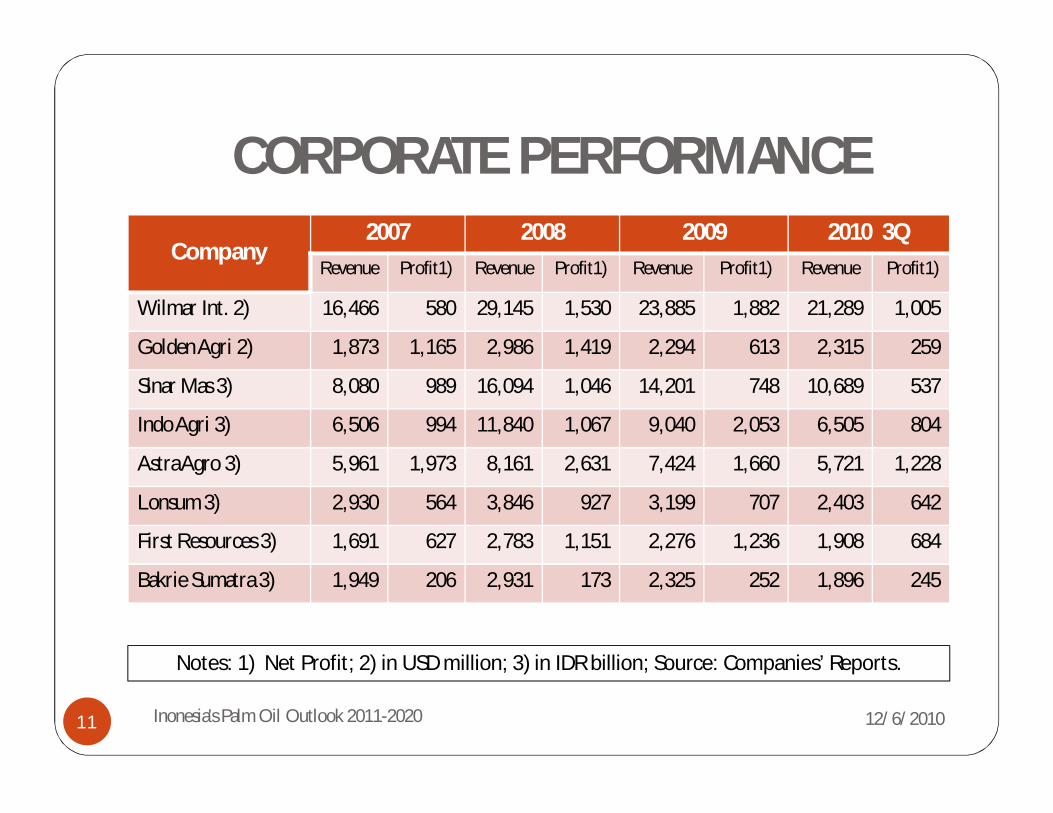
CORPORATE PERFORMANCE
12/6/2010
Company2007 2008 2009 2010 3Q
Revenue Profit1) Revenue Profit1) Revenue Profit1) Revenue Profit1)
Wilmar Int. 2) 16,466 580 29,145 1,530 23,885 1,882 21,289 1,005
Golden Agri 2) 1,873 1,165 2,986 1,419 2,294 613 2,315 259
Sinar Mas 3) 8,080 989 16,094 1,046 14,201 748 10,689 537
Indo Agri 3) 6,506 994 11,840 1,067 9,040 2,053 6,505 804
Astra Agro 3) 5,961 1,973 8,161 2,631 7,424 1,660 5,721 1,228
Lonsum 3) 2,930 564 3,846 927 3,199 707 2,403 642
First Resources 3) 1,691 627 2,783 1,151 2,276 1,236 1,908 684
Bakrie Sumatra 3) 1,949 206 2,931 173 2,325 252 1,896 245
Notes: 1) Net Profit; 2) in USD million; 3) in IDR billion; Source: Companies’ Reports.
11 Inonesia's Palm Oil Outlook 2011-2020
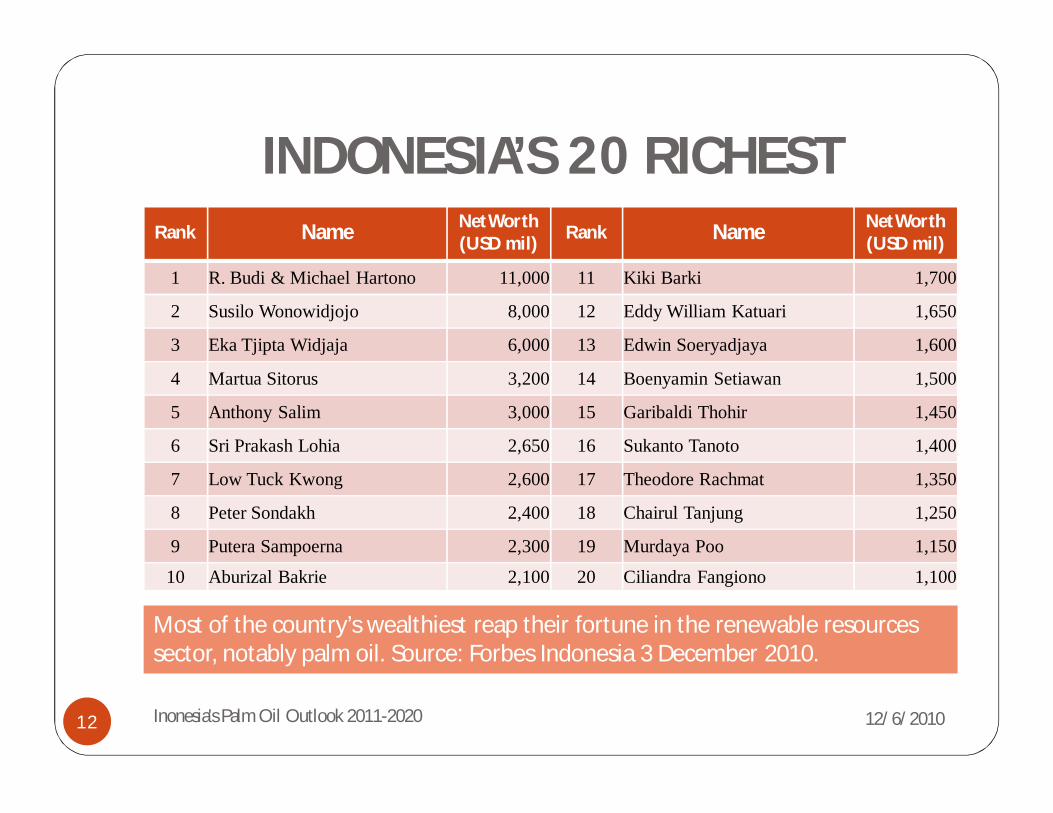
INDONESIA’S 20 RICHEST
12/6/2010Inonesia's Palm Oil Outlook 2011-202012
Rank Name Net Worth (USD mil) Rank Name Net Worth
(USD mil)
1 R. Budi & Michael Hartono 11,000 11 Kiki Barki 1,700
2 Susilo Wonowidjojo 8,000 12 Eddy William Katuari 1,650
3 Eka Tjipta Widjaja 6,000 13 Edwin Soeryadjaya 1,600
4 Martua Sitorus 3,200 14 Boenyamin Setiawan 1,500
5 Anthony Salim 3,000 15 Garibaldi Thohir 1,450
6 Sri Prakash Lohia 2,650 16 Sukanto Tanoto 1,400
7 Low Tuck Kwong 2,600 17 Theodore Rachmat 1,350
8 Peter Sondakh 2,400 18 Chairul Tanjung 1,250
9 Putera Sampoerna 2,300 19 Murdaya Poo 1,150
10 Aburizal Bakrie 2,100 20 Ciliandra Fangiono 1,100
Most of the country’s wealthiest reap their fortune in the renewable resources sector, notably palm oil. Source: Forbes Indonesia 3 December 2010.

PROMISING GLOBAL ECONOMY
12/6/2010
Country 2008 2009 2010 e
2011 f
2012 f
World 1.7 -2.1 3.3 3.3 3.5
OECD 0.3 -3.4 2.2 2.3 2.6
Brazil 5.1 -0.2 6.4 4.5 4.1
Russia 5.6 -7.9 4.5 4.8 4.7
India 5.1 7.7 8.2 8.7 8.2
China 9.6 8.7 9.5 8.5 8.2
Indonesia 6.0 4.5 5.9 6.2 6.3
Real GDP Growth (%)
Source: WB, Global Economic Outlook 2010
13 Inonesia's Palm Oil Outlook 2011-2020
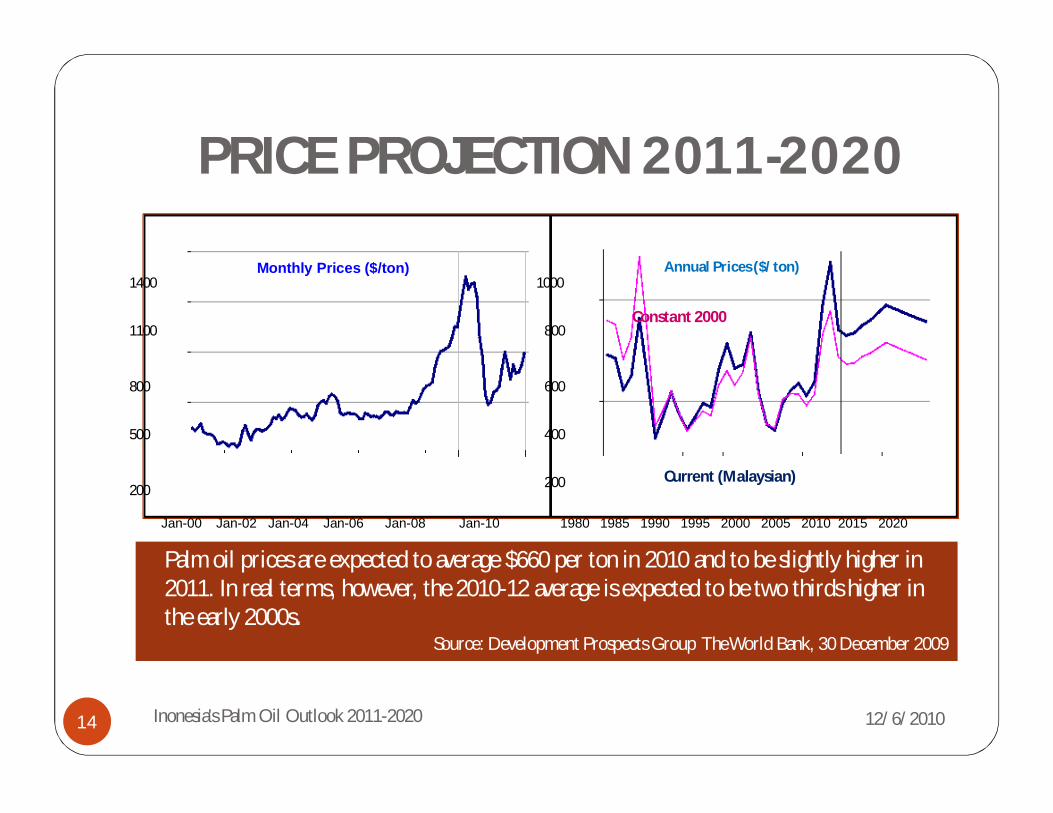
PRICE PROJECTION 2011-2020
12/6/2010
1980 1985 1990 1995 2000 2005 2010 2015 2020Jan-00 Jan-02 Jan-04 Jan-06 Jan-08 Jan-10
Monthly Prices ($/ton) Annual Prices ($/ton)
200
400
600
800
1000
200
500
800
1100
1400
Palm oil prices are expected to average $660 per ton in 2010 and to be slightly higher in 2011. In real terms, however, the 2010-12 average is expected to be two thirds higher inthe early 2000s.
Source: Development Prospects Group The World Bank, 30 December 2009
Constant 2000
Current (Malaysian)
14 Inonesia's Palm Oil Outlook 2011-2020

EXPANSION AREAS
12/6/2010Inonesia's Palm Oil Outlook 2011-202015
Potential 24.5 million Ha
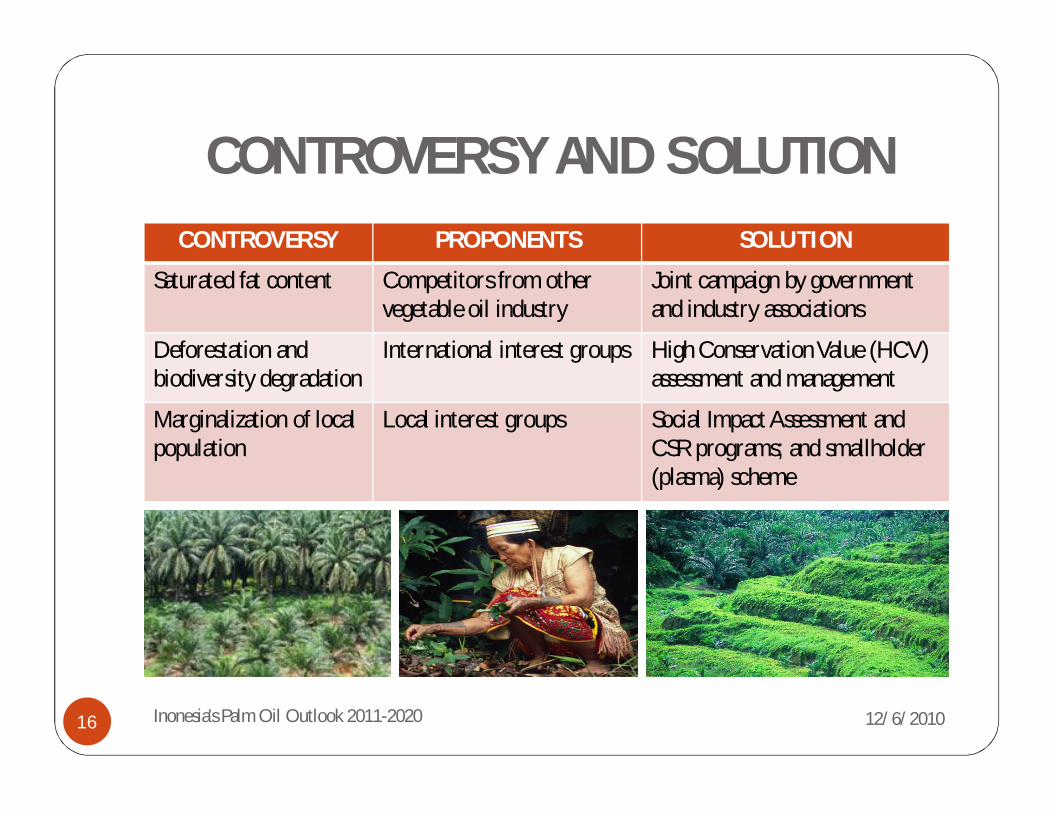
CONTROVERSY AND SOLUTION
12/6/2010
CONTROVERSY PROPONENTS SOLUTION
Saturated fat content Competitors from other vegetable oil industry
Joint campaign by government and industry associations
Deforestation and biodiversity degradation
International interest groups High Conservation Value (HCV) assessment and management
Marginalization of local population
Local interest groups Social Impact Assessment and CSR programs; and smallholder (plasma) scheme
16 Inonesia's Palm Oil Outlook 2011-2020