Embed Size (px)
Citation preview
Information andCommunicationTechnology (ICTs) Training, Employment and YouthThe case of Brazil, Colombia and Mexico
Judith MariscalCentro de Investigación y Docencia Económicas (CIDE), México
Antonio José Junqueira BotelhoPontificia Universidade Católica do Rio de Janeiro, Brasil
Luis H. GutiérrezUniversidad del Rosario, Colombia
September 2008
IEP Instituto de Estudios Peruanos
Serie: América Problema, 23
This research was financed by the University of Washington’s Center for Information & Society (CIS) through a grant from Microsoft Community Affairs.
© Judith Mariscal, Antonio José Junqueira Botelho y Luis H. Gutiérrez
© CIS CENTER FOR INFORMATION & SOCIETY Universidad of Washington 311 11th Avene NE, Suite 400 Box 354985 Seattle, WA 98105 (Tel) 206.616.6668 (Fax) 206.616.3152 Email: [email protected] www.cis.washington.edu
© IEP INSTITUTO DE ESTUDIOS PERUANOS Horacio Urteaga 694, Lima 11 Telf. (51-1) 332-6194 / 424-4856 E-mail: [email protected] www.iep.org.pe
ISBN: 978-9972-51-227-8ISSN: 1019-4460
Printed in PeruFirst Edition, november, 2008 500 copies
Legal Deposit National Library of Peru: 2008-15498
Editorial Project RegistrationNational Library: 11501130800947
General coordination: María GarridoTexts edits: Kristin KeenanDesign and format: Mario PopucheBook cover design: Rossy CastroEdition supervision: Mercedes Dioses / Mario PopuchePromotion and commercialization: Elizabeth Andrade
Reproduction in whole or in part of this document by any means without prior written permissionby the publishers is strictly prohibited
Garrido, María, ed.Information and Communication Technology (ICTs) Training, Employment and Youth: The case of Brazil, Colombia
and Mexico / Judith Mariscal, Antonio José Junqueira Botelho y Luis H. Gutiérrez. Lima: IEP; CIS, Center for Informa-
tion & Society, 2008. (América Problema, 23)
INFORMATION TECHNOLOGY; ICTs; TRAINNING; MARGINALIZATION; YOUTH; PUBLIC POLICY; CASE STUDIES;
BRASIL; COLOMBIA; MEXICO
W/02.04.01/A/23

This report was produced by CIS as part of its Research Paper Series. The views and opinions of the
authors expressed herein do not necessarily state or reflect those of CIS or the University of Washington.
This study is supported by a grant from Microsoft Community Affairs under the Unlimited Potential
- Community Technology Skills Program. This program broadens digital inclusion and global workforce
development by providing technology skills through community technology centers.
We would like to thank María Garrido for her invitation to participate in this study. The support of Regina
de Angoitia, Walter Lepore, Luis F. Gamboa, Fernando Ramírez and Armando Aldama in preparing this
document is much appreciated. We also extend our gratitude to Cléber Lucio for his help with field research
in Brazil.

�
Contents
Introduction 9
I. LiteratureReview 11
II. Brazil 19
2.1. Poverty, Digital Gap, Employment, ICT, Youth 19
2.1.1. Poverty 19
2.1.2. Digital Inclusion 20
2.1.3. Unemployment 21
2.1.4. Government efforts 23
2.2. NGOs, ICT, Centers and Employment 23
2.3. Internal analysis: relevance for the labor market 26
2.4. External analysis: ICTs, youth and the labor market 31
2.4.1. Beneficiaries 31
2.4.2. Courses 33
2.4.3. Employment 35
2.4.4. Digital exclusion 38
III.Colombia 39
3.1. Poverty, the Digital Divide and Unemployment in Colombia 39
3.1.1. Poverty 39
3.1.2. Digital Inclusion 41
3.1.3. Unemployment 43
3.1.4. Government training and ICT efforts 45
�
INFORMATION AND COMMUNICATION TECHNOLOGY (ICTs) TRAINING, EMPLOYMENT AND YOUTH
3.2. NGOs, ICT centers and employment 46
3.3. Internal analysis: labor market relevance 47
3.4. External Analysis: ICT, youth and the labor market 50
3.4.1. Beneficiaries 50
3.4.2. Courses 53
3.4.3. Employment 54
3.4.4. Digital exclusion 56
IV. Mexico 59
4.1. Poverty, the Digital Divide, Employment, ICTs, Youth 59
4.1.1. Poverty 59
4.1.2. Digital Inclusion 60
4.1.3. Unemployment 63
4.1.4. Government efforts 64
4.2. NGOs, ICT Centers and Employment 64
4.3. Internal analysis: relevance for the labor market 67
4.4. External analysis: ICT, Youth and the Labor Market 70
4.4.1. Beneficiaries 71
4.4.2. Courses 72
4.4.3. Employment 74
4.4.4. Digital exclusion 78
V. MainFindingsandRecommendations 79
5.1. Comparative Analysis 79
Conclusions 89
Appendix1(WorkMethod) 91
Appendix2(Fieldwork) 95
Bibliography 97
THE CASE OF BRAZIL, COLOMBIA AND MEXICO
�
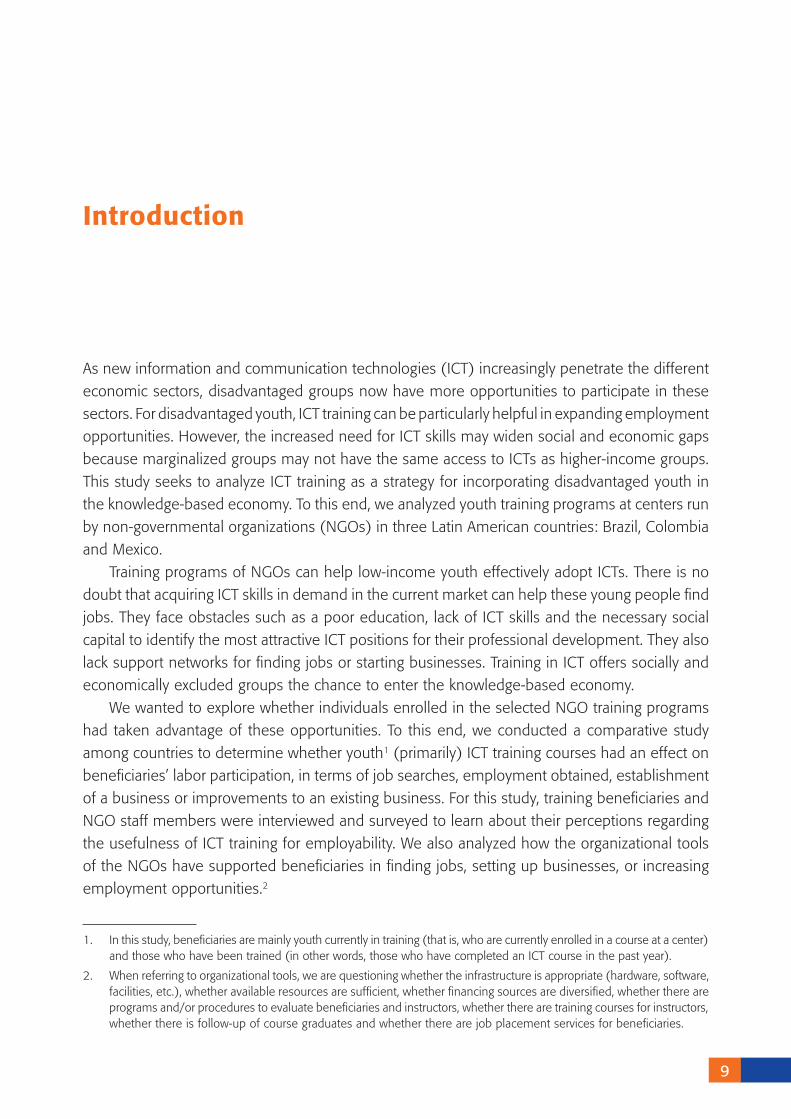
As new information and communication technologies (ICT) increasingly penetrate the different economic sectors, disadvantaged groups now have more opportunities to participate in these sectors. For disadvantaged youth, ICT training can be particularly helpful in expanding employment opportunities. However, the increased need for ICT skills may widen social and economic gaps because marginalized groups may not have the same access to ICTs as higher-income groups. This study seeks to analyze ICT training as a strategy for incorporating disadvantaged youth in the knowledge-based economy. To this end, we analyzed youth training programs at centers run by non-governmental organizations (NGOs) in three Latin American countries: Brazil, Colombia and Mexico.
Training programs of NGOs can help low-income youth effectively adopt ICTs. There is no doubt that acquiring ICT skills in demand in the current market can help these young people find jobs. They face obstacles such as a poor education, lack of ICT skills and the necessary social capital to identify the most attractive ICT positions for their professional development. They also lack support networks for finding jobs or starting businesses. Training in ICT offers socially and economically excluded groups the chance to enter the knowledge-based economy.
We wanted to explore whether individuals enrolled in the selected NGO training programs had taken advantage of these opportunities. To this end, we conducted a comparative study among countries to determine whether youth1 (primarily) ICT training courses had an effect on beneficiaries’ labor participation, in terms of job searches, employment obtained, establishment of a business or improvements to an existing business. For this study, training beneficiaries and NGO staff members were interviewed and surveyed to learn about their perceptions regarding the usefulness of ICT training for employability. We also analyzed how the organizational tools of the NGOs have supported beneficiaries in finding jobs, setting up businesses, or increasing employment opportunities.2
1. In this study, beneficiaries are mainly youth currently in training (that is, who are currently enrolled in a course at a center) and those who have been trained (in other words, those who have completed an ICT course in the past year).
2. When referring to organizational tools, we are questioning whether the infrastructure is appropriate (hardware, software, facilities, etc.), whether available resources are sufficient, whether financing sources are diversified, whether there are programs and/or procedures to evaluate beneficiaries and instructors, whether there are training courses for instructors, whether there is follow-up of course graduates and whether there are job placement services for beneficiaries.
Introduction
10
INFORMATION AND COMMUNICATION TECHNOLOGY (ICTs) TRAINING, EMPLOYMENT AND YOUTH
The study was designed to address the following research questions: How do NGOs, through their community centers, train youth in urban areas of Latin America for entrepreneurial/business activities? What role do ICT skills play in these programs? What partnerships are NGOs building to support economic and social development? How effective are these programs for creating employment opportunities, in the opinion of beneficiaries? How do beneficiaries perceive that ICTs can help improve their and their families’ living conditions?
The three countries had similar research findings. Beneficiaries generally believe that ICT training helps them to overcome economic and social constraints, that is, it offers them more opportunities. Beneficiaries frequently mentioned that the skills acquired made them feel empowered and gave them new opportunities to teach others and seek employment. Training also helped build beneficiaries’ self-esteem and gave them a sense of satisfaction because they had expanded their opportunities thanks to their ICT skills.
Beneficiaries’ positive perceptions and high expectations did not always translate into employment, however. The NGOs need to strengthen their organizational and strategic capacities for designing and implementing programs, with an emphasis on monitoring and learning from the experiences of the programs and individuals. Key challenges facing NGOs include the need to expand training beyond technical subjects and to support beneficiaries’ entry into the labor market. To this end, NGOs should establish and strengthen partnerships with businesses and improve and expand job placement services.
International entities have traditionally supported NGOs in Latin America by providing start-up financing. Although this type of funding is valuable for launching programs, these programs require ongoing support in terms of funding and monitoring of training.
Public policies also play a key role. There are several public, private and NGO initiatives designed to promote access to telecommunications services to underserved areas. However, these lack coordination and often lead to duplicated, ineffective efforts. Regional governments can provide the needed leadership and coordination by disseminating initiatives and experiences and promoting partnerships among NGOs and/or among NGOs and private businesses.
This document has five chapters. Chapter One discusses current research on employment and the digital exclusion situation in the countries, as well as government connectivity programs in the three countries. Chapters Two, Three and Four present the analysis of NGOs and technology centers in Brazil, Colombia and Mexico, respectively. Chapter Five compares the findings for the three countries and offers some conclusions and recommendations.
11
The dramatic technological changes occurring in the telecommunications industry in recent decades have bolstered the industry’s contribution to economic and social development. Information and communication technologies offer opportunities for increasing the productivity and competitiveness of the workforce. López Bassols’ (2002) empirical study found that ICT training had a positive effect on employment and, consequently, on countries’ economic growth. The author believes a relationship exists between the adoption of new technology and the structure of employment. Technology adoption increases the efficiency of the different agents in the production process. Nevertheless, individuals can only take advantage of the opportunities ICTs offer in increasing productivity and competitiveness by acquiring new knowledge and skills. In a labor market increasingly dependent on ICTs, the lack of a skilled workforce limits countries’ competitive advantage and widens the social and economic gaps of their populations.
Some assessments of these programs underscore the need for greater community involvement and the need to strengthen their role as intermediaries that link users with technology (Cecchini, 2005).3 In education programs, teachers are key intermediaries whereas physicians may be the technology link in the health sector. Both act as go-betweens for effective ICT adoption. Non-governmental organizations that provide ICT access and training to disadvantaged groups have also proved effective for ICT adoption. Although literature on this subject is limited, results of several empirical studies indicate that ICT training provided by NGOs positively contributes to the labor mobility of individuals with little education.
For example, Karen Chapple’s (2006) study of graduates of ICT training provided by several U.S. NGOs found that this training was generally successful. In that study, interviews with graduates indicated that most had found work and remained in their jobs for three years, on average. In another study, a group of researchers at the Center for Information & Society analyzed different NGOs that provide ICT training to populations with limited education to
3. In Colombia, for example, Amariles, Paz, Russell & Jonson (2006) studied a telecenter in rural Cauca and found that “these people, particularly the poorest among them, have fewer opportunities to benefit from the services.” The telecenters in that study mainly support individuals with a relatively higher education, and the use of ICTs only complement their access to other communication media. “It seems that telecenters (particularly, cybercafés) tend to increase rather than decrease the gap between the community elite and disadvantaged sectors.” The authors argue that the lack of a close relationship with the community most likely produced those results.
I.LiteratureReview
12
INFORMATION AND COMMUNICATION TECHNOLOGY (ICTs) TRAINING, EMPLOYMENT AND YOUTH
increase their employability. They found that NGOs are an essential part of the workforce development network, especially for lower wage, lower skill workers. (Sullivan, Garrido, Dridi, Coward, Gordon, 2007).
A study on youth from Eastern Europe (Cava, Lytle & Kolev, 2005) identified the lack of young people’s access to a quality education as an obstacle for obtaining employment. The study also identified a lack of training and credit opportunities as barriers for youth to establish a microenterprise, thereby hindering self-employment. West & Garrido (2008) recounted the experiences of several NGOs that work in five eastern European countries. Through careful, relevant training developed with community participation, these NGOs contributed to young people’s employability. Specifically, the study found that young people’s involvement in ICT projects gave them work experience, which subsequently helped them find a job. These NGO projects also served as a technological platform for youth to acquire the ICT skills required in the labor market.
Workforce mobility is not an automatic process, however. The lessons from different studies on ICT training provided by NGOs suggest that a key variable to success is relevance. A study documenting the experiences of 25 NGOs worldwide concluded that training should be relevant in populations without ICT experience; in other words, it should be part of the broader objectives of the individual and society to reduce the social barriers individuals face and to enable them to acquire new skills and use them productively (Garrido & Coward, 2007). Distinctive skills give people a clear advantage in every demanding and competitive labor market, particularly the ICT sector. Finally, these studies found that NGO partnerships with other organizations (government and corporate) are important both for obtaining information on skills in demand and possible job placement of trainees.
Although ICT skills are not the only key variable for labor market entry, they do give individuals access to jobs beyond those available through generic job training. The possibility of ICT training for employability, particularly for young people, is a relevant topic for the countries in this study. In Mexico, youth ages 14-29 represent 30% of the economically active population (EAP) and approximately 60% of the unemployed population nationwide. In Brazil, the youth unemployment rate rose from 11% in 1995 to 18% in 2000 and 19% in 2005. Youth comprised 22.9% of the population in 2002, and today make up 19.4%. Over the past 15 years, the unemployment rate among youth in Brazil has increased more rapidly than that of adults.
Some studies suggest that the difficulty in finding a job is largely due to a lack of education. Even when more jobs become available, some people are not hired because they lack training. In Colombia, the most recent reliable data on labor exclusion dates from 2003. Using data from the Quality of Life Survey and the National Household Survey, Forero, García and Guataquí (2008) estimated an unemployment rate4 of 28% for the population ages 12-18; approximately 22% for youth ages 19-24 and nearly 15% for those ages 25-30.
A recent comparative study on youth unemployment conducted by the Brazilian Government Research Institute (IPEA) reported that Brazil had the highest percentage of unemployed
4. Average of the two surveys.
THE CASE OF BRAZIL, COLOMBIA AND MEXICO
13
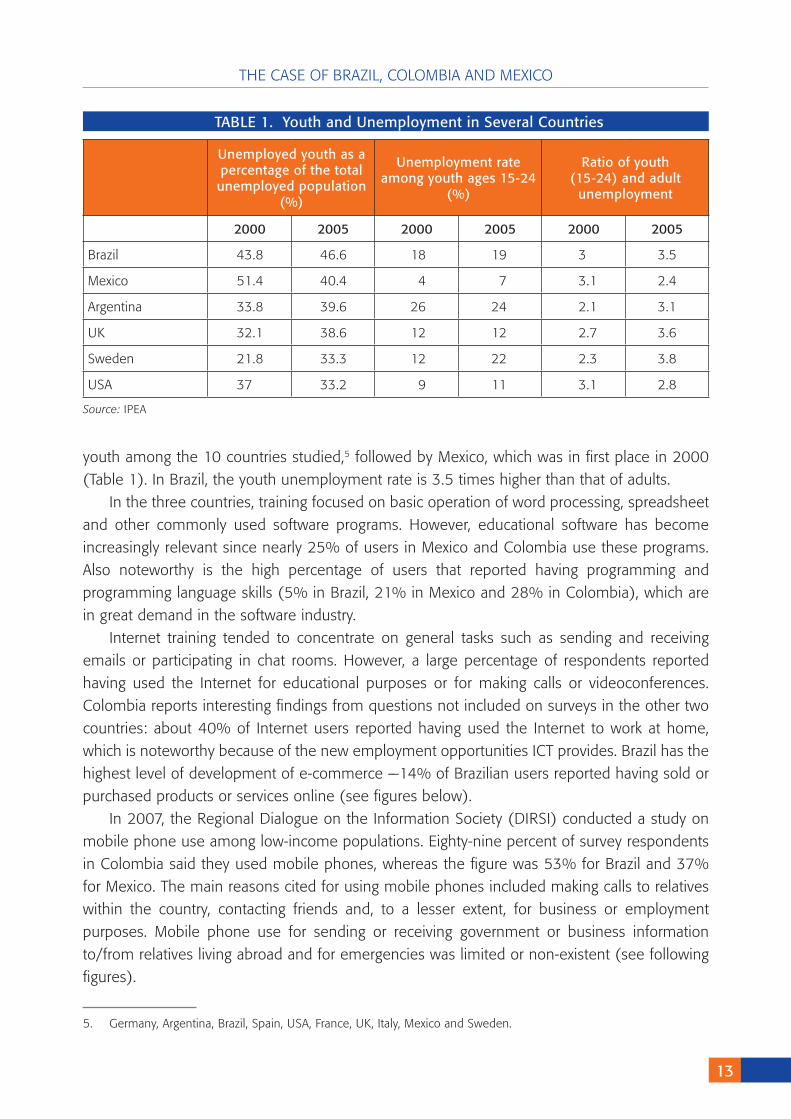
youth among the 10 countries studied,5 followed by Mexico, which was in first place in 2000 (Table 1). In Brazil, the youth unemployment rate is 3.5 times higher than that of adults.
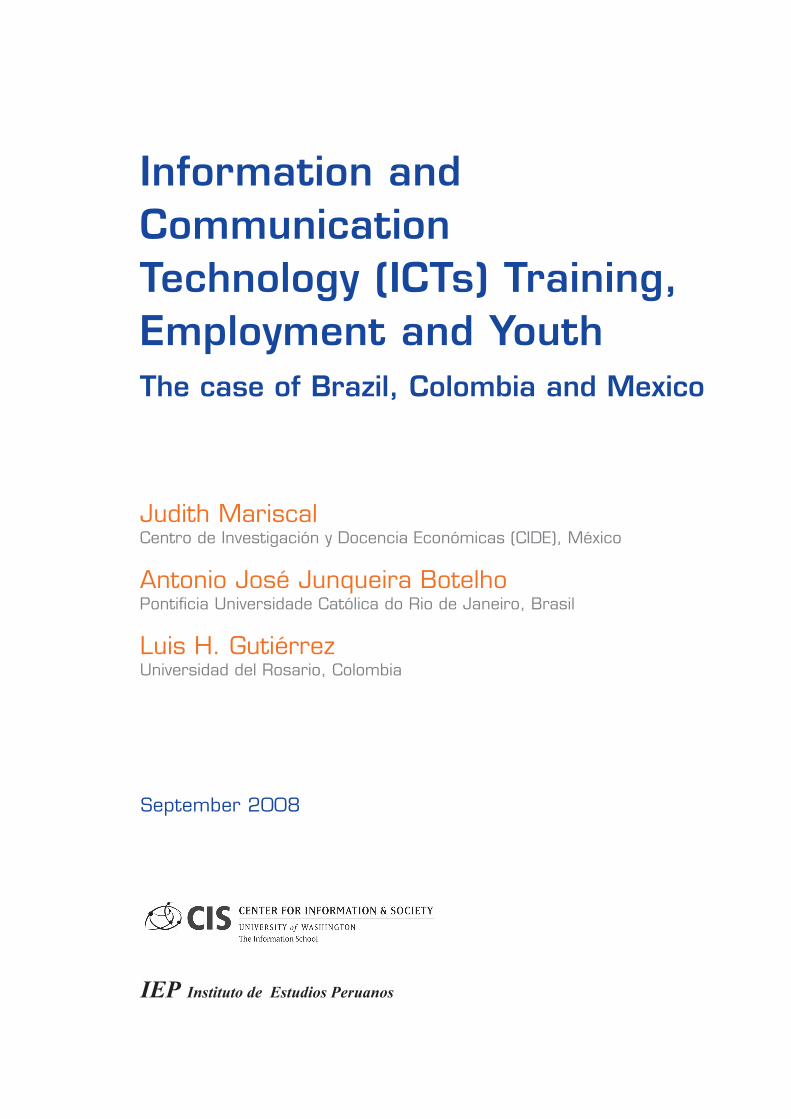
In the three countries, training focused on basic operation of word processing, spreadsheet and other commonly used software programs. However, educational software has become increasingly relevant since nearly 25% of users in Mexico and Colombia use these programs. Also noteworthy is the high percentage of users that reported having programming and programming language skills (5% in Brazil, 21% in Mexico and 28% in Colombia), which are in great demand in the software industry.
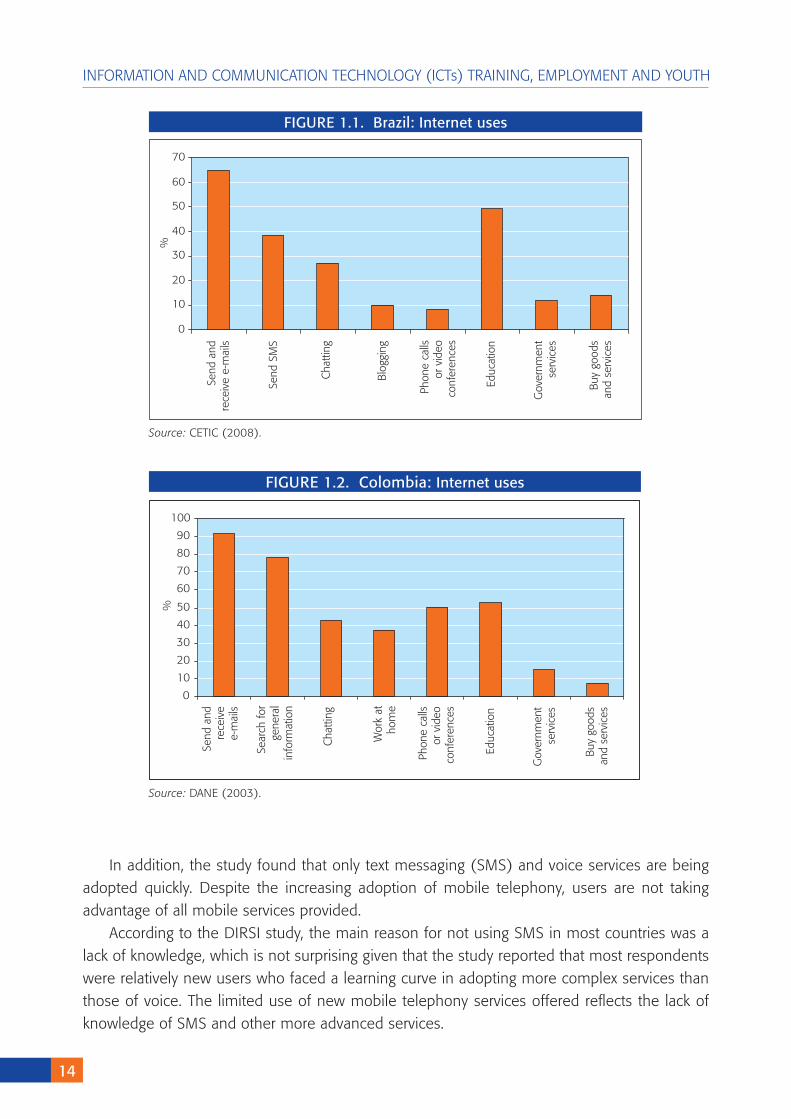
Internet training tended to concentrate on general tasks such as sending and receiving emails or participating in chat rooms. However, a large percentage of respondents reported having used the Internet for educational purposes or for making calls or videoconferences. Colombia reports interesting findings from questions not included on surveys in the other two countries: about 40% of Internet users reported having used the Internet to work at home, which is noteworthy because of the new employment opportunities ICT provides. Brazil has the highest level of development of e-commerce —14% of Brazilian users reported having sold or purchased products or services online (see figures below).
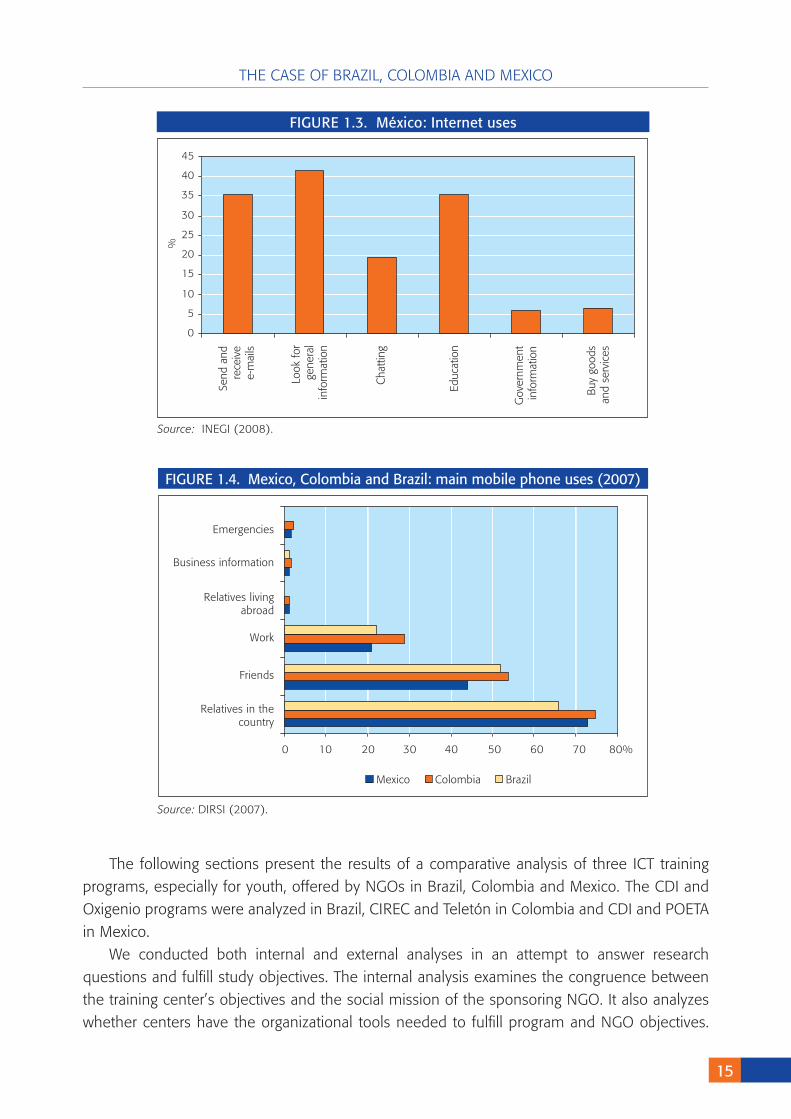
In 2007, the Regional Dialogue on the Information Society (DIRSI) conducted a study on mobile phone use among low-income populations. Eighty-nine percent of survey respondents in Colombia said they used mobile phones, whereas the figure was 53% for Brazil and 37% for Mexico. The main reasons cited for using mobile phones included making calls to relatives within the country, contacting friends and, to a lesser extent, for business or employment purposes. Mobile phone use for sending or receiving government or business information to/from relatives living abroad and for emergencies was limited or non-existent (see following figures).
Source: IPEA
TABLE 1. Youth and Unemployment in Several Countries
Unemployed youth as a percentage of the total unemployed population
(%)
Unemployment rate among youth ages 15-24
(%)
Ratio of youth(15-24) and adult
unemployment
2000 2005 2000 2005 2000 2005
Brazil 43.8 46.6 18 19 3 3.5
Mexico 51.4 40.4 4 7 3.1 2.4
Argentina 33.8 39.6 26 24 2.1 3.1
UK 32.1 38.6 12 12 2.7 3.6
Sweden 21.8 33.3 12 22 2.3 3.8
USA 37 33.2 9 11 3.1 2.8
5. Germany, Argentina, Brazil, Spain, USA, France, UK, Italy, Mexico and Sweden.
14
INFORMATION AND COMMUNICATION TECHNOLOGY (ICTs) TRAINING, EMPLOYMENT AND YOUTH
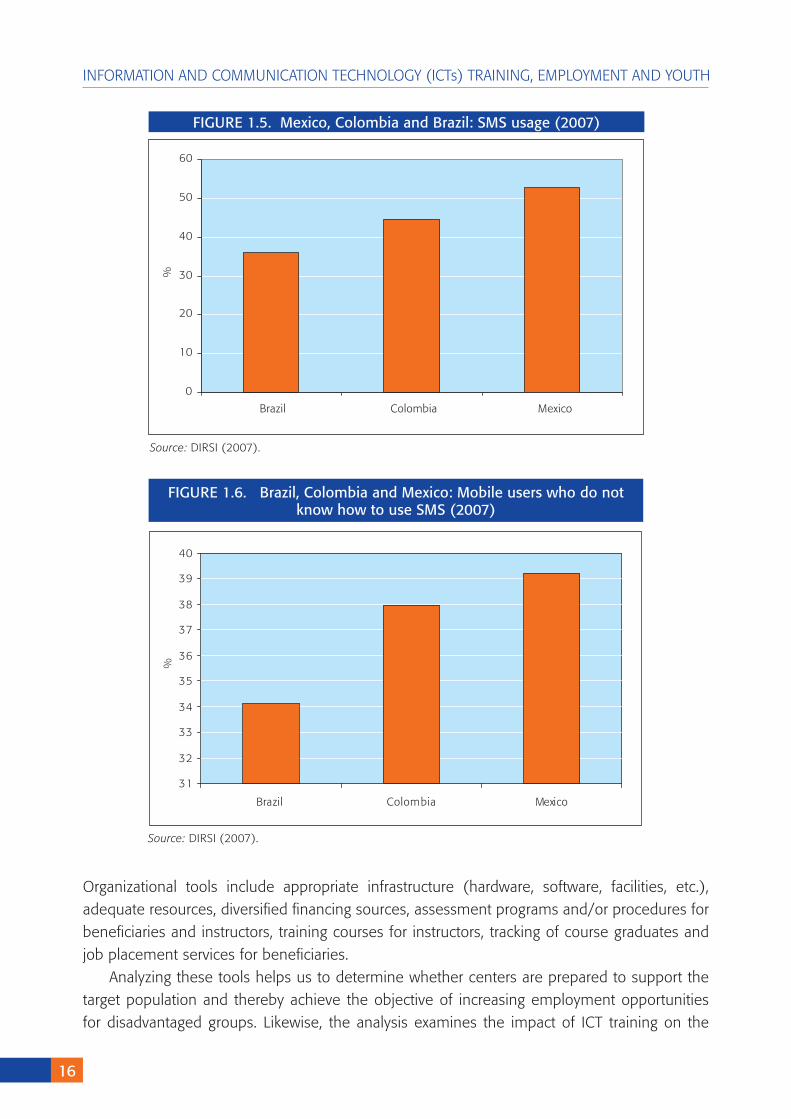
In addition, the study found that only text messaging (SMS) and voice services are being adopted quickly. Despite the increasing adoption of mobile telephony, users are not taking advantage of all mobile services provided.
According to the DIRSI study, the main reason for not using SMS in most countries was a lack of knowledge, which is not surprising given that the study reported that most respondents were relatively new users who faced a learning curve in adopting more complex services than those of voice. The limited use of new mobile telephony services offered reflects the lack of knowledge of SMS and other more advanced services.
FIGURE 1.1. Brazil: Internet uses
0
10
20
30
40
50
60
70
Send
and
rece
ive
e-m
ails
Send
SM
S
Cha
tting
Blog
ging
Phon
e ca
llsor
vid
eoco
nfer
ence
s
Educ
atio
n
Gov
ernm
ent
serv
ices
Buy
good
san
d se
rvic
es
%
Source: CETIC (2008).
FIGURE 1.2. Colombia: Internet uses
9
0
10
20
30
40
50
60
70
80
90
100
Sear
ch fo
rge
nera
lin
form
atio
n
Cha
tting
Wor
k at
hom
e
Send
and
rece
ive
e-m
ails
Phon
e ca
llsor
vid
eoco
nfer
ence
s
Educ
atio
n
Gov
ernm
ent
serv
ices
Buy
good
san
d se
rvic
es
%
Source: DANE (2003).
THE CASE OF BRAZIL, COLOMBIA AND MEXICO
15
The following sections present the results of a comparative analysis of three ICT training programs, especially for youth, offered by NGOs in Brazil, Colombia and Mexico. The CDI and Oxigenio programs were analyzed in Brazil, CIREC and Teletón in Colombia and CDI and POETA in Mexico.
We conducted both internal and external analyses in an attempt to answer research questions and fulfill study objectives. The internal analysis examines the congruence between the training center’s objectives and the social mission of the sponsoring NGO. It also analyzes whether centers have the organizational tools needed to fulfill program and NGO objectives.
FIGURE 1.3. México: Internet uses
Source: INEGI (2008).
0
5
10
15
20
25
30
35
40
45
Look
for
gene
ral
info
rmat
ion
Cha
tting
Send
and
rece
ive
e-m
ails
Educ
atio
n
Gov
ernm
ent
info
rmat
ion
Buy
good
san
d se
rvic
es
%
FIGURE 1.4. Mexico, Colombia and Brazil: main mobile phone uses (200�)
Source: DIRSI (2007).
0 10 20 30 40 50 60 70 80%
Relatives in thecountry
Friends
Work
Relatives livingabroad
Business information
Emergencies
Mexico Colombia Brazil
16
INFORMATION AND COMMUNICATION TECHNOLOGY (ICTs) TRAINING, EMPLOYMENT AND YOUTH
Organizational tools include appropriate infrastructure (hardware, software, facilities, etc.), adequate resources, diversified financing sources, assessment programs and/or procedures for beneficiaries and instructors, training courses for instructors, tracking of course graduates and job placement services for beneficiaries.
Analyzing these tools helps us to determine whether centers are prepared to support the target population and thereby achieve the objective of increasing employment opportunities for disadvantaged groups. Likewise, the analysis examines the impact of ICT training on the
FIGURE 1.5. Mexico, Colombia and Brazil: SMS usage (200�)
Source: DIRSI (2007).
FIGURE 1.6. Brazil, Colombia and Mexico: Mobile users who do not know how to use SMS (200�)
Source: DIRSI (2007).
0
10
20
30
40
50
60
Brazil Colombia Mexico
%%
31
32
33
34
35
36
37
38
39
40
Brazil Colombia Mexico
THE CASE OF BRAZIL, COLOMBIA AND MEXICO
1�
possibilities for securing employment and investigates the role of intermediaries (the centers, in this study) that serve as a link between technology and beneficiaries (in this case, youth in training or that have already completed training). We obtained much of the information necessary for this analysis from supporting documents provided by the centers, as well as from interviews and surveys of beneficiaries, instructors and coordinators.
The external analysis seeks to obtain information on beneficiaries, instructors and courses. To this end, two qualitative research tools were used: questionnaires and interviews. Three separate questionnaires were prepared for beneficiaries, instructors and center coordinators. Each questionnaire contained specific and general questions to verify and cross-check information. In the case of beneficiaries, questionnaires included the following sections: general information on the user; training and results; digital exclusion; technology use and access; and suggestions for improvement. Coordinators’ questionnaires contained questions on general information; technological infrastructure of the center; beneficiaries; training; instructors’ education; center resources; and suggestions for improvement. Finally, instructors’ questionnaires were composed of the following sections: general data; training; instructors’ education; and suggestions for improvement (see Annex 1 for further details on the research tools used).
Results of the analyses contribute to the body of knowledge on the human and physical resources of the organizations participating in this project and identify stakeholders’ perceptions with regard to the achievement of program objectives.
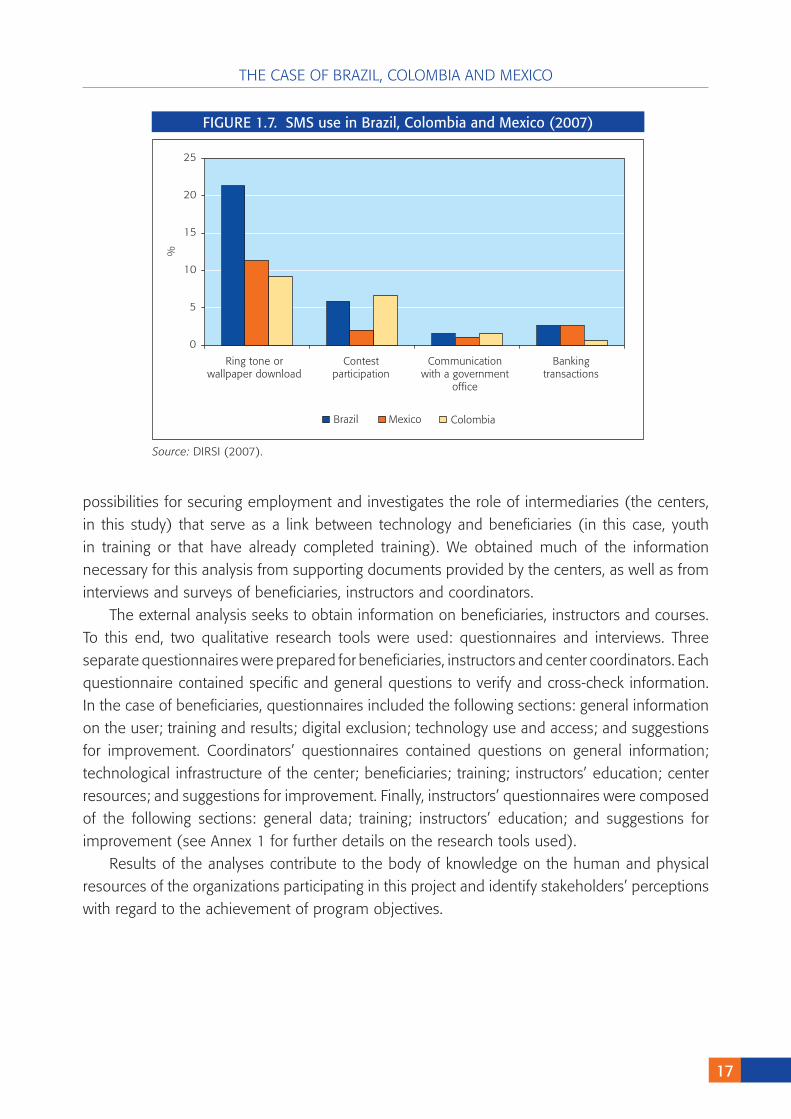
FIGURE 1.�. SMS use in Brazil, Colombia and Mexico (200�)
Source: DIRSI (2007).
0
5
10
15
20
25
Ring tone orwallpaper download
Contestparticipation
Communicationwith a government
office
Bankingtransactions
%
Brazil Mexico Colombia

1�
INFORMATION AND COMMUNICATION TECHNOLOGY (ICTs) TRAINING, EMPLOYMENT AND YOUTH
THE CASE OF BRAZIL, COLOMBIA AND MEXICO
1�
2.1.Poverty,DigitalGap,Employment,ICT,Youth
2.1.1.Poverty
In August 2000 (IBGE, 2000 National Census), Brazil had a population of 169.8 million, 81% of which lived in urban areas. Forty percent of the population resides in the southeast region (90% urban), approximately 25% lives in the northeastern region (75% urban) and 15% in the south (80% urban). The projected population for 2005 was approximately 184.2 million. In 2004, according to the national household survey (IBGE, PNAD 2004), there were 51.8 million dwellings, 84.5 percent of which were located in urban areas and nearly half of which were in the southeast region. An average of 3.5 people inhabited the dwelling, with 1.8 people per room. Over 90% of urban dwellings had running water (approximately 60% in the northern region) and approximately two-thirds had sewage services. Between 1992 and 2004, the Brazilian population increased from 139.7 million to 173.5 million, a growth rate of 1.92% per year. The northern and mid-western regions had the highest population growth rates, but accounted for only 13.5% of the country’s total population in 2004, whereas the northeast had 28.4% and the City of Sao Paulo, 22.1%. The population growth in the period reflected the growth in the urban population, especially in non-metropolitan areas whereas the average population growth rate fell in rural areas. The country’s northeast and rural regions have the highest poverty rates.
A recent government Millennium Goals monitoring report stated that between 1992 and 2006, the population living in extreme poverty (USD 1 or less per day) decreased from 8.8% (13.4 million) to 4.2% (7.5 million). Using minimum wage criteria (extreme poverty refers to households with a monthly per capita income of less that one-fourth of the minimum wage, R$ 89.60; poverty refers to households earning half the minimum wage, R$ 179.21), extreme poverty declined from 28% to 16%, whereas poverty fell from 52% to 38%. Inequality also decreased between 2001 and 2005, with the Gini coefficient declining to 0.566 by the end of the period, after remaining close to 0.595 in previous years. Income of the poorest 10% of the population grew 9.2% per year whereas the income of the wealthiest 1% declined 0.4% annually. Despite these advances, digital inequality remains high, according to the report. In
II.Brazil
20
INFORMATION AND COMMUNICATION TECHNOLOGY (ICTs) TRAINING, EMPLOYMENT AND YOUTH
2005, 32.1 million people had Internet access, 55% of whom lived in the southeast region, as compared with 8% and 4% in the mid-western and northern regions, respectively.
Similarly, Brazil’s gross domestic product (GDP) per capita rose from R$ 6,896 in 2001, to R$ 8,694.47 in 2003 and to R$ 10,519.89 in 2005. This increase in per capita income, combined with falling interest rates and the resulting increase in available credit, has driven increased consumption among low-income sectors.
Brazil’s recent economic growth seems to be having an impact on poverty. The most recent National Census (PNAD/2006), carried out by the Institute for Statistics and Geography (IBGE) in September 2006, reported promising results for the country’s fight against poverty. The increase in average household income between 2005 and 2006 was the highest in a decade. The percentage of workers in the formal sector increased while illiteracy declined (from 10.2% to 9.6%). In addition, more adults were continuing their education. For example, the percentage of people attending universities rose by 13.2%. In 2006, higher earnings dramatically increased consumption, including of ICT: 64% of the population had a car; 28% had a mobile phone only (whereas those with fixed telephones decreased to just 11%, from 28% in 2001) and 22% had a computer, almost double the percentage for 2001. However, the percentage of the population with Internet access is just 17%. In short, poverty decreased to its lowest level in 13 years.
Average real wages increased 7.2% overall and 9.6% in the lowest-income segments. According to socioeconomic criteria, the poorest population group (class E) decreased from 13% to 2% as a percentage of the total population whereas class D lost two million households (D/E: up to four minimum wages). Moreover, class C (4-10 minimum wages) grew by 1.5 million households and class B2 (A/B more than 10 minimum wages) by almost 600,000.
The PNAD 2006 census (IBGE 2007) demonstrated the continuing decrease in the Gini coefficient, to 0.541 in 2006, versus 0.544 in 2005 and 0.566 in 2001. Nevertheless, the declining trend slowed in the most recent period. The census also confirmed the continuation of the two-year growth (2005-2006) in workers’ average earnings, which rose 12.2% in 2006 as compared with 2005, although earnings remain below 1996 levels. An FGV study based on PNAD data also reported that poverty decreased 15% in 2006, the highest decline in 10 years, accompanied by a 9% growth in average household income. The poorest half of the population increased earnings by 12% whereas the wealthiest 10% experienced an 8% increase in earning. The percentage of the population living in poverty decreased from 23% in 2005 to 19% in 2006.
2.1.2.Digitalinclusion
Today, 22% of the 54.6 million households in Brazil have a computer, with the southeast region (29%) at one extreme and the northeast region (10%) at the other. Internet access is 17% (9.2 million households or 76% of those with computers, as compared with 12% in 2004) whereas broadband service is 13%. Only 1,900 of the country’s 5,100 municipalities have broadband. Fifty-one percent of public schools have broadband, compared with 92% of
THE CASE OF BRAZIL, COLOMBIA AND MEXICO
21
private ones. In absolute numbers, Brazil has 39 million Internet users, or approximately 45% of the population, placing it in sixth place in terms of number of Internet users, after India.
The number of computers has increased dramatically over the past two years (8.2 million sold in 2006 versus 5.5 million in 2005) due to several factors: rising incomes of lower-income groups, lower computer prices because of reduced taxes thanks to the government Computers for All program, and an increase in credit availability (including special lines of credit for retail stores selling computers for under R$ 1,400, as part of the Computers for All program), with lower average credit amounts (from R$150,000 to R$ 65,000) and expanded payment periods of up to 25 years. These developments have mainly benefited low-income groups. The 2006 PNAD reported that 89% of new households with computers had a monthly income below 10 minimum wages. Eighty-seven percent of households with incomes above 20 minimum wages had a computer, 95% with Internet connections. However, in households with an average monthly income under 10 minimum wages, only 16% had a computer, 68% with Internet access.
2.1.3Unemployment
Youth unemployment constitutes a serious problem in Brazil, and one that appears to be worsening. A report by Márcio Pochmann, which analyzes data from PNAD/IBGE, reveals that over the past 10 years (1995-2005), unemployment among youth ages 15-24 increased more than in other age groups, with the unemployment rate at the end of the period being 107% higher than at the beginning (it was 9.5% higher for the rest of the population). In addition, for every 100 youth who entered the job market during the 10-year period, 55 became unemployed and just 45 found jobs. In 2005, almost 20% of youth ages 15-24 were unemployed (as compared with 6.2% for the rest of the population), a figure that is 70.2% higher than the rate for 1995. Young women had a higher rate of unemployment, 25%, as compared with 15.3% for young men. According to IBGE, between 1995 and 2005, youth ages 15-24 occupied 1.8 million of the 17.5 million new jobs created.
Another study on the topic, conducted in six large metropolitan areas for the 1983-2002 period, showed high job turnover rates for youth. This is one explanation for the high unemployment rate among youth in 2001, which was more than double that of the adult population (13.5% versus 5.2%). The study concluded that the high unemployment rate among youth is not due to the difficulty of finding a first job, since 80% of unemployed youth had worked before.
The lack of education is the root cause of youth unemployment. In the first quarter of 2008, 550,000 new jobs were created, or 39%, similar to the percentage for the previous year. In 2007, 1.6 million new jobs were generated, causing the unemployment rate in metropolitan areas to fall to an all-time low, 8.4%, according to IBGE. Another government survey (SINAE/MTE) found that 50% of the 1.9 million new jobs created in 2007 were not filled due to the lack of qualified workers.
In addition, according to the 2006 PNAD, 29.3% of youth studied exclusively whereas 17.7% both studied and worked. Less than half of those who studied, or 46.9%, were enrolled
22
INFORMATION AND COMMUNICATION TECHNOLOGY (ICTs) TRAINING, EMPLOYMENT AND YOUTH
in high school or institutions of higher learning (of these, only 33% studied in secondary school) because the majority had not completed primary school and 33.1% worked only. The remaining 20%6 neither worked nor studied and generally had less education and a lower household income. The national average monthly income of young households was 1.27 minimum wages, or R$ 427 (US $ 259).
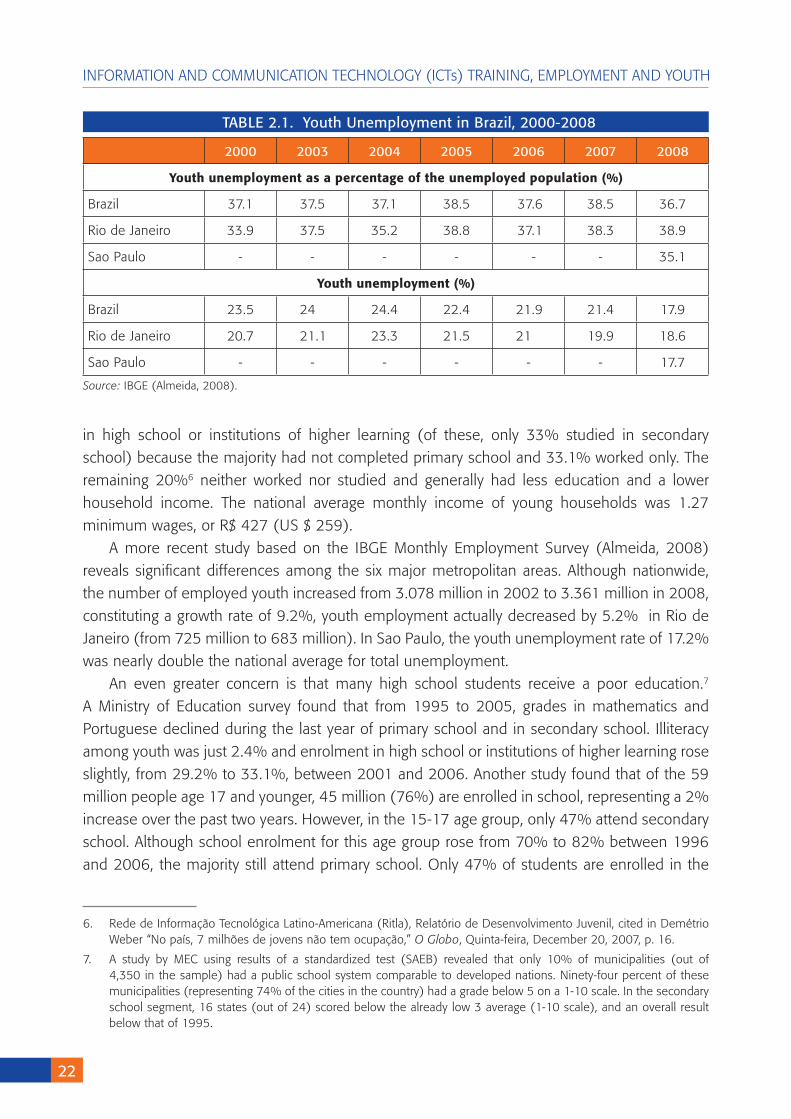
A more recent study based on the IBGE Monthly Employment Survey (Almeida, 2008) reveals significant differences among the six major metropolitan areas. Although nationwide, the number of employed youth increased from 3.078 million in 2002 to 3.361 million in 2008, constituting a growth rate of 9.2%, youth employment actually decreased by 5.2% in Rio de Janeiro (from 725 million to 683 million). In Sao Paulo, the youth unemployment rate of 17.2% was nearly double the national average for total unemployment.
An even greater concern is that many high school students receive a poor education.7
A Ministry of Education survey found that from 1995 to 2005, grades in mathematics and Portuguese declined during the last year of primary school and in secondary school. Illiteracy among youth was just 2.4% and enrolment in high school or institutions of higher learning rose slightly, from 29.2% to 33.1%, between 2001 and 2006. Another study found that of the 59 million people age 17 and younger, 45 million (76%) are enrolled in school, representing a 2% increase over the past two years. However, in the 15-17 age group, only 47% attend secondary school. Although school enrolment for this age group rose from 70% to 82% between 1996 and 2006, the majority still attend primary school. Only 47% of students are enrolled in the
6. Rede de Informação Tecnológica Latino-Americana (Ritla), Relatório de Desenvolvimento Juvenil, cited in Demétrio Weber “No país, 7 milhões de jovens não tem ocupação,” O Globo, Quinta-feira, December 20, 2007, p. 16.
7. A study by MEC using results of a standardized test (SAEB) revealed that only 10% of municipalities (out of 4,350 in the sample) had a public school system comparable to developed nations. Ninety-four percent of these municipalities (representing 74% of the cities in the country) had a grade below 5 on a 1-10 scale. In the secondary school segment, 16 states (out of 24) scored below the already low 3 average (1-10 scale), and an overall result below that of 1995.
2000 2003 2004 2005 2006 200� 200�
Youthunemploymentasapercentageoftheunemployedpopulation(%)
Brazil 37.1 37.5 37.1 38.5 37.6 38.5 36.7
Rio de Janeiro 33.9 37.5 35.2 38.8 37.1 38.3 38.9
Sao Paulo - - - - - - 35.1
Youthunemployment(%)
Brazil 23.5 24 24.4 22.4 21.9 21.4 17.9
Rio de Janeiro 20.7 21.1 23.3 21.5 21 19.9 18.6
Sao Paulo - - - - - - 17.7
TABLE 2.1. Youth Unemployment in Brazil, 2000-200�
Source: IBGE (Almeida, 2008).
THE CASE OF BRAZIL, COLOMBIA AND MEXICO
23
grade corresponding to their age. Similarly, in the 18-24 age group, 13% are still enrolled in primary school while 44% attend high school. However, school attendance among this age group rose from 28% to 32% during the period. Illiteracy rates are higher among lower-income groups, from a low of 1.3% for those earning more than two minimum wages to 18% for those earning less than half a minimum wage
2.1.4Governmentefforts
The Brazilian government recently (April 2008) announced several initiatives to close the digital divide. The first is a program to double the number of households with computers, to 24 million. Second, the government plans to increase the percentage of households with broadband to 25%, or 13.6 million. Finally, it is prioritizing a policy to ensure free broadband access to all 56,685 primary and secondary public schools (which enroll 87% of students), benefiting 37.2 million students by 2010. The service provision will be part of the mandatory universal service obligation of fixed telephony operators. An additional 7,000 rural schools will have broadband access through the Ministry of Communication’s GESAC satellite-based program and through a program to be implemented by mobile phone operators.
2.2.NGOs,ICT,CentersandEmployment
Brazil’s Digital Inclusion Map, which is being developed by MCT, will define 15,000 Internet access points, which do not include the rapidly growing (informal) LAN houses, particularly in low-income urban communities. Internet access via LAN houses increased by 30% in 2006, accounting for almost half (49%) of access in 2004, whereas home access remained stagnate at 40%.8 Non-governmental organizations often do not participate in operating these telecenters. Non-governmental organizations are in a key position to provide the capacity and infrastructure to the poorest segments of urban communities, to which most of the youth population belong.
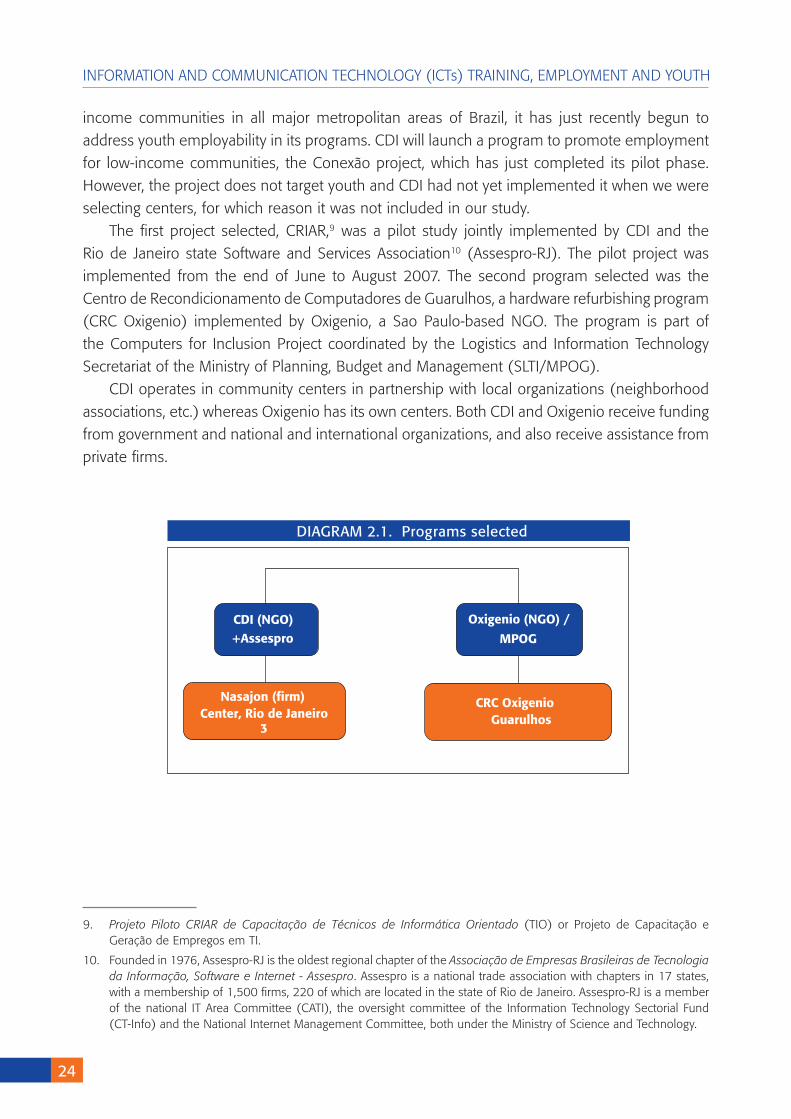
Two ICT capacity/infrastructure programs were selected for study in Brazil. Selection criteria focused on ICT-based programs targeting youth, preferably low-income youth. We attempted to identify ICT business programs for low-income youth; however, we could not find any that targeted youth specifically. Several ICT programs were identified that do not focus on employment and/or do not target youth specifically. Logistics and time constraints limited our search to the country’s two major metropolitan areas: Sao Paulo and Rio de Janeiro. For comparative purposes, we selected at least one program managed by the Committee for Democracy in Information Technology (CDI), an NGO that also has offices and programs in the two other countries in this study, Colombia and Mexico. Although CDI has several ICT programs in low-
8. Cetic.br, Pesquisa sobre uso da Tecnologia da Informação e da Comunicação no Brasil, a TIC Domicílios. www.cetic.br/usuarios/tic/2007/destaques-tic-2007.pdf
24
INFORMATION AND COMMUNICATION TECHNOLOGY (ICTs) TRAINING, EMPLOYMENT AND YOUTH
income communities in all major metropolitan areas of Brazil, it has just recently begun to address youth employability in its programs. CDI will launch a program to promote employment for low-income communities, the Conexão project, which has just completed its pilot phase. However, the project does not target youth and CDI had not yet implemented it when we were selecting centers, for which reason it was not included in our study.
The first project selected, CRIAR,9 was a pilot study jointly implemented by CDI and the Rio de Janeiro state Software and Services Association10 (Assespro-RJ). The pilot project was implemented from the end of June to August 2007. The second program selected was the Centro de Recondicionamento de Computadores de Guarulhos, a hardware refurbishing program (CRC Oxigenio) implemented by Oxigenio, a Sao Paulo-based NGO. The program is part of the Computers for Inclusion Project coordinated by the Logistics and Information Technology Secretariat of the Ministry of Planning, Budget and Management (SLTI/MPOG).
CDI operates in community centers in partnership with local organizations (neighborhood associations, etc.) whereas Oxigenio has its own centers. Both CDI and Oxigenio receive funding from government and national and international organizations, and also receive assistance from private firms.
9. Projeto Piloto CRIAR de Capacitação de Técnicos de Informática Orientado (TIO) or Projeto de Capacitação e Geração de Empregos em TI.
10. Founded in 1976, Assespro-RJ is the oldest regional chapter of the Associação de Empresas Brasileiras de Tecnologia da Informação, Software e Internet - Assespro. Assespro is a national trade association with chapters in 17 states, with a membership of 1,500 firms, 220 of which are located in the state of Rio de Janeiro. Assespro-RJ is a member of the national IT Area Committee (CATI), the oversight committee of the Information Technology Sectorial Fund (CT-Info) and the National Internet Management Committee, both under the Ministry of Science and Technology.
CDI (NGO) +Assespro
Oxigenio (NGO) /
MPOG
Nasajon (firm) Center, Rio de Janeiro
3
CRC Oxigenio Guarulhos
DIAGRAM 2.1. Programs selected
THE CASE OF BRAZIL, COLOMBIA AND MEXICO
25
Oxigenio – Implementation of Social and Public Policies
Oxigenio offers more than a dozen professional training programs at its main center (Consórcio Social da Juventude de Guarulhos—CSJ) in the low-income community of Guarulhos, in partnership with the Ministry of Labor and Employment (MTE), and at its own center. It has three other digital inclusion projects besides CRC Oxigenio: Imagine Cup, which targets youth ages 15-24, part of MTE’s Program to Promote Working Youth;11 and the Social Inclusion through Digital Inclusion Program, targeting siblings and other relatives of youth participating in the CSJ, in partnership with Microsoft. These also operate in the Guarulhos neighborhood. The other Oxigenio project, the school-based Student Monitoring Program, is also implemented in partnership with Microsoft. That program works with young people ages 14 and up in the greater Sao Paulo metropolitan area. In late 2007, Microsoft12 asked Oxigenio and the MTE to manage and coordinate a training program for young employees (ages 16-24) of 24 organizations participating in the CSJ, who will participate in an IT course for digital inclusion instructors.
Committee for Democracy in Information Technology (CDI) 13
Rodrigo Bagio founded CDI in the low-income community of Santa Marta in Rio de Janeiro in 1995. Today, CDI has 25 regional offices in Brazil and nine offices in other South American countries (Argentina, Chile, Colombia, Ecuador and Uruguay) and in North America (Mexico-1 and United States-2) and Africa (South Africa-1). It has 642 IT technology and citizens’ rights schools (EICs) in Brazil and 198 abroad. In 2006, it trained 62,000 people with support from 1,755 instructors and 1,069 volunteers.
Its mission is to promote the social inclusion of vulnerable groups through the use of ICTs as tools for the construction and exercise of citizenship. CDI’s objectives are to: 1- provide access to new ICTs; 2- help clients develop marketable technical skills to increase their employment potential; and 3- promote community involvement and civic awareness and help community leaders to thrive. Each EIC results from a partnership between CDI and a community center or other community-based or social organization recognized by the community.
CDI receives funding from a variety of sources: 30% from national foundations; 30% from private firms (Vale, Accenture, Philips, Exxon, Microsoft, etc.); 23% from international foundations (including the Kellogg Foundation, Skoll Foundation and Avina); and 16% from international development agencies (USAID) and organizations (IDB).
11. Formerly known as Programa Nacional de Estímulo ao Primeiro Emprego para Jovens (PNPE), which has assisted 80,000 youth since 2003. Since 2006, 26 organizations participating in MTE’s CSJ program have trained 30,520 young people, 12,479 of which found employment.
12. Microsoft will donate R$ 4 million for training instructors, software and teaching materials developed for digital inclusion programs.
13. This section is based on the following: Case Study: Committee for IT Democratization – Brazil; Moisés Barreto, apresentação CONCAHR 2007 – XVIII Human Resources Catarin Congress, and the author’s interview with Danielle Affonso, CDI-RJ, April 4, 2008.
26
INFORMATION AND COMMUNICATION TECHNOLOGY (ICTs) TRAINING, EMPLOYMENT AND YOUTH
Information technology plays a key role in the Rio de Janeiro regional economy, the nation’s second-largest software producer (behind Sao Paulo), with an estimated 9,800 software firms. It is a growing market that requires qualified professionals. One criterion firms use when deciding which software packet to purchase is the number of people who know how to operate it. Having a large number of specialists in their products gives local firms a competitive advantage.
The main objective of the CRIAR project is to «increase the employment opportunities and the quality of life of youth residing in low-income communities of Rio de Janeiro.» CDI’s main partner in the CRIAR program was ASESSPRO-RJ, which jointly designed the program with the Nasajon Sistemas software firm, whose president is also president of ASESSPRO-RJ, which conducted the pilot project. Six other member firms of ASESSPRO-RJ joined the project and 30 expressed an interest in participating in future programs, but none have been launched to date (May 2008). Originally, the program objective was to train 1,000 young people. Nasajon developed the program curriculum. Nasajon was interested because it had developed an internal project for capacity-building and infrastructure called ApoiaRH (Human Resources Support) to select and train software operators from among employees’ relatives and friends. There are several differences between CRIAR and ApoiaRH. First, CRIAR’s objective was to train trainers who would then train professionals that could be employed by clients. Nasajon Sistemas has 3,000 clients, 1,200 of which are in Rio de Janeiro. Its client call center receives approximately 6,000 calls per month, several requesting professionals. To meet demand, Nasajon hires three or four new software operators each month. ApoiaRH is a 40-hour weekly course whereas CRIAR is taught three afternoons per week. ApoiaRH seeks to train 50 professionals annually whereas CRIAR has the possibility of training 100-300 professionals through its trainers, another selling point that convinced Nasajon to implement the CRIAR pilot project.
2.3.Internalanalysis:relevanceforthelabormarket
As mentioned, NGO organizational capacity plays a key role in program beneficiaries’ future employment success. For this reason, this study analyzed NGO organizational tools, including infrastructure, available resources, financing sources, instructors, tracking of graduates and job placement.
With respect to infrastructure, the CRC program in Guarulhos, Sao Paulo, is carried out in the Espaço Social Oxigênio, a spacious building donated by the government airport administration authority (Infraero), located next to Sao Paulo’s Cumbica / Guarulhos international airport. The center is well equipped with 120 computers, 60 with Internet access. Each workstation in the refurbishing chain has a certified technician and an apprentice who works two (2007)/ four (2008) hours per day. The center is open five days a week (40 hours) and does not charge for the use of its computers. On an average day, 120 registered users utilize the center’s facilities. The center’s main advantages are price, equipment and local capacity/infrastructure. The center reports that users most frequently use computers to prepare and send resumes, search for employment and obtain public information. Usually generally have a high school education, are
THE CASE OF BRAZIL, COLOMBIA AND MEXICO
2�
age 30 or under and spend an average of four hours on the computer. The Internet, leaflets, word-of-month and instructors all help publicize the center’s activities. Specific, high-profile events of the center are advertised in local newspapers and magazines and on television.
The CRIAR project took place in the Nasajon Sistemas corporate training center in downtown Rio de Janeiro, which is fully equipped with modern computer equipment and powerful servers. It has 16 Pentium IV computers with high-speed broadband connections, Persona –Folha de Pagamento and other basic software (Windows, Linux, Acrobat, Explorer, Power Point, Photoshop).
Resources are a key input for NGO development. CRC Oxigenio is funded by SLTI/MPOG, which pays the salary of the general coordinator and also receives software, financial and training donations from Microsoft. The SLTI/MPOG covers the cost of human resources, equipment and transportation for receipt and delivery of donations.
CRIAR was funded entirely by corporate partner Nasajon Sistemas, which covered instructors’ salaries and classroom operating costs. CDI was responsible for selecting beneficiaries. Nasajon Sistemas’ human resources supervisor and human resources director also contributed their time to manage the program’s partnership with CDI.
CDI-RJ selected 20 EIC-trained candidates and identified those interested in earning an income. Ten EIC sent 30 candidates, 15 of whom were admitted into the program: 12 students (educandos) and four EIC instructors (educadores). One instructor resigned for personal reasons. Candidates who were not selected were given feedback on the problems identified in their admission exam and were encouraged to obtain further EIC training. CDI-RJ’s Pedagogical Coordinator designed the selection tool based on command of the Portuguese language (communication and expression) and mathematics, as well as general and IT knowledge. The EIC coordinator noted that candidates performed poorly in these subjects and arranged for two EICs to provide extra training in math and Portuguese to six candidates. Candidates also wrote an essay on their expectations regarding the course. An CDI-RJ evaluation coordinator monitored the course.
According to the CRC coordinator, center courses in program capacity/infrastructure address topics such as growing demand for ICT; the rapid incorporation of beneficiaries into the labor market; providing youth with basic training that enables them to choose their own ICT field; and, indirectly, the rapid dissemination of open source software. Ultimately, the program’s goal is to develop alternatives for generating income and benefiting the wider community. To this end, a survey was conducted in the region to identify demand.
Advertising and community activities are used to market/disseminate the program. For example, partnerships are being established with Linux distributor Ubunto. Besides its main activity of computer refurbishing, CRC Oxigenio is also advertised as a program that provides training in computer repair and maintenance, as well as installation and configuration of free software.
The skills-based curriculum focuses on hardware and computer maintenance and repair (35% of courses) while the remaining courses concentrate on training in the use of the Internet and word processing, spreadsheet, presentation and database software. Beneficiaries are also
2�
INFORMATION AND COMMUNICATION TECHNOLOGY (ICTs) TRAINING, EMPLOYMENT AND YOUTH
taught business and management skills. The curriculum includes a module on digital inclusion, mainly open source software, as well as hands-on experience in the refurbishing workshop. By the end of the program, beneficiaries have acquired skills in both hardware and software.
CRIAR’s objective was to train instructors who would then train a large number of software technicians in their respective communities (in EICs). The CRIAR project offered 12 three-hour classes twice a week from June 26 to August 1, 2007.
The program included:
l Payroll software theory.
l Practical experience with the Persona Gold Payroll Software.
l Q&A session on Persona Gold Payroll Software.
l Personal marketing skills.
l Final evaluation (written and oral exams).
Before learning how to operate the Persona Gold Payroll Software, students learned the basics of labor law and labor-related calculations. In addition, they were taught personal marketing skills (how to prepare a resume, how to behave in front of students, how to dress properly, etc.). Nasajon HR specialists also led discussions on how to address the problem of social discrimination in the workplace.
Well-trained instructors are needed for the courses to be successful. While both programs had trained instructors, CRIAR used the same experienced instructors that are trained to use the company’s software and have learned good work habits for dealing with company clients.
CRC Oxigenio instructors work full time for the program and have at least a secondary school education (one has a university degree). They have been working with the program for at least a year.
CRC Oxigenio has 26 instructors, six of whom are full-time employees paid by the NGO and 20 of whom are part-time volunteers, usually former students. Most are high school graduates. No CRC Oxigenio instructor had received teacher training but two out of three had earned a certificate in the subject they teach. The program’s two main coordinators hold university degrees and one is pursuing graduate work.
CRC Oxigenio instructors believe that what students learn in the course will help them to perform computer maintenance work, an activity with high market demand. However, they do not believe that students are capable of developing their own ICT products or services without further university-level training. Most instructors agree that incoming students have no previous knowledge of basic ICT concepts. However, they disagree with respect to several other student characteristics. They report that students are familiar with some basic elements but do not know how to use them correctly; that they are familiar with some software programs used in the course and want to improve their skills; that they want to take courses in advanced programs; and that they are seeking a diploma/certificate. Instructors agree that after completing the course, students are generally familiar with ICT terminology, software operation and hardware maintenance and have basic programming skills. They also believe that program graduates
THE CASE OF BRAZIL, COLOMBIA AND MEXICO
2�
are familiar with different electronic technologies and have the capability to assess the most appropriate; that they have the ability to analyze, obtain and use information; and that they can use other tools and software programs and communicate and/or publish ideas using a word processing program, email and or web design tools.
CRIAR employs two Nasajon employees as full-time instructors. They have university degrees and are certified in human resource management. Their salaries range from USD 751 to USD 1,500. In addition to the Nasajon full-time instructors, 60% of the firm’s software programmers are capable of teaching. The human resources supervisor was the class coordinator. Instructors teach an average of one to three courses per year, with anywhere from eleven to 20 students per class. None have taken teaching training courses. Nasajon Sistemas is ISO/900 certified, for which reason students evaluate all instructors at the end of the course. Instructors believe that incoming students have no knowledge of basic ICT concepts, are familiar with some programs and want to learn others and are familiar with some basic elements but do not know how to use them correctly. They believe that the main skills students acquired in the course were to analyze, extract and use information and to learn other tools and software.
Instructors test students during and at the end of the CRC Oxigenio course. Students also prepare a self-evaluation and complete a satisfaction survey at the end of the course. Students who have successfully completed the course receive a certificate. Instructors are also evaluated through a questionnaire and results are discussed in an evaluation seminar. A planning workshop is also held at the beginning of each course. The program is evaluated annually by SLTI/MPOG, which provides feedback for improving the program. Project coordinators of the SLTI/MPOG CI Program also meet annually. The program is part of the Brazilian government’s Digital Inclusion Program.
CDI-RJ, ASESSPRO-RJ and Nasajon Sistemas awarded an IT qualification certificate to 10 students who completed the course and passed the final written exam (11) given by Nasajon Sistemas instructors of the CRIAR Capacity Building and IT Employment Generation project, especially to operate the proprietary Persona software. Nasajon Sistemas also conducted a client satisfaction survey. Results were discussed in program evaluation meetings.
CRC Oxigenio graduates are listed in a database and follow up is made by phone. Instructors may visit graduates and contact them via chat rooms and other means. The CRC Oxigenio job placement service tracks graduates.
CDI-RJ did some follow-up of graduates, but when we contacted the organization in February/March to obtain their names and contact information, CDI-RJ could not provide them. Some graduates meet regularly in chat rooms (Orkut). We conducted two interviews via MSN.
CDI-RJ and Nasajon representatives met a few times to evaluate the pilot project and identify and discuss problems. During the second meeting, participants agreed that course graduates would not be capable of becoming trainers of trainers at their EICs, as originally planned. They decided that the graduates would be candidates for future classes (in 2008) of the ApoiaRH internal capacity and infrastructure program of Nasajon Sistemas. Thus the main objective of the CRIAR program would be job training rather than training of trainers. As of May 2008, Assespro and CDI-RJ had not yet decided on a follow-up to the pilot CRIAR program.
30
INFORMATION AND COMMUNICATION TECHNOLOGY (ICTs) TRAINING, EMPLOYMENT AND YOUTH
CRC Oxigenio has an employment agency, Agência Pró-Emprego, which places candidates in the federal Young Apprentices Program (Lei do Aprendiz) in IT support, administrative and operational positions. In 2007, the agency placed 34 candidates. Oxigenio is also making an effort to establish more partnerships with local firms (for example, Duty-Free, Atacadão, McDonalds, Brilho Próprio, Anvisa, Satã and Auxiliar Empregos) and promote events at its Guarulhos center to disseminate its programs among partner and sponsor firms and government organizations to foster placement of program beneficiaries in these entities. For example, in December 2007, Oxigenio’s employment agency organized the Ação Pró-Emprego at the center to help graduates find jobs and to register future candidates in the database. Partners at the event included the employment agencies Total Empregos, Via Net Estágios and Auxiliar Empregos. The director of the Professional Hairstylist Federation helped candidates look their best for their job interviews. CRC-Oxigenio presented the candidates to firm representatives.
Resumes of CRIAR graduates were incorporated into the ASSESPRO-RJ Human Resources database. CDI’s partner NGO, Rede Cidadã, tracked graduates’ employment status. By October 2007, one graduate had found a job at a German multinational firm through the CDI-RJ Pedagogic Coordination Office.
In a follow-up by the CDI-RJ pedagogy coordinator, the employer reported that the employee (CRIAR graduate) required additional guidance and monitoring for a year.
CRC Oxigenio was able to establish closer partnerships with potential employers in the region through its employment agency, Agência Pró-Emprego, after it better identified demand, which had been pointed out as a program weakness.
As mentioned, CDI-RJ formed an important partnership with ASSESPRO-RJ/Najason Sistemas for developing and implementing the CRIAR program. CDI-RJ also established a partnership for employment generation with another NGO in Minas Gerais, Rede Cidadã, to the Conexão program, although this partnership has not yet produced results. The Conexão project was launched in August 2007 and will help 1,200 youth (ages 16-30) who are enrolled in or graduating from secondary school to find jobs. This program also has the three-year support of the Accenture consulting firm, which provides tools for managing the project and database. The program goal is to find employment for 250 youth and train 12 individuals to become community entrepreneurs within nine months.
CDI-RJ’s Second Digital Inclusion Week took place March 24-28, 2008 at several EICs (Sapucaia, Centro Cultural da Light, Associação de Moradores de Vila Pauline, Instituto Municipal Nise da Silveira, Casa de Artes do Terreirão and Centro de Integração Social e Cultural). As part of the week’s activities, Conexão Project Coordinator Danielle Affonso gave a talk on good practices during job interviews.
Program weaknesses
Although the youth participating in the CRIAR program acknowledged the excellent quality of the training, particularly with respect to job orientation, they regret not having full access to the Persona software. They say they do not have the opportunity to practice their newly-acquired
THE CASE OF BRAZIL, COLOMBIA AND MEXICO
31
skills. This is because the Persona software is a specialized, proprietary software not available to beneficiaries outside the company’s training facilities, which are located far from the homes of most CRIAR beneficiaries. For this reason, graduates have not been able to practice the skills acquired in the course and are now losing them.
2.4.Externalanalysis:ICTs,youthandthelabormarket
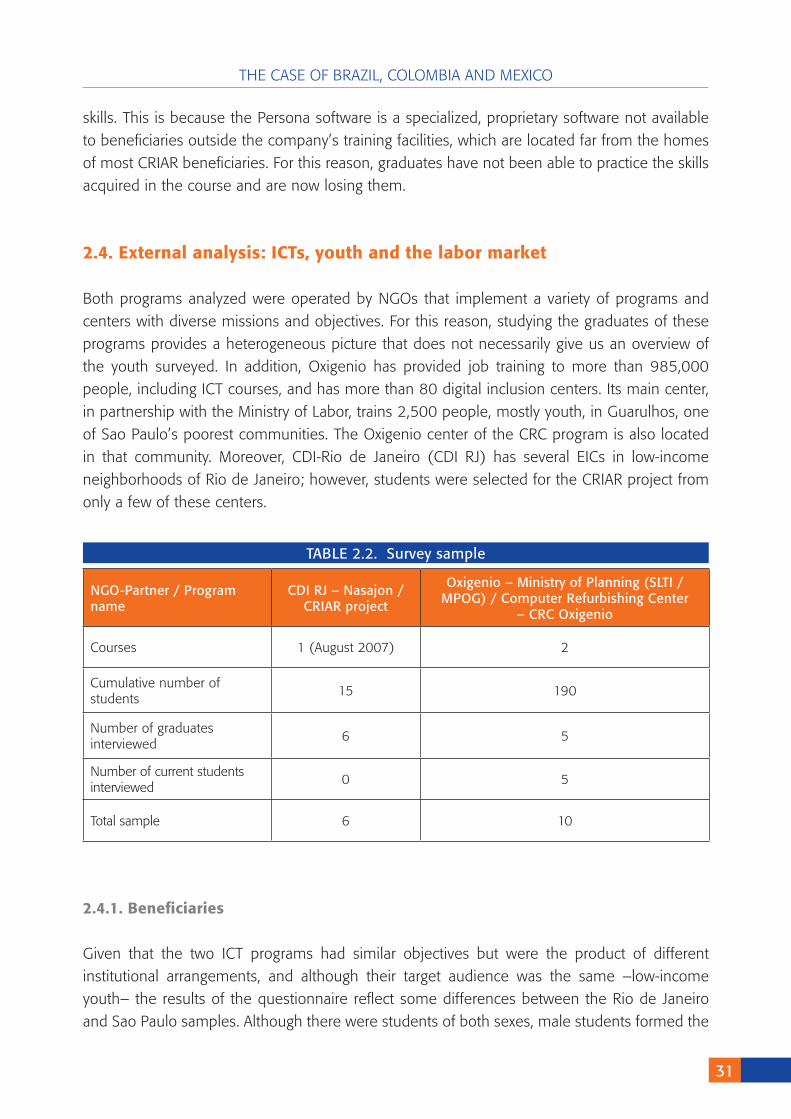
Both programs analyzed were operated by NGOs that implement a variety of programs and centers with diverse missions and objectives. For this reason, studying the graduates of these programs provides a heterogeneous picture that does not necessarily give us an overview of the youth surveyed. In addition, Oxigenio has provided job training to more than 985,000 people, including ICT courses, and has more than 80 digital inclusion centers. Its main center, in partnership with the Ministry of Labor, trains 2,500 people, mostly youth, in Guarulhos, one of Sao Paulo’s poorest communities. The Oxigenio center of the CRC program is also located in that community. Moreover, CDI-Rio de Janeiro (CDI RJ) has several EICs in low-income neighborhoods of Rio de Janeiro; however, students were selected for the CRIAR project from only a few of these centers.
2.4.1.Beneficiaries
Given that the two ICT programs had similar objectives but were the product of different institutional arrangements, and although their target audience was the same –low-income youth– the results of the questionnaire reflect some differences between the Rio de Janeiro and Sao Paulo samples. Although there were students of both sexes, male students formed the
NGO-Partner / Program name
CDI RJ – Nasajon / CRIAR project
Oxigenio – Ministry of Planning (SLTI / MPOG) / Computer Refurbishing Center
– CRC Oxigenio
Courses 1 (August 2007) 2
Cumulative number ofstudents
15 190
Number of graduatesinterviewed
6 5
Number of current students interviewed
0 5
Total sample 6 10
TABLE 2.2. Survey sample
32
INFORMATION AND COMMUNICATION TECHNOLOGY (ICTs) TRAINING, EMPLOYMENT AND YOUTH
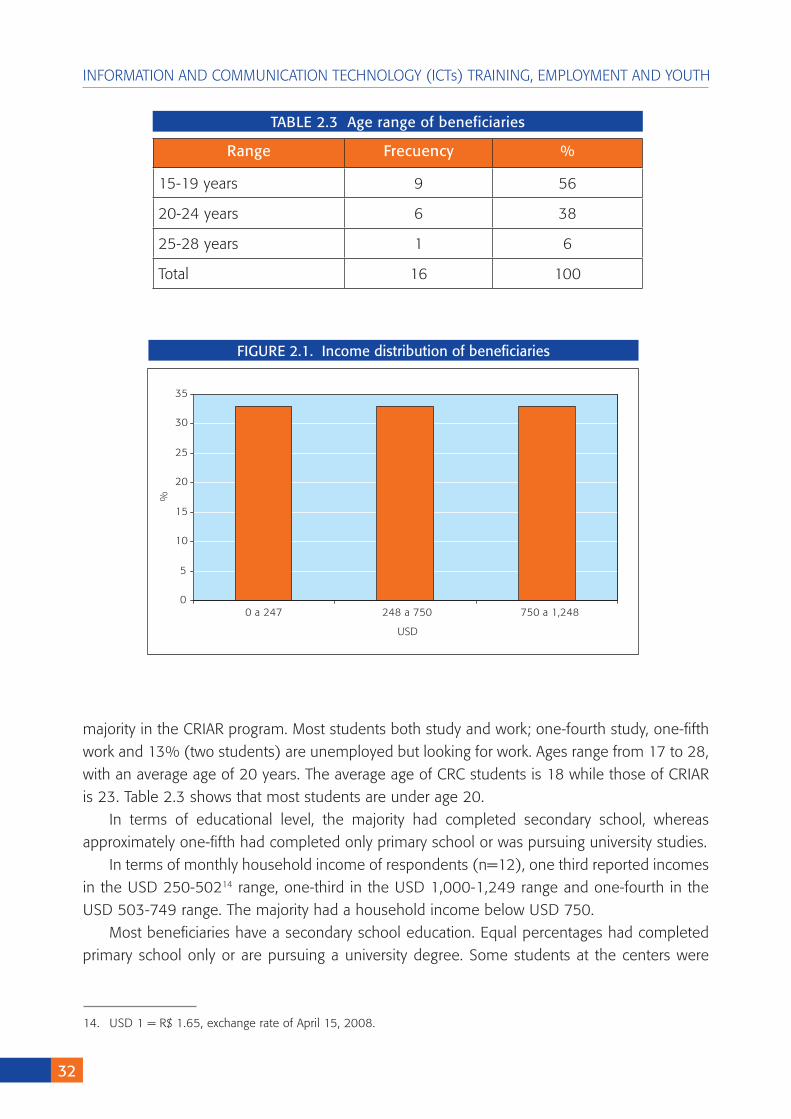
majority in the CRIAR program. Most students both study and work; one-fourth study, one-fifth work and 13% (two students) are unemployed but looking for work. Ages range from 17 to 28, with an average age of 20 years. The average age of CRC students is 18 while those of CRIAR is 23. Table 2.3 shows that most students are under age 20.
In terms of educational level, the majority had completed secondary school, whereas approximately one-fifth had completed only primary school or was pursuing university studies.
In terms of monthly household income of respondents (n=12), one third reported incomes in the USD 250-50214 range, one-third in the USD 1,000-1,249 range and one-fourth in the USD 503-749 range. The majority had a household income below USD 750.
Most beneficiaries have a secondary school education. Equal percentages had completed primary school only or are pursuing a university degree. Some students at the centers were
Range Frecuency %
15-19 years 9 56
20-24 years 6 38
25-28 years 1 6
Total 16 100
TABLE 2.3 Age range of beneficiaries
14. USD 1 = R$ 1.65, exchange rate of April 15, 2008.
FIGURE 2.1. Income distribution of beneficiaries
0
5
10
15
20
25
30
35
USD
%
0 a 247 248 a 750 750 a 1,248
THE CASE OF BRAZIL, COLOMBIA AND MEXICO
33
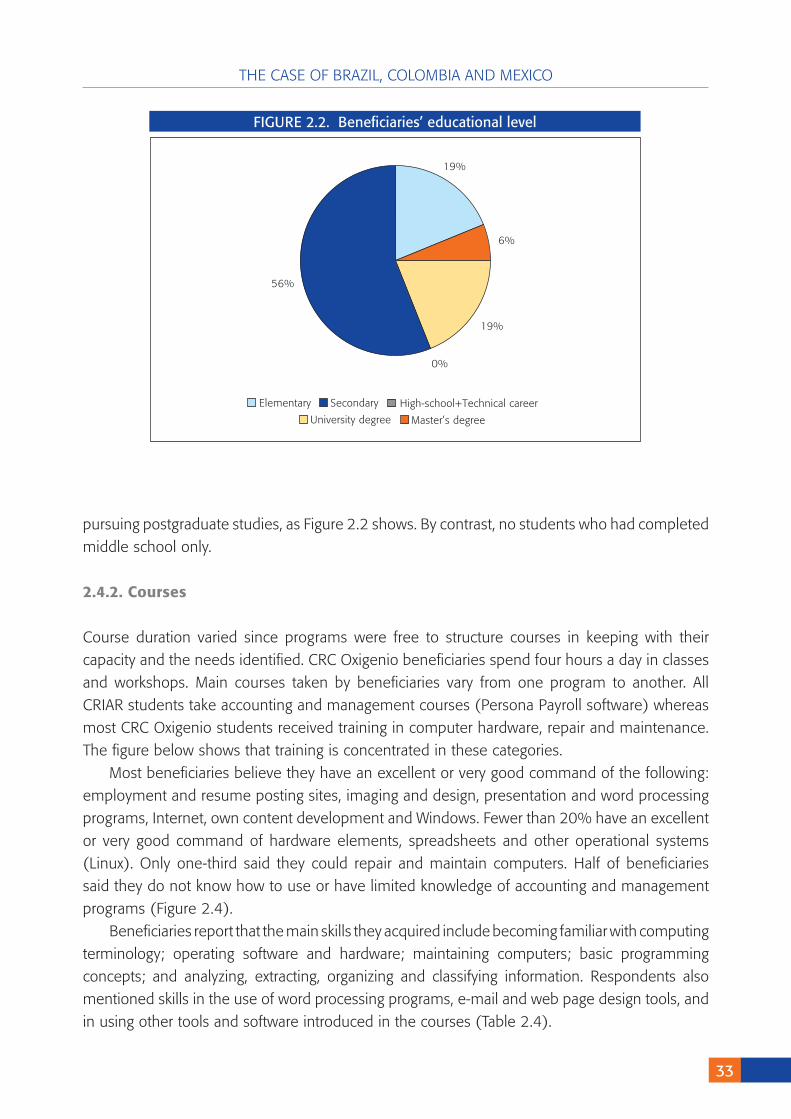
pursuing postgraduate studies, as Figure 2.2 shows. By contrast, no students who had completed middle school only.
2.4.2.Courses
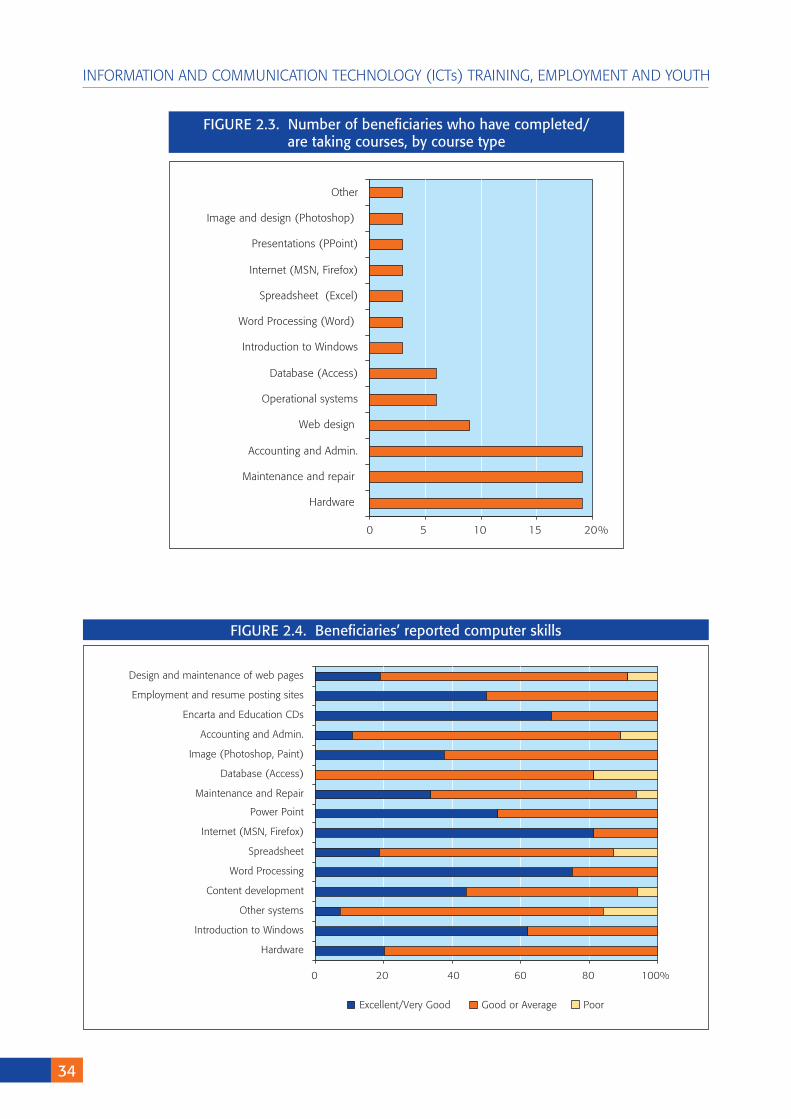
Course duration varied since programs were free to structure courses in keeping with their capacity and the needs identified. CRC Oxigenio beneficiaries spend four hours a day in classes and workshops. Main courses taken by beneficiaries vary from one program to another. All CRIAR students take accounting and management courses (Persona Payroll software) whereas most CRC Oxigenio students received training in computer hardware, repair and maintenance. The figure below shows that training is concentrated in these categories.
Most beneficiaries believe they have an excellent or very good command of the following: employment and resume posting sites, imaging and design, presentation and word processing programs, Internet, own content development and Windows. Fewer than 20% have an excellent or very good command of hardware elements, spreadsheets and other operational systems (Linux). Only one-third said they could repair and maintain computers. Half of beneficiaries said they do not know how to use or have limited knowledge of accounting and management programs (Figure 2.4).
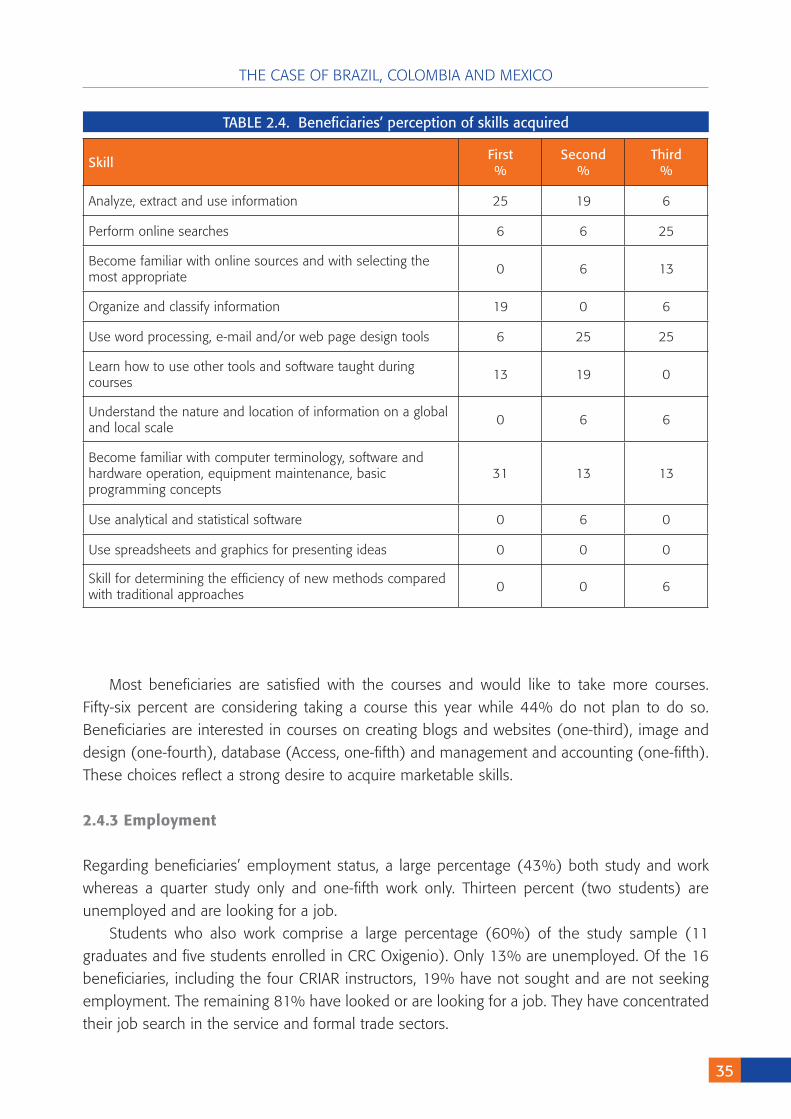
Beneficiaries report that the main skills they acquired include becoming familiar with computing terminology; operating software and hardware; maintaining computers; basic programming concepts; and analyzing, extracting, organizing and classifying information. Respondents also mentioned skills in the use of word processing programs, e-mail and web page design tools, and in using other tools and software introduced in the courses (Table 2.4).
FIGURE 2.2. Beneficiaries’ educational level
19%
6%
19%
0%
56%
Elementary Secondary High-school+Technical career
University degree Master’s degree
34
INFORMATION AND COMMUNICATION TECHNOLOGY (ICTs) TRAINING, EMPLOYMENT AND YOUTH
FIGURE 2.3. Number of beneficiaries who have completed/are taking courses, by course type
0 5 10 15 20
Hardware
Maintenance and repair
Accounting and Admin.
Web design
Operational systems
Database (Access)
Introduction to Windows
Word Processing (Word)
Spreadsheet (Excel)
Internet (MSN, Firefox)
Presentations (PPoint)
Image and design (Photoshop)
Other
%
0 20 40 60 80 100%
Hardware
Introduction to Windows
Other systems
Content development
Word Processing
Spreadsheet
Internet (MSN, Firefox)
Power Point
Maintenance and Repair
Database (Access)
Image (Photoshop, Paint)
Accounting and Admin.
Encarta and Education CDs
Employment and resume posting sites
Design and maintenance of web pages
Excellent/Very Good Good or Average Poor
FIGURE 2.4. Beneficiaries’ reported computer skills
THE CASE OF BRAZIL, COLOMBIA AND MEXICO
35
Most beneficiaries are satisfied with the courses and would like to take more courses. Fifty-six percent are considering taking a course this year while 44% do not plan to do so. Beneficiaries are interested in courses on creating blogs and websites (one-third), image and design (one-fourth), database (Access, one-fifth) and management and accounting (one-fifth). These choices reflect a strong desire to acquire marketable skills.
2.4.3Employment
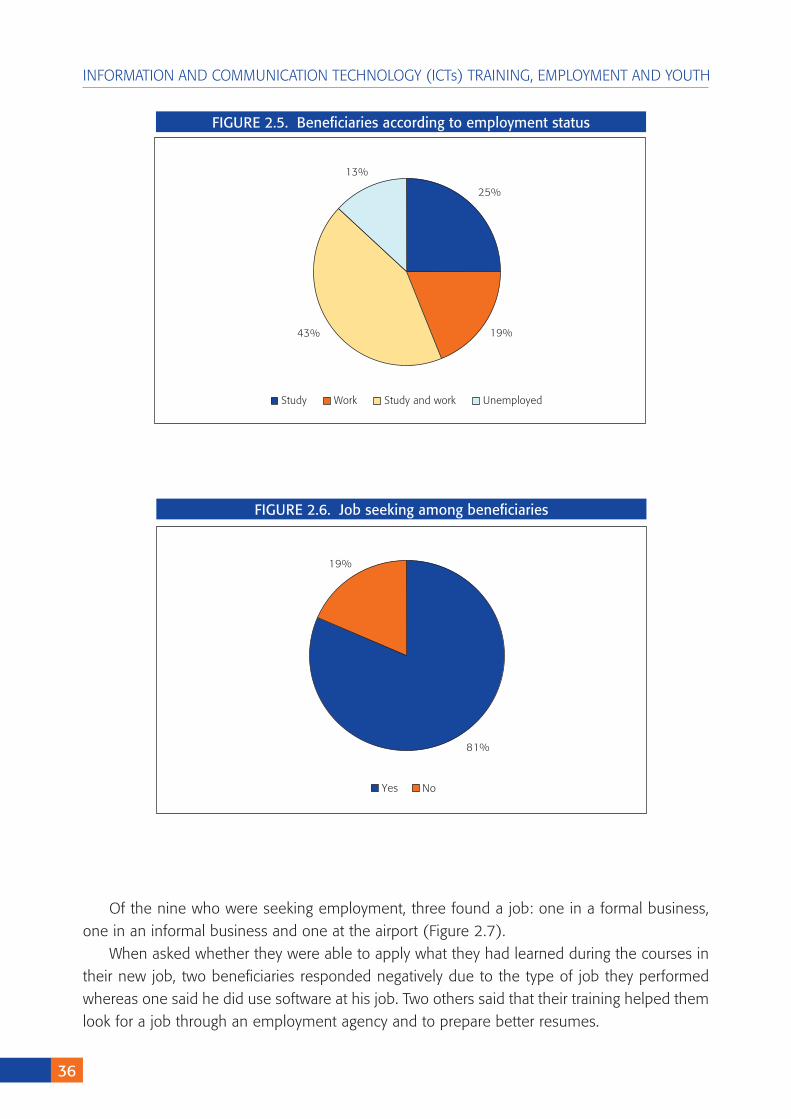
Regarding beneficiaries’ employment status, a large percentage (43%) both study and work whereas a quarter study only and one-fifth work only. Thirteen percent (two students) are unemployed and are looking for a job.
Students who also work comprise a large percentage (60%) of the study sample (11 graduates and five students enrolled in CRC Oxigenio). Only 13% are unemployed. Of the 16 beneficiaries, including the four CRIAR instructors, 19% have not sought and are not seeking employment. The remaining 81% have looked or are looking for a job. They have concentrated their job search in the service and formal trade sectors.
Skill First%
Second%
Third%
Analyze, extract and use information 25 19 6
Perform online searches 6 6 25
Become familiar with online sources and with selecting the most appropriate
0 6 13
Organize and classify information 19 0 6
Use word processing, e-mail and/or web page design tools 6 25 25
Learn how to use other tools and software taught duringcourses
13 19 0
Understand the nature and location of information on a global and local scale
0 6 6
Become familiar with computer terminology, software and hardware operation, equipment maintenance, basicprogramming concepts
31 13 13
Use analytical and statistical software 0 6 0
Use spreadsheets and graphics for presenting ideas 0 0 0
Skill for determining the efficiency of new methods compared with traditional approaches
0 0 6
TABLE 2.4. Beneficiaries’ perception of skills acquired
36
INFORMATION AND COMMUNICATION TECHNOLOGY (ICTs) TRAINING, EMPLOYMENT AND YOUTH
FIGURE 2.5. Beneficiaries according to employment status
25%
19%43%
13%
Study Work Study and work Unemployed
FIGURE 2.6. Job seeking among beneficiaries
81%
19%
Yes No
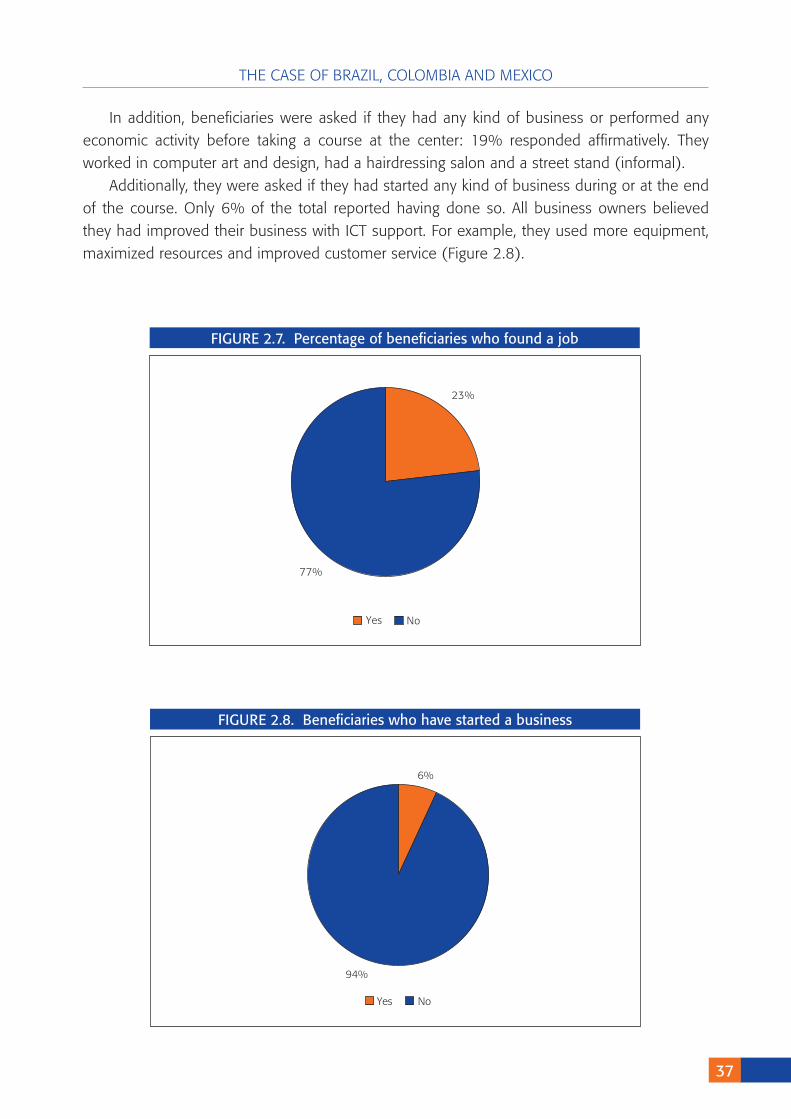
Of the nine who were seeking employment, three found a job: one in a formal business,
one in an informal business and one at the airport (Figure 2.7). When asked whether they were able to apply what they had learned during the courses in
their new job, two beneficiaries responded negatively due to the type of job they performed whereas one said he did use software at his job. Two others said that their training helped them look for a job through an employment agency and to prepare better resumes.
THE CASE OF BRAZIL, COLOMBIA AND MEXICO
3�
In addition, beneficiaries were asked if they had any kind of business or performed any economic activity before taking a course at the center: 19% responded affirmatively. They worked in computer art and design, had a hairdressing salon and a street stand (informal).
Additionally, they were asked if they had started any kind of business during or at the end of the course. Only 6% of the total reported having done so. All business owners believed they had improved their business with ICT support. For example, they used more equipment, maximized resources and improved customer service (Figure 2.8).
FIGURE 2.�. Percentage of beneficiaries who found a job
23%
77%
Yes No
FIGURE 2.�. Beneficiaries who have started a business
6%
94%
Yes No
3�
INFORMATION AND COMMUNICATION TECHNOLOGY (ICTs) TRAINING, EMPLOYMENT AND YOUTH
2.4.4Digitalexclusion
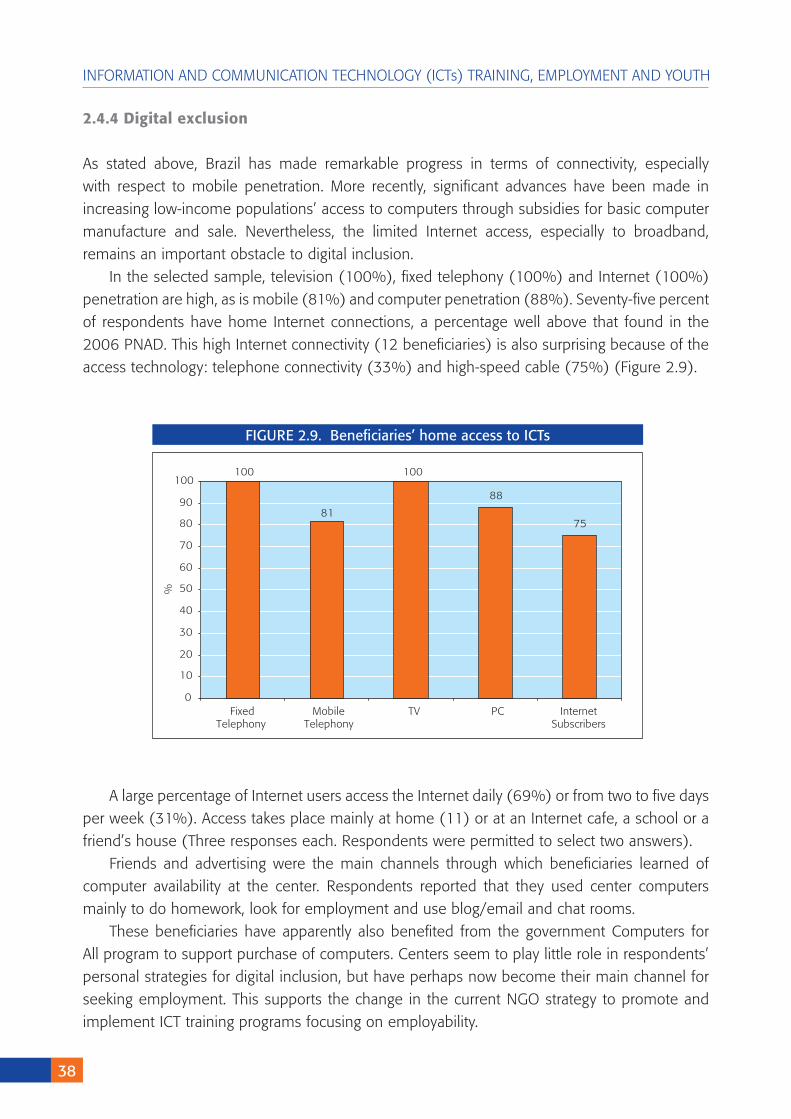
As stated above, Brazil has made remarkable progress in terms of connectivity, especially with respect to mobile penetration. More recently, significant advances have been made in increasing low-income populations’ access to computers through subsidies for basic computer manufacture and sale. Nevertheless, the limited Internet access, especially to broadband, remains an important obstacle to digital inclusion.
In the selected sample, television (100%), fixed telephony (100%) and Internet (100%) penetration are high, as is mobile (81%) and computer penetration (88%). Seventy-five percent of respondents have home Internet connections, a percentage well above that found in the 2006 PNAD. This high Internet connectivity (12 beneficiaries) is also surprising because of the access technology: telephone connectivity (33%) and high-speed cable (75%) (Figure 2.9).
FIGURE 2.�. Beneficiaries’ home access to ICTs
100
81
100
88
75
0
10
20
30
40
50
60
70
80
90
100
Fixed Mobile TV PC InternetTelephony Telephony Subscribers
%
A large percentage of Internet users access the Internet daily (69%) or from two to five days per week (31%). Access takes place mainly at home (11) or at an Internet cafe, a school or a friend’s house (Three responses each. Respondents were permitted to select two answers).
Friends and advertising were the main channels through which beneficiaries learned of computer availability at the center. Respondents reported that they used center computers mainly to do homework, look for employment and use blog/email and chat rooms.
These beneficiaries have apparently also benefited from the government Computers for All program to support purchase of computers. Centers seem to play little role in respondents’ personal strategies for digital inclusion, but have perhaps now become their main channel for seeking employment. This supports the change in the current NGO strategy to promote and implement ICT training programs focusing on employability.
3�
3.1Poverty,theDigitalDivideandUnemploymentinColombia
3.1.1.Poverty
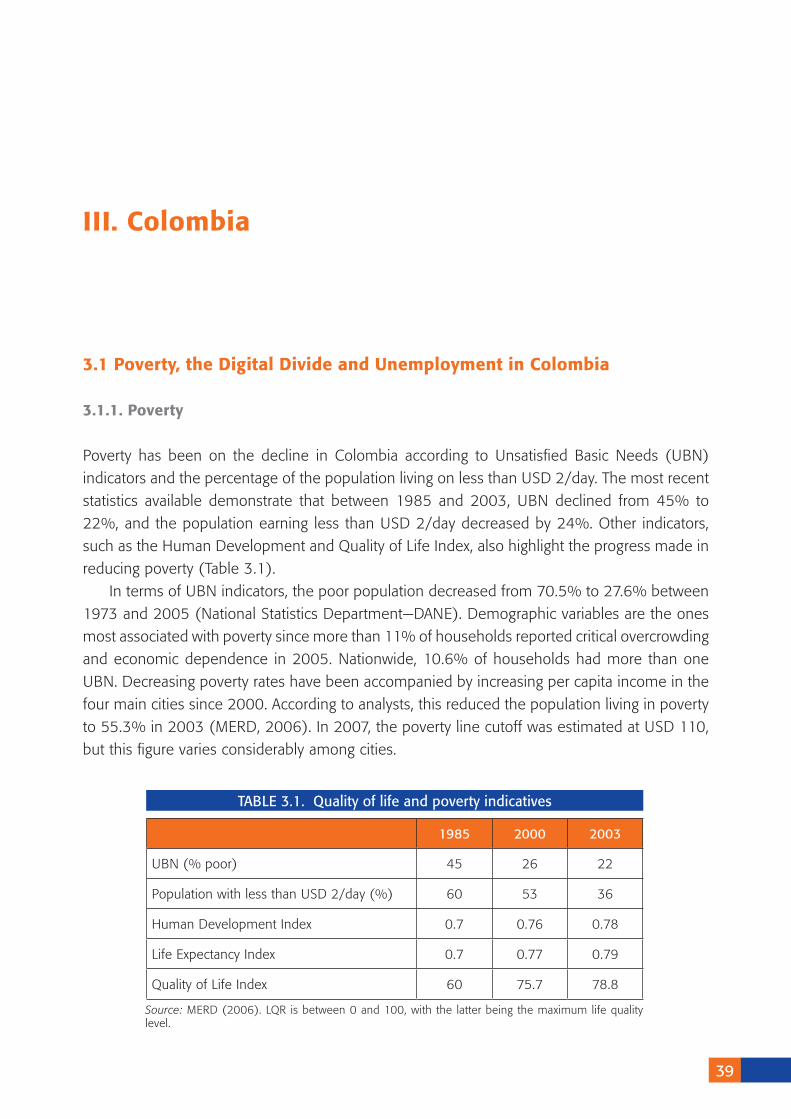
Poverty has been on the decline in Colombia according to Unsatisfied Basic Needs (UBN) indicators and the percentage of the population living on less than USD 2/day. The most recent statistics available demonstrate that between 1985 and 2003, UBN declined from 45% to 22%, and the population earning less than USD 2/day decreased by 24%. Other indicators, such as the Human Development and Quality of Life Index, also highlight the progress made in reducing poverty (Table 3.1).
In terms of UBN indicators, the poor population decreased from 70.5% to 27.6% between 1973 and 2005 (National Statistics Department—DANE). Demographic variables are the ones most associated with poverty since more than 11% of households reported critical overcrowding and economic dependence in 2005. Nationwide, 10.6% of households had more than one UBN. Decreasing poverty rates have been accompanied by increasing per capita income in the four main cities since 2000. According to analysts, this reduced the population living in poverty to 55.3% in 2003 (MERD, 2006). In 2007, the poverty line cutoff was estimated at USD 110, but this figure varies considerably among cities.
III.Colombia
TABLE 3.1. Quality of life and poverty indicatives
1��5 2000 2003
UBN (% poor) 45 26 22
Population with less than USD 2/day (%) 60 53 36
Human Development Index 0.7 0.76 0.78
Life Expectancy Index 0.7 0.77 0.79
Quality of Life Index 60 75.7 78.8
Source: MERD (2006). LQR is between 0 and 100, with the latter being the maximum life quality level.
40
INFORMATION AND COMMUNICATION TECHNOLOGY (ICTs) TRAINING, EMPLOYMENT AND YOUTH
Despite these advances, the income gap between urban and rural areas remains and has even increased in some cases. Although economic growth driven by the industrial and service sectors significantly contributed to reducing poverty rates in the country’s leading cities, it also widened the income gap between rural and urban areas.
Income distribution has not kept pace with the advances in poverty reduction. For example, the Gini coefficient increased (a negative sign) in Barranquilla and Bogotá, from 0.53 to 0.56 and from 0.48 to 0.54, respectively, between 1996 and 2004. In other cities, such as Cali and Medellín, this indicator decreased (a positive sign), from 0.52 to 0.48 and from 0.58 to 0.53, respectively, during same period.
Although Colombia has several poverty studies, only a few link poverty and educational levels. A notable exception is Ramírez & Castro’s study (undated), which used data from the 1997 Quality of Life Survey. These researchers calculated the poverty rate in Bogotá by gender and educational level. Although the data are more than 10 years old, they do help shed light on the differences between poor and non-poor youth.15
Table 4 of the Ramírez & Castro study demonstrates that 76.3% of poor youth ages 15-19 had completed at least one year of secondary school while 83.2% of their non-poor counterparts had done so. Poor women of the same age had even lower secondary school rates, with only 63.6% completing at least one year of high school. Higher education has a notable impact on reducing poverty rates. Only 3.4% of poor youth completed one year of university studies, as compared with 11.5% for non-poor youth. Among young women who are poor, only 2.5% completed one year of university. Three times as many non-poor male and female youth had completed at least a year of higher education than their poor counterparts. For young people ages 20-24, poverty rates were similar for men and women. In this age group, only 8% of men had access to higher education whereas the percentage for women was 15%. The higher-education figures for non-poor men and women in this age group were 39.1% and 39.9%, respectively. In summary, among youth ages 12-24, years of schooling are directly related to poverty levels, regardless of gender. Poverty rates are higher among the less educated. The study also found that employed poor youth ages 12 to 18 mainly worked in the services and construction sectors, which do not require a high level of education. Another interesting result is associated with what the authors refer to as “occupational status.” Poor youth of all ages, especially between the ages of 12 and 18, have (as expected) a high rate of “independent workers,” who work in “possibly sporadic or precarious jobs,” but which nevertheless give them job experience and therefore an opportunity to subsequently obtain salaried employment. “The training received in these initial informal jobs appears to be important since the majority of the subsequent age group (20 to 24 years) is employed as workers or employees” (p. 130).
In summary, the country has made progress in reducing poverty, especially in terms of basic needs, but still has a high rate of income concentration, which fuels social conflict. The poverty and income inequality affecting much of the population have hindered these segments from
15. The authors define poor individuals as “every person who does not have sufficient income to cover his or her needs.” (p. 112).
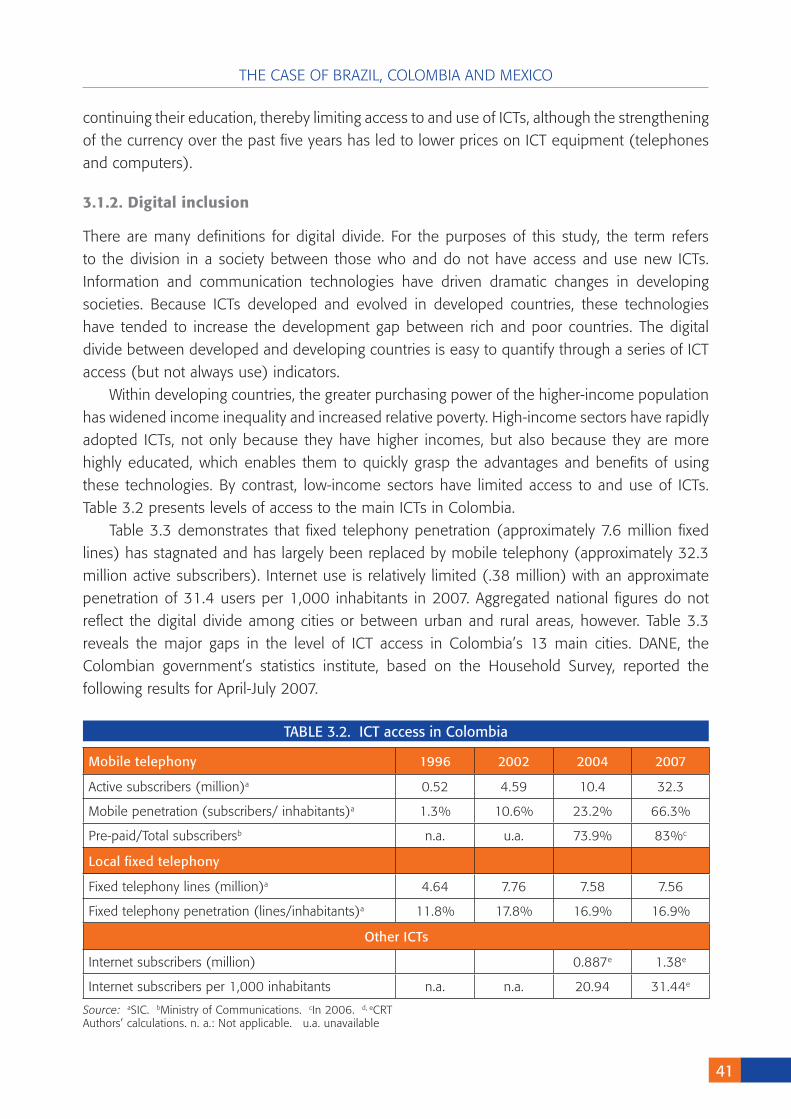
THE CASE OF BRAZIL, COLOMBIA AND MEXICO
41
Despite these advances, the income gap between urban and rural areas remains and has even increased in some cases. Although economic growth driven by the industrial and service sectors significantly contributed to reducing poverty rates in the country’s leading cities, it also widened the income gap between rural and urban areas.
Income distribution has not kept pace with the advances in poverty reduction. For example, the Gini coefficient increased (a negative sign) in Barranquilla and Bogotá, from 0.53 to 0.56 and from 0.48 to 0.54, respectively, between 1996 and 2004. In other cities, such as Cali and Medellín, this indicator decreased (a positive sign), from 0.52 to 0.48 and from 0.58 to 0.53, respectively, during same period.
Although Colombia has several poverty studies, only a few link poverty and educational levels. A notable exception is Ramírez & Castro’s study (undated), which used data from the 1997 Quality of Life Survey. These researchers calculated the poverty rate in Bogotá by gender and educational level. Although the data are more than 10 years old, they do help shed light on the differences between poor and non-poor youth.15
Table 4 of the Ramírez & Castro study demonstrates that 76.3% of poor youth ages 15-19 had completed at least one year of secondary school while 83.2% of their non-poor counterparts had done so. Poor women of the same age had even lower secondary school rates, with only 63.6% completing at least one year of high school. Higher education has a notable impact on reducing poverty rates. Only 3.4% of poor youth completed one year of university studies, as compared with 11.5% for non-poor youth. Among young women who are poor, only 2.5% completed one year of university. Three times as many non-poor male and female youth had completed at least a year of higher education than their poor counterparts. For young people ages 20-24, poverty rates were similar for men and women. In this age group, only 8% of men had access to higher education whereas the percentage for women was 15%. The higher-education figures for non-poor men and women in this age group were 39.1% and 39.9%, respectively. In summary, among youth ages 12-24, years of schooling are directly related to poverty levels, regardless of gender. Poverty rates are higher among the less educated. The study also found that employed poor youth ages 12 to 18 mainly worked in the services and construction sectors, which do not require a high level of education. Another interesting result is associated with what the authors refer to as “occupational status.” Poor youth of all ages, especially between the ages of 12 and 18, have (as expected) a high rate of “independent workers,” who work in “possibly sporadic or precarious jobs,” but which nevertheless give them job experience and therefore an opportunity to subsequently obtain salaried employment. “The training received in these initial informal jobs appears to be important since the majority of the subsequent age group (20 to 24 years) is employed as workers or employees” (p. 130).
In summary, the country has made progress in reducing poverty, especially in terms of basic needs, but still has a high rate of income concentration, which fuels social conflict. The poverty and income inequality affecting much of the population have hindered these segments from
continuing their education, thereby limiting access to and use of ICTs, although the strengthening of the currency over the past five years has led to lower prices on ICT equipment (telephones and computers).
3.1.2.Digitalinclusion
There are many definitions for digital divide. For the purposes of this study, the term refers to the division in a society between those who and do not have access and use new ICTs. Information and communication technologies have driven dramatic changes in developing societies. Because ICTs developed and evolved in developed countries, these technologies have tended to increase the development gap between rich and poor countries. The digital divide between developed and developing countries is easy to quantify through a series of ICT access (but not always use) indicators.
Within developing countries, the greater purchasing power of the higher-income population has widened income inequality and increased relative poverty. High-income sectors have rapidly adopted ICTs, not only because they have higher incomes, but also because they are more highly educated, which enables them to quickly grasp the advantages and benefits of using these technologies. By contrast, low-income sectors have limited access to and use of ICTs. Table 3.2 presents levels of access to the main ICTs in Colombia.
Table 3.3 demonstrates that fixed telephony penetration (approximately 7.6 million fixed lines) has stagnated and has largely been replaced by mobile telephony (approximately 32.3 million active subscribers). Internet use is relatively limited (.38 million) with an approximate penetration of 31.4 users per 1,000 inhabitants in 2007. Aggregated national figures do not reflect the digital divide among cities or between urban and rural areas, however. Table 3.3 reveals the major gaps in the level of ICT access in Colombia’s 13 main cities. DANE, the Colombian government’s statistics institute, based on the Household Survey, reported the following results for April-July 2007.
Mobile telephony 1��6 2002 2004 200�
Active subscribers (million)a 0.52 4.59 10.4 32.3
Mobile penetration (subscribers/ inhabitants)a 1.3% 10.6% 23.2% 66.3%
Pre-paid/Total subscribersb n.a. u.a. 73.9% 83%c
Local fixed telephony
Fixed telephony lines (million)a 4.64 7.76 7.58 7.56
Fixed telephony penetration (lines/inhabitants)a 11.8% 17.8% 16.9% 16.9%
Other ICTs
Internet subscribers (million) 0.887e 1.38e
Internet subscribers per 1,000 inhabitants n.a. n.a. 20.94 31.44e
TABLE 3.2. ICT access in Colombia
Source: aSIC. bMinistry of Communications. cIn 2006. d, eCRTAuthors’ calculations. n. a.: Not applicable. u.a. unavailable
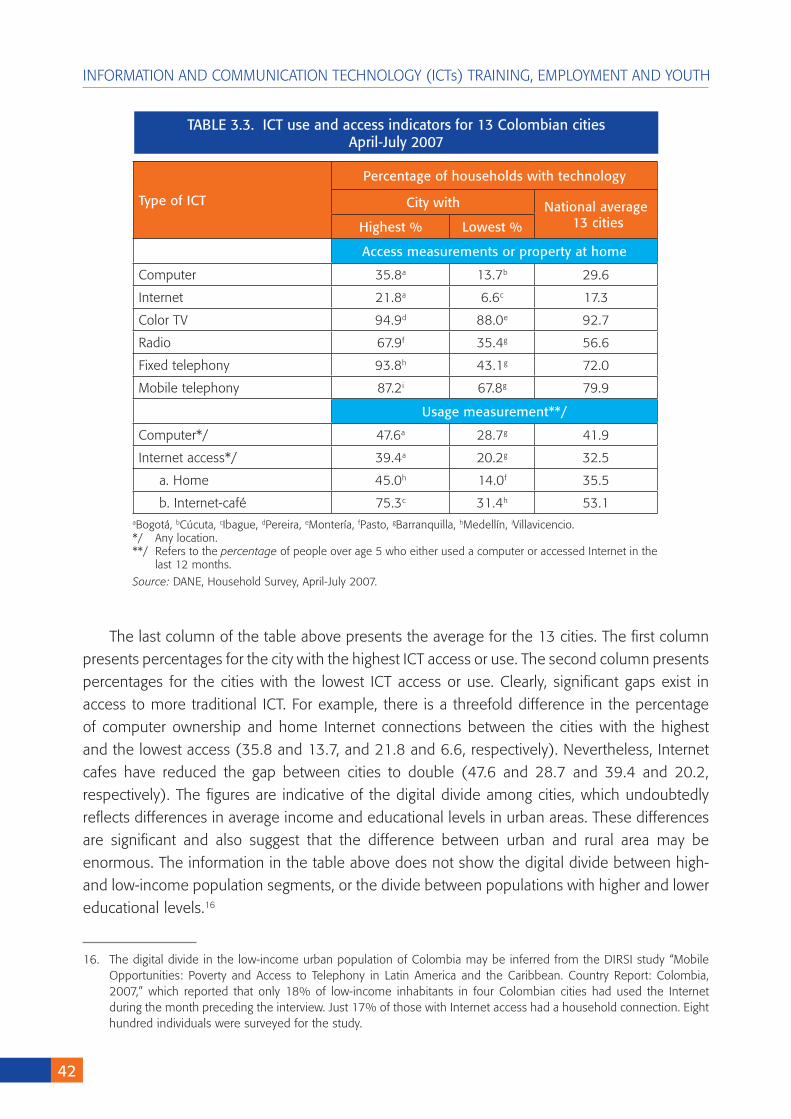
42
INFORMATION AND COMMUNICATION TECHNOLOGY (ICTs) TRAINING, EMPLOYMENT AND YOUTH
The last column of the table above presents the average for the 13 cities. The first column presents percentages for the city with the highest ICT access or use. The second column presents percentages for the cities with the lowest ICT access or use. Clearly, significant gaps exist in access to more traditional ICT. For example, there is a threefold difference in the percentage of computer ownership and home Internet connections between the cities with the highest and the lowest access (35.8 and 13.7, and 21.8 and 6.6, respectively). Nevertheless, Internet cafes have reduced the gap between cities to double (47.6 and 28.7 and 39.4 and 20.2, respectively). The figures are indicative of the digital divide among cities, which undoubtedly reflects differences in average income and educational levels in urban areas. These differences are significant and also suggest that the difference between urban and rural area may be enormous. The information in the table above does not show the digital divide between high- and low-income population segments, or the divide between populations with higher and lower educational levels.16
Type of ICT
Percentage of households with technology
City with National average 13 citiesHighest % Lowest %
Access measurements or property at home
Computer 35.8a 13.7b 29.6
Internet 21.8a 6.6c 17.3
Color TV 94.9d 88.0e 92.7
Radio 67.9f 35.4g 56.6
Fixed telephony 93.8h 43.1g 72.0
Mobile telephony 87.2i 67.8g 79.9
Usage measurement**/
Computer*/ 47.6a 28.7g 41.9
Internet access*/ 39.4a 20.2g 32.5
a. Home 45.0h 14.0f 35.5
b. Internet-café 75.3c 31.4h 53.1
TABLE 3.3. ICT use and access indicators for 13 Colombian cities April-July 200�
aBogotá, bCúcuta, cIbague, dPereira, eMontería, fPasto, gBarranquilla, hMedellín, iVillavicencio.*/ Any location. **/ Refers to the percentage of people over age 5 who either used a computer or accessed Internet in the
last 12 months.
Source: DANE, Household Survey, April-July 2007.
16. The digital divide in the low-income urban population of Colombia may be inferred from the DIRSI study “Mobile Opportunities: Poverty and Access to Telephony in Latin America and the Caribbean. Country Report: Colombia, 2007,” which reported that only 18% of low-income inhabitants in four Colombian cities had used the Internet during the month preceding the interview. Just 17% of those with Internet access had a household connection. Eight hundred individuals were surveyed for the study.
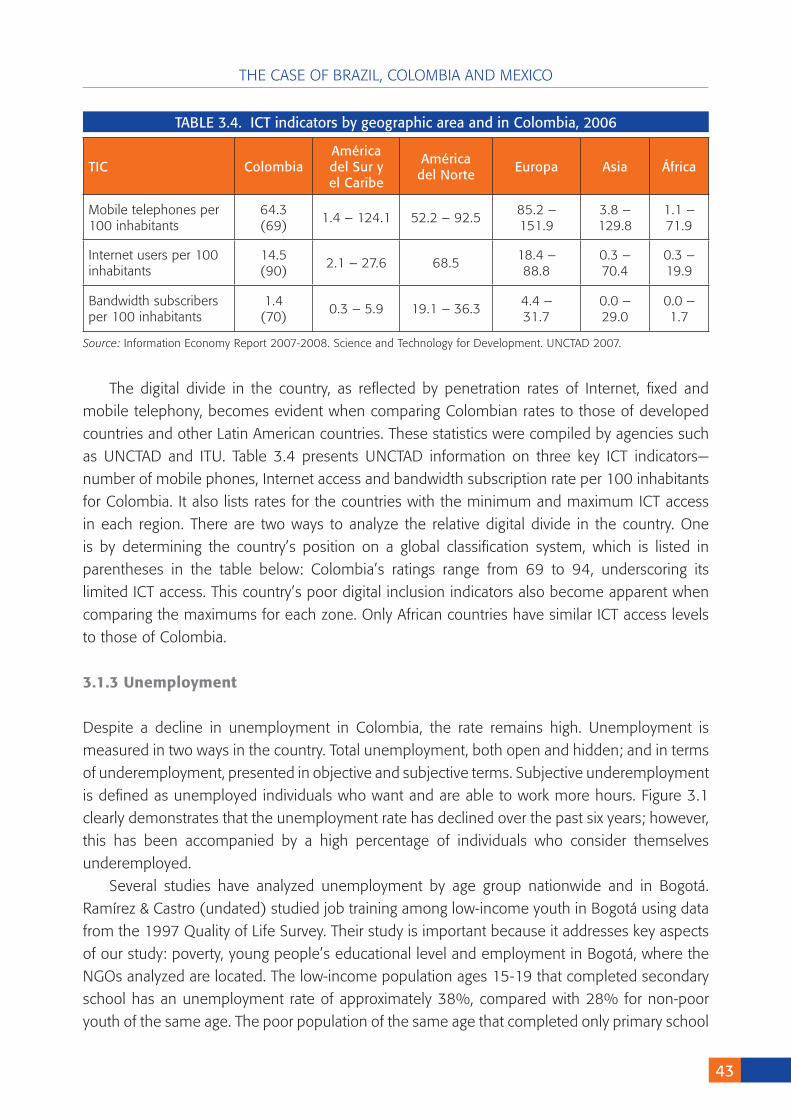
THE CASE OF BRAZIL, COLOMBIA AND MEXICO
43
The digital divide in the country, as reflected by penetration rates of Internet, fixed and mobile telephony, becomes evident when comparing Colombian rates to those of developed countries and other Latin American countries. These statistics were compiled by agencies such as UNCTAD and ITU. Table 3.4 presents UNCTAD information on three key ICT indicators—number of mobile phones, Internet access and bandwidth subscription rate per 100 inhabitants for Colombia. It also lists rates for the countries with the minimum and maximum ICT access in each region. There are two ways to analyze the relative digital divide in the country. One is by determining the country’s position on a global classification system, which is listed in parentheses in the table below: Colombia’s ratings range from 69 to 94, underscoring its limited ICT access. This country’s poor digital inclusion indicators also become apparent when comparing the maximums for each zone. Only African countries have similar ICT access levels to those of Colombia.
3.1.3Unemployment
Despite a decline in unemployment in Colombia, the rate remains high. Unemployment is measured in two ways in the country. Total unemployment, both open and hidden; and in terms of underemployment, presented in objective and subjective terms. Subjective underemployment is defined as unemployed individuals who want and are able to work more hours. Figure 3.1 clearly demonstrates that the unemployment rate has declined over the past six years; however, this has been accompanied by a high percentage of individuals who consider themselves underemployed.
Several studies have analyzed unemployment by age group nationwide and in Bogotá. Ramírez & Castro (undated) studied job training among low-income youth in Bogotá using data from the 1997 Quality of Life Survey. Their study is important because it addresses key aspects of our study: poverty, young people’s educational level and employment in Bogotá, where the NGOs analyzed are located. The low-income population ages 15-19 that completed secondary school has an unemployment rate of approximately 38%, compared with 28% for non-poor youth of the same age. The poor population of the same age that completed only primary school
TIC ColombiaAmérica del Sur yel Caribe
Américadel Norte Europa Asia África
Mobile telephones per 100 inhabitants
64.3 (69)
1.4 – 124.1 52.2 – 92.585.2 –151.9
3.8 –129.8
1.1 –71.9
Internet users per 100 inhabitants
14.5 (90)
2.1 – 27.6 68.518.4 –88.8
0.3 –70.4
0.3 –19.9
Bandwidth subscribersper 100 inhabitants
1.4 (70)
0.3 – 5.9 19.1 – 36.34.4 – 31.7
0.0 –29.0
0.0 –1.7
TABLE 3.4. ICT indicators by geographic area and in Colombia, 2006
Source: Information Economy Report 2007-2008. Science and Technology for Development. UNCTAD 2007.
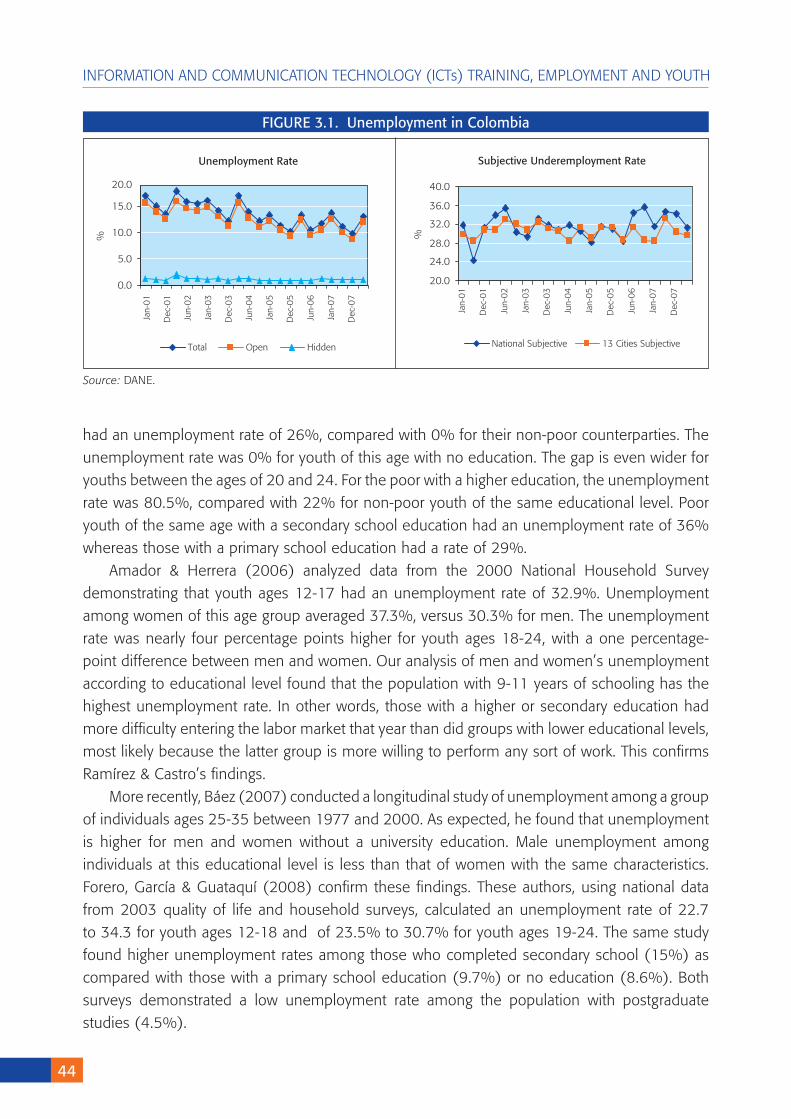
44
INFORMATION AND COMMUNICATION TECHNOLOGY (ICTs) TRAINING, EMPLOYMENT AND YOUTH
had an unemployment rate of 26%, compared with 0% for their non-poor counterparties. The unemployment rate was 0% for youth of this age with no education. The gap is even wider for youths between the ages of 20 and 24. For the poor with a higher education, the unemployment rate was 80.5%, compared with 22% for non-poor youth of the same educational level. Poor youth of the same age with a secondary school education had an unemployment rate of 36% whereas those with a primary school education had a rate of 29%.
Amador & Herrera (2006) analyzed data from the 2000 National Household Survey demonstrating that youth ages 12-17 had an unemployment rate of 32.9%. Unemployment among women of this age group averaged 37.3%, versus 30.3% for men. The unemployment rate was nearly four percentage points higher for youth ages 18-24, with a one percentage-point difference between men and women. Our analysis of men and women’s unemployment according to educational level found that the population with 9-11 years of schooling has the highest unemployment rate. In other words, those with a higher or secondary education had more difficulty entering the labor market that year than did groups with lower educational levels, most likely because the latter group is more willing to perform any sort of work. This confirms Ramírez & Castro’s findings.
More recently, Báez (2007) conducted a longitudinal study of unemployment among a group of individuals ages 25-35 between 1977 and 2000. As expected, he found that unemployment is higher for men and women without a university education. Male unemployment among individuals at this educational level is less than that of women with the same characteristics. Forero, García & Guataquí (2008) confirm these findings. These authors, using national data from 2003 quality of life and household surveys, calculated an unemployment rate of 22.7 to 34.3 for youth ages 12-18 and of 23.5% to 30.7% for youth ages 19-24. The same study found higher unemployment rates among those who completed secondary school (15%) as compared with those with a primary school education (9.7%) or no education (8.6%). Both surveys demonstrated a low unemployment rate among the population with postgraduate studies (4.5%).
Unemployment Rate
0.0
5.0
10.0
15.0
20.0
%
Total Open Hidden
Subjective Underemployment Rate
20.0
24.0
28.0
32.0
36.0
40.0
%
National Subjective 13 Cities Subjective
Jan-
01
Dec
-01
Jun-
02
Jan-
03
Dec
-03
Jun-
04
Jan-
05
Dec
-05
Jun-
06
Jan-
07
Dec
-07
Jan-
01
Dec
-01
Jun-
02
Jan-
03
Dec
-03
Jun-
04
Jan-
05
Dec
-05
Jun-
06
Jan-
07
Dec
-07
FIGURE 3.1. Unemployment in Colombia
Source: DANE.
THE CASE OF BRAZIL, COLOMBIA AND MEXICO
45
Unfortunately, no studies examine the impact of the country’s recent economic growth on low-income, uneducated youth. What is certain is that unemployment rates vary among the 13 main cities and between rural and urban areas.
3.1.4GovernmenttrainingandICTefforts
The Colombian government has launched initiatives to reduce the country’s digital divide. These focus on enabling low-income and rural populations to access ICTs. One of the first was the COMPARTEL Telecenter program, which installs, operates and maintains telecenters in urban areas with limited telecommunications services. Telecenters are supplied with computers with Internet connections, as well as international telephone lines. Most government-sponsored telecenters use satellite technology because they are located in rural or remote areas. To date, approximately 1,490 telecenters have been established, with a total of 6,900 computers and approximately 5,000 telephone lines with international access.
A second national initiative for closing the digital divide is the Internet Program, consisting of the installation of 670 Internet connection points throughout the country. These are frequently installed in existing telecenters. Rural Community Telephony is another initiative for the installation, operation and maintenance of telephone lines (approximately 12,000) in remote rural areas lacking telephony service. This program uses satellite, mobile and wireless technologies, which are connected to the public switch network, thereby enabling incoming/outgoing communication with the rest of the country and the world.
Ramírez & Castro (undated) studied training programs for low-income youth in Bogotá in 1996 and 1997. Although the study did not focus on ICT training, the overall results are of interest here. The authors report that,
Between 1996 and 1997, 18% of the Bogotá population ages 15-64 received some sort of job training or training in establishing or improving a business. This training did not target youth, however: only 7% of the Bogotá population ages 15-19 years, and 18% of the population ages 20-24, received this training. Neither did training target people living in poverty: 8.5% of the population living in poverty, versus 22% of the non-poor population, attended these courses. In terms of gender, more women (all age groups) than men enrolled in the training courses.17
Ramírez & Castro assessed different training programs for low-income youth in Bogotá between 1993 and 1996, a period of economic growth. The researchers found no public or private training program that offered ICT training specifically. They attempted to measure the impact of training on obtaining employment. This was only possible for one program, where they found that,
In total, the number of employed youth increased from 62 (before training) to 78 (after training) whereas the number of active unemployed youth increased from 22 (before training) to 68 (after
17. Taken from http://www.colombiajoven.gov.co/injuve/instit/cinte/fpexcl/index.htm.
46
INFORMATION AND COMMUNICATION TECHNOLOGY (ICTs) TRAINING, EMPLOYMENT AND YOUTH
training) … These courses are youth’s gateway to the labor market. However, that market does not give them the opportunities they expect. Moreover, most employed youth did not keep their jobs once they completed the course. By the time the survey was applied, the number of unemployed
had increased.
3.2.NGOs,ICTcentersandemployment
The Colombian government has attempted to narrow the digital divide among urban and rural zones and among the low-income population through a series of initiatives to provide access to disadvantaged groups. However, ICT researchers have long emphasized that although ensuring access in developing countries is the first step for closing the digital divide among population groups, ICT usage is restricted by the population’s limited education, especially with regard to ICT operation. Worldwide, in addition to providing access, NGOs and community-based organizations are providing ICT training to low-income populations (Cecchini, 2005).
Three Colombian NGOs that provide ICT access and training participated in this study: the Fundación Juan Bosco Obrero, Fundación POETA – Cirec and the Fundación Teletón-POETA.18
Centers supported by POETA-Trust for the Americas
CIREC and Teletón, two organizations that promote the well-being of people with disabilities, participated in this study.
a. CIREC, established in 1976,19 is a foundation that trains people with disabilities to help them in their home and work activities. In 2006, a group of international organizations and companies implemented a POETA project in Bogotá, Colombia. The Organization of American States (OAS), Trust for the Americas, Microsoft, through its Unlimited Potential Program, and Hewlett Packard joined forces to establish the POETA Technology Center in Cirec. POETA20-Cirec’s objective is to provide ICT training to people with disabilities, their families and the community to strengthen their employment opportunities. The computer center is open to the general public.
b. Teletón is a foundation created in 1973. Although initially planned as a recreational facility for people with disabilities, it began to provide integral support to this group in the 1980s. In 1997, Fundación Teletón signed an agreement with Universidad de la Sabana, which enabled it to greatly expand its support programs for people with disabilities. In July 2006, Teletón signed a Letter of Understanding with the Trust for the Americas to create the Opportunities for Employment through Technology in the Americas program for selected users in Bogotá and Chía. The objective of the program is to provide labor tools through IT
18. This paper will describe the ICT training provided by these organizations.
19. The center opened on October 9, 2006, and the first course began on October 17, 2006.
20. POETA (Partnership in Opportunities for Employment through Technology in the Americas)
THE CASE OF BRAZIL, COLOMBIA AND MEXICO
4�
training to vulnerable populations in those and neighboring communities who are seeking employment or want to start their own business. In addition to the ICT training, program beneficiaries receive psychological and occupational support for entering into the labor/business market. The program’s target population is the physically disabled, family members of people with any type of disability, the unemployed or those with very low incomes. The minimum age is 13. Approximately 75 people visit the main computer center daily, mainly to access the Internet, perform work-related activities or seek employment.
c. The Juan Bosco Obrero training center is a social-religious organization of the Salesian Society that offers a variety of training programs to low-income residents of Bolívar City in Bogotá. The Center was founded in 1988 with donations from several individuals. In 2004, the JBO Center signed an agreement with SENA, the government National Learning Service, to provide technical training. Since 2001, the JBO Center has been providing IT training to the low-income population. Approximately 3,357 students had enrolled at the Center to 2006. The Technical Training Center offers the Unlimited Potential ICT course, in coordination with SENA.21 The center is open daily to the local community, students and neighborhood boards. SENA issues certificates to graduates of JBO center courses. Approximately 150 people visit the center daily, mainly to obtain public information, search the Internet and do homework. The three NGOs not only provide basic ICT training to the low-income or disabled population but also offer employment support for beneficiaries. They use different tools to this end.
3.3.Internalanalysis:labormarketrelevance
As mentioned in the previous chapter, a key variable for the employability of center beneficiaries is the NGO’s organizational capacity. Thus, it is important to identify the NGO’s organizational tools (facilities, available resources, funding, instructors, tracking of graduates, job placement, etc.). These components will be used to analyze how centers are organized to support the population and consequently achieve the goal of increasing employment opportunities for marginalized groups.
The NGOs analyzed have or had support from government agencies, such as SENA with the JBO Center; educational entities, such as Universidad de la Sabana with Teletón-POETA; multinational firms, such as Teletón and Cirec with POETA; and, to a lesser extent, from public and private concerns nationwide. This support mostly took the form of start-up contributions, including direct funding, donations of computer equipment and training programs, as well as financing of operating expenses.
Achieving NGO program objectives to provide training and help beneficiaries find jobs or empower them to generate their own income depends largely on the NGOs’ organizational
21. Microsoft funded the building of the room and supplied the equipment and basic computer programs.
4�
INFORMATION AND COMMUNICATION TECHNOLOGY (ICTs) TRAINING, EMPLOYMENT AND YOUTH
tools, including the human and physical resources allocated to that end. What tools do the three NGOs of this study use to contribute to ICT training and help beneficiaries find jobs? How do the NGOs’ organizational tools differ?
Unlike training in many other areas, ICT training requires adequate facilities and updated equipment and computing programs. The NGO centers all have a special room designed specifically for either ICT training or ICT community services. These rooms are large and well-lit to facilitate learning. In addition, all three centers have relatively modern computers. The POETA-Cirec center has 24 Pentium IV computers donated by Hewlett Packard, each with basic software programs, including word processing (Word), spreadsheet (Excel), presentation (PowerPoint) and database (Access) programs, e-mail and Internet. All computers have 512 kb-Internet connections. The center is open Monday through Saturday for an average of 63 hours weekly. Beneficiaries are not charged for using the computers.
The Teletón-POETA Center in Bogotá has 22 computers and is open from Monday through Saturday for approximately 54 hours a week. All 22 Pentium III computers have 512 Kb-Internet connections and basic software programs, including word processing (Word), spreadsheets (Excel), presentations (PowerPoint), database (Access), e-mail and Internet. Lastly, the JBO center has 35 1G computers in its IT classroom, all with 512 Kb Internet access. Computers also have basic software, including word processing (Word), spreadsheets (Excel), presentations (PowerPoint), database (Access), e-mail and Internet. Users not enrolled in the center’s courses pay USD 0.17 per hour to use the computers.
With respect to infrastructure for ICT training, the three centers have adequate facilities, equipment and software programs. However, software programs are generally updated by their manufacturers every two or three years, and in many cases, equipment needs to be renewed or updated in order to operate these programs. Although the relative cost of computer equipment has declined thanks to a favorable exchange rate, the equipment at all three centers was directly donated or acquired with donated funds. If these centers want to expand their training or offer more advanced courses in the future, they will face serious financial challenges for expanding facilities and updating equipment and programs.
These three centers have different sources of human and financial resources to achieve their goals. The JBO center’s ICT training program receives support from SENA, which covers the cost of instructors’ salaries and computer operation. Teletón-POETA’s program finances its ICT courses through agreements with local mayoral offices and police forces, which cover all training costs. Approximately 80% of the Teletón-POETA center’s resources originate from funding agreements while the remaining 20% come from the center’s own resources, as well as contributions from Teletón and Universidad de Sabana, which owns the facilities. For its part, the POETA-Cirec center finances its program with resources from POETA, which covers approximately 25% of the budget; the remainder originates from sponsoring companies (70%) and its own resources (5%). In general, there are few funding sources and most cover only some operating costs, especially instructors’ salaries. Moreover, these resources are not always guaranteed because they depend on entering into usually temporary agreements with entities such as the police force, local government and others.
THE CASE OF BRAZIL, COLOMBIA AND MEXICO
4�
Human resources, that is, instructors, are decisive in ICT training of beneficiaries, particularly those beneficiaries with a physical disability or who are disadvantaged in terms of education, health, or otherwise. Information and communication technologies can and do intimidate users. For example, Moule (2003) surveyed university students to assess their personal experiences with initiating ICT use. He found that (2003, p. 532) “All students were initially intimidated when using the computer, a feeling that tended to persist whenever they were faced with an unfamiliar or new experience associated with technology, such as using new software or exploring the Internet.” The study of university students demonstrates that learning ICT can often intimidate users. Instructors can help users overcome their insecurities. Clearly, instructors are essential for enabling beneficiaries to take advantage of the opportunities ICTs offer.
The three centers have adequately trained staff to teach the ICT courses. POETA-Cirec has two instructors, one of whom works full time. Monthly salaries average USD 500. Each instructor teaches one to three courses per semester, with a total enrolment of approximately 40 students per semester. Only one instructor has received teacher training. The project coordinator evaluates both instructors every semester. The Teletón-POETA program has four qualified instructors, whose monthly salary averages USD 360. Instructors teach approximately four courses every semester, with a total enrolment of approximately 50 students per semester, who also receive some job training. All instructors are evaluated by beneficiaries although no other outside assessment exists. None of instructors has taken teacher training courses. The JBO center has six instructors (all with university degrees). Instructors work full-time and earn a monthly salary averaging USD 500. Each instructor teaches one to three courses per semester, with an average total enrolment of 25 students per semester. Four of the six instructors have taken teacher training courses and they all are periodically evaluated by Microsoft.
Although staff is adequately trained for teaching ICT courses, NGOs should provide training in pedagogical and psychological aspects to instructors so that they can help youth and adults with lower educational levels to overcome their intimidation when learning ICT.
As mentioned above, the centers’ specific objective, supported by POETA and the JBO center’s IT room, is to train users in basic ICTs. The three organizations use Microsoft’s Unlimited Potential materials and curriculum. They also have software donated by Microsoft. The centers offer basic courses in word processing, spreadsheets, presentations, databases and the Internet. Recently, the centers have begun offering intermediate-level courses.
Program beneficiaries at the three centers are tested during and at the end of the course or training program. In POETA-supported centers, students receive a Microsoft certificate or diploma at the end of the course. Students who complete a course at the JBO center receive a Professional Activity Certificate from SENA. The POETA-Cirec center certified its first graduating class of 25 in April 2007. The Teletón-POETA agreement had the objective of training a target population of 265 users. However, no information exists on the current number of total beneficiaries of the three centers. The three centers issued ICT training certificates to students. These certificates give NGO-program beneficiaries a competitive advantage over job candidates who may claim to have ICT training but cannot verify it.
50
INFORMATION AND COMMUNICATION TECHNOLOGY (ICTs) TRAINING, EMPLOYMENT AND YOUTH
While the three centers register students enrolled in their programs, personal, family and socioeconomic data are limited. Although coordinators of the JBO and Teletón-POETA centers reported that they track graduates, this monitoring requires strengthening to obtain accurate information on beneficiaries’ employment status.
All three centers have job placement services. At the JBO center, the coordinator22 stated that the JBO job placement service offers technical jobs; the coordinator23 of Teletón POETA stated that the center helps beneficiaries find work at call centers. Similarly, the POETA-Cirec24 coordinator said the center helps beneficiaries find jobs at call centers or as office assistants, etc. Although coordinators were not asked how many course graduates the job service supports, the evidence suggests that the three job placement services do not offer an adequate supply of appropriate jobs.
Overall, the three institutions have similar organizational resources. Key infrastructure, equipment and software programs are similar and instructors have comparable educational backgrounds. However, the three centers differ slightly in terms of instructor training.
The centers face similar financial challenges that may threaten their future sustainability, especially in terms of funding sources to expand their programs and to adapt and modernize their equipment and programs. Coordinators of all three centers said they need more support from international entities for instructor training and hiring of new instructors with expertise in new software programs. Coordinators of POETA-supported centers expressed concern about the lack of resources for disseminating the courses as demand for the training courses has stagnated. Although the three centers clearly play an important role in empowering low-income users, they require more human resource and financial support to be able to expand the coverage and scope of their ICT programs.
3.4.ExternalAnalysis:ICT,youthandthelabormarket
3.4.1Beneficiaries
Socioeconomic factors have a major influence on ICT use and access patterns. The project “ICT, and Youth: Creating Opportunities for Youth Entrepreneurship in Latin America,” which was simultaneously carried out in Brazil, Colombia and Mexico, focused on studying the relationship between ICT use and/or learning by youth in rural areas and the generation of employment or entrepreneurial or independent business opportunities. Unfortunately, in Colombia, time constraints limited the study to Bogotá, the capital city. Forty-five beneficiaries ranging in age from 16 to 55 participated in the study (Table 3.5). This was the approximate number of individuals at the three institutions at the moment interviews were conducted. We could locate
22. Information given by Carlos Ramírez, the Center’s coordinator.
23. Information given by Marcela Bernal, the Center’s coordinator.
24. Information given by Erika Oviedo, the Center’s coordinator.
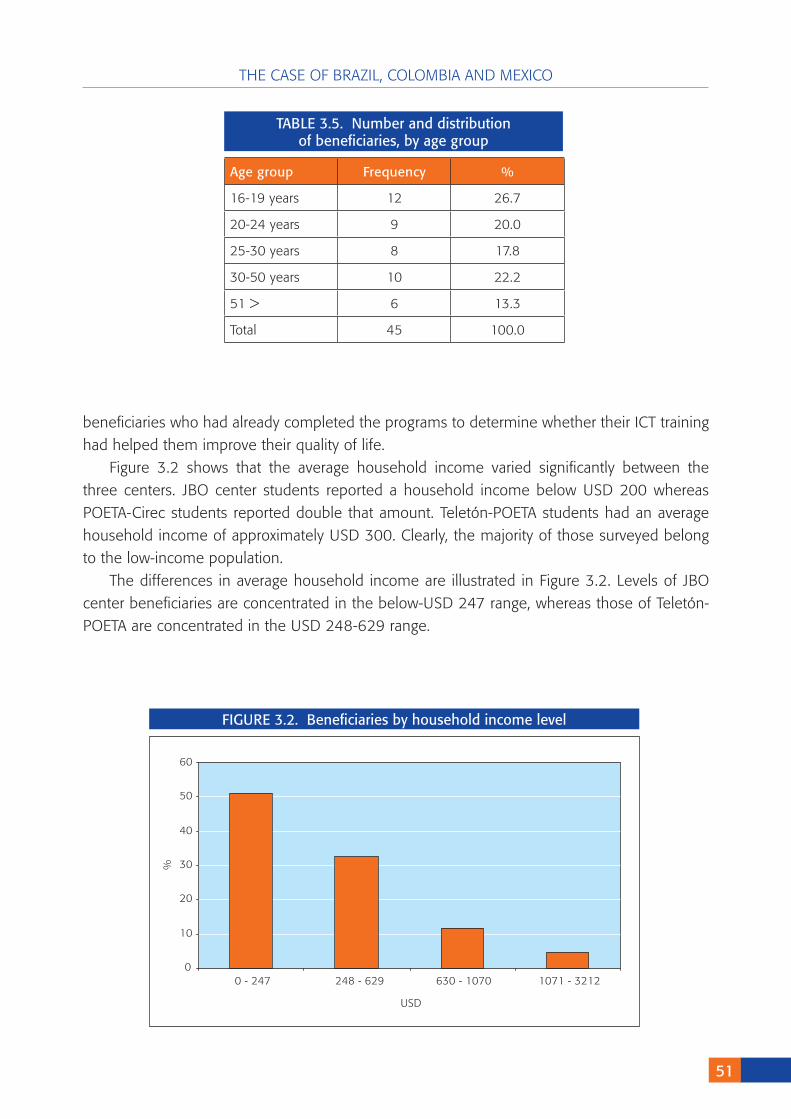
THE CASE OF BRAZIL, COLOMBIA AND MEXICO
51
beneficiaries who had already completed the programs to determine whether their ICT training had helped them improve their quality of life.
Figure 3.2 shows that the average household income varied significantly between the three centers. JBO center students reported a household income below USD 200 whereas POETA-Cirec students reported double that amount. Teletón-POETA students had an average household income of approximately USD 300. Clearly, the majority of those surveyed belong to the low-income population.
The differences in average household income are illustrated in Figure 3.2. Levels of JBO center beneficiaries are concentrated in the below-USD 247 range, whereas those of Teletón-POETA are concentrated in the USD 248-629 range.
Age group Frequency %
16-19 years 12 26.7
20-24 years 9 20.0
25-30 years 8 17.8
30-50 years 10 22.2
51 > 6 13.3
Total 45 100.0
TABLE 3.5. Number and distributionof beneficiaries, by age group
FIGURE 3.2. Beneficiaries by household income level
0
10
20
30
40
50
60
0 - 247 248 - 629 630 - 1070 1071 - 3212
USD
%
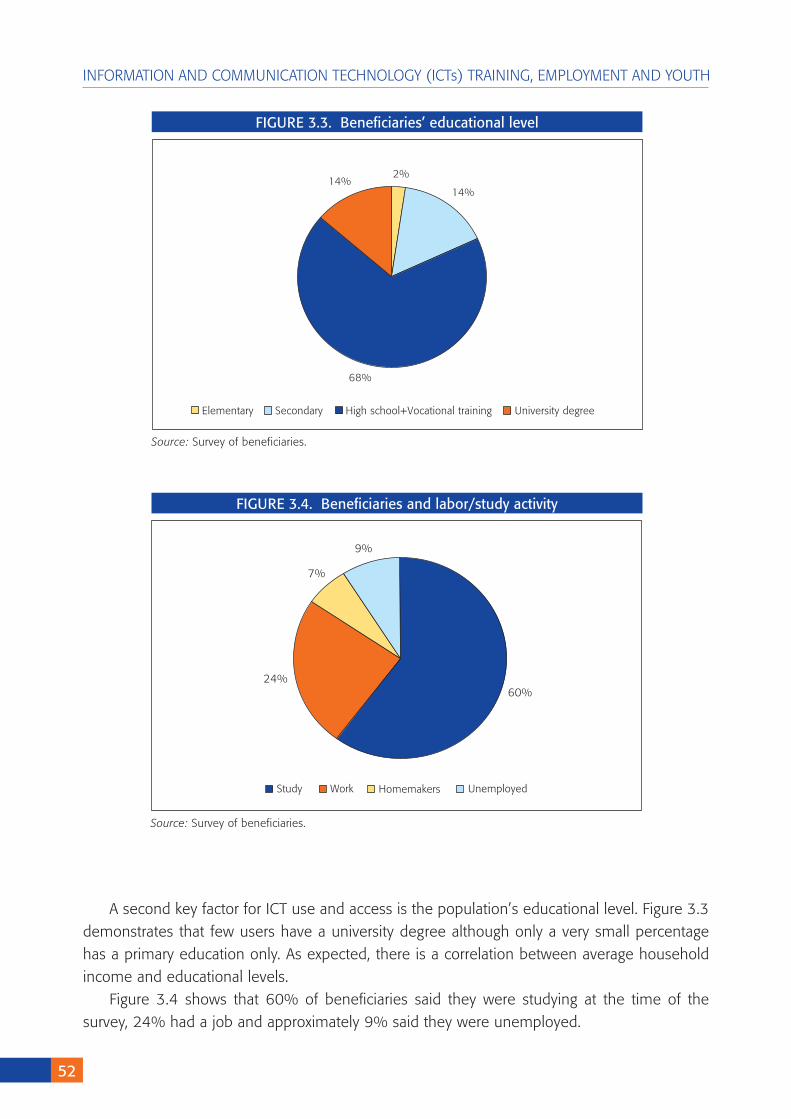
52
INFORMATION AND COMMUNICATION TECHNOLOGY (ICTs) TRAINING, EMPLOYMENT AND YOUTH
A second key factor for ICT use and access is the population’s educational level. Figure 3.3 demonstrates that few users have a university degree although only a very small percentage has a primary education only. As expected, there is a correlation between average household income and educational levels.
Figure 3.4 shows that 60% of beneficiaries said they were studying at the time of the survey, 24% had a job and approximately 9% said they were unemployed.
FIGURE 3.3. Beneficiaries’ educational level
Source: Survey of beneficiaries.
2%
14%
68%
14%
Elementary Secondary High school+Vocational training University degree
FIGURE 3.4. Beneficiaries and labor/study activity
Source: Survey of beneficiaries.
60%24%
7%
9%
Study Work Homemakers Unemployed
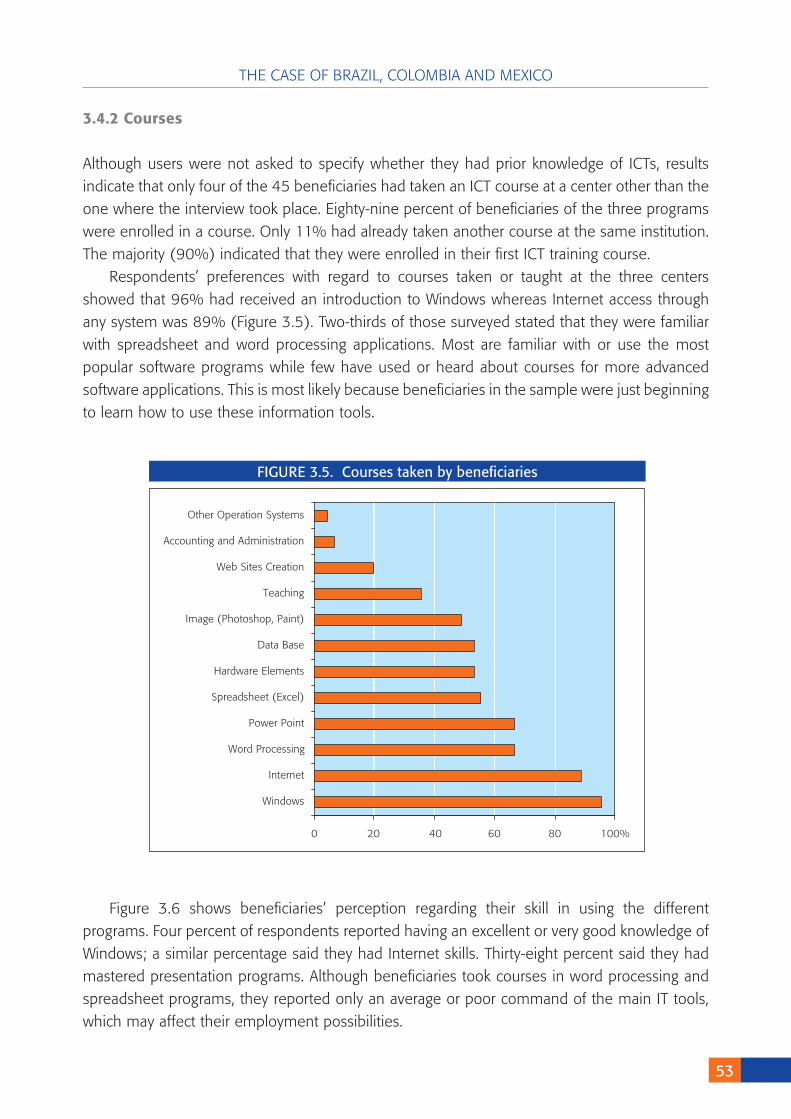
THE CASE OF BRAZIL, COLOMBIA AND MEXICO
53
3.4.2Courses
Although users were not asked to specify whether they had prior knowledge of ICTs, results indicate that only four of the 45 beneficiaries had taken an ICT course at a center other than the one where the interview took place. Eighty-nine percent of beneficiaries of the three programs were enrolled in a course. Only 11% had already taken another course at the same institution. The majority (90%) indicated that they were enrolled in their first ICT training course.
Respondents’ preferences with regard to courses taken or taught at the three centers showed that 96% had received an introduction to Windows whereas Internet access through any system was 89% (Figure 3.5). Two-thirds of those surveyed stated that they were familiar with spreadsheet and word processing applications. Most are familiar with or use the most popular software programs while few have used or heard about courses for more advanced software applications. This is most likely because beneficiaries in the sample were just beginning to learn how to use these information tools.
FIGURE 3.5. Courses taken by beneficiaries
0 20 40 60 80 100%
Windows
Internet
Word Processing
Power Point
Spreadsheet (Excel)
Hardware Elements
Data Base
Image (Photoshop, Paint)
Teaching
Web Sites Creation
Accounting and Administration
Other Operation Systems
Figure 3.6 shows beneficiaries’ perception regarding their skill in using the different programs. Four percent of respondents reported having an excellent or very good knowledge of Windows; a similar percentage said they had Internet skills. Thirty-eight percent said they had mastered presentation programs. Although beneficiaries took courses in word processing and spreadsheet programs, they reported only an average or poor command of the main IT tools, which may affect their employment possibilities.
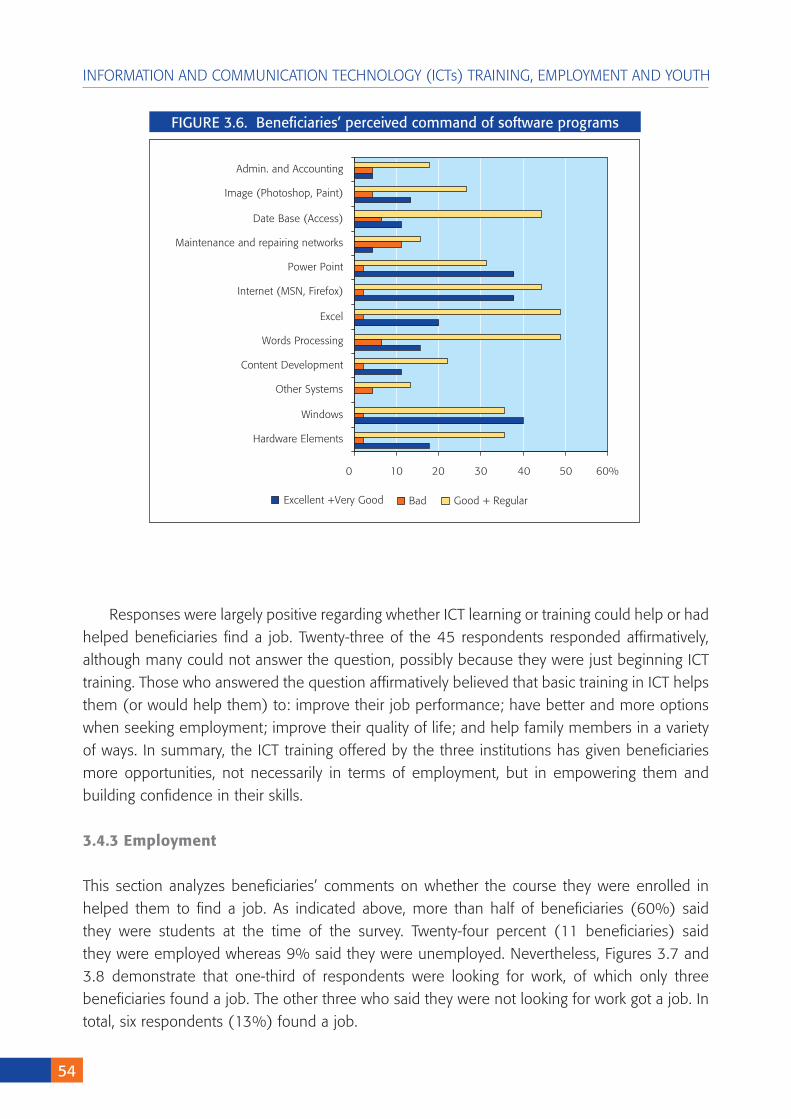
54
INFORMATION AND COMMUNICATION TECHNOLOGY (ICTs) TRAINING, EMPLOYMENT AND YOUTH
FIGURE 3.6. Beneficiaries’ perceived command of software programs
0 10 20 30 40 50 60%
Hardware Elements
Windows
Other Systems
Content Development
Words Processing
Excel
Internet (MSN, Firefox)
Power Point
Maintenance and repairing networks
Date Base (Access)
Image (Photoshop, Paint)
Admin. and Accounting
Excellent +Very Good Bad Good + Regular
Responses were largely positive regarding whether ICT learning or training could help or had helped beneficiaries find a job. Twenty-three of the 45 respondents responded affirmatively, although many could not answer the question, possibly because they were just beginning ICT training. Those who answered the question affirmatively believed that basic training in ICT helps them (or would help them) to: improve their job performance; have better and more options when seeking employment; improve their quality of life; and help family members in a variety of ways. In summary, the ICT training offered by the three institutions has given beneficiaries more opportunities, not necessarily in terms of employment, but in empowering them and building confidence in their skills.
3.4.3Employment
This section analyzes beneficiaries’ comments on whether the course they were enrolled in helped them to find a job. As indicated above, more than half of beneficiaries (60%) said they were students at the time of the survey. Twenty-four percent (11 beneficiaries) said they were employed whereas 9% said they were unemployed. Nevertheless, Figures 3.7 and 3.8 demonstrate that one-third of respondents were looking for work, of which only three beneficiaries found a job. The other three who said they were not looking for work got a job. In total, six respondents (13%) found a job.
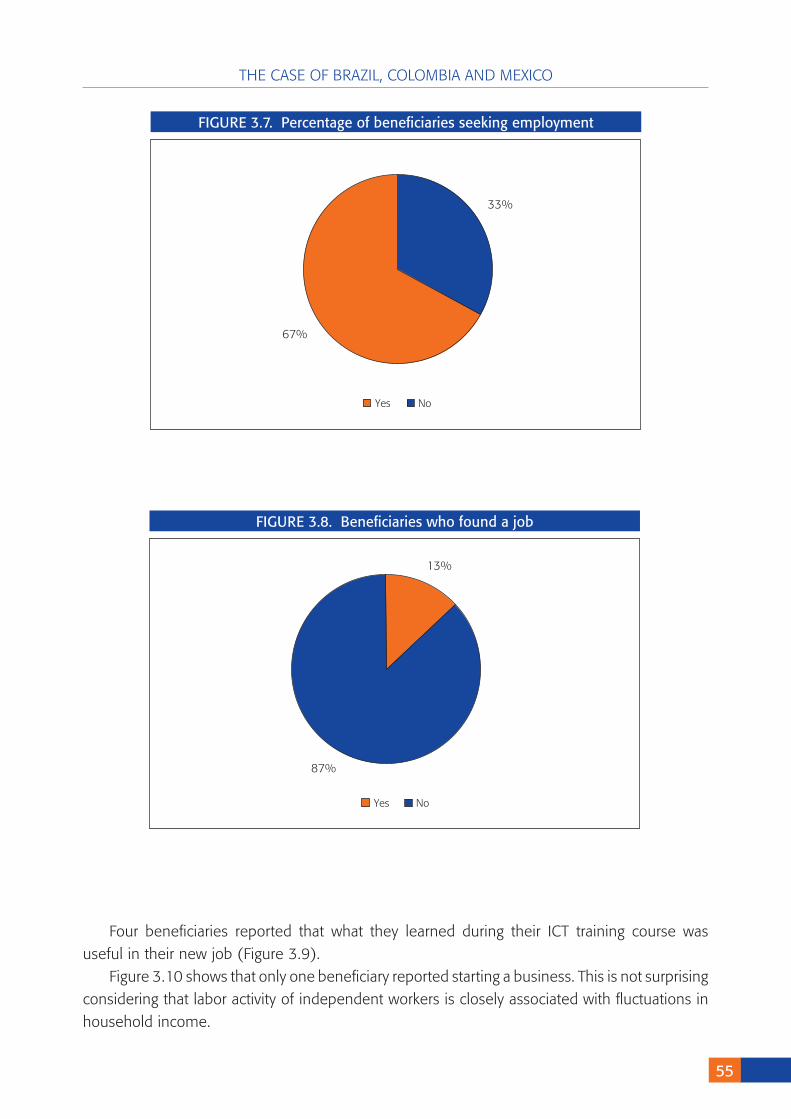
THE CASE OF BRAZIL, COLOMBIA AND MEXICO
55
FIGURE 3.�. Percentage of beneficiaries seeking employment
33%
67%
Yes No
FIGURE 3.�. Beneficiaries who found a job
13%
87%
Yes No
Four beneficiaries reported that what they learned during their ICT training course was useful in their new job (Figure 3.9).
Figure 3.10 shows that only one beneficiary reported starting a business. This is not surprising considering that labor activity of independent workers is closely associated with fluctuations in household income.
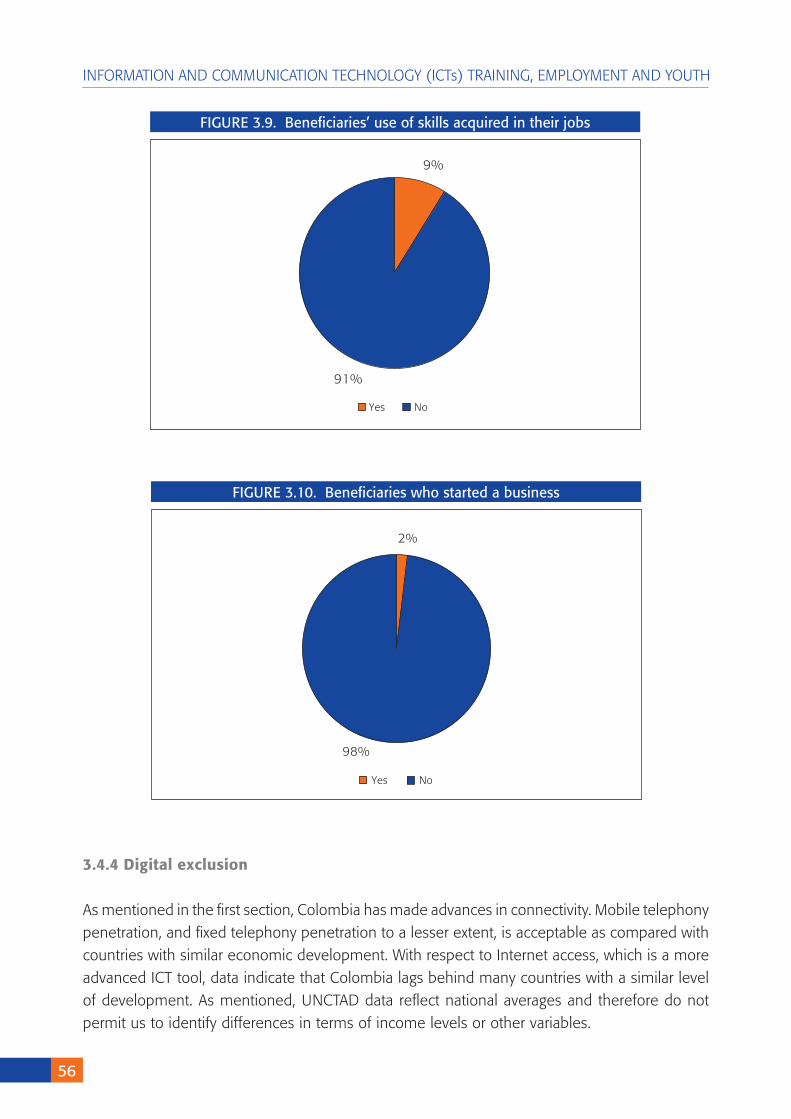
56
INFORMATION AND COMMUNICATION TECHNOLOGY (ICTs) TRAINING, EMPLOYMENT AND YOUTH
3.4.4Digitalexclusion
As mentioned in the first section, Colombia has made advances in connectivity. Mobile telephony penetration, and fixed telephony penetration to a lesser extent, is acceptable as compared with countries with similar economic development. With respect to Internet access, which is a more advanced ICT tool, data indicate that Colombia lags behind many countries with a similar level of development. As mentioned, UNCTAD data reflect national averages and therefore do not permit us to identify differences in terms of income levels or other variables.
FIGURE 3.�. Beneficiaries’ use of skills acquired in their jobs
9%
91%
Yes No
FIGURE 3.10. Beneficiaries who started a business
2%
98%
Yes No
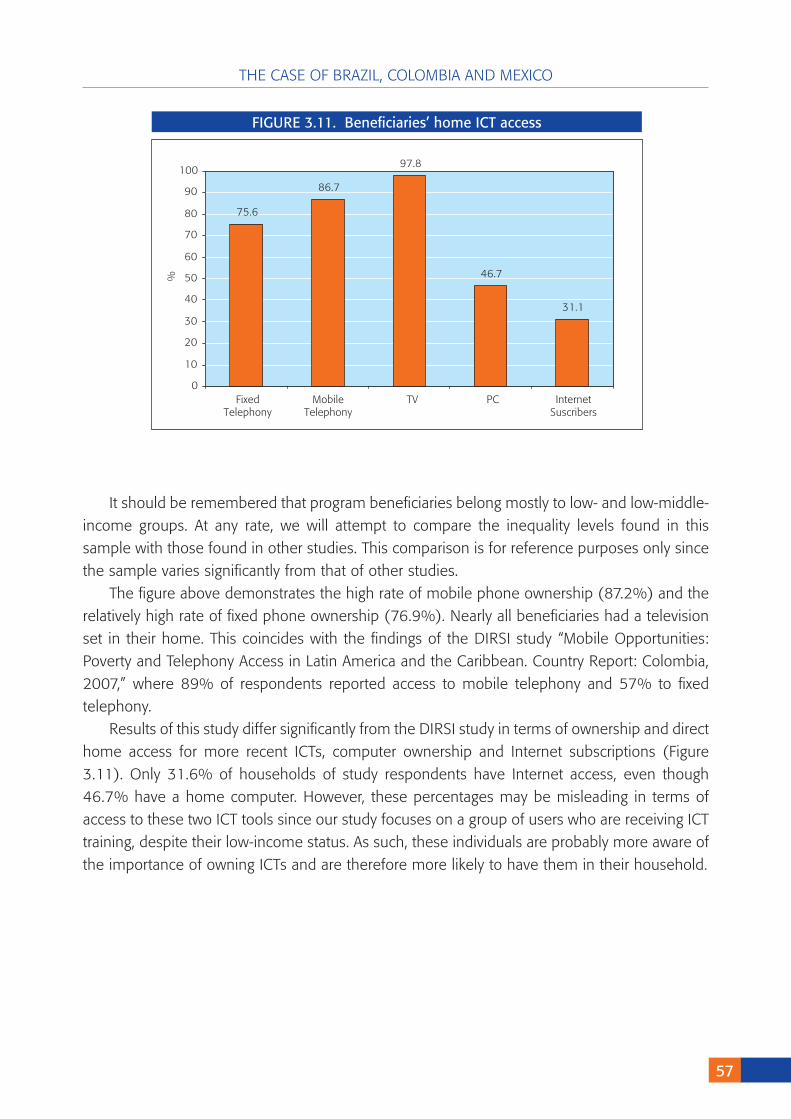
THE CASE OF BRAZIL, COLOMBIA AND MEXICO
5�
It should be remembered that program beneficiaries belong mostly to low- and low-middle-income groups. At any rate, we will attempt to compare the inequality levels found in this sample with those found in other studies. This comparison is for reference purposes only since the sample varies significantly from that of other studies.
The figure above demonstrates the high rate of mobile phone ownership (87.2%) and the relatively high rate of fixed phone ownership (76.9%). Nearly all beneficiaries had a television set in their home. This coincides with the findings of the DIRSI study “Mobile Opportunities: Poverty and Telephony Access in Latin America and the Caribbean. Country Report: Colombia, 2007,” where 89% of respondents reported access to mobile telephony and 57% to fixed telephony.
Results of this study differ significantly from the DIRSI study in terms of ownership and direct home access for more recent ICTs, computer ownership and Internet subscriptions (Figure 3.11). Only 31.6% of households of study respondents have Internet access, even though 46.7% have a home computer. However, these percentages may be misleading in terms of access to these two ICT tools since our study focuses on a group of users who are receiving ICT training, despite their low-income status. As such, these individuals are probably more aware of the importance of owning ICTs and are therefore more likely to have them in their household.
FIGURE 3.11. Beneficiaries’ home ICT access
75.6
86.7
97.8
46.7
31.1
0
10
20
30
40
50
60
70
80
90
100
Fixed Mobile TV PC Internet Telephony Telephony Suscribers
%

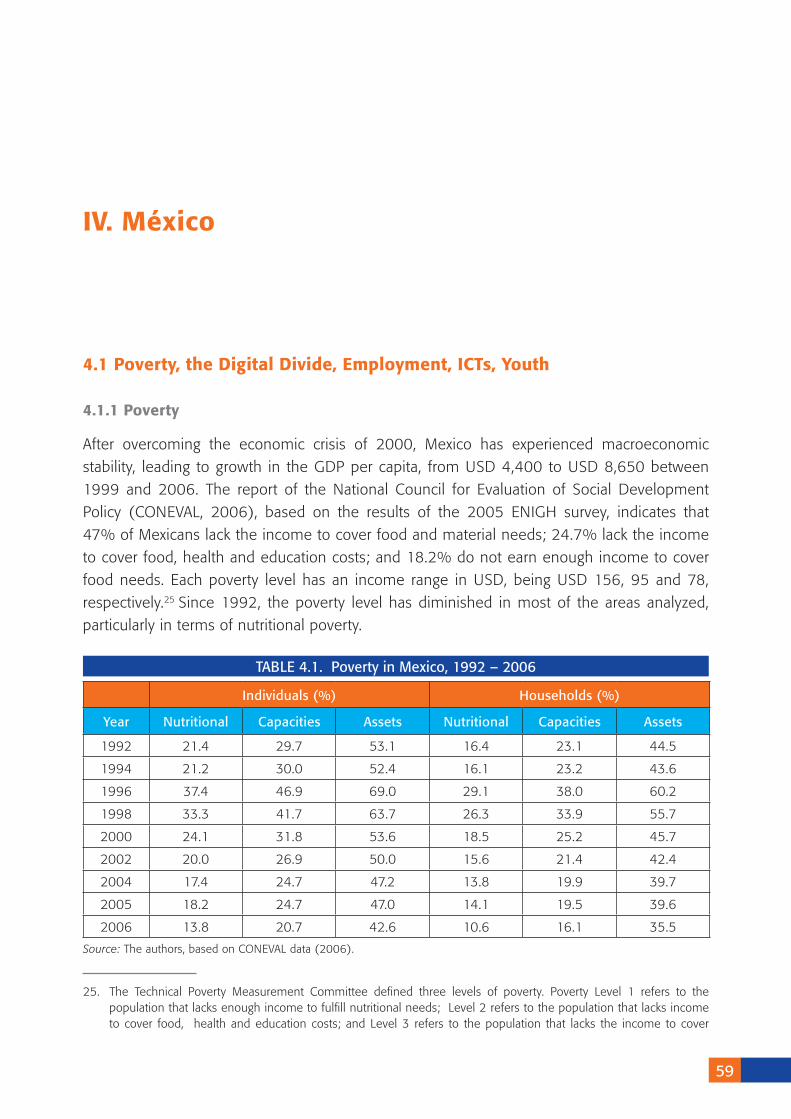
5�
4.1Poverty,theDigitalDivide,Employment,ICTs,Youth
4.1.1Poverty
After overcoming the economic crisis of 2000, Mexico has experienced macroeconomic stability, leading to growth in the GDP per capita, from USD 4,400 to USD 8,650 between 1999 and 2006. The report of the National Council for Evaluation of Social Development Policy (CONEVAL, 2006), based on the results of the 2005 ENIGH survey, indicates that 47% of Mexicans lack the income to cover food and material needs; 24.7% lack the income to cover food, health and education costs; and 18.2% do not earn enough income to cover food needs. Each poverty level has an income range in USD, being USD 156, 95 and 78, respectively.25 Since 1992, the poverty level has diminished in most of the areas analyzed, particularly in terms of nutritional poverty.
IV.México
25. The Technical Poverty Measurement Committee defined three levels of poverty. Poverty Level 1 refers to the population that lacks enough income to fulfill nutritional needs; Level 2 refers to the population that lacks income to cover food, health and education costs; and Level 3 refers to the population that lacks the income to cover
Individuals (%) Households (%)
Year Nutritional Capacities Assets Nutritional Capacities Assets
1992 21.4 29.7 53.1 16.4 23.1 44.5
1994 21.2 30.0 52.4 16.1 23.2 43.6
1996 37.4 46.9 69.0 29.1 38.0 60.2
1998 33.3 41.7 63.7 26.3 33.9 55.7
2000 24.1 31.8 53.6 18.5 25.2 45.7
2002 20.0 26.9 50.0 15.6 21.4 42.4
2004 17.4 24.7 47.2 13.8 19.9 39.7
2005 18.2 24.7 47.0 14.1 19.5 39.6
2006 13.8 20.7 42.6 10.6 16.1 35.5
TABLE 4.1. Poverty in Mexico, 1��2 – 2006
Source: The authors, based on CONEVAL data (2006).
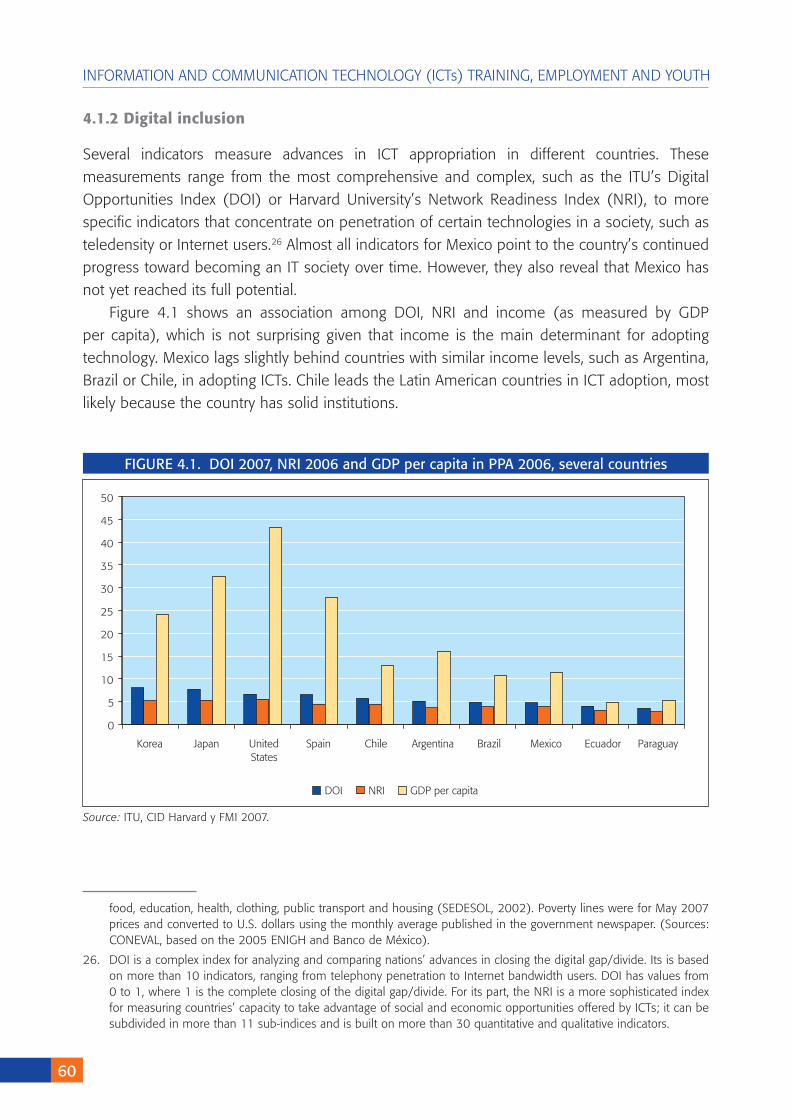
60
INFORMATION AND COMMUNICATION TECHNOLOGY (ICTs) TRAINING, EMPLOYMENT AND YOUTH
4.1.2Digitalinclusion
Several indicators measure advances in ICT appropriation in different countries. These measurements range from the most comprehensive and complex, such as the ITU’s Digital Opportunities Index (DOI) or Harvard University’s Network Readiness Index (NRI), to more specific indicators that concentrate on penetration of certain technologies in a society, such as teledensity or Internet users.26 Almost all indicators for Mexico point to the country’s continued progress toward becoming an IT society over time. However, they also reveal that Mexico has not yet reached its full potential.
Figure 4.1 shows an association among DOI, NRI and income (as measured by GDP per capita), which is not surprising given that income is the main determinant for adopting technology. Mexico lags slightly behind countries with similar income levels, such as Argentina, Brazil or Chile, in adopting ICTs. Chile leads the Latin American countries in ICT adoption, most likely because the country has solid institutions.
FIGURE 4.1. DOI 200�, NRI 2006 and GDP per capita in PPA 2006, several countries
Source: ITU, CID Harvard y FMI 2007.
0
5
10
15
20
25
30
35
40
45
50
Korea Japan UnitedStates
Spain Chile Argentina Brazil Mexico Ecuador Paraguay
DOI NRI GDP per capita
food, education, health, clothing, public transport and housing (SEDESOL, 2002). Poverty lines were for May 2007 prices and converted to U.S. dollars using the monthly average published in the government newspaper. (Sources: CONEVAL, based on the 2005 ENIGH and Banco de México).
26. DOI is a complex index for analyzing and comparing nations’ advances in closing the digital gap/divide. Its is based on more than 10 indicators, ranging from telephony penetration to Internet bandwidth users. DOI has values from 0 to 1, where 1 is the complete closing of the digital gap/divide. For its part, the NRI is a more sophisticated index for measuring countries’ capacity to take advantage of social and economic opportunities offered by ICTs; it can be subdivided in more than 11 sub-indices and is built on more than 30 quantitative and qualitative indicators.
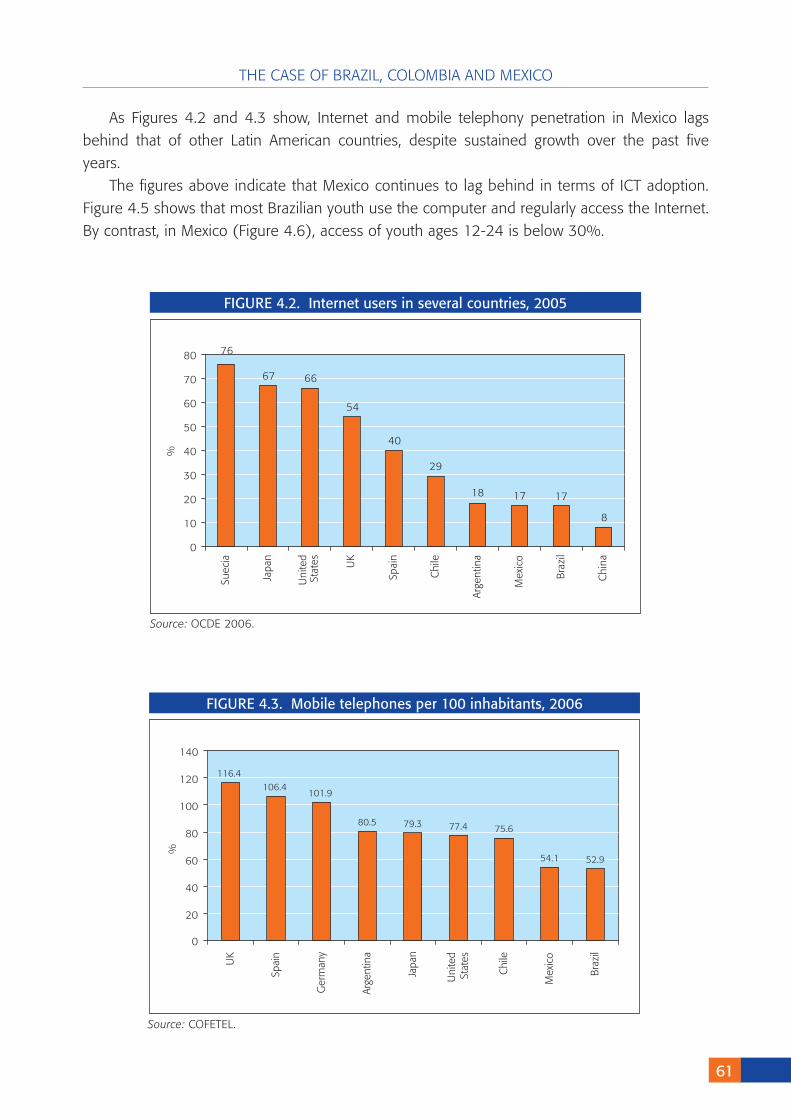
THE CASE OF BRAZIL, COLOMBIA AND MEXICO
61
FIGURE 4.2. Internet users in several countries, 2005
Source: OCDE 2006.
76
67 66
54
40
29
18 17
8
0
10
20
30
40
50
60
70
80
Suec
ia
Japa
n
Uni
ted
Stat
es UK
Spai
n
Chi
le
Arge
ntin
a
Mex
ico
Bra
zil
Chi
na
%
17
FIGURE 4.3. Mobile telephones per 100 inhabitants, 2006
Source: COFETEL.
116.4106.4
101.9
80.5 79.3 77.4 75.6
54.1 52.9
0
20
40
60
80
100
120
140
UK
Spai
n
Ger
man
y
Arge
ntin
a
Japa
n
Uni
ted
Stat
es
Chi
le
Mex
ico
Braz
il
%
As Figures 4.2 and 4.3 show, Internet and mobile telephony penetration in Mexico lags behind that of other Latin American countries, despite sustained growth over the past five years.
The figures above indicate that Mexico continues to lag behind in terms of ICT adoption. Figure 4.5 shows that most Brazilian youth use the computer and regularly access the Internet. By contrast, in Mexico (Figure 4.6), access of youth ages 12-24 is below 30%.
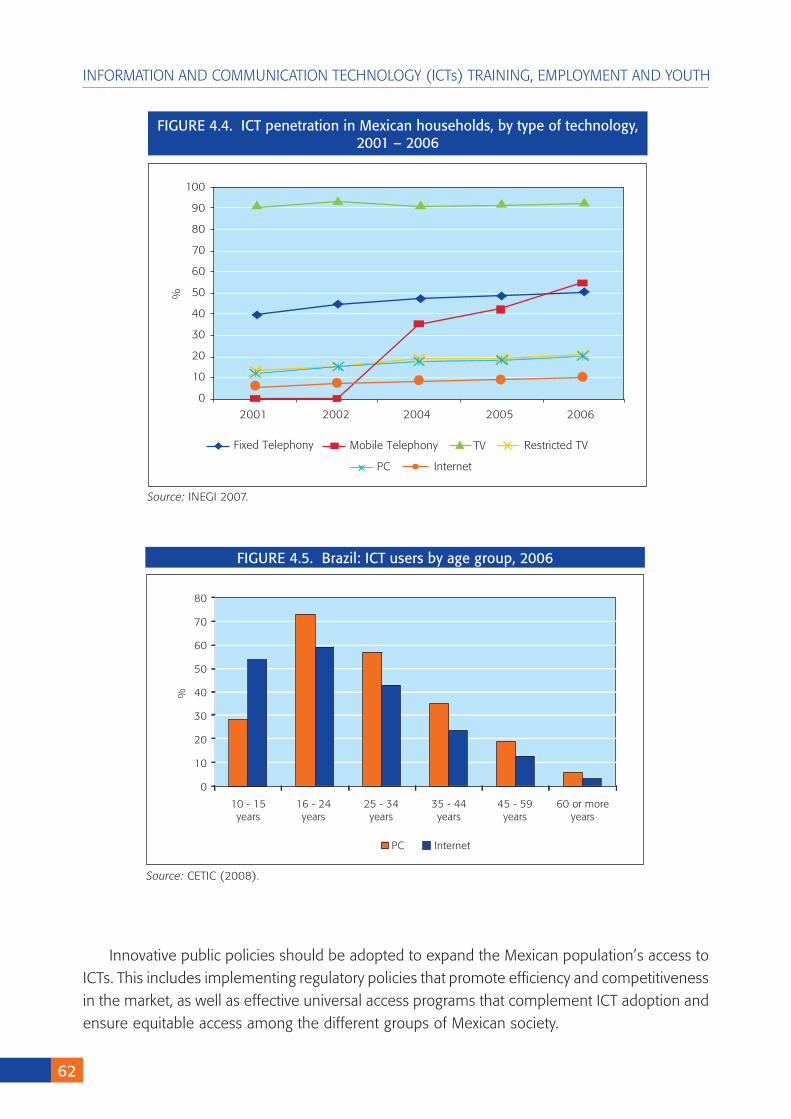
62
INFORMATION AND COMMUNICATION TECHNOLOGY (ICTs) TRAINING, EMPLOYMENT AND YOUTH
Innovative public policies should be adopted to expand the Mexican population’s access to ICTs. This includes implementing regulatory policies that promote efficiency and competitiveness in the market, as well as effective universal access programs that complement ICT adoption and ensure equitable access among the different groups of Mexican society.
FIGURE 4.4. ICT penetration in Mexican households, by type of technology, 2001 – 2006
Source: INEGI 2007.
2001 2002 2004 2005 2006
Fixed Telephony Mobile Telephony TV Restricted TV
PC Internet
100
90
80
70
60
50
40
30
20
10
0
%
FIGURE 4.5. Brazil: ICT users by age group, 2006
Source: CETIC (2008).
10 - 15 16 - 24 25 - 34 35 - 44 45 - 59 60 or more years years years years years years
PC Internet
80
70
60
50
40
30
20
10
0
%
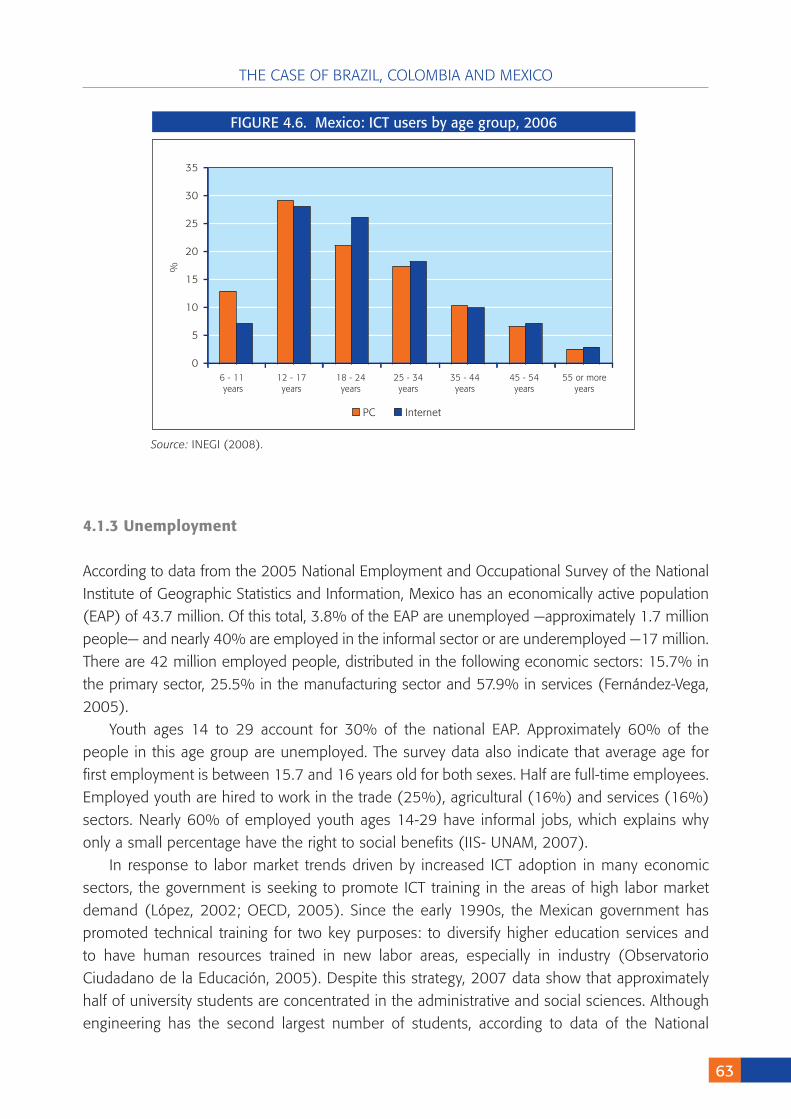
THE CASE OF BRAZIL, COLOMBIA AND MEXICO
63
4.1.3Unemployment
According to data from the 2005 National Employment and Occupational Survey of the National Institute of Geographic Statistics and Information, Mexico has an economically active population (EAP) of 43.7 million. Of this total, 3.8% of the EAP are unemployed —approximately 1.7 million people— and nearly 40% are employed in the informal sector or are underemployed —17 million. There are 42 million employed people, distributed in the following economic sectors: 15.7% in the primary sector, 25.5% in the manufacturing sector and 57.9% in services (Fernández-Vega, 2005).
Youth ages 14 to 29 account for 30% of the national EAP. Approximately 60% of the people in this age group are unemployed. The survey data also indicate that average age for first employment is between 15.7 and 16 years old for both sexes. Half are full-time employees. Employed youth are hired to work in the trade (25%), agricultural (16%) and services (16%) sectors. Nearly 60% of employed youth ages 14-29 have informal jobs, which explains why only a small percentage have the right to social benefits (IIS- UNAM, 2007).
In response to labor market trends driven by increased ICT adoption in many economic sectors, the government is seeking to promote ICT training in the areas of high labor market demand (López, 2002; OECD, 2005). Since the early 1990s, the Mexican government has promoted technical training for two key purposes: to diversify higher education services and to have human resources trained in new labor areas, especially in industry (Observatorio Ciudadano de la Educación, 2005). Despite this strategy, 2007 data show that approximately half of university students are concentrated in the administrative and social sciences. Although engineering has the second largest number of students, according to data of the National
FIGURE 4.6. Mexico: ICT users by age group, 2006
Source: INEGI (2008).
PC Internet
35
30
25
20
15
10
5
0 6 - 11 12 - 17 18 - 24 25 - 34 35 - 44 45 - 54 55 or more years years years years years years years
%
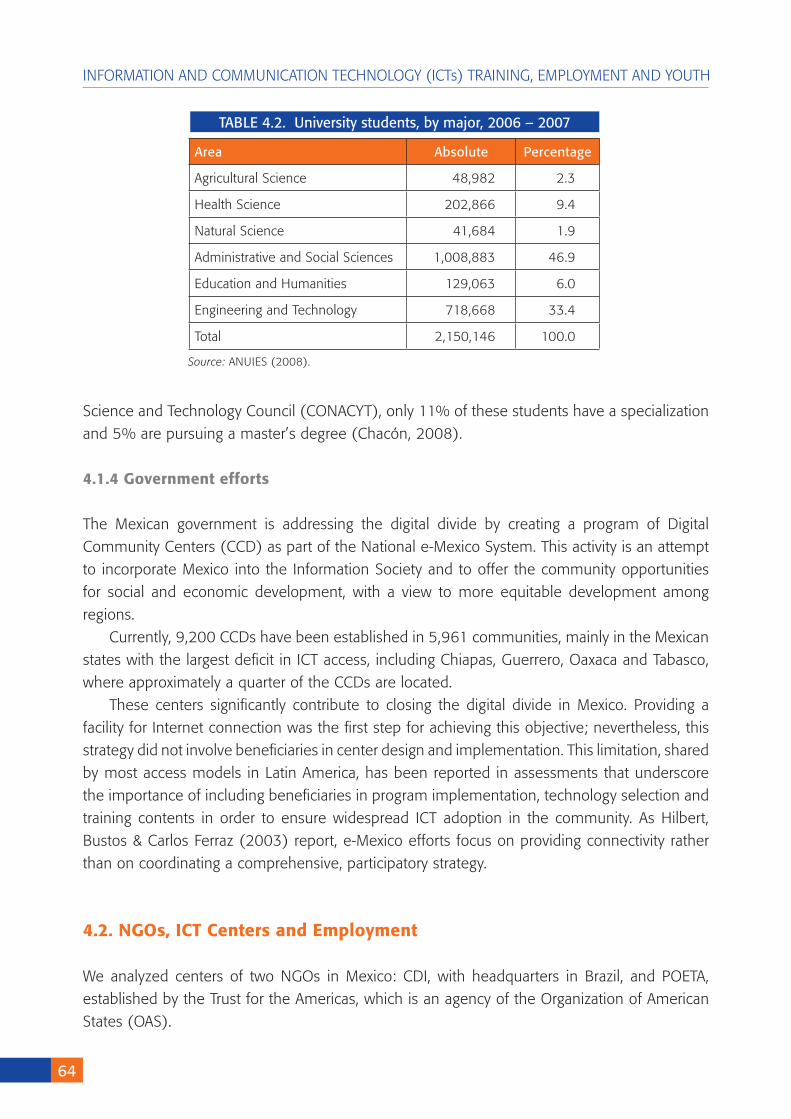
64
INFORMATION AND COMMUNICATION TECHNOLOGY (ICTs) TRAINING, EMPLOYMENT AND YOUTH
Science and Technology Council (CONACYT), only 11% of these students have a specialization and 5% are pursuing a master’s degree (Chacón, 2008).
4.1.4Governmentefforts
The Mexican government is addressing the digital divide by creating a program of Digital Community Centers (CCD) as part of the National e-Mexico System. This activity is an attempt to incorporate Mexico into the Information Society and to offer the community opportunities for social and economic development, with a view to more equitable development among regions.
Currently, 9,200 CCDs have been established in 5,961 communities, mainly in the Mexican states with the largest deficit in ICT access, including Chiapas, Guerrero, Oaxaca and Tabasco, where approximately a quarter of the CCDs are located.
These centers significantly contribute to closing the digital divide in Mexico. Providing a facility for Internet connection was the first step for achieving this objective; nevertheless, this strategy did not involve beneficiaries in center design and implementation. This limitation, shared by most access models in Latin America, has been reported in assessments that underscore the importance of including beneficiaries in program implementation, technology selection and training contents in order to ensure widespread ICT adoption in the community. As Hilbert, Bustos & Carlos Ferraz (2003) report, e-Mexico efforts focus on providing connectivity rather than on coordinating a comprehensive, participatory strategy.
4.2.NGOs,ICTCentersandEmployment
We analyzed centers of two NGOs in Mexico: CDI, with headquarters in Brazil, and POETA, established by the Trust for the Americas, which is an agency of the Organization of American States (OAS).
Area Absolute Percentage
Agricultural Science 48,982 2.3
Health Science 202,866 9.4
Natural Science 41,684 1.9
Administrative and Social Sciences 1,008,883 46.9
Education and Humanities 129,063 6.0
Engineering and Technology 718,668 33.4
Total 2,150,146 100.0
TABLE 4.2. University students, by major, 2006 – 200�
Source: ANUIES (2008).
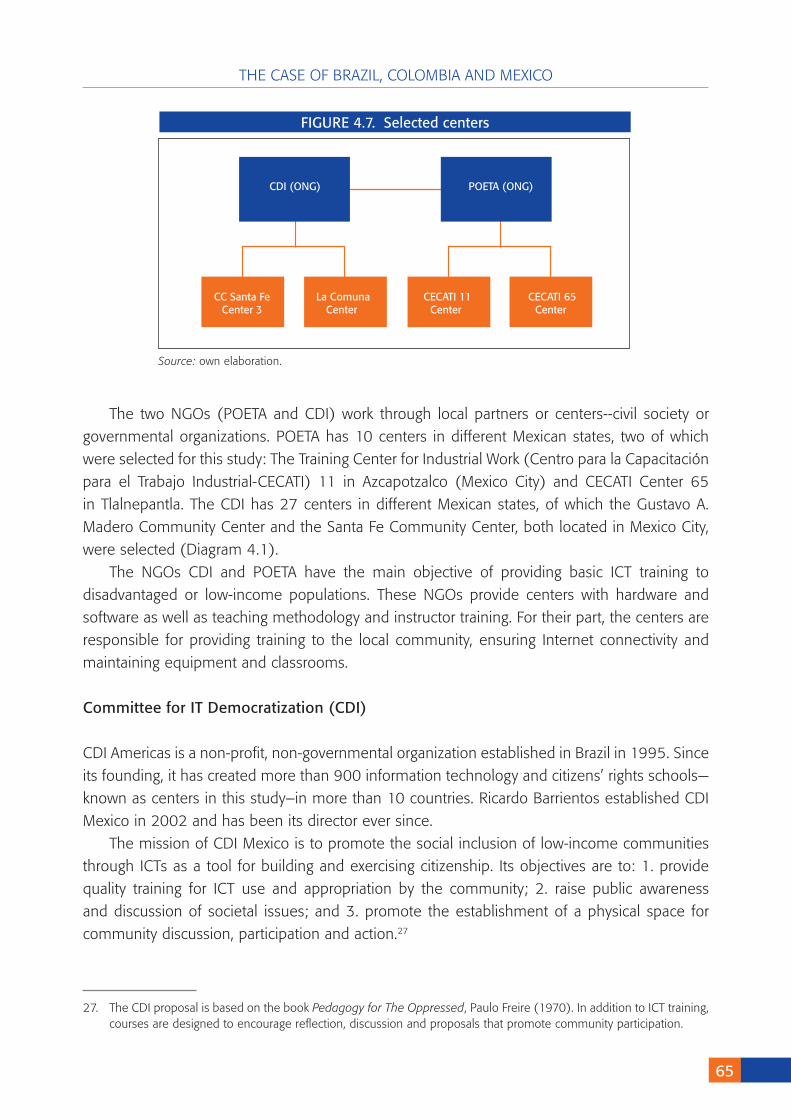
THE CASE OF BRAZIL, COLOMBIA AND MEXICO
65
The two NGOs (POETA and CDI) work through local partners or centers--civil society or governmental organizations. POETA has 10 centers in different Mexican states, two of which were selected for this study: The Training Center for Industrial Work (Centro para la Capacitación para el Trabajo Industrial-CECATI) 11 in Azcapotzalco (Mexico City) and CECATI Center 65 in Tlalnepantla. The CDI has 27 centers in different Mexican states, of which the Gustavo A. Madero Community Center and the Santa Fe Community Center, both located in Mexico City, were selected (Diagram 4.1).
The NGOs CDI and POETA have the main objective of providing basic ICT training to disadvantaged or low-income populations. These NGOs provide centers with hardware and software as well as teaching methodology and instructor training. For their part, the centers are responsible for providing training to the local community, ensuring Internet connectivity and maintaining equipment and classrooms.
Committee for IT Democratization (CDI)
CDI Americas is a non-profit, non-governmental organization established in Brazil in 1995. Since its founding, it has created more than 900 information technology and citizens’ rights schools—known as centers in this study–in more than 10 countries. Ricardo Barrientos established CDI Mexico in 2002 and has been its director ever since.
The mission of CDI Mexico is to promote the social inclusion of low-income communities through ICTs as a tool for building and exercising citizenship. Its objectives are to: 1. provide quality training for ICT use and appropriation by the community; 2. raise public awareness and discussion of societal issues; and 3. promote the establishment of a physical space for community discussion, participation and action.27
FIGURE 4.�. Selected centers
CDI (ONG) POETA (ONG)
CC Santa FeCenter 3
La ComunaCenter
CECATI 11Center
CECATI 65Center
Source: own elaboration.
27. The CDI proposal is based on the book Pedagogy for The Oppressed, Paulo Freire (1970). In addition to ICT training, courses are designed to encourage reflection, discussion and proposals that promote community participation.
66
INFORMATION AND COMMUNICATION TECHNOLOGY (ICTs) TRAINING, EMPLOYMENT AND YOUTH
CDI Mexico is responsible for generating its own financial resources. Government information is accessible from it website, www.cdimexico.org, although complete and updated information is not available.
Partnership in Opportunities for Employment through Technologiesin the Americas (POETA)
In April 2005, the OAS28 Trust for the Americas established POETA. POETA centers have the objective of providing ICT training to promote employability among disabled and disadvantaged groups.29 Its goals are to enrich the lives of these individuals, democratize connectivity in marginalized communities of the Americas and create long-term, lasting change for people. Public information such as a web site is not available for POETA Mexico Centers.
Centers supported by CDI
La Comuna (Gustavo A. Madero)
La Comuna, or the Integral Support Program for Unemployed Youth, was established by the government’s Youth Institute in 2000. Its goal is to assist at-risk, unemployed youth (ages 15 to 29) who are experiencing problems finding jobs to develop alternatives for achieving their goals,30 promoting their social and productive integration, the exercise of their rights and improved coexistence within the family and the community.31
Santa Fe Community Center
Santa Fe Community Center (Centro Comunitario Santa Fe, A.C.32) was established in 2005 to provide education, health, psycho-social and other services to the Santa Fe hillside community. This Mexico City neighborhood has high poverty and marginalization rates.33 The center’s mission is to promote personal dignity and skills by implementing social programs in marginalized areas that actively contribute to the integral development of the family through shared experiences among diverse communities.34
28. The Organization of American States (OAS) is the region’s principal multilateral forum for strengthening democracy, promoting human rights and confronting shared problems such as poverty, terrorism, illegal drugs and corruption.
29. POETA and CDI have two population groups attending their centers. Beneficiaries include all individuals who join the program for training and who spend part of their time in training courses, whereas users are those community members who use the center to take advantage of available resources (Internet, computers, software, etc, who may not participate in training. This study is concerned with beneficiaries.
30. www.dgec.df.gob.
31. This project is based on the model of the French Misión Locale association, which strives to overcome unemployment and social exclusion among youth by providing personalized, comprehensive training and employment services.
32 . Santa Fe Community Center began operations as Santa María community kitchen, which offers meals to Santa Fe residents living in poverty. It is located next to Jalapa el Grande Church.
33. Annual Report, Santa Fe Community Center, 2006
34. Voluntary Service Leaflet, February 2008
THE CASE OF BRAZIL, COLOMBIA AND MEXICO
6�
POETA-supported Centers
Center for Industrial Job Training, CECATI 11 and CECATI 65
The CECATI 11 and CECATI 65 centers report directly to the Ministry of Public Education. Their goal is to provide job training. Courses are 20% theoretical and 80% practical, allowing students to integrate knowledge, skills and attitudes regarding the labor market in as short a time as possible and in keeping with labor market needs.35
The objectives of POETA and CDI are compatible with the objectives of the four centers studied. They all strive to offer ICT training to low-income individuals in an effort to reduce the barriers these people face in the labor market. With these NGOs’ support, centers increase and diversify their course offering, serving new groups and community needs. CECATI 11, CECATI 65 and La Comuna have the explicit objective of providing job training as their main activity. The Santa Fe center also provides job training as part of its efforts to promote individual and community development.
4.3.Internalanalysis:relevanceforthelabormarket
The cases studied include transnational, national, private, public and civil society efforts which, to varying degrees, support different community centers that face the daunting task of providing ICT training to disadvantaged individuals to promote their personal development and improved performance in labor market.
This support includes experience, knowledge and resources-financing, facilities, infrastructure, equipment, software, instructors, connectivity, training materials and job placement services. Centers strive to be self-sustainable and at the same time support low-income communities as well as well as marginalized individuals and those with disabilities. These two goals make its sustained operation difficult. Offering training courses is insufficient for generating the necessary resources to operate the centers given the target population’s limited ability to pay. In fact, none of the four centers studied has become self-sustainable through funds obtained from courses. Centers receive support from the government and private firms, which makes them vulnerable to changes in public policies, government programs and sponsorship arrangements.
As in the other two countries, we studied a series of variables regarding the NGOs’ organizational capacity to introduce individuals into the labor market. The goal is to determine how these centers are organizationally established to serve the population and contribute to their employability.
Important differences among the centers are observed with respect to available financial resources. CECATI 11 and Santa Fe centers have the necessary resources to implement the activities needed to meet objectives. La Comuna and CECATI 65 have financial problems, for which reason they do not have an Internet bandwidth connection and have difficulty maintaining
35. Publication of the General Operations Office of Job Training Centers in Mexico City, 2005, p. 5.
6�
INFORMATION AND COMMUNICATION TECHNOLOGY (ICTs) TRAINING, EMPLOYMENT AND YOUTH
equipment in optimal condition. Neither do these centers provide training and incentives for teachers. The lack of resources significantly affects the centers’ ability to fulfill objectives, especially the lack of an Internet connection.
La Comuna center received support from an instructor paid by CECATI for nearly two and a half years, although the center is not currently receiving this support. The instructor receives 80% of the fees paid by students –about USD 200 per month. Coordinator Daniel Gutiérrez blames the high instructor turnover on the lack of resources. There is little demand for the courses given the lack of an Internet connection.36 The CECATI 65 center faces similar problems since the POETA classroom has not had Internet access for almost a year. Director Pedro Gutierrez explained that the center lacks the funds to repair the technical problems.
These cases reveal how the lack of financial resources directly affects beneficiaries’ training because of their impact on available infrastructure. Although the four centers have infrastructure, facilities and basic services (at least 10 Pentium IV computers, software and training material), there are substantial differences among them. CECATI 11 and Santa Fe centers have additional equipment, such as digital cameras, electronic boards, scanners and photocopiers, as well as Internet bandwidth connections. By contrast, La Comuna and CECATI 65 do not have Internet bandwidth connections and equipment maintenance is inadequate. The lack of Internet access and full-time instructors hinders students from developing skills in information search, selection and e-mail, putting them at a disadvantage when competing in the labor market.
The Santa Fe center has committed volunteers, which have established an important network of sponsors who donate resources. Volunteers also maintain partnerships with a variety of schools and universities. Thanks to the large demand for courses and the support of sponsors and volunteers, the center is undergoing a period of growth and institutionalization. The center plans to build a spacious new computer room and to expand and diversify its course offering.37
All centers offer basic ICT courses, except the Santa Fe center, where courses have been expanded to include Intel, CDI 1, CDI 2 basic programs, preventive maintenance, CDI 3 and microenterprise development, which teaches the basic steps for establishing a business, with support from different programs and the Prep@net program of Tecnológico de Monterrey, which offers online courses. Partnerships make a major contribution to hiring graduates by offering concrete job opportunities that enable beneficiaries to put their new ICT skills to immediate use. The centers’ efficient job placement services makes ICT training more relevant because it offers tangible opportunities.
The CECATI 11 center has forged partnerships with the private and public sectors for employee training and hiring of graduates.38 Center Director Norma González highlights the
36. Information provided during an interview with Daniel Gutiérrez, coordinator of La Comuna Gustavo A. Madero, and Fernando Rojas, coordinator of La Comuna Miguel Hidalgo, March 5, 2008.
37. Interview with computer instructor Mario Alberto Mejía, March 3, 2008.
38. Information based on an interview with Norma González, CECAT 11 director, February 27, 2008, and the 2006-2007 Accountability Report.
THE CASE OF BRAZIL, COLOMBIA AND MEXICO
6�
partnership with the Federal District Ministry of Labor, through which 16 people with disabilities were hired to work in government agencies. Currently, the center is establishing a partnership with the Azcapotzalco regional office for the hiring of POETA graduates at its telemarketing center.39 CECATI 65 does not have a formal job placement service but does advertise job offers. La Comuna has a job placement service; however, it only provides global information on the centers and courses offered rather than specific information on La Comuna graduates. The Santa Fe center does not offer job placement services and does not form partnerships for the hiring of graduates.40
It was not possible to determine graduates’ employment status as the centers do not have a tracking system. The CECATI centers have a mandatory follow up procedure. CECATI 11 has information on all courses in its 2006-2007 Accountability Report; however, there are no POETA graduates. The CECATI 65 center could not provide any information. La Comuna and Santa Fe centers do not have graduate follow-up procedures. It is essential to develop a detailed system to track graduates in order to obtain detailed information on the relationship between ICT training and youth employment.
Certificates issued to graduates by the four centers are an acknowledgment of the skills and knowledge acquired during the courses because students are tested during and at the end of each course. This certificate is useful when applying for jobs.
Partnerships depend largely on the capacity of the center director, who should have a thorough knowledge of the center, a clear vision, capacity for innovation as well as a network of contacts and potential partners. CECATI 11 and CECATI 65 are similar institutions that belong to the same government agency; they have the same resource scheme and support the low-income population. Nevertheless, their financial situations differ. The CECATI 11 director has a clear vision with respect to center objectives and organizational limits and believes that establishing partnerships is a key strategy for employing graduates. The director gave precise answers to all questions, providing documentation to support this information. By contrast, the CECATI 65 director has worked for the Ministry of Public Education for more than 20 years and has been employed at the center for one year. He has limited knowledge of the organization and was not able to provide any document or specific information on the center. Staff did not cooperate and the director reported that the center has major financial difficulties. The center has no strategy for generating more income or creating a job placement service.41 These cases underscore the importance of an effective, involved leader (e.g. CECATI 11) who is has an understanding of the center’s situation as well as of its target population.
The centers have university-educated instructors qualified to teach their respective courses. Some have had teacher training. Instructors have been working at the centers for an average of
39. The center has established partnerships with Sedesol (Social Development Ministry) and the Astra Seneca pharmaceutical company, the electric power utility, the military and the Federal District government, among others.
40. Information based on an interview with Norma González, CECATI 11 director, February 27, 2008, and the 2006-2007 Accountability Report.
41. Interview with Pedro Gutiérrez, CECATI 65 director, February 28, 2008.
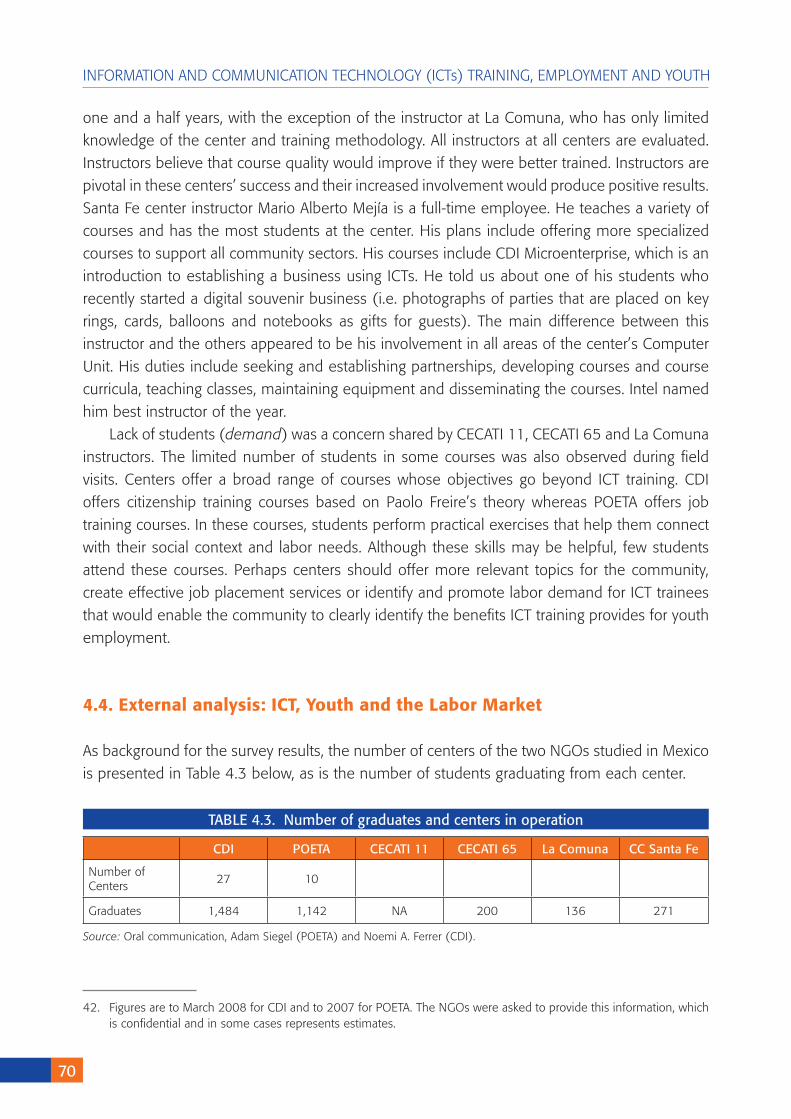
�0
INFORMATION AND COMMUNICATION TECHNOLOGY (ICTs) TRAINING, EMPLOYMENT AND YOUTH
one and a half years, with the exception of the instructor at La Comuna, who has only limited knowledge of the center and training methodology. All instructors at all centers are evaluated. Instructors believe that course quality would improve if they were better trained. Instructors are pivotal in these centers’ success and their increased involvement would produce positive results. Santa Fe center instructor Mario Alberto Mejía is a full-time employee. He teaches a variety of courses and has the most students at the center. His plans include offering more specialized courses to support all community sectors. His courses include CDI Microenterprise, which is an introduction to establishing a business using ICTs. He told us about one of his students who recently started a digital souvenir business (i.e. photographs of parties that are placed on key rings, cards, balloons and notebooks as gifts for guests). The main difference between this instructor and the others appeared to be his involvement in all areas of the center’s Computer Unit. His duties include seeking and establishing partnerships, developing courses and course curricula, teaching classes, maintaining equipment and disseminating the courses. Intel named him best instructor of the year.
Lack of students (demand) was a concern shared by CECATI 11, CECATI 65 and La Comuna instructors. The limited number of students in some courses was also observed during field visits. Centers offer a broad range of courses whose objectives go beyond ICT training. CDI offers citizenship training courses based on Paolo Freire’s theory whereas POETA offers job training courses. In these courses, students perform practical exercises that help them connect with their social context and labor needs. Although these skills may be helpful, few students attend these courses. Perhaps centers should offer more relevant topics for the community, create effective job placement services or identify and promote labor demand for ICT trainees that would enable the community to clearly identify the benefits ICT training provides for youth employment.
4.4.Externalanalysis:ICT,YouthandtheLaborMarket
As background for the survey results, the number of centers of the two NGOs studied in Mexico is presented in Table 4.3 below, as is the number of students graduating from each center.
42. Figures are to March 2008 for CDI and to 2007 for POETA. The NGOs were asked to provide this information, which is confidential and in some cases represents estimates.
CDI POETA CECATI 11 CECATI 65 La Comuna CC Santa Fe
Number of Centers
27 10
Graduates 1,484 1,142 NA 200 136 271
Source: Oral communication, Adam Siegel (POETA) and Noemi A. Ferrer (CDI).
TABLE 4.3. Number of graduates and centers in operation
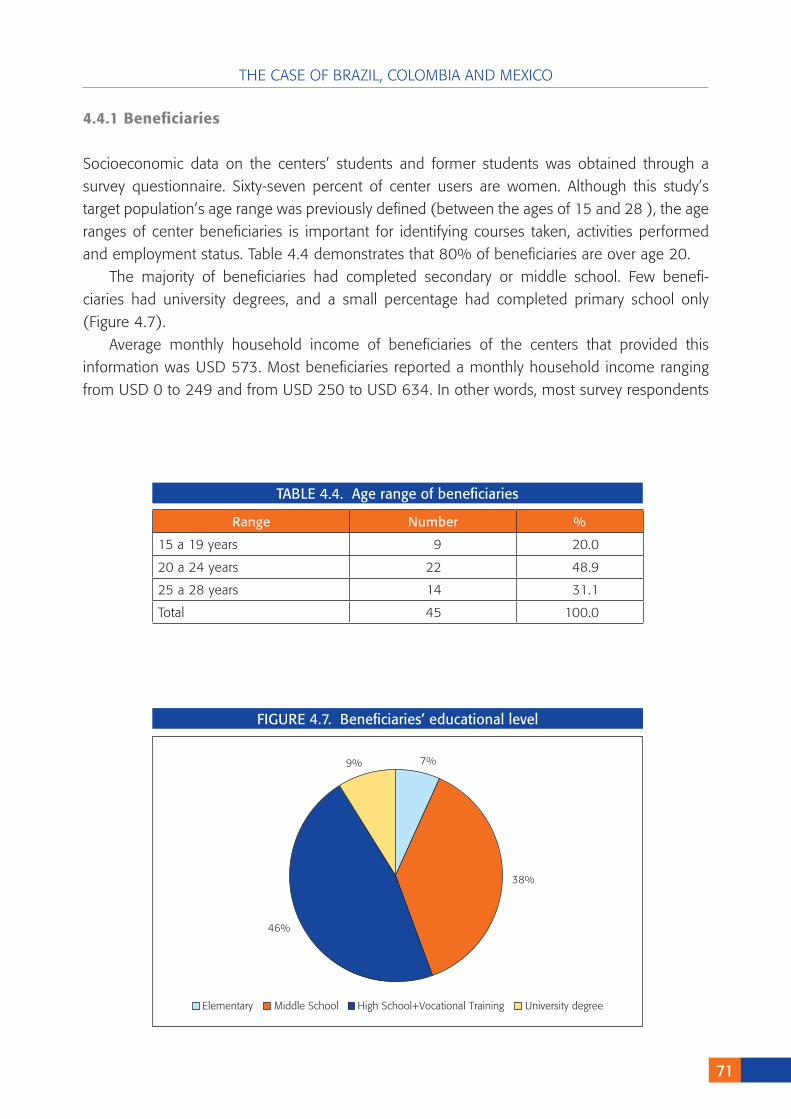
THE CASE OF BRAZIL, COLOMBIA AND MEXICO
�1
4.4.1Beneficiaries
Socioeconomic data on the centers’ students and former students was obtained through a survey questionnaire. Sixty-seven percent of center users are women. Although this study’s target population’s age range was previously defined (between the ages of 15 and 28 ), the age ranges of center beneficiaries is important for identifying courses taken, activities performed and employment status. Table 4.4 demonstrates that 80% of beneficiaries are over age 20.
The majority of beneficiaries had completed secondary or middle school. Few benefi-ciaries had university degrees, and a small percentage had completed primary school only (Figure 4.7).
Average monthly household income of beneficiaries of the centers that provided this information was USD 573. Most beneficiaries reported a monthly household income ranging from USD 0 to 249 and from USD 250 to USD 634. In other words, most survey respondents
7%
38%
46%
9%
Elementary Middle School High School+Vocational Training University degree
FIGURE 4.�. Beneficiaries’ educational level
Range Number %
15 a 19 years 9 20.0
20 a 24 years 22 48.9
25 a 28 years 14 31.1
Total 45 100.0
TABLE 4.4. Age range of beneficiaries
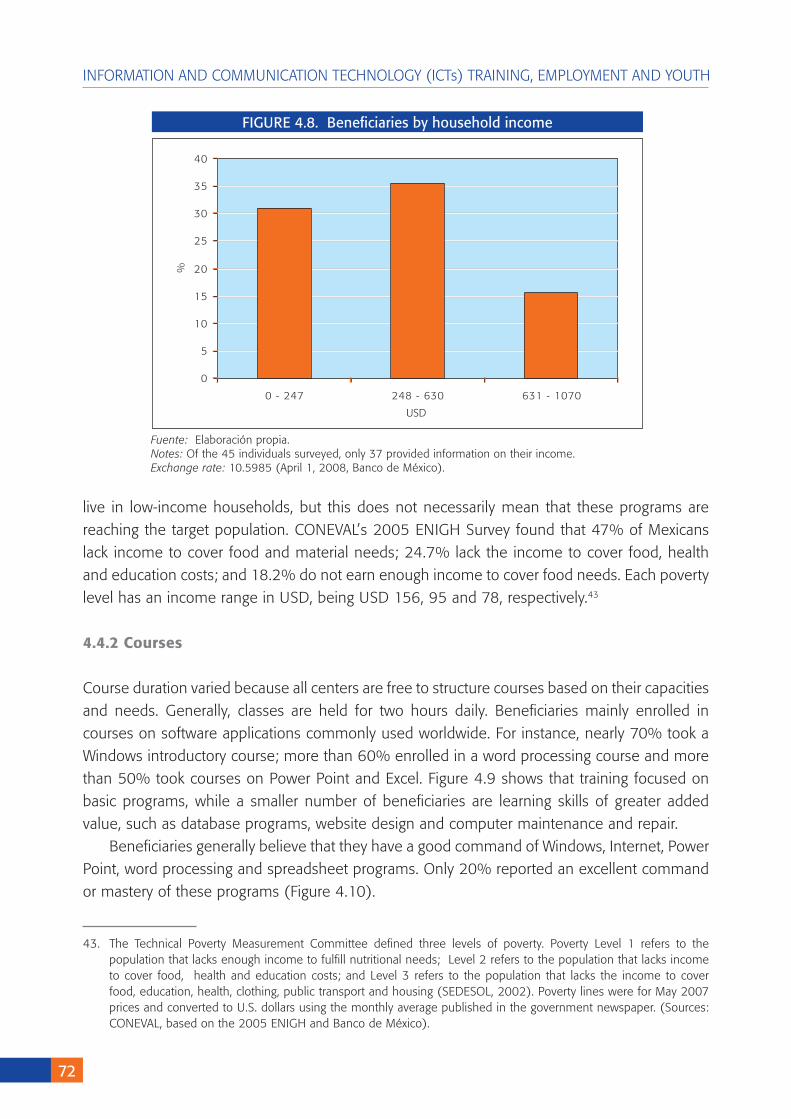
�2
INFORMATION AND COMMUNICATION TECHNOLOGY (ICTs) TRAINING, EMPLOYMENT AND YOUTH
live in low-income households, but this does not necessarily mean that these programs are reaching the target population. CONEVAL’s 2005 ENIGH Survey found that 47% of Mexicans lack income to cover food and material needs; 24.7% lack the income to cover food, health and education costs; and 18.2% do not earn enough income to cover food needs. Each poverty level has an income range in USD, being USD 156, 95 and 78, respectively.43
4.4.2Courses
Course duration varied because all centers are free to structure courses based on their capacities and needs. Generally, classes are held for two hours daily. Beneficiaries mainly enrolled in courses on software applications commonly used worldwide. For instance, nearly 70% took a Windows introductory course; more than 60% enrolled in a word processing course and more than 50% took courses on Power Point and Excel. Figure 4.9 shows that training focused on basic programs, while a smaller number of beneficiaries are learning skills of greater added value, such as database programs, website design and computer maintenance and repair.
Beneficiaries generally believe that they have a good command of Windows, Internet, Power Point, word processing and spreadsheet programs. Only 20% reported an excellent command or mastery of these programs (Figure 4.10).
43. The Technical Poverty Measurement Committee defined three levels of poverty. Poverty Level 1 refers to the population that lacks enough income to fulfill nutritional needs; Level 2 refers to the population that lacks income to cover food, health and education costs; and Level 3 refers to the population that lacks the income to cover food, education, health, clothing, public transport and housing (SEDESOL, 2002). Poverty lines were for May 2007 prices and converted to U.S. dollars using the monthly average published in the government newspaper. (Sources: CONEVAL, based on the 2005 ENIGH and Banco de México).
FIGURE 4.�. Beneficiaries by household income
Fuente: Elaboración propia.Notes: Of the 45 individuals surveyed, only 37 provided information on their income.Exchange rate: 10.5985 (April 1, 2008, Banco de México).
0
5
10
15
20
25
30
35
40
0 - 247 248 - 630 631 - 1070
%
USD
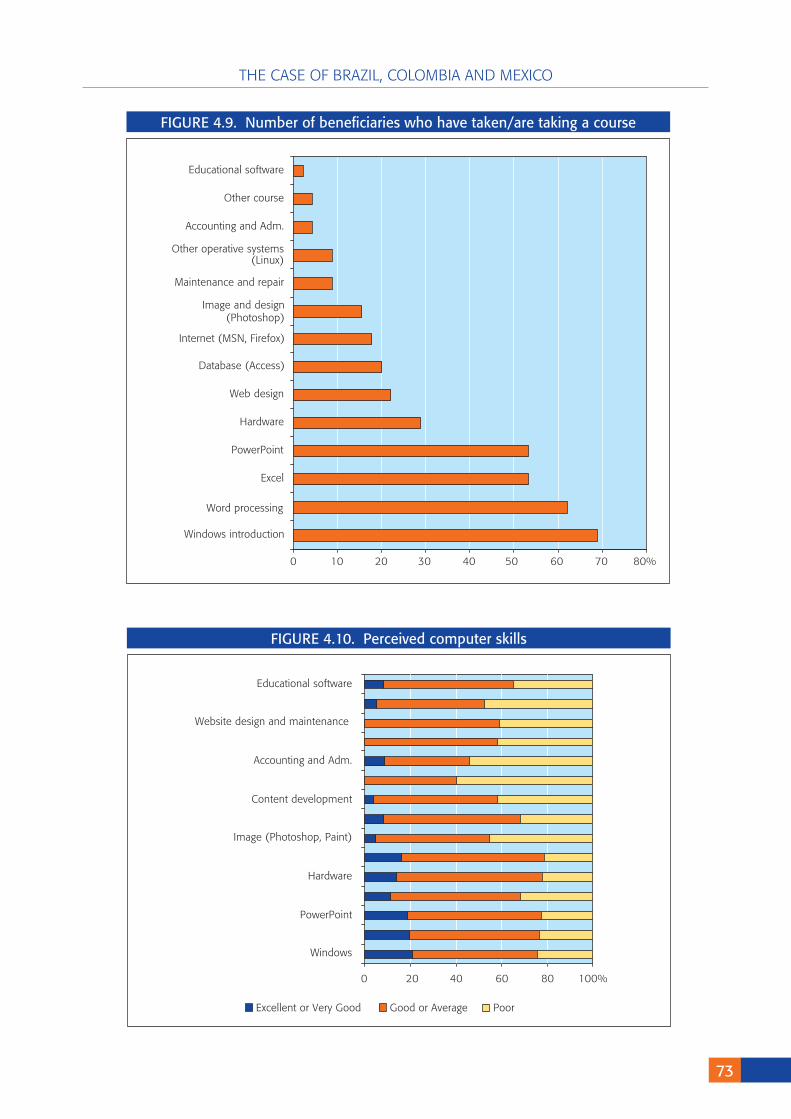
THE CASE OF BRAZIL, COLOMBIA AND MEXICO
�3
FIGURE 4.�. Number of beneficiaries who have taken/are taking a course
0 10 20 30 40 50 60 70 80%
Windows introduction
Word processing
Excel
PowerPoint
Hardware
Web design
Database (Access)
Internet (MSN, Firefox)
Image and design(Photoshop)
Maintenance and repair
Other operative systems(Linux)
Accounting and Adm.
Other course
Educational software
FIGURE 4.10. Perceived computer skills
0 20 40 60 80 100%
Windows
PowerPoint
Hardware
Image (Photoshop, Paint)
Content development
Accounting and Adm.
Website design and maintenance
Educational software
Excellent or Very Good Good or Average Poor
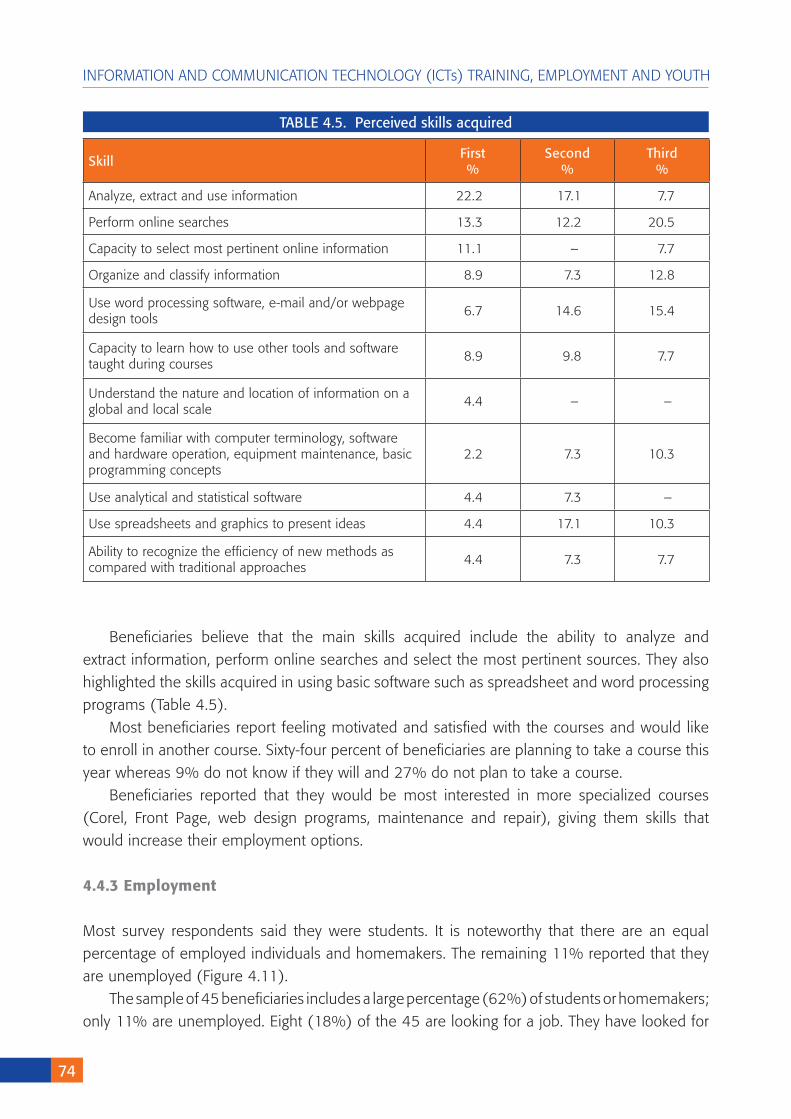
�4
INFORMATION AND COMMUNICATION TECHNOLOGY (ICTs) TRAINING, EMPLOYMENT AND YOUTH
Beneficiaries believe that the main skills acquired include the ability to analyze and extract information, perform online searches and select the most pertinent sources. They also highlighted the skills acquired in using basic software such as spreadsheet and word processing programs (Table 4.5).
Most beneficiaries report feeling motivated and satisfied with the courses and would like to enroll in another course. Sixty-four percent of beneficiaries are planning to take a course this year whereas 9% do not know if they will and 27% do not plan to take a course.
Beneficiaries reported that they would be most interested in more specialized courses (Corel, Front Page, web design programs, maintenance and repair), giving them skills that would increase their employment options.
4.4.3Employment
Most survey respondents said they were students. It is noteworthy that there are an equal percentage of employed individuals and homemakers. The remaining 11% reported that they are unemployed (Figure 4.11).
The sample of 45 beneficiaries includes a large percentage (62%) of students or homemakers; only 11% are unemployed. Eight (18%) of the 45 are looking for a job. They have looked for
Skill First%
Second%
Third%
Analyze, extract and use information 22.2 17.1 7.7
Perform online searches 13.3 12.2 20.5
Capacity to select most pertinent online information 11.1 – 7.7
Organize and classify information 8.9 7.3 12.8
Use word processing software, e-mail and/or webpage design tools
6.7 14.6 15.4
Capacity to learn how to use other tools and software taught during courses
8.9 9.8 7.7
Understand the nature and location of information on a global and local scale
4.4 – –
Become familiar with computer terminology, software and hardware operation, equipment maintenance, basic programming concepts
2.2 7.3 10.3
Use analytical and statistical software 4.4 7.3 –
Use spreadsheets and graphics to present ideas 4.4 17.1 10.3
Ability to recognize the efficiency of new methods as compared with traditional approaches
4.4 7.3 7.7
TABLE 4.5. Perceived skills acquired
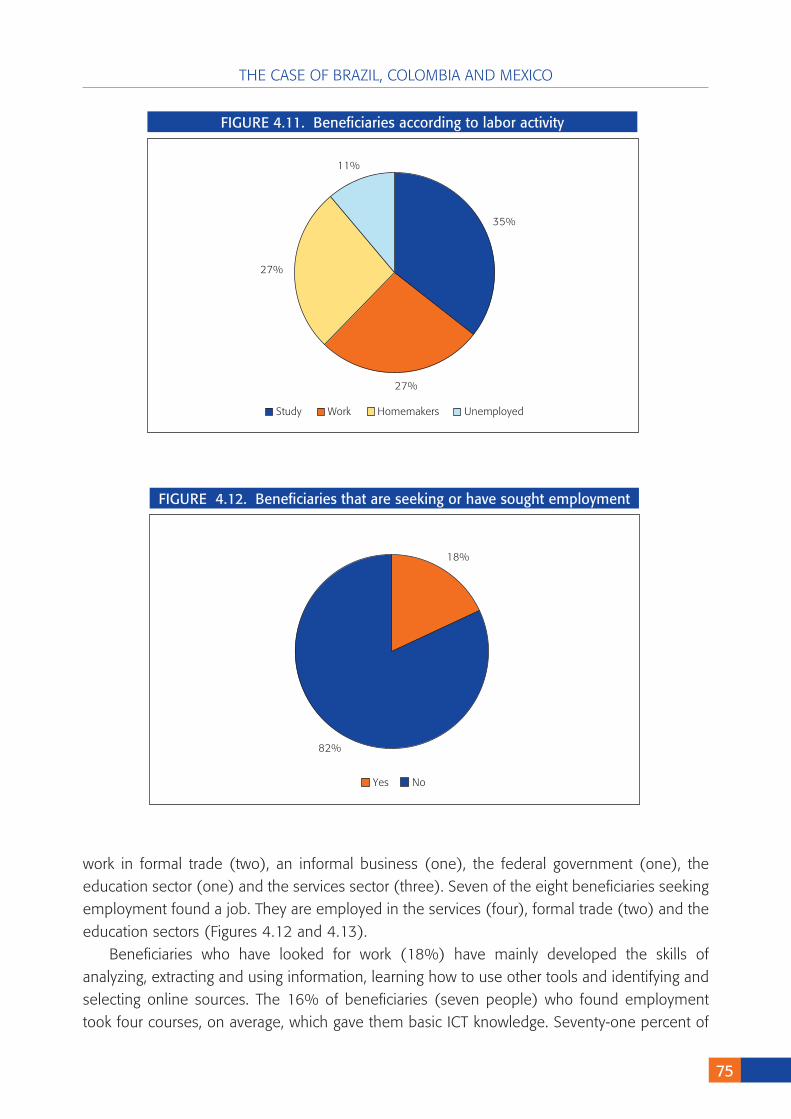
THE CASE OF BRAZIL, COLOMBIA AND MEXICO
�5
FIGURE 4.11. Beneficiaries according to labor activity
35%
27%
27%
11%
Study Work Homemakers Unemployed
FIGURE 4.12. Beneficiaries that are seeking or have sought employment
18%
82%
Yes No
work in formal trade (two), an informal business (one), the federal government (one), the education sector (one) and the services sector (three). Seven of the eight beneficiaries seeking employment found a job. They are employed in the services (four), formal trade (two) and the education sectors (Figures 4.12 and 4.13).
Beneficiaries who have looked for work (18%) have mainly developed the skills of analyzing, extracting and using information, learning how to use other tools and identifying and selecting online sources. The 16% of beneficiaries (seven people) who found employment took four courses, on average, which gave them basic ICT knowledge. Seventy-one percent of
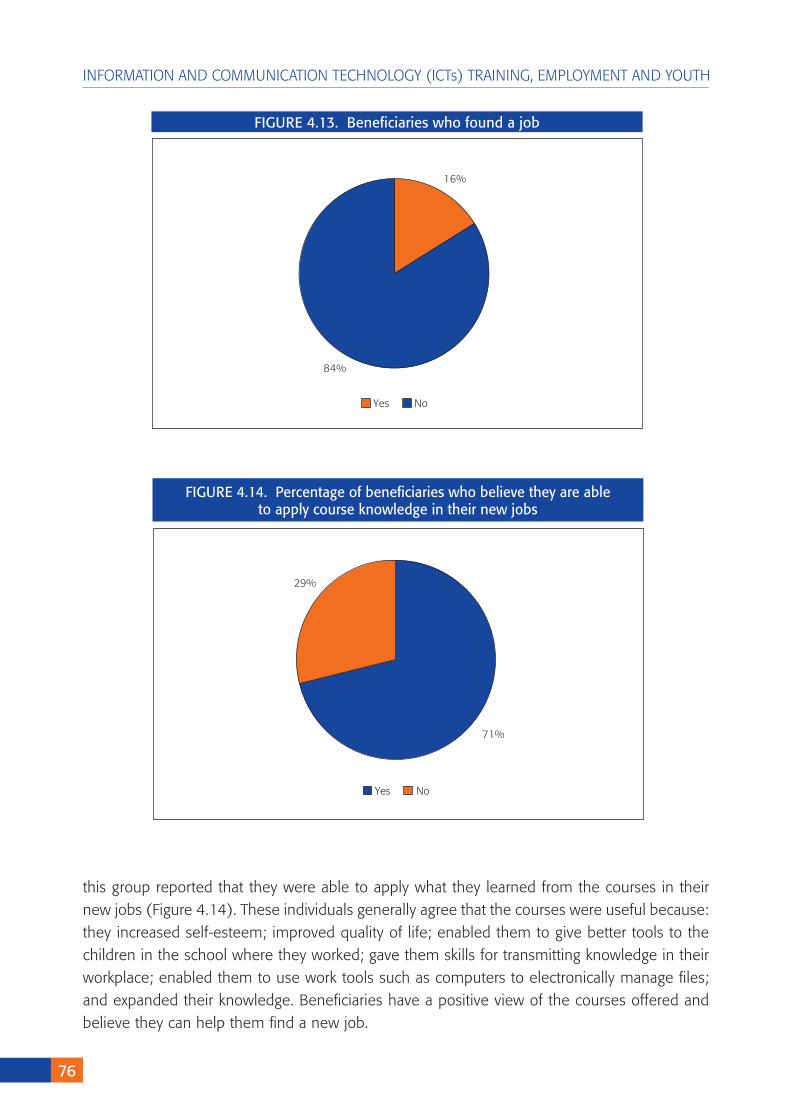
�6
INFORMATION AND COMMUNICATION TECHNOLOGY (ICTs) TRAINING, EMPLOYMENT AND YOUTH
this group reported that they were able to apply what they learned from the courses in their new jobs (Figure 4.14). These individuals generally agree that the courses were useful because: they increased self-esteem; improved quality of life; enabled them to give better tools to the children in the school where they worked; gave them skills for transmitting knowledge in their workplace; enabled them to use work tools such as computers to electronically manage files; and expanded their knowledge. Beneficiaries have a positive view of the courses offered and believe they can help them find a new job.
FIGURE 4.13. Beneficiaries who found a job
16%
84%
Yes No
FIGURE 4.14. Percentage of beneficiaries who believe they are ableto apply course knowledge in their new jobs
71%
29%
Yes No
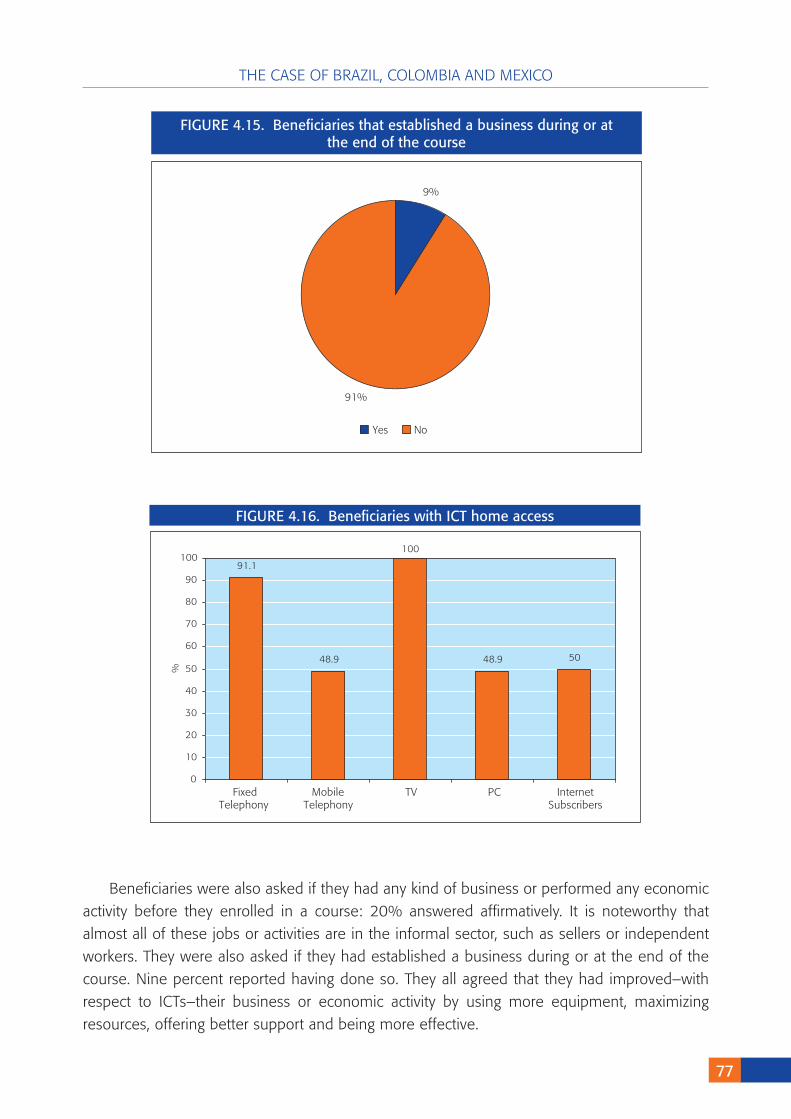
THE CASE OF BRAZIL, COLOMBIA AND MEXICO
��
Beneficiaries were also asked if they had any kind of business or performed any economic activity before they enrolled in a course: 20% answered affirmatively. It is noteworthy that almost all of these jobs or activities are in the informal sector, such as sellers or independent workers. They were also asked if they had established a business during or at the end of the course. Nine percent reported having done so. They all agreed that they had improved–with respect to ICTs–their business or economic activity by using more equipment, maximizing resources, offering better support and being more effective.
FIGURE 4.15. Beneficiaries that established a business during or atthe end of the course
9%
91%
Yes No
FIGURE 4.16. Beneficiaries with ICT home access
91.1
48.9
100
48.9 50
0
10
20
30
40
50
60
70
80
90
100
%
Fixed Mobile TV PC InternetTelephony Telephony Subscribers
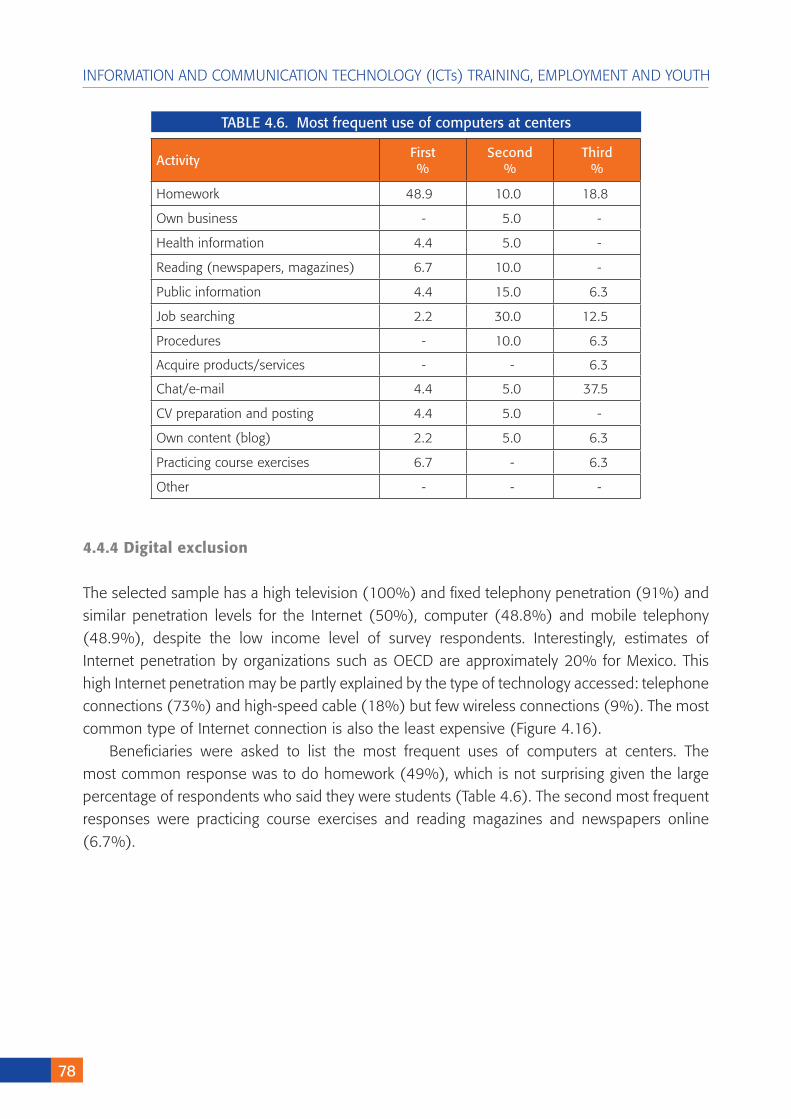
��
INFORMATION AND COMMUNICATION TECHNOLOGY (ICTs) TRAINING, EMPLOYMENT AND YOUTH
4.4.4Digitalexclusion
The selected sample has a high television (100%) and fixed telephony penetration (91%) and similar penetration levels for the Internet (50%), computer (48.8%) and mobile telephony (48.9%), despite the low income level of survey respondents. Interestingly, estimates of Internet penetration by organizations such as OECD are approximately 20% for Mexico. This high Internet penetration may be partly explained by the type of technology accessed: telephone connections (73%) and high-speed cable (18%) but few wireless connections (9%). The most common type of Internet connection is also the least expensive (Figure 4.16).
Beneficiaries were asked to list the most frequent uses of computers at centers. The most common response was to do homework (49%), which is not surprising given the large percentage of respondents who said they were students (Table 4.6). The second most frequent responses were practicing course exercises and reading magazines and newspapers online (6.7%).
Activity First%
Second%
Third%
Homework 48.9 10.0 18.8
Own business - 5.0 -
Health information 4.4 5.0 -
Reading (newspapers, magazines) 6.7 10.0 -
Public information 4.4 15.0 6.3
Job searching 2.2 30.0 12.5
Procedures - 10.0 6.3
Acquire products/services - - 6.3
Chat/e-mail 4.4 5.0 37.5
CV preparation and posting 4.4 5.0 -
Own content (blog) 2.2 5.0 6.3
Practicing course exercises 6.7 - 6.3
Other - - -
TABLE 4.6. Most frequent use of computers at centers
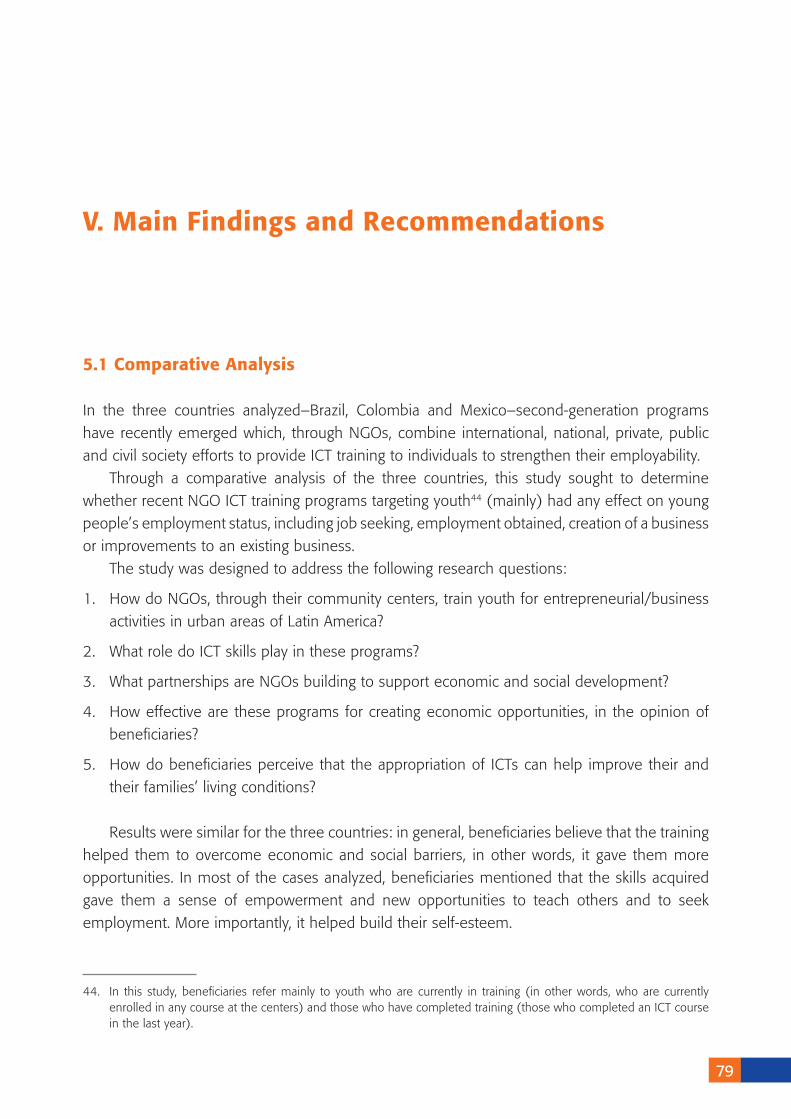
��
V.MainFindingsandRecommendations
44. In this study, beneficiaries refer mainly to youth who are currently in training (in other words, who are currently enrolled in any course at the centers) and those who have completed training (those who completed an ICT course in the last year).
5.1ComparativeAnalysis
In the three countries analyzed–Brazil, Colombia and Mexico–second-generation programs have recently emerged which, through NGOs, combine international, national, private, public and civil society efforts to provide ICT training to individuals to strengthen their employability.
Through a comparative analysis of the three countries, this study sought to determine whether recent NGO ICT training programs targeting youth44 (mainly) had any effect on young people’s employment status, including job seeking, employment obtained, creation of a business or improvements to an existing business.
The study was designed to address the following research questions:
1. How do NGOs, through their community centers, train youth for entrepreneurial/business activities in urban areas of Latin America?
2. What role do ICT skills play in these programs?
3. What partnerships are NGOs building to support economic and social development?
4. How effective are these programs for creating economic opportunities, in the opinion of beneficiaries?
5. How do beneficiaries perceive that the appropriation of ICTs can help improve their and their families’ living conditions?
Results were similar for the three countries: in general, beneficiaries believe that the training helped them to overcome economic and social barriers, in other words, it gave them more opportunities. In most of the cases analyzed, beneficiaries mentioned that the skills acquired gave them a sense of empowerment and new opportunities to teach others and to seek employment. More importantly, it helped build their self-esteem.
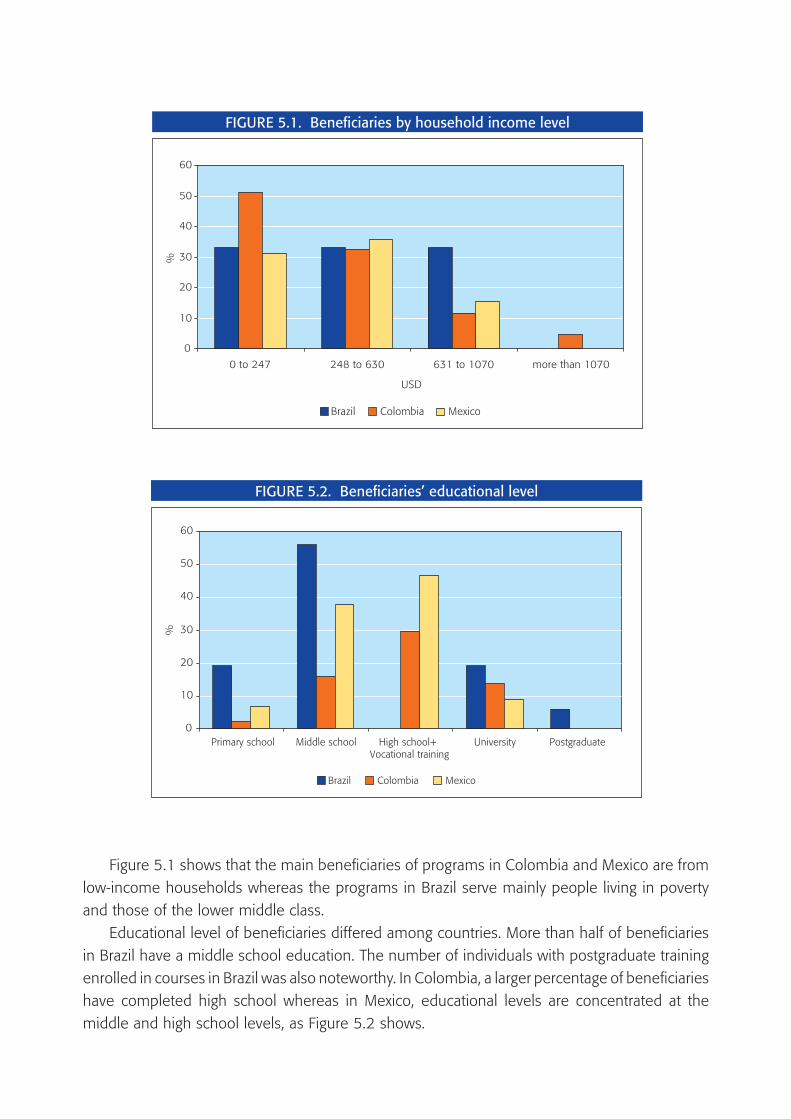
FIGURE 5.2. Beneficiaries’ educational level
0
10
20
30
40
50
60
Primary school Middle school High school+ University Postgraduate Vocational training
%
Brazil Colombia Mexico
FIGURE 5.1. Beneficiaries by household income level
0
10
20
30
40
50
60
0 to 247 248 to 630 631 to 1070 more than 1070
USD
Brazil Colombia Mexico
%
Figure 5.1 shows that the main beneficiaries of programs in Colombia and Mexico are from low-income households whereas the programs in Brazil serve mainly people living in poverty and those of the lower middle class.
Educational level of beneficiaries differed among countries. More than half of beneficiaries in Brazil have a middle school education. The number of individuals with postgraduate training enrolled in courses in Brazil was also noteworthy. In Colombia, a larger percentage of beneficiaries have completed high school whereas in Mexico, educational levels are concentrated at the middle and high school levels, as Figure 5.2 shows.
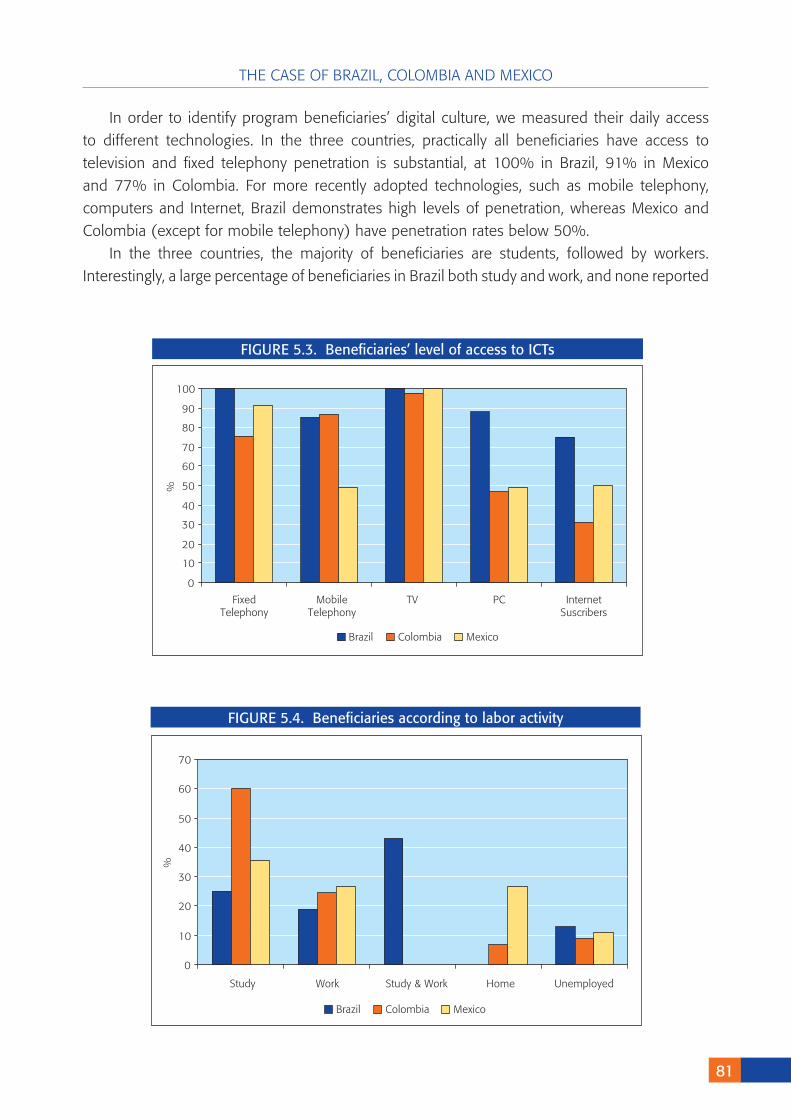
THE CASE OF BRAZIL, COLOMBIA AND MEXICO
�1
In order to identify program beneficiaries’ digital culture, we measured their daily access to different technologies. In the three countries, practically all beneficiaries have access to television and fixed telephony penetration is substantial, at 100% in Brazil, 91% in Mexico and 77% in Colombia. For more recently adopted technologies, such as mobile telephony, computers and Internet, Brazil demonstrates high levels of penetration, whereas Mexico and Colombia (except for mobile telephony) have penetration rates below 50%.
In the three countries, the majority of beneficiaries are students, followed by workers. Interestingly, a large percentage of beneficiaries in Brazil both study and work, and none reported
FIGURE 5.3. Beneficiaries’ level of access to ICTs
0
10
20
30
40
50
60
70
80
90
100
Fixed Mobile TV PC Internet Telephony Telephony Suscribers
Brazil Colombia Mexico
%
FIGURE 5.4. Beneficiaries according to labor activity
0
10
20
30
40
50
60
70
Study Work Study & Work Home Unemployed
%
Brazil Colombia Mexico
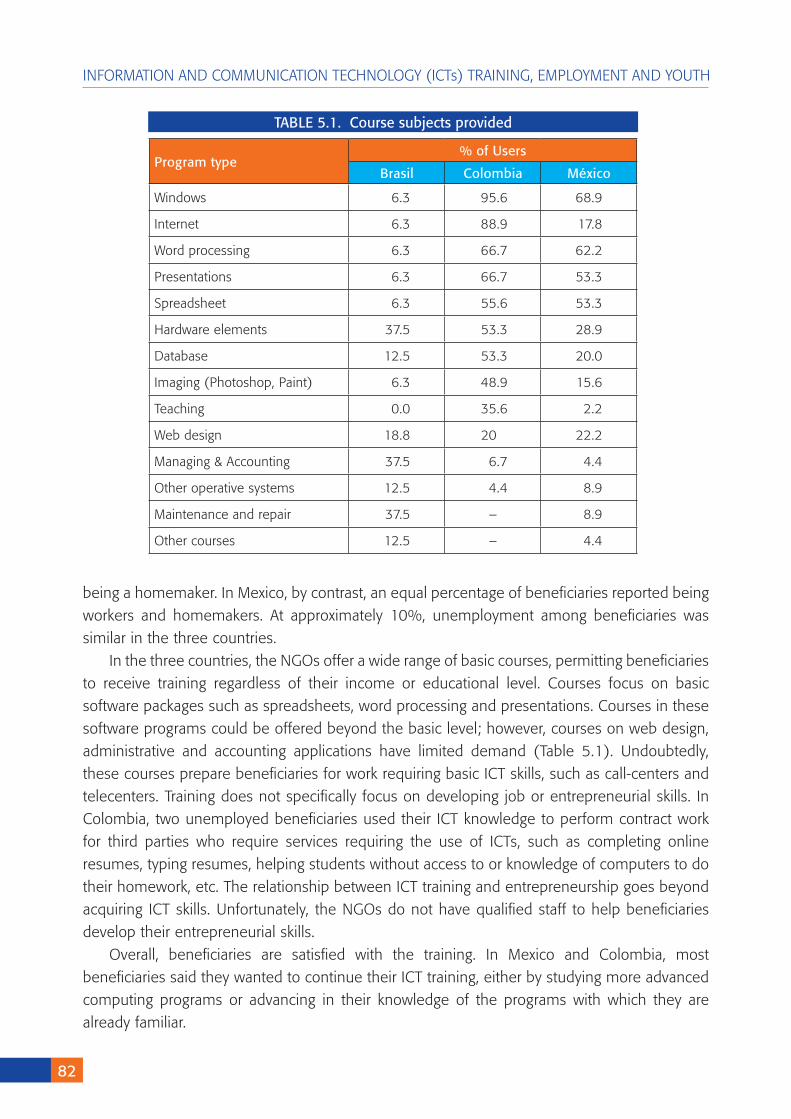
�2
INFORMATION AND COMMUNICATION TECHNOLOGY (ICTs) TRAINING, EMPLOYMENT AND YOUTH
being a homemaker. In Mexico, by contrast, an equal percentage of beneficiaries reported being workers and homemakers. At approximately 10%, unemployment among beneficiaries was similar in the three countries.
In the three countries, the NGOs offer a wide range of basic courses, permitting beneficiaries to receive training regardless of their income or educational level. Courses focus on basic software packages such as spreadsheets, word processing and presentations. Courses in these software programs could be offered beyond the basic level; however, courses on web design, administrative and accounting applications have limited demand (Table 5.1). Undoubtedly, these courses prepare beneficiaries for work requiring basic ICT skills, such as call-centers and telecenters. Training does not specifically focus on developing job or entrepreneurial skills. In Colombia, two unemployed beneficiaries used their ICT knowledge to perform contract work for third parties who require services requiring the use of ICTs, such as completing online resumes, typing resumes, helping students without access to or knowledge of computers to do their homework, etc. The relationship between ICT training and entrepreneurship goes beyond acquiring ICT skills. Unfortunately, the NGOs do not have qualified staff to help beneficiaries develop their entrepreneurial skills.
Overall, beneficiaries are satisfied with the training. In Mexico and Colombia, most beneficiaries said they wanted to continue their ICT training, either by studying more advanced computing programs or advancing in their knowledge of the programs with which they are already familiar.
Program type% of Users
Brasil Colombia México
Windows 6.3 95.6 68.9
Internet 6.3 88.9 17.8
Word processing 6.3 66.7 62.2
Presentations 6.3 66.7 53.3
Spreadsheet 6.3 55.6 53.3
Hardware elements 37.5 53.3 28.9
Database 12.5 53.3 20.0
Imaging (Photoshop, Paint) 6.3 48.9 15.6
Teaching 0.0 35.6 2.2
Web design 18.8 20 22.2
Managing & Accounting 37.5 6.7 4.4
Other operative systems 12.5 4.4 8.9
Maintenance and repair 37.5 – 8.9
Other courses 12.5 – 4.4
TABLE 5.1. Course subjects provided
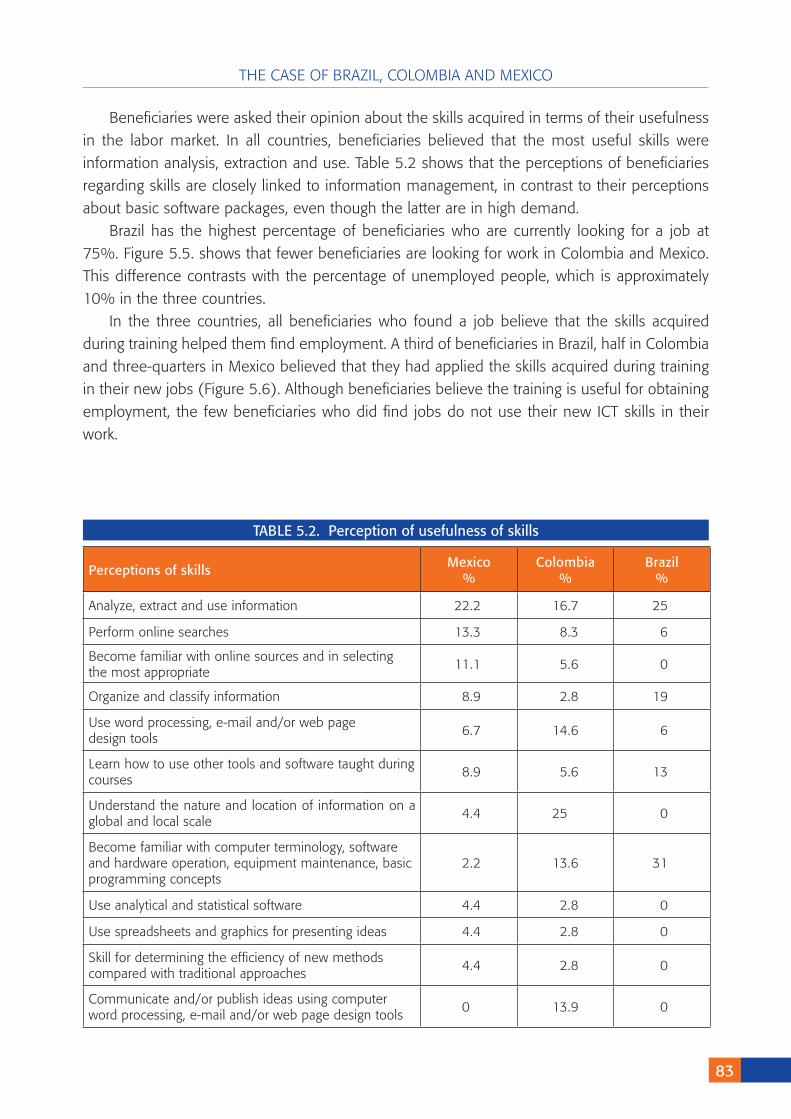
THE CASE OF BRAZIL, COLOMBIA AND MEXICO
�3
Beneficiaries were asked their opinion about the skills acquired in terms of their usefulness in the labor market. In all countries, beneficiaries believed that the most useful skills were information analysis, extraction and use. Table 5.2 shows that the perceptions of beneficiaries regarding skills are closely linked to information management, in contrast to their perceptions about basic software packages, even though the latter are in high demand.
Brazil has the highest percentage of beneficiaries who are currently looking for a job at 75%. Figure 5.5. shows that fewer beneficiaries are looking for work in Colombia and Mexico. This difference contrasts with the percentage of unemployed people, which is approximately 10% in the three countries.
In the three countries, all beneficiaries who found a job believe that the skills acquired during training helped them find employment. A third of beneficiaries in Brazil, half in Colombia and three-quarters in Mexico believed that they had applied the skills acquired during training in their new jobs (Figure 5.6). Although beneficiaries believe the training is useful for obtaining employment, the few beneficiaries who did find jobs do not use their new ICT skills in their work.
Perceptions of skills Mexico%
Colombia%
Brazil%
Analyze, extract and use information 22.2 16.7 25
Perform online searches 13.3 8.3 6
Become familiar with online sources and in selecting the most appropriate
11.1 5.6 0
Organize and classify information 8.9 2.8 19
Use word processing, e-mail and/or web pagedesign tools
6.7 14.6 6
Learn how to use other tools and software taught during courses
8.9 5.6 13
Understand the nature and location of information on a global and local scale
4.4 25 0
Become familiar with computer terminology, software and hardware operation, equipment maintenance, basic programming concepts
2.2 13.6 31
Use analytical and statistical software 4.4 2.8 0
Use spreadsheets and graphics for presenting ideas 4.4 2.8 0
Skill for determining the efficiency of new methods compared with traditional approaches
4.4 2.8 0
Communicate and/or publish ideas using computer word processing, e-mail and/or web page design tools
0 13.9 0
TABLE 5.2. Perception of usefulness of skills
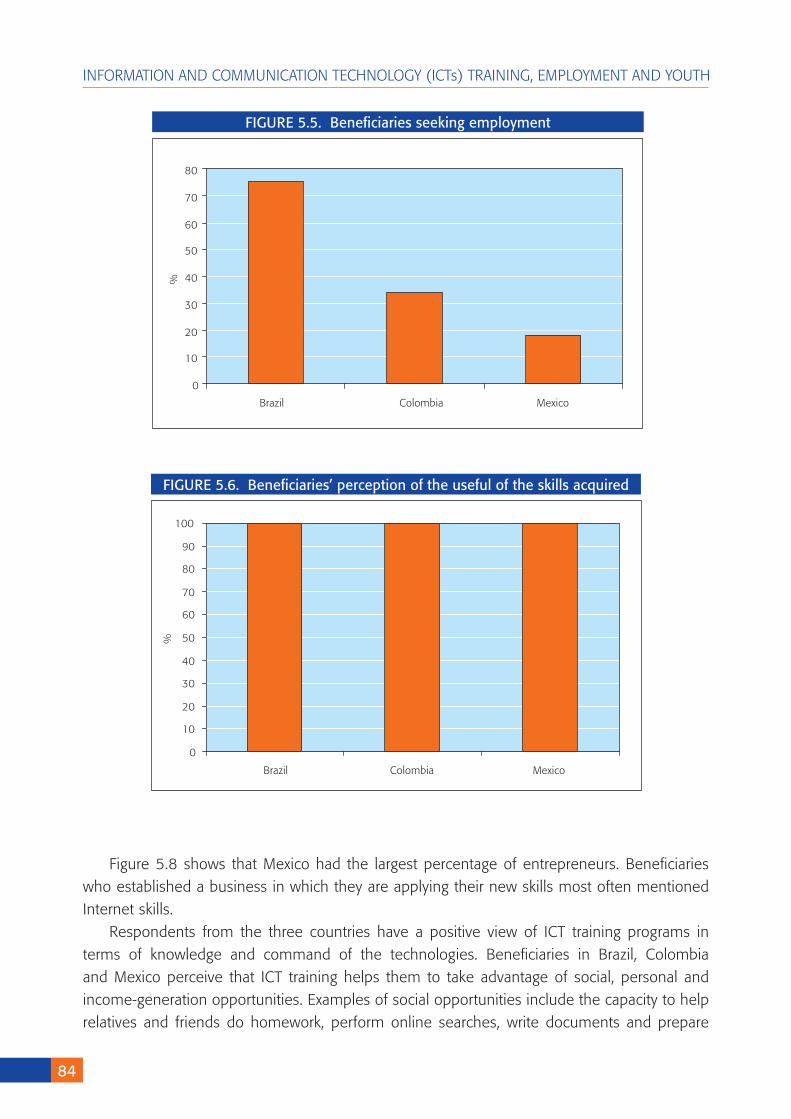
�4
INFORMATION AND COMMUNICATION TECHNOLOGY (ICTs) TRAINING, EMPLOYMENT AND YOUTH
FIGURE 5.5. Beneficiaries seeking employment
0
10
20
30
40
50
60
70
80
Brazil Colombia Mexico
%
FIGURE 5.6. Beneficiaries’ perception of the useful of the skills acquired
0
10
20
30
40
50
60
70
80
90
100
Brazil Colombia Mexico
%
Figure 5.8 shows that Mexico had the largest percentage of entrepreneurs. Beneficiaries who established a business in which they are applying their new skills most often mentioned Internet skills.
Respondents from the three countries have a positive view of ICT training programs in terms of knowledge and command of the technologies. Beneficiaries in Brazil, Colombia and Mexico perceive that ICT training helps them to take advantage of social, personal and income-generation opportunities. Examples of social opportunities include the capacity to help relatives and friends do homework, perform online searches, write documents and prepare
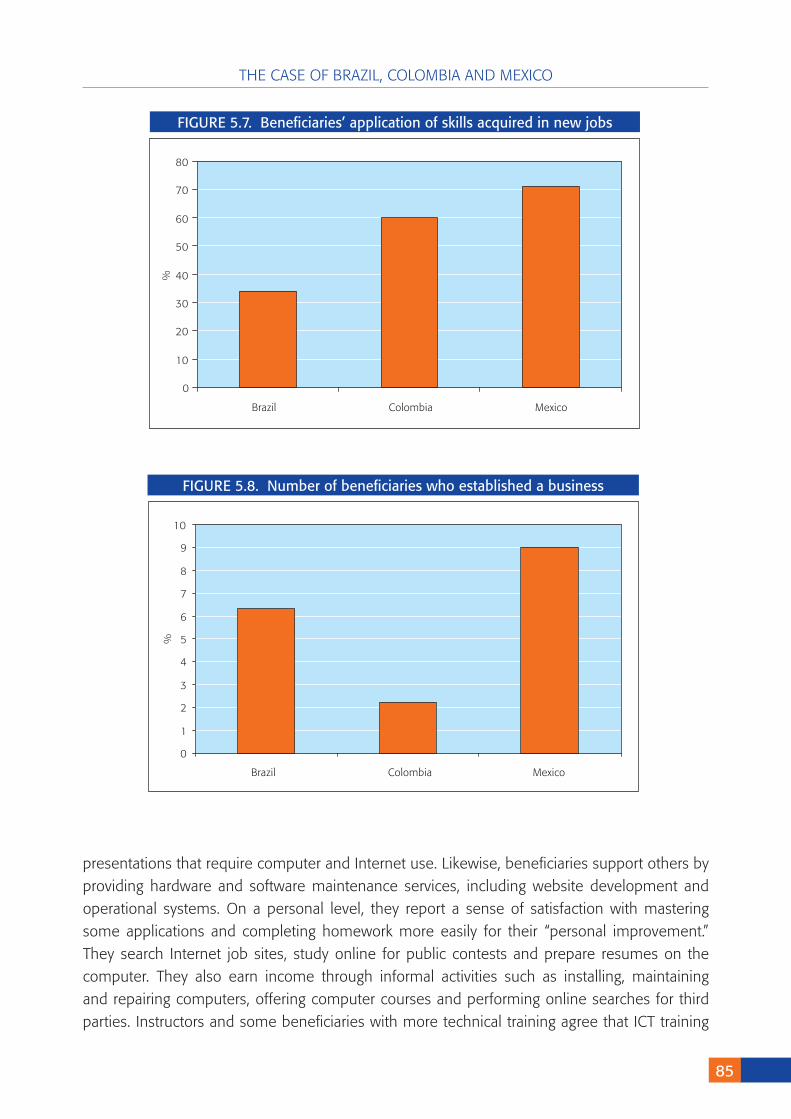
THE CASE OF BRAZIL, COLOMBIA AND MEXICO
�5
presentations that require computer and Internet use. Likewise, beneficiaries support others by providing hardware and software maintenance services, including website development and operational systems. On a personal level, they report a sense of satisfaction with mastering some applications and completing homework more easily for their “personal improvement.” They search Internet job sites, study online for public contests and prepare resumes on the computer. They also earn income through informal activities such as installing, maintaining and repairing computers, offering computer courses and performing online searches for third parties. Instructors and some beneficiaries with more technical training agree that ICT training
FIGURE 5.�. Beneficiaries’ application of skills acquired in new jobs
0
10
20
30
40
50
60
70
80
Brazil Colombia Mexico
%
FIGURE 5.�. Number of beneficiaries who established a business
0
1
2
3
4
5
6
7
8
9
10
Brazil Colombia Mexico
%
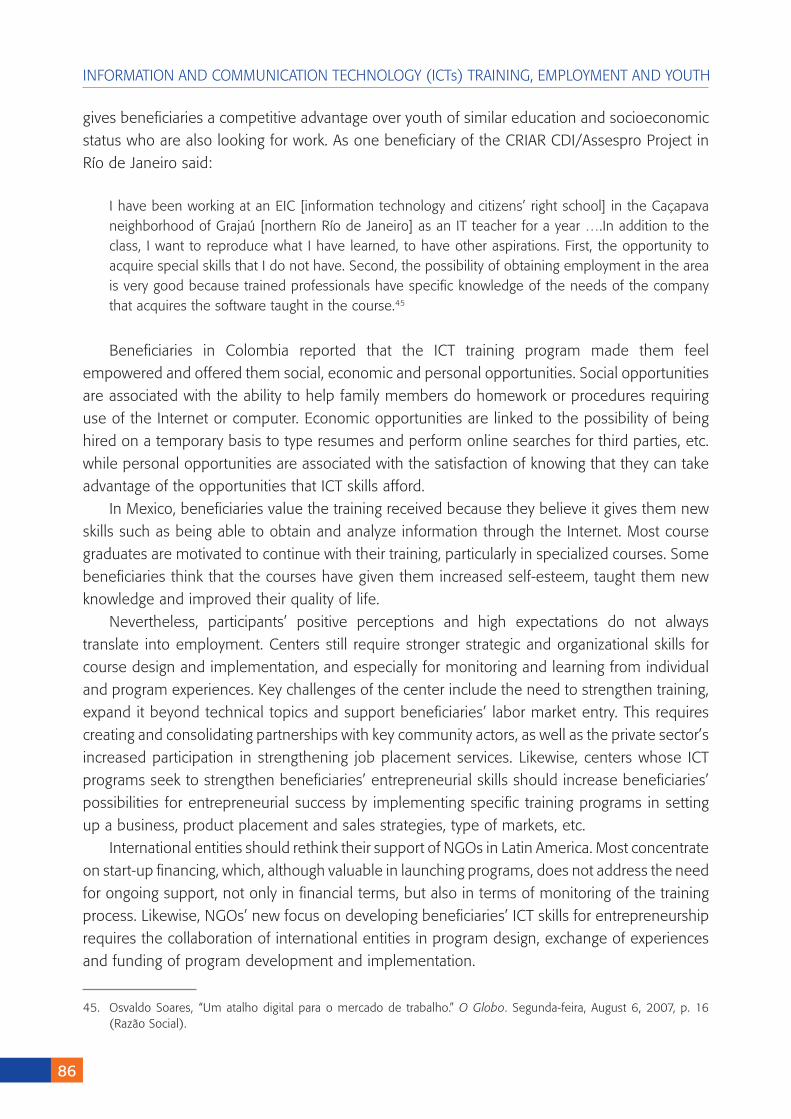
�6
INFORMATION AND COMMUNICATION TECHNOLOGY (ICTs) TRAINING, EMPLOYMENT AND YOUTH
gives beneficiaries a competitive advantage over youth of similar education and socioeconomic status who are also looking for work. As one beneficiary of the CRIAR CDI/Assespro Project in Río de Janeiro said:
I have been working at an EIC [information technology and citizens’ right school] in the Caçapava neighborhood of Grajaú [northern Río de Janeiro] as an IT teacher for a year ….In addition to the class, I want to reproduce what I have learned, to have other aspirations. First, the opportunity to acquire special skills that I do not have. Second, the possibility of obtaining employment in the area is very good because trained professionals have specific knowledge of the needs of the company that acquires the software taught in the course.45
Beneficiaries in Colombia reported that the ICT training program made them feel empowered and offered them social, economic and personal opportunities. Social opportunities are associated with the ability to help family members do homework or procedures requiring use of the Internet or computer. Economic opportunities are linked to the possibility of being hired on a temporary basis to type resumes and perform online searches for third parties, etc. while personal opportunities are associated with the satisfaction of knowing that they can take advantage of the opportunities that ICT skills afford.
In Mexico, beneficiaries value the training received because they believe it gives them new skills such as being able to obtain and analyze information through the Internet. Most course graduates are motivated to continue with their training, particularly in specialized courses. Some beneficiaries think that the courses have given them increased self-esteem, taught them new knowledge and improved their quality of life.
Nevertheless, participants’ positive perceptions and high expectations do not always translate into employment. Centers still require stronger strategic and organizational skills for course design and implementation, and especially for monitoring and learning from individual and program experiences. Key challenges of the center include the need to strengthen training, expand it beyond technical topics and support beneficiaries’ labor market entry. This requires creating and consolidating partnerships with key community actors, as well as the private sector’s increased participation in strengthening job placement services. Likewise, centers whose ICT programs seek to strengthen beneficiaries’ entrepreneurial skills should increase beneficiaries’ possibilities for entrepreneurial success by implementing specific training programs in setting up a business, product placement and sales strategies, type of markets, etc.
International entities should rethink their support of NGOs in Latin America. Most concentrate on start-up financing, which, although valuable in launching programs, does not address the need for ongoing support, not only in financial terms, but also in terms of monitoring of the training process. Likewise, NGOs’ new focus on developing beneficiaries’ ICT skills for entrepreneurship requires the collaboration of international entities in program design, exchange of experiences and funding of program development and implementation.
45. Osvaldo Soares, “Um atalho digital para o mercado de trabalho.” O Globo. Segunda-feira, August 6, 2007, p. 16 (Razão Social).
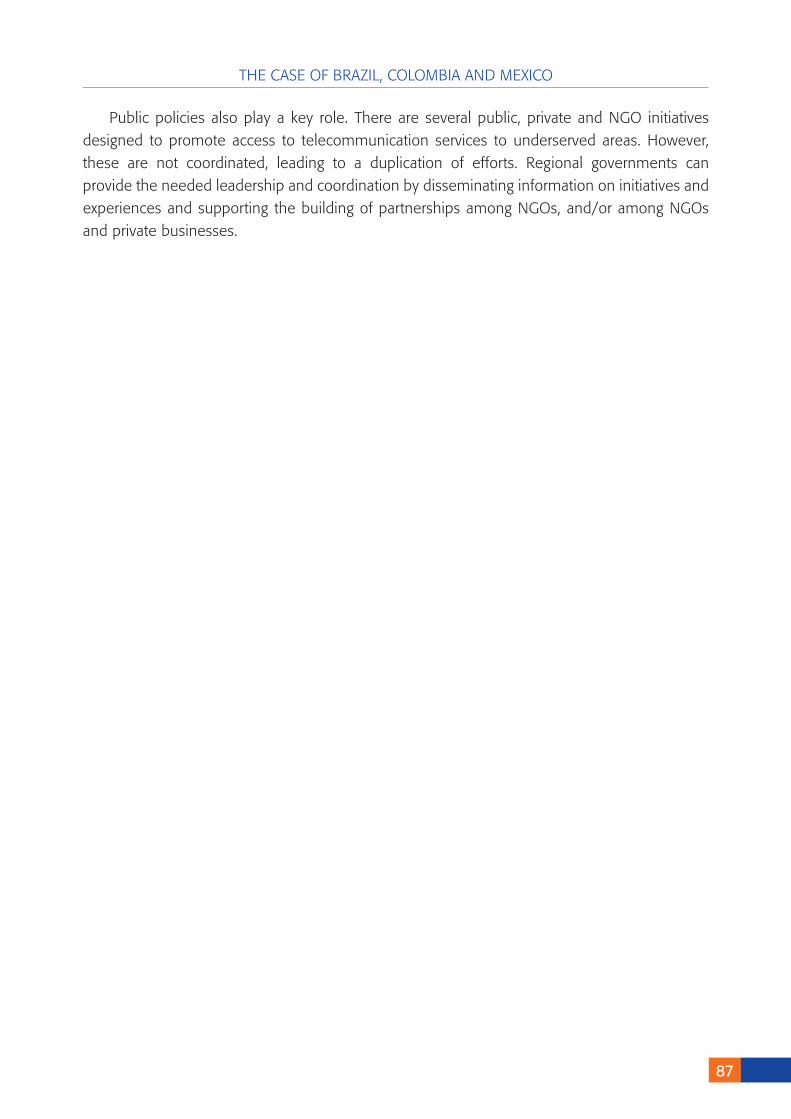
THE CASE OF BRAZIL, COLOMBIA AND MEXICO
��
Public policies also play a key role. There are several public, private and NGO initiatives designed to promote access to telecommunication services to underserved areas. However, these are not coordinated, leading to a duplication of efforts. Regional governments can provide the needed leadership and coordination by disseminating information on initiatives and experiences and supporting the building of partnerships among NGOs, and/or among NGOs and private businesses.

��
Efforts of NGOs to provide ICT training for employability of youth represent a second generation of digital inclusion activities; however, these remain on the drawing board and continue to be influenced by first-generation training programs that focused only on teaching ICT technical skills without considering other skills needed for employment.
Although these programs have added modules to support labor market entry (resume preparation; preparing for interviews, etc.) and have created job placement services, the community continues to have a limited vision of building partnerships only with companies close to the center. However, the labor market is much wider in geographical terms; moreover, the partnerships built are for generic jobs rather than for those that could make use of beneficiaries’ ICT training. Several countries have a demand for employees in software services, either for codifying programs under development or for operating specialized software programs (ERP management, payroll, human resources, etc.) in companies of different sectors that are beginning to adopt ICTs, including small and medium-sized businesses.
Moreover, courses have a major training deficit in terms of building entrepreneurial skills. Other NGOs in these countries address this topic but have not yet been integrated in the ICT training of the NGOs under study.
Nevertheless, in some countries, the increase in computer ownership and use, and in some cases even Internet access by the low-income population (for example, in Brazil, the government Computers for All program provides funding for low-cost computers), has created numerous opportunities to establish ICT firms in the area of LAN, hardware maintenance and software installation.
Recommendations:
l Leadership is a key variable for both effective fulfillment of training objectives and building of partnerships for center sustainability and employment of graduates. The leader must have a thorough knowledge of the center, a clear vision, capacity for innovation and a network of potential contacts.
Conclusions
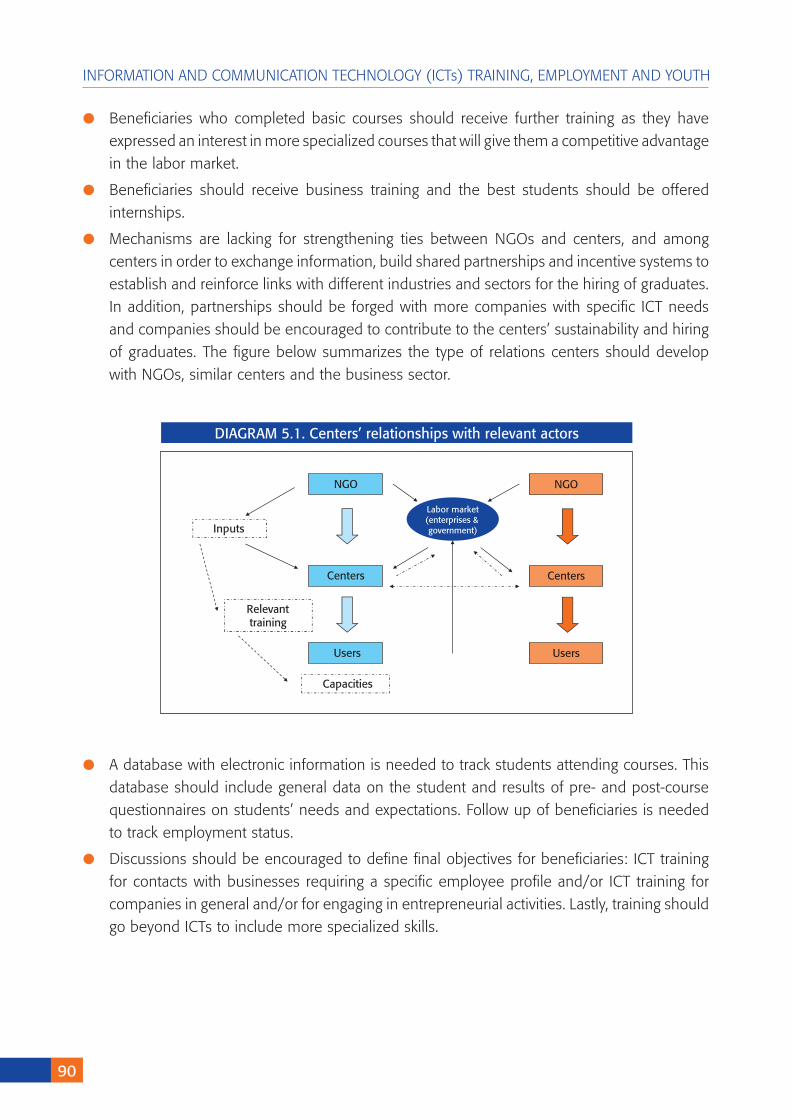
�0
INFORMATION AND COMMUNICATION TECHNOLOGY (ICTs) TRAINING, EMPLOYMENT AND YOUTH
l Beneficiaries who completed basic courses should receive further training as they have expressed an interest in more specialized courses that will give them a competitive advantage in the labor market.
l Beneficiaries should receive business training and the best students should be offered internships.
l Mechanisms are lacking for strengthening ties between NGOs and centers, and among centers in order to exchange information, build shared partnerships and incentive systems to establish and reinforce links with different industries and sectors for the hiring of graduates. In addition, partnerships should be forged with more companies with specific ICT needs and companies should be encouraged to contribute to the centers’ sustainability and hiring of graduates. The figure below summarizes the type of relations centers should develop with NGOs, similar centers and the business sector.
l A database with electronic information is needed to track students attending courses. This database should include general data on the student and results of pre- and post-course questionnaires on students’ needs and expectations. Follow up of beneficiaries is needed to track employment status.
l Discussions should be encouraged to define final objectives for beneficiaries: ICT training for contacts with businesses requiring a specific employee profile and/or ICT training for companies in general and/or for engaging in entrepreneurial activities. Lastly, training should go beyond ICTs to include more specialized skills.
NGO
Centers
Users
Labor market(enterprises & government)Inputs
Relevanttraining
Capacities
NGO
Centers
Users
DIAGRAM 5.1. Centers’ relationships with relevant actors
�1
WorkMethod
In accordance with the above and the research questions, the objectives of this study are as follows:
1. identify the target population’s socioeconomic characteristics;
2. determine whether the target population has increased employment opportunities;
3. analyze centers that offer courses, with an emphasis on course type and quantity, as well as centers’ technological infrastructure and instructors’ educational capacities;
4. establish relationships, causes and/or linkages among the above three aspects to propose a hypothesis and obtain preliminary results of the complex training-youth-employment relationship.
To address the research questions and achieve the proposed objectives, we need to examine both the internal and external effects of the centers’ activities. The internal analysis attempts to give a timely response to the first research question whereas the external analysis complements the internal analysis and responds to the last two research questions.
With respect to the internal analysis, a key aspect for the employability of ICT-trained youth is the organizational capacity of the NGO, for which reason it is important to identify the organizational tools of the NGO. For this study, organizational tools refer to whether the infrastructure (hardware, software, installations, etc.) is adequate, whether available resources are sufficient, whether funding sources are diversified, whether there are programs and/or procedures to evaluate beneficiaries and instructors, whether instructor training is provided, whether center graduates are tracked and whether job placement services are offered. This analysis helps determine whether the centers are effectively organized to serve the target population and thereby achieve the objective of increasing employment opportunities for marginalized groups.
First, the study will focus on identifying the level of congruence between the center’s objectives and the social mission of the sponsoring NGO (for example, CDI) or of programs
Appendix1
�2
INFORMATION AND COMMUNICATION TECHNOLOGY (ICTs) TRAINING, EMPLOYMENT AND YOUTH
supporting the centers (for example, POETA). Second, given the objectives of the center and those of the NGO or support program, we will analyze whether each center has the organizational tools needed to achieve them. We will measure the following organizational tools:
1. infrastructure (hardware, software, facilities, etc.);
2. available resources;
3. funding sources;
4. evaluations of beneficiaries and instructors;
5. instructor training;
6. tracking of course graduates; and
7. existence of job placement services for beneficiaries.
Much of the information necessary for this analysis will be obtained from supporting documents provided by the centers, as well as interviews with and questionnaires applied to center beneficiaries, instructors and coordinators (these are discussed below in more detail).
With respect to the external analysis, the study sought to answer the following questions:
Regardingusers:
1.1. What are the main characteristics (age, gender, education, household income, level of digital exclusion) of beneficiaries who enroll in ICT courses at the centers?
Regardingcourses:
2.1. What courses do centers offer and which are the most requested by the target population? What are the main characteristics (cost, duration, type of evaluation) of these courses?
2.2. What skills and capacities are acquired through training? How do beneficiaries who have been trained or are in training use ICTs?
2.3. How have training courses helped beneficiaries in their job searches? In which sectors have beneficiaries looked for employment?
2.4. How have training courses helped beneficiaries find work? In which sectors have beneficiaries found jobs?
2.5. How have training courses helped beneficiaries establish (or improve) their businesses?
Regardingcenters(instructors):
3.1. What are instructors’ main characteristics (quantity, salaries, education, teaching skills, courses taught, etc.). What are instructors’ perceptions of the courses taught?
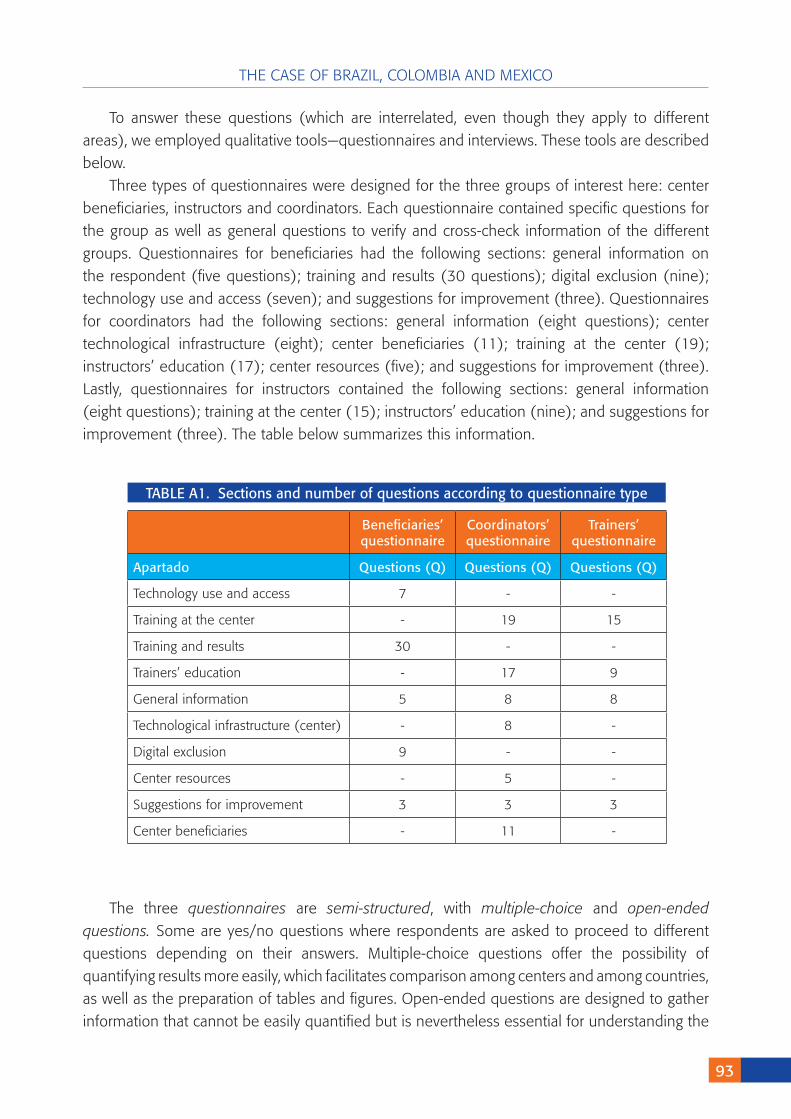
THE CASE OF BRAZIL, COLOMBIA AND MEXICO
�3
To answer these questions (which are interrelated, even though they apply to different areas), we employed qualitative tools—questionnaires and interviews. These tools are described below.
Three types of questionnaires were designed for the three groups of interest here: center beneficiaries, instructors and coordinators. Each questionnaire contained specific questions for the group as well as general questions to verify and cross-check information of the different groups. Questionnaires for beneficiaries had the following sections: general information on the respondent (five questions); training and results (30 questions); digital exclusion (nine); technology use and access (seven); and suggestions for improvement (three). Questionnaires for coordinators had the following sections: general information (eight questions); center technological infrastructure (eight); center beneficiaries (11); training at the center (19); instructors’ education (17); center resources (five); and suggestions for improvement (three). Lastly, questionnaires for instructors contained the following sections: general information (eight questions); training at the center (15); instructors’ education (nine); and suggestions for improvement (three). The table below summarizes this information.
TABLE A1. Sections and number of questions according to questionnaire type
Beneficiaries’questionnaire
Coordinators’questionnaire
Trainers’questionnaire
Apartado Questions (Q) Questions (Q) Questions (Q)
Technology use and access 7 - -
Training at the center - 19 15
Training and results 30 - -
Trainers’ education - 17 9
General information 5 8 8
Technological infrastructure (center) - 8 -
Digital exclusion 9 - -
Center resources - 5 -
Suggestions for improvement 3 3 3
Center beneficiaries - 11 -
The three questionnaires are semi-structured, with multiple-choice and open-ended questions. Some are yes/no questions where respondents are asked to proceed to different questions depending on their answers. Multiple-choice questions offer the possibility of quantifying results more easily, which facilitates comparison among centers and among countries, as well as the preparation of tables and figures. Open-ended questions are designed to gather information that cannot be easily quantified but is nevertheless essential for understanding the
�4
INFORMATION AND COMMUNICATION TECHNOLOGY (ICTs) TRAINING, EMPLOYMENT AND YOUTH
special characteristics of the subject under study or particular cases of beneficiaries, instructors, coordinators or the centers themselves.
Interviews were not structured (only a basic outline was provided) and were designed to complement, corroborate or refute the information provided by questionnaires. This tool is useful because, like the open-ended questions on the questionnaires, it can provide details on the specific characteristics and cases that cannot be described in multiple choice questions. Most interviews were with center directors and/or directors of the NGOs supporting the centers.
This is a descriptive-exploratory research study. It is descriptive because its aims to provide an overview of the target population (age, gender, education, kind of user and relationship with center, i.e., frequency of attendance, use of infrastructure and activities), courses offered by centers (cost, duration, type and quantity), centers (technological infrastructure and resources), coordinators and instructors (education, capacities, skills, etc.). This kind of descriptive research gives us a preliminary overview of the main components analyzed, in this case beneficiaries, courses, instructors and centers. This information may be compiled in tables and figures, and results of the three countries can be easily compared.
This study is exploratory in that, based on the data obtained, it seeks to develop a series of preliminary hypotheses to answer research questions and establish causal relationships (or at least logical associations) among variables to gain a better understanding of the link between ICT training of youth and employment. After comparing centers and countries, these hypotheses become the most relevant findings of the study.
�5
Fieldwork
After establishing the study objectives, research questions and methods, fieldwork must be conducted to obtain substantial information. Since this is a comparative study among countries, the fieldwork method is designed to obtain comparable information in different contexts.
First, an equal number of similar centers must be selected in each country (for example, two CDI centers and two supported by POETA). The following selection criteria were used:
Centers should:
l Prioritize employment training;
l be supported by an NGO;
l offer ICT training;
l offer similar types of courses;
l mainly support youth;
l be in operation during this study; and
l be located in metropolitan areas.
According to these criteria, the main components of center selection are ICTs–youth–employment. Centers with at least two of these components were selected. For example, in Mexico, POETA-supported CECATI 11 and 65 centers were selected because the NGO POETA has the objective of promoting ICT training for employability and because CECATI centers focus on employment; serve all types of individuals, including a large percentage of young people; are located in Mexico City; and were in operation during field research. Fieldwork was also conducted in the CDI centers La Comuna and Santa Fe because CDI’s main mission is citizen education through the use of ICTs tools, even though they do not prioritize employment. The Santa Fe center serves all types of individuals, including a large percentage of young people. Although this center does not prioritize employment, it does focus on community development. The Santa Fe center was also selected because of its success in terms of the growth, specialization and range of ICT courses offered (for example, it offers a course on
Appendix2
�6
INFORMATION AND COMMUNICATION TECHNOLOGY (ICTs) TRAINING, EMPLOYMENT AND YOUTH
microenterprise development), because it was operating when field research was conducted and because it is located in Mexico City.
Centers were selected in urban areas (in the three countries under study) because of time and resource constraints, which impeded the research teams from working in the countries’ interior or remote rural areas.
A similar number of questionnaires were applied in each country (at every center, if possible). Questionnaires for beneficiaries were applied to youth who had already received training (those who had completed an ICT course in the past year) or to youth enrolled in a training course at the center. This prevented a bias in the results that would occur, for example, if center users who had not taken a course were interviewed. A similar number of questionnaires and interviews were also applied to coordinators and instructors, which were conducted in a similar fashion in the three countries.
��
Almeida, Cássia 2008 “Jovem do Rio procura trabalho”. En O Globo, Monday, May 26, p. 14.
Amador, Mauricio y Paula Herrera 2006 Diferencias en el desempleo por género. ¿Hay discriminación en el acceso al traba-
jo? Documentos de Economía. Bogotá: Universidad Javeriana, Facultad de Ciencias Económicas y Administrativas.
Amariles, Fabiola, Olga P. Paz, Nathan Russell, Nancy Johnson 2006 “The Impacts of Community Telecenters in Rural Colombia,” Colombia. Journal of
Community Informatics 2(3). Special Issue: Telecentres.
Báez, Javier 2007 “¿Qué tanto han cambiado las decisiones de los jóvenes en Colombia en las últimas
tres décadas?”. In Revista de Economía del Caribe.
Cecchini, Simone 2005 “Oportunidades Digitales, Equidad y Pobreza en América Latina: ¿Qué podemos
aprender de la Evidencia Empírica?” ECLAC, Serie Estudios Estadísticos y Prospec-tivos 40.
Cecchini, Simone y Christopher Scott 2003 “Can Information and Communications Technology Applications Contribute to Pov-
erty Reduction?” Lessons from Rural India, Information Technology for Develop-ment, 10: 73-84.
Chacón, L. 2008 Falta a ‘inges’ especialización, Reforma, Business section, Page 1, April 1, 2008,
Mexico.
Chapple, Karen 2005 Promising futures: workforce development and upward mobility in information te-
chnology. Berkeley, Calif: Institute of Urban and Regional Development, University of California at Berkeley.
Bibliography
��
INFORMATION AND COMMUNICATION TECHNOLOGY (ICTs) TRAINING, EMPLOYMENT AND YOUTH
2006 “Moving Beyond the Divide: Workforce Development and Upward Mobility in Infor-mation Technology.” Oakland, CA: PolicyLink.
Fernández-Vega, C. 2008 Maquinaria económica ineficaz, , La Jornada, Column MEXICO SA, Economics sec-
tion, p. 1, November 11, 2005, Mexico. <http://www.jornada.unam.mx/2005/11/11/034o1eco.php> [April 2, 2008].
Forero, Nohora, Andrés F. García & Juan C. Guataquí 2008 “¿A quiénes afecta el desempleo? Análisis de la tasa de incidencia en Colombia,”
School of Economics. Bogotá: University of Rosario.
Garrido, M., C. Coward & A. Gordon 2007 “ICT Training for Disadvantaged Populations: The importance of tailoring to the local
context”. Center for Internet Studies Working Paper Series, University of Washington. June.
Federal District Government Report 2006 “La Comuna un modelo de atención integral para jóvenes del Distrito Federal,”
Training and Employment Office, , Mexico City.
Hilbert, Martin, Sebastián Bustos & Joao Carlos Ferraz 2003 Estrategias nacionales para la sociedad de la información en América Latina y el
Caribe (LC/R.2109). Santiago, Chile: Economic Commission for Latin America and the Caribbean (ECLAC).
IIT and Geographical Statistics National Institute 2008 Encuesta Nacional de Ocupación y Empleo, <http://www.inegi.gob.mx/inegi/
default.aspx?s=est&c=10658> [April 3, 2008].
ITU 2005 “Measuring digital opportunity,” available online at: http://www.itu.int/osg/spu/statis-
tics/DOI/linkeddocs/Measuring_Digital_Opp_Revised_23_Nov_2005%20(2).pdf.
La Cava, Gloria, Carine Clert & Paula Lytle 2004 “Investing in Youth empowerment and inclusion: A social development approach
insights from the ECA and LAC regions”. Social Development Papers. World Bank. Paper No. 60. February.
López-Bassols, V. 2002 “ICT Skills and Employment”. En STI Working Papers DSTI/DOC 10, Directorate for
Science, Technology and Industry. Paris: OECD Publications.
THE CASE OF BRAZIL, COLOMBIA AND MEXICO
��
Mariscal, Judith, José Ramón Gi & Armando Aldama 2008 “Investigación sobre las Políticas y Estrategias de Informatización de en México.”
Chapter on Infrastructure, INFOTEC. Available online at: http://www.infotec.com.mx/work/sites/infotec/resources/PDFContent/LibroBlanco_Marzo31.pdf.
Moule, Pam “ICT: a social justice approach exploring user issues?” Nurse Education Today, 23.
530-536. Bristol: UK. University of the West of England, Faculty of Health and Social Care.
Observatorio Ciudadano de la Educación 2005 “Jóvenes y empleo” in Debate Educativo 8, Observatorio Ciudadano de la Educación,
Mexico. [April 1, 2008] http://www.observatorio.org/comunicados/debate008.html
OECD 2005 “New Perspectives on ICT Skills and Employment”.
Ramírez, Clara & Oscar Castro “Programas de Capacitación para Jóvenes en Condiciones de Pobreza. El caso
de Bogotá, Colombia.” Research working paper directed by María Antonia Gallart. “Formación, pobreza y exclusión: los programas para jóvenes” Available at: http://www.colombiajoven.gov.co/injuve/instit/cinte/fpexcl/index.htm.
Robles, Gisela & Mónica Tapia 2007 Evaluación del Programa “Potencial Ilimitado” de Microsoft México,” August, pp. 35-
36. Mexico City.
Sachs, Jeffery 2007 “The Networked Readiness Index: Measuring the Preparedness of Nations for the
Networked World” Harvard Center for International Development. Available online at http://cyber.law.harvard.edu/readinessguide/Readiness%20Guide-Spanish.pdf.
Soares, Osvaldo 2007 “Um atalho digital para o mercado de trabalho”. En O Globo. Segunda-feira, 6 de
agosto, p. 16 (Razão Social).
Social Research Institute UNAM 2007 “En el desempleo 60 por ciento de los jóvenes,” UNAM Bulletin no. 542, Mexico.
<http://www.iis.unam.mx/pdfs/bol_unam_542.pdf > [April 1, 2005].
Subsecretaria de Educación Media Superior2006-2007 SEP “Informe de Rendición de Cuentas CECATI 11”.
100
INFORMATION AND COMMUNICATION TECHNOLOGY (ICTs) TRAINING, EMPLOYMENT AND YOUTH
Sullivan, J., M. Garrido, K. Dridi, C. Coward & A. Gordon 2007 “ICT Training and employability: integrated services delivery in United States workfor-
ce development networks.” Center for Internet Studies Working Paper Series, June. Washington: University of Washington.
Weber, Demétrio 2007 “No país, 7 milhões de jovens não tem ocupação”. En O Globo, Thursday, december
20, p. 16.
West, M. & M. Garrido 2008 Bridging the e-Skills Gap in Central and Eastern Europe: The Growth of e-Skills and
Employability Initiatives in the Newly Expanded European Union. Center for Infor- mation and Society, Working Paper Series. March.
World Bank Group Share 2005 The Year of Development: Swing Change to Fight Poverty, Staff Exchange Program,
World Bank Group, Issue 9, Spring.


Impreso en los talleres gráficos de Tarea asociación Gráfica educaTiva
Psje. María Auxiliadora 156 - Breñacorreo-e: [email protected]
Telfs.: 332-3229 / 424-8104Noviembre 2008 • Lima-Perú


![DONG IN KIM - 성균관대학교 정보통신대학icc.skku.ac.kr/~dikim/cv.pdf · training purpose: 1) ... $10,000,000 May 2014 - February 2021. [18] Dong In Kim, ... Communication](https://img.pdfslide.tips/doc/110x75/5b9ce9df09d3f29b498d9e22/dong-in-kim-iccskkuackrdikimcvpdf.jpg)


![UNIVERSIDADE NOVE DE JULHO PROGRAMA DE PÓS ...bibliotecatede.uninove.br/bitstream/tede/1990/2/Dayana...Communication Technologies [ICTs], arise. However, these services can also promote](https://img.pdfslide.tips/doc/110x75/6001cd6343347a0f800578e8/universidade-nove-de-julho-programa-de-ps-communication-technologies-icts.jpg)