Embed Size (px)
Citation preview
LABORATORIO DE PETROLOGÍA APLICADADepartamento de Ciencias de la Tierra y del Medio Ambiente
UNIVERSIDAD DE ALICANTE
Final Report
Commercial name of analysed material: Piedra Paloma
Requested by: Piedra Paloma S.L.
January 2011
Dra. María Angeles García del Cura Dr. David Benavente
Responsible for the Laboratory
LABORATORIO DE PETROLOGÍA APLICADADepartamento de Ciencias de la Tierra y del Medio Ambiente
UNIVERSIDAD DE ALICANTE Data of test: January 2011Requested by: Piedra Paloma S.L. Commercial name of analysed material: Piedra Paloma
Data reported here relates to samples supplied by the company who submitted the test. The company who solicits the tests accepts full responsibility for the sampling. Partial or total reproduction of this report is forbidden without written authorization of the laboratory. 2
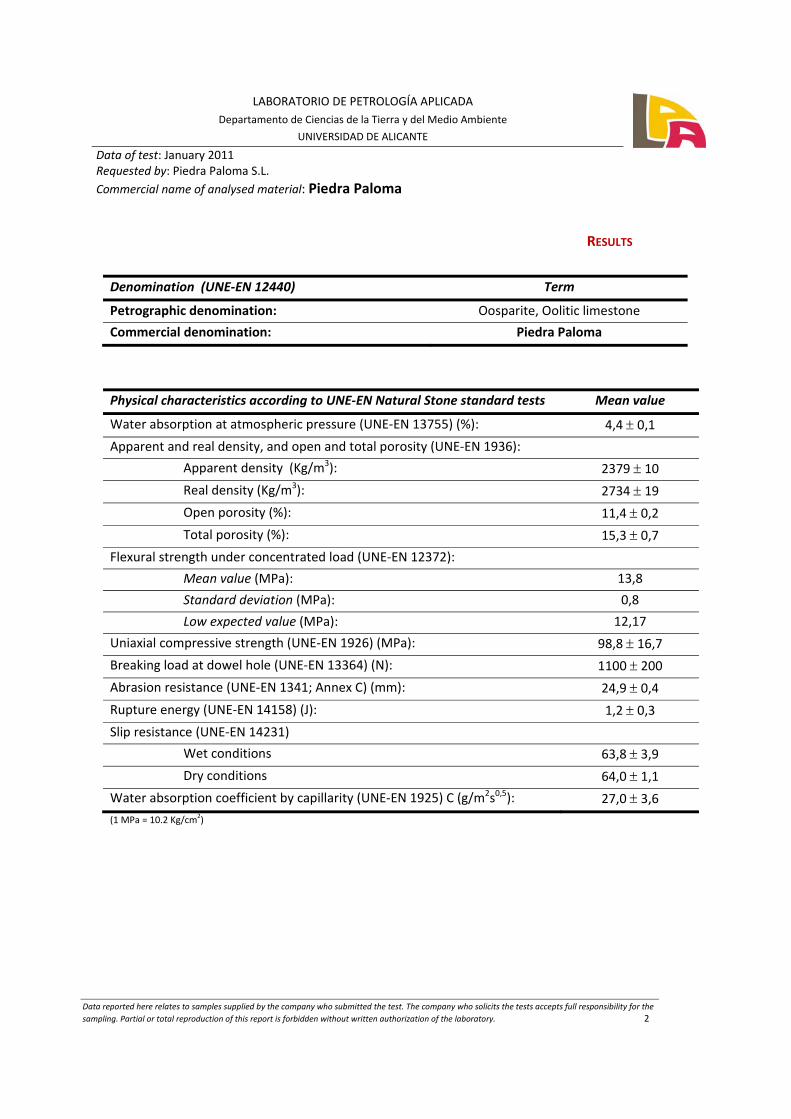
RESULTS
Denomination (UNE‐EN 12440) Term
Petrographic denomination: Oosparite, Oolitic limestone
Commercial denomination: Piedra Paloma
Physical characteristics according to UNE‐EN Natural Stone standard tests Mean value
Water absorption at atmospheric pressure (UNE‐EN 13755) (%): 4,4 ± 0,1 Apparent and real density, and open and total porosity (UNE‐EN 1936):
Apparent density (Kg/m3): 2379 ± 10 Real density (Kg/m3): 2734 ± 19 Open porosity (%): 11,4 ± 0,2 Total porosity (%): 15,3 ± 0,7
Flexural strength under concentrated load (UNE‐EN 12372):
Mean value (MPa): 13,8
Standard deviation (MPa): 0,8
Low expected value (MPa): 12,17
Uniaxial compressive strength (UNE‐EN 1926) (MPa): 98,8 ± 16,7 Breaking load at dowel hole (UNE‐EN 13364) (N): 1100 ± 200 Abrasion resistance (UNE‐EN 1341; Annex C) (mm): 24,9 ± 0,4 Rupture energy (UNE‐EN 14158) (J): 1,2 ± 0,3 Slip resistance (UNE‐EN 14231)
Wet conditions 63,8 ± 3,9 Dry conditions 64,0 ± 1,1
Water absorption coefficient by capillarity (UNE‐EN 1925) C (g/m2s0,5): 27,0 ± 3,6 (1 MPa = 10.2 Kg/cm2)
LABORATORIO DE PETROLOGÍA APLICADADepartamento de Ciencias de la Tierra y del Medio Ambiente
UNIVERSIDAD DE ALICANTE Data of test: January 2011Requested by: Piedra Paloma S.L. Commercial name of analysed material: Piedra Paloma
Data reported here relates to samples supplied by the company who submitted the test. The company who solicits the tests accepts full responsibility for the sampling. Partial or total reproduction of this report is forbidden without written authorization of the laboratory. 3
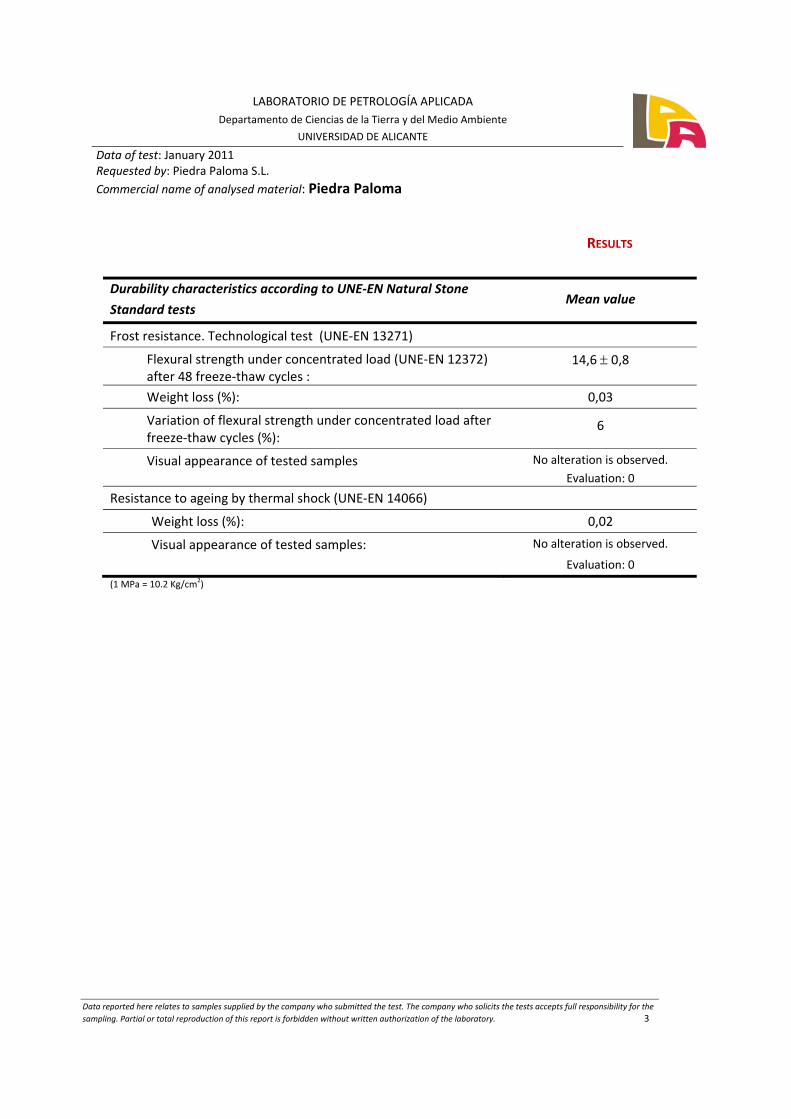
RESULTS
Durability characteristics according to UNE‐EN Natural Stone
Standard tests Mean value
Frost resistance. Technological test (UNE‐EN 13271)
Flexural strength under concentrated load (UNE‐EN 12372) after 48 freeze‐thaw cycles :
14,6 ± 0,8
Weight loss (%): 0,03
Variation of flexural strength under concentrated load after freeze‐thaw cycles (%):
6
Visual appearance of tested samples No alteration is observed. Evaluation: 0
Resistance to ageing by thermal shock (UNE‐EN 14066)
Weight loss (%): 0,02
Visual appearance of tested samples: No alteration is observed.
Evaluation: 0
(1 MPa = 10.2 Kg/cm2)
LABORATORIO DE PETROLOGÍA APLICADADepartamento de Ciencias de la Tierra y del Medio Ambiente
UNIVERSIDAD DE ALICANTE Data of test: January 2011Requested by: Piedra Paloma S.L. Commercial name of analysed material: Piedra Paloma
Data reported here relates to samples supplied by the company who submitted the test. The company who solicits the tests accepts full responsibility for the sampling. Partial or total reproduction of this report is forbidden without written authorization of the laboratory. 4
ANNEX I. PETROGRAPHIC DESCRIPTION
Natural stone test methods. Petrographic description UNE‐EN 12407 Denomination: Oolitic limestone Oosparite (Folk classification, which is included in the UNE‐EN 12407 standard). Macroscopic description:
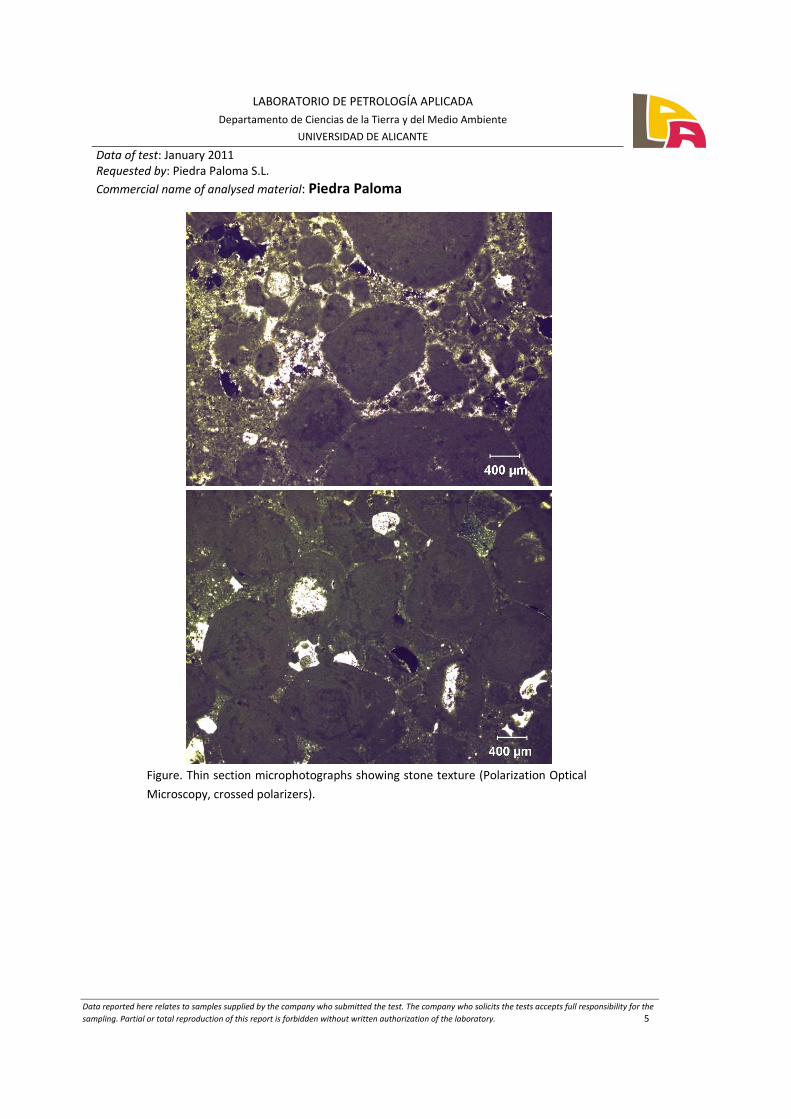
Structure: Homogenous. Grain size: Medium, poorly sorted. Allochems range from 0,5 mm to few centimetres. Colour: White (N9, after The Rock‐Color Chart, Geological Society of America, ed. 1984) Microscopic description: Texture: Piedra Paloma contains ooliths, ooids, lumps and limeclasts and oncolites. This stone also presents foraminifers and fossil fragments of echinoderms (mainly plates), molluscs and bryozoans. Interparticle porosity is abundant. The calcite cement in this stone consists of microcrystalline blocky and also macrocrystalline rim, which is mainly associated to plates of echinoderms. Mineralogical composition:
Main components: Calcite (∼98 %). Minor component: Quartz (∼2 %).
LABORATORIO DE PETROLOGÍA APLICADADepartamento de Ciencias de la Tierra y del Medio Ambiente
UNIVERSIDAD DE ALICANTE Data of test: January 2011Requested by: Piedra Paloma S.L. Commercial name of analysed material: Piedra Paloma
Data reported here relates to samples supplied by the company who submitted the test. The company who solicits the tests accepts full responsibility for the sampling. Partial or total reproduction of this report is forbidden without written authorization of the laboratory. 5
Figure. Thin section microphotographs showing stone texture (Polarization Optical
Microscopy, crossed polarizers).
LABORATORIO DE PETROLOGÍA APLICADADepartamento de Ciencias de la Tierra y del Medio Ambiente
UNIVERSIDAD DE ALICANTE Data of test: January 2011Requested by: Piedra Paloma S.L. Commercial name of analysed material: Piedra Paloma
Data reported here relates to samples supplied by the company who submitted the test. The company who solicits the tests accepts full responsibility for the sampling. Partial or total reproduction of this report is forbidden without written authorization of the laboratory. 6
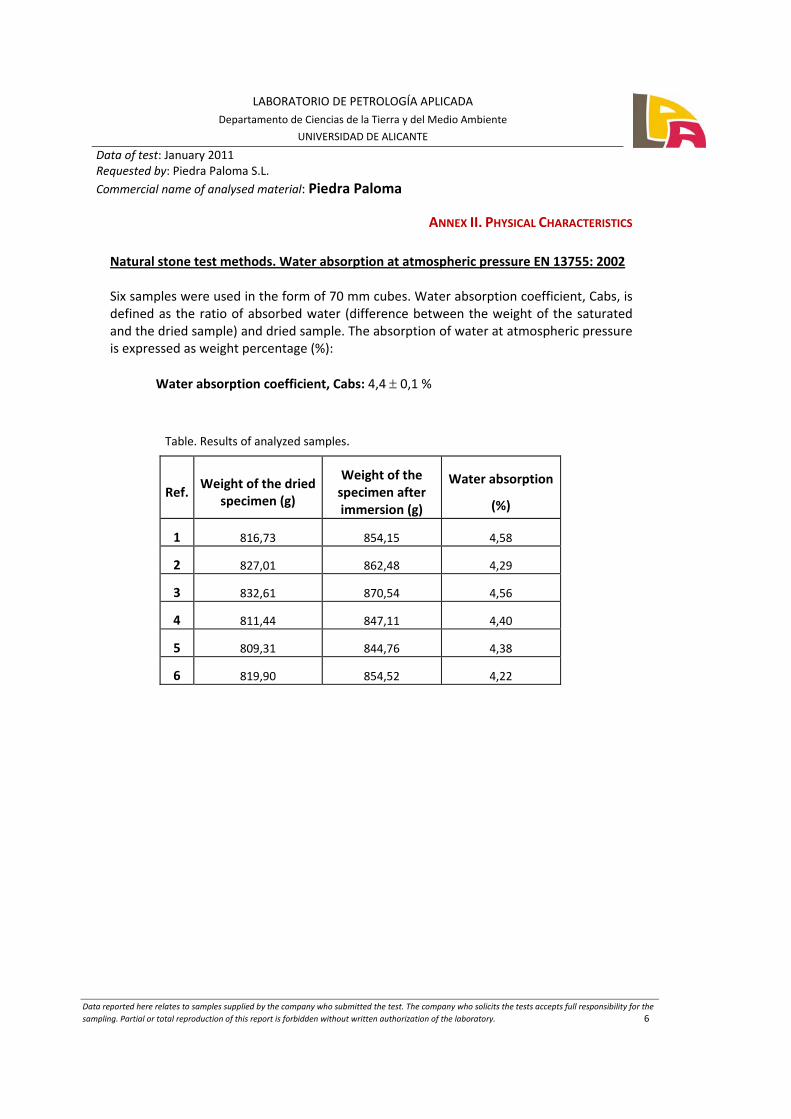
ANNEX II. PHYSICAL CHARACTERISTICS Natural stone test methods. Water absorption at atmospheric pressure EN 13755: 2002 Six samples were used in the form of 70 mm cubes. Water absorption coefficient, Cabs, is defined as the ratio of absorbed water (difference between the weight of the saturated and the dried sample) and dried sample. The absorption of water at atmospheric pressure is expressed as weight percentage (%):
Water absorption coefficient, Cabs: 4,4 ± 0,1 %
Table. Results of analyzed samples.
Ref. Weight of the dried
specimen (g)
Weight of the specimen after immersion (g)
Water absorption
(%)
1 816,73 854,15 4,58
2 827,01 862,48 4,29
3 832,61 870,54 4,56
4 811,44 847,11 4,40
5 809,31 844,76 4,38
6 819,90 854,52 4,22
LABORATORIO DE PETROLOGÍA APLICADADepartamento de Ciencias de la Tierra y del Medio Ambiente
UNIVERSIDAD DE ALICANTE Data of test: January 2011Requested by: Piedra Paloma S.L. Commercial name of analysed material: Piedra Paloma
Data reported here relates to samples supplied by the company who submitted the test. The company who solicits the tests accepts full responsibility for the sampling. Partial or total reproduction of this report is forbidden without written authorization of the laboratory. 7
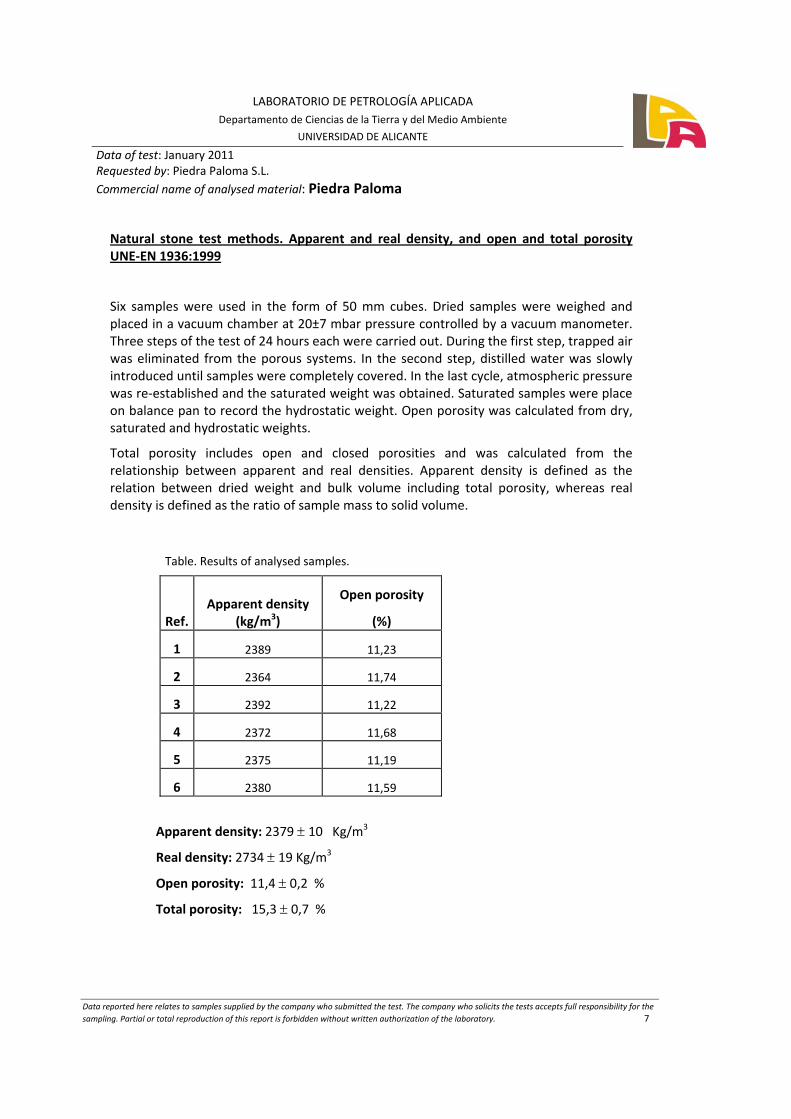
Natural stone test methods. Apparent and real density, and open and total porosity UNE‐EN 1936:1999
Six samples were used in the form of 50 mm cubes. Dried samples were weighed and placed in a vacuum chamber at 20±7 mbar pressure controlled by a vacuum manometer. Three steps of the test of 24 hours each were carried out. During the first step, trapped air was eliminated from the porous systems. In the second step, distilled water was slowly introduced until samples were completely covered. In the last cycle, atmospheric pressure was re‐established and the saturated weight was obtained. Saturated samples were place on balance pan to record the hydrostatic weight. Open porosity was calculated from dry, saturated and hydrostatic weights.
Total porosity includes open and closed porosities and was calculated from the relationship between apparent and real densities. Apparent density is defined as the relation between dried weight and bulk volume including total porosity, whereas real density is defined as the ratio of sample mass to solid volume.
Table. Results of analysed samples.
Ref. Apparent density
(kg/m3)
Open porosity
(%)
1 2389 11,23
2 2364 11,74
3 2392 11,22
4 2372 11,68
5 2375 11,19
6 2380 11,59
Apparent density: 2379 ± 10 Kg/m3
Real density: 2734 ± 19 Kg/m3
Open porosity: 11,4 ± 0,2 %
Total porosity: 15,3 ± 0,7 %
LABORATORIO DE PETROLOGÍA APLICADADepartamento de Ciencias de la Tierra y del Medio Ambiente
UNIVERSIDAD DE ALICANTE Data of test: January 2011Requested by: Piedra Paloma S.L. Commercial name of analysed material: Piedra Paloma
Data reported here relates to samples supplied by the company who submitted the test. The company who solicits the tests accepts full responsibility for the sampling. Partial or total reproduction of this report is forbidden without written authorization of the laboratory. 8
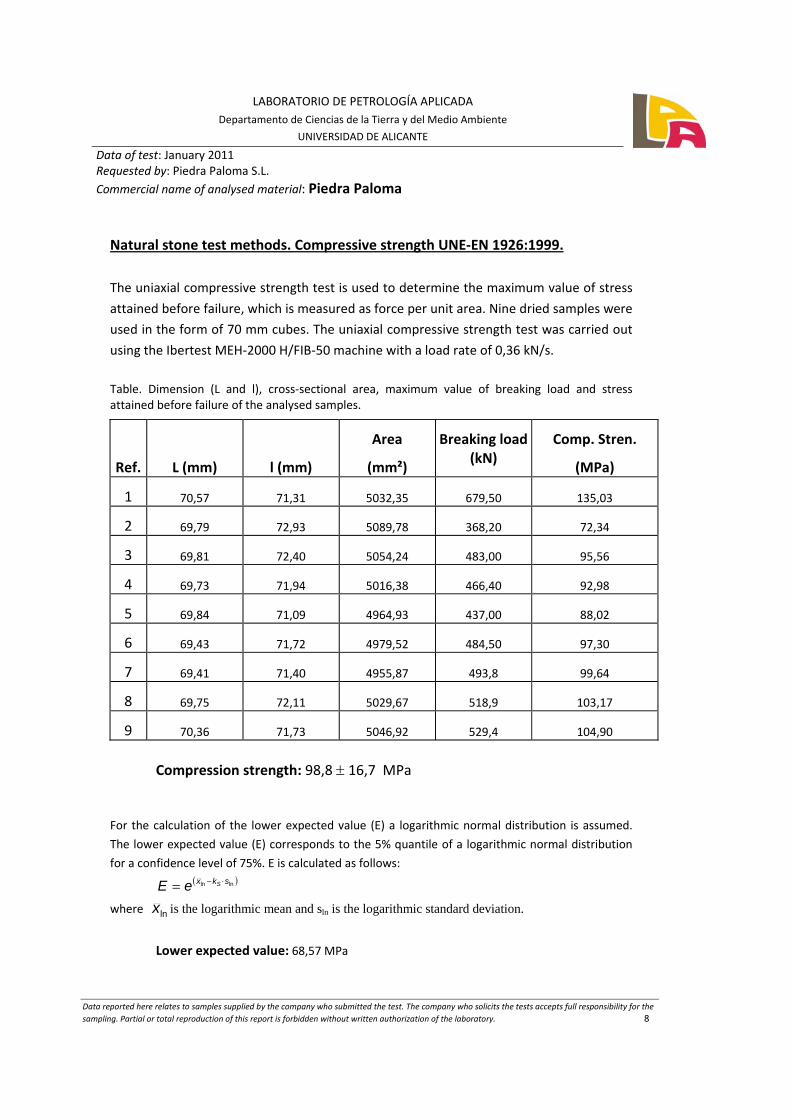
Natural stone test methods. Compressive strength UNE‐EN 1926:1999.
The uniaxial compressive strength test is used to determine the maximum value of stress
attained before failure, which is measured as force per unit area. Nine dried samples were
used in the form of 70 mm cubes. The uniaxial compressive strength test was carried out
using the Ibertest MEH‐2000 H/FIB‐50 machine with a load rate of 0,36 kN/s.
Table. Dimension (L and l), cross‐sectional area, maximum value of breaking load and stress attained before failure of the analysed samples.
Ref. L (mm) l (mm)
Area
(mm²)
Breaking load (kN)
Comp. Stren.
(MPa)
1 70,57 71,31 5032,35 679,50 135,03
2 69,79 72,93 5089,78 368,20 72,34
3 69,81 72,40 5054,24 483,00 95,56
4 69,73 71,94 5016,38 466,40 92,98
5 69,84 71,09 4964,93 437,00 88,02
6 69,43 71,72 4979,52 484,50 97,30
7 69,41 71,40 4955,87 493,8 99,64
8 69,75 72,11 5029,67 518,9 103,17
9 70,36 71,73 5046,92 529,4 104,90
Compression strength: 98,8 ± 16,7 MPa
For the calculation of the lower expected value (E) a logarithmic normal distribution is assumed.
The lower expected value (E) corresponds to the 5% quantile of a logarithmic normal distribution
for a confidence level of 75%. E is calculated as follows: ( )lnln skx SeE ⋅−=
where lnx is the logarithmic mean and sln is the logarithmic standard deviation.
Lower expected value: 68,57 MPa
LABORATORIO DE PETROLOGÍA APLICADADepartamento de Ciencias de la Tierra y del Medio Ambiente
UNIVERSIDAD DE ALICANTE Data of test: January 2011Requested by: Piedra Paloma S.L. Commercial name of analysed material: Piedra Paloma
Data reported here relates to samples supplied by the company who submitted the test. The company who solicits the tests accepts full responsibility for the sampling. Partial or total reproduction of this report is forbidden without written authorization of the laboratory. 9
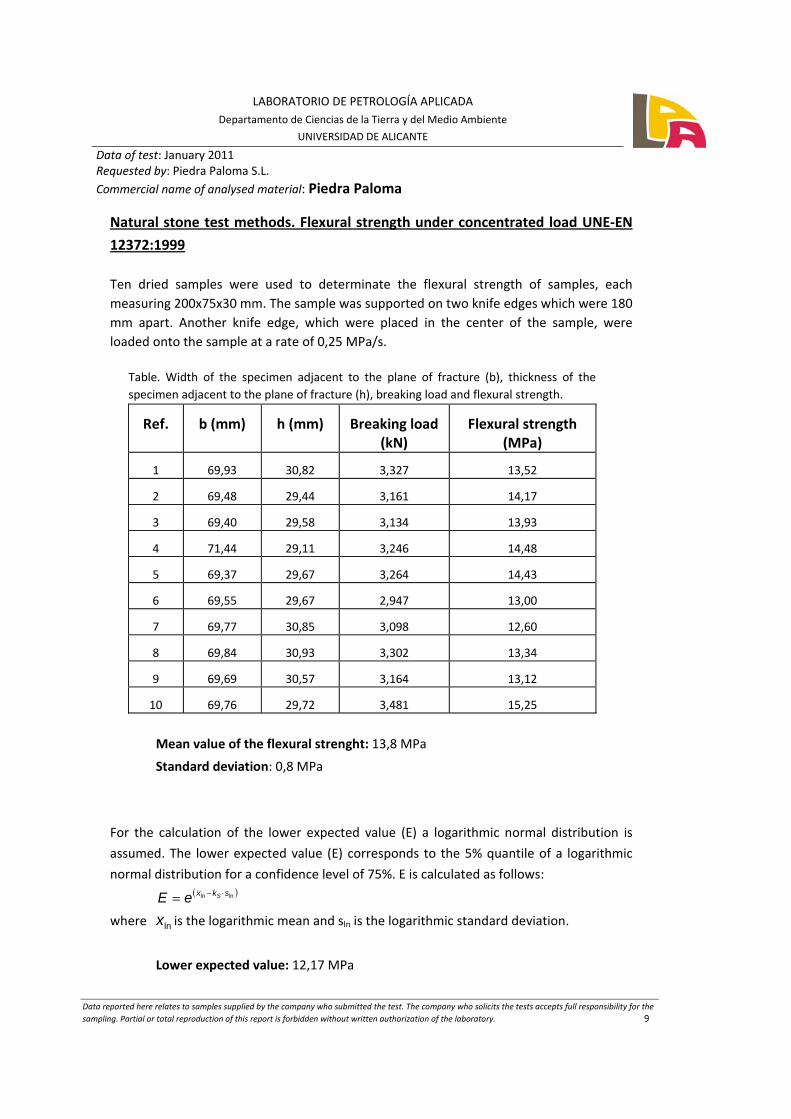
Natural stone test methods. Flexural strength under concentrated load UNE‐EN
12372:1999 Ten dried samples were used to determinate the flexural strength of samples, each measuring 200x75x30 mm. The sample was supported on two knife edges which were 180 mm apart. Another knife edge, which were placed in the center of the sample, were loaded onto the sample at a rate of 0,25 MPa/s.
Table. Width of the specimen adjacent to the plane of fracture (b), thickness of the specimen adjacent to the plane of fracture (h), breaking load and flexural strength.
Ref. b (mm) h (mm) Breaking load (kN)
Flexural strength (MPa)
1 69,93 30,82 3,327 13,52
2 69,48 29,44 3,161 14,17
3 69,40 29,58 3,134 13,93
4 71,44 29,11 3,246 14,48
5 69,37 29,67 3,264 14,43
6 69,55 29,67 2,947 13,00
7 69,77 30,85 3,098 12,60
8 69,84 30,93 3,302 13,34
9 69,69 30,57 3,164 13,12
10 69,76 29,72 3,481 15,25
Mean value of the flexural strenght: 13,8 MPa
Standard deviation: 0,8 MPa
For the calculation of the lower expected value (E) a logarithmic normal distribution is
assumed. The lower expected value (E) corresponds to the 5% quantile of a logarithmic
normal distribution for a confidence level of 75%. E is calculated as follows: ( )lnln skx SeE ⋅−=
where lnx is the logarithmic mean and sln is the logarithmic standard deviation.
Lower expected value: 12,17 MPa
LABORATORIO DE PETROLOGÍA APLICADADepartamento de Ciencias de la Tierra y del Medio Ambiente
UNIVERSIDAD DE ALICANTE Data of test: January 2011Requested by: Piedra Paloma S.L. Commercial name of analysed material: Piedra Paloma
Data reported here relates to samples supplied by the company who submitted the test. The company who solicits the tests accepts full responsibility for the sampling. Partial or total reproduction of this report is forbidden without written authorization of the laboratory. 10
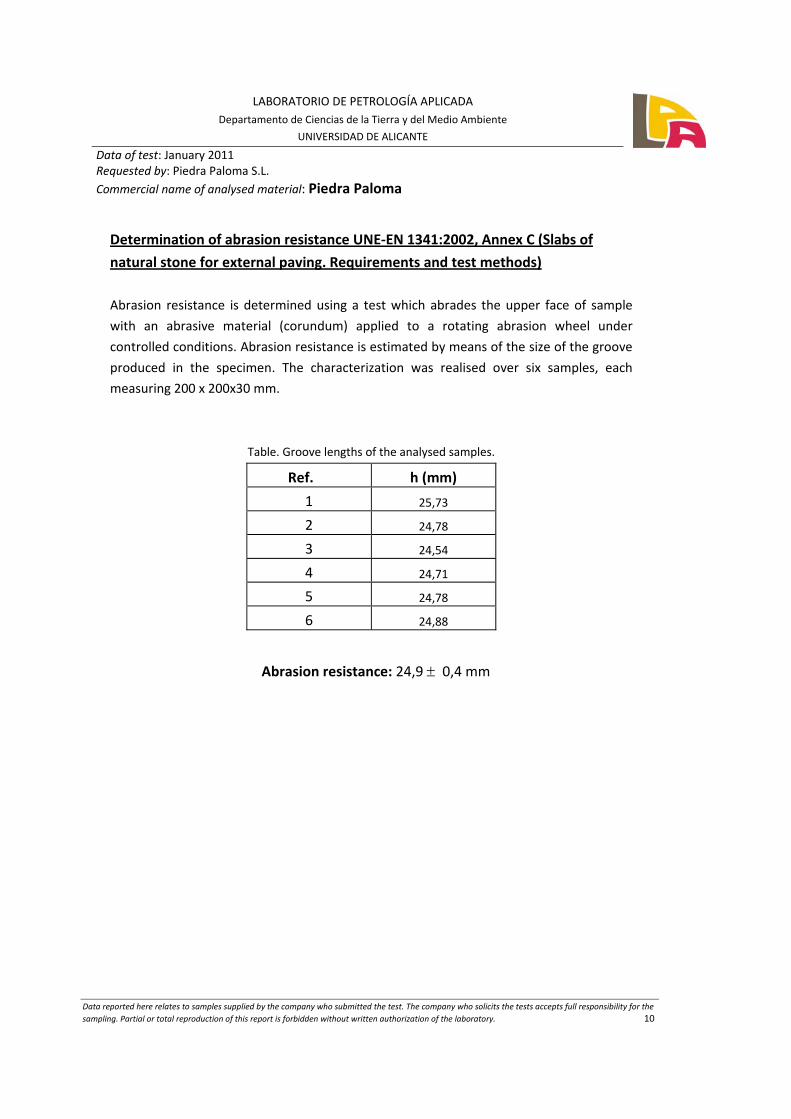
Determination of abrasion resistance UNE‐EN 1341:2002, Annex C (Slabs of
natural stone for external paving. Requirements and test methods)
Abrasion resistance is determined using a test which abrades the upper face of sample
with an abrasive material (corundum) applied to a rotating abrasion wheel under
controlled conditions. Abrasion resistance is estimated by means of the size of the groove
produced in the specimen. The characterization was realised over six samples, each
measuring 200 x 200x30 mm.
Table. Groove lengths of the analysed samples.
Ref. h (mm)
1 25,73
2 24,78
3 24,54
4 24,71
5 24,78
6 24,88
Abrasion resistance: 24,9 ± 0,4 mm
LABORATORIO DE PETROLOGÍA APLICADADepartamento de Ciencias de la Tierra y del Medio Ambiente
UNIVERSIDAD DE ALICANTE Data of test: January 2011Requested by: Piedra Paloma S.L. Commercial name of analysed material: Piedra Paloma
Data reported here relates to samples supplied by the company who submitted the test. The company who solicits the tests accepts full responsibility for the sampling. Partial or total reproduction of this report is forbidden without written authorization of the laboratory. 11
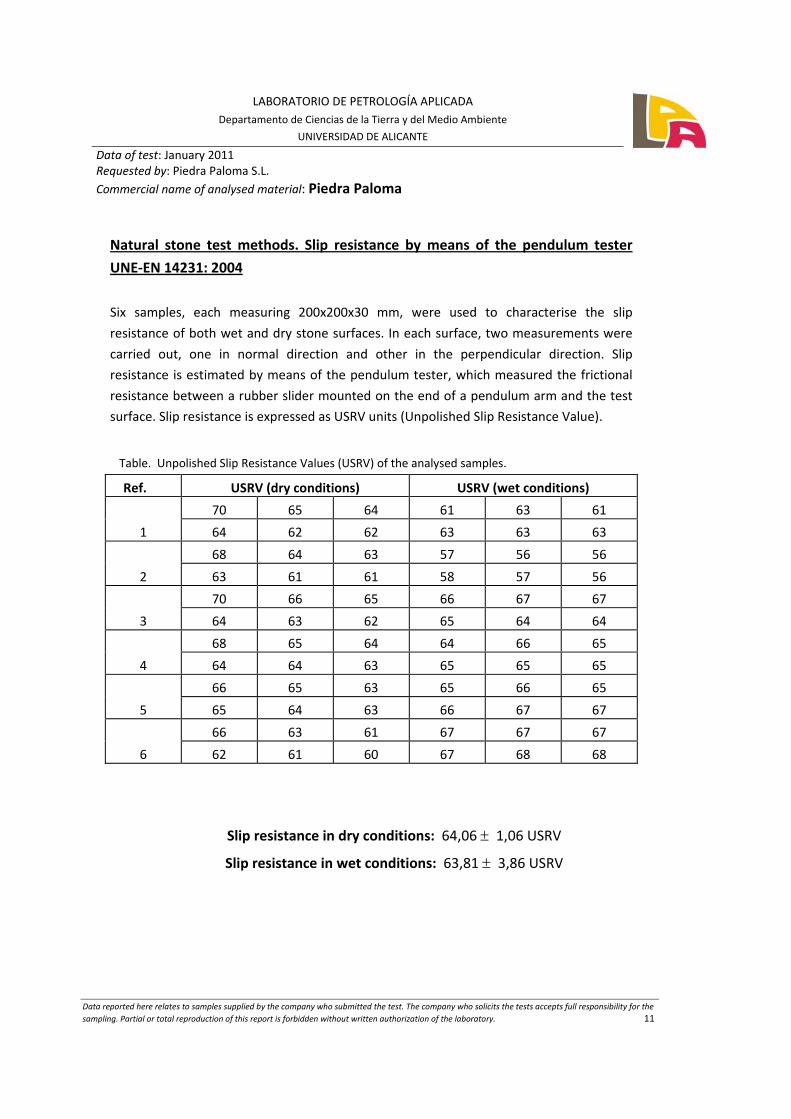
Natural stone test methods. Slip resistance by means of the pendulum tester
UNE‐EN 14231: 2004
Six samples, each measuring 200x200x30 mm, were used to characterise the slip
resistance of both wet and dry stone surfaces. In each surface, two measurements were
carried out, one in normal direction and other in the perpendicular direction. Slip
resistance is estimated by means of the pendulum tester, which measured the frictional
resistance between a rubber slider mounted on the end of a pendulum arm and the test
surface. Slip resistance is expressed as USRV units (Unpolished Slip Resistance Value).
Table. Unpolished Slip Resistance Values (USRV) of the analysed samples.
Ref. USRV (dry conditions) USRV (wet conditions)
1
70 65 64 61 63 61
64 62 62 63 63 63
2
68 64 63 57 56 56
63 61 61 58 57 56
3
70 66 65 66 67 67
64 63 62 65 64 64
4
68 65 64 64 66 65
64 64 63 65 65 65
5
66 65 63 65 66 65
65 64 63 66 67 67
6
66 63 61 67 67 67
62 61 60 67 68 68
Slip resistance in dry conditions: 64,06 ± 1,06 USRV
Slip resistance in wet conditions: 63,81 ± 3,86 USRV
LABORATORIO DE PETROLOGÍA APLICADADepartamento de Ciencias de la Tierra y del Medio Ambiente
UNIVERSIDAD DE ALICANTE Data of test: January 2011Requested by: Piedra Paloma S.L. Commercial name of analysed material: Piedra Paloma
Data reported here relates to samples supplied by the company who submitted the test. The company who solicits the tests accepts full responsibility for the sampling. Partial or total reproduction of this report is forbidden without written authorization of the laboratory. 12
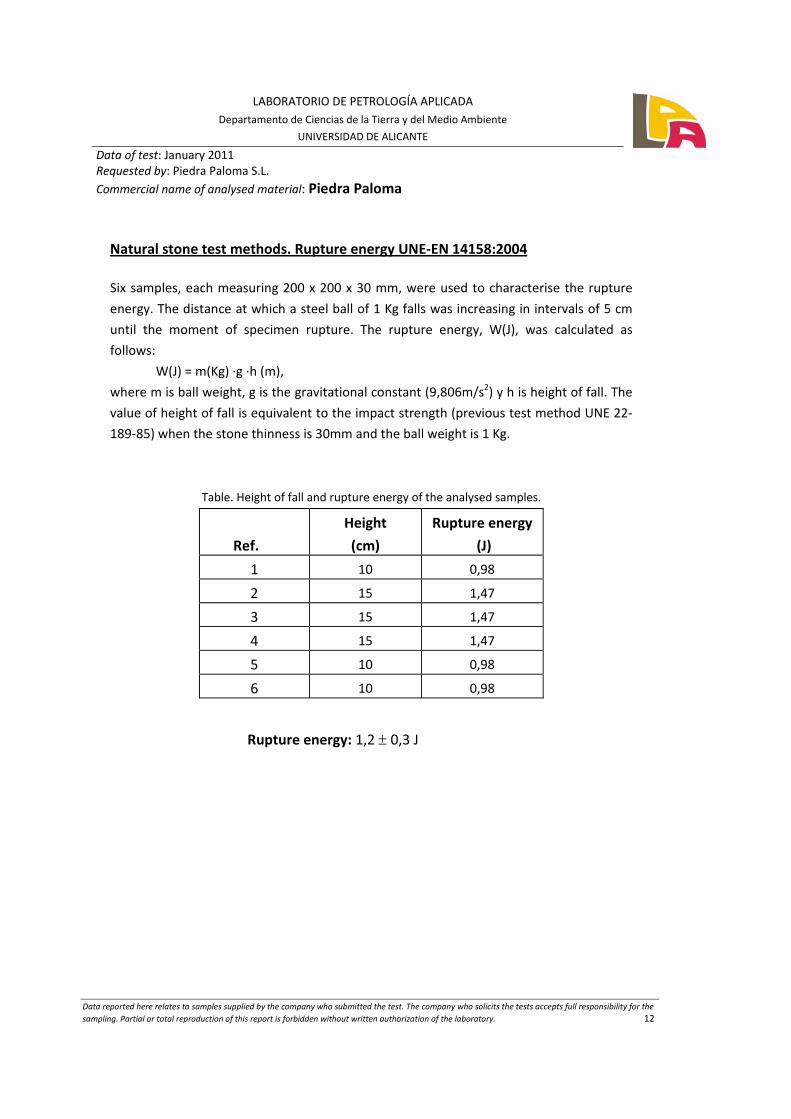
Natural stone test methods. Rupture energy UNE‐EN 14158:2004
Six samples, each measuring 200 x 200 x 30 mm, were used to characterise the rupture
energy. The distance at which a steel ball of 1 Kg falls was increasing in intervals of 5 cm
until the moment of specimen rupture. The rupture energy, W(J), was calculated as
follows:
W(J) = m(Kg) ∙g ∙h (m),
where m is ball weight, g is the gravitational constant (9,806m/s2) y h is height of fall. The
value of height of fall is equivalent to the impact strength (previous test method UNE 22‐
189‐85) when the stone thinness is 30mm and the ball weight is 1 Kg.
Table. Height of fall and rupture energy of the analysed samples.
Ref.
Height
(cm)
Rupture energy
(J)
1 10 0,98
2 15 1,47
3 15 1,47
4 15 1,47
5 10 0,98
6 10 0,98
Rupture energy: 1,2 ± 0,3 J
LABORATORIO DE PETROLOGÍA APLICADADepartamento de Ciencias de la Tierra y del Medio Ambiente
UNIVERSIDAD DE ALICANTE Data of test: January 2011Requested by: Piedra Paloma S.L. Commercial name of analysed material: Piedra Paloma
Data reported here relates to samples supplied by the company who submitted the test. The company who solicits the tests accepts full responsibility for the sampling. Partial or total reproduction of this report is forbidden without written authorization of the laboratory. 13
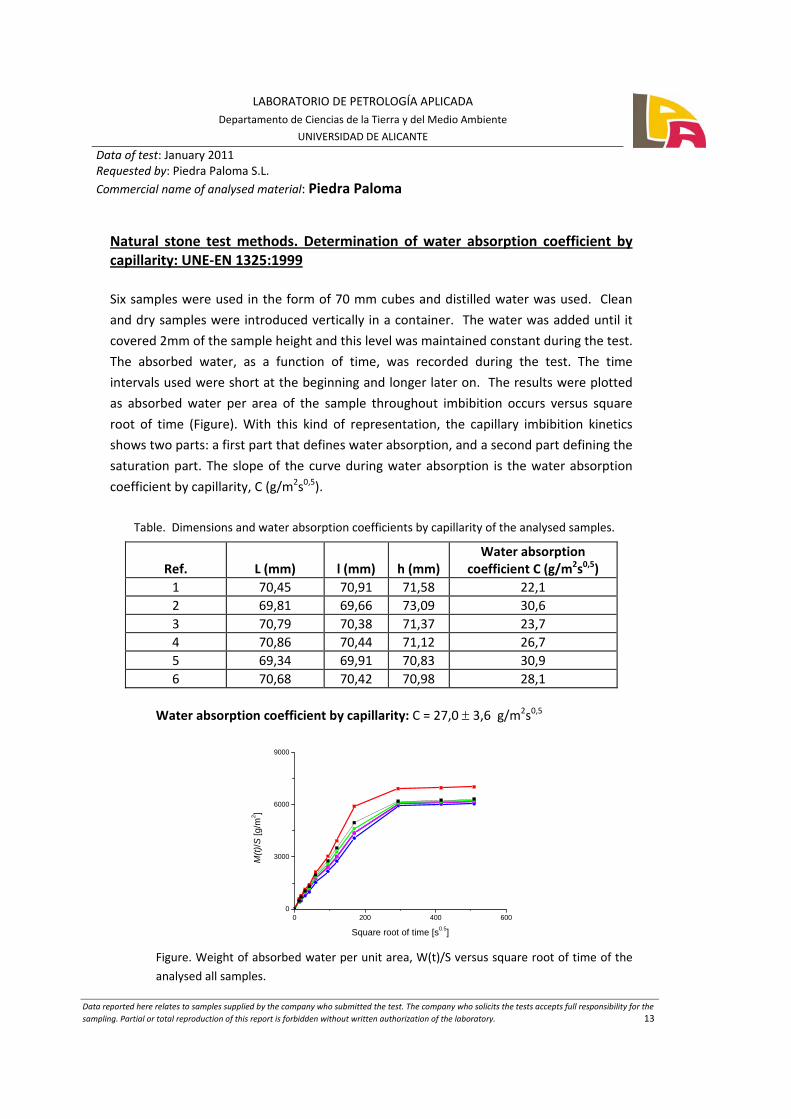
Natural stone test methods. Determination of water absorption coefficient by capillarity: UNE‐EN 1325:1999
Six samples were used in the form of 70 mm cubes and distilled water was used. Clean
and dry samples were introduced vertically in a container. The water was added until it
covered 2mm of the sample height and this level was maintained constant during the test.
The absorbed water, as a function of time, was recorded during the test. The time
intervals used were short at the beginning and longer later on. The results were plotted
as absorbed water per area of the sample throughout imbibition occurs versus square
root of time (Figure). With this kind of representation, the capillary imbibition kinetics
shows two parts: a first part that defines water absorption, and a second part defining the
saturation part. The slope of the curve during water absorption is the water absorption
coefficient by capillarity, C (g/m2s0,5).
Table. Dimensions and water absorption coefficients by capillarity of the analysed samples.
Ref. L (mm) l (mm) h (mm) Water absorption
coefficient C (g/m2s0,5) 1 70,45 70,91 71,58 22,1 2 69,81 69,66 73,09 30,6 3 70,79 70,38 71,37 23,7 4 70,86 70,44 71,12 26,7 5 69,34 69,91 70,83 30,9 6 70,68 70,42 70,98 28,1
Water absorption coefficient by capillarity: C = 27,0 ± 3,6 g/m2s0,5
0 200 400 6000
3000
6000
9000
M(t)
/S [g
/m2 ]
Square root of time [s0.5]
Figure. Weight of absorbed water per unit area, W(t)/S versus square root of time of the
analysed all samples.
LABORATORIO DE PETROLOGÍA APLICADADepartamento de Ciencias de la Tierra y del Medio Ambiente
UNIVERSIDAD DE ALICANTE Data of test: January 2011Requested by: Piedra Paloma S.L. Commercial name of analysed material: Piedra Paloma
Data reported here relates to samples supplied by the company who submitted the test. The company who solicits the tests accepts full responsibility for the sampling. Partial or total reproduction of this report is forbidden without written authorization of the laboratory. 14
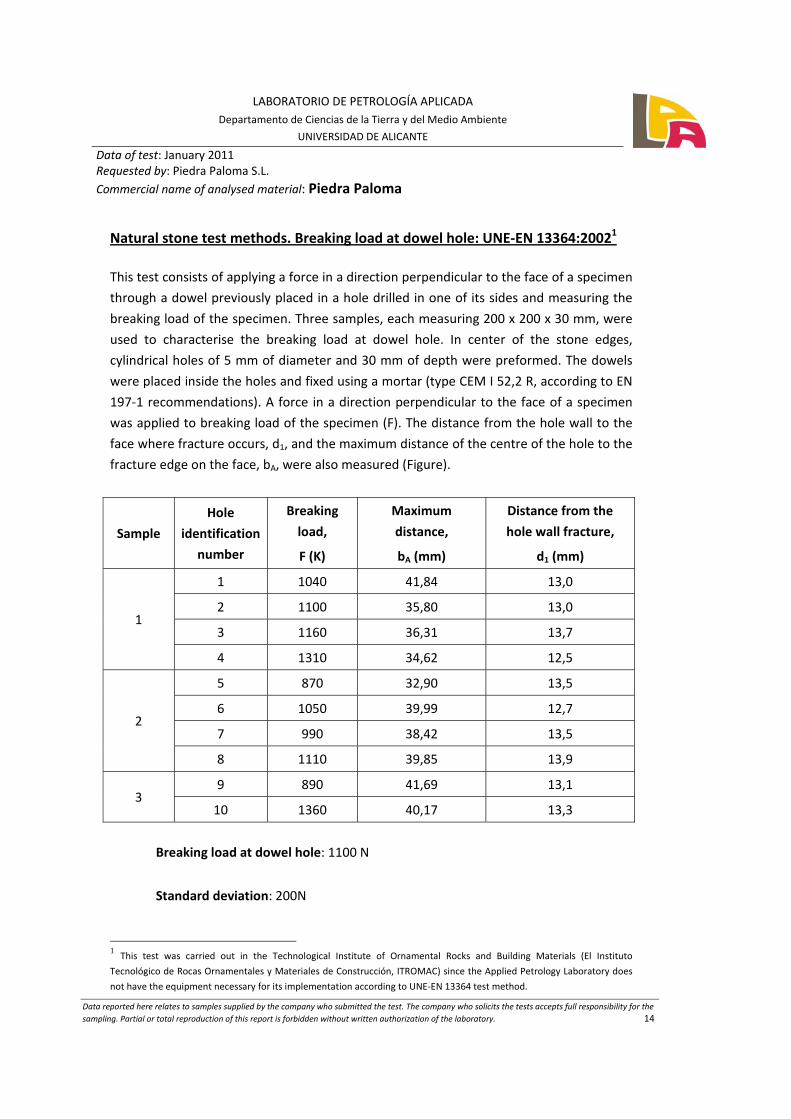
Natural stone test methods. Breaking load at dowel hole: UNE‐EN 13364:20021
This test consists of applying a force in a direction perpendicular to the face of a specimen
through a dowel previously placed in a hole drilled in one of its sides and measuring the
breaking load of the specimen. Three samples, each measuring 200 x 200 x 30 mm, were
used to characterise the breaking load at dowel hole. In center of the stone edges,
cylindrical holes of 5 mm of diameter and 30 mm of depth were preformed. The dowels
were placed inside the holes and fixed using a mortar (type CEM I 52,2 R, according to EN
197‐1 recommendations). A force in a direction perpendicular to the face of a specimen
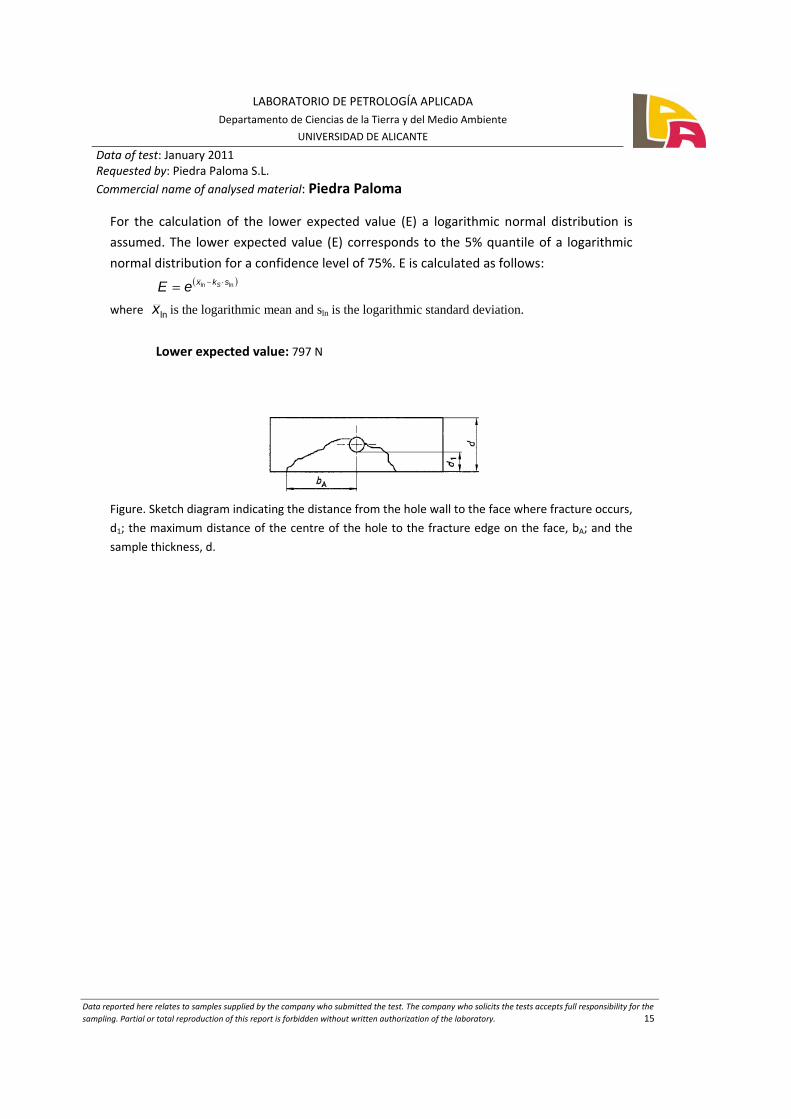
was applied to breaking load of the specimen (F). The distance from the hole wall to the
face where fracture occurs, d1, and the maximum distance of the centre of the hole to the
fracture edge on the face, bA, were also measured (Figure).
Sample
Hole
identification
number
Breaking
load,
F (K)
Maximum
distance,
bA (mm)
Distance from the
hole wall fracture,
d1 (mm)
1
1 1040 41,84 13,0
2 1100 35,80 13,0
3 1160 36,31 13,7
4 1310 34,62 12,5
2
5 870 32,90 13,5
6 1050 39,99 12,7
7 990 38,42 13,5
8 1110 39,85 13,9
3 9 890 41,69 13,1
10 1360 40,17 13,3
Breaking load at dowel hole: 1100 N
Standard deviation: 200N
1 This test was carried out in the Technological Institute of Ornamental Rocks and Building Materials (El Instituto
Tecnológico de Rocas Ornamentales y Materiales de Construcción, ITROMAC) since the Applied Petrology Laboratory does
not have the equipment necessary for its implementation according to UNE‐EN 13364 test method.
LABORATORIO DE PETROLOGÍA APLICADADepartamento de Ciencias de la Tierra y del Medio Ambiente
UNIVERSIDAD DE ALICANTE Data of test: January 2011Requested by: Piedra Paloma S.L. Commercial name of analysed material: Piedra Paloma
Data reported here relates to samples supplied by the company who submitted the test. The company who solicits the tests accepts full responsibility for the sampling. Partial or total reproduction of this report is forbidden without written authorization of the laboratory. 15
For the calculation of the lower expected value (E) a logarithmic normal distribution is
assumed. The lower expected value (E) corresponds to the 5% quantile of a logarithmic
normal distribution for a confidence level of 75%. E is calculated as follows: ( )lnln skx SeE ⋅−=
where lnx is the logarithmic mean and sln is the logarithmic standard deviation.
Lower expected value: 797 N
Figure. Sketch diagram indicating the distance from the hole wall to the face where fracture occurs,
d1; the maximum distance of the centre of the hole to the fracture edge on the face, bA; and the
sample thickness, d.

LABORATORIO DE PETROLOGÍA APLICADADepartamento de Ciencias de la Tierra y del Medio Ambiente
UNIVERSIDAD DE ALICANTE Data of test: January 2011Requested by: Piedra Paloma S.L. Commercial name of analysed material: Piedra Paloma
Data reported here relates to samples supplied by the company who submitted the test. The company who solicits the tests accepts full responsibility for the sampling. Partial or total reproduction of this report is forbidden without written authorization of the laboratory. 16
ANNEX III. DURABILITY
Natural stone test methods. Resistance to frost UNE‐EN 12371:2001
The frost resistance of natural stone was determined by a test comprising cycles of freezing in air and thawing in water. The frost resistance was estimated by the variation of the flexural strength and weight and through a visual inspection. The freeze‐thaw test was carried out in a freezing chamber. The first step of the test consists in saturating the samples with distilled water. After that, the cycles begin. One cycle consists in three parts: 1) temperature decrease until ‐8 0C for 2 hours (dry conditions); 2) temperature decrease until ‐12 0C for 4 hours (dry conditions); and 3) temperature increase until 20 0C for 6 hours (wet conditions and sample water saturation). Samples were subjected to 48 cycles of freeze‐thaw. After the completion of the required number of cycles, samples were taking out from the freezing chamber, and dried in an oven (70 0C). The specimens were visually inspected, weighted and flexural strength tested in accordance with UNE‐EN 12372 standard.
Weight loss: 0.03 %
The visual inspection was realised to the tested samples and evaluated in concordance to the following classification (Table).
Table: Classification of alteration on tested samples
Evaluation Alteration forms on tested samples
0 No alteration
1
Minimal damage (minimal roundness of corners and edges) that does not affect the integrity of the samples.
2
One or several small cracks (≤ 0,1 mm width) or breakdown of small fragments (≤ 10 mm2 fragment surface)
3
One or several small cracks, holes or breakdown of fragments higher than classification number 2
4 Specimen breakdown in two pieces or in large cracks
5 Specimen breakdown in several rock pieces or disintegrated.
The tested samples did not show visual alteration after the freeze‐thaw test.
LABORATORIO DE PETROLOGÍA APLICADADepartamento de Ciencias de la Tierra y del Medio Ambiente
UNIVERSIDAD DE ALICANTE Data of test: January 2011Requested by: Piedra Paloma S.L. Commercial name of analysed material: Piedra Paloma
Data reported here relates to samples supplied by the company who submitted the test. The company who solicits the tests accepts full responsibility for the sampling. Partial or total reproduction of this report is forbidden without written authorization of the laboratory. 17
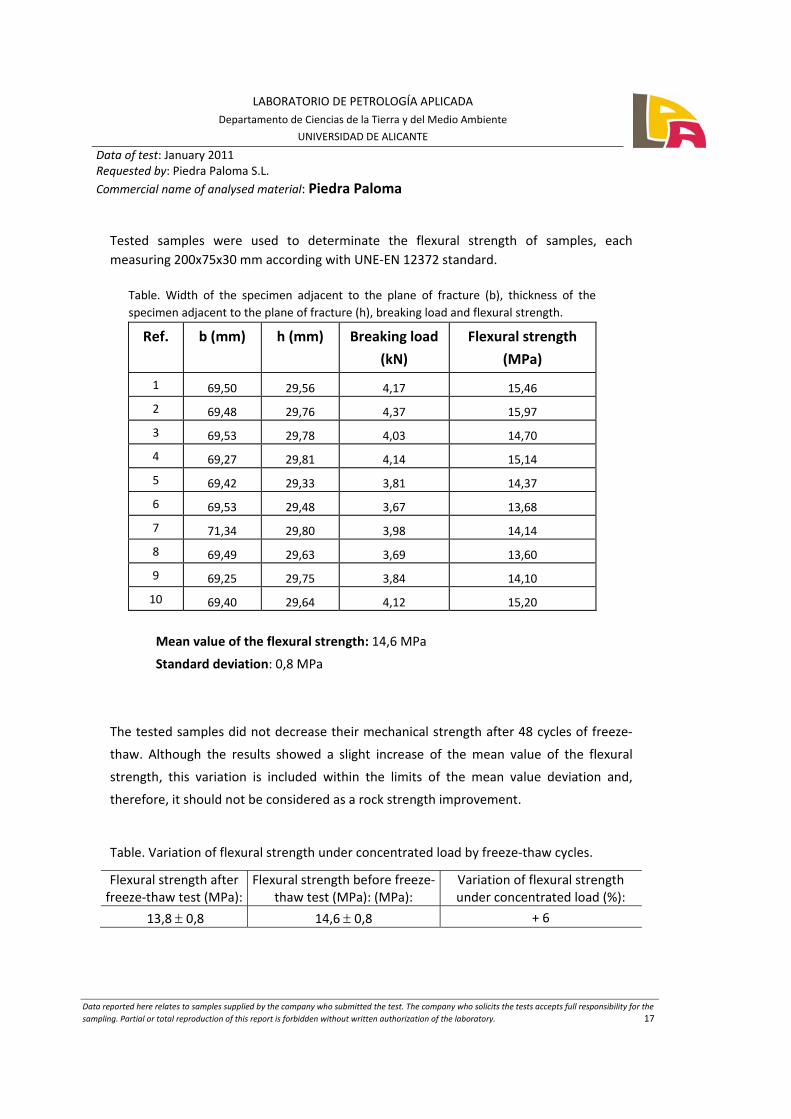
Tested samples were used to determinate the flexural strength of samples, each measuring 200x75x30 mm according with UNE‐EN 12372 standard.
Table. Width of the specimen adjacent to the plane of fracture (b), thickness of the specimen adjacent to the plane of fracture (h), breaking load and flexural strength.
Ref. b (mm) h (mm) Breaking load
(kN)
Flexural strength
(MPa)
1 69,50 29,56 4,17 15,46
2 69,48 29,76 4,37 15,97
3 69,53 29,78 4,03 14,70
4 69,27 29,81 4,14 15,14
5 69,42 29,33 3,81 14,37
6 69,53 29,48 3,67 13,68
7 71,34 29,80 3,98 14,14
8 69,49 29,63 3,69 13,60
9 69,25 29,75 3,84 14,10
10 69,40 29,64 4,12 15,20
Mean value of the flexural strength: 14,6 MPa
Standard deviation: 0,8 MPa
The tested samples did not decrease their mechanical strength after 48 cycles of freeze‐
thaw. Although the results showed a slight increase of the mean value of the flexural
strength, this variation is included within the limits of the mean value deviation and,
therefore, it should not be considered as a rock strength improvement.
Table. Variation of flexural strength under concentrated load by freeze‐thaw cycles.
Flexural strength after freeze‐thaw test (MPa):
Flexural strength before freeze‐thaw test (MPa): (MPa):
Variation of flexural strength under concentrated load (%):
13,8 ± 0,8 14,6 ± 0,8 + 6
LABORATORIO DE PETROLOGÍA APLICADADepartamento de Ciencias de la Tierra y del Medio Ambiente
UNIVERSIDAD DE ALICANTE Data of test: January 2011Requested by: Piedra Paloma S.L. Commercial name of analysed material: Piedra Paloma
Data reported here relates to samples supplied by the company who submitted the test. The company who solicits the tests accepts full responsibility for the sampling. Partial or total reproduction of this report is forbidden without written authorization of the laboratory. 18
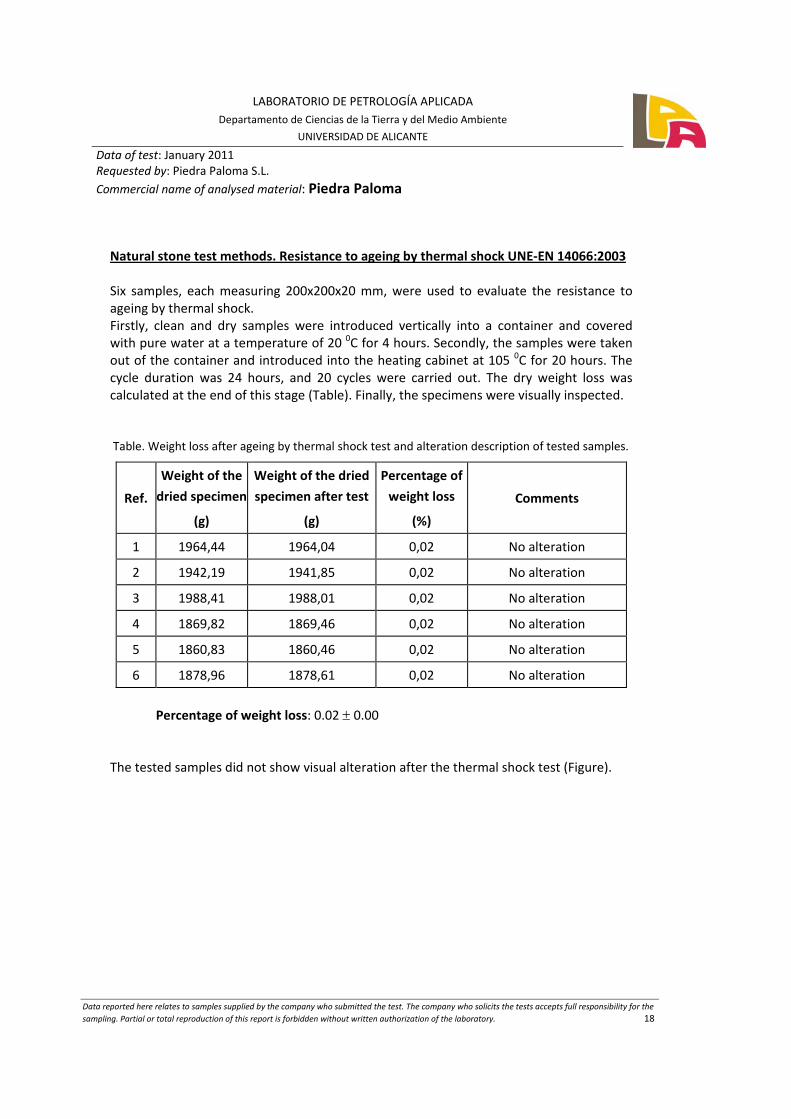
Natural stone test methods. Resistance to ageing by thermal shock UNE‐EN 14066:2003 Six samples, each measuring 200x200x20 mm, were used to evaluate the resistance to ageing by thermal shock. Firstly, clean and dry samples were introduced vertically into a container and covered with pure water at a temperature of 20 0C for 4 hours. Secondly, the samples were taken out of the container and introduced into the heating cabinet at 105 0C for 20 hours. The cycle duration was 24 hours, and 20 cycles were carried out. The dry weight loss was calculated at the end of this stage (Table). Finally, the specimens were visually inspected. Table. Weight loss after ageing by thermal shock test and alteration description of tested samples.
Ref.
Weight of the
dried specimen
(g)
Weight of the dried
specimen after test
(g)
Percentage of
weight loss
(%)
Comments
1 1964,44 1964,04 0,02 No alteration
2 1942,19 1941,85 0,02 No alteration
3 1988,41 1988,01 0,02 No alteration
4 1869,82 1869,46 0,02 No alteration
5 1860,83 1860,46 0,02 No alteration
6 1878,96 1878,61 0,02 No alteration
Percentage of weight loss: 0.02 ± 0.00
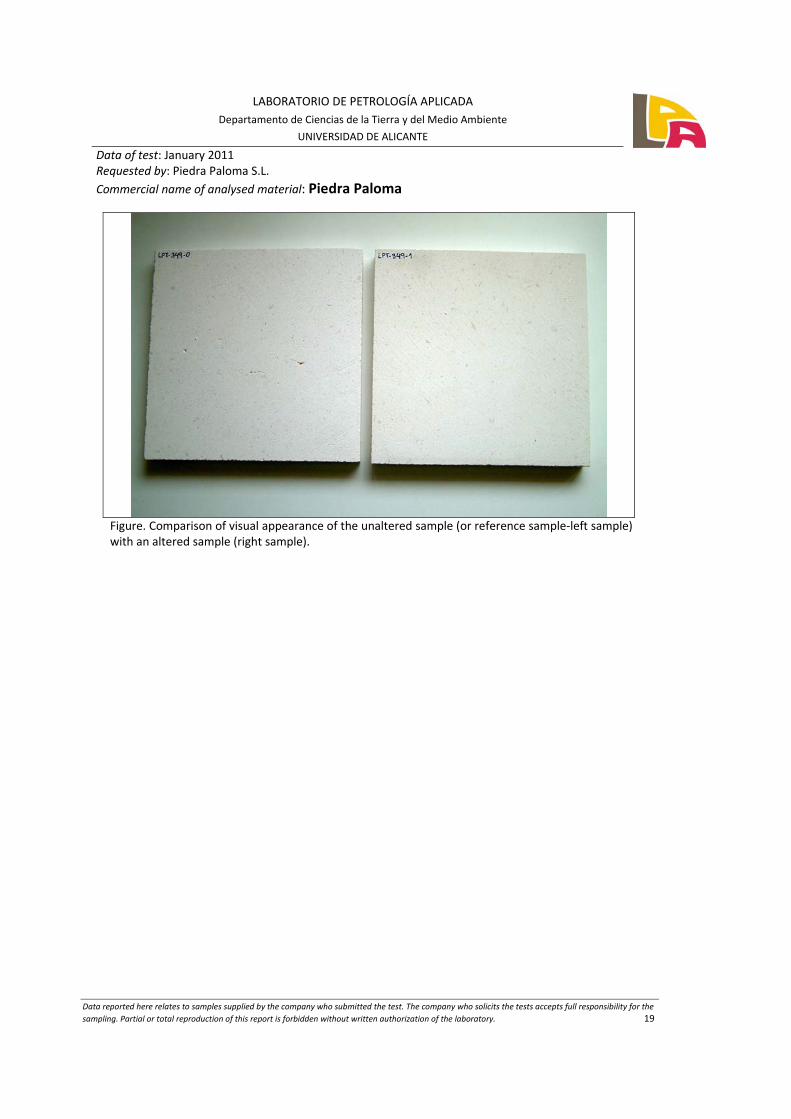
The tested samples did not show visual alteration after the thermal shock test (Figure).
LABORATORIO DE PETROLOGÍA APLICADADepartamento de Ciencias de la Tierra y del Medio Ambiente
UNIVERSIDAD DE ALICANTE Data of test: January 2011Requested by: Piedra Paloma S.L. Commercial name of analysed material: Piedra Paloma
Data reported here relates to samples supplied by the company who submitted the test. The company who solicits the tests accepts full responsibility for the sampling. Partial or total reproduction of this report is forbidden without written authorization of the laboratory. 19
Figure. Comparison of visual appearance of the unaltered sample (or reference sample‐left sample) with an altered sample (right sample).