Embed Size (px)
Citation preview

Innovative Economy Operational Programme
2007 – 2013
National Strategic Reference Framework 2007 – 2013
Warszawa, 5 February 2007
MINISTRY OF REGIONAL DEVELOPMENT

2
Tłumaczenie przygotowane na zlecenie Ministerstwa Rozwoju Regionalnego
współfinansowane ze środków Europejskiego Funduszu Rozwoju Regionalnego

3
Table of Contents Introduction ………………………………………………………………………………..…. 5 1. Diagnosis of selected areas aimed at establishing and developing a knowledge-based economy ……………………………………………………………………………………… 7 1.1 Description of the enterprise sector in Poland …………………………………………… 7 1.2 The enterprise sector in Poland in comparison with the EU enterprise sector …………... 7 1.3 Innovativeness of enterprises operating in Poland ………………………………………. 8 1.4 Financial results of the Polish enterprise sector ……………………………...…………. 12 1.5 Investments in the enterprise sector ………………………..…………….……………... 14 1.6 Foreign trade ……………………………………………………………………………. 17 1.7 Employment and work efficiency in the enterprise sector …………..………….….…… 21 1.8 Regulatory framework of the enterprise sector …………………………………………. 22 1.9 Business support institutions ……………………………………………………………. 24 1.10 Financing of enterprises at early stages of development .….……...….….….….….…. 26 1.11 Cooperation of entrepreneurs …………………………………………………………. 28 1.12 Economic promotion of Poland ……………………………………………………….. 28 1.13 Cooperation between scientific entities and the economy …………………………….. 29 1.14 Diagnosis of Research and Development activities …………………………………… 31 1.15 Human resources potential in Research and Development ………….………….….….. 32 1.16 Research and Development equipment ……………………………………………...… 33 1.17 IT infrastructure of science ..………….…….……..……….….….…………..….….... 34 1.18 International scientific and technical cooperation …..….….…...…..…….…...….….… 34 1.19 IT market in Poland ……………………………………………………………………. 35 1.20 Level of the country’s data communication infrastructure ……….………….…….….. 36 1.21 Level of development of eServices of the public administration ……………………… 36 1.22 Activities in the area of eEconomy……….…………………………….…….………... 37 1.23 eCitizen ……………………………………………….……………………….….…… 40 2. SWOT analysis …………………………….…………………………………………….. 41 3. Assessment of the effectiveness of domestic and foreign support for the enterprise sector in the years 2000-2006 …………………………………………..…………………….………. 46 3.1 Characteristics of aid granted to the enterprise sector ………………………………….. 46 3.2 Analysis and assessment of domestic and foreign support for the science sector ……… 47 3.3 Support from European funds ………………………………….….……….…………… 51 3.3.1 Support for enterprises within pre-accession programmes ………….……….……..… 51 3.3.2 Support for enterprises within the European Union’s structural funds ……………….. 52 3.4 Aid to business support institutions ……………………………………….…….……… 54 3.5 Support for the science sector within the European Union’s structural funds ….….….... 55 4. Strategy ……………………………………………………………….………….…….… 57 4.1 Main objective ………………………………………………………………………….. 57 4.2 Detailed objectives ……………………………………………………………………… 60 4.3 Strategy for implementation of the detailed objectives …………………………………. 62 4.3.1 Detailed objective 1. Improvement of innovativeness of enterprises …….……..……. 64 4.3.2 Detailed Objective 2. Improvement of competitiveness of Polish science …………… 65 4.3.3 Detailed Objective 3. Strengthening of the role of science in economic development.. 67
4
4.3.4 Detailed objective 4. Increasing the share of innovative products of the Polish economy in the international market …………………………………………………….……….…… 68 4.3.5 Detailed Objective 5. Creation of permanent and better workplaces ………………… 69 4.3.6 Detailed objective 6. Growth of the use of information and communication technologies in the economy ……………………………………………………………………………… 70 5. Priority axes implemented within the programme ……………………………………….. 72 5.1 Priority Axis 1. Research and development of new technologies ………………………. 72 5.2 Priority Axis 2. R&D infrastructure …………………………………………………….. 78 5.3 Priority Axis 3. Capital for innovation ………………………………………………….. 82 5.4 Priority Axis 4. Investments in innovative undertakings ……………….………….…… 85 5.5 Priority Axis 5. Diffusion of innovation ……………………….….…….…………….... 89 5.6 Priority Axis 6. Polish economy on the international market ….…….……….………… 93 5.7 Priority Axis 7. Information society establishment and development ………………….. 97 5.8 Priority Axis 8. Technical assistance ………………………………….………….…… 102 6. System for the implementation of the Innovative Economy Operational Programme …. 105 6.1 Management and implementation …………………………….……….……….……… 105 6.1.1 General remarks ……………………………………………………………………... 105 6.1.2 Managing Authority …………………………………………………………………. 105 6.1.3 Intermediary Bodies …………………………………………………………………. 107 6.1.4 Certifying Authority …………………………………………………………………. 110 6.1.5 Audit Authority ……………………………….……………….……….……………. 111 6.2 Audit and control procedures ………………………………………………………….. 111 6.2.1 Audits of management and control systems ……………………….……….……...... 111 6.2.2 Controls of projects ………………………………………………………………….. 112 6.3 Financial flows ………………………………………………………..……….………. 113 6.4 Monitoring …………………………………….……………….…….………………... 113 6.4.1 Monitoring Committee ……………………………………………………………… 113 6.5 Evaluation ……………………………………………………………………………... 114 6.6 Exchange of electronic data aimed at meeting the requirements related to payments, monitoring and evaluation ……………………………………….……….……….………. 115 6.7 Information and promotion …………………………………………….……………… 115 6.8 Principle of partnership ………………………………………………………………... 116 7. Draft financial plan …………………………………………………….…….….……… 117 8. Categories of structural funds intervention in the years 2007-2013 ……………………. 119 9. Annexes …………………………………………………………………………………. 124 Annex 9.1. Indicative financial table ……………………………………….….….………. 124 Annex 9.2. Ex-ante evaluation and assessment of the expected macroeconomic effect ….. 128 Annex 9.3. Assessment of the expected impact on the environment ……………………… 131 Annex 9.4. Report on social consultations ………………………………………………… 135 Annex 9.5 Indicatve list of major projects…………………………………………………..140 10. List of abbreviations used in the Programme ………………….……….…………….... 141

5
INTRODUCTION
The Innovative Economy Operational Programme (IE OP) is one of the instruments for the implementation of the National Strategic Reference Framework for the years 2007-2013 (NSRF)1. The NSRF sets out the national framework for intervention within the European Regional Development Fund (ERDF), the European Social Fund (ESF) and the Cohesion Fund, as well as the rules for coordination of the EU cohesion policy and respective national, sectoral and regional policies. Furthermore, it defines the mechanism for coordination of the programmes co-financed from the ERDF, the ESF and the Cohesion Fund, programmes co-financed from the European Agricultural Fund for Rural Development (EAFRD), the European Fisheries Fund (EFF) and the European Investment Bank (EIB), as well as with the use of other financial instruments.
According to the NSRF implementation system, the minister in charge of regional development is responsible for preparing a draft of the IE OP, acting as coordinator of works carried out by the minister in charge of economy, the minister in charge of tourism, the minister in charge of science and the minister in charge of informatisation.
The IE OP, managed by the minister in charge of regional development, is aimed to contribute to improvement of the intervention cohesion within the scope of competence of the ministers in charge of economy, science, tourism and informatisation. It will allow for adjusting the offer of the science sector to the needs of enterprises, and will eventually contribute to an increased transfer of modern solutions from the science sector to the economy. The resulting synergy will generate an extra impulse that will allow for accelerating the pace of economic growth and for creating the basis for long-term competitiveness of the Polish economy.
All priority axes of the IE OP aim at supporting innovativeness and measures that support innovativeness. In the IE OP, innovativeness should be understood as introduction of novelties to economic practice. More precisely, innovativeness should denote introduction of new or significantly improved solutions regarding a product (a good or service), a process, marketing or organisation2. Innovativeness cannot be defined objectively, it must refer to a particular enterprise which, after introducing innovative solutions, becomes an innovative enterprise in the given period of time. Innovativeness is characterised by its novelty and diffusion. In the IE OP, priority will be given to support for innovations with the largest potential for diffusion, as they are of key importance to the Polish economy as a whole, to its modernisation, to improvement of its competitiveness on the international market, and to its ability to create workplaces based on knowledge. In the IE OP emphasis will be placed on process, marketing and organisational innovativeness related to electronic economy based on knowledge, as it has the greatest potential for growth and export. At the same time, backing for business support institutions and scientific entities is conditioned by appropriate demand for their services on the part of innovative enterprises. Innovativeness with a low degree of diffusion will be promoted and supported within Regional Operational Programmes (ROPs) and the Eastern Poland Development Operational Programme. The IE OP covers the measures that support innovativeness, offering assistance for business support institutions (BSI) and scientific entities, provided that there is demand for their services on the part of innovative enterprises.
Within the IE OP, there will also be a possibility to support innovative projects that will be focusing on changes in production or consumption models, and, consequently, will directly or
1 The document entitled “National Strategic Reference Framework 2007-2013 supporting economic growth and employment” was adopted by the Council of Ministers on 29 November 2006. 2 Oslo Manual, Guidelines for Collecting and Interpreting Innovation Data, third edition of 2005, joint publication of the Organisation for Economic Cooperation and Development (OECD) and the Statistical Office of the European Communities (Eurostat).

6
indirectly contribute to reduction of pressures on particular environmental components (air, water, soil, nature, landscape) and the environment as a whole. This will be achieved through limiting emission and eliminating, from economic use, substances that are particularly damaging to the environment and human health, by limiting the amounts of non-recyclable waste, by reducing the demand for non-renewable resources and by limiting, or at least rationalising the use of energy. This also refers to innovative techniques of environmental protection sensu stricto that ensure better effectiveness of the reduction of effects on the environment with reduced costs and outlays of materials and energy.
The Innovative Economy Operational Programme consists of the following components:
- diagnosis of selected areas aimed at establishing and developing a knowledge-based economy,
- SWOT analysis;
- information on present domestic and foreign assistance for the enterprise and science sectors and aimed at creating an information society,
- strategy setting out the main objective and the detailed objectives of the IE OP that will be achieved as a result of its implementation,
- description of individual priority axes defining the extent of public intervention within the framework of the IE OP,
- description of the institutional implementation system,
- financial tables presenting division of resources into particular priority axes and the years of the IE OP implementation,
- annexes.

7
1. DIAGNOSIS OF SELECTED AREAS AIMED AT ESTABLISHING AN D DEVELOPING A KNOWLEDGE -BASED ECONOMY
3
1.1 Description of the enterprise sector in Poland4
1. There were more than 3.6 million economic entities registered in Poland at the end of 20055 out of which 96.2% belonged to the private sector6. The largest group among these enterprises were micro-enterprises constituting about 95.1% of all economic operators. Small and medium-sized enterprises constituted 4% and 0.8% respectively, whereas large companies accounted for 0.1% of all enterprises operating in Poland. It is estimated that 1.7 million of the registered entities are actually active.
2. Micro-enterprises operate in particular in crafts, commerce, transport, industrial manufacturing, construction industry, real estate and business services. They employ about 3.2 – 3.5 million people which amounts to nearly 20% of total employment in the economy (on average 2 persons per micro-enterprise).
3. The majority of enterprises in Poland are sole proprietorships, amounting to 76.8% of all existing companies. The second most popular organisational structure is a civil law partnership (a company that has no legal personality) constituting 7.7% of all economic operators. Companies based on the commercial law – mostly limited liability companies (Sp. z o.o.) amount to 6.4% of all economic entities. Other organisational forms (e.g. cooperatives, associations and foundations) are significantly less popular.
1.2 The enterprise sector in Poland in comparison with the EU enterprise sector
4. The entry of the ten new members into the EU caused an increase in the number of enterprises in the EU by 24%. Prior to the enlargement in 2001, there were around 18.7 million enterprises operating in the EU-15. In the candidate countries there were around 6 million enterprises, including some 3.4 million in Poland. Consequently, enterprises operating in Poland constitute about 13.8% of the total number of enterprises operating in the EU-257. In 2003, people employed in the Polish enterprise sector amounted to 7% of total EU-25 employment in enterprises. However, it has to
3 The statistical data comes from the Central Statistical Office (GUS), unless otherwise stated. Forecasts presented hereby have been prepared by the Gdansk Institute for Market Economics (IBnGR). Statistical data presented in this chapter will be updated before the adoption of the final version of the IE OP. 4 According to Article 2 of Annex I to Commission Regulation (EC) No. 364/2004 of 25 February 2004 amending Regulation (EC) No 70/2001 on extension of its scope so that to include aid for research and development (OJ L No. 63 of 2004), the following categories of enterprises have been distinguished: a medium-sized enterprise (an enterprise which employs fewer than 250 persons and has an annual turnover not exceeding EUR 50 million or an annual balance sheet total not exceeding EUR 43 million), a small enterprise (an enterprise which employs fewer than 50 persons and has an annual turnover not exceeding EUR 10 million or an annual balance sheet total not exceeding EUR 10 million), a micro-enterprise (an enterprise which employs fewer than 10 persons and has an annual turnover not exceeding EUR 2 million or an annual balance sheet total not exceeding EUR 2 million). A large enterprise is any enterprise other than a micro-, small or medium-sized enterprise as defined in the abovementioned Regulation. 5 Source: National Official Business Register REGON. 6 In the years 2003 – 2004 private enterprises generated about 79% of Gross Domestic Product (GDP) and about 55% of the employment in the economy. 7 In order to maintain data comparability, this chapter contains 2001 Eurostat data. The data covers only active enterprises, i.e. those that really run business operations. The data differs methodologically from the GUS data presented in other chapters of this paper.

8
be stressed that, as a result of a downfall of the Polish labour market in the years 2001 – 2004, this share has probably diminished.
5. In 2001, the enterprises operating in the EU-15 and in the candidate countries generated the added value of EUR 4.5 billion and the enterprises operating in Poland accounted for around 3.2% of this sum. This index is three times lower for the number of operators and two times lower than the employment, if compared to the said indices. Such data proves that the productivity level of Polish enterprises and the level of their technological development are far lower than those of enterprises operating in the EU-15.
1.3 Innovativeness of enterprises operating in Poland
6. Innovativeness8 of the sector of industrial enterprises in Poland is still very low which can be reflected by one of the lowest innovation indicators9 in the European Union10. In 2004, the share of enterprises performing innovative activities dropped by 0.3 percentage points from 39.3% in 2003. Additionally, this coincides with the lower share of innovative enterprises11 in the private sector (38.7% in 2004) than in the public sector (47.6%). As regards the share of innovative enterprises in manufacturing, it accounted for 18%12 and was similar to that of Slovakia (17%), but very low in comparison with the UE-15 where it amounts to 51%. Such a structure of business spending on innovation mainly stems from the poor financial condition
8 According to Oslo Manual (compare: footnote 2), the notion of innovation refers to introduction of a new or considerably improved solution regarding a product (good or service), process, marketing or organisation to the enterprise’s practice. Innovations consist in introducing a novelty in practice. Implementation of a new product (good or service) consists in offering it on the market. Implementation of a new process, new marketing solutions or a new organisation consists in its application in the present functioning of the given enterprise.
- A product innovation is introduction by an enterprise of a new good or service or considerable improvement of previous goods or services with regard to their characteristics or use. Improvement may be connected with technical parameters, components, materials, software, user-friendly maintenance and other functional features.
- A process innovation is introduction of new or significantly improved methods of production or supply in the enterprise’s practice.
- A marketing innovation is application of a new marketing method covering significant changes in the product appearance, package, positioning, promotion, price policy or business model, stemming from a new marketing strategy of the enterprise.
- An organisational innovation is application of a new method of organisation of the enterprise’s business activity, new organisation of workplaces or new organisation of external relations.
Innovative solutions (a product, a process, marketing or an organisation) may result form the enterprise’s own R&D activity, cooperation with other enterprises and institutions, or may result from acquisition of knowledge of intangible nature (patents, licences, software, know-how, technical, marketing, organisational or training services), or of tangible nature (machines and equipment with better parameters). 9 An innovative enterprise is an enterprise that in the given period (e.g. within the last three years) introduced an innovation. In accordance with this definition, an enterprise which has at its disposal certain advanced technologies and sells them to other companies but which does not develop them, is not an innovative enterprise. Innovation indicators identify the share of entities that have introduced innovations over a three-year period in the given population of industrial entities. 10 The indicator for Poland accounts for 0.23 whereas the UE-25 average stands at 0.42%; Poland is on the 21st position in the EU in terms of this indicator. Source: European Innovation Scoreboard 2005. Comparative Analysis of Innovation Performance. European Commission, Luxembourg 2005. 11 Compare footnote 7. 12 The data refers to economic operators in sections C, D and E according to the Polish Classification of Activities (PKD), in which the number of employees exceeds 49. This collection in 2004 covered altogether 8,021 enterprises, out of which 87.7% belonged to the private sector (Science and Technique in 2004, p. 77).

9
of Polish enterprises and limited interest in undertaking research and development activities that are characterised by a high risk of failure.
Figure 1.3.1. Innovation indicators and their dynamics in selected countries
There are four groups of countries marked in the figure – at the top: the most innovative countries, in the middle: countries with average innovation performance, at the bottom on the right: countries catching up in terms of innovation performance, at the bottom on the left: countries lagging behind the top performers.
Source: European Innovation Scoreboard 2005. Comparative Analysis of Innovation Performance, European Commission, Luxembourg 2005.
7. An analysis of expenditure on innovation activities in the manufacturing sector in 2000-2004 indicates that there was a decline in spending, both in nominal terms and in relation to GDP. In 2000, the expenditure on innovation activities in the manufacturing sector in relation to GDP accounted for circa 1.7%, followed by a drop in 2001 to approximately 1.5%. In the following two years, the dynamics of expenditure on innovation slightly improved accounting for 1.8% and 2.1% respectively. In spite of the observed growth, expenditure on innovation activities still remains relatively low.
8. The structure of expenditure on innovative activities according to sources of financing (compare Table 1.3.1.) shows that own funds of companies predominate and it is an upward trend. However, it should be stressed that it is closely related to a drop in the share of outlays from the remaining sources of financing, which presumably stems from changes in the classification of sources of financing, for instance venture capital funds have been included.

10
Table 1.3.1. Structure of expenditure on innovative activities in the manufacturing sector according to sources of financing in 2001-2004
Year Own funds Bank loans Non-returnable foreign funds
Budgetary funds
Venture capital funds
Other
2001 71.9% 17.7% 2.7% 1.5% no data available
6.2%
2002 65.4% 22.4% 0.7% 1.0% no data available
10.5%
2003 66.8% 13.7% 1.0% 0.7% 0.1% 17.7%
2004 78.9% 15.6% 1.1% 1.1% 0.0% 3.3% Source: GUS: Science and Technology in 2001, 2002, 2003, 2004, GUS, Warszawa.
9. The structure of expenditure on innovative activities in 2004 indicates that it was mainly the modernisation of machines that played a predominant role in technological development. As much as 60% of total investments in innovative activities were expenditures on purchase of machines and equipment. At the same time, the share of R&D spending, which constitutes one of the major sources of innovation, stood at only 7.5%, which is far behind more developed countries. Moreover, only about 3% of total expenditure on innovative activities in enterprises were earmarked for acquisition of ready technologies in the form of documentation and rights. Such a structure of outlays indicates that innovative activities in Poland are mainly based on acquisition of the so-called hard technology, which is rational in the context of the need to reduce the technological gap.
10. Innovativeness13 of enterprises in the service sector in Poland has significantly improved over recent years. It grew from 16%14 in the years 1997-1999 to 22% in the years 2002-2003. Such a substantial growth in the service sector innovativeness, however, has to be considered in view of a new methodological approach that was adopted, namely the inclusion of entities from the science sector into the examined population (their level of innovativeness stands at 74.9%). Moreover, a significant increase in the innovativeness level of enterprises operating in the area of financial intermediary (from 23% in the years 1997-1999 to 45.8% in the years 2001-2003) also contributed to innovativeness growth in the service sector. To compare, the share of innovative enterprises in the service sector in the years 1998-2000 in the UE-15 accounted for 36%, but in some countries it was more diverse. For example, in Germany and Portugal it accounted for 49%, whereas in Italy and Spain for 24% and 23% respectively.
11. The key factor determining the innovativeness of an economy is its ability to implement and commercialise new technologies. Among the major indicators measuring this ability there is, e.g. the share of exports and imports of high-tech products in total exports and imports. In Poland, the share of high-tech products since the beginning of 90s has maintained at the level of circa 2-3% (in 2004 it amounted to
13 The number of innovative enterprises, i.e. enterprises that in the analysed period implemented at least one new or significantly improved product and/or process as the percentage of the total number of enterprises. 14 All statistical data come from the GUS’s study entitled Innovative activities of enterprises in the service sector in 2001-2003, Warszawa 2005.

11
scarcely 2.3%). To compare, in the same period in the UE-15, Japan and the USA this figure was systematically increasing. It reached as much as 40% in Ireland (the leading country), followed by 30% and 27% in USA and Japan respectively. According to the data of the OECD, Poland ranks among the countries with the highest relative advantage in the sectors of medium-low and low technology and simultaneously among the countries which lack relative advantage in the sectors of high and medium-high technology15. Poland’s balance of payment in the area of technology has also been negative for many years. It refers to both industrial property rights, services in the R&D area and technical services.
12. The share of new and modernised products in the total production sold also reflects Polish enterprises’ ability to implement R&D results. Table 1.3.2. presents the share of new or substantially modernised products in total production sold. However, there is no clear trend in terms of share of new products neither in the manufacturing nor the industrial processing sector (according to the Polish Classification of Activity – PKD) in the analysed period. The highest share of new and modernised products in total production sold in 2003 was observed in manufacturing of other auxiliary transport equipment (64.2%), in production of radio, television and telecommunication equipment and facilities (61.3%) followed by production of computer and related equipment (59.4%). Therefore, these branches may be recognised as the most advanced in the Polish economy.
Table 1.3.2. Share of new and modernised products sold in total production sold in 2000-2004 (%)
2001 2002 2003 2004
Products the production of which started in the years
1999-2001 2000-2002 2001-2003 2002-2004 Industry in total 18.0 16.7 20.7 19.2 Industrial processing in the industry 20.8 19.1 23.8 21.8 Source: GUS Statistical Yearbook 2005, 2004, 2003.
13. Other important indicators of innovative performance are indices related to patent statistics, e.g. the number of submitted patent applications and the number of patents granted. The number of patent applications filed at the Patent Office of the Republic of Poland (UP RP) by Polish inventors over last years has maintained a very low level, barely over 2,000 annually16. Moreover, out of the total number of 7,740 patent applications submitted at the UP RP in 2004, 69.2% were related to foreign inventions, which is similar to the phenomenon observed in Western European countries as well. As regards the invention ratio, that is the number of patent applications submitted by Polish inventors per 10,000 inhabitants, in Poland in 1998 it was four times lower than the EU-15 average amounting to 2.6, and over nine times lower than the average of this ratio for the OECD which was 6.0. Altogether in 2004 in Poland 1,794 patents were granted (46.9 per 1 million inhabitants).
14. The number of patents granted abroad to Polish inventors in 2002 amounted to 142, including 10 granted by the European Patent Office (EPO). Poland also has a very low
15 Science and Technology in 2003, Information and statistics of the GUS, Warszawa 2005. 16 In 2004, 2,381 patent applications were filed.

12
ratio of both the number of patent applications submitted and patents granted in the United States (123 and 11 respectively in 2002).
15. The level of innovativeness of the economy clearly mirrors the share of import and export of advanced technologies (on the basis of the OECD list of 1995) in total import and export (Table 1.3.3.).
Table 1.3.3. Share of import and export of advanced technology products in total import and export in the years 2001-2004
Export Import Year in %
2001 11.4 2.7 2002 10.1 2.2 2003 9.5 2.6 2004 9.2 2.3 Source: GUS: Science and Technology in 2001, 2002, 2003 and 2004, Warszawa.
16. The share of export of advanced technology products in foreign trade has been maintaining since the beginning of 1990s at a relatively stable low level, and in 2004 the share of export of such products stood at 2.3%. For the EU, this value for export (in 2003) stood at 17.8%, having grown in 1990s by about ten percent points.
1.4 Financial results of the Polish enterprise sector
17. The diagnosis of the financial situation of the enterprise sector in Poland has been based on three elements: total revenue analysis, financial results and turnover profitability17.
18. The analysis of total enterprise revenue shows that after a growth in revenue of enterprises in 2001 amounting to over 10%, the following year witnessed a decrease resulting from a temporarily deteriorated situation on the market. Due to a gradual improvement in the market situation resulting in an increased demand for goods and services, another growth in revenue by over 14% was observed in 2003 and by almost 13% in 2004 (compare Figure 1.4.1).
17 The data does not cover banks, insurance companies, brokerage houses, investment and pension funds, national investment funds, higher education institutions, independent public healthcare institutions, culture centres with legal personality, individual farmers.
13
Figure 1.4.1 Total revenue of enterprises in Poland in the years 2000 – 2004 (PLN billion, current prices)
1.261.08
0.970.95 0.96
0,000,200,400,600,801,001,201,40
2000 2001 2002 2003 2004
Source: GUS Statistical Yearbooks, Warszawa 2000, 2001, 2001, 2003, 2004.
19. An upturn in the Polish economy observed in 2003 resulted also in an improvement of financial results of enterprises. The gross financial result increased by more than five times compared to the year 2002, and revenues of enterprises increased by five times (with an increase in revenue by 14.15% from PLN 1,229 billion to PLN 1,403 billion), whereas compared to the year 2001 by four times, whereas the improvement in the net result stood at PLN 30 bullion. The upturn continued through 2004, when gross result grew to PLN 89.22 billion, and net result – to PLN 72.13 billion (compare Figure 1.4.2).
Figure 1.4.2 Financial results of enterprises in Poland in the years 2000-2004 (in PLN billion, current prices)
75.4
6.418.4
7.5
39.2
8.4
-2.0-2.6
18.0
60.7
-20
0
20
40
60
80
2000 2001 2002 2003 2004
Gross Net
Source: GUS Statistical Yearbooks.
20. Significant ameliorations of financial results in the years 2003 – 2004 caused a visible profitability increase (compare Table 1.4.1). After two years of negative net profitability (2001 – 2002), the index became positive again in 2003. In 2004, profitability further improved: gross profitability stood at 5.6% and net profitability – at 4.5%. Although the favourable financial situation in the years 2003 – 2004 allowed entrepreneurs to accumulate substantial financial means, the level of investment increased only narrowly18.
18 Compare Chapter 1.5. Investments in the enterprise sector.
14
Table 1.4.1 Gross and net turnover profitability indices of the enterprise sector in Poland in the years 2000-2003 (%)
2000 2001 2002 2003 2004
Gross turnover profitability index 1.92 0.66 0.76 2.79 6.00
Net turnover profitability index 0.65 -0.26 0.2 1.66 4.82
Source: GUS Statistical Yearbooks, Warszawa 2000, 2001, 2001, 2003, 2004.
1.5 Investments in the enterprise sector
21. The year 2000 was a peak year for investments in the enterprise sector (see Figure 1.5.1). In the following years (2001 – 2002), investment outlays started to fall due to the unfavourable economic situation. Negative effects of a market slump were enhanced by a restrictive monetary policy and a fall in foreign direct investments (FDI). An improvement in the condition of enterprises in 2003 and 2004 allowed for a break in the negative trend and for an increase in investment outlays in comparison with 2002. It is, however, necessary to emphasise that the level of investment outlays in 2003, despite a growth by 0.8% in comparison with 2002, was significantly lower than those observed in 2000 and 2001 (a fall by 9.6% in comparison with 2001 and by 21% in comparison with 2000). First signs of a scant improvement of investment dynamics appeared already in 2004 – the gross outlays on fixed assets increased by 5.1% in real terms (as compared to 2003). According to preliminary data, this slight increase continued through 2005 as well. The lack of certainty about the development of economic situation and the presence of barriers for economic activity resulted in a slow increase of investment outlays, disproportionate to the opportunities created by the improvement of both domestic and international market situation.
Figure 1.5.1 Investment outlays in the enterprise sector in the years 2000-2004 (PLN billion, current prices)
133.2
121.4109.9 110.8
118.9
0
20
40
60
80
100
120
140
2000 2001 2002 2003 2004
Source: GUS Statistical Yearbooks, Warszawa 2000, 2001, 2001, 2003, 2004.
22. The sector of small and medium-sized enterprises (SMEs) has a significant share in total investment of the enterprise sector. In 2000, about 50% of all private enterprises investment outlays were made by SMEs. However, this share decreased significantly
15
in 2001 – 2002. In 2002, investment outlays of SMEs constituted only 43.8% of all enterprise investment outlays19, while their share increased narrowly in 2003 to 45.5%20.
23. The wear level of fixed assets in the economy stands at over 50%. In the industry, the level of wear of machines, technical equipment and tools in 2004 stood at the level of 60%.
24. One of the reasons underlying the downfall of investments in the years 2001 – 2002 was a decrease of foreign investors’ interest in the Polish economy (see Table 1.5.1). In 2000-2003, the flow of FDI to Poland declined by over 60% (in PLN). FDI reached again the level above USD 10 billion in 2004, yet in 2005, in comparison with 2004, the dynamics of the FDI flow fell to about 40% (USD 7.72 billion). The drop in investments in 2005 resulted from, for instance, transactions involving repurchases of shares in Polish enterprises from non-residents by Polish companies.
Table 1.5.1 Foreign Direct Investments in Poland in the years 2000 – 2005
2000 2001 2002 2003 2004 2005
FDI (USD million) 9,343 5,714 4,131 4,589 12,873 7,724
FDI (PLN million) 41,050 23,340 16,821 17,842 46,534 25,076
Source: National Bank of Poland (NBP), Balance of payments, annual data.
25. Stimulation of FDI flow to innovative areas with the potential for development and export is one of the most important challenges of the economic policy and one of the most important factors contributing to the improvement of the competitiveness of the enterprise sector. On the list of 100 most innovative enterprises in Poland in 2005, 18 companies (i.e. 18%) are foreign investors operating in Poland. At the same time, the share of products of new and modernised foreign enterprises in the sold production of the Polish industry stands at over 20% and tends to go up. The main investors in Poland are EU countries. The value of investment outlays of investors registered in the “old” EU Member States in 2005 constituted 85.1% of the FDI inflow to Poland, that is EUR 75.7 billion in total. The biggest amounts were invested by the Netherlands – EUR 16.4 billion, Germany – EUR 12.3 billion and France – EUR 9.6 billion, which totalled EUR 38.4 billion (50.7% of the total value of FDI in Poland). It is worth stressing that the position of the USA, although it has been decreasing, in still strong, despite the large geographical distance. The USA invested in Poland EUR 5.6 billion, which makes 7.4% of the total value of FDI21.
26. In 2000 – 2003, the share of foreign companies in investment outlays in both the industry and the industrial manufacturing sector systematically grew which proved that foreign companies were widening the range and scale of their economic activity in
19 Data based on Report on the State of the Sector of Small and Medium-Sized Enterprises in Poland in the Years 2002-2003, Ministry of Economy and Labour (MGiP) and Polish Agency for Enterprise Development (PARP), Warszawa 2004. 20 Report on the State of the SME Sector in Poland in the years 2003-2004, Ministry of Economy (MG), Warszawa 2005. 21 Draft Assumptions for the Strategy for Promotion of the Polish Economy 2007-2015, November 2006.

16
Poland. The interest in the Polish economy on the part of foreign capital (both of concerns and SMEs) should be mainly attributed to cheap and qualified workforce, the low CIT rate, as well as availability of lands for investments and attractive prices of land. Over 50% of foreign investments are the so called greenfied investments. In 2004, this share fell a little. The structure of investment outlays, including those of companies with foreign capital, is presented in Table 1.5.2.
Table 1.5.2 Investment outlays in Poland, including investments by companies with foreign share in the years 2000 – 2004 (PLN million)
2000 2001 2002 2003 2004
Total investment outlays 133,160.2 121,362.9 109,265.9 110,859.8 120,467.0 Share of investment outlays of companies with foreign share in total investment outlays (%)
39.6 39.3 40.0 41.3 38.7
Investment outlays in the industry 37,707.5 35,888.5 34,621.6 37,387.3 41,911.0
Share of investment outlays of companies with foreign share in investment outlays in the industry (%)
49.1 47.2 54.1 56.2 51.2
Investment outlays in industrial manufacturing
26,522.8 23,235.2 23,068.0 26,041.5 30,227.0
Share of investment outlays of companies with foreign share in investment outlays in industrial manufacturing (%)
67.1 67.8 73.7 75.2 66.0
Number of investing companies with foreign share
8,475 8,230 8,251 9,164 9,540
Source: GUS Yearbooks, Business Activity of Companies with Foreign Share, GUS, Warszawa 2001, 2002, 2003, 2004, 2005.
27. Over recent years, a significant increase in the number of foreigners arriving in Poland
has been observed, which adds to an increase of currency incomes in the tourist sector. In 2005, 64.6 million foreigners arrived in Poland, according to the records of the Border Guard (by 4.3% more than in 2004), including 15.2 million tourists, according to the estimations of the Institute of Tourism (growth by 6.4%).
17
Figure 1.5.2 Arrivals of foreigners and tourists in Poland in the years 1995-2005 (in thousand)
82 2
44
87 4
39
87 8
17
88 5
92
89 1
18
84 5
15
61 4
31
50 7
35
52 1
30 61 9
18
64 6
06
19 2
15
19 4
10
19 5
20
18 7
80
17 9
50
17 4
00
15 0
00
13 9
80
13 7
20
14 2
90
15 2
00
0
10 000
20 000
30 000
40 000
50 000
60 000
70 000
80 000
90 000
100 000
1995 1996 1997 1998 1999 2000 2001 2002 2003 2004 2005
Arrivals of foreigners in Poland (in thousands)Arrivals of tourists in Poland (in thousands)
l
Source: Institute of Tourism in Warszawa, 2006.
28. In 2005, total income under arrivals of foreigners stood at USD 6,230 million, out of which USD 3.3 billion (i.e. 53.5%) refers to tourist, and the rest to one-day visitors. The data shows a small development potential of the sector. However, it is necessary to modernise tourist products in order to increase Poland’s attractiveness. The lacks of financial outlays in this respect in a long-term perspective may negatively affect arrivals of tourists and foreigners, and, consequently, incomes from tourism.
1.6 Foreign trade
29. Since 2002, a fast growth of exports of enterprises operating in Poland has been observed (compare Figure 1.6.1). In 2004, the value of their exports amounted to PLN 272.1 billion22 and the value of imports amounted to PLN 325.6 billion. Hence, the value of foreign trade deficit stood at PLN 53.5 billion, as compared to PLN 56.2 billion in the previous year. Since 2001, the negative balance of foreign trade has been constantly decreasing due to maintained export dynamics that exceeded import dynamics.
22 Companies with foreign share account for a significant share in exports – in 2004 their exports constituted over 62% of the entire export of Polish enterprises.

18
Figure 1.6.1 Export (yellow) and import (green) dynamics in the years 2000 – 2004 (in %)
13.412.3 12.0
23.5
27.4
6.2
8.8
19.0
2.7
22.8
0
5
10
15
20
25
30
2000 2001 2002 2003 2004
Source: GUS Statistical Yearbooks.
30. Despite a relatively high total value of export, Poland has a low level of export per capita in comparison with both the EU-15 and the new Member States (compare Figure 1.6.2). This is not a consequence of weaker competitiveness of Polish enterprises but of dynamically growing consumption on the Polish market, which makes some enterprises less interested in exporting, as in this way they reduce the risk related to their activity (especially small enterprises). A growth in consumption is accompanied by a strong zloty, which makes export profitability lower to some enterprises, first of all to small enterprises and to those whose exports do not require import. Furthermore, the costs of operating on foreign markets are for small enterprises relatively high in comparison with revenues from sales. Therefore, if there is an opportunity to concentrate on sales on the Polish market, many enterprises take advantage of it.
19
Figure 1.6.2 Exports per capita in selected EU countries in the years 2000 – 2003 (in USD)
Source: GUS Statistical Yearbooks.
31. The main reasons for a fast growth in export include, for example, limitations of production costs resulting from restructuring processes of enterprises conducting economic activity in Poland and currency fluctuations favourable for exporters and unfavourable for importers, i.e. a weaker zloty compared to the main currency of Polish foreign trade, namely euro. These processes strengthened especially in 2003 and in the first half of 2004, however at the end of 2004 and over 2005 a tendency of zloty to weaken against euro reversed.
32. Despite a disadvantageous zloty-euro exchange rate, in 2005 Poland belonged to the group of countries with the fastest export growth, almost three time exceeding the world export rate, which substantially added to our share in the world export (from 0.71% in 2003 to 0.86% in 2005), and Poland moved on the thirtieth position among the world’s top exporters. The significance of exports in the economy (measured with the share of export in GDP) grew from 21.4% in 2002 to 29.4% in 2005.
33. The SME sector has a relatively large share in Polish sales on the Single European Market (SEM)23. In 2002 the sector’s share in total exports amounted to 44.5% and in imports to 60.7%. In 2003, this index changed insignificantly, amounting to 44.3% in exports and to 60.3% in imports24. Improvement of modernity and openness of the economy to the world is confirmed by a systematic growth of the share of highly developed markets in Polish exports. The dynamic growth of export to highly developed countries (by 127%) exceeds the growth of import from these markets (by 58%). Exports to developed markets in the years 2000-2005 grew annually by 2.2 percent points faster than exports in total, while average annual import from this direction turned to be only by 0.8% faster than the average import in total.
23 The share of SMEs is significant in comparison with the whole sector but much smaller than the share of SMEs in the total number of enterprises. 24 Data based on The Report on the State of the Sector of Small and Medium-Sized Enterprises in Poland in the Years 2002-2003, Ministry of Economy and Labour (MGiP) and Polish Agency for Enterprise Development (PARP), Warszawa 2004 which covers the period until 2002. It may be assumed that in the years 2003 – 2004, due to a depreciation of zloty with regard to euro and a consecutive increase in export profitability and decrease in import profitability, the negative foreign trade balance of the SME sector dwindled.
0.00
1000.00
2000.00
3000.00
4000.00
5000.00
6000.00
7000.00
8000.00
9000.00
10000.00
2000 2001 2002 2003
Poland
Czech Rep.
Hungary
Spain
Germany
France
20
34. Germany has been Poland’s largest trade partner in both import and export since the beginning of the system transformation in Poland. Apart from Germany, Poland’s main trade partners are European countries, and EU countries in particular (EU-15). In 2003, the share of EU-15 countries in Polish exports amounted to 68.8% and in imports – to 61.1%. The GUS data for 2004 shows that the share of Germany in Polish exports declined to 30.1% in comparison with 32.2% in 2003, whereas the share in imports remained the same at 24.4%. In 2004, the EU-25 share in Polish exports and imports amounted to 79.2% and 68.3% respectively. A minor decrease occurred in comparison with 2003 – from January to December 2003 this share stood at 80.8% and 69.2% respectively.
Figure 1.6.3 Geographic structure of Polish exports (left) and import (right) in 2003
Import24.4
8.5
7.77.121.2
31.1
Germany ItalyRussia FranceOther EU15 Other
Source: Foreign Trade Statistical Yearbook, GUS, Warszawa 2004.
35. The most significant product groups in the product structure of Polish exports are cars and spare car parts, furniture, coal, clothing, hygiene products and food. Most frequently imported goods are petroleum, cars, spare car parts and medicines. In the years 2000 – 2003, there was a slight increase in the share of manufactured goods in Polish exports (sections 5-9 according to the SITC25). In 2000, these goods amounted to 84.2% of Polish exports, whereas in 2003 to 85.1%.
36. Within the last five years, no important changes have been observed in the structure of turnover in terms of goods, yet in some groups of products there have appeared some changes. On the basis of a rather small export growth in the last five years, the following observations have been made: relatively fast (by 147.9%) growth of exports of farm and food products, and a consequent increase of their share in exports from 8.4% in 2000 to 10% in 2005; a considerably higher growth than the average in export of electrical machines that reached about 140%, which improved the share of these products in total exports from 35.1% to 40.6%; and the export growth index in the chemical industry, especially plastics and rubber goods, which exceeded the average export in total by 19 percent points.
37. Polish trade has two main opposing tendencies: a systematic growth in trading with developed markets accompanied by improvement of the state of trade balance, whereas in trading with relatively less developed countries a reverse situation is observable, namely exports are disproportionately low in comparison with imports, which leads to a dynamic growth of the trade deficit.
25 Standard International Trade Classification.
Export
32.3
6.15.75.019.7
31.2
Germany FranceItaly United KingdomOther EU15 Other

21
1.7 Employment and work efficiency in the enterprise sector
38. In 2005, enterprises in Poland employed some 4.8 million people26. Therefore, the employment level was higher than in 2004 by 1.9%. In the previous years, the number of enterprise employees decreased. The estimated decrease in enterprise employment in 2002 was around 4.5%, in 2003 was nearly 3%, and in 2004 around 1%. The changes in the SME employment level (a growth by nearly 2% in 2004 and slight decreases in the years 2002 – 2003) indicate more significant employment reductions in large enterprises, caused mostly by restructuring processes of large companies.
Figure 1.7.1 Total employment in the enterprise sector and in SMEs in the years 2000-2004 (thousand people)
5,8845,9346,1676,4516,617
3,9783,9053,9474,0103,942
0
1 000
2 000
3 000
4 000
5 000
6 000
7 000
2000 2001 2002 2003 2004
Enterprise sector total SMEs
Source: Estimates of the IBnGR based on the data of the GUS and the Polish Agency for Enterprise Development (PARP)27.
39. The decrease of employment that was observed in the enterprise sector in the years 1998 – 2004 stemmed from several reasons:
a) the necessity to reduce production costs (including labour costs), incurred by the need to search for foreign markets;
b) high non-wage labour costs and low elasticity of the labour market which force employers to save up by discharging employees and which increase both the risk of new employments and total business costs;
c) delayed effects of the system transformation incurred by collective agreement arrangements which obliged new owners of state-owned enterprises to either keep employment at a constant level or to reduce employment in a more limited manner than economic management rules would suggest.
40. The insignificant employment rise in the enterprise sector in 2005 resulted from an improvement in the economic situation, a rise of demand and consequently increased demand for workforce. This rise in employment might be considered a sign of
26 GUS Statistical Bulletin. The data does not cover micro-enterprises which are estimated to employ 3.2-3.5 million people. The figure covers both company owners and employees. 27 The data presented in the figure covers all types of enterprises. For companies employing over 9 people, the data comes from the GUS Statistical Bulletin, and for micro-enterprise it was collected by the IBnGR.

22
improvement of the entrepreneurs’ expectations towards development possibilities in consecutive periods.
41. The employment rate, which has been decreasing since 2004, combined with an increase of the enterprise sector production volume has resulted in a rapid work efficiency growth. Figure 1.7.2 shows the dynamics of work efficiency in the enterprise sector28 and in the national economy in the years 1999 – 2003. The figure shows that during the analysed period (with the exception of the year 2001) work efficiency in enterprises improved faster than in the economy in total (annual average efficiency growth in enterprises – 6.1%, whereas in the national economy – 4.5%).
Figure 1.7.2 Work efficiency dynamics in the enterprise sector and in the national economy in the years 1999-2003 (constant prices)
109.9
105.4
108.0
104.4
101.9
105.5104.3
102.6
105.5 105.3
9698
100102104106108110112
1999 2000 2001 2002 2003
Enterprise sector National economy
Source: Calculations of the IBnGR based on data of the GUS.
42. The most important factor that affects work efficiency is the necessity to maintain constantly or improve the competitive position of enterprises operating in Poland against companies from other countries. According to approximate estimates, the average work efficiency in enterprises operating in Poland is still nearly 50% lower than in the EU-15. As far as the EU-25 is concerned, only in the three Baltic states (Lithuania, Latvia and Estonia) the level of work efficiency is lower than the one in Poland29. This means that the main competitive advantage of enterprises operating in Poland is a comparatively low remuneration level. However, since Poland entered the Single European Market (SEM), which encompasses free movement of goods, capital and services as well as freedom of establishment, this situation is to change.
1.8 Regulatory framework of the enterprise sector
43. The regulatory system, being an important factor influencing the situation and development of the enterprise sector, is very unstable. Frequent amendments and changes in legal acts vital for running a business (e.g. tax regulations) increase the risk of business operations. Instability of the regulatory system hinders development and
28 For enterprises employing over 9 people. 29 Facing the Challenge. The Lisbon Strategy for Growth and Employment, Report from the High Level Group chaired by Wim Kok, November 2004.

23
implementation of mid- and long-term strategies and boosts the costs of running a business.
44. In order to remove the barriers related to economic activity, such as too many regulations in the area of economic processes, unfriendly administration, inflexible labour market and high extra payments, it is necessary to introduce changes in the legal and administrative environment.
45. The most important legal regulations regarding the functioning of enterprises adopted in the years 2004 – 2005 include:
a) Act on Economic Freedom of 2 July 200430 which aims to simplify the rules governing company establishment and functioning,
b) amendment to the regulations on corporate income tax (CIT) – a tax reduction and introduction of the same tax rate for entrepreneurs paying PIT and CIT31,
c) Act of 8 October 2004 on the Principles of Science Financing32 which aims to shape an active scientific, technological and innovation policy of the state, as well as to adjust scientific activities to the needs of the economy,
d) Act of 29 July 2005 on Certain Forms of Support for Innovative Activity33 which aims to improve effectiveness of the management of public funds allocated for R&D, as well as to encourage the private sector to increase outlays for innovation.
46. The above-mentioned changes to the regulatory framework should facilitate running a business and stimulate innovativeness in enterprises operating in Poland. However, since they have been introduced only recently, it is not possible to assess their impact yet.
47. Consequences of adaptation of Polish law to the acquis communautaire, a vital part of pre-accession preparations, are important for the business regulatory system. The harmonisation process entailed high costs for entrepreneurs, but on the other hand it forced many companies to accelerate their restructuring and modernisation, what resulted in their improved competitiveness. Moreover, adaptation of Polish law to the acquis communautaire allowed the entrepreneurs operating in Poland to get, in many aspects, the same conditions for functioning on the SEM as their EU counterparts enjoy. In order to ensure high quality of law, the rule of running a regulation impact assessment (OSR) was introduced in 2002 covering four areas: budget, labour market, competitiveness and regional development. The rule pertains to all drafted legal regulations. However, the quality of OSRs has been low, partially due to a lack of experience in their development. In 2005, the government took intense actions aimed to improve the OSR quality, in particular with regard to the administrative burden imposed upon the entrepreneurs.
30 Journal of Laws No. 173, item 1807 with amendments. 31 The Act of 12 November 2003 amending the Act on legal persons’ income tax act and other acts, Journal of Laws No. 202, item 1957. 32 Journal of Laws No. 238, item 2390. 33 Journal of Laws No. 179, item 1484.

24
1.9 Business support institutions
48. Business support institutions (BSI) have the following tasks: to support entrepreneurship, to facilitate business take up (e.g. to companies such as start-ups and spin-offs), to provide assistance to newly established enterprises (business incubators, technology incubators), to facilitate transfer of new technological solutions (technology transfer centres (TTC), technology incubators), to improve the quality of human capital through training and counselling services (training and counselling centres), to support networking and clustering, including mobilisation of innovative business environment (science and technology parks), and to provide access to external financing, in particular for SMEs which undertake investments (guarantee and micro-loan funds, venture capital funds).
49. In Poland, the majority of business support institutions are situated in cities with 50,000 to 250,000 inhabitants (about 36%), about 34% of BSIs operate in cities with more than 250,000 inhabitants and the smallest part (30%) is located in cities with population below 50,000 inhabitants.34 They are distributed irregularly throughout the country and despite relatively high number of these institutions their networks are rather weak. BSIs, which usually operate on a non-for-profit basis, are most often faced with the following problems: insufficient financial resources to perform their activities, and – consequently – difficulties in hiring and maintaining experienced staff, as well as the tendency to operate on a project-to-project basis (as a result, in periods between two consecutive projects, problems of these institutions become even more intense). At the same time, these organisations, focused on support for SMEs, especially those operating at the local and regional level, have a very important role to play in the area of activities improving the performance of local and regional economies.
50. A particular role in strengthening of the business support system is played by the National SME Services Network (KSU) developed and coordinated since 1996 by the Polish Foundation for the Promotion and Development of Small and Medium-Sized Enterprises (transformed into the Polish Agency for Enterprise Development (PARP) in 2001). Within the KSU networks, there are various groups of institutions, rendering particular types of services: counselling and information, financial services (loans and credit guarantees), pro-innovative services (including creating conditions for technological solutions transfer and commercialisation) and training. In 2004, the KSU encompassed 206 centres. On average, one centre provides support for 652 entrepreneurs (SMEs) and 115 persons undertaking business activity a year.
51. Systemic activities supporting innovativeness and investment. Support for entrepreneurship, in particular for SMEs, is the main task of the Polish Agency for Enterprise Development (PARP), established in 2001. The PARP implements programmes financed with funds from the state budget as well as from the EU budget (pre-accession and structural funds) aimed at developing entrepreneurship and human resources. The tasks of the PARP also cover support for the use of new techniques and
34 Report on the State of the Sector of Small and Medium-Sized Enterprises in Poland in the Years 2002-2003, Ministry of Economy and Labour (MGiP) and Polish Agency for Enterprise Development (PARP), Warszawa 2004. The study covered the following entities providing support for the SME sector: loan guarantee funds, loan funds, organisations grouping entrepreneurs, national and local organisations representing the interests of business environment, the most active business incubators and technology transfer centres. The sample consisted of 322 entities, the effective sample size was 113 entities. Sampling allowed for examining one third of the population of business support institutions.
25
technologies, regional development and export development. Regional support for SMEs is performed in cooperation with Regional Financing Institutions (RIFs), which perform counselling, promotion and administrative tasks. The PARP also functions as the Implementing Authority for some measures of the Sectoral Operational Programme – Improvement of the Competitiveness of Enterprises 2004 – 2006 (SPO WKP) and the Sectoral Operational Programme – Human Resources Development 2004 – 2006 (SPO RZL), collaborating in some measures with the RIFs.
52. A major role in supporting industrial and innovative businesses is played by the Industrial Development Agency (ARP S.A.) established in 1991 whose main tasks are to support restructuring processes of Polish economic operators and to adjust them to the conditions of international competition, as well as to take actions aimed at economic infrastructure development, which directly contribute to unemployment combat through maintenance of existing workplaces and creation of new ones. The activities of the ARP S.A. also cover support for regional development through initiating establishment of industrial and technology parks and technology incubators. The ARP S.A. also exercises corporate supervision over 33 local and regional development agencies. Besides, the activities of the ARP S.A. cover support for establishment of innovative companies in the area of new technologies via the FIRE Innovation Centre. The ARP S.A. also acts as one of the Implementing Authorities for the SPO WKP.
53. Substantial support for SMEs’ innovative activities is offered by the Polish Federation of Engineering Associations (NOT) with the use of goal-oriented projects, implemented on the basis of an agreement with the minister in charge of science. These projects encompass funds for R&D works, but their receipt is conditioned on implementation works35.
54. Investment inflow support is the main task of the Polish Information and Foreign Investment Agency (PAIiIZ), established in 2003 by merging the Polish Agency of Foreign Investment (Polska Agencja Inwestycji Zagranicznych S.A.) with the Polish Agency of Information (Polska Agencja Informacji S.A.). The PAIiIZ offers potential investors information on lands suitable for investments and on conditions of business activity in Poland. It is also helpful in negotiations with central and local administration.
55. Support for tourism development in Poland and for promotion of Poland as a country attractive for tourists is rendered by the Polish Tourism Organisation (POT) established by the Act of 25 July 1999 on the Polish Tourism Organisation36. The POT is the main shareholder of the Polish Tourism Development Agency (PART) which is active in tourist infrastructure development and strategic counselling for tourist product development.
56. The Polish Chamber of Commerce (KIG) is an institution of economic self-government, active since 1990, encompassing more than 130 business organisations which group about 300,000 domestic enterprises. The KIG’s activity concentrates on 16 problem committees, which assemble experts, scientists and practitioners of business life. Moreover, the Polish Chamber of Commerce possesses its own research facility – the Institute for Research on Democracy and Private Enterprise. The main task of the KIG is to represent the interests of Polish entrepreneurs vis-à-vis state
35 Between 6 November 2001 and 28 February 2005, 348 co-financing agreements granting support for goal-oriented projects implemented by SMEs were signed (an average project grant amounts to PLN 154,288). 36 Journal of Laws No. 62, item 689.

26
bodies and domestic organisations, as well as to represent enterprises operating in Poland abroad. The Polish Chamber of Commerce took part in preparing Poland’s participation in EXPO 2000 in Hanover and EXPO 2005 in Aichi, as well as organised events promoting Poland in countries that presided over the European Union.
57. Another forum for discussion between employers’ organisations, government and trade unions is the Tripartite Commission where the entrepreneurs’ community is represented by the “Lewiatan” Polish Confederation of Private Employers (PKPP), the Confederation of Polish Employers (KPP), the Polish Craft Association (ZRP) and the Business Centre Club.
1.10 Financing of enterprises at early stages of development
58. Access to external sources of financing is one of the key factors for developing a knowledge-based economy since innovative undertakings are often capital consuming and involve high risk levels. Therefore, entrepreneurs are hardly ever able to start such an activity basing on their own resources only. Meanwhile, in Poland opportunities to obtain capital at the value from PLN 0.1-2 million to PLN 8-10 million are rather limited37. Usually, entrepreneurs are able to gain financing below the lower limit of the above-mentioned range from private sources (savings, family and friends, etc.), while the sums exceeding the upper limit are to a certain degree easily available on the venture capital (VC) / private equity (PE) market.
59. The main reasons for the VC/PE funds reluctance to invest within the equity gap range are:
i. high risks related to investments in undertakings with unclear market chances (lack of enterprise history, unknown products, etc.);
ii. high costs of due diligence analyses and of development of legal documentation necessary to start investments (in comparison with the investment value);
iii. high costs of fund management in comparison with the investment value.
60. The development of the venture capital market in Poland shows that investments tend to concentrate on later stages of enterprise development (expansion, buyout and replacement), and, at the same time, the number of capital interventions in enterprises at early stage of their development decreases – in 2004 in Poland no intervention of this kind was recorded38 (the so-called seed and start-up phases; see Table 1.10.1). This trend is observable throughout Europe, but it is especially visible on the markets of Central and Eastern Europe, including Poland39. Investments in enterprises at later stages of their development involve significantly lower risk, and they usually require a higher value of single capital entry, therefore the funds more willingly engage in such undertakings.
37 The report entitled Equity Gap in the Polish Economy, developed at the request of the Ministry of Economy and Labour (MGiP) by Dr. Paweł Tamowicz, Gdańsk 2005. 38 It seems that the high value of investments at seed phase in 2003 might have resulted from misclassification of investments which in fact pertained to undertakings at much later stages of development (see Equity Gap in the Polish Economy, op. cit.). 39 Central and Eastern Europe. Statistics 2004, EVCA, Zaventem, Belgium 2005.

27
Table 1.10.1 Value of investments by the VC funds in Poland at different stages of enterprise development in the years 1999 – 2004 (EUR million)
Phase of enterprise’s development
1999 2000 2001 2002 2003 2004
Seed 1.8 2.9 2.2 0 15.1 0
Start-up 16.2 38.8 22.7 9.8 2.0 0
Expansion 131.2 158.2 73.9 53.7 40.4 44.1
Replacement 24.2 1.9 47.8 34.6 42.7 59.5
Buyout 10.6 0 3.8 19.5 32.9 30.8
Total 184.1 201.8 150.4 117.6 133.1 134.4
Source: European Venture Capital Association (EVCA).
61. The equity gap existing at early stages of enterprise development is almost completely independent of the sector in which the given enterprise operates. Access to finance within the range of the equity gap is easier only in the information and communication technology (ICT) sector, due to, exclusively, the policy of one of VC funds and long-lasting good economic situation in this sector.
62. In 2004, the Polish Private Equity Association (PSIK) grouped 28 VC/PE funds, but in fact none of them invested in enterprises at the start-up or seed stage. Due to the situation described above, it was decided to undertake public intervention in this area within Sub-measure 1.2.3 of the SPO WKP Support for establishment of seed capital funds. This sub-measure is envisaged to provide assistance to funds which invest in SMEs at the earliest stages of their development. As a pilot undertaking, it should result in creation of about five new funds which will offer financing within the equity gap range. Such a combination of public funds and private capital should encourage private investors to commit their resources to such funds.
63. Apart from VC funds, other potential sources of financing within the equity gap range (especially within the bottom part of the spectrum) are the so-called Business Angels, i.e. private persons who invest their own capital, knowledge and experience in start-ups, which often is rather risky. In Poland, organisations associating and supporting Business Angels have been developing intensely. These are the Polish Business Angels Network (PolBAN) which groups 43 investors ready to invest PLN 25-40 million and the Lewiatan Business Angels (the network created by the “Lewiatan” Polish Confederation of Private Employers) grouping 50 investors capable of investing some PLN 300 million. Their activity has already brought about first positive results, such as contacts between investors and start-ups, as well as first investments. The total value of investments realised with the participation of the PolBAN in 2005 stood at over PLN 1 million. Business Angels may become a very valuable source of financing within the bottom part of the equity gap range, since their assistance is not limited to making an investment only. Establishing and developing networks of Business Angels and organisations supporting such investors, which will assure supplies of feasible projects, should allow for a rapid development of this market.

28
1.11 Cooperation of entrepreneurs
64. The competitiveness of enterprises operating in Poland is weaker in comparison with the EU-15 due to their limited resources. Their competitiveness might be increased through cooperation, which allows for obtaining results that are impossible for single entities (SMEs in particular). Nevertheless, enterprises operating in Poland do not show propensity for cooperation with one another and with the science sector and business support institutions. The main reason for this may be the fact that the enterprise sector in Poland remains at an early stage of development, which is characterised by intense competition on the local market which does not favour cooperation. Development of cooperative relations between enterprises and scientific entities started as late as in 2004 with an analysis of industrial clusters in Poland and support instruments that could be possibly provided by the state. The development of a policy supporting clusters was to a large extent supported by studies of the European Commission related to identification of cooperative relations in the new Member States. Finally, the need to support and develop cooperative relations in Poland was highlighted in the strategic document entitled “Directions for improvement of the economy’s innovativeness in the years 2007 – 2013” which was adopted by the government on 4 September 2006. The part of the document entitled “Infrastructure for innovation” stressed the need to assist joint actions taken by entrepreneurs related to support for the science sector, directed towards implementation of innovative undertakings.
65. In this context, it is extremely important to support various types of interaction between the industrial sector and the scientific and research sector and with the administration, which is characteristic of clusters. However, the level of clustering development in Poland is still relatively law. At present, studies are carried out aimed at diagnosing the state of clustering in Poland. The best developed cluster initiatives are the following:
i. Aviation Valley cluster in the Podkarpackie Voivodship,
ii. Industrial automation and control cluster in Gdańsk,
iii. Printing cluster in Warsaw,
iv. Construction cluster in the Świętokrzyskie Voivodship
v. Furniture cluster (Wielkopolskie and Zachodniopomorskie Voivodships).
1.12 Economic promotion of Poland
66. Economic promotion of Poland encompasses promotion of trade on the SEM, promotion of Poland as an attractive place for investment and general promotion of the country addressed mainly to tourists and people interested in Poland.
67. In the area of trade exchange and export promotion, there are several support instruments accessible (including instruments implemented within the SPO WKP). Trade exchange and export promotion is also lead by Polish diplomatic missions abroad. Furthermore, actions encompassing general economic promotion of Poland aiming at creation of a positive image of the country are also taken, involving public administration entities and other institutions, such as e.g. the KIG, and support for foreign investment inflow is, in turn, provided by the PAIiIZ.
29
68. Information and coordination of activities related to Poland’s tourist promotion lies with the Polish Tourist Organisation (POT). It carries out its promotional tasks abroad with the use of the network of 13 Polish Tourist Information Centres and one branch in Japan. Moreover, the POT constantly cooperates with regional and local tourist organisations in the area of creation and promotion of tourist products in Poland and abroad. Other public institutions also run activities in the field of tourist promotion.
69. The results of the activities undertaken so far are assessed as insufficient in the context of the actual needs. For example, there is no unified countrywide system of support for exporters and investors, nor a national system of services for tourists (tourist information and promotion). The lack of a clear positive image of Poland results in measurable economic losses. It aggravates the opinion on investment conditions in Poland and negatively affects the demand for exported products. Poland is viewed through the prism of many prejudices and stereotypes, as the knowledge of our country is scarce. It is necessary to increase the number of complex promotion projects (e.g. participation in / organisation of EXPO or other prestigious events of international importance) and to promote the image of Poland in global media40. According to estimations made by the Ministry of Economy, the level of public expenditure on export promotion in Poland in 2003 was by almost twelve times lower than the level of such expenditure in the EU-1541. A system for creation and promotion of the Polish national brand (the “Poland” brand – marka “Polska”), which would allow for a significant increase in the brand’s recognition, and, consequently would lead to an increase in its value, should be created as soon as possible.
1.13 Cooperation between scientific entities and the economy
70. Innovation diffusion in Poland is hampered due to poor cooperation between the science sector and the economy. On the one hand, the supply of new technological solutions that would match the needs of the economy is very low. On the other hand, enterprises rarely seek for solutions to their technological or organisational problems in Polish scientific entities42. Although in some sectors, such as, for example biotechnology and eco-innovation, cooperation has been developing, the economy in general still lacks such tendencies. Moreover, entities acting in favour of cooperation between the science sector and the economy in Poland are relatively poorly developed, and their activities are often aimed at the incubation phase rather then at increasing cooperation between science and the economy.
71. In 2004, there were 537 centres dealing with support for innovation in Poland43. Although since 2000 their number has increased by as much as 91%, still over half of these centres (55%) offers mainly training, counselling and information services. Only one out of ten innovation centres was able to support innovative activities of enterprises within technology transfer. As a result, their impact is still limited. Moreover, in every second self-government of poviats (counties) as well as in 75% of
40 Polish Economy Promotion Programme to the year 2005, Ministry of Economy and Labour (MGiP), Warszawa 2003. 41 Ibidem. 42 SMEs are not an attractive partner for scientific entities because of their low technological advancement and inability to spend substantial funds on R&D projects, whereas large enterprises are not interested in introducing new technologies or they have their own R&D base. An Analysis of Development Opportunities of Industrial Clusters in Poland and Proposals for Support Instruments, a study developed at the request of the Ministry of Economy and Labour, T. Brodzicki, M. DzierŜanowski, K. Erlandsson, S. Szultka, Gdańsk – Stockholm 2004. 43 Data of the Polish Association of Capital Investors (PSIK).
30
self-governments of gminas (municipalities), there are no innovation support institutions44.
72. It is worth stressing that the European Commission’s initiatives aimed at strengthening cooperation between the science sector and the economy have considerably enhanced the performance of R&D aimed at practical application in the Polish economy, as well as cooperation between Polish scientific entities and enterprises. New financial instruments under the 5th and 6th Framework Programmes created an opportunity to co-finance the programme of Centres of Excellence and Centres of Advanced Technologies. As a result, a few hundred Centres of Excellence were established in Poland, out of which 90 received co-financing from the European Union’s Framework Programmes (67% of all co-financed Centres of Excellence from the candidate countries). Centres of Advanced Technologies and Centres of Excellences may also apply for co-financing from the structural funds of the EU under sub-measure 1.4.3. of the SPO WKP for implementation of investment projects related to the construction and modernisation of research laboratories, as well as to acquisition of scientific and research equipment.
73. The implementation of Regional Innovation Strategies (RIS) may also help overcome these unfavourable tendencies. The aim of RIS is to establish strong partnership between scientific entities and industry in the regions and to increase competitiveness of SME. This should be based on introduction of new technologies and on development of professional skills of employees in the area of research and innovation. These strategies have been prepared in 15 regions (except for the Mazowieckie Voivodship) and, having been approved by self-governments, they are currently implemented under sub-measure 2.6. Regional Innovation Strategies and Technology Transfer of the Regional Development Integrated Operational Programme (ZPORR). In turn, the Regional Innovation and Development Strategy for Mazovia – RIS MAZAOVIA is implemented as a project of the 6th Framework Programme (FP6, 2002-2006).
74. RIS appropriately identify problems related to cooperation between scientific entities and enterprises, and consider them as the main reason for poor innovativeness of local economies. Most of regional innovation strategies, however, do not specify what kind of instruments of intervention will be applied in the area of collaboration between scientific entities and enterprises with a view to meeting the objectives of the strategies. These instruments of intervention are often formulated in a rather general manner and determined as objectives rather than as implementation instruments.
75. Poland needs to establish a National Innovation System45 that would be open to international environment and based on interconnected regional innovation systems. The development of RISes may be considered as the first step towards the establishment of such a system.
44 The report entitled Centres for Innovation and Entrepreneurship in Poland, Association of Organisers of Innovation and Entrepreneurship Centres in Poland, 2004, p. 23-24. 45 National Innovation System is a complex of institutions that jointly or individually contribute to development and diffusion of new technologies, forming the basis in the framework of which the governments formulate and implement a policy aimed at influencing innovation processes. It is a system of interrelated intuitions that are to create, transfer and store knowledge and skills constituting the foundation of new technologies. (Proposed Guidelines for Collecting and Interpreting Technological Innovation Data – Oslo Manual, second edition; OECD/EC/Eurostat, 1997, p. 132).

31
1.14 Diagnosis of Research and Development activities
76. Establishment of a knowledge-based economy in Poland requires substantial increase in expenditure on research and development (R&D), as well as infrastructure and information technology services. It is also necessary to provide a high level of innovativeness of the industry, through, e.g. development of advanced competitive technologies.
77. The Polish science and technology sector has not yet benefited from opportunities resulting from Poland’s accession to the European Union. The majority of indicators measuring science and technology performance in Poland show that there is a large gap between Poland and both the UE-20 and the UE-15, also in comparison with those states that joined the European Union together with Poland in 200446.
78. The main characteristics of R&D financing in Poland are as follows:
a) very low outlays on R&D in relation to GDP,
b) predominance of budgetary expenditure and low participation of economic operators in the structure of R&D financing ,
c) relatively low level of finances for applied research and development works in comparison with basic research.
79. In 2004, budgetary expenditure on R&D amounted to 0.31% of GDP, whereas non-budgetary – to 0.25% of GDP. The value of the GERD indicator (Gross Domestic Expenditure on R&D) in 2004 went up as compared to 200347, but the value of the GERD/GDP relation remained unchanged and stood at 0.56%48. To compare, in 2004 in the UE-25 this indicator stood at 1.90%. The highest amount of money was spent on R&D in Sweden (3.74% of GDP) and Finland (3.51%), and the lowest in Malta (0.29%), Cyprus (0.37%) and Latvia (0.42%). Average annual expenditures on R&D in real terms in the years 2001 – 2004 in Poland stood at 0.4%, while for the EU-25 they amounted to 1.3%, e.g. in Finland – 4% and in Cyprus – 15.2%49.
80. In 2003, GERD per capita in Poland amounted to 64.5 USD PPP50 whereas in the UE-15 to 462.6 USD PPP. As a result, R&D expenditure per capita in Poland constituted only circa 14% of the UE’s average.
81. Simultaneously, the breakdown of R&D financing in Poland, according to the source of financing, was reverse to the one set out in the Lisbon Strategy, which outlined that 2/3 of GERD should be represented by the non-budgetary sector. In fact, the majority of R&D expenditure in Poland comes from the state budget (in 2004, circa 61.7% of total expenditure). The share of economic operators in expenditure on R&D represents only 22.6%, whereas 5.2% is financed from abroad. To compare, in the UE-25 budgetary means spent on R&D constituted 35% of total outlays, with the business sector financing reaching 54.3% and financial means from abroad at the level of 8.5% (data for the year 2003).
46 European Innovation Scoreboard 2005, European Commission, Brussels 2005. 47 The GERD index in current prices in 2003 amounted to PLN 4,558.3 million, whereas in 2004 to PLN 5,155.4 million; see: Science and Technology in 2004, GUS, Warszawa 2005. The majority of the data presented in the chapter dedicated to the diagnosis of the R&D sector come from this document. 48 The Statistical Yearbook of the Republic of Poland 2005, GUS, Warszawa 2006, p. 423. 49 EUROSTAT News Release, 156/2005, 6 December 2005. 50 USD PPP – according to Dollar Purchasing Power Parity.
32
82. The science sector in Poland is also characterised by an ineffective structure of budgetary spending. The majority of means (62% in 2004) come from subsidies, out of which 48% were spent on the so-called primary statutory activity51, especially on expenditures on the basic needs of scientific entities. The remaining resources were spend on, e.g. research projects (15.6%), goal-oriented projects (6.81%), investments (13.4%) and international scientific and technological cooperation (0.09%). Such a distribution of funds indicates that R&D budgetary financing in Poland was to a very small extent linked to the effectiveness and appropriateness of research performed by subsidised entities, with respect to the needs of the economy. It should be stressed that changes in this respect consisting in substantial improvement of demand for competition or “project” funds (it refers both to enterprises and scientific entities) is not possible in such a short period of time, as it requires systemic changes as well.
83. In 2004, 39.5% of total current expenditure on R&D in Poland was designated for basic research, mainly financed from the state budget. As regards applied research and development works, they represented 35.3% and 25.2% respectively. Such a distribution of expenditures ranks Poland, along with the Czech Republic, among the countries with the highest share of basic research in the structure of R&D financing, which is characteristic of developing countries. The main performers of basic research, likewise in previous years, were scientific entities of the Polish Academy of Sciences (PAN) and higher education institutions.
84. In 2004, out of 957 entities performing R&D in Poland as many as 197 were research and development entities (JBR), 128 – higher education institutions, 78 – scientific entities of the PAN, and 480 – development entities (economic operators dealing with R&D within their basic activity, i.e. 2 million enterprises). Such structure does not enhance the integration of research in Poland nor the performance of R&D programmes in priority areas. It stems from unsatisfactory cooperation between R&D entities from different areas, which often results in ineffective utilisation of human resources potential, financial resources and research equipment alike. It should be stressed that apart from development entities, in Poland there are no other private scientific entities, and there are only 25 private schools that undertake R&D works.
1.15 Human resources potential in Research and Development
85. The main characteristics of human resources potential in science and technology are as follows:
a) lower than the UE average share of researchers in the working population,
b) small share of research and scientific personnel employed in the enterprise sector in comparison with the total number of the country’s research personnel,
c) relatively old age of those receiving post-doctoral scientific titles,
d) growing number of doctorates (but still lower than the UE average),
e) tendency of researchers to hold numerous work positions as a result of low salaries, and too many educational duties (since 1990, the number of students has grown by almost five times).
51Report on the budget implementation in 2004, Part 28 – Science, Part 27 – Informatisation, Ministry of Science and Informatisation, Warszawa, March 2005, p. 14.
33
86. The total number of people employed in R&D in 2004 stood at 127,35652, although over the last ten years, this figure changed frequently, ranging from 120,000 to 128,40053. In Poland the number of researchers per 1,000 employed people in 2003 stood at 4.5 and was by a few times lower then in Finland where it stood at 17.7. To compare, the average for the UE stood at 5.8 (2003)54.
87. In Poland only 6.5% of the total number of people employed in R&D are workers of enterprises, whereas in the UE-15 this ratio amounts to 50%55.
88. In the years 1998 – 2002, the number of professors has increased. The majority of professors (51.7%) are people aged 50 – 59. Barely 24% received the title of professor below the age of 50, whereas 14.4% received their post-doctoral title (in Polish: doktor habilitowany) below the age of 40. As regards the latter, 63.5% of doctors are people below the age of 35. However, in all fields of science (according to the data for the year 2003) the most numerous group are scientists holding the title of professor aged 60-70.
89. While analysing the quality of human resources potential in R&D in Poland some bibliometric data should be recalled. In 2003, Poland’s share in the world scientific publications stood at 1.45% (11,600 citations) and was the highest over the last twenty years. However, as compared to other EU countries, the number of citations of Polish scientists per one thousand inhabitants was substantially lower. The average for the UE-15 in 2002 accounted for 673, whereas for Poland it was 266.
1.16 Research and Development equipment
90. Research and scientific laboratories in Poland are poorly equipped. The wear rate of R&D equipment constituting fixed assets (at the disposal of scientific entities) in 2003 accounted for almost 78%. The highest share in the total value of R&D equipment in 2003 had higher education institutions (49.1%) and scientific and research institutes included in JBRs (30.2%). Obsolete R&D infrastructure does not allow Polish scientists to make scientific research to such an extent as their colleagues in more developed countries do.
91. Apart from the low level of budgetary spending on purchase of R&D equipment, the major problem is also the system for distribution of public means designated for co-financing of such purchases. Resources earmarked for R&D infrastructure are allocated in a dispersed way to relatively small infrastructure investments. Acquisition of R&D infrastructure of interdisciplinary character is financed to a very small degree (e.g. due to the low number of applications that are submitted). Such equipment is used by several scientific entities on the basis of formalised agreements. In 2004, some 13.6% of total budgetary expenditure on R&D equipment purchase were of interdisciplinary character. In 2005, this ratio increased to 19%. A similar level of spending on R&D infrastructure is observed in the case of the Polish Science and Technology Fund (Fundusz Nauki i Technologii Polskiej)56.
52 Including 71,906 in higher schools, 13,238 in research and development centres, 4,843 in institutes of the Polish Academy of Sciences (PAN) and 5,957 in development units (enterprises). 53 Science and Technology in 2003, GUS, Warszawa 2005, p. 30. 54 OECD in figures. Statistics on the member countries, OECD Observer 2005, Supplement 1, p. 72-73. 55 Statistics on Science and Technology in Europe. Data 1991-2002. Part 1. European Commission, Eurostat, Luxembourg 2003, p. 34. 56 Polish Science and Technology Fund (previously: Science Development Fund) was established on the basis of the Regulation by the Minister of Science and Informatisation of 29 April 2005 on the detailed principles of
34
1.17 IT infrastructure of science
92. The present IT and information infrastructure of science is to a large extent based on resources obtained within IT infrastructure development programmes for scientific and academic communities implemented in 199557 and 200058. These programmes are an element of the strategy implemented since 1993 by the State Committee for Scientific Research (KBN), and then subsequently by the minister in charge of science. The strategy has been continued through the implementation of Programme for development and maintenance of IT and information infrastructure of science and its digital resources for the years 2006 – 2009.
93. Information technology infrastructure of science in Poland mainly covers equipment, networks and digital resources located in five high performance computing centres (Gdańsk, Kraków, Poznań, Warszawa, Wrocław) and 21 MAN metropolitan area networks. MAN leading entities are situated in the biggest academic and scientific centres in Poland and have numerous local resources in scientific and academic entities. The basis for such infrastructure is the PIONIER national optical network which provides scientific and research community with access to worldwide Internet resources and links with domestic and foreign centres. PIONIER is based on its own optical fibres with current total length accounting to over 4,000 km59.
94. It should be stressed that information technology infrastructure of science in Poland is relatively new and constantly developed, however there are also some areas with poor coverage in terms of IT infrastructure (particularly in Eastern Poland). Moreover, the level of innovative solutions and applications employed by particular entities is also unsatisfactorily low.
1.18 International scientific and technical cooperation
95. In the framework of multilateral scientific cooperation, particular importance is attached to Poland’ participation (since September 1999) in the Fifth Framework Programme for Research, Technological Development and Demonstration Activities of the EU (FP5, 1998-2002) and in the Sixth Framework Programme for Research, Technological Development and Demonstration Activities of the EU (FP6, 2002-2006).
96. Poland’s participation over the first two years of the FP5 was limited60. In the years 1999 – 2000, participants from Poland, Hungary, the Czech Republic and Austria (states with similar research potential) constituted about 0.8% to 0.9% of all participants in the FP5. However, in spite of this, Poland’s participation in the FP5 was a success, mainly due to joining running programmes. Participation of Polish
financial management of the Polish Science and Technology Fund (Journal of Laws No. 81, item 714). The resources of the Fund come, e.g. from revenues from privatisation (2% in the given budget year) and are spent mainly on financing of investments for the needs of R&D works. 57 Programme for IT infrastructure development in Polish scientific circles. 58 Programme for IT infrastructure development in Polish scientific circles for the years 2001 – 2005 called “PIONIER: Polish Optical Internet – Advanced Applications, Services and Technologies for Information Society”. 59 Assessment of data communication technology infrastructure of science in Poland, OPI, Warszawa, December 2005, p. 2. 60 A. Siemaszko, J. Supel, Assessment of Poland’s Participation in the EU Framework Programmes, http://www.6pr.pl/statystyki/udzial_pl.html, Warszawa, 22 August 2006.

35
entities in the FP6, although the rules were changed (focus was placed on financing of strong industrial consortia concentrating on solving priority technological problems), has been constantly growing. In 2005, Polish participants in the FP6 constituted almost 3% of all participants, which placed Poland on the tenth position among all EU Member States. Besides, Poland’s share in financed projects is also big – it grew by 15%, although the leader in the area is Hungary with a 22% growth.
97. Poland is also a member of the Multi-annual Framework Programme of the European Atomic Energy Community, and it participates in the works of many other international organisations, such as, in particular, the European Scientific Foundation (ESF, the Polish Academy of Sciences has been its member since 1992), the NATO Scientific Programme, the OECD (since 1996), UNESCO (since 1946), and the Eureka initiative (as a member since 1995). Many Polish research teams also perform contracted research for foreign companies, whereas universities and scientific institutes implement a number of bilateral agreements with foreign partners.
1.19 IT market in Poland
98. In 200561 in Poland the level of investments in information and communication technologies per capita amounted to EUR 374, in comparison to the Czech Republic (EUR 563), Hungary (EUR 639) and to EUR 1,376 in the EU-25, which proves high underinvestment of the sector. The pace of growth of the IT services sector accounting for 13.2% in 2004 was the highest among the New Member States. Poland was ranked 32 (out of 65 surveyed countries)62 among countries which were best adjusted to the era of new technologies. Among six main categories, Poland achieved the best score in the category “Economic surrounding” and was ranked 30th with 7.34 points (out of 10), while average note for Eastern and Central European countries amounted to 6.71.
99. However, it has to be taken into account that, according to the World Economic Forum, strategic assessment of Poland’s readiness for transformation into the information society phase is very weak. Under this ranking, in 2004 Poland was placed on the 72nd position out of 104 classified countries, and this rate has been worsening since then. In reference to the public sector, Poland ranks on the 95th position (behind all the EU-25 states), which proves exceptionally bad situation and insufficient readiness of the Polish administration for functioning in an information society. The worst is the readiness of the administration to provide electronic services – in 2004 the level of access to electronic services in the administration in Poland stood at 34%63. However, in 2005 Poland received a much better note and was ranked on the 53rd position (growth by 19 positions, the highest among the countries included in the ranking). In spite of this, Poland still lags behind all countries of the EU-25.
61 Report: European Information Technology Observatory ITC Markets, March 2006. 62 The 2005 eReadiness Rankings, Economist Intelligence Unit, The IBM Institute for Business Value, 2005. 63 eGovernment Development in Poland – 3rd edition of eEurope Studies, Capgemini, Warszawa 2004.
36
1.20 Level of the country’s data communication infrastructure
100. In 2002, investments in telecommunication per capita in Poland amounted to USD 35.4 – a lot less than in the best-developed EU countries64. The indicator of digital access at the end of 2002 stood at the level of 0.59, which, in comparison with the highest EU indicators (e.g. Sweden – 0.85, Denmark – 0.83), also gives much weaker results.65 In 2003, Poland was ranked on the 57th place in the ranking of competitiveness of world economies66. This competitiveness is remarkably influenced by development of telecommunication infrastructure and services.
101. In 2004, the ration of apartment telephone subscriber lines per 100 residents amounted to 73.8, while the ratio of mobile phones subscribers per 100 residents – to 60.5. The number of subscribers and users amounted to 23 million and was by 32.7% higher than that recorded at the end of 200367. In 2004, there were 12.54 million active telephone lines, i.e. 328.46 per 1,000 persons. There were also 7,932 automatic digital local exchanges, including 3,655 in the countryside, as well as 97 automatic digital inter-zone exchanges. The number of subscribers for special communication systems revealed a tendency to grow, in the years 1999-2003 there was an increment of fixed phone subscribers by 9.5% (including by 26% in rural areas), as well as an increment of mobile phone subscribers by 339.8%. An increase in the number of subscribers was also observed for cable TVs (in the years 1999-2003 by 9.1%)68.
1.21 Level of development of eServices of the public administration
102. The level of advancement of public service development among the EU-25 amounts to 68% and in Poland to 34%69. The level of full interactivity of public on-line services amounts to 40%, in Poland – 9% (3rd position from the end). The highest level of development of public eServices for citizens is observable in the following areas: job search (74%), personal income tax (50%), registering for institutions of higher education (36%) and certificates of registry (29%). The lowest level of development is, in turn, noticed in health services (2%) and registration of reports to the police (2%). The level of access to public services in the regions is little higher than in the central administration (34% against 33%). The largest number of services in available in the Pomorskie Voivodship (45%) and the smallest – in the Śląskie Voivodship (27%). The majority of activities in this respect is undertaken at the local level, that is why big differences in the access to services in individual regions are observable (e.g. services in the area of eHealth from 0% to 13%).
103. The state of the development of public eServices addressed to legal persons is better than of those addressed to individuals. The highest indicator refers to obligatory
64 To compare, Denmark – USD 238.9; United Kingdom – USD 227.3; Portugal – USD 191.1; Sweden – USD 166; Spain – USD 128; the Czech Republic – USD 80; Slovenia – USD 75; Hungary – USD 67; World Telecommunication Development Reports, 2003, International Telecommunications Union (ITU). 65 http://www.itu.int/newsarchive/press_releases/2003/30.html; IDC includes four elements: information
infrastructure, knowledge and skills of the society, quality of ICT access, influence of income on ICT. 66 The World Competitiveness Yearbook 2004; 2001, IMD. 67The State of Telecommunication in Poland, data as at the end of the third quarter 2004, http://www.mi.gov.pl/departamenty/1/analizy/943.html. 68 Communication – Results of Activity in 2003; 2002; 2001; 2000. GUS, Warszawa 2005. 69 Data based on the survey Web-based survey on electronic public services conducted by Capgemini at the request of the European Commission, July 2004.

37
social insurance (100%), service of customs declarations (100%) and VAT (50%). In the case of obligatory social insurances such a high level stems from legal requirements, but in the case of the two remaining services, the development was achieved mainly thanks to own initiatives of the public administration entities in individual regions. Services in the area of payments for environment exploitation and for enterprise registering remain still at a low level – 25% and 5% respectively.
104. The majority of public administration institutions reached the information level that does not require transformations in the internal functioning of offices and is relatively easy to achieve. However, transactional services remain at a low level of development as they demand internal procedures, integration of state registers and databases, changes in legal provisions and creation of new organisational regulations, classifications and standards. Moreover, the lack of experience in managing electronic administration projects and the lack of vision of its development result in the low level of eServices development. 99.4% of public offices have Internet access, however as much as 80% of local government (gmina) offices use only an analogue modem70. Informatisation is not a priority – in over 56.6% of offices the percentage of budgetary resources earmarked for this purpose did not exceed 1% in 2005 (although it grew in comparison to 2004 when it stood at 29%).
1.22 Activities in the area of eEconomy71
105. The results of the surveys on the use of ICT in enterprises, carried out in 2004 and 2005, showed that the overall level of indicators of computer use and access to the Internet was high.
106. In 2005, computers were used in 93% of enterprises, and 87% of enterprises had access to the Internet. Almost all large enterprises (over 250 employees) used computers and had access to the Internet. Almost all (90%) medium-sized enterprises (number of employees between 50 and 249) had computers and 98% of them had access to the Internet. The number of on-line eServices available to citizens, businesses and general public is by 2-3 times lower than the average in the EU-15.
70 Report ARC Market and Opinion for the Ministry of Science and Informatisation, September 2004. 71 Use of Information and Communication Technologies in 2005, GUS, Warszawa 2005.

38
Figure 1.22.1 Percentage of enterprises that use computers broken into sectors in the years 2004 and 2005
Source: GUS Study entitled “Use of IT Technologies in 2005”, http://www.stat.gov.pl/dane_spol-gosp/spoleczenstwo_informacyjne/index.htm.wykres nr 3.
107. In 2005, the share of enterprises using analogue modems fell by 9 percentage points in comparison with the previous year and amounted to 43%. Enterprises started to invest on a wider scale in broadband connections, the use of which increased by 15 percentage points over the year and also amounted to 43%.
108. In 2005, 38% of employees working in enterprise surveyed admitted to use computers in their work routine at least once a week, out of which 27% used computers with access to the Internet. Compared to the data from the previous year, these indicators increased by 5 and 6 percentage points respectively, which gives 35,000 employees.
109. The biggest ratio of employees using computers in their work routine amounting to 41% was recorded in large enterprises, while in small and medium-sized enterprises it stood at 36% and 35% respectively. The index of employees having access to the Internet does not differ a lot in enterprises classified according to their size and fluctuates between 26% and 28%.
110. An analysis of enterprises by their activity shows that the highest ratio of employees using computers in their work routine was observed in the financial intermediary sector (96%), followed by the IT sector (95%). However, in the IT sector 91% of employees using computers had access to the Internet, while in financial enterprises this ratio was almost two times lower and amounted to 47%.
111. The data on enterprises using Internet in contacts with public administration in 2005 indicates a fall in comparison with 2004. The share of enterprises using Internet to acquire information from public administration amounted to 52% and decreased by 5 percentage points in comparison with 2004. In the case of access to applications, e.g. tax applications, this indicator remained at the level of 47%. The ratio of enterprises which submitted such applications to public administration bodies via the
84%
82%
85%
83%
89%
91%
100%
96%
98%
85%
85%
87%
85%
91%
94%
99%
98%
manufacturing
construction
trade and repair works
hotels and accommodation
transport, storage and communication
real estate and science
IT
film, radio and television
financial intermediary
2004 2005

39
Internet fell by 8 percentage points and in 2005 accounted for 60% (68% in 2004). The use of the Internet to handle all official matters only via an electronic way decreased by as many as 15 percentage points to the level of 16% (31% in 2004).
Figure 1.22.2. Share of enterprises that use the Internet in contacts with public administration in 2004 and 2005
Source: GUS Study entitled “Use of IT Technologies in 2005”, http://www.stat.gov.pl/dane_spol-gosp/spoleczenstwo_informacyjne/index.htm.wykres nr 3.
112. In general, in 2005 the share of people ordering or buying things via the Internet grew in comparison to 2004, however eCommerce is still not very popular in our country. Goods that are most frequently bought via the Internet, i.e. books and magazines, were purchased only by 3% of people at the age of 16-74, which constitutes almost 900,000 people.
113. The total value of goods and services ordered or bought via the Internet surpassed one billion zloty in 2005. To compare, in 2004 the value of purchases made via the Internet by Polish inhabitants aged 16-74 amounted in total to nearly PLN 360 million.
114. As far as enterprises that buy things via the Internet are concerned 72, comparing the years 2003 and 2004, we can observe an increase of the share of enterprises that placed orders via the Internet by 7 percentage points. In 2004, 17% of all enterprises chose this form of shopping. This means that the group of over 6,800 companies ordering things via the Internet in 2003 was joined by 5,700 companies in 2004. On-line payments for orders made via the Internet are still not very popular, but this has been changing gradually (an increase from 3% to 5%).
72 In the survey on ICT use in enterprises, conducted by the GUS, similarly to the situation in other EU Member States, the category of orders via the Internet does not include orders placed via electronic mail. The information collected in this area refers to the year preceding the year when the survey was conducted, that is to 2003 and 2004.
57%
47%
68%
31%
52%
47%
60%
16%
to acquire information
to obtain applications, e.g. tax applications
to send back completed applications, e.g. to the ZUS
via electronic way only
2004 2005
to handle all official matters

40
115. In 2004, the share of enterprises selling things via the Internet (exclusive of orders obtained via e-mails) and those receiving on-line payments did not change radically in comparison to 2003 and amounted to 4% and 1% respectively. In 2004, 4% of small, 6% of medium-sized and 8% of large enterprises surveyed sold their products via the Internet, including 1% of companies in all the three groups that received payments via the Internet as well.
1.23 eCitizen
116. Technically, access to the Internet in 2005 was available in 30% of households in Poland. In urban areas, this ratio stood at 36%, and in the country – at 19%. Access to the Internet is closely related to incomes – 71% of households with net income exceeding PLN 7,200 had access to the Internet, while for households generating income below PLN 1,440 – only 14%.Only 40% of households have computers, which, in comparison to the average for new Member States (55%)73 is still a very low result. The number of computers depends on income. Over 68% of households with average monthly income exceeding PLN 7,200 had a computer, whereas households with incomes between PLN 1,441 and 3,360 and below PLN 1,440 had relatively fewer computers – 48% and 21% respectively.
117. Almost half of the households that had technical conditions to access the Internet in 2005 used broadband connections (allowing for data transmission at a speed over 128 kb/s). In the group of households with the highest monthly net income, 100% used broadband connections, while in the group of those with the lowest income – only 50%. Differences are also visible when we compare the place of residence: in urban areas (both in cities with more and fewer than 100,000 inhabitants) over half of Internet users had broadband connections, but in rural areas – only one user in four74. According to the data for 2004, the level of access to the Internet in Polish households (then 26%) was lower than the EU-25 average where it stood at 43%. To compare, the highest ratio of access to the Internet was recorded in Denmark (69%), and the lowest in Lithuania (12%)75.
118. In the first quarter of 2005, 12% of people looked for information on public administration websites, 6% loaded forms and applications, and 3% sent their forms via the Internet76.
73 Eurostat Internet portal: http://epp.eurostat.cec.eu.int, Data, link 1: information society statistics, folder: Computers and the Internet in households and enterprises, Availability of Computers, Households. 74 Use of Information and Telecommunication Technologies in Enterprises and Households in 2005, GUS, Warszawa 2006. 75 Use of Information and Telecommunication Technologies in Enterprises and Households in 2005, GUS, Warszawa 2005. 76 Use of Information and Telecommunication Technologies in Enterprises and Households in 2005, GUS, Warszawa 2006.

41
2. SWOT ANALYSIS
119. A SWOT analysis assumes that Strengths and Weaknesses refer to characteristic features of the enterprise and science sectors, as well as information society, whereas Opportunities and Threats describe external factors that influence these three sectors of the Polish economy.
120. Strengths point to elements which constitute competitive advantages of the sectors and upon which the implementation of the IE OP will rely, while Weaknesses are flaws of the sectors that the IE OP should remove or reduce.
121. Opportunities are events that take place in the environment of the enterprise and science sectors, and in the area of information society which will be used to obtain the objectives of the IE OP, both general and detailed. Threats stem from external factors. The implementation of the IE OP is to contribute to limitation of their influence on the two sectors.
STRENGTHS WEAKNESSES
a) Increasing attractiveness and credibility of Poland consequent upon its membership in the EU
b) Openness of the economy and possibilities of easy transfer of goods and capital
c) Dynamic increases of sales of Polish enterprises on markets of the EU-25 following 1 May 2004
d) Considerably high ability of Polish companies to adjust to changing external conditions of business activity, especially to competition on the SEM (despite growing labour costs)
e) Substantial potential of the Polish economy
f) Transformation of FDI structure towards greenfield investments (realised from scratch)
g) Attractive location for foreign investments in some branches (including innovative activities)
h) Qualified workers
i) High and steady share of researchers in the total number of people employed in R&D in scientific entities
a) Low share of highly processed goods and high-tech industry in the export structure
b) Low share of new and modernised products in production sold
c) High level of fixed assets wear in enterprises
d) Low level of investment outlays of entrepreneurs
e) Insufficient development of the service sector
f) Low level of productivity of enterprises operating in Poland in comparison with the EU-15
g) Insufficient recognition of the Poland brand and Polish brand and company names abroad
h) Low level of internationalisation of enterprises (lack of a unified systemic support)
i) Low propensity for cooperation between enterprises and scientific entities
j) Low level of cooperation between
77 Journal of Laws No 64, item 565.

42
j) Increasing number of doctoral students and employees with a doctorate in the R&D sector
k) Relatively modern and constantly extended IT infrastructure of science
l) Regulated legal environment of administration informatisation – Act of 17 February 2005 on informatisation of the activity of entities that perform public tasks77 and respective executive acts
m) Electronic registers of the administration
n) High interest in and knowledge of IT technologies among young people
o) Modern system of publicly available places where the Internet can be accessed
entrepreneurs
k) Maladjustment of the business support system to the needs of entrepreneurs and the R&D area
l) Low level of companies’ innovativeness and their low propensity for innovativeness
m) Low awareness in the area of necessity to compete through application of innovative solutions
n) Limited access to external sources of financing for innovative activities of enterprises, especially SMEs (in particular limited access to external sources of financing for innovative start-ups)
o) Lack of pro-innovation and pro-entrepreneurship educational programmes at Polish universities
p) Insufficient saturation of the enterprise sector with modern technologies, including information and communication technologies
q) Low level of inventiveness and limited awareness of intellectual property rights and their use among entrepreneurs
r) Maladjustment of R&D works to the needs of enterprises (resulting from, e.g., reluctance of scientific staff in this respect)
s) Low number of patent rights granted
t) Low level of total R&D outlays, including a much lower than optimal level of non-budgetary outlays
u) Ineffective structure of budgetary financing of R&D activities (domination of financing granted to entities rather than for specific projects, relatively low level of budgetary outlays on applied research and development works)
v) Unfavourable age structure of scientific workers
w) Unsuitable organisational structure
43
of the R&D sector and fragmented structure of the R&D sector
x) Limited experience of Polish teams in implementation of large international research projects
y) Low level of infrastructure development in rural areas
z) Low purchasing power of the population that limits the demand for data communication services
aa) Limited access and low level of eAdministration services
bb) Low share of Polish contents in the Internet
cc) Lack of experience in managing IT projects in administration
dd) Obsolete and dispersed public registers
ee) Insufficient development of the country’s data communication infrastructure
ff) Low level of development of eServices of the public administration
OPPORTUNITIES THREATS
a) Intensification of actions aiming at implementation of the priorities of the Lisbon Strategy
b) Support from EU Funds focused on investments favouring economic growth and creation of jobs
c) Access to world achievements in the area of entrepreneurship and innovation
d) Favourable trend in transformation of the sectoral structure of the economy towards a growth of the share of the service sector in GDP
e) Establishment of a coherent business support system adjusted to the needs of entrepreneurs, especially to the needs of innovative companies
f) Increasing work effectiveness
a) High state budget deficit in relation to GDP (and the tendency to reduce the value in the coming years)
b) Worsening economic situation in the world and EU which may result in a slow of economic growth
c) Structure of professional qualifications maladjusted to the needs of the economy
d) High costs of business activity
e) Unstable and non-transparent legal environment
f) Overregulated economic procedures
g) Administration unfriendly towards entrepreneurs
h) Difficulties related to restructuring processes of some branches of the
44
g) Inflow of foreign investments in the areas of advanced technologies based on R&D activities
h) Improvement of the institutional and legal environment for business activity
i) Accelerating modernisation and improvement of effectiveness of the sectors resulting from more efficient transfer of innovative solutions
j) Strengthening of scientific networks and consortia, and technological platforms
k) Participation of Poland in the establishment of the European Research Area
l) Enlargement of the EU by Bulgaria and Romania, and potentially by Turkey and Ukraine
m) Development of the National Innovation System through coherent policy in the area of innovation
n) Implementation of Regional Innovation Strategies stimulating establishment of Knowledge Regions
o) Restructuring and consolidation of the best scientific entities and teams of researchers around priority-oriented, multi-annual strategic research programmes
p) Development of services on the basis of highly qualified human resources
q) Growing access to on-line services for citizens and enterprises and growing interest in this type of services
r) Growing involvement of Polish operators in European programmes
s) Falling prices of telephone connections and access to the Internet resulting from technological development and growth in the competitiveness of the sector
t) Revolutionary development of IT technologies projected for the years 2010-2015
industry
i) State aid aimed mainly at declining sectors
j) Inflexible labour market and high non-wage costs of employment disadvantageous to those willing to take up their own business activity
k) Lack of pro-innovativeness attitude among entrepreneurs
l) Brain drain
m) Low level of security in economic transactions
n) Inconsistent implementation of a policy aimed at increasing R&D outlays resulting in a low level of resources designated for science in the state budget (lack of leverage effect) and insufficient extra-budgetary financing for R&D
o) Inability of universities and scientific entities to reorient their research activity so that to satisfy the needs of the economy
p) Serious threat of information exclusion, especially in rural areas and in socially threatened groups
q) Language barrier that makes it necessary to translate the contents of the Internet
r) Too low pace of development of services in the area of eAdministration

45
u) Development of digital communication technologies

46
3. ASSESSMENT OF THE EFFECTIVENESS OF DOMESTIC AND FOREIGN SUPPORT FOR THE
ENTERPRISE SECTOR IN THE YEARS 2000-2006
3.1 Characteristics of aid granted to the enterprise sector
122. Support awarded to the enterprise sector in Poland usually takes two forms: state aid or financing activities of business support institutions. State aid accounts for a substantial part of support.
123. In the years 2000-2004, the value of state aid granted stood at between 1.1% of GDP in 2000 and 1.9% of GDP in 2004, with the exception of 2003 when the value of state aid granted amounted to 3.5% of GDP.
Table 3.1.1. Value of state aid granted (PLN million)78
Year 2000 2001 2002 2003 2004 Total value of aid granted 7,712.0 11,194.8 10,277.6 28,627.5 16,400.6 Value of aid granted excluding transport
no data available
no data available
no data available
no data available
8,809.3
Share of aid value in GDP 1.1% 1.5% 1.3% 3.5% 1.9% Share of aid value in GDP excluding transport
no data available
no data available
no data available
no data available
1.0%
Source: Report on State Aid in Poland Granted to Entrepreneurs in 2004, Office for Competition and Consumer Protection (UOKiK), Warszawa 2004.
124. The relatively high level of state aid in 2003 resulted mainly from the aid granted for restructuring processes in the coal-mining sector that stood at PLN 17.5 billion.
125. The structure of state aid granted in Poland in the years 2000-2004 was unfavourable. Out of the total amount of the aid awarded in 2004 that reached about PLN 16.4 billion, only 11% (about PLN 1.7 billion) was designated for pro-development objectives (regional aid, horizontal aid for SME development, R&D and jobs creation), whereas the rest, that is nearly 89% (about PLN 14.2 billion) were allocated for restructuring processes in some sectors, especially coal-mining, railway and ship-building, or for their preservation.
126. However, a positive tendency is also observable, namely systematic growth in the value of regional aid (from PLN 48 million in 2001 to PLN 855 million in 2004), as well as its share in total value of state aid (from 0.4% in 2001 to 9.7% in 2004). The main factor behind this trend is tax exemptions awarded to entrepreneurs operating in Special Economic Zones. Since 2005, a more and more significant role has been played by regional aid awarded to entrepreneurs within the framework of operational programmes co-financed from EU funds (mainly SPO WKP).
127. In 2004, the value of horizontal aid granted to enterprises also increased (from PLN 2,840.8 million in 2003 to PLN 4,453.1 million in 2004, i.e. from 10% of total value of aid granted in 2003 to 50.5% of total value of aid granted in 2004). However, it has to be noted that a huge part of this amount was allocated for restructuring
78 The data presented in the table does not take into account the aid granted to entrepreneurs from EU resources (pre-accession and operational programmes) which formally do not constitute state aid.

47
processes (PLN 3,597.2 million, i.e. 81% in 2004). This results mainly from the implementation of the so-called anti-crisis acts (Act of 30 August 2002 on restructuring of some public dues from entrepreneurs79 and Act of 30 October 2002 on state aid to entrepreneurs of particular importance to the labour market80). In 2005, due to the implementation of programmes financed from the structural funds, the value of horizontal aid designated for SMEs, training, R&D, jobs creation and environmental protection increased significantly.
128. The most frequently used forms of state aid, i.e. tax exemptions and remissions which accounted for 52.7% of the aid granted in 2000 and for 90.3% in 2003, result in a decrease of state revenues. State aid in the form of direct public expenses (e.g. subsidies) still constitutes less than 50% of the aid granted.
3.2 Analysis and assessment of domestic and foreign support for the science sector81
129. Public support for R&D from budgetary funds concerns financing of activities aimed at implementing the state’s scientific, science and technology and innovation policy, in particular scientific research, development works and other tasks of high importance for its implementation. Funds for science are mainly spent on co-financing of the so-called primary statutory activities of scientific entities, investments in R&D, research projects, goal-oriented projects performed by enterprises (which constitutes state aid) and scientific entities, international scientific cooperation and research-supporting activities. Moreover, budgetary means are also allocated for financing of programmes and initiatives concerning, among other things, professional development of young scientific personnel and organisational entities supporting cooperation between science and the economy.
130. The share of budgetary expenditure on R&D in GDP as well as in total budgetary expenditure has been systematically decreasing in recent years. The process over the years 2000-2005 has been illustrated in Figure 3.2.1.
79 Journal of Laws No. 155, item 1287. 80 Journal of Laws No. 213, item 1800. 81 The data presented in chapter 3.2. has been calculated on the basis of information included in Reports on budget implementation, Part 28 – Science for the years 2000-2005. Warszawa 2001, 2002, 2003, 2004, 2005, 2006.

48
Figure 3.2.1. Share of budgetary expenditure on R&D in GDP and in total budgetary expenditure in the years 2000-2005
Source: Study of the Ministry of Science and Higher Education (MNiSW).
Table 3.2.1 Budgetary expenditure on science in the years 2000-2005 (million PLN)
2000
2001
2002
2003
200482
2005 Expenditure on science
2,916.8 3,089.9 2,661.5 2,729.2 2,893.8 2,901.1
Source: Study of the Ministry of Science and Higher Education
131. The structure of budgetary expenditure on R&D is also unfavourable, as institutional subsidies for scientific entities prevail. At the same time, the share of expenditure on development activities, such as goal-oriented projects the results of which are aimed at practical application in the economy or investments in R&D, is considerably lower.
132. The data in Figure 3.2.2 indicates that recipient-specific subsidies that are mainly earmarked for financing of the so-called primary statutory activities of scientific entities represent as much as 64.4% of total budgetary expenditure on R&D in the analysed period.
82 In the years 2004-2005, total budgetary expenditure on science, apart from budgetary funds covered by Budget Part 28 – Science, also covered the funds allocated to budgets of the voivodes (regional governors) for performance of tasks and programmes co-financed from the structural funds.
0.41% 0.41% 0.34% 0.33% 0.33% 0.31%
1.93% 1.79% 1.45% 1.44% 1.46% 1.38%
0.00% 0.50% 1.00% 1.50% 2.00% 2.50%
2000 2001 2002 2003 2004 2005 Year
%
Share of budgetary expenditure on science in GDP
Share of budgetary expenditure on science in total budgetary expenditure

49
Figure 3.2.2 Structure of expenditure in Budget Part 28 - Science in the years 2000-2005 (thousand PLN)83
Source: Study of the Ministry of Science and Higher Education.
133. At the same time, the share of expenditure on implementation of research projects84 in total budgetary outlays is unsatisfactory; it constitutes 15.3% on average, although shows a slight growth85.
83 In thousands PLN and in relation to total budgetary expenditure on science. The data presented in the table refers to expenditures on science covered by Budget Part 28, which is managed by the minister in charge of science. 84 This analysis does not cover the outlays spent on research development projects due to the fact that the first call for proposals for their performance was only announced at the beginning of 2006. 85 Financing of research projects (pursuant to the Act of 8 October 2004 on the principles of financing of science) covers commissioned projects (dedicated to subjects set out in national framework programmes or in the multi-annual programme), own projects (dedicated to subjects set out by scientists submitting such projects), development projects (subjects set out by the scientists, their result should constitute the basis for practical use), as well as supervised projects and special projects (which are part of international programmes which are not co-financed from foreign funds). Pursuant to the Act of 12 January 1991 on the State Committee for Scientific Research (KBN) (Journal of Laws of 2001, No. 33, item 389 with amendments), financing of research projects mainly referred to financing on the basis of a competition of applications, submitted individually or by research
0 500,000 1,000,000 1,500,000 2,000,000 2,500,000 3,000,000 3,500,000
2000
2001
2002
2003
2004
2005
PLN thousand
Receipient-specific subsidies 1,766,076 1,908,487 1,829,896 1,873,953 1,793,042 1,870,351 Other activities 11,057 8,090 8,529 10,028 9,985 10,514 Research supporting activities 73,322 67,329 46,242 47,325 50,436 48,275 Investments 436,795 413,463 175,100 163,926 387,595 299,787 International scientific cooperation
8,950 619 629 1,982 2,567 2,480
Goal oriented projects 238,409 246,029 188,028 198,530 197,043 171,675 Research projects 329,534 445,912 413,042 433,427 451,113 489,427
2000 2001 2002 2003 2004 2005
50
134. Budgetary expenditure on commissioned research projects (PBZ) and research elements of multi-annual programmes in nominal values in the years 2000-2005, as well as the share of this expenditure in total spending on scientific research are presented in Figure 3.2.3.
Figure 3.2.3 Budgetary expenditure on commissioned projects and research elements of multi-annual programmes in nominal values in 2000 – 2005 and in total budgetary spending on research projects (%)
Source: Study of the Ministry of Science and Higher Education.
135. The data presented above shows that there was a small share of commissioned projects in the total volume of research projects over the last five years. It has to be noted that such projects are the main tools for the implementation of the state’s scientific, science and technology and innovation policy managed by the minister in charge of science. They allow the minister to direct budgetary expenditure towards undertakings in the area of research and in disciplines of priority importance for the country’s development and for the establishment of a knowledge-based economy.
136. Additionally, financing of international scientific cooperation from budgetary funds, which covers in particular scientific research and development works carried out within European or international programmes (co-financed with non-returnable foreign funds), is at a very low level and has been declining. As regards the structure of budgetary expenditure on international scientific cooperation in 2005, as much as 52.3% were spent on fees paid to international institutions or organisations under
teams, dedicated to subjects set out by its performers or ordered by the KBN or its Chairman. Therefore, according to the previous regulations, financing of research did not cover development and special projects.
84009
5196753051
64840
91007 92485
19.70%18.89%
20.17%
19.30%
11.90%12.60%
0
10000
20000
30000
40000
50000
60000
70000
80000
90000
100000
2000 2001 2002 2003 2004 2005
0%
5%
10%
15%
20%
25%
Commissioned research projects (PBZ) and research elements of multi-annual programmes (thousand PLN) Share of commissioned research projects (PBZ) and research elements of multi-annual programmes in total budgetary spending on scientific research (%)

51
international agreements, whereas participation in UE programmes along with activities supporting this participation accounted for scarcely 34.68%.
137. The share of expenditure on goal-oriented projects86 the results of which are aimed at practical application in the economy is yet lower. In the analysed period, it constituted 7.2% of total budgetary expenditure on R&D and has been steadily declining; in 2005 it dropped to 5.93%.
138. As the diagnosis of the Polish science sector shows, budgetary financing is also characterised by the low level of expenditure on investments in scientific research and development works87. Additionally, the system for distribution of budgetary funds designated for co-financing of R&D investments is rather dispersed. As a result, scientific entities are poorly equipped, which is accompanied by the high wear of scientific and research devices and constraints on possibilities to carry out research at the global level.
Figure 3.2.4 Structure of expenditure on investments in scientific research and development works in the years 2000-2005
Source: Study of the Ministry of Science and Higher Education.
3.3 Support from European funds
3.3.1 Support for enterprises within pre-accession programmes
139. Aid granted from pre-accession programmes such as Phare and SAPARD was an important source of financing of pro-development projects of enterprises in the period preceding accession and at the early stage of Poland’s membership in the EU. The tables presented below show the detailed structure of the aid awarded to the enterprise sector within the framework of the Phare programme in the years 1999-2005 and within SAPARD until the end of 2005.
86 According to the Act on the principles of science financing, a goal-oriented project is an undertaking intended for accomplishment in a specified period of time, on stipulated terms by authorised entities covering applied research, development works, industrial research and pre-competitive research. 87 Financing of investments in scientific research or development works under the Act on the principles of science financing covers: construction investments, purchase of buildings, purchase or construction of scientific and research equipment classified as fixed assets, development of information technology infrastructure of science, as well as participation in investment projects on the basis of international agreements.
43.50%
34.40%
43.60%
39.60%
18.70%
48.20%49.90%53.60%
13.30%
32.00%
41.70%
34.50%
6.70%11.90%
43.10%
28.30%
20.10% 17.20%
0%
10%
20%
30%
40%
50%
60%
2000 2001 2002 2003 2004 2005
Construction investments Investments in equipment IT infrastructure of science

52
Table 3.3.1.1 Support for the enterprise sector within the Phare programme in the years 1999-2003 (EUR million)
Name of Project Allocated resources Amounts contracted Amounts spent
Phare 2000, Development of SME 30.1 29.9 27.1
Phare 2001, Promotion of SME Development
55.1 55.1 44.4
Phare 2002, SME and Innovativeness Sectoral Programme
11.0 10.5 6.4
Phare 2002, Entrepreneurship in Poland – Regional Programme for support for SME
24.6 24.6 16.3
Phare 2003, SME and Innovativeness Sectoral Programme
11.5 8.5 0.0
Phare 2003, Regional Programme for Support for SME
22.8 19.8 6.252
Source: Study of the Ministry of Regional Development, Warszawa 2006.
Table 3.3.1.2. Support for the enterprise sector within SAPARD until 31 December 2005 (EUR million)
Measure / Scheme Allocated resources Amounts contracted Amounts spent
Creation of workplaces in rural areas
361.5 343.4 212.6
Source: Study of the Agency for Restructuring and Modernisation of Agriculture (ARiMR), Warszawa 2006.
140. At present, a complete assessment of the amount and effectiveness of support that Poland received under the Phare and SAPARD programmes cannot be made. The contracting phase of the Phare programmes ended in November 2005, but the implementation of a few thousand projects financed from Phare 2002 and Phare 2003 is still in progress. However, it must be observed that Phare programmes, especially those implemented within the so-called New Orientation (starting with Phare 2000), were the first pro-development support undertakings addressed to enterprises, and SMEs in particular, implemented on a wide scale. These programmes, irrespectively of meeting their primary objectives, contributed to improvement of the ability of effective awarding (on the part of the administration) and effective use (on the part of entrepreneurs) of pro-development state aid in compliance with European standards.
3.3.2 Support for enterprises within the European Union’s structural funds
141. Thanks to support from the EU structural funds and to the instruments designed to take advantage of them, the amount of resources destined for activities aimed directly and indirectly at the enterprise sector has significantly increased since 200488. Within the framework of respective operational programmes, assistance is
88 Because of the schedules for launching particular measures within the framework of operational programmes and accepted procedures for selection of projects, the process of support awarding (i.e. contracting) on a large scale started in 2005 and will last until the end 2006, whereas disbursing of resources will last until the end of 2008 at the latest, depending on the programme.

53
available for, inter alia, new investments, innovative activities, employment growth, counselling, training, pro-ecological and occupational health and safety investments, as well as for internationalisation of companies and marketing activities.
142. The Improvement of Competitiveness of Enterprises Sectoral Operational Programme (SPO WKP) provides the most complex system of support for entrepreneurs. It is meant for both business support institutions and directly for entrepreneurs, with particular regard to the SME sector. The SPO WKP aims to improve the competitive position of enterprises operating in Poland and within the framework of the Single European Market through creation of a strong institutional environment providing support for enterprises and fostering the transformation of the economy into an economy based on innovative enterprises. In order to achieve this goal, two priorities were set: entrepreneurship development and innovativeness growth by means of strengthening business support institutions and direct support for enterprises.
143. Support for the enterprise sector awarded in the framework of the SPO WKP is complemented by:
i. Regional Development Integrated Operational Programme (ZPORR) which supports the enterprise sector at the regional level, offering assistance to micro-enterprises and promoting entrepreneurship among local communities;
ii. Restructuring and Modernisation of the Food Sector and Rural Development Sectoral Operational Programme (SPO ROL) which supports enterprises from the farm and food sector operating in the area of processing and marketing of agricultural produce subject to Annex I to the European Community Treaty, as well as activities related to tourism and leisure services;
iii. Human Resources Development Sectoral Operational Programme (SPO RZL) which provides support for unemployed people wishing to start their own business, promotes entrepreneurship (especially among women, young people and people with disabilities), as well as strengthens the adaptive potential of enterprises;
iv. Fisheries and Fish Processing Sectoral Operational Programme (SPO RYBY) which includes measures designated for sea fishery, inland fishery and fish processing sectors.
144. On the basis of experiences gathered so far from the implementation of the structural funds it may be said that the measures destined for entrepreneurs enjoy wide interest. Within the framework of the SPO WKP, the majority of applications were submitted within Measure 2.3, under which SMEs may receive subsidies for new investments.
145. By the end of March 2006, the total number of applications for financing submitted within the framework of the SPO WKP which offers direct assistance to enterprises stood at 40,679, out of which 21,898 applications within Measure 2.3. In the case of investment activities, the value of financing applied for in applications that were correct with regard to formal requirements exceeded the value of the allocation by four times in Measure 2.3.
146. By the end of October 2006, the total value of applications filed in by entrepreneurs amounted to over PLN 8 billion, exceeding by two times the amount of resources available. The table below illustrates the interest in the measures destined for entrepreneurs in the framework of the operational programmes concerned.

54
Table 3.3.2.1 Consolidated list of amounts of support for the enterprise sector allocated for the years 2004-2006 and granted in the years 2004-2005 under each operational programme co-financed from the EU structural funds
Operational Programme
Priority/ Measure number
Total value of allocation
(PLN)
Total value of support applied
for (PLN)
Allocation / value of
applications
Total value of contracts signed
(PLN)
Allocation /total
value of contracts
signed
2.1 52,914,050 88,180,311.79 170.40% 40,501,636.78 76.54%
2.2 986,622,287 3,545,328,528.42 359.34% 460,161,854.35 46.64%
2.3 1,054,044,810 4,066,093,370.00 385.76% 1,026,202,053.83 97.35%
SPO WKP
2.4 604,518,557 1,061,251,547.33 175.55% 172,592,451.92 28.55% ZPORR 3.4 221,771,616 528,470,180.07 238% 179,622,248.36 80.99%
1.2 792,244,366.41 733,194,315 93% 725,425,814 92%
1.4 303,859,779.55 600,300,543 198% 301,661,844 99%
1.6 260,695,640.57 522,314,502 200% 209,856,025 80%
SPO RZL
2.3 755,840,136.57 3,218,816,972 426% 746,627,481 99%
1.1 1,284,894,694 1,541,598,833.45 120% 1,182,566,796.3 92%
1.5 1,291,383,837 1,830,821,540 141.8% 1,234,940,370.97 95.6%
2.4 297,506,872 301,035,660.10 101.2% 201,464,729.29 67.7%
SPO ROL
2.6 113,091,289 151,843,595.74 134.3% 103,425,021 91.5%
3.1 34,257,171 1,341,662 3.9% 0 0.0%
3.2 41,195,332 13,308,652 32.3% 10,850,583 26.3%
3.4 65,478,900 90,897,579 138.8% 31,912,737 48.7%
3.5 867,268 115,179 13.3% 39,237 4.5%
4.3 15,177,232 1,537,112 10.1% 466,812 3.1%
SPO RYBY
4.5 11,509,500 3,000,321 26.1% 2,264,613 19.7%
Total 8,019,387,953 18,189,249,898.9 226.82% 6,585,048,326.8 82.11%
Source: Ministry of Regional Development, Warszawa 2006.
3.4 Aid to business support institutions
147. Development of enterprises is stimulated not only by direct assistance provided to entrepreneurs, but also by support for widely understood business support institutions. The majority of measures aimed to strengthen and develop various business support institutions (such as technology transfer centres, science and technology parks, industrial parks, technology incubators and R&D institutions, loan and guarantee funds, seed capital funds) were provided within the SPO WKP. These measures aim at stimulating entrepreneurship and innovative activities through giving access to high quality services provided by business support institutions, through improvement of accessibility of external financing, and through preparation of a modern infrastructure for business activity. Furthermore, they should foster entrepreneurship through strengthening of links between the R&D sector and enterprises, through improvement of mechanisms for implementation and

55
commercialisation of innovations (including technology transfer) as well as through better on-line access to a variety of public services.
148. The measures aimed at business support institutions enjoy wide interest of applicants. Out of 937 formally correct applications, 355 were approved. The value of approved projects (including projects placed on the waiting lists) is PLN 2.7 billion and surpasses by 18% the value of available resources. The table presented below shows the structure of the SPO WKP measures aimed at business support institutions along with the amounts allocated for particular category of support.
Table 3.4.1 Support for business support institutions allocated in the years 2004-2006 and granted in the years 2004-2006 within the SPO WKP presenting categories of support (EUR million)
TYPE OF SUPPORT Amount
allocated for the years 2004-2006
Value of approved projects covered by contracts 89
Reinforcement of institutions (and their networks) supporting operations of enterprises, including those belonging to the National SME Services Network (KSU)
37.6 37.4
Improvement of accessibility to external financing for investments in enterprises: providing capital for micro-loan funds, credit guarantee funds and seed capital funds
203.8 179.1
Support for industrial parks, science and technology parks and technology incubators, including academic initiatives
185.66 171.59
Strengthening of co-operation between the R&D sector and the economy: support for institutions and organisations from the R&D sector (including their networks and consortia) and other institutions that support entrepreneurship and innovativeness
121.7 86.72
Source: Ministry of Regional Development. Complement to the SPO WKP and Monthly information on the progress of the SPO WKP implementation as at 27 October 2006.
3.5 Support for the science sector within the European Union’s structural funds
149. Support for the science sector is available within Measure 1.4 of the SPO WKP and covers co-financing of goal-oriented projects carried out by enterprises either individually or in collaboration with scientific entities, as well as by the Centres of Advanced Technologies (Sub-measures 1.4.1 and 1.4.4), investments (Sub-measures 1.4.2 and 1.4.3) and research and goal-oriented projects in the area of foresight (Sub-measure 1.4.5). The total value of contracts signed within the said sub-measures as well as the total value of European co-financing in the period between 1 May 2004 and the end of August 2006 are presented in Table 3.5.1.
89 As at 27 October 2006.

56
Table 3.5.1 Total value of contracts signed within Sub-measure 1.4 of the SPO WKP in the years 2004-2006 (PLN)
Value of signed contracts/ decisions issued Measure Sub-measure
Number of applications
Number of contracts
signed Total ERDF
1.4.1 85 19 33,905,29.51 25,429,297.13 1.4.2 250 50 82,968,443.78 62,226,332.84 1.4.3 217 42 187,395,907.88 140,546,930.92 1.4.4 13 6 5,413,143.90 4,059,857.93 1.4.5 28 19 35,334,222.80 26,500,667.10
1.4
Total 596 136
345,017,447.87
258,763,085.92
Source: Ministry of Regional Development, Warszawa, October 2006.
150. While attempting to asses the process of the implementation of the structural funds for science, it must be stressed that the applicants have a great interest in investment projects, yet they are not that interested in R&D projects. It is a typical feature of undercapitalised structures, yet changes in the infrastructure should result in an increased number of research projects due to a modernised infrastructure. Furthermore, the reasons for such a structure of applications should be attributed to not very flexible and complicated procedures and general construction of the instruments applied: according to the presently functioning formats of goal-oriented projects, entrepreneurs do not directly receive financing for development works.

57
4. STRATEGY
4.1 Main objective
151. The IE OP is an element of the system for effective use of the European Union’s structural funds by Poland in the years 2007-2013. The main strategic document the assumptions of which serve as a point of reference for the IE OP is the Lisbon Strategy90 renewed in 2000, which sets two priority objectives: economic growth and employment, in compliance with the objectives of sustainable development91 and Community Strategic Guidelines. At the national level, these are: The Country’s Development Strategy for the years 2007-2015, National Strategic Reference Framework for the years 2007-2013 and National Reform Programme for the Implementation of the Lisbon Strategy for the years 2005-200892.
152. The IE OP meets the assumptions of the Lisbon Strategy adding to the implementation of its objectives due to designation of 90% of the financial allocation for measures in the following areas: R&D, innovations, information and communication technologies.
153. The IE OP is complementary to Community documents developed within the 2007-2013 financial perspective: the 7th Framework Programme for Research, Technological Development and Demonstration Activities for the years 2007-201393 and the Competitiveness and Innovation Framework Programme for the years 2007-201394.
154. The basic strategic document which unifies assumptions of the renewed Lisbon Strategy and of the Cohesion Policy for the years 2007-2013 is the Community Strategic Guidelines (CSG)95. Within the framework of the CSG, the Commission proposed to focus intervention measures of the Cohesion Policy on the objectives of the renewed Lisbon Strategy, namely on stimulating growth of economy competitiveness and on increasing the employment level. In the CSG, the Cohesion Policy goals, meant to be attained at the Community level, are defined as follows: making Europe and its regions a more attractive place to work and invest, development of knowledge and innovativeness for economic growth and creation of a substantial number of good and permanent jobs.
155. The national document to which the IE OP directly refers is NSRF. Its objective was defined as creating conditions for increasing competitiveness of the Polish economy based on knowledge and entrepreneurship, ensuring a growth of the employment level and enhancing social, economic and territorial cohesion of Poland96.
90 An agenda of economic and social renewal for Europe, COM (2000) 7, Brussels, 28 February, 2000. 91 The basic document which describes the assumptions of the renewed Lisbon Strategy is the Integrated Package of Guidelines for the years 2005-2008, i.e. General Guidelines for the Economic Policy and Guidelines on Employment united in one document, Growth and Employment – Integrated Guidelines for the years 2005-2008, COM (2000) 141, Brussels, April 2005. 92 The document was adopted by the Council of Ministers on 27 December 2005. 93 Proposal for a Decision of the European Parliament and of the Council concerning the Seventh Framework Programme of the European Community for Research, Technological Development and Demonstration Activities (2007 to 2013), COM (2005) 121 final, Brussels, April 2005. 94 Proposals for a Decision of the European Parliament and of the Council establishing a Competitiveness and Innovation Framework Programme (2007-2013), COM(2005) 121final, Brussels, 6 April 2005. 95 Cohesion Policy in Support of Growth and Employment: Community Strategic Guidelines 2007-2013, Communication from the Commission, COM (2005) 0299, Brussels, September 2005. 96 National Strategic Reference Framework 2007-2013 supporting economic growth and employment –draft approved by the Council of Ministers on 14 February 2006.

58
156. The objective formulated in this way calls for concentrated efforts aimed to increase the competitiveness of the Polish economy through improving its innovativeness97. It is necessary to improve the innovativeness of enterprises in all its areas, that is with regard to products, both manufactured goods and services provided, technologies and business processes, internal and external alike, marketing strategies and methods, including business models, and organisation, including re-engineering of business processes.
157. Innovations are the key factor contributing to creation of new, better workplaces, in particular of workplaces based on knowledge, which is necessary at the moment, e.g. because of the growing number of graduates of higher schools in Poland. Innovations contribute to creation of new workplaces based on knowledge in two ways.
158. Firstly, innovations lead to improvement of productivity and effectiveness of enterprises and to a growth of satisfaction of their clients, in this way strengthening their competitive position on the market. At present, technologically advanced countries meet these objectives through, first of all, innovations consisting in unconventional information gathering and processing, as well as in use of their knowledge which directly results in creation of workplaces based on knowledge. Secondly, innovations are a source of new types of services, both in production and in widely understood consumption. New types of services open new markets and new opportunities for economic activity, which again adds to creation of new workplaces.
159. Innovations in the enterprise sector should contribute to reduction of the pressures on the natural environment, both locally – through improved effectiveness of the use of renewable and non-renewable resources, reduction of water and air pollutants and non-recyclable waste, and globally – through improvement of the effectiveness of energy use which reduces emission of “greenhouse gases”. Wherever possible, it is expected that innovative changes in presently used systems and devices will lead to reduction of pressures on the environment, and new products or services will be implemented in such a way as to comply with the requirements in the area of environmental protection and effective use of resources, especially energy.
160. The implementation of the IE OP should add to a better use of environmental technologies, through, for example, stimulating scientific research and diffusion of environmentally-friendly technologies. It is particularly important to promote environmentally-friendly products and services on the Single European Market and to support export of such products and services.
161. Innovations, especially those related to application of new information and communication technologies in the area of organisation and management, are an indispensable element of the transformation of the Polish economy into an electronic economy based on knowledge and of the transformation of the Polish society into an information society which can enjoy a better standard of living. On the basis of an analysis of the needs of the Polish economy presented in the diagnosis, as well as on the basis of an analysis of strategic objectives of the abovementioned documents, the main objective of the programme has been identified, namely:
97Compare footnote 3.

59
Development of the Polish economy on the basis of innovative
enterprises
162. The objective will be achieved through measures that together constitute a comprehensive process which is one of the most important elements that support the country’s socio-economic development. The components of this process include investments in human resources and investments in the R&D area which will provide better opportunities for high quality development works resulting in effects that may be used in the economy. These effects will add to establishment of new innovative enterprises, the development of which will be supported by providing capital for investments in innovations and by mutual cooperation and activities of numerous business support institutions. In addition, support will be provided for their expansion on international markets through promotion and information activities. Meeting the main objective with the use of all the said elements will be more effective thanks to application of information and communication tools.
163. In the context of the implementation of the renewed Lisbon Strategy, it is necessary to provide basis for a stable economic growth that will be compliant with the principles of sustainable development. In the area of the environment, emphasis will be placed on activities that are beneficial to both the economy and the environment, in this way implementing the win-win strategy.
164. In order to monitor the progress of the implementation of the measures aimed at achieving the main objective of the IE OP, the following indicators have been adopted.
165. Monitoring indicators for the main objective of the IE OP
Indicator Indicator base value
Assumed value of the indicator in the target year
Frequency of indicator measurement
Source of data
Share of enterprises financing innovative activities in industrial enterprises in total98
39% (2004)
60% Every year GUS
Share of sold production of new and modernised products in the total sold production of the industry99
19.6% (2004)
32% Every year GUS
Share of sold production of new and modernised goods in the total sold production of goods in the service sector
7.4% (2003)
15% Every two years GUS
Amount of outlays on innovative activities in the industry (industrial processing section, in PLN million)100
13,847.5 (2004)
16,600 Every two years GUS
98 The data refers to economic operators employing over 49 people. 99 The data refers to economic operators classified, according to the Polish Classification of Activities (PKD), to the following sections: C – Mining, D – Industrial Processing and E – Electricity, Gas and Water Supply which employ over 49 persons. 100 The data refers to economic operators employing over 49 people.

60
Amount of outlays on innovative activities in the service sector (in PLN million)101
9,318.2 (2003)
11,200 Every two years GUS
166. The implementation of the IE OP will contribute to establishment of an economy based on knowledge, to support for enterprises at early stages of development and those introducing innovative technological and organisational solutions, to strengthening of cooperation among enterprises, business support institutions and scientific entities, also through establishing the basis and development of information society.
4.2 Detailed objectives
167. The IE OP is compatible with The Country’s Development Strategy for the years 2007-2015102 (SRK) that sets out priorities in the area of socio-economic development. The objectives of the IE OP refer directly to Priority 1 Improvement of competitiveness and innovativeness of the economy of the Strategy, primarily in the following areas: entrepreneurship development, improvement of access to external sources of financing of investments, improvement of the technological level of the economy through increased expenditures on R&D and innovations, development of information society through informatisation of the relations between business and the public administration, and development of the service sector.
168. The detailed objectives of the IE OP fit in with the two priorities of National Reform Programme for the years 2005-2008: Entrepreneurship development and improvement of competitiveness of enterprises. The priorities and support instruments operating within the IE OP are a reply to the challenges identified in the National Reform Programme with regard to support for the R&D area, development of innovation market and institutional environment assisting in cooperation between the R&D area and the economy, with regard to improvement of the external financing system for innovative undertakings, support system for economic promotion of Poland and ICT development in the economy and administration. At the same tame, they constitute a complement to the measures of the strategy with regard to improvement of regulations quality, simplification of administrative procedures and reduction of economic activity costs, improvement of economic judiciary and completion of the main privatisation processes.
169. At the same time, the scope of the IE OP meets the challenges identified at the European Summit in spring 2006 with regard to improvement of investments in knowledge and innovations and boosting the potential of enterprises, especially SME, through concentration of support on undertakings that support establishment, transfer and diffusion of innovative undertakings in the economy and creation of conditions that facilitate establishment and development of SME.
170. The IE OP is one of the instruments aimed at performance of the tasks set out in Directions of Improvement of the Economy’s Innovativeness for the years 2007-2013, in particular with regard to: Research for the Economy, Capital for
101 The data refers to economic operators employing over 9 people 102 The Country’s Development Strategy for the years 2007-2015 was adopted by the Council of Ministers on 29 November 2006.

61
Innovations, Infrastructure for Innovations, Intellectual Property for Innovation and, to a smaller extent, Staff for Modern Economy.
171. The objectives that should be reached at the national level and simultaneously refer to the intervention of the IE OP are also set out in the following documents: Strategy for Development of Science in Poland until 2013 and a prospective forecast covering the period up to 2020103, Assumptions for the State Policy in the Area of Science, Technology and Innovativeness until 2020104, draft Strategy for Development of Tourism in the years 2007-2013105 and Directional Strategy for informatisation of Poland until 2013 and a prospective forecast covering the period up to 2020106.
172. The diagnosis of the situation of the science and enterprise sectors and the description of the cooperation between these two summarised in the SWOT analysis, as well as the analysis of strategic documents, allowed for formulation of the following detailed objectives contributing to the development of the Polish economy based on innovative enterprises:
1. Improvement of innovativeness of enterprises.
2. Improvement of competitiveness of Polish science.
3. Strengthening of the role of science in economic development.
4. Increasing the share of innovative products of the Polish economy in the international market.
5. Creation of permanent and better workplaces.
6. Growth of the use of information and communication technologies in the economy.
173. The objectives of the IE OP are compatible with the components of the Convergence Objective set out in the Regulation of the European Parliament and the Council on the European Regional Development Fund107 regarding, in particular: research and technological development, innovation and entrepreneurship, information society, tourism and support for SME promoting sustainable production models.
174. At the same time, the implementation of the objectives of the IE OP will contribute to the attainment of the horizontal detailed objective of the NSRF: Improvement of competitiveness and innovativeness of enterprises, especially in the manufacturing sector of high added value and development of the service sector. The objective will be also implemented by intervention of Regional Operational Programmes (ROPs), the Human Capital Operational Programme, the Eastern Poland Development
103 The document was adopted by the Council of Ministers on 29 June 2005. 104 The document was adopted by the Council of Ministers on 14 December 2004. 105 The document was adopted by the Council of Ministers on 21 June 2005. 106 The document was adopted by the Council of Ministers on 29 June 2005. 107 Regulation (EC) No. 1080/2006 of the European Parliament and the Council of 5 July 2006 on the European Regional Development Fund Regulation and repealing Regulation (EC) No. 1783/1999, OJ L 210/1 of 31 July 2006.

62
Operational Programme and, to a smaller extent, the Infrastructure and Environment Operational Programme, as all they are compatible with the IE OP.
175. The implementation of this objective of the NSRF will assume concentration of the structural funds on the aims favouring an increase of the competitiveness of the Polish economy and contributing to strengthening of the IE OP “growth engines” (as innovative enterprises have been considered in the IE OP) through creation of a positive institutional environment for their development, including establishment of an information society.
176. The intervention envisaged within the IE OP will contribute to the implementation of the remaining objectives of the NSRF: “improvement of the quality of public institutions services and extension of partnership mechanisms”, “improvement of the quality of human capital and improvement of social cohesion”, “development and modernisation of technical infrastructure of fundamental importance for growth of competitiveness of Poland”, and “an increase of competitiveness of Polish regions and preventing their social, economic and territorial marginalisation”.
4.3 Strategy for implementation of the detailed objectives
177. Within the IE OP, support will be provided for activities in the area of product (goods and services), process and organisational innovations in the production and service sectors, which directly or indirectly contribute to creation and development of innovative enterprises. Support will be also provided for innovativeness with high potential for diffusion108, whereas innovativeness with little potential for diffusion will be promoted and supported within ROPs and the Eastern Poland Development Operational Programme.
178. Support will be provided also for investments of enterprises in R&D infrastructure, which should positively influence the growth of outlays in this area.
179. Emphasis will be placed on financing of both development of the production sector and of market services, with the latter being a perfect opportunity for the country’s development. At the moment, off-shoring services in Poland experience a boom, mainly due to the advantageous cost/quality ratio. However, Poland should not build its competitive advantages on the basis of low cost of services, but on its highly qualified human resources, high quality of its services and high quality research resources. Therefore, emphasis will be moved from development of the typical off-shoring services towards high quality R&D services based on highly qualified human resources.
180. Since it is necessary to reconcile productivity growth, restructuring processes of the economy and, at the same time, to create new workplaces, it is advisable to direct the support provided within the IE OP towards undertakings with considerably high innovative potential that create new competitive goods and services. Concentration
108 The level of diffusion describes potential range of the given innovation which, following its first introduction in one enterprise, is later absorbed in other enterprises, regions, countries and on other markets through market channels (acquisition of tangible assets (machines and equipment) and intangible assets (software, technical services, counselling and training services, etc.)) and non-market channels (imitation, adaptation, etc.). Only product innovativeness (with regard to goods and services) leads to diffusion of innovation through market channels, since only this type of innovativeness is carried out to meet direct needs of the clients of innovative enterprises. In other words, if an innovative product (a good or service) is manufactured by one company, it is later sold to other enterprises which, due to its implementation, become innovative themselves.

63
of support on undertakings in the R&D area and innovations will accelerate the process of establishment of a knowledge-based economy in Poland.
181. Because of limited public resources, the IE OP will support projects with high added value109 that may bring the most desirable economic results. Therefore, it has been assumed that within the IE OP support will be provided for undertakings that add to establishment and development of innovative companies and to introduction of new innovative solutions, both technological and organisational. Besides, support will be given to highly innovative projects and to projects of high value, including those related to creation of new and permanent workplaces. A large part of projects to be supported within the IE OP will be also co-financed from private resources which will allow for financing of a large number of projects and add to better effectiveness of the implementation of the IE OP’s objectives.
182. Support envisaged within the IE OP will be awarded regardless of the sector to which it will be related to (in compliance with the restrictions arising from the scope of the intervention of the ERDF and from state aid principles) and it will be complementary to the measures of 16 ROPs, the Human Capital Operational Programme, the Infrastrukcture and Environment Operational Programme and the Eastern Poland Development Operational Programme.
183. Intervention within the IE OP is in accordance with the provisions of ERDF, pursuant to the regulation (EC) No 1080/2006 of the European Parliament and of the Council of 5 July 2006 on the European Regional Development Fund and repealing Regulation (EC) No 1783/1999 and with the regulations concerning State Aid. The intervention is also complementary to the Operational Programme for Agricultural Areas Development, 2007-2013 and to the Operational Programme for Fishery and Riparian Areas Sustained Development, 2007-2013.
184. The implementation of the measures resulting from the detailed objectives of the IE OP will be compliant with the directions of Community policies regarding environmental protection, equal opportunities, employment, creation of information society and sustainable development.
4.3.1 Detailed objective 1. Improvement of innovativeness of enterprises
185. Objective 1 Improvement of innovativeness of enterprises will be achieved due to various tools contributing to improvement of the role of the innovative solutions in the enterprise sector in Poland and at the same time contributing to enhancement of the role of enterprises in establishment of a knowledge-based economy.
186. The diagnosis of the Polish enterprise sector and the SWOT analysis show that the level of innovativeness of Polish enterprises is rather low which is reflected in, for example, a little share of advanced technologies in the production sold, insufficient saturation of the enterprise sector with new technologies, the low level of resources for R&D coming from the enterprise sector and the low level of entrepreneurs’ awareness regarding industrial property rights.
187. Moreover, the SWOT analysis showed that one of the weaknesses of enterprises in Poland is their low propensity for cooperation. Whereas cooperative undertakings of enterprises, mutually interconnected by a common economic objective, together with specialised suppliers, service providers, firms running businesses in similar
109 Added value is understood as additional value resulting from the implementation of the project that would not be generated in the given period without state support.

64
sectors, as well as institutions related to them (including scientific entities), are the most effective instruments for improvement of competitive position through transfer of new solutions.
188. Therefore, support instruments of the IE OP will make it easier for entrepreneurs to establish, transfer and popularise new solutions, both among entrepreneurs and business support institutions.
189. Limited access to external sources of financing, resulting from highly restrictive formal requirements that must be met to get a loan for risky undertakings, is a serious obstacle in the process of innovation implementation. Besides, venture capital funds that operate on the market do not invest in innovative undertakings of relatively low value because of relatively high costs related to servicing such investments.
190. Furthermore, basic indicators describing Polish enterprises show that they are much weaker in terms of technology, capital and personnel than enterprises operating in other EU Member States with which they compete on the SEM and on global markets.
191. In the light of the said observations, it seems necessary to undertake activities aimed at encouraging entrepreneurs to implement innovative undertakings, both at early stages of development and at later stages. This calls for development of various support instruments, especially for SMEs, in particular for those at early stages of development, and for those introducing new technologies of high importance to the whole economy.
192. The said observations make Objective 1 dedicated to enhancement of innovativeness of enterprises due to strengthening of the role of innovations (related to products, processes and organisation) in the production and service sector, to stimulation of investment outlays, including funds spent on R&D works in enterprises, as well as enhancement of business support institutions, especially of the science sector. The implementation of Objective 1 will also entail support for creation of a complex system of external financing for innovative activity of enterprises, especially at early stages of development, which will add to development of SME potential.
193. Monitoring indicators for Objective 1
Indicator Baseline value Expected value in
the target year Frequency of measurement
Source of data
Share of innovative enterprises in the industry110
45.6% (2004)
50% Every two years GUS
Share of innovative enterprises in the service sector
22.0% (2003)
60% Every two years GUS
Share of business spending on R&D/GDP (BERD/GDP)
0.16% (2004)
1.15% Every year EUROSTAT
Share of high-tech products in the total sold production of the industry (in %)111
30.1% (2004)
37.5% Every year GUS
110 The data refers to economic operators employing over 49 people. 111 The data refers to entities classified to the section “Industrial Processing” employing over 49 people.

65
4.3.2 Detailed Objective 2. Improvement of competitiveness of Polish science
194. Implementation of Objective 2. Improvement of competitiveness of Polish science is to enhance the science sector through, on the one hand, providing appropriate research base and, on the other hand, directing already available resources towards research in the disciplines of priority importance for the country’s development.
195. Competitiveness of science is understood as the ability to solve research problems at the level recognised as high by international scientific environments, and as the ability to develop solutions that can be put in socio-economic practice (in enterprises, education and public administration). In particular, it is demonstrated in the number of international (especially European) projects in which Polish scientists participate and in the amount of financial means obtained for implementation of these projects. Such state can be achieved only if access to high quality research personnel and base is guaranteed.
196. The SWOT analysis revealed many weakness of the Polish science sector. A very low level of expenditure on research and development is observable, as well as predominating budgetary financing which additionally does not foresee much money for basic research. Another problem is the limited availability of financing for priority development directions.
197. Additionally, the analysis conducted shows that scientific equipment is frequently worn-out and obsolete because of limited investments in this area. Another feature of Polish science is unfavourable R&D staff age structure resulting, in particular, from insufficient incentives for young people to take up scientific careers and the lack of adjustment of the competence of personnel to the needs of the modern economy.
198. Implementation of this objective is to improve the competitiveness of Polish scientific research and development works thanks to concentration of financing of scientific research on priority directions, as well as thanks to providing better equipment for scientific entities, including specialist research devices and IT infrastructure. Improvement of the quality of scientific workers will also be stimulated due to rejuvenation of scientific personnel achieved through involvement of students in scientific research and support for doctoral students, as well as through making use of international good practices and international mobility. These efforts will be accompanied by activities aimed at consolidating entities involved in R&D works.
199. It must be stressed that the implementation of this objective will be complementary to the planned changes in the Polish science system set out in the document entitled Introductory Assumptions for the Changes in the System of Scientific Research and Development Works112. The most significant changes include a reform of public support for the R&D sector and innovations, as well as increasing public funds for science and activation of non-budgetary sources of financing. These changes will be concerned with:
i. Changes in the rules for awarding subsidies for basic statutory activity consisting in concentration of financing on the best scientific entities which
112 Wstępne załoŜenia do zmiany systemu badań naukowych i prac rozwojowych. The document was adopted by the Council of Ministers on 28 March 2006.

66
should result in consolidation of scientific entities and improvement of those with the largest potential. These changes should be completed in summer 2006 after evaluation of scientific entities. From 2007, subsidies will be granted to entities from categories 1 and 2 (there are five categories altogether). Financing will be also related to implementation of tasks of key importance in the area of the state’s scientific policy. Changes will be also introduced in the area of the control system of these tasks performance.
ii. Establishment of the National Research and Development Centre (NCBR) being the coordinator and management centre for research programmes in the strategic areas set out in the government’s policy. The activity of the NCBR will add to concentration of public funds on tasks of key importance to the state, especially on financing of a limited number of large R&D projects, strengthening cooperation between the science sector and the economy, as well as on restructuring processes of scientific entities and their consolidation.
iii. Amendments to the Act of 8 October 2004 on the Rules for Financing of Science and executive acts related to this act, so that to facilitate the procedures of application for budgetary funds on R&D works which will allow for their more effective and efficient spending.
200. Monitoring indicators for Objective 2
Indicator Baseline value Expected value
in the target year Frequency of measurement
Source of data
Share of total outlays on R&D in GDP (GERD/GDP)
0.56% (2004)
To be completed113
Every year GUS
Poland’s financial share in projects financed within EU FP
1.3% (2005)
2.0% Every year National Contact
Point (KPK) Share of Polish publications cited on the Philadelphia list in the total number of Polish publications
14.16% (2005)
25% Every year OPI
4.3.3 Detailed Objective 3. Strengthening of the role of science in economic development
201. Achievement of Objective 3. Strengthening of the role of science in the economic development will contribute to enhancing the economy’s innovativeness, through enlarging the number of commercialised R&D results and putting them into practice by entrepreneurs.
202. Knowledge, innovation and human capital are the driving forces of economic growth and add to the society’s development. The Polish economy, in order to become a competitive knowledge based economy, must improve its knowledge potential through scientific research, education and innovations. The IE OP assumes that “the knowledge triangle” consisting of research, education and innovations will also be the basis for science development strategy so that it might become a driving force of the country’s economic development. “The knowledge triangle”, along with a new approach to innovation (open innovation114) therefore assumes wide cooperation of
113 The value of the indicator will be given after the decision is taken by the Council of Ministers with regard to the scope at the level of the National Strategic Reference Framework, 2007-2013. 114 This strategy consists in finding and compiling new ideas, which are complementary to already existing research and development projects, as well as in removing geographical and technological barriers that pose obstacles to development of new products and markets.

67
scientists and entrepreneurs, and, consequently, enhancement of the role of science in the economy.
203. The SWOT analysis conducted showed substantial unwillingness for cooperation between companies and scientific entities. This results, for example, from the lack of compliance of R&D activities with the needs of entrepreneurs stemming from scientists’ reluctance to take up such activities. On the other hand, entrepreneurs are not aware of potential profits of innovativeness growth achieved due to implementation of new technologies which result from R&D works. Partly, another reason for such a situation is a high risk attributed to such activities, which adds to entrepreneurs’ reluctance to invest their limited funds in such undertakings. Therefore, the technological gap between Poland and leading EU Member States has been widening.
204. The factors presented above justify directing Objective 3 towards enhancing the effects of synergy that may be achieved through cooperation of scientific entities, entrepreneurs and business support institutions.
205. Objective 3 will be implemented through co-financing of projects concerning applied research, development works, industrial and pre-competitive research as well as development projects. It will be also implemented through support for acquisition of industrial property rights, commercialisation of R&D results and their application in the economy. These actions will be assisted by activities aimed at development of innovative business support institutions and infrastructure for transfer of new technologies from research centres to enterprises.
206. Monitoring indicators for Objective 3
Indicator Baseline value Expected value
in the target year Frequency of measurement
Source of data
Share of business spending on R&D in total outlays on R&D
22.6% (2004)
40% Every year GUS
Number of people employed in R&D in enterprises in relation to total employment in R&D activity*
7.3%
20% Every year GUS
Number of patents granted to Polish residents in the EPO and USPTO
21 (2002)
240 Every year GUS
* As at 31 December.
4.3.4 Detailed objective 4. Increasing the share of innovative products of the Polish economy in the international market
207. Objective 4. Increasing the share of innovative products of the Polish economy in the international market will be implemented through, for example, establishment of a coherent system for economic promotion of Poland, which should indirectly contribute to a growth of investment outlays in enterprises and through the improvement of their activity thanks to strengthened economic relations with the international market.
208. The SWOT analysis shows that the share of highly processed products and high-tech goods in Polish exports is low, the Polish economy is not sufficiently internationalised, and the “Poland” brand is not sufficiently promoted, which additionally hinders the activities of Polish entrepreneurs on international markets. Strengthening of entrepreneurs that would lead to improvement of the quality of

68
their goods and services (with the use of the instruments from other priority axes) calls for promotional activities which would make Polish brand and company names more recognisable. Strengthening of economic ties between Poland and its foreign partners (through increased foreign trade turnover, increased number of foreign tourists visiting Poland and foreign investment inflow) is a prerequisite for improvement of the competitive position of the Polish economy.
209. Simultaneously, it is necessary to improve tourist products of supra-regional importance which will strengthen their competitive position on the international market and will add to a growth of the number of foreign tourists, and at the same time to attractiveness of Poland. Besides, the level of the development of social infrastructure, including tourist infrastructure, is one of the factors that reflect the attractiveness of investment locations. Therefore, intervention in this area is indispensable.
210. In addition, formulation of Objective 4 is even more justified by the fact that both inflow of investment and intensified commercial exchange contribute significantly to diffusion of innovative solutions and thereby to economic growth.
211. At the same time, the implementation of Objective 4 depends on the other objectives of the IE OP which contribute to modernisation of products and services offered by enterprises operating on the Polish market and consequently enables them to improve their competitive position on the SEM and on foreign markets.
212. Furthermore, the implementation of Objective 4 will add to improvement of the product and service portfolio of enterprises operating in Poland, to support for their participation in global economic turnover and to creation of conditions for improvement of the level of investments, including foreign investments, as well as to making tourism more intense in Poland.
213. Monitoring indicators for Objective 4
Indicator Baseline value Expected value in
the target year Frequency of measurement
Source of data
Share of high technology goods in total exports
2.3% (2004)
3.7% Every year GUS
4.3.5 Detailed Objective 5. Creation of permanent and better workplaces
214. Objective 5. Creation of permanent and better workplaces was formulated in the context of the challenges posed by the implementation of the renewed Lisbon Strategy and the cohesion policy. The implementation of this objective is fundamental to the Polish economy since the high rate of unemployment and unfavourable structure of employment (high share of agriculture and declining industries) constitute one of the key obstacles restricting socio-economic development of the country and hampering an increase of innovativeness of the Polish economy. This objective is horizontal and its accomplishment depends on progresses made in the implementation of the remaining detailed objectives of the IE OP.
215. It is assumed that comprehensive support within the IE OP for innovative undertakings, such as R&D works, investments, counselling and training necessary for realisation of investments, as these activities strengthen competitive position of enterprises on the SEM and international markets, will contribute to creation of new

69
permanent workplaces. At the same time, the implementation of the objectives of the IE OP should contribute to generating a demand for jobs requiring specialist skills and knowledge, which may lead to changes in the employment structure (creation of jobs in modern sectors of the economy, including the service sector), and simultaneously will enhance modernisation processes in the Polish economy.
216. The IE OP aims at focusing support on creation of permanent and better workplaces, in particular in the sectors that are carriers of a knowledge-based economy, which include, for example, science, research and development activities, branches of the industry related to advanced technologies, business services related to knowledge-based economy and the information society services sector.
217. Monitoring indicators for Objective 5
Indicator Baseline value Expected value in
the target year Frequency of measurement
Source of data
Number of new workplaces created as a result of projects implemented within the IE OP (in total and broken according to sex) Total/Women/Men
0 64,500/25,800/38,700 Every year
Authorities responsible for
the implementation
of the IE OP measures
4.3.6 Detailed objective 6. Growth of the use of information and communication technologies in the economy
218. Objective 6 will be implemented with the use of instruments that add to the growth of use of information and communication technologies in the economy by the state administration, enterprises and citizens, which will positively influence the development of the Polish economy and improve the position of Poland among European Union Member States with respect to ICT use.
219. Creation of conditions for the development of digital services and contents is the key element of successful establishment of an information society. To do so, it is necessary, for example, to provide access to information resources of state registers by the public administration. Thanks to it, it will be possible for citizens to use electronic means of communication to contact appropriate offices, which will provide efficient services.
220. Support for use of new technologies in enterprises will add to stimulation of innovativeness in the SME sector and in micro-enterprises which, consequently, will add to their efficiency, quality and competitiveness, and will open international markets to them through support for implementation of eBusiness solutions in the operational and organisational area.
221. Activities that support creation of enterprises providing eServices and access to digital contents will stimulate local entrepreneurship and innovativeness in the sector of electronic knowledge-based economy through opening the market of digital contents and services, and consequent creation of new workplaces with the potential for development.
222. The growth of use of new technologies is necessary, in the first place, in the public administration which will, thanks to this, improve effectiveness, quality and efficiency of its activities. Establishment of electronic administration will require re-engineering of the processes it implements in the areas where the administration meets with enterprises and citizens, and between various levels of administration, in

70
compliance with the opportunities offered by contemporary information and communication technologies.
223. Only 16%115 of Polish households have a broadband access to the Internet, which considerably reduces opportunities to use eServices offered by the public administration and enterprises. Such a low level of access to the Internet preserves digital exclusion of citizens. That is why support for access to broadband Internet in households, especially in the areas of little attractiveness for commercial operators and in households with low incomes, will contribute to elimination of differences not only in the territory of Poland, but it will also improve Poland’s position in this respect among European Union Member States.
224. Monitoring indicators for Objective 6
Indicator Baseline value Expected value in
the target year Frequency of measurement
Source of data
Expenditure on information and telecommunication technologies (% of GDP)
7.2
(2004)
8.5
Every year
EUROSTAT
225. The structure of detailed objectives and priority axes for the implementation of the IE OP has been presented in Figure 4.3.1.
115 Use of Information and Communication Technologies in Enterprises and Households, GUS, Warszawa, 2005.
71
Figure 4.3.1.
Main objective: Development of the Polish economy on the basis of innovative enterprises
Priority Axis 1. Research and development of new technologies
Priority Axis 2. R&D infrastructure
Priority Axis 3. Capital for innovation
Priority Axis 4. Investments in innovative undertakings
Priority Axis 5. Diffusion of innovation
Priority Axis 6. Polish economy on the international market
Priority Axis 7. Information society establishment and development
Priority Axis 8. Technical assistance
Priority Axis 1. Research and development of new technologies
Priority Axis 2. R&D infrastructure
Priority Axis 4. Investments in innovative undertakings
Priority Axis 5. Diffusion of innovation
Priority Axis 8. Technical assistance
Priority Axis 1. Research and development of new technologies
Priority Axis 2. R&D infrastructure
Priority Axis 4. Investments in innovative undertakings Priority Axis 5. Diffusion of innovation
Priority Axis 8. Technical assistance
.
Priority Axis 1. Research and development of new technologies
Priority Axis 2. R&D infrastructure
Priority Axis 3. Capital for innovation
Priority Axis 4. Investments in innovative undertakings
Priority Axis 5. Diffusion of innovation
Priority Axis 6. Polish economy on the international market
Priority Axis 8. Technical assistance
Priority Axis 1. Research and development of new technologies
Priority Axis 3. Capital for innovation
Priority Axis 4. Investments in innovative undertakings Priority Axis 5. Diffusion of innovation
Priority Axis 6. Polish economy on the international market
Priority Axis 8. Technical assistance
Detailed Objective 1: Improvement of innovativeness of enterprises
Detailed Objective 2: Improvement of competitiveness of Polish science
Detailed Objective 3: Strengthening of the role of science in economic development
Detailed Objective 4: Increasing the share of innovative products of the Polish economy in the international market
Detailed Objective 5: Creation of permanent and better workplaces
Detailed Objective 6: Growth of the use of information and communication technologies in the economy
Priority Axis 2. R&D infrastructure
Priority Axis 4. Investments in innovative undertakings Priority Axis 7. Information society establishment and development
Priority Axis 8. Technical assistance

72
5. PRIORITY AXES IMPLEMENTED WITHIN THE PROGRAMME
5.1 Priority Axis 1. Research and development of new technologies
226. Objective of the priority axis: The objective of the priority axis is to improve the significance of the science sector in the economy through R&D activity in the directions recognised as priorities for the social and economic development of the country.
227. Monitoring indicators for the priority axis
Indicator Baseline
value
Estimated value of the indicator
(in the target year)
Frequency of measurement
Source of data
Share of outlays on R&D in total outlays on innovative activities in industrial enterprises*
7.53% 15% Every year GUS
Share of spending on R&D related to the needs of enterprises (GERD)**
26.4% 48% Every year Authority responsible for the implementation of the
IE OP measures/GUS
Number of people employed in R&D (including women)*** as a share in the total number of employees
127,365
(55,303)
0.92%
(2004)
250,000
(125,000)
1.80%
Every year GUS / EUROSTAT
* The data refers to economic operators employing more than 49 people.
** The expenditures on R&D works related to the needs of enterprises are a sum of public co-financing of goal-oriented projects, expenditures on development projects, commissioned projects and expenditures of enterprises on R&D.
*** As at 31 December.
228. Justification for the selection of the priority axis: Implementation of the economy development strategy on the basis of innovative enterprises calls for tightened cooperation between the science sector and enterprises. The Polish science sector is not sufficiently developed and therefore it does not provide sufficient support for entrepreneurs operating in a more and more competitive international environment. This leads to preservation of the technological gap between Poland and the most innovative economies of the world, including some European Union Member States. Therefore, it is indispensable to strengthen the R&D sector in order to create appropriate research potential adjusted to development needs of the country. Simultaneously, an intensification of science and business cooperation should be pursued, also through more efficient use of existing instruments and through introduction of new effective mechanisms of public intervention. The cooperation between science and business will be intensified by application of instruments that, on the one hand, may encourage entrepreneurs to take up activities in favour of their development based on R&D results and, on the other hand, may encourage scientists to take up scientific research and development works compliant with the needs of entrepreneurs. The implementation of this priority axis should adjust the supply of new technological solutions to the demand for them and, consequently, it should

73
probably increase the demand of the economy for high technologies based on R&D results.
229. Description of the priority axis: Within this priority axis financing will be provided to forecasting research directions that may best influence the pace of socio-economic development of the country. Such forecasts will be made with the use of the foresight method, which is very popular in other countries, consisting in a public debate on the most important future needs of the society and the economy involving all the interested parties (representatives of non-governmental organisations, entrepreneurs, politicians, scientists, the media). Foresight will be conducted at the national level (setting research directions for the whole country), as well as at the level of particular regions and sectors of the economy.
230. The priority axis covers support for scientific research and development works that will contribute to the establishment of a knowledge-based economy performed by scientific and industrial consortia. Support will be also provided for large multidisciplinary and transdisciplinary research projects compliant with thematic priority axes set out in item 229 and stemming from foresight.
231. Support will be provided for changes in the age structure of human resources of the science sector due to involvement of students and doctoral students in research projects in the areas of key importance for the country’s economic development, as well as through support for research projects being the basis for doctoral dissertations. Transfer of best practices to Poland, also in the area of cooperation between science and the economy is expected thanks to co-financing of research projects carried out in the Polish scientific entities by outstanding foreign scientists.
232. Moreover, support will be provided for development projects of applied nature, directed towards direct practical application for the needs of the sector/branch of the economy of high importance to the society. In the framework of the axis, support is designated for transfer of results of scientific and development works through co-financing of the costs of acquisition of industrial property generated in scientific entities based in Poland. Support will be also provided for feasibility studies related to implementation of goal-oriented projects planned for the implementation on the basis of the results of a development project.
233. The implementation of the priority axis will focus on support for investments of entrepreneurs in the area of R&D works through co-financing of projects covering technical, technological or organisational undertakings (applied research and development works) implemented by entrepreneurs, groups of entrepreneurs116 or other entities that are able to directly apply the results of the project in practice. The implementation of R&D activities of entrepreneurs within the said priority axis will be co-financed within the fourth priority axis.
234. Within the priority axis, support may also be given to such undertakings as European Institute of Technology+ (EIT+). It is a complex programme for education and innovativeness, developed and initiated in Wrocław, the key element of which is to place the seat of the European Institute of Technology in the city.
116 Projects will be implemented by entrepreneurs on their own or in cooperation with scientific entities and scientific consortia, and by scientific entities at the request of entrepreneurs.

74
235. Additionally, in order to support commercialisation of results of R&D works, each project implemented within the priority axis will be able to contain an element that promotes the given project or its results.
236. It should be stressed that within Priority Axis 1 support will be provided only for R&D projects belonging to the following thematic areas:
a) Info thematic group:
i. information and telecommunication technologies,
ii. intelligent, telecommunication and data communication networks of new generation,
iii. optoelectronics,
iv. computational sciences.
b) Techno thematic group:
i. new materials and technologies,
ii. nanotechnologies,
iii. designing specialised systems,
iv. mechatronics,
v. chemical technology and engineering.
c) Bio thematic group:
i. biotechnology and bioengineering,
ii. biological progress in agriculture and environmental protection,
iii. new medical products and techniques.
Thematic restrictions, however, will not apply to goal-oriented projects and application projects implemented by students and doctoral students (the main objective will be usefulness of research for economic activities).
237. Development projects (item 232) the themes of which will fit in with the said areas will be given a priority in the selection procedure, however projects which do not fit in with these areas will not be excluded from financing. The same applies to international doctoral studies.
238. It should be stressed that there is a possibility to correct the said priorities, in particular when the results of the National Foresight Programme are taken into account.
239. Under the priority, the following measures will be supported:
a) Identification of scientific research and development works directions in view of enhancing sustainable economic growth for raising life quality of the Polish society and rationalising funds available for scientific research by means of co-financing of projects related to:
i. Foresight Polska 2020 National Programme,
ii. preparation of strategies for development of specific areas of science and the economy,

75
iii. preparation of strategies for technology platforms operating in Poland with the use of the results of the foresight method;
b) co-financing of integrated, multidisciplinary research projects in the area of science and technology set out in the previous item (commissioned projects);
c) projects that make students and doctoral students interested in taking up scientific work covering:
i. application projects implemented by students and doctoral students in the priority areas for the economy development,
ii. projects in which students and doctoral students participate compliant with the priorities set out in item 230, implemented in the best research teams in Poland,
iii. international doctoral studies in Poland;
d) projects related to improvement of professional qualifications of scientific and research workers covering employment of outstanding scientist from abroad as project managers, on the basis of contracts with scientific entities;
e) establishment of and support for the European Institute of Technology+;
f) co-financing of research projects the results of which are intended for direct practical application and satisfying the needs of specific sectors of the economy or sectors of particular social importance (development projects);
g) support for protection of industrial property generated in scientific entities based in Poland as a result of R&D works co-financed from budgetary funds;
h) support for feasibility studies related to implementation of the results of goal-oriented projects planned on the basis of the results of a development project;
i) co-financing of projects that cover technical, technological or organisational undertakings (applied research and development works) carried out by enterprises, groups of enterprises or other entities that are able to directly apply the results of projects in practice (goal-oriented projects).
240. Under the priority axis, non-returnable support will be granted to the following groups of beneficiaries:
a) scientific entities;
b) scientific consortia and networks (including Centres of Excellence, Centres of Advanced Technologies as well as the European Institute of Technology+);
c) organisational units that deal with R&D works management and organisation,
d) Polish technology platforms,
e) entrepreneurs (especially SME),
f) scientists (especially young ones) and scientific teams,
g) students,
h) entities that implement foresight projects, e.g. entrepreneurs, scientific entities, public administration entities,
i) entities acting for the benefit of science – entities engaged in continuous efforts related to development, promotion and practical application of science and

76
supporting an increase of innovativeness of the economy, other than scientific research or development works,
j) National Centre for Research and Development (NCBR),
k) Foundation for Polish Science (Fundacja na Rzecz Nauki Polskiej - FNP),
l) minister in charge of science.
241. State aid: Some measures under the priority axis are subject to the principles of state aid. This refers to the projects related to:
a) support for implementation of scientific, scientific and technological and innovative policies of the state through co-financing of commissioned research or development projects,
b) support for development projects,
c) co-financing of development of feasibility studies,
d) support for implementation of goal-oriented projects.
242. Expected results of the implementation of the priority axis:
a) bigger share of R&D works related to the needs of entrepreneurs in R&D works implemented in scientific entities,
b) improvement of innovativeness of enterprises,
c) increase in the share of R&D expenditures in GDP, in particular business expenditures,
d) improvement of international competitiveness of Polish science.
243. Compatibility with other programmes implemented under the NSRF:
The priority axis is complementary to:
a) 16 Regional Operational Programmes with regard to:
i) co-financing of R&D works implemented by entrepreneurs; within ROPs financing will be provided for projects at the value below EUR 100,000 of co-financing; if the given ROP does not assume financing of the said projects, entrepreneurs will be able to apply to the Polish Federation of Engineering Associations – Supreme Technical Organisation (FSNT NOT);
ii) co-financing of improvement of human potential of science; within ROPs, co-financing will be awarded to students and doctoral students for implementation of research projects compliant with the priorities that stem from the RIS, grants will be awarded to scientists and support will be provided for implementation of doctoral dissertations in priority areas for the development of the region;
b) Eastern Poland Development Operational Programme;
c) Human Capital Operational Programme with regard to:
i) support for mobility between sectors,
ii) improvement of qualifications of the personnel of the R&D system in the area of research management and commercialisation of R&D works,

77
iii) support for students and workers of higher schools who intend to take up economic activity (spin-offs),
iv) popularisation of R&D and innovative activities,
v) intensification of cooperation between institutions of the education system and scientific entities,
vi) grants for doctoral students studying the areas of the key importance to the region.
244. Cross-financing117. Grants for students, doctoral students, persons undergoing post-doctoral placements or foreign scientist, to the extent necessary for the implementation of the project. The share of financing within this instrument will stand at 10% of the amount designated for the priority axis.
245. The budget of the priority axis (EUR million)
Total public contribution
ERDF National public funds Share of the priority axis in total IE OP allocation
1,314.27 1,117.13 197.14 13.53%
117 The functioning of cross-financing, according to Article 33 paragraph 2 of the General Regulation, Information Note No. 56, cross-financing is a mechanism of the so called flexible financing that in the years 2007-2013 allows for engaging resources from the ERDF in implementation of measures the scope of which normally falls within the EFS intervention. Cross-financing is aimed at facilitating implementation of one-fund operational programmes. This mechanism consists in admitting, within the framework of a priority and in duly justified cases, limited financing for a group of projects, individual projects or parts of projects belonging to the scope of assistance of another Fund, e.g. in the case of the IE OP – from the ESF. Cross financing is limited only to such actions that are necessary for implementation of a project or a group of projects, as well as those directly linked to a project or a group of projects. Regulation of the Council No. 1083/2006 limits the engagement of cross-financing to maximum 10% of the allocation at the level of priority. Expenditures on implementation of projects that use cross-financing will be eligible under the rules set out for the given fund in accordance with the intervention scope.

78
5.2 Priority Axis 2. R&D infrastructure
246. Objective of the priority axis: The objective of the priority axis is to increase competitiveness of Polish science due to consolidation and modernisation of scientific research and IT infrastructure of the best scientific entities operating in Poland.
247. Monitoring indicators for the priority axis
Indicator Baseline
value
Estimated value of the indicator
(in the target year)
Frequency of measurement
Source of data
Outcome indicators
Level of scientific and research equipment wear*
79.5% (2004)
50% Every year GUS
Share of budgetary and IE OP resources designated for acquisition of scientific and research equipment to be used by more than one entity** in the total amount of budgetary and IE OP resources designated for acquisition of R&D equipment
13.6%
(2005) 50% Every year
Authority responsible for the implementation of
the IE OP measures
*As at 31 December.
** In the framework of a formalised agreement.
248. Justification for the selection of the priority axis: The majority of Polish scientific entities have at their disposal obsolete equipment which extremely hampers advanced research. Another obstacle to high quality research work is dispersed infrastructure which leads to inefficient use of the existing research base.
249. Although IT research infrastructure in Poland is relatively new and regularly extended, there are still areas characterised by a low level of development. Moreover, the level of innovative solutions and IT applications used by particular entities is unsatisfactory.
250. The above-mentioned weaknesses show that there is an urgent need for extensive investments in R&D infrastructure. Modern research centres, equipped with the most up-to-date scientific devices, capable of taking up the most ambitious tasks in the R&D area, will make it possible to conduct high quality research and will allow for training scientific and technical personnel for the economy, science and education at level compliant with international standards. Moreover, such centres will contribute to faster implementation of new technological solutions by the Polish economy and society.
251. Construction of the said research centres is also vital for assuring active and increased participation of scientific entities and innovative firms in research programmes and activities aimed at establishing the European Research Area. Participation in these programmes and activities is one of the main ways for improving the Polish R&D area and the economy’s innovativeness, as well as for strengthening its competitiveness.

79
252. Moreover, thanks to concentration of funds on investments in the best scientific entities, the efficiency of use of public funds earmarked for R&D infrastructure, including IT infrastructure, should substantially improve.
253. Description of the priority axis: Within the priority axis, support will be provided for investments in scientific and research equipment, necessary buildings and structures made by centres with a high potential for research. A substantial part of the funds from Priority Axis 2 will be spent on the said infrastructural investments in a few (maximally up to over ten) large centres managed by scientific and industrial consortia. Support will be also provided for Large Research Infrastructure Objects.
254. Moreover, the priority axis is envisaged to co-finance restructuring processes that consolidate scientific entities, through transfer of construction of common modern research infrastructure.
255. Another type of support offered under the priority will be co-financing of necessary investments related to maintenance and development of IT infrastructure of science. It is also planned to develop scientific digital resources, especially creation and maintenance of a database containing information on the results of research projects and access to them.
256. Priority will be given to projects that will lead to providing infrastructure for implementation of scientific research and development works in the thematic areas set out in the description of Priority Axis 1 (item 236).
257. Because of the needs for trainings for personnel servicing new scientific and research infrastructure, infrastructural projects may contain elements that allow for acquisition of such skills. Additionally, there will be a possibility to support each of the projects implemented under the priority also with regard to its promotion, as well as to promotion of R&D results obtained with the use of the co-financed infrastructure.
258. Under the priority axis, the following measures will be supported:
a) development of high research potential centres, including these operating as scientific and industrial consortia118 and regional scientific and industrial consortia by means of co-financing of their research infrastructure development (e.g. in Advanced Technology Centres and laboratories providing specialist services for entrepreneurs, as well as in the EIT +),
b) development of R&D infrastructure in specialist laboratories, including those operating as scientific networks119 (e.g. Centres of Excellence),
c) support for projects implemented within the Polish Roadmap in the field of Large Research Infrastructure Objects (construction of buildings and research equipment),
d) projects covering investments related to creation of common research infrastructure of science,
118 A scientific and industrial consortium is a group of organisational entities, including at least one scientific entity and at least one entrepreneur, which takes up a joint undertaking, on the basis of an agreement, covering scientific research, development works or investments aimed at meeting the needs of scientific research or development works. 119 A Scientific network is a group of scientific entities with legal personality, which, on the basis of an agreement, take up organised cooperation related to continuous joint scientific research or development works for the development of scientific areas of the network.

80
e) projects in the area of maintenance and development of modern IT research infrastructure of science,
f) projects in the area of development of scientific digital resources,
g) projects in the area of development of advanced data communication services and applications for science.
259. Under the priority axis, non-returnable support will be granted to the following groups of beneficiaries:
a) scientific entities,
b) scientific networks and scientific and industrial consortia (including CE and CAT),
c) European Institute of Technology+,
d) organisational entities dealing with R&D works and organisation of such works,
e) higher schools,
f) leading units of metropolitan area networks (MAN),
g) High Performance Computing Centres.
260. State aid: No state aid has been designated within the priority axis.
261. Expected results of the implementation of the priority axis:
a) improvement of state of infrastructure and laboratory equipment of national research centres with high potential,
b) improvement of the level of competitiveness of Polish research centres,
c) widening and enriching the offer of research services provided by scientific entities for enterprises,
d) increasing transfer of R&D results to the economy,
e) improvement of the quality of Polish science management through creation of efficient mechanisms for access to information.
262. Compatibility with other programmes implemented under the NSRF:
The priority is complementary to:
a) 16 Regional Operational Programmes with regard to:
i) development of centres with high potential for research for investments at the value below EUR 1 million or at the value of EUR 1 million and above if they are on the list of ROP major projects,
ii) development of infrastructure in specialist laboratories for investments at the value below EUR 1 million or at the value of EUR 1 million and above if they are on the list of ROP major projects,
iii) regional projects in the area of maintenance and development of modern IT infrastructure of science,
iv) regional projects in the area of development of advanced data communication services and applications for science.
81
b) Eastern Poland Development Operational Programme – with regard to projects from the list of priority axis Modern economy.
263. Cross-financing: Each of the projects implemented within the priority axis will be allowed to contain elements covering trainings for employees servicing new scientific and research equipment. The share of co-financing may not exceed 10% of the value designated for the priority axis.
264. Budget of the priority axis (million EUR)
Total public contribution
ERDF National public funds Share of the priority axis in total IE OP allocation
1,314.27 1,117.13 197.14 13.53%

82
5.3 Priority Axis 3. Capital for innovation
265. Objectives of the priority axis:
a) to increase the number of innovative enterprises,
b) to improve access to external sources of financing for innovative undertakings.
266. Monitoring indicators for the priority axis
Indicator Baseline
value
Estimated value of the indicator
(in the target year)
Frequency of measurement
Source of data
Outcome indicators
Number of new workplaces in enterprises that obtained support (total/women/men)
0 4,500/1,800/
2,700 Every year
Authority responsible for the
implementation of the IE OP
measures
Number of enterprises which used venture capital and funds of private investors as a result of support (seed, start-up, expansion – in total)
0 184 Every year
Authority responsible for the
implementation of the IE OP
measures
Financial leverage effect 0 EUR 216 million
Every year
Authority responsible for the
implementation of the IE OP
measures
267. Justification for the selection of the priority axis: The Polish economy is characterised by a very low level of innovativeness and an insufficient level of innovation financing by enterprises. There is a serious market gap in financing of high-risk undertakings (highly innovative, at the start-up stage) as it is often impossible to obtain capital for such undertakings (up to PLN 10 million).
268. Difficulties in gaining access to external financing come from, e.g. very restrictive formal requirements indispensable to obtain a credit. Venture capital funds operating on the market are unwilling to invest in risky undertakings due to high fixed costs and high risk of projects implemented at early stages of enterprise development. Statistical data reveals that the number of funds (that invest mainly in the seed phase) that offer financial support for covering the gap is constantly decreasing. This situation is a serious barrier to the development of new enterprises, especially at early stages.
269. Consequently, there is a justified need for public intervention that will encourage investors to make capital investments in companies at early stages of development. This will allow for improvement of the level of investments in innovative solutions, both technological and organisational.
270. At the same time, in the light of a very small number of new innovative enterprises, it is necessary to introduce new instruments for support for establishment of companies based on innovative ideas in the area of counselling and financial support. This will create favourable conditions for boosting potential of SME.

83
271. Description of the priority axis: In connection with difficulties that potential and new entrepreneurs come up against while attempting to obtain finance for innovative undertakings, appropriate support measures have been developed. They cover establishment of new enterprises, including spin-offs, on the basis of innovative ideas through counselling, providing access to infrastructure and services necessary to newly establish companies and financial injections. The priority axis also provides financial support for SME at early stages of development through acquisition of shares or bonds by capital funds. In order to provide financing for innovative enterprises at early stages of development, a financial engineering instrument will be used in the form of a fund of funds supporting capital funds. The fund of funds will be selected in accordance with Article 44 of Council Regulation No. 1083/2006 of 11 July 2006 laying down general provisions on the European Regional Development Fund, the European Social Fund and the Cohesion Fund and repealing Regulation (EC) No. 1260/1999. At the same time, support will be provided for measures aimed at activation of the individual investor market, e.g. Business Angels. Within priority axis “Capital for innovation”, measures will be introduced that are necessary for initiating innovative activity of SME and support for its early stages of development with the use of capital funds and networks of private investors. These measures are addressed, in particular, to entrepreneurs whose undertakings are marked with a high level of innovativeness, relatively low value, high market potential and high risk.
272. Within the priority axis, the following measures will be supported:
a) initiating innovative activities through identification and verification of innovative ideas with a high market potential, support for establishment of enterprises on the basis of such ideas, and early stages of their development,
b) support for enterprises at early stages of development (seed, start-up and expansion) the undertakings of which are based on innovative solutions through financing capital funds,
c) activation of the private investor market through establishment of good conditions for initiating cooperation of private investors and entrepreneurs who search for finance for implementation of innovative undertakings.
273. Under the priority axis, non-returnable support will be granted to the following groups of beneficiaries:
a) capital funds,
b) business support institutions (e.g. innovation and technology transfer centres, technology accelerators, incubators, scientific and technology parks, organisations that group potential investors (e.g. Business Angels),
c) organisations of entrepreneurs and employers as well as SME.
274. Support instruments. Co-financing of a part of eligible expenditures in the form of a grant and capitalisation of venture capital funds.
275. State aid. State aid is envisaged (horizontal aid for research, development and innovative activities, for venture capital and de minimis aid).
276. Expected results of the implementation of the priority axis. The implementation of Priority Axis 3 will contribute to creation of an external system of financing of innovative activities of entrepreneurs at early stages of development who, due to a

84
short period of their activity and high risks of their undertakings, cannot take advantage of the offer of the banking sector. It is expected that the following results will be achieved:
a) increasing the share of capital investments in innovative undertakings of companies at early stages of development,
b) strengthening of the system of entities offering external financial and counselling support for enterprises,
c) increasing the number of new companies based on highly innovative solutions,
d) increasing the number of enterprises that use new technologies,
e) increasing the level of private financing for SME.
277. Compatibility with other programmes implemented within the NSRF. With regard to specifics of the planned intervention, implementation of Priority Axis 3 is envisaged at the central level. The following are complementary to these measures:
a) capital support for loan and guarantee funds operating at the regional level (within Regional Operational Programmes),
b) measures aiming at networking and benchmarking of existing loan and guarantee funds (within the Human Capital Operational Programme),
c) support for graduates of higher schools planning to take up business activity (start-up) within the Human Capital Operational Programme, which is complementary to the measure supporting initiation of innovative activity designed within Priority Axis 3.
278. Cross-financing. The implementation of the cross-financing instrument is envisaged within the scope necessary to achieve the objectives set. The share of co-financing may not exceed 10% of the value designated for the priority axis.
279. Budget of the priority axis (EUR million)
Total public contribution
ERDF National public funds Share of the priority axis in total IE OP
allocation 340.00 289.00 51.00 3.51%

85
5.4 Priority Axis 4. Investments in innovative undertakings
280. Objective of the priority axis: to increase the level of competitiveness of enterprises through application of new solutions.
281. Monitoring Indicators for Priority Axis 4
Indicator Baseline
value
Estimated value of the indicator
(in the target year)
Frequency of measurement
Source of data
Output indicators
Number of enterprises that received support (including SME) and introduced innovations on their own
0 1,200 Every year
Authority responsible for the
implementation of the IE OP measures
Outcome indicators
Number of workplaces created in supported enterprises (total/women/men)
0 60,000/24,000/
36,000 Every year
Authority responsible for the
implementation of the IE OP measures
Financial leverage effect 0 EUR 8.7 billion Every year
Authority responsible for the
implementation of the IE OP measures
282. Justification for the selection of the priority axis. Currently, the main sources of competitive advantage of enterprises operating in Poland are low labour costs and the large domestic market. However, in terms of development trends and advanced globalisation, sustainable growth can be guaranteed only by enhancing competitive advantage by enterprises based on innovative solutions.
283. Lack of sufficient own resources and difficulties in possessing finance for new investments120, in particular by SME, make only a small percentage of Polish enterprises count as innovative enterprises.
284. Poor financial situation of Polish enterprises is reflected in limited involvement of enterprises, especially SME, in R&D activity, and consequent development and implementation of new solutions that would improve the competitive position of enterprises. Lack of instruments for support for R&D works in enterprises negatively affects the innovativeness level of entrepreneurs operating in Poland.
285. Consequently, public intervention within Priority Axis 4 will focus on support for undertakings related to development, implementation and transfer of innovative solutions, both technological and organisational, with high added value for the economy and providing substantial numbers of new workplaces. Since support for entrepreneurs, especially SME, has been provided within ROPs, the programmed support instruments will cover support for new investments related to application of new solutions of high value and undertakings necessary to take up R&D activities.
286. Description of the priority axis. Support instruments for innovative undertakings of entrepreneurs designed within Priority Axis 4 are complementary to the
120 A new investment is an investment in tangible and intangible assets related to: establishment of a new production site, extension of present production sites, diversification of production through introduction of new products, or substantial changes in the production process.

86
instruments set out in Priority Axis 3, which aim at support for the benefit of enterprises at early stages of development.
287. They cover co-financing of undertakings in the area of implementation of results of R&D works implemented with support granted within Priority Axis 1 for R&D works. Irrespectively of the position of support instruments in the two priority axes (1 and 4), support for R&D works and for implementation of their results will be granted through a common system for support for entrepreneurs121.
288. Support will be provided for projects consisting in implementation of own or acquired new technologies. Additional support for companies investing in R&D will be granted in the form of co-financing of counselling services and investments necessary to carry out R&D works, including preparations of entrepreneurs for obtaining the status of a research and development centre122. At the same time, support will be given to investments in the area of developing industrial models that are one of the sources of competitive advantage.
289. Co-financing will be also provided for projects of entrepreneurs from both the production and the service sector, related to implementation of new investments, covering acquisition of innovative organisational or technological solutions (including those leading to reduction of adverse influence on the environment, e.g. reduction of energy, material and water consumption of products and services). Because of complementary support granted within ROPs, the measures included in the IE OP must be characterised by a high level of innovativeness of the solutions applied and relatively high value of the project.
290. Simultaneously, support will be provided for large innovative projects implemented in the production sector. Preference will be given to innovative solutions on European and global scale. Moreover, support will be granted for undertakings of companies from the modern services sector which creates substantial number of new workplaces, especially for highly qualified workers (e.g. within research and development centres).
291. Investment projects may contain elements of counselling and training necessary for the implementation of the investment.
292. Within the priority axis, the following measures will be supported:
a) support for implementation of R&D results achieved thanks to the implementation of R&D works co-financed within Priority Axis 1 (within one complex project covering R&D works and implementation of their results, on condition that the criterion of economic justification has been met),
b) implementation of own or acquired new technologies and production of new goods or improvement of old goods on the basis of such technologies through co-financing from the Technological Credit Fund,
c) counselling and investments necessary for entrepreneurs to conduct R&D works, including those directed towards obtaining the status of a research and development centre,
d) counselling and investments necessary to develop industrial models,
121 Beneficiaries will obtain support for R&D works and for implementation of their results within one project. 122 According to the provisions of the Act of 29 July 2005 on some forms of support for innovative activities (Journal of Laws No. 179, item 1484).

87
e) new investments covering application of new highly innovative organisational and technological solutions in production and services, including those leading to reduction of an adverse impact on the environment,
f) new investments of enterprises from the production sector, covering application of innovative solutions of high importance to the economy due to the volume of investments and the number of new workplaces related to these investments,
g) establishment of a large number of workplaces in enterprises from the sector of modern services, including common services centres and research and development centres.
293. Under the priority axis, non-returnable support will be granted to the following groups of beneficiaries: entrepreneurs.
294. Support instruments. Co-financing of a part of eligible expenditures in the form of a grant and co-financing of the Technology Credit Fund.
295. State aid. State aid is envisaged (horizontal aid for research, development and innovative activities, regional state aid).
296. Expected results of the implementation of the priority axis. The implementation of Priority Axis 4 will contribute to intensification of application of new and modern solutions in the are of products (goods and services), processes (also technological processes), marketing and organisation (logistical and IT in the area of management and distribution). In the first place, the following results are expected:
a) growth in the level of new investments in enterprises,
b) growth in the number of innovative enterprises,
c) growth in expenditure on R&D in enterprises,
d) growth in the number of enterprises that use information and communication technologies,
e) growth in the number of newly created permanent workplaces.
297. Compatibility with other programmes implemented within the NSRF. Within the IE OP support will be given to investment projects of entrepreneurs aiming at introduction of innovations that may bring about significant economic results on the national scale. Consequently, it is assumed that complementary support in the area of initial investments of entrepreneurs is envisaged:
a) at the regional level (within Regional Operational Programmes),
b) at the central level for investments aiming at reduction of negative environmental impact (within Infrastructure nad Environment Operational Programme complementary measures aiming at adjusting enterprises to environmental protection requirements have been envisaged),
c) at the central level for training activities within the Human Capital Operational Programme.
298. Cross-financing. Cross-financing may be provided in the area of trainings necessary to obtain the objectives of the measures implemented. The share of co-financing may not exceed 10% of the value designated for the priority axis.
88
299. Budget of the priority axis (EUR million)
Total public contribution
ERDF National public funds Share of the priority axis in total IE OP
allocation 3,309.71 2,813.25 496.45 34.09%

89
5.5 Priority Axis 5. Diffusion of innovation
300. Objectives of the priority axis:
a) to provide entrepreneurs with high quality services and infrastructure aimed at strengthening and use of their innovative potential,
b) to strengthen the competitive position of enterprises through development of cooperative relations.
301. Monitoring indicators for the priority axis :
Indicator Baseline
value
Estimated value of the indicator
(in the target year)
Frequency of measurement
Source of data
Output indicators
Number of entities engaged in cooperative undertakings supported (entrepreneurs, including SME and business support institutions)
0 600 Every year Authority responsible for
the implementation of the IE OP measures
Outcome indicators
Number of enterprises (including SME) which have implemented innovations with the assistance of business support institutions
0 600 Every year Authority responsible for
the implementation of the IE OP measures
Financial leverage effect 0 EUR 146.96
million Every year
Authority responsible for the implementation of the IE OP measures
302. Justification for the selection of the priority axis. In order to increase innovativeness of the economy, it is necessary to popularise and provide access to solutions created and applied by economic operators, scientific entities and business support institutions. Thanks to access to innovations, it is possible to create new solutions, develop new applications and derive profits by authors of innovations.
303. Diffusion of innovation in the economy is possible due to intense and constant cooperation between authors and beneficiaries of innovative solutions. On the basis of developed countries, it may be stated that cooperation often facilitates achievement of results that would be inaccessible for entities acting on their own due to high outlays and knowledge required. Such cooperation also reduces costs of economic activity and improves productivity of participants. From the economic point of view, this kind of projects creates a significant added value in comparison to measures undertaken by individual entities.
304. Cooperation between entrepreneurs (also at the start-up stage), as well as between firms and business support institutions, mainly scientific entities, creates conditions that facilitate development and diffusion of new solutions (technological, product and organisational), know-how exchange and better utilisation of resources.
305. However, entities currently acting on the Polish market, in particular entrepreneurs, rarely undertake this kind of cooperation, mostly due to the lack of awareness of its advantages and lack of trust in potential partners, resulting from the fear of loosing

90
their competitive advantage and disclosing too much information concerning their strategy and resources. Similarly, business support institutions do not employ all potential possibilities for cooperation for diffusion of innovation. Moreover, business support services in Poland are dispersed which hampers effective transfer of innovations.
306. Development of the innovation market requires execution of its legal protection. Polish and international laws provide for this kind of protection, however, as it has been stressed in the diagnosis, it is very rarely used by entities operating in Poland. Awareness of possibilities and benefits resulting from legal protection of developed solutions is very low. Relatively high costs of the procedure for obtaining industrial property rights protection constitute a serious obstacle. Taking advantage of opportunities that stem from legal protection will make investments in R&D activity more profitable, and new solutions will be accessible providing benefits to their authors.
307. Description of the priority axis. Support provided within the priority axis aims at the creation and development of supra-regional cooperative relations between entrepreneurs, especially in the area of counselling and investment which add to transfer and diffusion of knowledge and innovations among cooperating entities. Since the measures are complementary to those provided within ROPs, the scope of the IE OP intervention will allow for support for cooperation between entrepreneurs and between entrepreneurs and business support institutions, especially scientific entities, which will be very beneficial for the development of the economy.
308. Additionally, support is provided for enhancement of supra-regional and nationwide business support institutions that contribute to improvement of cooperation between entrepreneurs with regard to technology transfer, use of industrial property protection rights and use of industrial models.
309. In the area of creation of favourable conditions for innovative economic activity of companies, support will be provided for comprehensive undertakings of specialised innovation centres, especially technology parks located in the areas with the highest development potential for the whole economy. Improvement of such institutions is very important as they add to strengthening of relations between entrepreneurs and between entrepreneurs and scientific entities through providing access to suitable infrastructure, services and knowledge necessary to conduct economic activities related to new solutions.
310. Instruments of Priority Axis 5 have been complemented with support for enterprises in the area of protection and use of intellectual property rights.
311. Within the priority axis, the following measures will be supported:
a) investments and counselling services related to development of cooperative relations on a supra-regional scale, including clusters,
b) comprehensive support for innovation centres (e.g. science and technology parks, technology incubators, technology transfer centres) located in the areas with top development potential,
c) support for establishment and development of business support networks on a supra-regional scale rendering services related to innovative activities of entrepreneurs,
d) support for use of intellectual and industrial property rights by entrepreneurs.

91
312. Under the priority axis, non-returnable support will be granted to the following groups of beneficiaries: groups of entrepreneurs, including: clusters, SME and large enterprises production chains, technological networks (SME and scientific entities) represented by entities holding a legal title to act on their behalf; technology platforms, networks of business support institutions of a nationwide range, highly specialised innovation centres (entities managing science and technology parks, technology incubators, advanced technology centres, productivity centres, centres of specialised services for entrepreneurs), entrepreneurs.
313. Support instruments. Co-financing of a part of eligible expenditures in the form of a grant.
314. State aid. State aid is envisaged (horizontal aid for research, development and innovative activity, regional state aid, de minimis aid).
315. Expected results of the implementation of the priority axis. The implementation of Priority Axis 5 should contribute to increasing the percentage of innovative enterprises by rising the number of cooperative relations and enhancing services rendered to such entrepreneurs, through:
a) increasing the role of cooperative relations of entrepreneurs (including cooperation with scientific entities);
b) extension and improvement of the quality of services offered to innovative enterprises at the national and international level;
c) making the services delivered by business support institutions more professional;
d) increasing the awareness of entrepreneurs of benefits stemming from cooperation;
e) increasing the number of patent applications and other applications for industrial property rights protection.
316. Compatibility with other programmes implemented within the NSRF. Support within Priority Axis 5 is aimed at business support institutions offering services designed for satisfying the needs of innovative entrepreneurs. It is coherent with:
a) support in the area of development and standardisation of services rendered in favour of entrepreneurship development by business support institutions (offered within the framework of the Human Capital Operational Programme);
b) support for cluster initiatives on a regional scale (offered within Regional Operational Programmes);
c) support for industrial parks and Special Economic Zones/investment areas along with business support institutions operating at the regional and local level (offered within Regional Operational Programmes).
317. Cross-financing. Cross-financing may be provided in the area of trainings necessary to obtain the objectives of the measures implemented. The share of co-financing may not exceed 10% of the value designated for the priority axis.

92
318. Budget of the priority axis (EUR million)
Total public contribution
ERDF National public funds Share of the priority axis in total IE OP
allocation 398.99 339.15 59.85 4.11%

93
5.6 Priority Axis 6. Polish economy on the international market
319. Objective of the priority axis: Improvement of the image of Poland as an attractive economic partner, as a place where good trade contacts may be made, and as a place good for investments, economic activity and development of tourist services.
320. Monitoring indicators of the priority axis
Indicator Baseline
value
Estimated value of the indicator
(in the target year)
Frequency of measurement
Source of data
Outcome indicators
Number of entrepreneurs making use of the databases created or improved within Priority Axis 6 (databases for exporters, investors and tourists)
0 40,000 Every year Authority responsible for
the implementation of the IE OP measures
Number of firms that commenced and/or improved exports or sales on the SEM as a result of support within the IE OP
0 1,350 Every year Intermediary Body/ Centre for Socio-
Economic Information
Number of tourist visiting Poland (in million persons)
15.2 (2005)
21 Every year Institute of Tourism
321. Justification for the selection of the priority axis. Poland’s accession to the Single European Market (SEM), has been beneficial for intensification of international relations of entrepreneurs and requires constant improvement of economic activity standards. In order to improve the competitive position of the Polish economy, it is necessary to improve economic ties through increased trade, increased movement of tourists and creation of conditions allowing for improvement of investments, including foreign investments. Strengthening of the importance of innovations in economic activity of enterprises is the key element for development and maintenance of economic growth dynamics.
322. Simultaneously, the objectives of Priority Axis 6 are complementary to the other objectives implemented within the IE OP for which support has been provided for establishment and development of innovative products and services. The implementation of measures aimed at promoting sales on the SEM and promoting export of innovative products and services, as well as innovative investments, allows for comprehensive implementation of the main objective of the IE OP, namely development of the Polish economy on the basis of innovative enterprises. It will be possible thanks to strengthening of the competitive position of entrepreneurs on the global market. Moreover, within Priority Axis 6, support will be provided for projects that complement and support activities undertaken within other IE OP priority axes.
323. The current system of services and support for investments and trade requires further improvements. In order to encourage enterprises to strengthen international contacts, to search for co-operators or new markets, it is necessary to define standards and procedures and to improve access to information. To meet the needs of entrepreneurs, it has been planned to establish a modern system of information about the Polish economy, innovative products and services and opportunities for economic activity in Poland. Moreover, support will be offered for entrepreneurs who start export or sales on the SEM, as well as programmes aimed at facilitating

94
and supporting the activity of Polish enterprises on the international market and the system for investor assistance.
324. Additionally, co-financing has been planned for investments in the tourist sector aimed at strengthening of competitive and innovative supra-regional products. Support for investments in supra-regional tourist products will contribute to Poland’s attractiveness.
325. Unsatisfactory image of Poland on the international market makes it necessary to introduce state intervention that will lead to establishment of coherent systems in four areas: promotion of exports and sales on the SEM, investments (including foreign investments), as well as economic and tourist promotion of the country.
326. Description of the priority axis. Within Priority Axis 6, support will be provided for measures consisting in making a closer link between the Polish economy and the international economy, due to presenting Poland as an attractive partner and attractive location for investments. Such measures cover: support for promotion of exports and sales on the SEM, establishment and development of a business service system, support for business service networks and measures related to improvement of Poland’s investment attractiveness, promotion of the Polish economy on the international market and promotion of Poland’s tourist assets. Emphasis will be placed on use of IT instruments. The priority axis will also support initiatives essential for promotion of Poland, e.g. large international undertakings such as world EXPO exhibitions.
327. At the same time, the objectives of the priority axis are complementary to other priority axes implemented within the IE OP. Priority Axis 6 provides support for making innovative products more international. Implementation of measures aimed at promotion of export and sales on the SEM allows for comprehensive implementation of the objective of the IE OP, namely improvement of competitiveness of entrepreneurs on the global market.
328. The Polish system for servicing and supporting trade and sales on the SEM is incoherent and lacks defined standards: there are many institutions that offer services of various quality, and access to necessary information, especially outside large agglomerations and abroad, is limited.
329. Achievement of the objective of Priority Axis 6 depends on changes which are beyond the intervention of the IE OP (e.g. road infrastructure development, appropriate preparation of investment areas, stability of the legal system). It is also necessary to improve the quality of the offer of enterprises operating in Poland.
330. Within Priority Axis 6, the following measures will be supported:
a) comprehensive support for entrepreneurs interested in trade contacts with foreign partners, covering counselling, trainings, foreign market studies, participation in exhibitions and fairs,
b) development of business assistance centres,
c) development of large investment areas, especially related to conceptual works allowing for implementation of greenfield investments,
d) undertakings necessary for promotion of Poland’s tourist assets, including creation of new innovative products and tourist services, establishment of tourist information centres,

95
e) investments in the area of tourist products of supra-regional importance, including those contributing to improvement of the quality of tourist services, such projects may be also selected through competition,
f) establishment and development of an Internet system for servicing entrepreneurs who look for trade partners and investments in Poland.
331. Under the priority axis, non-returnable support will be granted to the following groups of beneficiaries:
a) business support institutions of supra-regional and international importance dealing with economic and tourist promotion,
b) business support institutions from the tourist sector,
c) public institutions, including state legal persons,
d) local government entities,
e) entrepreneurs.
332. Support instruments. Co-financing of a part of eligible expenditures in the form of a grant.
333. State aid. In the majority of projects implemented within Priority Axis 6, state aid is not applicable. Direct support for entrepreneurs allows for application of the rules related to de minimis aid.
334. Expected results of the implementation of the priority axis. The following results should be obtained within Priority Axis 6:
a) increased sales on the SEM,
b) increased export volume,
c) increased value of investments, including foreign direct investments (FDI),
d) increased recognition of the “Poland” brand,
e) increased knowledge of the potential and opportunities of the Polish economy,
f) increased intensity of tourist movement,
g) establishment of information systems supporting promotion of exports and sales on the SEM, increased number of investments,
h) improvement of expenditures in the tourist sector.
335. Compatibility with other programmes implemented within the NSRF: Under Priority Axis 6, systemic support will be provided for establishment and development of a national system for support for exports and sales on the SEM, investor servicing and tourist services.
336. The instruments designed within Priority Axis 6 will be complemented by measures introduced at the local and regional levels (within Regional Operational Programmes), such as:
a) improvement of enterprises that produce for the SEM and for exports, acting on the local and regional market,
b) creation and development of a coherent promotion system of voivodships (regions) that may improve the attractiveness of the region in the area of investment.
96
337. Cross-financing. The implementation of the cross-financing instrument is envisaged within the scope of trainings necessary to achieve the objectives set. The share of co-financing may not exceed 10% of the value designated for the priority axis.
338. Priority budget (EUR million)
Total public contribution
ERDF National public funds Share of the priority axis in total IE OP
allocation
410.63 349.04 61.59 4.24%

97
5.7 Priority Axis 7. Information society establishment and development
339. Objectives of the priority axis. The objective of the priority axis is to create conditions for improvement of efficiency and competitiveness, and growth of employment in a knowledge-based economy through comprehensive activities supporting establishment and development of an information society.
340. Monitoring indicators for the priority axis
Indicator Baseline value
Estimated value of the indicator
(in the target year)
Frequency of measurement
Source of data
Outcome indicators
Percentage of enterprises that use the Internet in contacts with public administration institutions
16% 65% Every year GUS
Percentage of small and medium-sized enterprises which sell products via the Internet
10%
35%
Every year
GUS
Percentage of households that have a broadband access to the Internet123, including:
a) households in rural areas
b) households with net income below PLN 1,440
16%
5%
7%
75%
30%
40%
Every year
GUS
341. Justification for the selection of the priority axis. The position of the Polish economy on the international market, especially in the European Union, will be soon more and more dependent on access to information, including public information and access to electronic services provided by the public administration for citizens and entrepreneurs. In order to implement these measures, it is necessary to provide citizens with broadband Internet access.
342. Implementation of new ICT gives an opportunity to optimise the functioning of enterprises and directly results in improvement of the economy’s competitiveness and innovativeness. ICT stimulate changes in organisation and business models in enterprises, and influence additional investments in human capital. The share of outlays on ICT in total investment outlays has been constantly increasing, which influences the growth of GDP. The ICT sector is the one with the highest globalisation level and is a good example of how production rationalisation adds to improved specialisation and to growth in turnover of enterprises.
343. Improved use of ICT in the public administration will allow for improvement of effectiveness of its activities and ability to plan and forecast, as well as for reducing the costs of performance of public administration tasks. This will positively influence the rationalisation of the administration budget. At the same time, new solutions will make economic activity easier, through, e.g., elimination of barriers in the areas where business and the administration meet and through providing more
123 The minimum speed 128 kb/s.
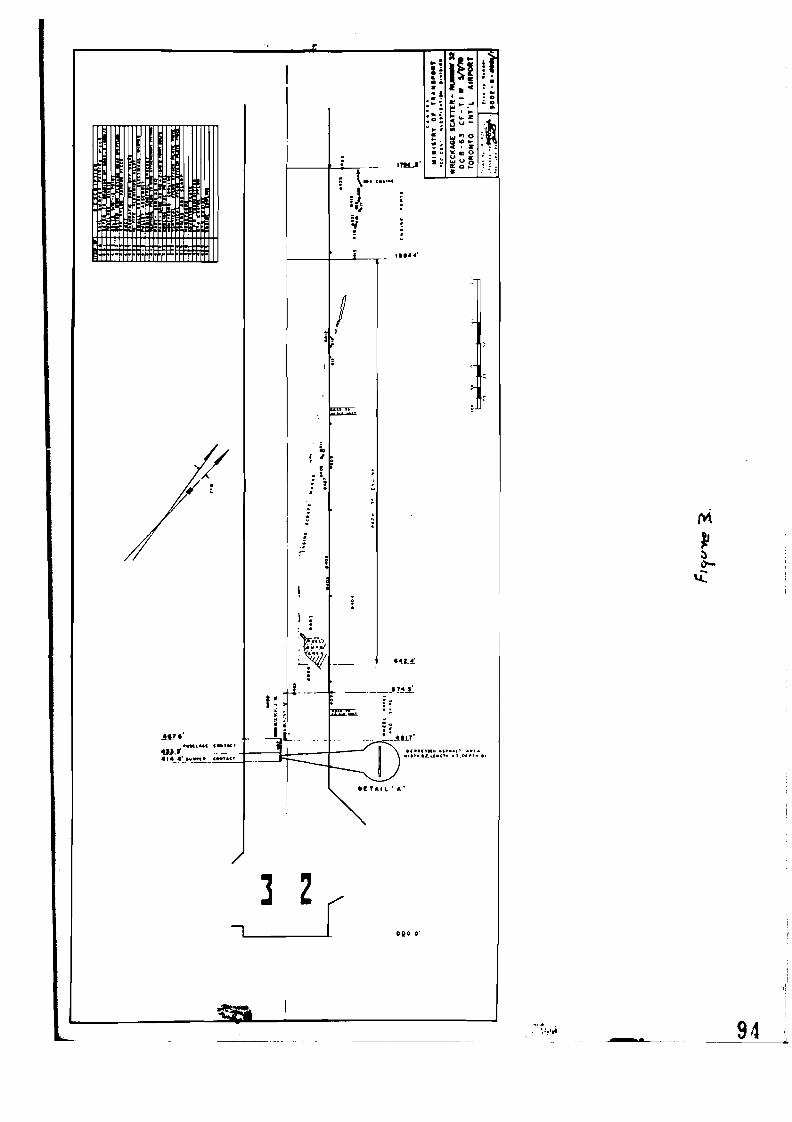
98
opportunities for use of public information by entrepreneurs. Besides, they should add to development of entrepreneurship in areas located far from economic centres and to stimulation of entrepreneurship among people with disabilities.
344. It is also important for Poland’s economic development to stimulate economic activity among young people, including graduates of higher schools. This calls for support for development of an electronic economy based on knowledge, including creation and access to digital contents and digital services. Support will allow entrepreneurs to obtain funds for their first important projects and consequently they will be able to develop activity on the open market of digital services.
345. Support for implementation of ICT in enterprises and creation of electronic services for enterprises and between enterprises (so called Business–to-Business – B2B) meets the needs and expectations of entrepreneurs. eServices124 for enterprises will add to more efficient functioning of companies.
346. Co-financing of establishment and implementation of eServices will open the market to innovative enterprises established within the measures set out in item 345. This will add to prevention of brain drain and departures of graduates to foreign universities, and to inclusion of educated and resourceful people into the Polish economy based on knowledge. This will also improve innovativeness in traditional enterprises, especially in SME and micro-enterprises, providing them with opportunities to benefit from electronic solutions available on the common European market.
347. Support granted within measures aimed at starting business activity, including activities directed towards local markets, should bring about important social effects. It should have influence on integration of local societies around common digital contents and on improvement of the quality of living due to digital services adjusted to local needs. It will also add to the openness of local societies to Europe and the world, making their processes understandable.
348. A necessary complement to the said measures will be to provide citizens with access to broadband Internet due to which they will be able to take advantage of electronic services provided by the public administration and enterprises by active participation in the information society.
349. At present, the level of application of ICT in Polish enterprises, institutions and state administration offices is much lower than the average level in the European Union. The experiences of EU Member States show that restructuring changes in internal processes for management in the public administration are a prerequisite for efficient fully transactional electronic services in the public administration125. Therefore, it is necessary to:
a) improve the scope and integration of eServices of the administration for citizens and entrepreneurs and their full transactionality,
b) redesigning, standardisation and integration of processes inside the administration. Reorganisation of the public administration must be related to documentation circulation management and access to electronic state registers.
124 eServices are electronic services. 125 Full transactionality of electronic services means that the whole process, from the moment when the information and form are loaded to the moment when the payment is made and the matter is settled, is conducted in an electronic way.
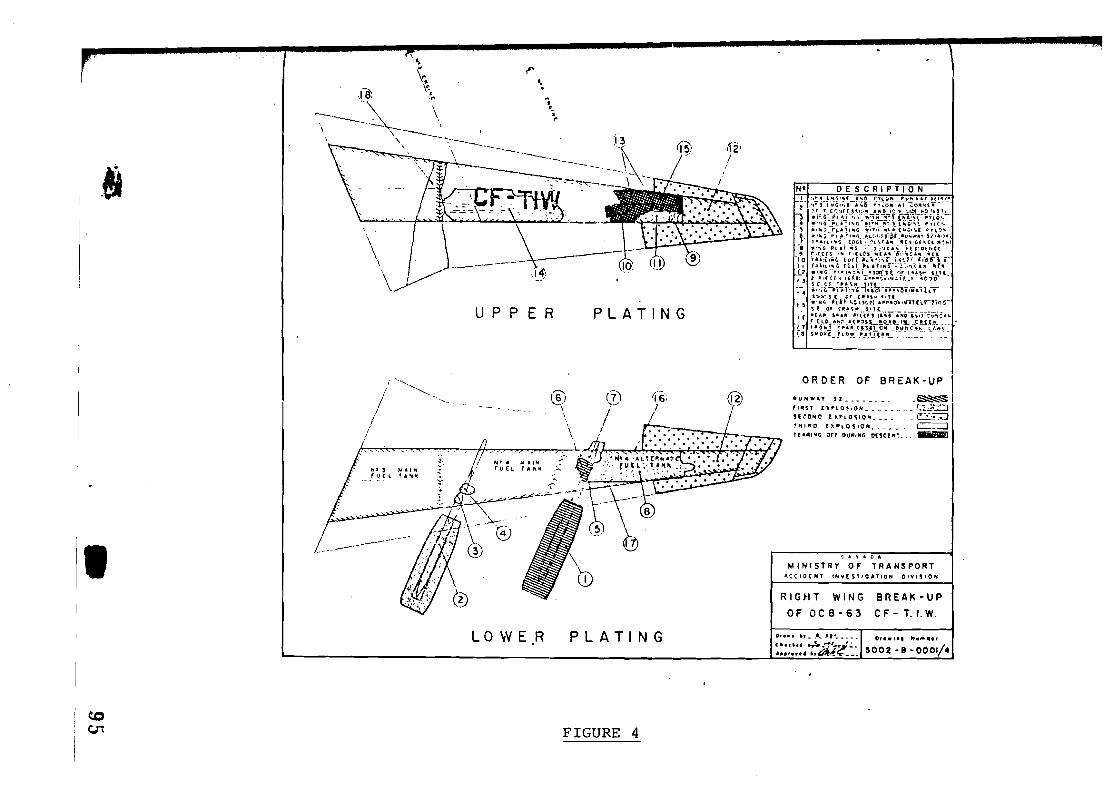
99
It is important to ensure that the two processes are introduced synergically. The development of the systems of eAdministration must reconcile development of integrated electronic services and digital contents and implementation of support systems and process restructuring in the administration.
350. Description of the priority axis. Establishment of electronic public services for citizens and entrepreneurs will be possible thanks to restructuring of the public administration and establishment of integrated platforms that will provide public services via electronic way in the areas necessary for economic activity, e.g. tax settlements, duties, administrative charges, etc. It is assumed that the integrated IT system of electronic services will be based on innovative IT technologies.
351. Integration with regard to data assumes further extension and integration of nationwide IT infrastructure which is the basis for coherent implementation of electronic services. It will allow for data transferring between platforms, electronic registers and offices, integrating public administration entities, and will also provide a set of necessary horizontal services supporting electronic public services, thanks to, e.g., the system for electronic personal identification (eID).
352. One of the areas of the priority axis will be stimulation of establishment and development of Polish digital resources in the Internet, especially resources of high importance to competitiveness of the Polish economy in the EU, development of entrepreneurship and improvement of social and economic cohesion. The basic task in this respect is restructuring and integration of state registers, so that to provide safe and effective access to the data they contain and development of systems for giving access to public information.
353. Support for establishing and providing eServices for citizens and enterprises will consist in the system of grants for implementation of a project in the area of creation and access to digital contents and services. Digital contents and services may refer to all areas of life related to local history, geography, culture, health, education, economic activity, administration, etc.
354. Moreover, support will be provided for creation of electronic services provided among enterprises and for use of new technologies in enterprises.
355. It is necessary to provide citizens with access to broadband Internet. Support in this respect will consist in partial or complete covering of costs borne by households potentially excluded from the information society. Additionally, it will be possible to rent or acquire computer equipment in compliance with the rules that are binding for mobile phones: signing long-term agreements with Internet providers and technical assistance necessary to install such equipment at home.
356. Within the priority axis, the following measures will be supported:
a) establishment of compatible electronic platforms of public services providing eServices for citizens and enterprises, e.g. social security, taxes, public procurement, business activity registers, court registers, health protection, environmental protection,
b) restructuring, adjustment and implementation of state registers, resources and IT systems of the public administration for cooperation in order to make them more efficient, integrated and able to provide services via electronic way, providing integrated IT infrastructure of the public administration at all levels,
c) development of public information systems (including legal information),

100
d) support for enterprises (also new ones) that provide eServices or access to digital contents, also for local societies,
e) support for eServices between enterprises (B2B),
f) support for eIntegration,
g) support related to access of citizens to broadband Internet.
357. Under the priority axis, non-returnable support will be granted to the following groups of beneficiaries:
a) government administration entities,
b) local government entities and associations of local government entities,
c) entities subordinated to the government administration,
d) consortia of public administration entities and scientific entities, enterprises, associations, professional self-government bodies, non-governmental organisations.
e) enterprises,
f) citizens opening enterprises providing local eServices,
g) citizens subject to digital inclusion policy.
358. State aid. State aid is applicable within the priority axis.
359. Expected results of the implementation of the priority axis:
a) establishment of new electronic services for enterprises and citizens provided by the public administration or modernisation or extension of those already existing, or improved access to these services,
b) establishment of electronic circulation of matters and documents in the public administration with the use of electronic signature and electronic identity (eID),
c) improved scope of the use of existing state registers, resources and IT systems of the public administration (including legal information),
d) establishment of eGovernment through establishment of an integrated central platform that will allow for providing public services via electronic way with regard to services for entrepreneurs and citizens,
e) boosting entrepreneurship and innovativeness of entrepreneurs through support for their economic activity in the area of establishment of digital contents and services, also for the benefit of local societies,
f) dissemination and promotion of new ICT in local societies all around Poland, also outside academic centres,
g) generating demand for digital products and services among entrepreneurs, companies and public institutions as an important element of the establishment of electronic economy based on knowledge and transformation to an information society,
h) improved scope of electronic integration,
i) improved and facilitated access to services and public information,

101
j) improved effectiveness and lowered costs of enterprise management, introduction of new organisational solutions based on ICT, new electronic distribution channels, remote services between enterprises via electronic means, improved cooperation between enterprises,
k) extension of international markets for products and services of Polish enterprises thanks to ICT,
l) improved access of digitally excluded citizens to broadband Internet, in compliance with market competitiveness and technological neutrality.
360. Compatibility with other programmes implemented within the NSRF. The priority axis is complementary to:
a) 16 ROPs within which projects in the area of information society infrastructure and eAdministration will be implemented at the local level,
b) Eastern Poland Development Operational Programme which covers projects directed towards trainings and improvement of citizens’ skills with regard to use of new technologies and infrastructure projects in the area of information society,
c) Human Capital Operational Programme where support will be granted to projects related to special trainings in the area of ICT application, e.g. use of eLearning and professional trainings of medical staff in the area of eHealth.
361. Cross-financing. The implementation of the cross-financing instrument is envisaged within the scope of trainings necessary to achieve the objectives set. The share of co-financing may not exceed 10% of the value designated for the priority axis.
362. Budget of the priority axis (million EUR)
Total public contribution
ERDF National public funds Share of the priority axis in total IE OP
allocation
2,294.11 1,949.99 344.12 23.6 %
102
5.8 Priority 8. Technical assistance
363. Objective of the priority axis: To ensure support for the IE OP management, implementation and monitoring processes and to ensure that Community funds and national resources are used effectively and in compliance with the law.
364. Justification for the selection of the priority axis: One of the conditions for participation in the management of the structural funds is to provide administrative potential necessary to meet this purpose. It will require substantial financial outlays for providing an efficient management, implementation, information, monitoring and evaluation system for structural aid within the IE OP, since the authorities involved in these measures must have necessary potential and skills. At the same time, maintenance of such system will require additional human resources. Priority 8 provides funds and tools necessary for servicing the IE OP implementation process.
365. Description of the priority axis: Support for effective IE OP management and implementation process will be rendered through:
a) providing compliance with Community laws and policies,
b) ensuring high quality and cohesion of measures used for the IE OP implementation,
c) organisation of a coherent system for information and promotion of the IE OP measures, compliant with the information policy of the NSRF,
d) support for institutions involved in the IE OP management and implementation.
366. Under the priority axis, non-returnable support will be granted to the following groups of beneficiaries: Institutions directly involved in the IE OP management and implementation.
367. Within the priority axis, the following measures will be supported:
a) support for employment in authorities responsible for management, implementation, monitoring, evaluation, audit and control. Financing of employment costs in the authorities responsible for the implementation of the IE OP measures will be granted within the technical assistance component, while financing of employment costs in Managing Authorities and in Intermediary Bodies which are simultaneously government administration bodies, will be provided within the Technical Assistance Operational Programme 2007-2013,
b) improvement of qualifications of employees responsible for management, implementation, monitoring, evaluation, audit and control, as well as promotion,
c) costs of the IE OP management and implementation, in particular:
i) costs of selection of projects,
ii) control,
iii) evaluation,
iv) organisation of meetings, committees, groups of teams,
v) development of analyses, studies, evaluations, reports,
vi) financing of assistance provided by external experts,
vii) collection, processing and analysing of data.
103
d) financing of costs of the IE OP evaluation,
e) financing of operating and administrative costs related to the implementation of the objectives of the IE OP,
f) acquisition of equipment and software necessary for the implementation of the objectives of the IE OP,
g) financing of programming costs and future structural interventions,
h) financing of activities related to communication, promotion and training activities supporting the IE OP implementation and management system,
i) financing of activities aimed at the completion of the SPO WKP 2004-2006 implementation,
j) financing of measures supporting development of key projects the implementation of which is envisaged within other IE OP priorities starting from the year 2009,
k) financing of costs of documents archiving,
l) financing of costs of rent, development, modernisation and adaptation of rooms for the needs of the IE OP management and implementation.
368. Expected results of the implementation of the priority axis:
a) efficient IE OP management, implementation, monitoring, evaluation and control process,
b) improvement of social awareness and knowledge on support available within the IE OP,
c) in relation to transfer of useful information to beneficiaries and potential beneficiaries connected with the structural funds, it is expected that efficient and effective application of funds within the IE OP will improve, which will add to their better absorption.
104
369. Monitoring indicators for Priority Axis 8
Indicator Baseline value
Estimated value of the indicator
(in the target year)
Frequency of measurement
Source of data
Outcome indicators
Average time for payment of funds on the basis of payment applications
400126 30 Every year Managing Authority
Output indicators
Number of workplaces financed from the IE OP
0 400 Every six months
Managing Authority
Number of devices and software acquired with funds from the IE OP
0 5,000 Every six months
Managing Authority
Number of meetings, seminars, trainings and conferences
0 1,000 Every six months
Managing Authority
Number of opinions, analyses, studies, researches and evaluations
0 1,000 Every six months
Managing Authority
370. Budget of the priority axis (million EUR)
Total public contribution
ERDF National public funds Share of the priority axis in total IE OP
allocation
329.65 280.20 49.45 3.39 %
126 Data at the level of the NSRF.
105
6. SYSTEM FOR THE I MPLEMENTATION OF THE INNOVATIVE ECONOMY OPERATIONAL
PROGRAMME
6.1 Management and implementation
6.1.1 General remarks
371. The system for the management and implementation of the IE OP is compliant with Council Regulation (EC) No. 1083/2006 laying down general provisions on the European Regional Development Fund, the European Social and the Cohesion Fund and Commission Regulation No. …./EC of …. laying down the general principles for the implementation of the Council Regulation (EC) No. 1083/2006 laying down general provisions on the European Regional Development Fund, the European Social and the Cohesion Fund, as well as with Regulation (EC) No. 1080/2006 by the European Council and Parliament of 5 July 2006 on the European Regional Development Fund.
372. This chapter contains the description of the system for the IE OP management and control, in accordance with the requirements set out in Article 58 of the Council Regulation (EC) No. 1083/2006. General information regarding the functions of the Managing Authority for the NSRF, the Managing Authority for the IE OP, Certifying Authorities, Intermediary Bodies, Audit Institution and the relations between them are set out in the NSRF.
6.1.2 Managing Authority
373. The functions of the Managing Authority (MA) shall be performed by the Minister of Regional Development. Pursuant to Article 60 of the Council Regulation (EC) No. 1083/2006, the Managing Authority is responsible for the management and implementation of the IE OP in compliance with the principles of sound financial management. The Managing Authority shall be responsible in particular for:
a) ensuring that the measures to be financed are compliant with the criteria applied to the operational programme and compliant with Community and national rules throughout the implementation period,
b) verification whether co-financed goods and services are supplied and declared expenditures for operations have been really incurred and whether they are compliant with Community and national rules,
c) ensuring that there is a system for computer registration and storage of accounting data for each measure within the operational programme and that data regarding the implementation is collected, necessary for financial management, monitoring, control and evaluation,
d) ensuring that beneficiaries and institutions involved in the implementation of the measures have either a separate accounting system or an appropriate accounting code for all transactions related to the given measure,
e) ensuring that evaluation of operational programmes referred to in Article 47 of Council Regulation (EC) 1083/2006 is compliant with the provisions of the said regulation,
f) ensuring the compliance with requirements related to information and promotion set out in Article 69 of Council Regulation (EC) 1083/2006,
g) providing the EC with information necessary for evaluation of major projects,

106
h) setting procedures for ensuring that all documents related to expenditure and audit, necessary for providing appropriate audit route, are stored in compliance with Article 90 of Council Regulation (EC) 1083/2006,
i) ensuring that the Certifying Authority obtains all necessary information related to the procedures and verifications related to expenditure, necessary for certification,
j) managing the works of the Monitoring Committee of the IE OP (MC) and providing it with necessary documents allowing for the IE OP monitoring and implementation,
k) development of annual and final reports on the progress of the IE OP implementation approved by the Monitoring Committee and transmission of these reports to the EC,
l) developing a description of the management and control system setting the organisation and procedures of the MA, IB, Certifying Authority, Audit Institution and other institutions responsible for audits (pursuant to Article 71, paragraph 1 of Council Regulation (EC) 1083/2006),
m) sending annual IE OP expenditure forecast for the present and following year to the EC, pursuant to Article 76, paragraph 3 of Council Regulation (EC) 1083/2006.
374. Furthermore, the MA is obliged to:
a) develop guidelines for the IB for development of detailed manuals and procedures and give opinion on these documents,
b) develop sample reports for the IB and guidelines related to sample application forms, contracts and other documents for beneficiaries, as well as verify and approve samples developed by the IB,
c) prepare guidelines concerning eligibility of expenditure within the IE OP with the participation of the IB,
d) develop general criteria for project selection for the IE OP and submit them to the MC for approval,
e) verify applications related to major projects sent by the IB with regard to compliance with the requirements of the IE OP,
f) provide audits of the IE OP, including development of a system audit plan and cooperate with the IB on development of an audit plan for priority axes,
g) perform system audits of the IE OP,
h) evaluate the progress of the implementation of the IE OP on the basis of the annual report,
i) provide the MC with information on comments voiced by the EC on the basis of the annual report and inform the EC about actions taken in reaction to these comments,
j) develop reports on irregularities in cooperation with the IB and send them to authorised institutions, in accordance with the NSRF implementation system,
k) ensure evaluation of the IE OP in compliance with the EU requirements, especially development of an evaluation plan for the IE OP and cooperation with

107
the IB on development of evaluation plans of individual priority axes, and to supervise the implementation of this plan,
l) depending on the option selected in respect to the electronic monitoring system –participate in implementation and operation of the central system and supervise the performance of these tasks by the IB or identify, in cooperation with the IB, the needs for systems within the IE OP and supervise their establishment and functioning, and supervise the efficiency of cooperation with the central system, in order to provide suitable flow of data to the central system,
m) develop, in cooperation with the IB, annual expenditure forecasts for the present and following year and submit them to the EC,
n) develop, in cooperation with the IB, a detailed communication plan for the IE OP and supervise communication activities of the IB.
375. The MA, at the request of the MC, on its own initiative or on the motion of the IB, introduces changes in the IE OP and in the criteria for project selection, including those related to the share of funds. Changes may be introduced as a result of socio-economic changes or in order to consider the Community priorities in another way, or because of difficulties in the implementation and allocation of reserves. The MC gives opinions on the said changes but the final decision is taken by the MA. The EC must be notified of such a decision within a month. The Commission takes a decision on the motion to amend the IE OP in the shortest period of time possible from the date of official submission of the motion by the MA. With respect to the area referred to in Article 65 a) and g) of Regulation No. 1083/2006, changes must be approved by the MC.
6.1.3 Intermediary Bodies
376. Pursuant to Article 59 of Council Regulation (EC) No. 1083/2006, the IE OP shall delegate the management of individual priority axes to Intermediary Bodies (IB) which are directly responsible to the IE OP Managing Authority for performance of these tasks.
377. Delegation of authority shall refer to tasks related to individual priority axes (or a few priority axes) covering interventions that belong to the competence of the given ministry. While delegating authority, the MA shall remain fully responsible for the complete implementation of the IE OP.
378. Delegation of authority shall take place on the basis of an appropriate agreement that should set out:
a) tasks and scope of responsibility of the IB,
b) way for monitoring and controlling of the IBs’ performance of tasks by the MA.
379. The following institutions act as IB for the IE OP:
a) minister in charge of science (for Priority Axis 1 and 2),
b) minister in charge of economy (for Priority Axis 3, 4, 5 and 6),
c) minister in charge of economy and minister in charge of tourism (for Priority Axis 6),
d) minister in charge of informatisation (for Priority Axis 7).
108
380. The mains tasks of the IB within the IE OP include in particular:
a) with regard to programming:
i. developing proposals for detailed description of the priority axis and measures within the IE OP on the basis of the guidelines set out by the minister in charge of regional development and submitting them to the MA,
ii. management of individual priority axes implemented within the IE OP (the IB may establish implementing authorities for particular measures and delegate there some duties; at the same time, the IB has the sole responsibility of the complete implementation of the priority axis within the IE OP),
iii. developing a strategy for the implementation of the priority axis,
iv. developing, if such a need arises, proposals for amendments in the IE OP, in particular in the area of the implementation of the given operations,
b) with regard to implementation and selection of projects:
i. developing proposals for criteria for selection of operations and submitting them to the Monitoring Committee,
ii. setting out eligibility criteria for costs covered by co-financing within the operations,
iii. setting out the level of co-financing for the operations as the percentage of eligible costs (the level may vary depending on the type of operation or the competence of the beneficiary, or stand at up to 100% of the operation value),
iv. setting out the types of projects the selection of which requires opinions by experts,
v. evaluation and selection of operations to be implemented and co-financed within the IE OP on the basis of the criteria approved by the Monitoring Committee,
vi. ensuring that the operations selected are compliant with appropriate Community and national rules throughout their implementation,
vii. concluding contracts on co-financing with beneficiaries,
c) with regard to financial management:
i. settling contracts with beneficiaries in compliance with the adopted procedures and making payments from the IE OP resources to beneficiaries, including development of applications for refunds and sending them to the Managing Authority; monitoring the progress of contract implementation,
ii. managing financial resources designated for implementation of the priority axis programme coming from the European Union’s budget, from the state budget and from other sources at the level of priority axes/operations (measures),

109
iii. developing annual and multi-annual prognosis for expenditure within the priority axis/operation (measures) for the present year and for the following year and transmitting it to the MA of the IE OP,
d) with regard to monitoring and evaluation:
i. monitoring the progress of the implementation of priority axes/operations, including the degree to which the objectives set have been achieved, as well as making evaluations of priority axes/operations in compliance with the procedures set out by the MA,
ii. developing periodic, annual and final reports on the implementation of operations and sending them to the MA of the IE OP, the reports are later sent to the Monitoring Committee for approval and then to the European Commission,
iii. participation in the implementation and use of the electronic monitoring system and maintenance of the electronic monitoring system for the priority axis within the IE OP,
e) with regard to control:
i. control of the implementation of the priority axis/operation, including controls of the implementation of individual projects (in particular aimed to verify whether the co-financed products and services have been supplied and whether the expenditures declared by beneficiaries have been actually incurred, and whether they are compliant with appropriate Community and national rules); sending the results of such controls to the MA of the IE OP,
ii. developing an annual control plan with regard to the priority axes,
iii. recovering amounts wrongly paid to beneficiaries within the priority axis,
iv. developing periodic reports on irregularities and sending them to the MA of the IE OP,
v. transmitting all necessary information on procedures and verifications made in relation to expenditures to the Certifying Authority for the needs of certification,
vi. systemic controls in the authorities that implement individual operations in order to assure the regularity of the system maintenance and sending the results of these controls to the MA of the IE OP,
f) with regard to communication and promotion:
i. ensuring appropriate information and promotion in the area of the priority axis and informative, promotion and communication activities at the level of operations,
ii. ensuring compliance of the implementation of the priority axis with the requirements related to information and promotion within the IE OP,
iii. developing a detailed communication plan for the priority axes, taking into account informative and training activities in the first place,

110
g) with regard to ensuring accounting standards:
i. ensuring application of separate accounting systems or appropriate accounting codes for all financial operations related to the project by beneficiaries and all institutions involved in the priority implementation,
ii. ensuring an IT system for registering and storing accounting records for each operation within the Programme and ensuring that the data on the implementation necessary for financial management, monitoring, verification, audit and evaluation is collected,
iii. storing all documentation related to the implementation of the operation for five years since the date of the project completion.
381. After a consent of the MA, the IB may vest the implementation of some of its tasks in another institution that has suitable competence, staff and experience, in particular with regard to the implementation of undertakings that refer to the tasks vested in it within the IE OP.
382. This function may be performed by institutions belonging to the public finance sector or which are in charge of the performance of such a function, the competences of which stem from appropriate legal regulations or statutes. These may be public entities, including state of private legal persons, responsible for the implementation of measures within individual priority axes.
383. Such delegation of authorities by the IB does not exempt it from absolute responsibility for the implementation of the priority axis within the IE OP.
384. The IB must not delegate tasks related to:
a) development of applications for refund and transmitting them to the Certifying Authority,
b) transmitting to the Certifying Authority all necessary information on procedures and verifications related to expenditures,
c) developing annual and multi-annual prognoses of expenditures within the priority axis and transmitting them to the MA.
6.1.4. Certifying Authority
385. Certification of payments to the EC shall be made by certifying authorities (CA) for central programmes financed from the ERDF and the Cohesion Fund that operate within the Ministry of Regional Development and are functionally independent of the MA. The tasks of the CA cover mainly the tasks set out in Article 61 of the Council Regulation No. 1083/2006.
386. The CA shall be responsible for certification of expenditures incurred within the IE OP. The main tasks of the CA cover certification of expenditures incurred by beneficiaries and certification of payment applications sent by the IB.
387. The main tasks of the CA cover:
a) development of certified lists of expenditures and payment applications for the IE OP and submitting them to the EC,
111
b) certification of the regularity of expenditures within the IE OP and their compliance with accounting systems and source documents,
c) certification of the compliance of expenditures declared with appropriate Community and national rules,
d) development of requirements related to expenditure certification,
e) certification of the compliance of expenditures incurred for the implementation of projects with the criteria applied within the IE OP,
f) considering the results of audits of the IE OP carried out by the Audit Authority for the needs of certification,
g) maintenance of accounting documentation related to expenditures declared to the EC in an electronic form,
h) registering amounts to be recovered and returned to the European Union budget and amounts withdrawn as a result of cancellation of the whole or part of financial contribution to the project,
i) evaluation of the certification system,
j) potential changes in the certification system aimed at its improvement.
6.1.5 Audit Authority
388. The General Inspector for Fiscal Control shall act as the Audit Authority (AA) for the IE OP. Tasks related to this area shall be performed by a separate organisational unit within the Ministry of Finance and tax inspection authorities. The AA is independent of the MA and IB for the IE OP.
389. The AA shall perform the tasks set out in Article 62 and Article 71 of the Council Regulation (EC) No. 1083/2006.
390. The AA is responsible, in the first place, for ensuring that audits of the IE OP management and control system as well as controls of projects carried out on the basis of an appropriate sample are compliant with internationally recognised auditing standards.
6.2. Audit and control procedures
6.2.1 Audits of management and control systems
391. Examination proceedings within audits of management and control systems referred to in Article 62, paragraph, 1 letter a of the Council Regulation (EC) No. 1083/2006 are performed at the following stages:
1) Introductory review – collecting and analysing information on the audited activity;
The results of an introductory review are the basis for introductory assessment of the audit environment and for identification, on the basis of risk analysis, of audit areas subject to examination procedures at the following stages.

112
2) Test of control mechanisms – verification whether the risks identified during the introductory review are accompanied by control mechanisms so that to limit or eliminate these risks, and whether these mechanisms were implemented by the audited entity in the areas subject to examination.
Analyses made during the introductory review and control tests are the basis for assessment of the internal control environment.
3) Development of an audit programme – identification of areas to be examined during reliability tests together with a detailed schedule.
4) Reliability tests – examination of the effectiveness of introduced control mechanisms on the basis of the examined document sample.
392. Expenditures examined during reliability tests will be included in the group of eligible expenditures subject to examination within project controls (Article 62, paragraph 1, letter b of Council Regulation (EC) No. 1083/2006).
6.2.2 Controls of projects
393. Controls of projects referred to in Article 62, paragraph 1, letter b of Council Regulation (EC) No. 1083/2006 are performed on spot, on the basis of documentation maintained by the beneficiary. The aim of controls is to ensure that:
a) the project was selected in compliance with the selection criteria established within the IE OP and that it was implemented in accordance with the decision on awarding assistance, that it fulfils appropriate requirements related to its functionality and usefulness or meets the objectives set,
b) declared expenditures are reflected in accounting records and other documents on accounting value maintained by the beneficiary,
c) expenditures declared by the beneficiary are complaint with Community and national rules,
d) public contribution was paid to the beneficiary without unnecessary deductions or unjustified delays.
394. If the problems detected seem systematic and may therefore bring about risks threatening other projects implemented within the IE OP, further examinations shall be made, so that to identify the scale of these problems.
395. The Audit Authority shall develop an audit strategy which identifies entities responsible for performance of audits, defines a methodology to be followed, sampling methods and an indicative audit plan. The audit strategy shall be submitted to the EC for approval.
396. On the basis of audits of the management and control systems and controls of projects, the Audit Authority shall develop:
a) an annual report on control containing results of audits carried out in the given year, compliant with the audit strategy and presenting potential irregularities in the IE OP management and control system,
b) an annual opinion establishing whether the management and control system guarantees that the declarations of expenditures submitted to the EC are correct and whether the transactions they refer to are compliant with the law,

113
c) a declaration on partial closure of aid referring to projects completed in the given year,
d) a declaration on closure of aid that assesses the validity of the application for final payment and compliance with the law and regularity of transactions related to this application included in the final declaration of expenditures.
397. The Audit Authority shall also be responsible for assessment of compliance of management and control systems in the entities that participate in the management and implementation of the IE OP, pursuant to Articles 58 – 62 of the Council Regulation (EC) No. 1083/2006. A report on the assessment and an opinion is submitted to the EC together with the description of the management and control systems prior to transmission of the first payment application or within 12 months from the day of the adoption of the IE OP. The first payment under audit of indirect compliance depends on the approval for the report by the EC.
6.3 Financial flows
398. Resources transferred by the European Commission to the minister in charge of public finance as advance payments, interim payments and final payments for the IE OP shall be included in the state budget as its revenue, and from the state budget shall be transferred as resources for financing of projects.
399. Intermediary Bodies and beneficiaries which are state budgetary entities shall plan, within the IE OP, funds for expenditure for financing of the implementation of the given priority axis or project, in compliance with the rules for state budget implementation within annual limits set out in the Budget Act. These limits shall be established in agreement with the minister responsible for regional development during works on the Budget Act on the basis of IE OP payment tables and multi-annual limits for liabilities and expenditures set out in the IE OP, so that to provide for efficient and prompt implementation of the IE OP.
400. Within the IE OP, payments shall be made by the IB to beneficiaries as refunds of expenditures they have incurred or as payments for covering future expenditures, in compliance with the rules set out in the IE OP.
401. Beneficiaries shall, in specified periods, transmit to the IB the required documents for certification of expenditures incurred on implementation of projects. In the case of payments aimed at covering future expenditure, subsequent payments shall depend on settlements of previous payments.
6.4 Monitoring
402. The IE OP monitoring is aimed to assure appropriate quality of the IE OP implementation. Monitoring is done by the MA, the MC and the IB, as well as by monitoring sub-committees for priority axes if any such sub-committees have been established.
6.4.1. Monitoring Committee
403. The MC shall be appointed by the minister in charge of regional development within three months since the date of the transmission to Poland of the decision on the adoption of the IE OP by the EC. Works of the MC are presided over by a

114
representative of the minister in charge of regional development. The MC shall assembly when such a need arises at least every six months.
404. The MC shall be composed of representatives of the minister in charge of regional development as the coordinator of the NSRF, the minister in charge of public finance, the MA, the IB, other ministers competent with regard to the scope of the IE OP, local governments, social and economic partners and representatives of the EC in an advisory capacity.
405. The MC may take a decision on establishing a monitoring sub-committee for particular support areas to which some of its tasks shall be delegated related to monitoring with regard to the given support area.
406. The MC shall take care of the effectiveness and quality of the IE OP implementation. Its tasks include, in particular:
a) considering and approving the criteria for selection of projects within the IE OP and approving potential changes in these criteria,
b) periodic examination of progress in the area of fulfilment of detailed objectives set out in the IE OP on the basis of the documents submitted by the MA,
c) analysing the results of the IE OP implementation, in particular the achievement of the objectives set out for each priority axis and the results of evaluations related to monitoring of the IE OP implementation, in particular when monitoring reveals substantial departures from the objectives or when proposals for changes in the IE OP have been put forward,
d) analysing and adopting annual and final reports on the IE OP implementation,
e) developing strategies for implementation of support areas,
f) knowledge of annual reports on IE OP controls and the EC’s comments on these reports, as well as informing the EC on actions taken in reply to its comments,
g) submitting proposals for changes in the IE OP to the MA; such changes should be aimed at facilitating the implementation of the ERDF objectives set out in Regulation No. 1083/2006 or at improving the IE OP management, including financial management,
h) analysing and approving all proposals for changes in the EC decision on the ERDF contribution.
407. Monitoring is done on the basis of financial indicators set out in the IE OP as well as of output and outcome indicators quantifying the objectives of individual priority axes. Wherever possible, appropriate statistical data shall be broken down by sex and size of the projects implemented by beneficiaries. The data for monitoring purposes shall be submitted to the EC electronically, in accordance with the requirements.
6.5 Evaluation
408. Evaluation shall aim at improving the quality, effectiveness and cohesion of the assistance within the Cohesion Policy and the IE OP strategy and implementation with respect to specific structural problems at the national and regional levels, while taking account of the principle of sustainable development and relevant Community

115
legislation concerning environmental effects and strategic environmental assessments.
409. Evaluation of the IE OP shall be vested with the MA. Its main tasks cover:
a) developing an evaluation plan covering various implementation stages,
b) ensuring that ex-ante evaluation is made before the IE OP implementation begins,
c) ensuring that evaluations related to monitoring of the IE OP implementation are made, in particular where monitoring reveals significant departures from objectives or where proposals for changes in the IE OP are put forward,
d) cooperation with the EC during its strategic evaluations,
e) cooperation with the EC during evaluations related to monitoring of the IE OP implementation done on the EC’s initiative,
f) cooperation with the EC during ex-post evaluation.
410. Furthermore, competent ministers that act as IB shall be responsible for evaluation of priority axes they are responsible for.
6.6 Exchange of electronic data aimed at meeting the requirements related to payments, monitoring and evaluation
411. The minister in charge of regional development shall be responsible for ensuring appropriate functioning of a safe system for electronic exchange of information with the EC and for granting accreditation to access to the system to the institutions involved in the implementation of operational programmes. Input of data to the IT system and introduction of a local system shall lie with the MA that shall cooperate with the NSRF coordinator. The minister in charge of regional development shall supervise the IT system and set out the standards related to data collection on the part of all participants in the NSRF implementation system.
412. The minister in charge of public finance shall be responsible for creating and developing an IT system on the basis of standards with regard to data collection set out by the minister in charge of regional development.
6.7 Information and promotion
413. The IE OP Managing Authority and the IB shall provide suitable information and promotion related to the IE OP and to projects implemented within the IE OP addressed to EU citizens and beneficiaries. Information and promotion shall be aimed at emphasising the role of the Community and ensuring transparency of the assistance from the Cohesion Policy funds. Information and promotion shall satisfy the requirements set out in the respective regulation of the European Commission.
414. In order to ensure the appropriate process of information and promotion of the IE OP, a Communication Plan shall be developed by the MA of the IE OP in cooperation with the IB which is to be the basis for information and promotion activities. The strategic objective of the communication process is to assure the adequate level of awareness of possibilities of obtaining EU financial support and to create a positive climate for absorption of structural assistance. This objective will

116
be accomplished by enhancing social awareness of Poles in the area of profits related to the implementation of the NSRF and, indirectly, to the integration with the European Union, as well as by diffusion of knowledge on results and progress of the funds implementation, and by exchange of experiences between participants in European funds implementation process in Poland.
6.8 Principle of partnership
415. As it was the case during the development of the IE OP, economic and social partners will be consulted on at all stages of the Programme implementation, in compliance with the requirements of Article 11 of Regulation No. 1083/2006 and national laws.
117
7. DRAFT FINANCIAL PLAN
416. Total amount of public finance involved in the implementation of the IE OP in the years 2007-2013 will reach about EUR 9,711.6 million127.
417. This sum includes public resources from the ERDF amounting to EUR 8,254.9 million and national resources the involvement of which has been forecast at the level of EUR 1,456.7 million. The allocation from the European Regional Development Fund for the IE OP accounts for 12.3% of the total Community financial appropriation envisaged for the NSRF implementation.
418. The level of national public co-financing accounts for 15% of the total public financial allocation, and the support from the European Regional Development Fund amounts to 85% of the total public financial allocation.
419. The majority of interventions taken up within the IE OP will constitute state aid in accordance with the definition of the ECT. Therefore, apart from public funds, the implementation of the IE OP will also involve private funds at the level compliant with the Community rules on state aid granting
420. Since it is impossible to precisely determine the amount of private funds that will be involved within the IE OP, they have not been included in the financial table which constitutes an annex to the IE OP.
421. Pursuant to the provisions of Council Regulation (EC) No. 1083/2006 of 11 July 2006 laying down general provisions on the European Regional Development Fund, the European Social Fund and the Cohesion Fund and repealing Regulation (EC) No. 1260/1999, whenever state aid is provided, the share of structural resources is counted in relation to public resources, thus it is not necessary to list private funds in the financial table.
127 The amounts of ERDF funds and national public funds stated here are amounts of financial obligations and have been presented in current prices.

118
Presentation of financial obligations for the Innovative Economy Operational Programme 2007-2013 broken into years in current prices in euro
European Regional Development Fund
Cohesion Fund
Total
1 2 3 = 1+2
2007 1,157,226,001 0 1,157,226,001 2008 1,184,324,642 0 1,184,324,642 2009 1,211,244,851 0 1,211,244,851 2010 1,195,443,813 0 1,195,443,813 2011 1,173,121,175 0 1,173,121,175 2012 1,151,510,530 0 1,151,510,530
2013 1,182,014,268 0 1,182,014,268 2007-2013 8,254,885,280 0 8,254,885,280
Presentation of financial obligations for the Innovative Economy Operational Programme 2007-2013 broken into priorities and sources of financing in current prices in euro
Indicative division of national contribution
For information purposes:
Priority axis
Community contribution
National contribution
National
public funds
National private funds*
Financing in total
Level of co-financing Contri-
bution of the EIB
Other sources of financing
1 2=3+4 3 4 5=1+2 6=1/5 7 8
I 1,117,130,000 197,140,588 197,140,588 1,314,270,588 0.85
II 1,117,130,000 197,140,588 197,140,588 1,314,270,588 0.85
III 289,000,000 51,000,000 51,000,000 340,000,000 0.85
IV 2,813,254,000 496,456,588 496,456,588 3,309,710,588 0.85
V 339,148,000 59,849,647 59,849,647 398,997,647 0.85
VI 349,038,080 61,594,955 61,594,955 410,633,035 0.85
VII 1,949,985,200 344,115,035 344,115,035 2,294,100,235 0.85
VIII 280,200,000 49,447,059 49,447,059 329,647,059 0.85
Total 8,254,885,280 1,456,744,460 1,456,744,460 9,711,629,740 0.85
* Amount of private funds involved has not been presented since, in accordance with the provisions of the Council Regulation (EC) No. 1083/2006 of 11 July 2006, whenever state aid is provided, the share of structural funds is counted in relation to public funds.

119
8. CATEGORIES OF STRUCTURAL FUNDS INTERVENTION IN THE Y EARS 2007-2013
Indicative division of the programmed use of the funds’ contribution according to categories (in euro)
Priority questions Forms of financing Area Code Amount Code Amount Code Amount
1 357,991,950 1 8,254,885,280 PL 8,254,885,280 2 1,027,462,000 Total 8,254,885,280 Total 8,254,885,280 3 250,155,565
4 726,717,050
5 164,222,295
7 1,027,918,250
8 1,910,373,130
9 322,892,315
11 239,668,000
12 150,000,000
13 660,000,000
14 529,489,453
15 464,993,192
57 142,802,080
85 224,160,000
86 56,040,000
Total 8,254,885,280
120
Implementation of the Lisbon Strategy within priori ty axes
422. In the table, the categories of structural funds intervention in the years 2007-2013128 have been assigned to individual priority axes of the IE OP.
Inte
rven
tion
cate
gory
num
ber
Priorities Intervention categories
“Lis
bon
” ca
tego
ry
(Y/N
)
Est
imat
ed d
ivis
ion
betw
een
cate
gorie
s
Com
mun
ity
cont
ribut
ion
of
the
ER
DF
“Lis
bon
” ex
pend
iture
P I Research and development of new technologies
01 Measures in the area of research and technological development in research centres
Y 32%
04
Support for research and technological development especially for SME (including access to services related to research and technological development in research centres)
Y 65%
09 Other measures aimed at stimulating research, innovations and entrepreneurship in SME
Y 3%
1,117 1,117
P II R&D infrastructure
02
Infrastructure related to research and technological development (including systems, instrumentation and fast computer lines connecting research centres) and competence centres related to concrete technologies
Y 92%
11 Information and communication technologies (access, safety, interoperation, risk prevention, research, innovations)
Y 8%
1,117 1,117
P III Capital for innovation 289 289
128 Pursuant to the requirements of Article 36, paragraph 1, letter d) of Council Regulation No. 1083/2006 and in accordance with the list of intervention categories proposed by the European Commission in the draft executive regulation of 23 October 2006.
121
Inte
rven
tion
cate
gory
num
ber
Priorities Intervention categories
“Lis
bon”
cat
egor
y (Y
/N)
Est
imat
ed d
ivis
ion
betw
een
cate
gorie
s
Com
mun
ity
cont
ribut
ion
of
the
ER
DF
“Lis
bon”
ex
pend
iture
07
Investments in enterprises directly involved in research and innovations (innovative technologies, establishment of new enterprises by universities, R&D centres or already existing enterprises)
Y 32.3%
09 Other measures for stimulation of research, innovations and entrepreneurship in SME
Y 67.7%
P IV Investments in innovative undertakings
07
Investments in enterprises directly involved in research and innovations (innovative technologies, establishment of new enterprises by universities, R&D centres or already existing enterprises)
Y 32.2%
08 Other investments in enterprises N 67.8%
2,813 934
P V Diffusion of innovation
03
Transfer of technologies and improvement of networks of cooperation between SME and between SME and research centres, universities and regional authorities
Y 73.7%
05 Advanced counselling for enterprises and for groups of enterprises
Y 16.5%
09 Other measures for stimulation of research, innovations and entrepreneurship in SME
Y 9.8%
339 339
P VI Polish economy on the international market
05 Advanced counselling for enterprises and for groups of enterprises
Y 31%
08 Other investments in enterprises N 9%
09 Other measures for stimulation of research, innovations and entrepreneurship in SME
Y 17.8%
349 174
122
Inte
rven
tion
cate
gory
num
ber
Priorities Intervention categories
“Lis
bon”
cat
egor
y (Y
/N)
Est
imat
ed d
ivis
ion
betw
een
cate
gorie
s
Com
mun
ity
cont
ribut
ion
of
the
ER
DF
“Lis
bon”
ex
pend
iture
14 SME services and applications (eCommerce, education / trainings, network creation)
Y 1.3%
57 Assistance in improvement of tourist services N 40.9%
P VII Information society establishment and development
11 Information and communication technologies (access, safety, interoperation, risk prevention, research, innovations)
Y 7.7%
12 Information and communication technologies (TEN-ICT)
Y 7.7%
13 Services and applications for citizens (eHealth, eAdministration, eLearning, eIntegration, etc.)
Y 33.8%
14 SME services and applications (eCommerce, education / trainings, network creation)
Y 26.9%
15
Other measures aimed at improving access to and effectiveness of using information and communication technologies by small and medium-sized enterprises
Y 23.81%
1,949 1,949
P VII Technical assistance – European Regional Development Fund
85 Development, implementation, monitoring and control
N 80%
86 Information and communication studies and assessment
N 20%
280
Allocation for 2007-2013 in total129 8,254 5,919
129 The difference between the amounts presented in the line and the sum of amounts for individual priorities comes from roundings.
123
Inte
rven
tion
cate
gory
num
ber
Priorities Intervention categories
“Lis
bon”
cat
egor
y (Y
/N)
Est
imat
ed d
ivis
ion
betw
een
cate
gorie
s
Com
mun
ity
cont
ribut
ion
of
the
ER
DF
“Lis
bon”
ex
pend
iture
Out of which: expenditure for the implementation of the Lisbon Strategy
71.7%
423. As has been shown in the table above, about 71.7% of the total funds under the IE OP will be earmarked for the categories of intervention subject to the “earmarking” principle. This means that they will be designated for achieving the objectives of the Lisbon Strategy that have been set out in annex IV to Council Regulation No. 1083/2006130.
130 According to the provisions of Council Regulation (WE) of 11 July 2006 laying down general provisions on the European Regional Development Fund, the European Social Fund and the Cohesion Fund and repealing Regulation (EC) No. 1260/1999.

124
9. ANNEXES:
9.1. Indicative financial table of liabilities for the Programme according to priority axes and years (in EUR131)
European Union National public contribution
Out of which Total Public funds (EU + national) NSRF in total
ERDF ESF CF Total State budget
Budget of local
government entities
Other Private
Intervention category code
Years
1=2+11 2=3+7 3=4+5+6 4 5 6 7=8+9+10 8 9 10 11 12 Priority axis I 01,04,09
2007 184 243 396 184 243 396 156 606 887 156 606 887 0 0 27 636 509 27 636 509 0 0 0 2008 188 557 804 188 557 804 160 274 133 160 274 133 0 0 28 283 671 28 283 671 0 0 0 2009 192 843 805 192 843 805 163 917 234 163 917 234 0 0 28 926 571 28 926 571 0 0 0 2010 190 328 102 190 328 102 161 778 887 161 778 887 0 0 28 549 215 28 549 215 0 0 0 2011 186 774 086 186 774 086 158 757 973 158 757 973 0 0 28 016 113 28 016 113 0 0 0 2012 183 333 428 183 333 428 155 833 414 155 833 414 0 0 27 500 014 27 500 014 0 0 0 2013 188 189 967 188 189 967 159 961 472 159 961 472 0 0 28 228 495 28 228 495 0 0 0
2007-2013 1 314 270 588 1 314 270 588 1 117 130 000 1 117 130 000 197 140 588 197 140 588 Priority axis II 02,11
2007 184 243 396 184 243 396 156 606 887 156 606 887 0 0 27 636 509 27 636 509 0 0 0 2008 188 557 804 188 557 804 160 274 133 160 274 133 0 0 28 283 671 28 283 671 0 0 0 2009 192 843 805 192 843 805 163 917 234 163 917 234 0 0 28 926 571 28 926 571 0 0 0 2010 190 328 102 190 328 102 161 778 887 161 778 887 0 0 28 549 215 28 549 215 0 0 0 2011 186 774 086 186 774 086 158 757 973 158 757 973 0 0 28 016 113 28 016 113 0 0 0 2012 183 333 428 183 333 428 155 833 414 155 833 414 0 0 27 500 014 27 500 014 0 0 0 2013 188 189 967 188 189 967 159 961 472 159 961 472 0 0 28 228 495 28 228 495 0 0 0
2007-2013 1 314 270 588 1 314 270 588 1 117 130 000 1 117 130 000 197 140 588 197 140 588
131 The amounts presented in the table refer to current prices.

125
Priority axis III 07,09 2007 47 663 514 47 663 514 40 513 987 40 513 987 0 0 7 149 527 7 149 527 0 0 0 2008 48 779 646 48 779 646 41 462 699 41 462 699 0 0 7 316 947 7 316 947 0 0 0 2009 49 888 428 49 888 428 42 405 164 42 405 164 0 0 7 483 264 7 483 264 0 0 0 2010 49 237 619 49 237 619 41 851 976 41 851 976 0 0 7 385 643 7 385 643 0 0 0 2011 48 318 200 48 318 200 41 070 470 41 070 470 0 0 7 247 730 7 247 730 0 0 0 2012 47 428 106 47 428 106 40 313 890 40 313 890 0 0 7 114 216 7 114 216 0 0 0 2013 48 684 487 48 684 487 41 381 814 41 381 814 0 0 7 302 673 7 302 673 0 0 0
2007-2013 340 000 000 340 000 000 289 000 000 289 000 000 51 000 000 51 000 000
Priority axis IV 07,08 2007 463 977 756 463 977 756 394 381 093 394 381 093 0 0 69 596 663 67 143 394 0 2 453 269 0 2008 474 842 675 474 842 675 403 616 274 403 616 274 0 0 71 226 401 68 715 684 0 2 510 717 0 2009 485 636 053 485 636 053 412 790 645 412 790 645 0 0 72 845 408 70 277 621 0 2 567 787 0 2010 479 300 791 479 300 791 407 405 672 407 405 672 0 0 71 895 119 69 360 830 0 2 534 289 0 2011 470 350 761 470 350 761 399 798 147 399 798 147 0 0 70 552 614 68 065 648 0 2 486 966 0 2012 461 686 198 461 686 198 392 433 268 392 433 268 0 0 69 252 930 66 811 777 0 2 441 153 0 2013 473 916 354 473 916 354 402 828 901 402 828 901 0 0 71 087 453 68 581 634 0 2 505 819 0
2007-2013 3 309 710 588 3 309 710 588 2 813 254 000 2 813 254 000 496 456 588 478 956 588 17 500 000 Priority axis V 03,05,09
2007 55 934 206 55 934 206 47 544 075 47 544 075 0 0 8 390 131 8 390 131 0 0 0 2008 57 244 012 57 244 012 48 657 410 48 657 410 0 0 8 586 602 8 586 602 0 0 0 2009 58 545 192 58 545 192 49 763 413 49 763 413 0 0 8 781 779 8 781 779 0 0 0 2010 57 781 453 57 781 453 49 114 235 49 114 235 0 0 8 667 218 8 667 218 0 0 0 2011 56 702 494 56 702 494 48 197 120 48 197 120 0 0 8 505 374 8 505 374 0 0 0 2012 55 657 950 55 657 950 47 309 258 47 309 258 0 0 8 348 692 8 348 692 0 0 0 2013 57 132 340 57 132 340 48 562 489 48 562 489 0 0 8 569 851 8 569 851 0 0 0
2007-2013 398 997 647 398 997 647 339 148 000 339 148 000 59 849 647 59 849 647 Priority axis VI 05,08,09,14,57
2007 57 565 333 57 565 333 48 930 533 48 930 533 0 0 8 634 800 7 853 076 781 724 0 0 2008 58 913 335 58 913 335 50 076 335 50 076 335 0 0 8 837 000 8 036 971 800 029 0 0 2009 60 252 460 60 252 460 51 214 591 51 214 591 0 0 9 037 869 8 219 655 818 214 0 0

126
2010 59 466 449 59 466 449 50 546 482 50 546 482 0 0 8 919 967 8 112 427 807 540 0 0 2011 58 356 028 58 356 028 49 602 624 49 602 624 0 0 8 753 404 7 960 943 792 461 0 0 2012 57 281 022 57 281 022 48 688 869 48 688 869 0 0 8 592 153 7 814 290 777 863 0 0 2013 58 798 408 58 798 408 49 978 646 49 978 646 0 0 8 819 762 8 021 293 798 469 0 0
2007-2013 410 633 035 410 633 035 349 038 080 349 038 080 61 594 955 56 018 655 5 576 300
Priority axis VII 11,12,13,14,15 2007 321 602 585 321 602 585 273 362 197 273 362 197 0 0 48 240 388 48 240 388 0 0 0 2008 329 133 519 329 133 519 279 763 491 279 763 491 0 0 49 370 028 49 370 028 0 0 0 2009 336 614 866 336 614 866 286 122 636 286 122 636 0 0 50 492 230 50 492 230 0 0 0 2010 332 223 627 332 223 627 282 390 083 282 390 083 0 0 49 833 544 49 833 544 0 0 0 2011 326 019 983 326 019 983 277 116 986 277 116 986 0 0 48 902 997 48 902 997 0 0 0 2012 320 014 208 320 014 208 272 012 077 272 012 077 0 0 48 002 131 48 002 131 0 0 0 2013 328 491 447 328 491 447 279 217 730 279 217 730 0 0 49 273 717 49 273 717 0 0 0
2007-2013 2 294 100 235 2 294 100 235 1 949 985 200 1 949 985 200 344 115 035 344 115 035
Priority axis VIII 85,86 2007 46 212 168 46 212 168 39 280 342 39 280 342 0 0 6 931 826 6 931 826 0 0 0 2008 47 294 313 47 294 313 40 200 167 40 200 167 0 0 7 094 146 7 094 146 0 0 0 2009 48 369 333 48 369 333 41 113 934 41 113 934 0 0 7 255 399 7 255 399 0 0 0 2010 47 738 342 47 738 342 40 577 591 40 577 591 0 0 7 160 751 7 160 751 0 0 0 2011 46 846 920 46 846 920 39 819 882 39 819 882 0 0 7 027 038 7 027 038 0 0 0 2012 45 983 931 45 983 931 39 086 340 39 086 340 0 0 6 897 591 6 897 591 0 0 0 2013 47 202 052 47 202 052 40 121 744 40 121 744 0 0 7 080 308 7 080 308 0 0 0
2007-2013 329 647 059 329 647 059 280 200 000 280 200 000 49 447 059 49 447 059
Costs in total 2007 1 361 442 354 1 361 442 354 1 157 226 001 1 157 226 001 0 0 204 216 353 200 981 360 781 724 2 453 269 0 2008 1 393 323 108 1 393 323 108 1 184 324 642 1 184 324 642 0 0 208 998 466 205 687 720 800 029 2 510 717 0 2009 1 424 993 942 1 424 993 942 1 211 244 851 1 211 244 851 0 0 213 749 091 210 363 090 818 214 2 567 787 0 2010 1 406 404 485 1 406 404 485 1 195 443 813 1 195 443 813 0 0 210 960 672 207 618 843 807 540 2 534 289 0 2011 1 380 142 558 1 380 142 558 1 173 121 175 1 173 121 175 0 0 207 021 383 203 741 956 792 461 2 486 966 0 2012 1 354 718 271 1 354 718 271 1 151 510 530 1 151 510 530 0 0 203 207 741 199 988 725 777 863 2 441 153 0 2013 1 390 605 022 1 390 605 022 1 182 014 268 1 182 014 268 0 0 208 590 754 205 286 466 798 469 2 505 819 0
127
2007-2013 9 711 629 740 9 711 629 740 8 254 885 280 8 254 885 280 0 0 1 456 744 460 1 433 668 160 5 576 300 17 500 000 0 * The volume of private funds involved has not been presented since, pursuant to the provisions of Council Regulation (EC) No. 1083/2006 of 11 July 2006, whenever state aid is involved, the share of structural funds is calculated in relation to public funds.
128
9.2. Ex-ante evaluation and assessment of the expected macroeconomic effect
1. Objective and legal basis
424. Pursuant to Article 48 of Council Regulation (EC) No. 1083/2006 of 11 July 2006 laying down general provisions on the European Regional Development Fund, the European Social Fund and the Cohesion Fund and repealing Regulation (EC) No. 1260/1999, Member States are obliged to make an ex-ante evaluation of each operational programme.
425. Ex-ante evaluation is aimed at optimising the allocation of budgetary resources within the given operational programme and at improving the programming quality. It is also aimed at identification and assessment of disproportions, gaps and development potential, objectives set, expected results, quantitative target values, if necessary: the cohesion of the strategy offered for the region, community added value, the extent to which the Community’s priorities have been taken into account, conclusions on the previous programming period and quality of implementation procedures, financial management and assessment.
426. The task to make an ex-ante evaluation was commissioned to independent experts selected through open tender. The study was developed by CASE-Doradcy in the period between 11 September and 30 November 2006. The whole report is available at the seat of the IE OP Managing Authority.
2. Scope of the evaluation
2.1. Social and economic analysis and accuracy of the strategy offered against the identified needs
427. According to the evaluators, the diagnosis of the socio-economic situation presented in the IE OP is accurate and comprehensive. As a result of the study, however, some problems have been identified that call for verification, extension or changes.
428. Some comments made by the experts have been taken into account, and the provisions of the Programme have been corrected. As a result of the evaluators’ recommendation, the data included in the diagnosis has been updated. Besides, clearer conclusions from the quantitative data presented have been added to the diagnosis. As a result of the evaluation, the SWOT analysis has been also modified and extended – the experts suggested that a few new elements should be added with regard to both strengths and weaknesses of the examined areas, especially with regard to information society. Moreover, they suggested that it was possible to change some provisions so that they better reflect the conclusions from the socio-economic analysis presented.
2.2. Assessment of the rationality of the Programme strategy and its internal cohesion
429. Despite the recommendations related to extension or changes in some provisions in the diagnostic part that were suggested by the experts, the accuracy and cohesion of the IE OP strategy was generally assessed positively. The report has stressed, in particular, numerous links between detailed objectives and the main objective of the Programme.
129
430. The evaluators also proposed to consider a reformulation of the structure of the diagnostic part through a more complex view on the analysed areas, as this would better reflect the main idea of the IE OP.
431. In accordance with the recommendations, the structure of the diagnostic part has been modified so that to better reflect the correlations between the analysed areas: entrepreneurship, science, information society and cooperation of scientific entities with the economy sector, and a new title for the diagnostic part has been introduced, namely “Diagnosis of selected areas aimed at establishing and developing a knowledge-based economy” which reflects the complex attitude to the examined areas of innovative economy.
432. The experts suggested that, for better cohesion of the detailed objectives, the description of Priority Axis 5 should precisely state that creation of permanent and better workplaces refers to the sectors which are the vehicles of a knowledge-based economy, and, for better clarity of the document, the objective of Priority Axis 6 should be reformulated. These recommendations have been taken into account.
433. The experts also pointed out that it was necessary to specify the part dedicated to programming in the field of information society. It was suggested that a new detailed objective should be added related to establishment of an information society that would take eGovernment into account.
434. According to the recommendation, the IE OP has been extended by a new detailed objective related to the growth of the use of new information and communication technologies in the economy, coherent with the main objective of the IE OP and with the objectives set for Priority Axis 7. Therefore, the diagnosis in the area of information society and the description of Priority Axis 7 have been modified and extended.
2.3. Assessment of the cohesion of the Programme with Community, national and regional strategic documents and policies
435. The cohesion of the Programme with Community, national and regional strategic documents and horizontal policies has been confirmed.
436. The evaluators recommended to verify and extend the provisions related to eGovernment and information society as a whole in the context of strategic documents in the area of the state’s informatisation policy and information society establishment. It was also suggested that the Programme should include a broader description of the concept of a national innovation system. The majority of the comments in this area have been taken into account.
2.4. Assessment of the expected results and impact, and the assessment of the system of indicators
437. The assessment of the expected results and impact of the Programme was based on the results of the analysis of the HERMIN macroeconomic effect and expert analysis. This area was also verified on the basis of the control list of the European Commission for establishment of a system of indicators.
438. The system of IE OP indicators was positively assessed with regard to the accuracy of their selection and methodological accuracy. The experts confirmed the positive

130
effect of the IE OP on the achievement of the objectives of the EU’s socio-economic cohesion and the Lisbon objectives.
439. The experts pointed out to some areas that required specification and the majority of their recommendations have been included in the Programme. The evaluators paid attention to the question of definitions of the indicators and recommended to specify and verify them with regard to cohesion with the presented objectives of the IE OP. It was also suggested that the number of indicators should be reduced in the area of measures related to information society, and that the indicator of the main objective related to the share of employed in the economy sectors should be changed.
2.5. Assessment of the proposed solutions for the Programme implementation system
440. In the opinion of the evaluators, the structure of the IE OP implementation system is clear and it should provide for appropriate implementation of the instruments planned within the Programme.
441. The experts positively assessed both the management and monitoring system and the division of competence between the institutions responsible for the implementation of the IE OP. The evaluators also pointed out that the majority of recommendations from the evaluations made in the 2004-2006 programming period had been taken into account.
442. At the same time, potential barriers that may negatively affect the implementation of the IE OP were identified, such as, e.g. the lack of all necessary legal solutions for the years 2007-2013, insufficient human resources and the necessity to notify support programmes with regard to measures containing state aid.

131
9.3. Assessment of the expected impact on the environment
1. Objective and legal basis
443. The legal basis for development of the prognosis of the environmental impact are set out in Directive 2001/42/EC of the European Parliament and of the Council on Assessment of the Effects of Certain Plans and Programmes on the Environment (so called SEA Directive – Strategic Environmental Assessment), as well as the Act of 27 April 2001 – Environmental Protection Law132, Article 40 which imposes an obligation to take actions related to assessment of the effects of plans and programmes on the environment.
444. Pursuant to Article 4 of the preamble to Directive 2001/42/EC of the European Parliament and of the Council on Assessment of the Effects of Certain Plans and Programmes on the Environment, assessment of effects on the environment is an important tool for including environmental aspects in the process of development and adoption of programmes that may potentially have significant effects on the environment in Member States, as it ensures that such effects of plans and programmes are considered while these documents are developed and before they are adopted.
445. The objective of the prognosis was to examine and assess to what extent environmental aspects had been included in specific parts of the operational programme and in what ways. The strategic assessment of the effects of the IE OP on the environment was aimed at identifying potential and actual changes that may appear in the environment in relation to the implementation of the measures set out in the IE OP and to future use of the infrastructure and buildings.
2. Consultation process
446. The prognosis of the effects of the IE OP on the environment was developed by the PROEKO Sp. z o.o. company, selected through tender.
447. The prognosis was developed in accordance with the requirements of the Act of 27 April 2001 – Environmental Protection Law which provides for assessment of the effects of policies, strategies, plans or programmes on the environment developed, according to legal acts, by central or regional public administration bodies.
448. Pursuant to the provisions of Article 43, paragraph 2 of the Act – Environmental Protection Law, on 8 November 2006 social consultations were started related to the draft prognosis report on the effects of the draft IE OP on the environment.
449. The draft of the preliminary prognosis report on the effects on the environment, together with the draft IE OP, was placed on the website of the Ministry of Regional Development (MRR) at http://www.mrr.gov.pl/Aktualnosci/konsultacje_prognozy_ oddzialywania_srodowisko_poig.htm. It was also available at the reception in the building of the MRR (ul. Wspólna 2/4, Warsaw). The information on the commencement of the consultations was also published in “Gazeta Wyborcza”, a national daily, on 15 November 2006.
450. The preliminary version of the prognosis report on the effects of the draft IE OP on the environment was presented at the press conference dedicated to environmental
132 Journal of Laws, No. 62, item 627 with amendments.

132
effects of the IE OP that was held on 21 November 2006 in Warsaw, in which representatives of non-governmental organisations, scientific institutions and socio-economic partners took part. During the meeting, the draft IE OP was presented and the implementing body of the programme presented the conclusions from the evaluation and recommendations for the IE OP.
451. Pursuant to the provisions of Article 43, paragraph 1 of the Act – Environmental Protection Law, the preliminary prognosis report on the effects of the draft IE OP on the environment was submitted for approval to the Minister of Environment and to the Chief Sanitary Inspector.
452. The process of social consultations on the preliminary report on the assessment of the effects on the environment lasted 21 days and was completed on 29 November 2006.
453. Pursuant to the provisions of Article 44, paragraph 1 of the Act – Environmental Protection Law, the findings included in the prognosis of the effects on the environment, the opinion of the Minister of Environment and of the Chief Sanitary Inspector, as well as comments and remarks voiced by the society, have been taken into account during the development of the final version of the IE OP.
3. Findings included in the assessment of the effects of the IE OP on the environment
454. The prognosis of the effects of the draft IE OP on the environment contain, in particular:
a) analysis and assessment of the compliance of the provisions and proposals of the IE OP with the requirements, provisions and objectives of other strategic documents related to environmental protection, including international conventions and treaties binding for Poland,
b) description of environmental effects of the IE OP implementation that may be identified, in particular the measures that may potentially be a source of irreparable damage to the environment,
c) recommendations related to the ways for reducing negative effects.
3.1. Conclusions
455. The report stated that the problems of environmental protection had been presented in the IE OP in a rather general manner. The necessity to take account of the requirements of environmental protection refers to all projects, even those considered most innovative, directed towards economic development through a growth of production and services.
456. The analysis made by the independent experts shows that the IE OP should include environmental requirements of the development of an innovative economy in Poland, especially identify pro-environmental expectations that may and should be formulated with regard to innovative projects that apply for support from public resources.
457. The diagnosis and SWOT analysis do not sufficiently cover the context of sustainable development principles. The strategic European documents referred to in the IE OP, namely the Lisbon Strategy and the Goeteborg Strategy, show that the

133
ambitious objective to make the European economy the most competitive knowledge-based economy in the world in the forthcoming decade must not be achieved without taking account of environmental protection requirements which must be treated as an integral element of the development process.
458. The analysis made by the implementing body showed that the implementation of the IE OP may have a defined effect on the environment: direct, related to the implementation of some investment or modernisation projects, or indirect, related to the economic environment. The implementation of the IE OP may be also related to certain environmental effects, both immediate and long-term, that may appear after completion of the 2007-2013 programming period.
459. The analysis of the detailed objectives shows that basically there are potential favourable effects of the implementation of individual objectives of the IE OP. Potential negative indirect effects on the environment may take place in relation to the implementation of Priority Axis 3 through increasing new innovative enterprises and Priority Axis 6 through promotion of Poland as a country attractive to investors and tourists and a place where good economic relationships may be developed.
460. The results of internal cohesion at the level of the Programme’s detailed objectives showed that the possibility of potentially positive effects was 54%, of potentially negative effects – 14% and of neutral effects – 25%.
461. Environmental effects of the activities undertaken will closely depend on the absorption of the environment in the area where the given undertaking will be implemented or on existence of the so called sensitive areas. Once identified, adverse effects may be in most cases eliminated or limited on condition that soothing measures or recommendations presented in the prognosis are applied.
462. The analysis shows that projects in the area of tourism may be accompanied by a risk of environmental conflicts if the projects are directed towards modern “tourist products” (e.g. tourist thematic cycles). For this group, potential fields of risk and typical compensation measures have been indicated, however tourist facilities must not be situated in the areas of Nature 2000 or in their vicinity. The analysis also assessed the impact of the implementation of selected IE OP measures, especially greenfield investments on maintenance/improvement/deterioration of the spatial structure on the national scale. Special emphasis was placed on indirect effects of spatial fragmentation in the ecological and cultural aspect.
463. It must be stressed that the changes proposed by the implementing body do not influence the structure of the priorities and objectives set out in the IE OP, it was, however, stated that complete implementation of the IE OP objectives would start a process of dynamic changes in the Polish economy, environmental effects of which, thanks to reduction of energy consumption, material consumption and emission to the environment would be in most cases positive.
3.2. Recommendations
464. In the IE OP, the following recommendations presented by the implementing body after the assessment of the effects of the IE OP on the environment have been included:
a) the diagnostic part was extended with regard to identification of the needs and desired directions of changes in the effects of the industrial and service sector on

134
the environment in order to fulfil the requirement to integrate the horizontal objectives of environmental protection into sectoral policies and strategies,
b) recommendations related to giving priority to investments realised from scratch not only in the greenfield areas, but also in the brownfield or greyfield areas, and to directing investments to industrial or deserted post-industrial areas, or to areas agriculturally degraded. Besides, the IE OP does not define how the notions of greenfield investments and greenfield areas should be understood,
c) it must be specified which locations of projects would be preferred in the context of the Concept for Spatial Development of the Country. The IE OP should be used in order to achieve the indirect effect, namely spatial directing of the economy development while there are no clear references to these questions,
d) references to the energy effectiveness factor in innovative process have been included,
e) at the stage of works on the criteria for evaluation of projects, the Managing Authority of the IE OP will offer to include, as a post-environmental criterion of evaluation of projects, the need for the implementation of the decoupling principle, i.e. limiting the growth pace, and preferably reducing the need for energy and natural resources and, at the same time, increasing the pace of socio-economic development.
f) the IE OP has been extended by provisions related to effective use of natural resources, including non-renewable resources.
4. Opinion of the Minister of Environment and the Chief Sanitary Inspector
465. The entities set out in legal acts to which received the preliminary report on the assessment of the effects of the IE OP on the environment with a request for an opinion did not make any comments.

135
9.4. Report on social consultations
1. Objective and legal basis
466. In the 2007-2013 financial perspective, the European Union stressed the role of social, economic and self-governmental partners in the process of development of programming documents.
467. Pursuant to the provisions of Article 11 of Regulation No. 1083/2006 of 11 July 2006 laying down general provisions on the European Regional Development Fund, the European Social Fund and the Cohesion Fund and repealing Regulation (EC) No. 1260/1999, Member States, while developing documents for programming support with the European Union structural funds, are obliged to closely cooperate with socio-economic partners.
468. With regard to the use of the EU structural funds, in accordance with the said provisions, the draft IE OP adopted by the Council of Ministers on 1 August 2006 was subject to social consultations. Those consultations aimed at stirring a debate on the directions of support from European Union’s resources in the area of entrepreneurship, science and information society.
469. Works on the IE OP were a continuation of strategic works started in 2005 aimed at developing documents that would set out the intervention with the use of public funds in the area of entrepreneurship, science and information society, namely the following Operational Programmes: Innovations – Investments – Open Economy and Science – New Technologies – Information Society. The IE OP social consultations referred to social consultations related to the said programmes and the comments that were made during these consultations were an important source of knowledge and experiences used in the works on the final version of the IE OP.
2. Course
470. The IE OP consultation process lasted from May to mid-October 2006. The consultations were mainly held at press conferences, both general and thematic, at sessions of the Working Group on the IE OP and at meetings, seminars and interviews addressed to representatives of socio-economic partners, self-governmental and governmental partners and potential beneficiaries of the Programme.
471. The official opening of the consultations took place at the inauguration conference organised by the Ministry of Regional Development in Warsaw on 3 July 2006. There was also a series of thematic conferences organised in cooperation with Marshal’s Offices and economic partners, e.g. the Polish Agency for Enterprise Development (PARP). The IE OP was presented during numerous conferences and cross-sectional meetings, co-organised by socio-economic partners interested in the document for the reasons of the scope of their activity (e.g. Polish Chamber of Commerce (KIG), “Lewiatan” Polish Confederation of Private Employers (PKPP Lewiatan), Confederation of Polish Employers (KPP)) and regional partners.
472. Driven by the principle of partnership, in May 2006 the Managing Authority appointed the Working Group on the IE OP composed of representatives of socio-economic partners and representatives of self-governments and the government. Additionally, competent Intermediary Bodies appointed working groups in order to

136
consult on the instruments they were in charge of. The meetings of the Working Group and working sub-groups organised by the MA and IB aimed at presenting further drafts of the IE OP and at collecting remarks and opinions of its participants with regard to the document.
473. The IE OP was also referred to in the correspondence coming to the Ministry of Regional Development. Motions, proposals, recommendations and questions were sent by both natural persons and various institutions and organisations. Besides, MPs and senators asked many questions and developed statements with regard to the provisions of the IE OP.
474. The draft IE OP was placed on the website of the Ministry of Regional Development (www.mrr.gov.pl and www.konkurencyjnosc.gov.pl) and on the official websites of the ministries that were appointed Intermediary Bodies for the IE OP: the Ministry of Economy (www.mg.gov.pl), the Ministry of Science and Higher Education (www.mnisw.gov.pl) and the Ministry of Internal Affairs and Administration (www.mswia.gov.pl).
475. A special electronic address ([email protected]) was launched where opinions or questions related to the document could be sent via e-mail. The information on the address was placed on the websites and presented at meetings and conferences in which representatives of the MA and IB participated.
476. Consultation meetings were often held in presence of the media (the press and TV), while the information on the IE OP was made available to the public through interviews, articles and press advertisements.
3. Participants in consultations
477. The form of consultations that had been adopted was very well received by socio-economic partners, and the attendance showed that there was vast interest in the document.
478. The main participants in the meetings were entrepreneurs and representatives of business support institutions. The meetings were based on the principle of disclosure, which was reflected in an easy access to the documents in question, as well as on the principle of equality and openness, which allowed all interested parties to participate in those meetings.
479. Among the participants in the consultations, there were representatives of the following groups:
a) enterprise sector,
b) business support institutions:
- regional and local development agencies,
- chambers of commerce and industry and chambers of tourism,
- trade and service associations, associations of employers, associations supporting entrepreneurship, craft associations, etc.,
c) non-governmental organisations (economic, entrepreneurship, development),
d) special economic zones, innovation centres, technology transfer centres, industrial and technology parks, clusters and innovators,

137
e) scientific circles, higher schools, educational centres, research and development centres, scientific and research entities,
f) banks,
g) central administration and regional offices,
h) local administration (municipal and marshals’ offices),
i) media.
4. Most frequent discussion topics and comments
480. The process of IE OP social consultations resulted in numerous comments and recommendations, both general and detailed, which proves broad interest of socio-economic partners in the works on agreeing on the draft IE OP. Opinions voiced by representatives of various circles allowed for verification of the assumptions adopted in the IE OP and for setting an appropriate direction for changes in the Programme’s provisions.
481. Remarks related to the IE OP focus, in the first place, on the strategic part of the document and on the way of selection of support instruments and division of financial resources in individual areas of the IE OP with regard to:
a) establishment of a concrete, precise and not very complex definition of innovativeness, softening the criterion of innovativeness that was adopted and allowing innovative projects on a regional scale to participate in the IE OP, as well as guaranteeing objective assessment of the level of innovativeness of projects,
b) readiness of Poland for implementation of the objectives of the Lisbon Strategy and for analysing whether the IE OP should focus on support for research and innovations or rather on basic or modernisation investments,
c) cooperation of the scientific sector with the economy, i.e. designating financial means for scientific research directly for entrepreneurs,
d) focusing on support for small and medium-sized enterprises and providing possibilities to finance basic investments at the national level, including modernising investments,
e) designating a large amount of finance for direct support for entrepreneurs,
f) extension of the groups of beneficiaries in some priorities and considering various organisational forms of beneficiaries. There was also a proposal submitted to adopt the principle of an open list of entities that can apply for co-financing,
g) scope of intervention set out in individual priorities,
h) informatisation – whether within the IE OP funds should be spent only on establishment of eAdministration for enterprises or on comprehensive support for instruments related to eEconomy, eScience and eAdministration,
i) financial allocations for individual priorities within the IE OP,
j) establishing a demarcation line between the IE OP and Regional Operational Programmes. The most frequently discussed question related to demarcation was the lower limit of investment projects at the level of EUR 2 million,
k) support for entrepreneurs in applying for EU funds, e.g. with regard to development of applications for co-financing,

138
l) proposal to develop a glossary that would explain the notions and abbreviations used in the IE OP,
m) proposal to precisely define beneficiaries in the IE OP priorities and to identify their organisational and legal forms. It was also suggested that the definitions of individual beneficiaries should be unified, as well as the names and notions in all operational programmes,
n) limited clarity of the IE OP. It was suggested that it should be divided, as the SPO WKP, into a part for entrepreneurs, a part for business support institutions (BSI) and technical assistance,
o) include commercial banks in the system for absorption of the structural funds in the years 2007-2013.
5. Conclusions
482. The draft IE OP that was consulted on was well received, and the participants in the consultations often expressed the opinion that the instruments offered by the IE OP are coherent and adjusted to the needs of the Polish economy and science, and at the same time take into account mid- and long-term objectives set out in these areas in strategic national and Community documents.
483. As a result of consultations, the draft IE OP was amended on the basis of some of the comments and proposals that had been presented. The changes introduced into the IE OP refer to its all parts:
a) its name, which originally was Competitive Economy and has been changed to Innovative Economy133,
b) the introduction, where the notion of innovativeness has been explained and the specificity of innovative projects implemented within the IE OP has been pointed out,
c) the diagnosis, which has been verified so that to include present statistical data and the area of services and innovative society, as well as the effects of the use of pre-accession/ structural funds on individual economy sectors, which presents a clear picture of the situation before the implementation of the IE OP,
d) the SWOT analysis, to which the elements of information society have been added,
e) the strategy, which has been extended by the explanation of the importance of innovativeness and due to increased allocation for the area of information society, the main objective has been changed and one more detailed objective of the IE OP has been added,
f) the priority axes and some of their instruments, which have been facilitated as a result of beneficiaries’ proposals, in particular:
133 The name of the Programme within the National Strategic Reference Framework 2007-2013 was changed, on the basis of the decision of the Council of Ministers of 5 May 2006, from the Competitive Economy Operational Programme 2007-2013 to the Innovative Economy Operational Programme 2007-2013. The name Innovative Economy better reflects the plans Poland intends to implement with the use of the EU structural funds. Simultaneously, it reflects the objectives of the renewed Lisbon Strategy. The name Competitive Economy does not meet the objectives of the Programme and it could be misleading to potential beneficiaries.

139
- a coherent instrument for entrepreneurs has been established that allows for obtaining support for research and development works and implementation of their results within one project,
- the scope of Priority Axis 7 has been extended by instruments for entrepreneurs and broad eServices,
- the idea of financing of research implemented within international cooperation has been abandoned,
g) the IE OP monitoring indicators – the indicators have been specified within the IE OP objectives and priority axes,
h) financial allocations – as a result of consultation a decision has been taken to designate a bigger amount of resources for support for investments and for more comprehensive support for information society establishment in Poland,
i) the glossary explaining some notions and abbreviations used in the IE OP.

140
9.5 INDICATIVE LIST OF MAJOR PROJECTS
Name of the project / scope of the investment
Approximate total cost of
the investment (in million
EUR)
Expected time for
implementation of the project
Location Institution responsible
for the project implementation
1 2 3 4 5
Priority Axis 1. Research and development of new technologies
Intermediary Body – Ministry of Science and Higher Education (MNiSW)
Implementation of high temperature reactor technology in Poland
100 2007-2013 Whole country
Consortium of scientific entities and
entrepreneurs* *(final composition to
be agreed on)
Priority Axis 2. R&D infrastructure
Intermediary Body – Ministry of Science and Higher Education (MNiSW)
Centre for Advanced Materials and Technologies
100 2007-2013 Warszawa Warsaw University of
Technology
Centre for Preclinical and Technological Research
100 2007-2013 Warszawa Medical University
Dolnośląskie Centre for Materials and Biomaterials Wrocław Research Centre (EIT+)
120 2007-2013 Wrocław
Wrocław University of
Technology
Wrocław University
Wielkopolska Centre for Advanced Technologies in Poznań
70 2007-2013 Poznań Adam Mickiewicz
University
Priority Axis 5. Diffusion of innovation
Intermediary Body – Ministry of Economy
Warsaw Technology Park - Phase I, Construction of Micro- and Nanotechnologies in the Warsaw Technology Park
53.1 2007-2010 Mazowieckie Warsaw Technology
Park
Priority Axis 7. Information society establishment and development
Intermediary Body – Ministry of Internal Affairs and Administration Electronic Platform for Collecting, Analysing and Giving Access to Digital Resources related to Medical Events
200 2007-2010 Whole country
Ministry of Health/Centre for
Healthcare Information Systems
pl.ID – Polish ID card 110 2008-2013 Not applicable -
IT project
Ministry of Internal Affairs and
Administration

141
10. L IST OF ABBREVIATIONS USED IN THE PROGRAMME
ARP S.A. – Industrial Development Agency BA – Business Angels BERD – business expenditure on research and development BIN – Business Information Network BPO – business process offshoring BSI – business support institution CAT – Centre of Advanced Technologies CE – Centre of Excellence EC – European Commission EIT+ – European Institute of Technology+ EPO – European Patent Office EU – European Union FDI – foreign direct investments GDP – gross domestic product GERD – gross expenditure on research and development GOW – knowledge based economy GUS – Central Statistical Office IBnGR – Gdańsk Institute for Market Economics ICT – information and communication technologies JBR – research and development entities KBN – State Committee for Scientific Research KIG – Polish Chamber of Commerce KPP – Confederation of Polish Employers KSI – National Innovation Network KSU – National SME Services Network MG – Ministry of Economy MGiP – Ministry of Economy and Labour MNiSW – Ministry of Science and Higher Education MRR – Ministry of Regional Development NBP – National Bank of Poland NOT – Polish Federation of Engineering Associations NSRF – National Strategic Reference Framework OECD – Organisation for Economic Cooperation and Development OSR – regulation impact assessment PAIiIZ – Polish Information and Foreign Investment Agency PAN – Polish Academy of Sciences PARP – Polish Agency for Enterprise Development PE – private equity PHARE – Poland and Hungary Assistance for Reconstructing of their Economies PKPP – “Lewiatan” Polish Confederation of Private Employers IE OP – Innovative Economy Operational Programme POT – Polish Tourism Organisation R&D – Research and Development R&TD – Research and Technological Development RIA – regulation impact assessment RIF – Regional Financing Institution

142
ROP – Regional Operational Programme RIS – Regional Innovation Strategies SAPARD – Special Accession Programme for Agriculture and Rural Development SEM – Single European Market SITC – Standard International Trade Classification SME – small and medium-sized enterprises SPO WKP – Improvement of the Competitiveness of Enterprises Sectoral Operational
Programme Sp. z o.o. – limited liability company SSE – Special Economic Zone TTC – Technology Transfer Centre UNESCO – United Nations Educational Scientific and Cultural Organisation UOKiK – Office of Competition and Consumer Protection UP RP – Patent Office of the Republic of Poland US PTO – United States Patent and Trademark Office VC – venture capital