Embed Size (px)
Citation preview
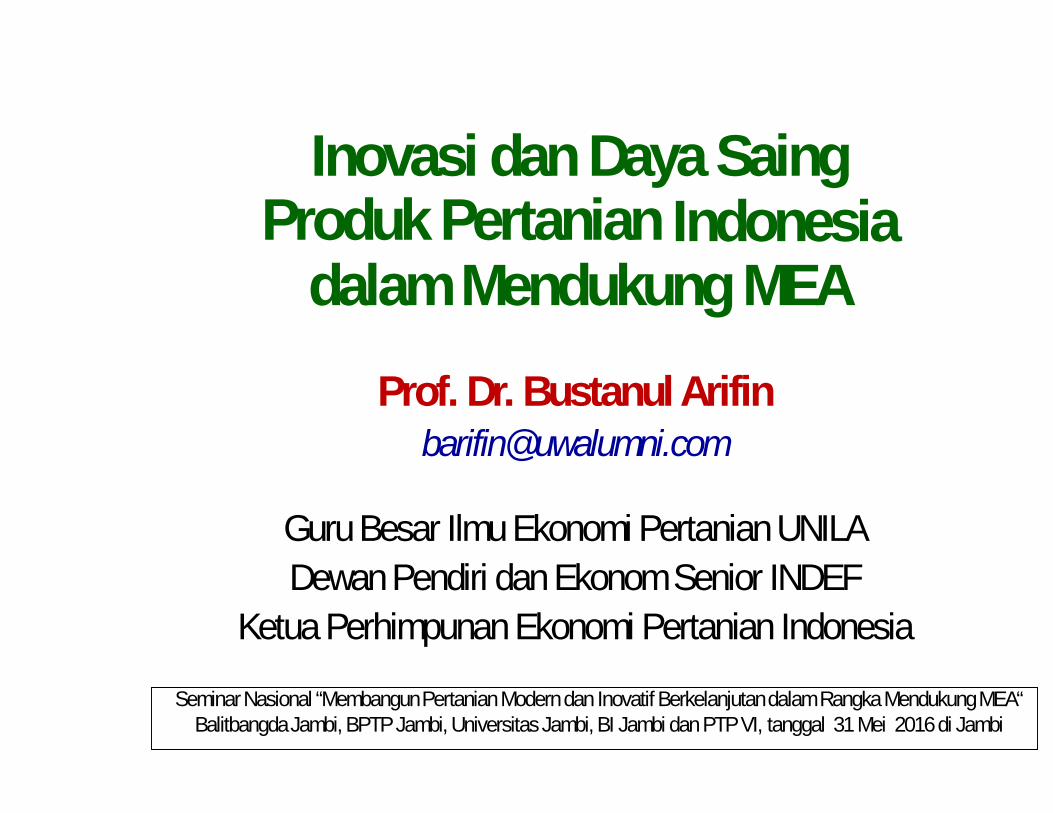
Inovasi dan Daya SaingProduk Pertanian Indonesia
dalam Mendukung MEAProf. Dr. Bustanul Arifin
Guru Besar Ilmu Ekonomi Pertanian UNILADewan Pendiri dan Ekonom Senior INDEF
Ketua Perhimpunan Ekonomi Pertanian Indonesia
Seminar Nasional “Membangun Pertanian Modern dan Inovatif Berkelanjutan dalam Rangka Mendukung MEA“Balitbangda Jambi, BPTP Jambi, Universitas Jambi, BI Jambi dan PTP VI, tanggal 31 Mei 2016 di Jambi
Sistematika Pembahasan1. Update Ekonomi Global dan Ekonomi Nasional2. Pertanian Indonesia: Kapasitas Produksi Menurun3. Dari Keunggulan Komparatif ke Keunggulan Kompetitif4. Geo-Ekonomi Global: Kerangka ASEAN Community5. Dayasaing: Pertarungan Inovasi dan Business Model6. Rekomendasi: Perbaikan Ekosistem dan Kreativitas
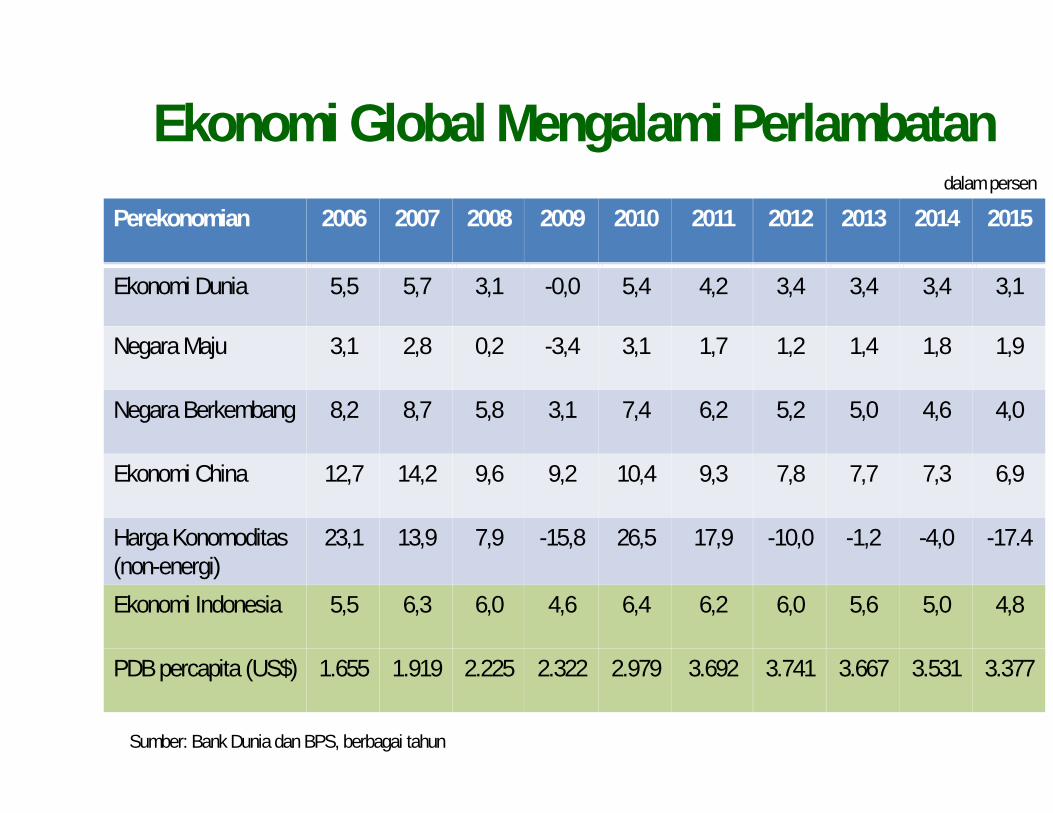
Ekonomi Global Mengalami Perlambatandalam persen
Perekonomian 2006 2007 2008 2009 2010 2011 2012 2013 2014 2015
Ekonomi Dunia 5,5 5,7 3,1 -0,0 5,4 4,2 3,4 3,4 3,4 3,1
Negara Maju 3,1 2,8 0,2 -3,4 3,1 1,7 1,2 1,4 1,8 1,9
Negara Berkembang 8,2 8,7 5,8 3,1 7,4 6,2 5,2 5,0 4,6 4,0
Ekonomi China 12,7 14,2 9,6 9,2 10,4 9,3 7,8 7,7 7,3 6,9
Harga Konomoditas(non-energi)
23,1 13,9 7,9 -15,8 26,5 17,9 -10,0 -1,2 -4,0 -17.4
Ekonomi Indonesia 5,5 6,3 6,0 4,6 6,4 6,2 6,0 5,6 5,0 4,8
PDB percapita (US$) 1.655 1.919 2.225 2.322 2.979 3.692 3.741 3.667 3.531 3.377
Sumber: Bank Dunia dan BPS, berbagai tahun
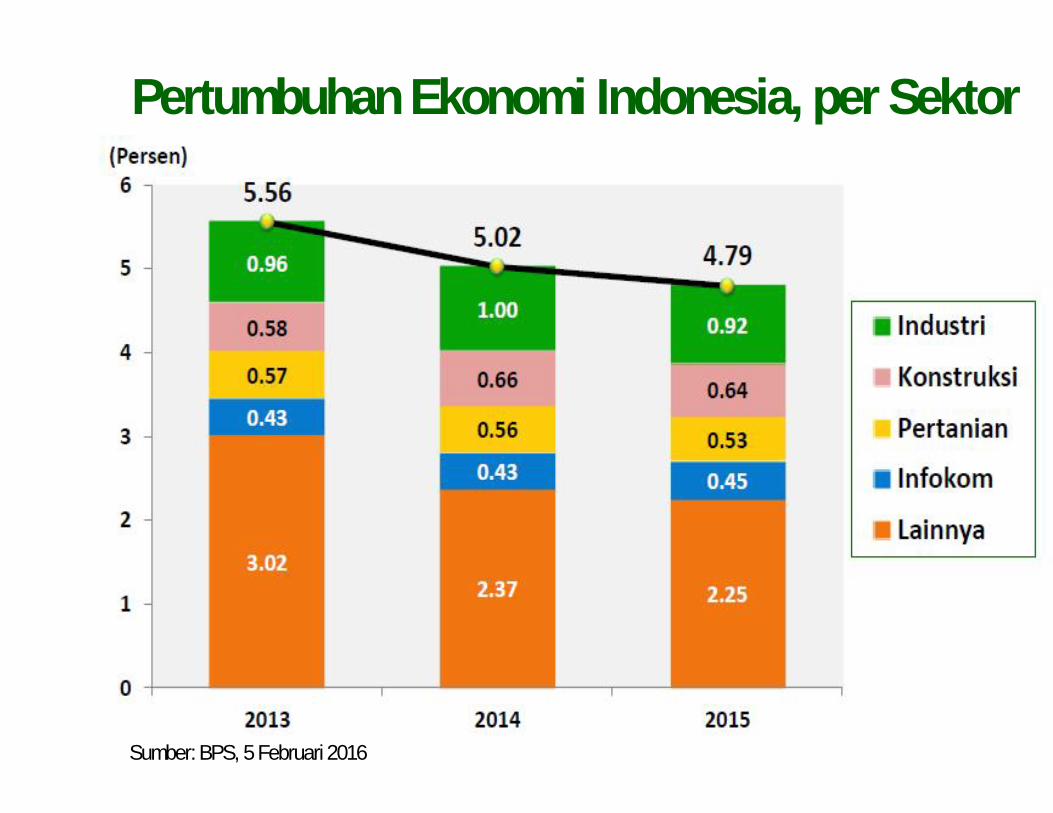
Pertumbuhan Ekonomi Indonesia, per Sektor
Sumber: BPS, 5 Februari 2016
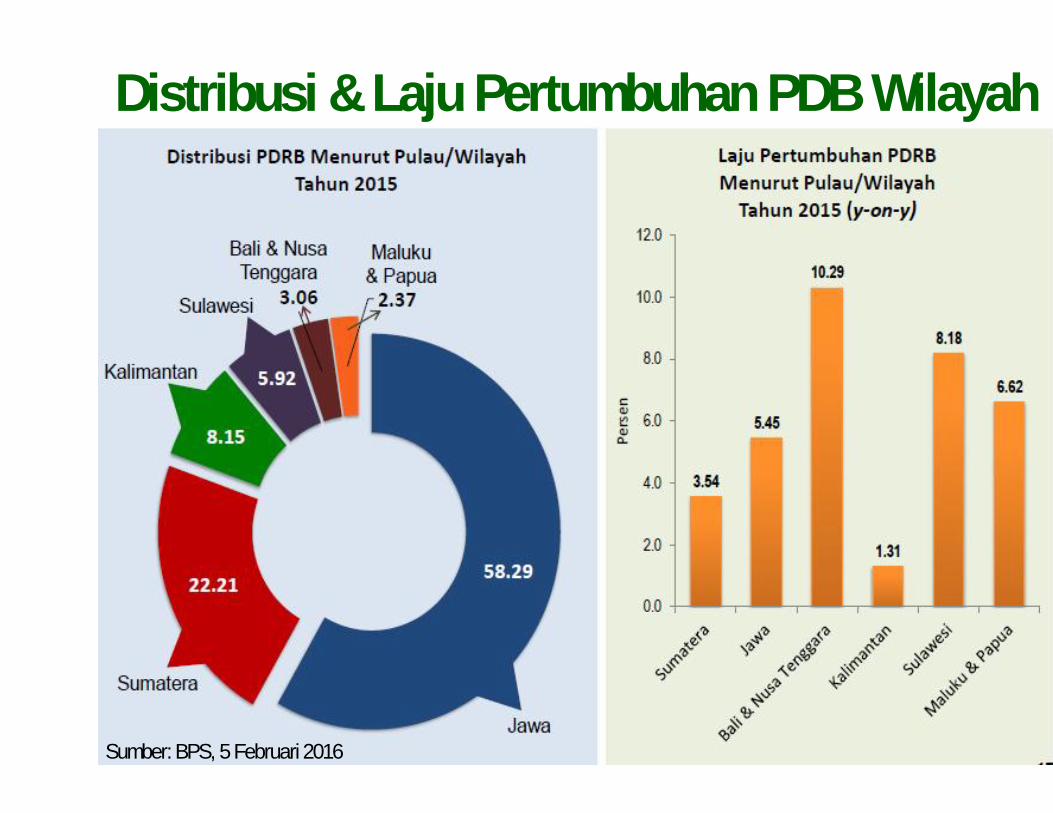
Distribusi & Laju Pertumbuhan PDB Wilayah
Sumber: BPS, 5 Februari 2016
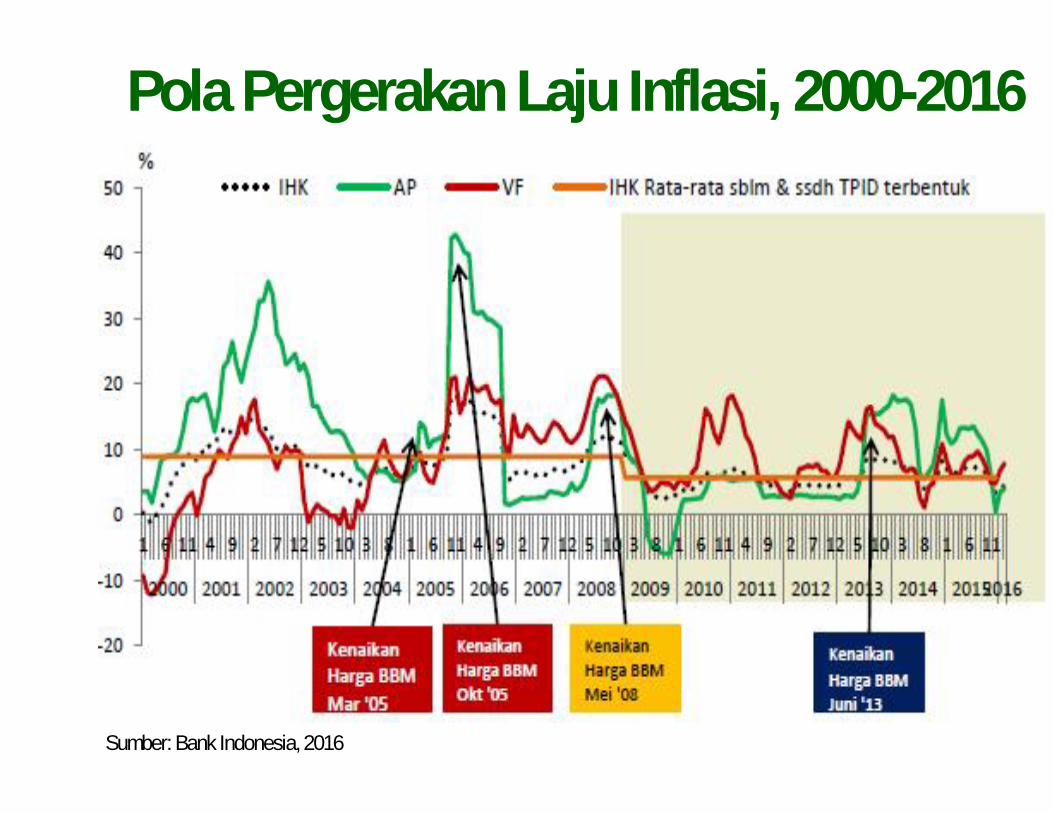
Pola Pergerakan Laju Inflasi, 2000-2016
Sumber: Bank Indonesia, 2016
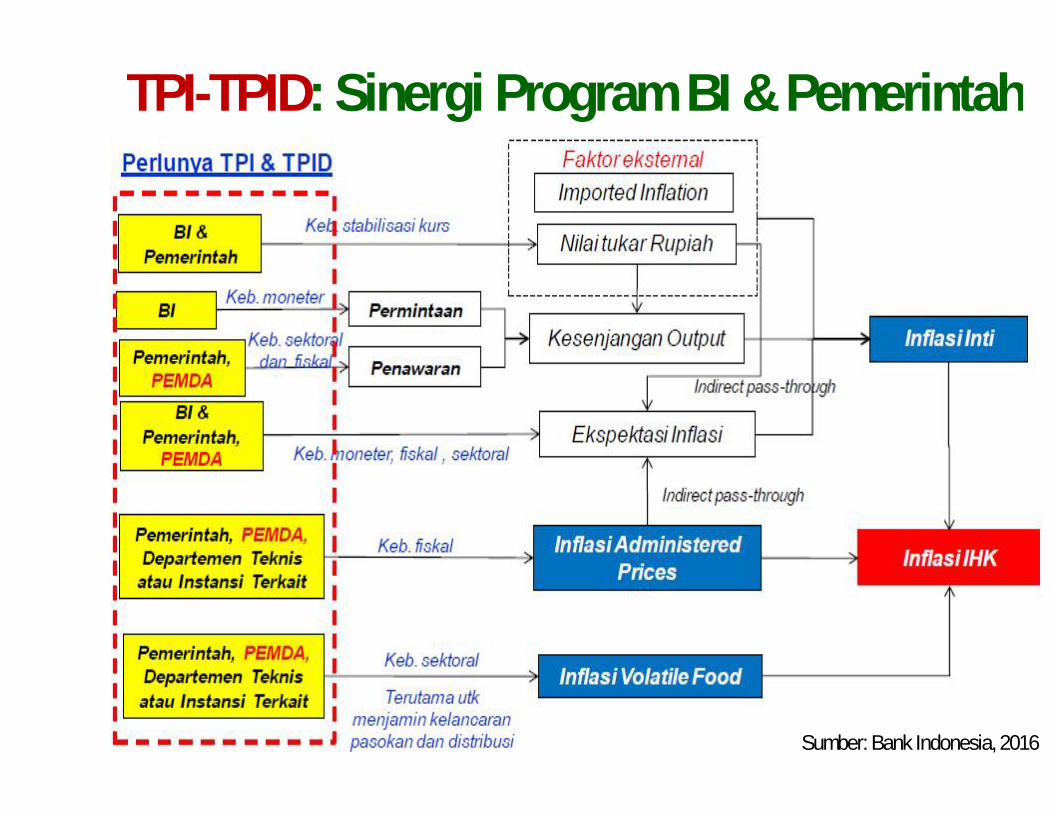
TPI-TPID: Sinergi Program BI & Pemerintah
Sumber: Bank Indonesia, 2016
Pertanian Indonesia: Kapasitas Produksi Menurun• Kapasitas produksi pertanian pertanian sudah menurun,
baik sumberdaya alam, maupun sumberdaya manusia.• Peningkatan produksi pangan tidak banyak didorong oleh
perubahan teknologi pertanian dan adaptasi inovasi baru;• Total factor productivity (TFP) pertanian Indonesia 1%
(ASEAN 1,4%), lebih didorong perubahan efisiensi teknis(TEC), bukan perubahan teknologi (TC) (Suo, 2014);
• Pemerintahan membuat Upaya Khusus PeningkatanProduksi Padi, Jagung dan Kedelai (Upsus Pajale), yangbelum terbukti memecahkan masalah kapasitas produksi.
• Akibatnya, persoalan struktur dan tingkah laku pasarkomoditas pangan tidak tertangani secara sistematis.
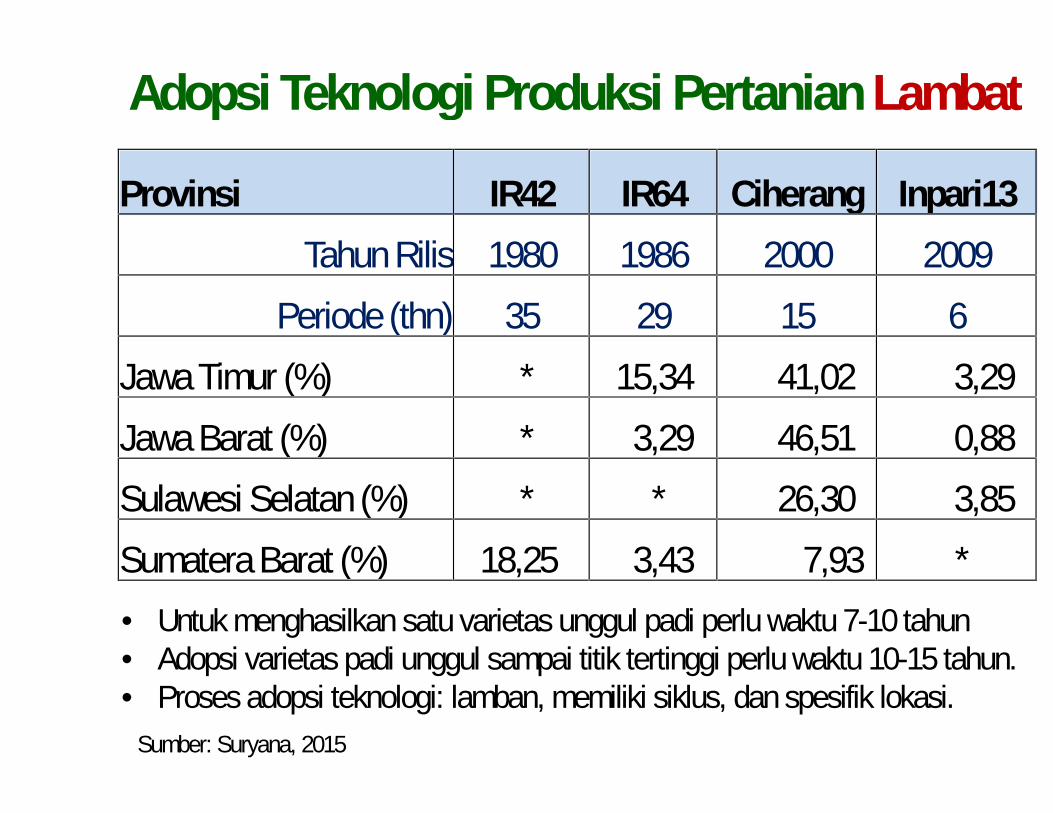
Adopsi Teknologi Produksi Pertanian Lambat
Provinsi IR42 IR64 Ciherang Inpari13Tahun Rilis 1980 1986 2000 2009
Periode (thn) 35 29 15 6Jawa Timur (%) * 15,34 41,02 3,29Jawa Barat (%) * 3,29 46,51 0,88Sulawesi Selatan (%) * * 26,30 3,85Sumatera Barat (%) 18,25 3,43 7,93 *• Untuk menghasilkan satu varietas unggul padi perlu waktu 7-10 tahun• Adopsi varietas padi unggul sampai titik tertinggi perlu waktu 10-15 tahun.• Proses adopsi teknologi: lamban, memiliki siklus, dan spesifik lokasi.
Sumber: Suryana, 2015
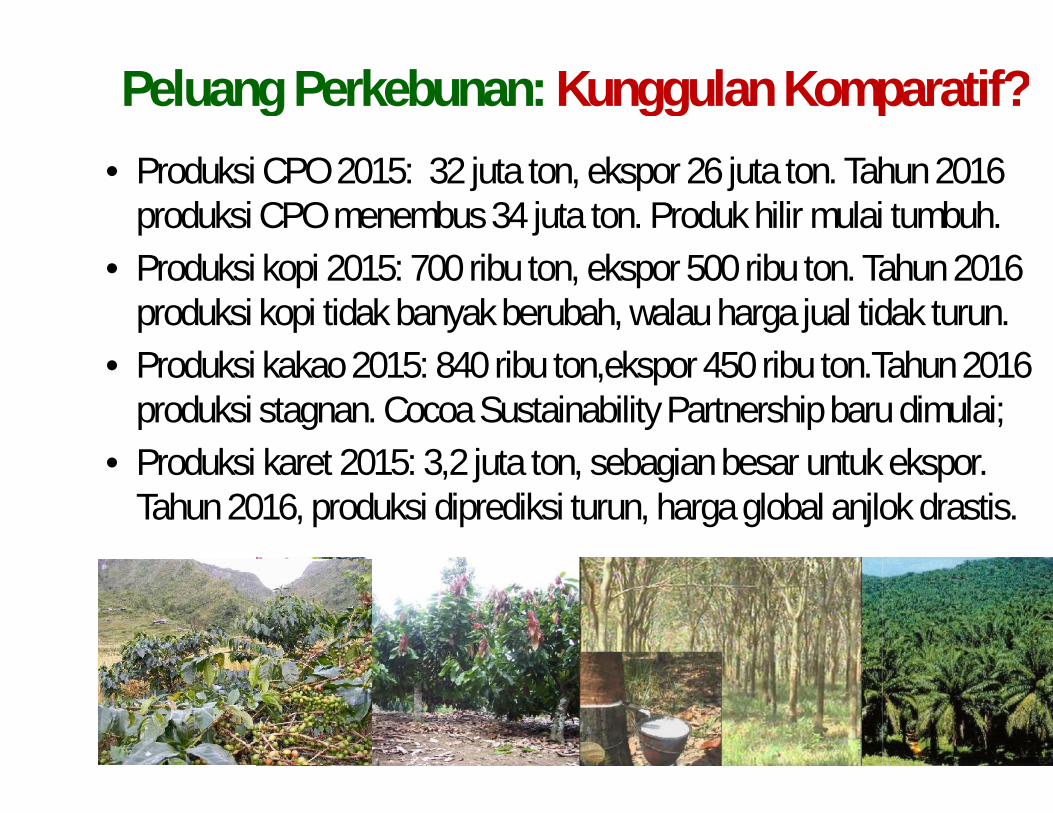
Peluang Perkebunan: Kunggulan Komparatif?• Produksi CPO 2015: 32 juta ton, ekspor 26 juta ton. Tahun 2016
produksi CPO menembus 34 juta ton. Produk hilir mulai tumbuh.• Produksi kopi 2015: 700 ribu ton, ekspor 500 ribu ton. Tahun 2016
produksi kopi tidak banyak berubah, walau harga jual tidak turun.• Produksi kakao 2015: 840 ribu ton,ekspor 450 ribu ton.Tahun 2016
produksi stagnan. Cocoa Sustainability Partnership baru dimulai;• Produksi karet 2015: 3,2 juta ton, sebagian besar untuk ekspor.
Tahun 2016, produksi diprediksi turun, harga global anjlok drastis.
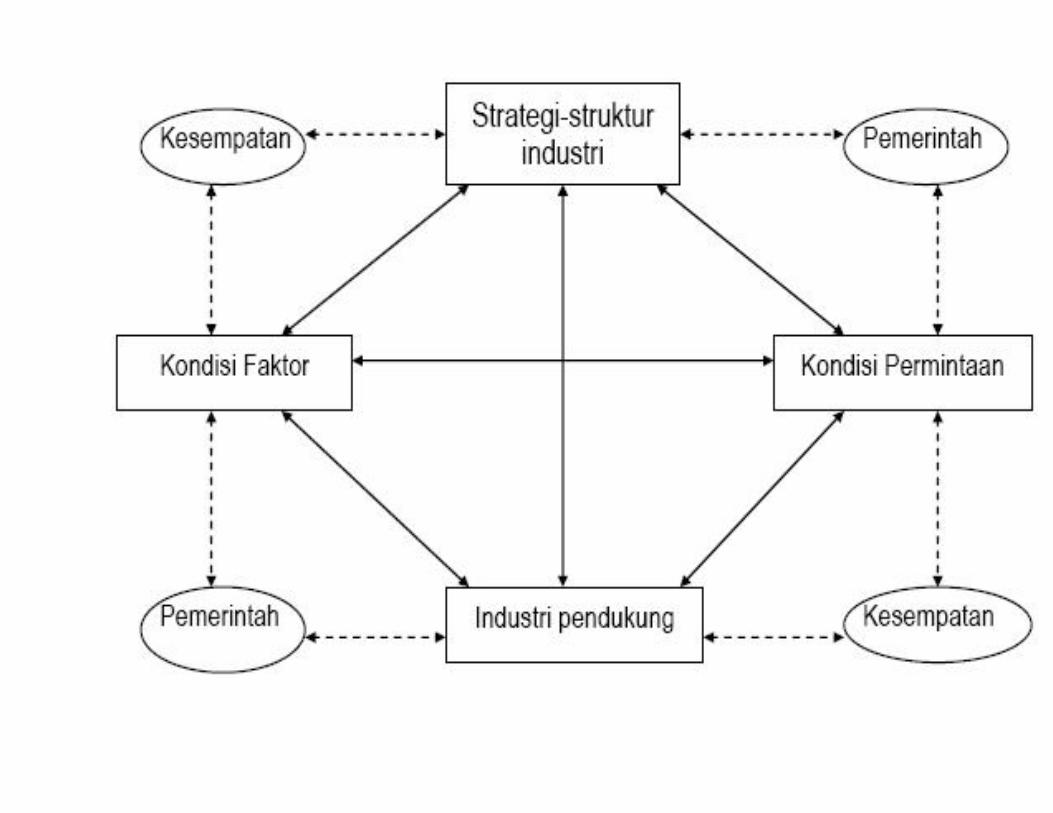
Fokus Dayasaing: Keunggulan Kompetitif?• Pembangunan pertanian Indonsia perlu megubah strategi
untuk lebih berbasis pada pengembangan dayasaingekonomi berbasis pengetahuan dan inovasi baru yangmensyaratkan empat aspek dari Porter’s Diamond:
1. Kondisi faktor produksi: ter-spesialisasi, tenaga terampil2. Kondisi permintaan: konsumen makin canggih (rewel?)3. Industri pendukung: kluster utuh, referensi, suplier4. Stretagi dan struktur organisasi: persaingan, rivalitas• Plus peran pemerintah dapat bersifat positif atau negatif• Plus kesempatan tertentu dapat mendorong dayasaing
Prinsip Dayasaing: Tingkat Mikro dan Makro
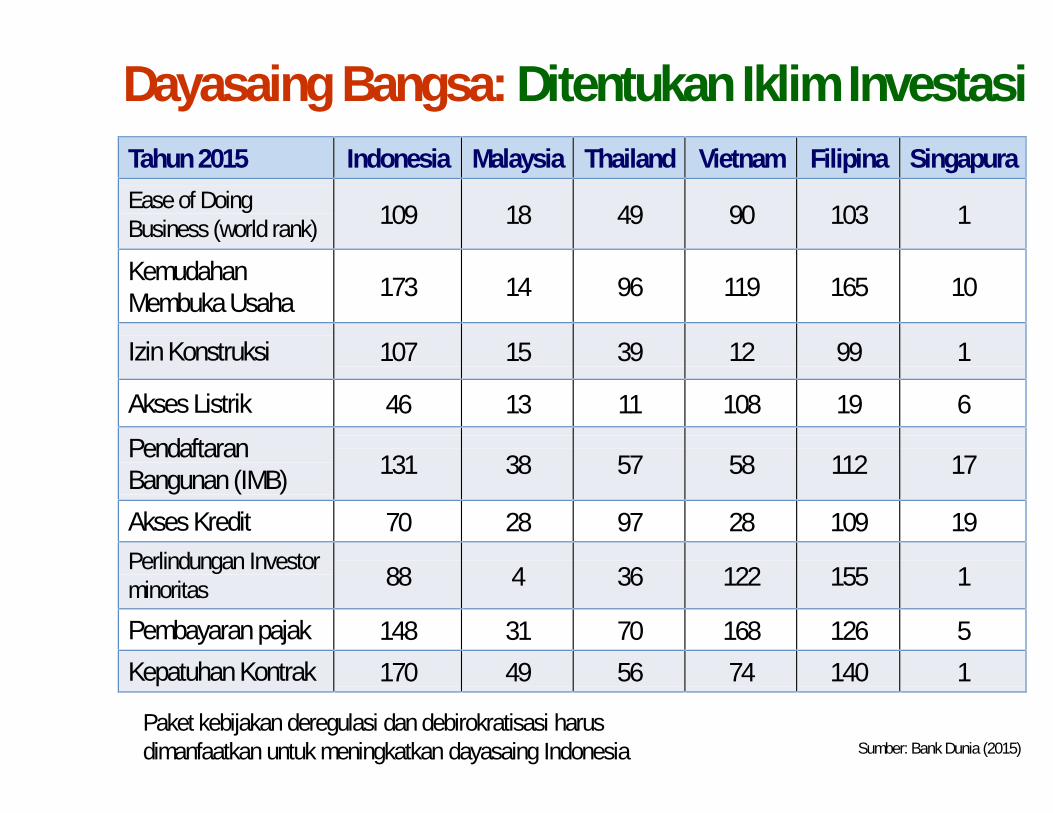
Dayasaing Bangsa: Ditentukan Iklim InvestasiTahun 2015 Indonesia Malaysia Thailand Vietnam Filipina SingapuraEase of DoingBusiness (world rank) 109 18 49 90 103 1
KemudahanMembuka Usaha 173 14 96 119 165 10
Izin Konstruksi 107 15 39 12 99 1
Akses Listrik 46 13 11 108 19 6PendaftaranBangunan (IMB) 131 38 57 58 112 17
Akses Kredit 70 28 97 28 109 19Perlindungan Investorminoritas 88 4 36 122 155 1
Pembayaran pajak 148 31 70 168 126 5Kepatuhan Kontrak 170 49 56 74 140 1
Paket kebijakan deregulasi dan debirokratisasi harusdimanfaatkan untuk meningkatkan dayasaing Indonesia Sumber: Bank Dunia (2015)
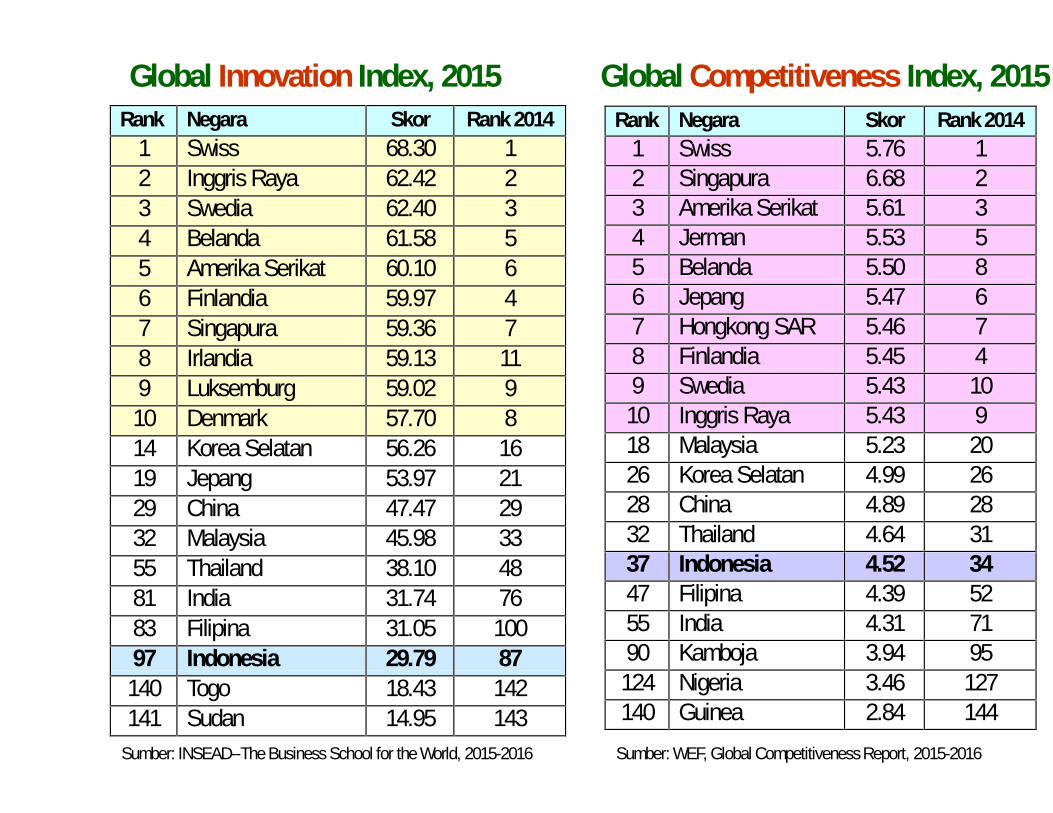
Rank Negara Skor Rank 20141 Swiss 5.76 12 Singapura 6.68 23 Amerika Serikat 5.61 34 Jerman 5.53 55 Belanda 5.50 86 Jepang 5.47 67 Hongkong SAR 5.46 78 Finlandia 5.45 49 Swedia 5.43 1010 Inggris Raya 5.43 918 Malaysia 5.23 2026 Korea Selatan 4.99 2628 China 4.89 2832 Thailand 4.64 3137 Indonesia 4.52 3447 Filipina 4.39 5255 India 4.31 7190 Kamboja 3.94 95124 Nigeria 3.46 127140 Guinea 2.84 144
Global Innovation Index, 2015 Global Competitiveness Index, 2015Rank Negara Skor Rank 2014
1 Swiss 68.30 12 Inggris Raya 62.42 23 Swedia 62.40 34 Belanda 61.58 55 Amerika Serikat 60.10 66 Finlandia 59.97 47 Singapura 59.36 78 Irlandia 59.13 119 Luksemburg 59.02 910 Denmark 57.70 814 Korea Selatan 56.26 1619 Jepang 53.97 2129 China 47.47 2932 Malaysia 45.98 3355 Thailand 38.10 4881 India 31.74 7683 Filipina 31.05 10097 Indonesia 29.79 87140 Togo 18.43 142141 Sudan 14.95 143
Sumber: INSEAD--The Business School for the World, 2015-2016 Sumber: WEF, Global Competitiveness Report, 2015-2016
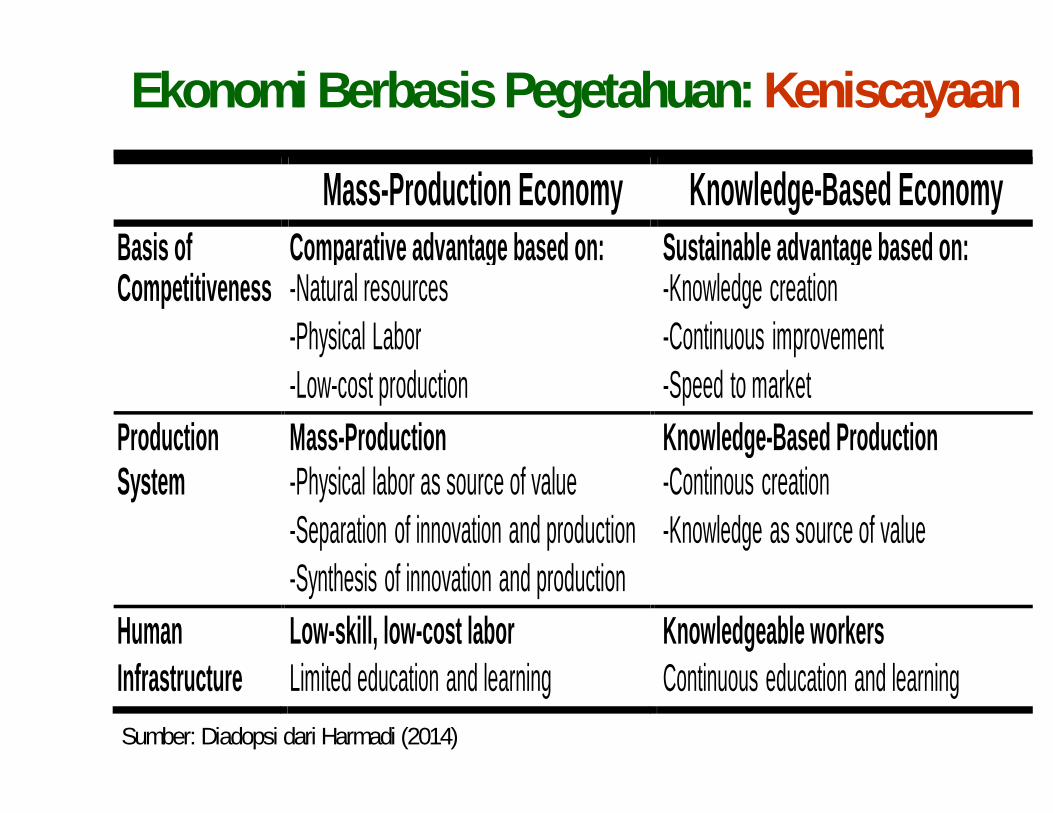
Ekonomi Berbasis Pegetahuan: Keniscayaan
Mass-Production Economy Knowledge-Based EconomyBasis of Comparative advantage based on: Sustainable advantage based on:Competitiveness -Natural resources -Knowledge creation
-Physical Labor -Continuous improvement-Low-cost production -Speed to market
Production Mass-Production Knowledge-Based ProductionSystem -Physical labor as source of value -Continous creation
-Separation of innovation and production -Knowledge as source of value-Synthesis of innovation and production
HumanInfrastructure
Low-skill, low-cost laborLimited education and learning
Knowledgeable workersContinuous education and learning
Sumber: Diadopsi dari Harmadi (2014)
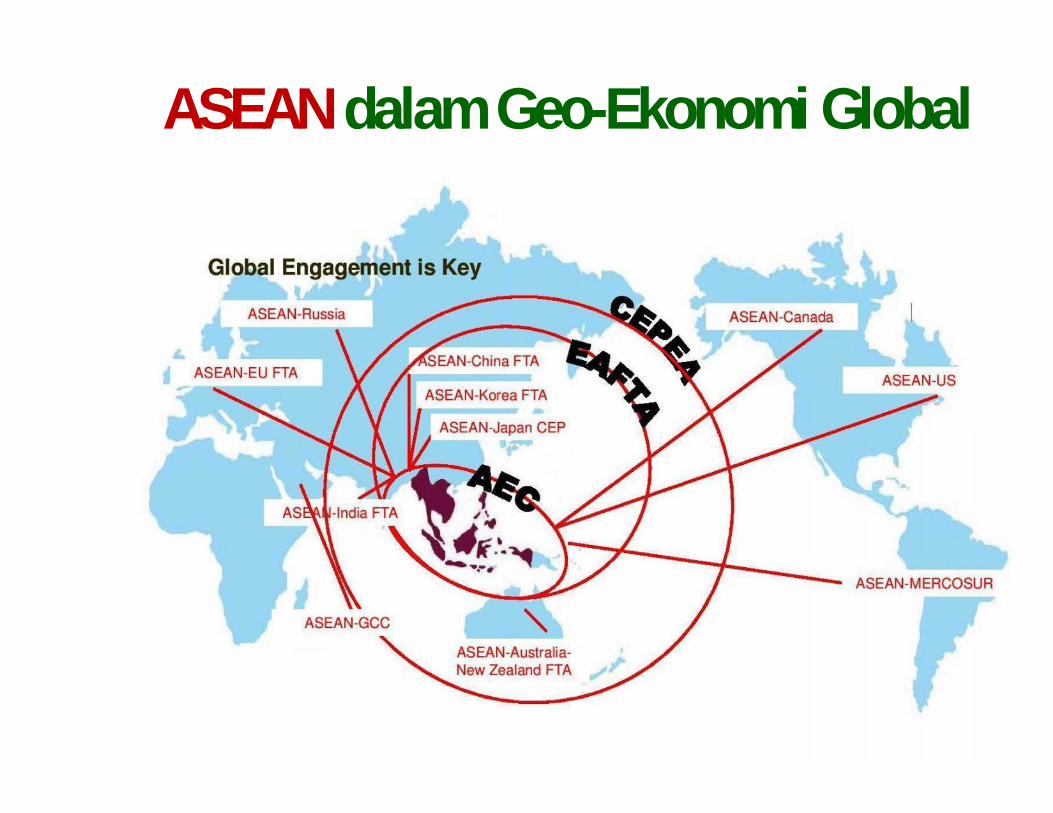
ASEAN dalam Geo-Ekonomi Global
INTE
RGRA
TIO
NDE
EPEN
ING
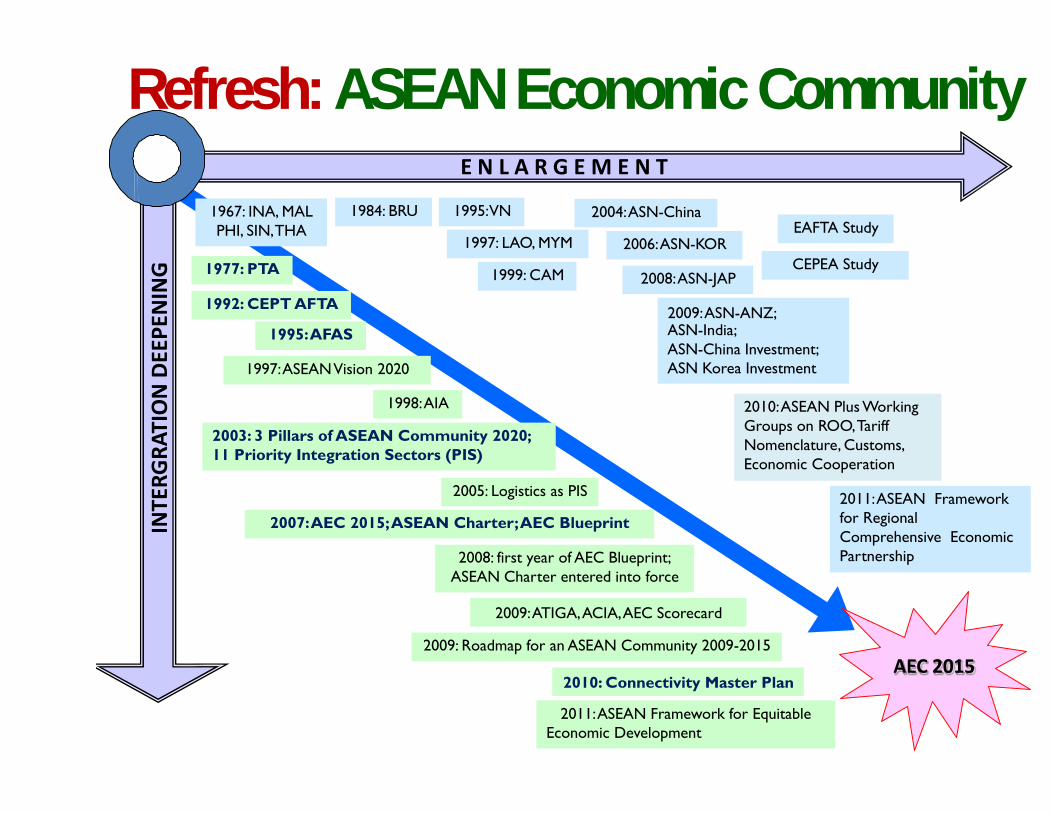
Refresh: ASEAN Economic CommunityE N L A R G E M E N T
1967: INA, MALPHI, SIN,THA
1977: PTA
1992: CEPTAFTA
1984: BRU 1995:VN
1997: LAO, MYM
1999: CAM
2004:ASN-China
2006:ASN-KOR
2008:ASN-JAP
2009:ASN-ANZ;
EAFTA Study
CEPEA Study
1995:AFAS
1997:ASEANVision 2020
1998:AIA
2003: 3 Pillars of ASEAN Community 2020;11 Priority Integration Sectors (PIS)
2005: Logistics as PIS
2007:AEC 2015;ASEAN Charter;AEC Blueprint
ASN-India;ASN-China Investment;ASN Korea Investment
2010:ASEAN Plus WorkingGroups on ROO,TariffNomenclature, Customs,Economic Cooperation
2011:ASEAN Frameworkfor RegionalComprehensive Economic
2008: first year of AEC Blueprint;ASEAN Charter entered into force
Partnership
2009:ATIGA,ACIA,AEC Scorecard
2009: Roadmap for an ASEAN Community 2009-2015
2010: Connectivity Master PlanAEC 2015
2011:ASEAN Framework for EquitableEconomic Development
INTE
RGRA
TIO
NDE
EPEN
ING
Refresh: ASEAN Economic CommunityE N L A R G E M E N T
1967: INA, MALPHI, SIN,THA
1977: PTA
1992: CEPTAFTA
1984: BRU 1995:VN
1997: LAO, MYM
1999: CAM
2004:ASN-China
2006:ASN-KOR
2008:ASN-JAP
2009:ASN-ANZ;
EAFTA Study
CEPEA Study
1995:AFAS
1997:ASEANVision 2020
1998:AIA
2003: 3 Pillars of ASEAN Community 2020;11 Priority Integration Sectors (PIS)
2005: Logistics as PIS
2007:AEC 2015;ASEAN Charter;AEC Blueprint
ASN-India;ASN-China Investment;ASN Korea Investment
2010:ASEAN Plus WorkingGroups on ROO,TariffNomenclature, Customs,Economic Cooperation
2011:ASEAN Frameworkfor RegionalComprehensive Economic
2008: first year of AEC Blueprint;ASEAN Charter entered into force
Partnership
2009:ATIGA,ACIA,AEC Scorecard
2009: Roadmap for an ASEAN Community 2009-2015
2010: Connectivity Master PlanAEC 2015
2011:ASEAN Framework for EquitableEconomic Development
18
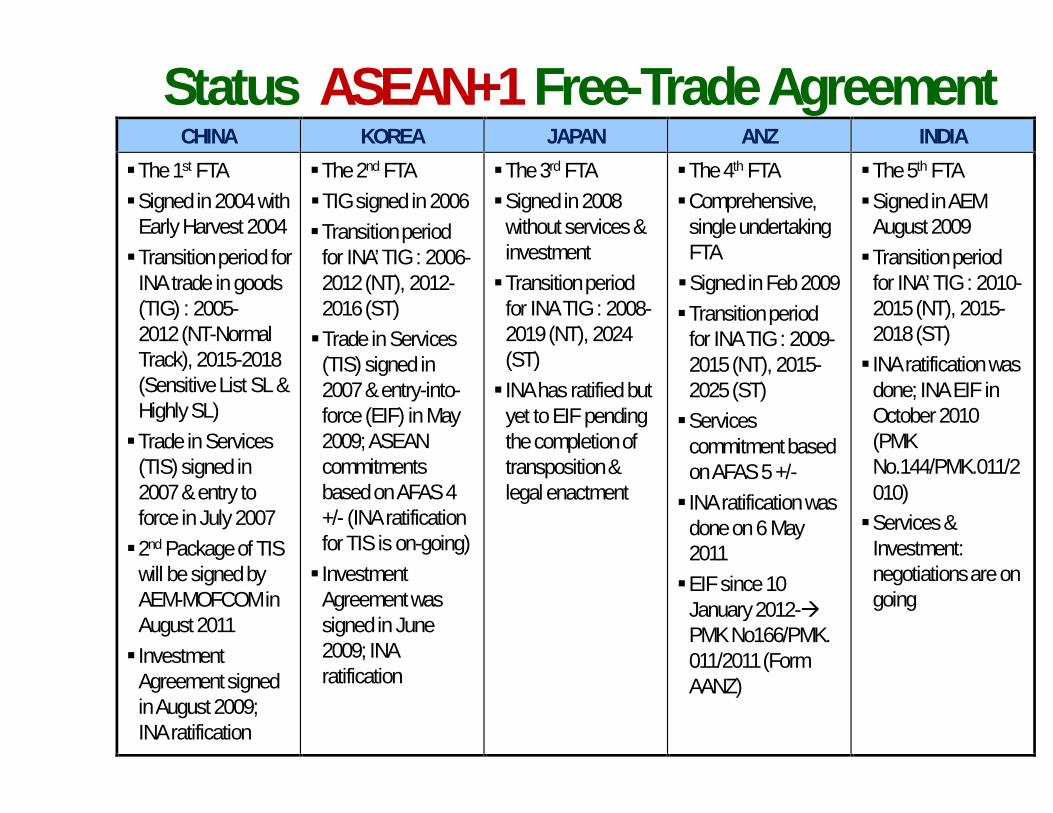
Status ASEAN+1 Free-Trade AgreementCHINA KOREA JAPAN ANZ INDIA
The 1st FTASigned in 2004 with
Early Harvest 2004Transition period for
INA trade in goods(TIG) : 2005-2012 (NT-NormalTrack), 2015-2018(Sensitive List SL &Highly SL)Trade in Services
(TIS) signed in2007 & entry toforce in July 20072nd Package of TIS
will be signed byAEM-MOFCOM inAugust 2011 Investment
Agreement signedin August 2009;INA ratification
The 2nd FTATIG signed in 2006Transition period
for INA’ TIG : 2006-2012 (NT), 2012-2016 (ST)Trade in Services
(TIS) signed in2007 & entry-into-force (EIF) in May2009; ASEANcommitmentsbased on AFAS 4+/- (INA ratificationfor TIS is on-going) Investment
Agreement wassigned in June2009; INAratification
The 3rd FTASigned in 2008
without services &investmentTransition period
for INA TIG : 2008-2019 (NT), 2024(ST) INA has ratified but
yet to EIF pendingthe completion oftransposition &legal enactment
The 4th FTAComprehensive,
single undertakingFTASigned in Feb 2009Transition period
for INA TIG : 2009-2015 (NT), 2015-2025 (ST)Services
commitment basedon AFAS 5 +/- INA ratification was
done on 6 May2011EIF since 10
January 2012-PMK No166/PMK.011/2011 (FormAANZ)
The 5th FTASigned in AEM
August 2009Transition period
for INA’ TIG : 2010-2015 (NT), 2015-2018 (ST) INA ratification was
done; INA EIF inOctober 2010(PMKNo.144/PMK.011/2010)Services &
Investment:negotiations are ongoing
18
Status ASEAN+1 Free-Trade AgreementCHINA KOREA JAPAN ANZ INDIA
The 1st FTASigned in 2004 with
Early Harvest 2004Transition period for
INA trade in goods(TIG) : 2005-2012 (NT-NormalTrack), 2015-2018(Sensitive List SL &Highly SL)Trade in Services
(TIS) signed in2007 & entry toforce in July 20072nd Package of TIS
will be signed byAEM-MOFCOM inAugust 2011 Investment
Agreement signedin August 2009;INA ratification
The 2nd FTATIG signed in 2006Transition period
for INA’ TIG : 2006-2012 (NT), 2012-2016 (ST)Trade in Services
(TIS) signed in2007 & entry-into-force (EIF) in May2009; ASEANcommitmentsbased on AFAS 4+/- (INA ratificationfor TIS is on-going) Investment
Agreement wassigned in June2009; INAratification
The 3rd FTASigned in 2008
without services &investmentTransition period
for INA TIG : 2008-2019 (NT), 2024(ST) INA has ratified but
yet to EIF pendingthe completion oftransposition &legal enactment
The 4th FTAComprehensive,
single undertakingFTASigned in Feb 2009Transition period
for INA TIG : 2009-2015 (NT), 2015-2025 (ST)Services
commitment basedon AFAS 5 +/- INA ratification was
done on 6 May2011EIF since 10
January 2012-PMK No166/PMK.011/2011 (FormAANZ)
The 5th FTASigned in AEM
August 2009Transition period
for INA’ TIG : 2010-2015 (NT), 2015-2018 (ST) INA ratification was
done; INA EIF inOctober 2010(PMKNo.144/PMK.011/2010)Services &
Investment:negotiations are ongoing
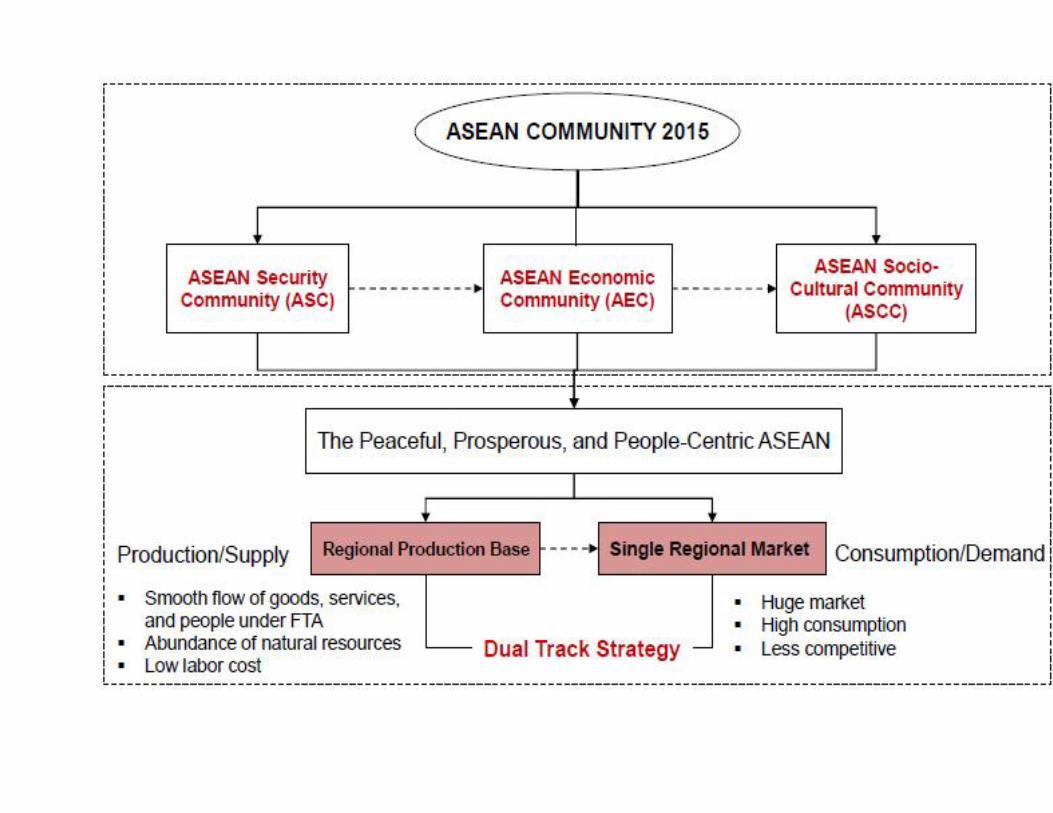
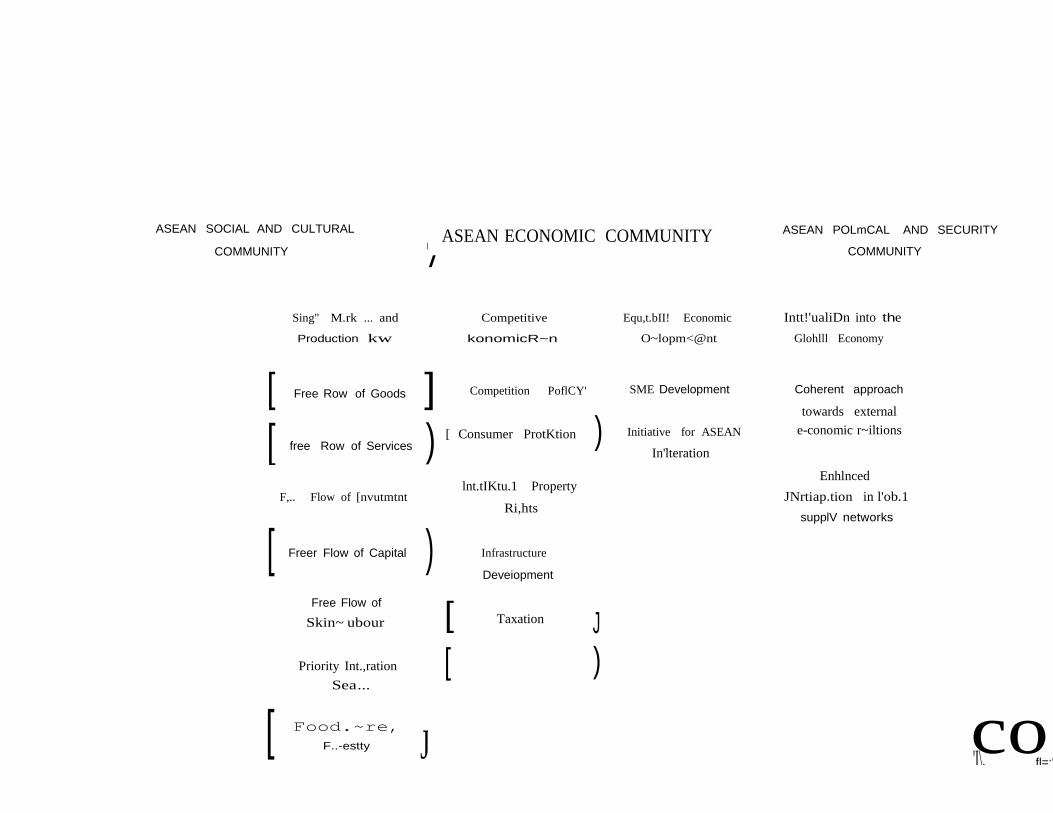
Kerangka Besar: ASEAN Community
[ ) )
[ J co
ASEAN SOCIAL AND CULTURAL
COMMUNITYASEAN ECONOMIC COMMUNITY
I
I
ASEAN POLmCAL AND SECURITY
COMMUNITY
Sing" M.rk ... and Competitive Equ,t.bII! Economic Intt!'ualiDn into the
Production kw konomicR~n O~lopm<@nt Glohlll Economy
[ Free Row of Goods ] Competition PoflCY' SME Development Coherent approach
towards external
[ Consumer ProtKtion Initiative for ASEAN e-conomic r~iltionsfree Row of Services In'lteration
lnt.tIKtu.1 PropertyEnhlnced
F,.. Flow of [nvutmtnt JNrtiap.tion in l'ob.1Ri,hts
[ Freer Flow of Capital ) Infrastructure
Deveiopment
supplV networks
Free Flow of
Skin~ ubour
Priority Int.,ration
Sea...
Food.~re,F..-estty
[ Taxation J[ )
'I\. fl=:'
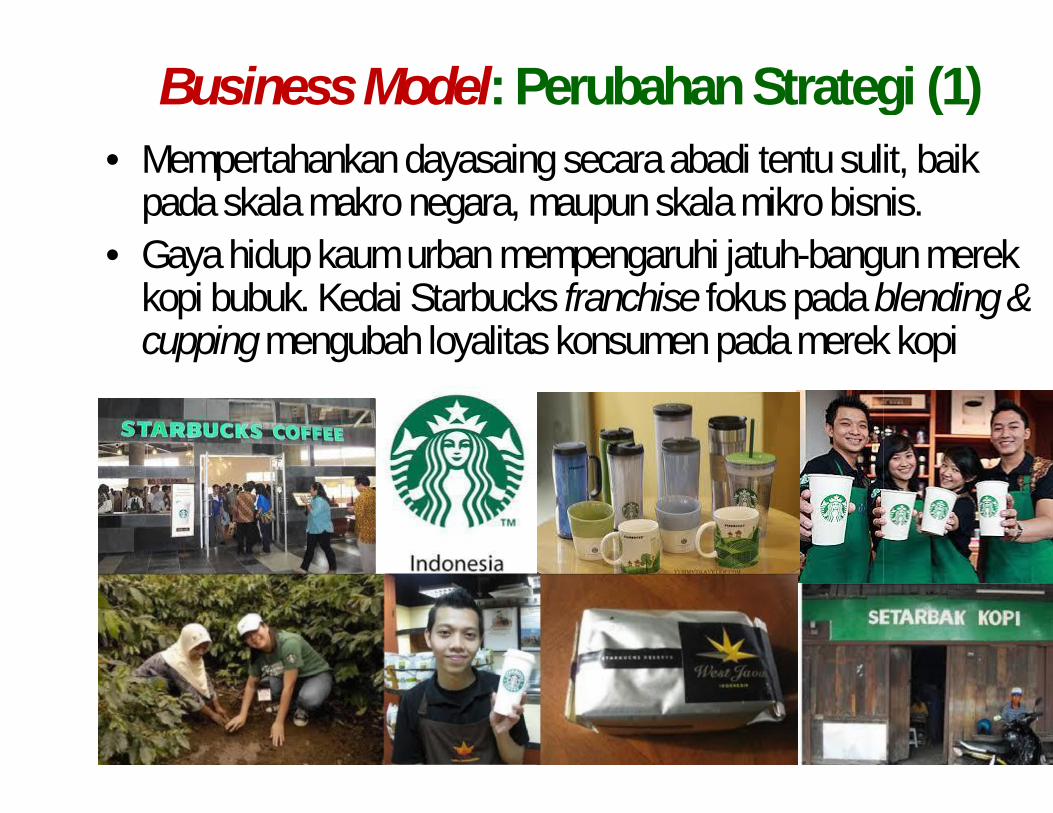
Business Model: Perubahan Strategi (1)• Mempertahankan dayasaing secara abadi tentu sulit, baik
pada skala makro negara, maupun skala mikro bisnis.• Gaya hidup kaum urban mempengaruhi jatuh-bangun merek
kopi bubuk. Kedai Starbucks franchise fokus pada blending &cupping mengubah loyalitas konsumen pada merek kopi
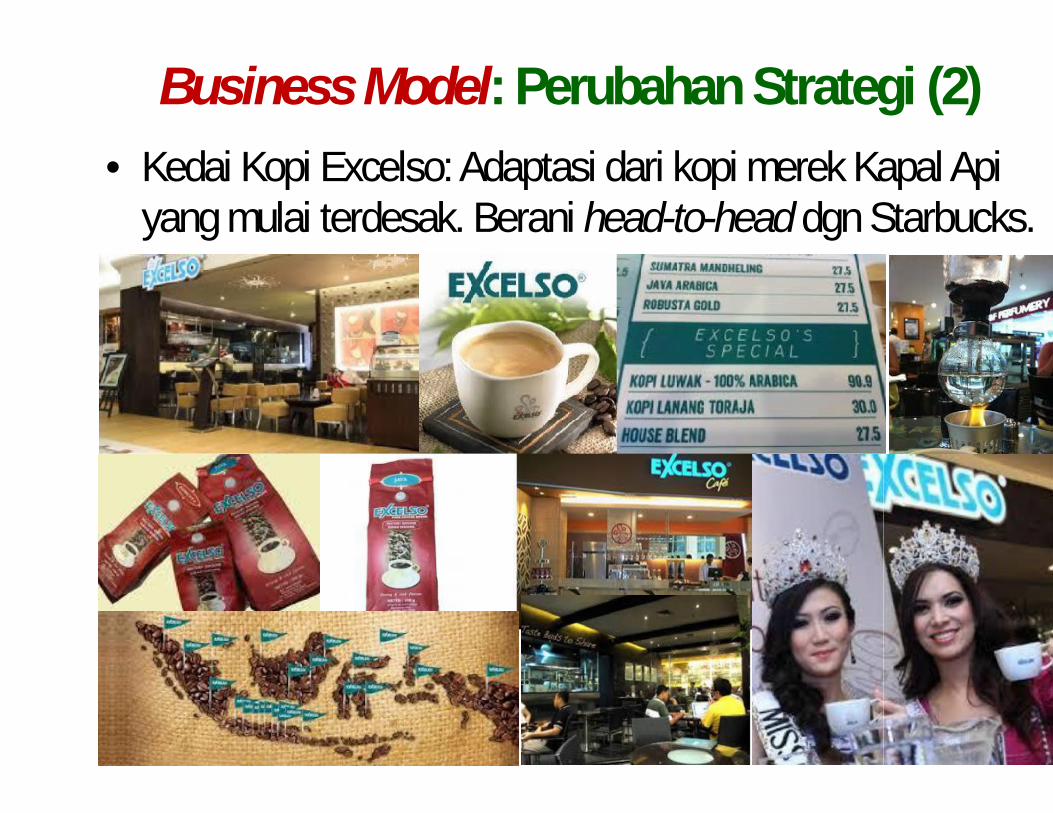
Business Model: Perubahan Strategi (2)• Kedai Kopi Excelso: Adaptasi dari kopi merek Kapal Api
yang mulai terdesak. Berani head-to-head dgn Starbucks.
Business Model: Perubahan Strategi (2)• Kedai Kopi Excelso: Adaptasi dari kopi merek Kapal Api
yang mulai terdesak. Berani head-to-head dgn Starbucks.
Business Model: Perubahan Strategi (2)• Kedai Kopi Excelso: Adaptasi dari kopi merek Kapal Api
yang mulai terdesak. Berani head-to-head dgn Starbucks.
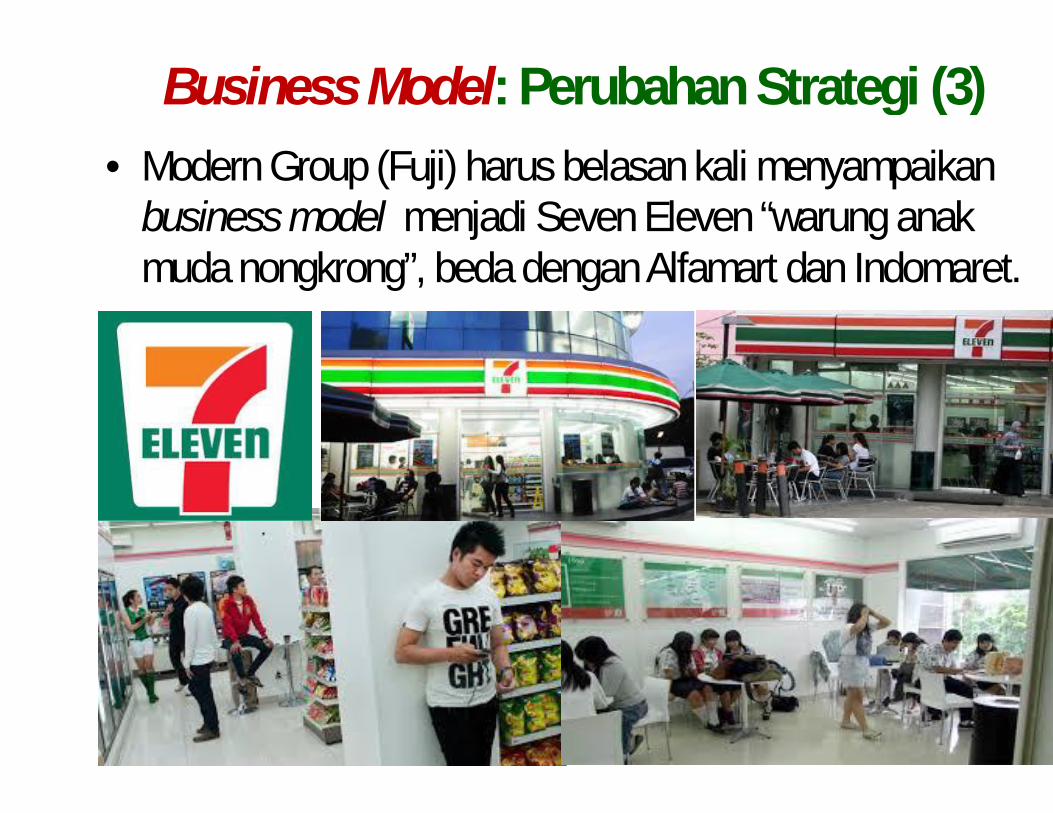
Business Model: Perubahan Strategi (3)• Modern Group (Fuji) harus belasan kali menyampaikan
business model menjadi Seven Eleven “warung anakmuda nongkrong”, beda dengan Alfamart dan Indomaret.
Rekomendasi: Perbaikan Ekosistem & Kreativitas• Inovasi dan dayasaing memerlukan perbaikan ekosistem inovasi
secara holistik, mulai dari manajemen usahatani, peningkatanproduktivitas, pendampingan intensif kepada petani (melibatkanuniversitas dan R&D) dengan memanfaatkan kearifan lokal;
• Rural non-farm employment (RNFE), produktivitas tenaga kerjaper sektor, integrasi proksimitas bahan baku, pusat-pusat pasar;
• Industrialisasi pedesaan, pemberdayaan sumber daya manusia,efisiensi tenaga kerja, keterkaitan desa-kota, sektor pendukung;
• Konsoldisasi lahan: skema contract-farming, kelembagaanmasyarakat, penguasaan aset, perluasan akses pasar;
• Teknologi informasi dan ekonomi kreatif: Inisiatif budaya kreatif,peningkatan nilai tambah, dan dukungan kebijakan memadai;