Embed Size (px)
Citation preview
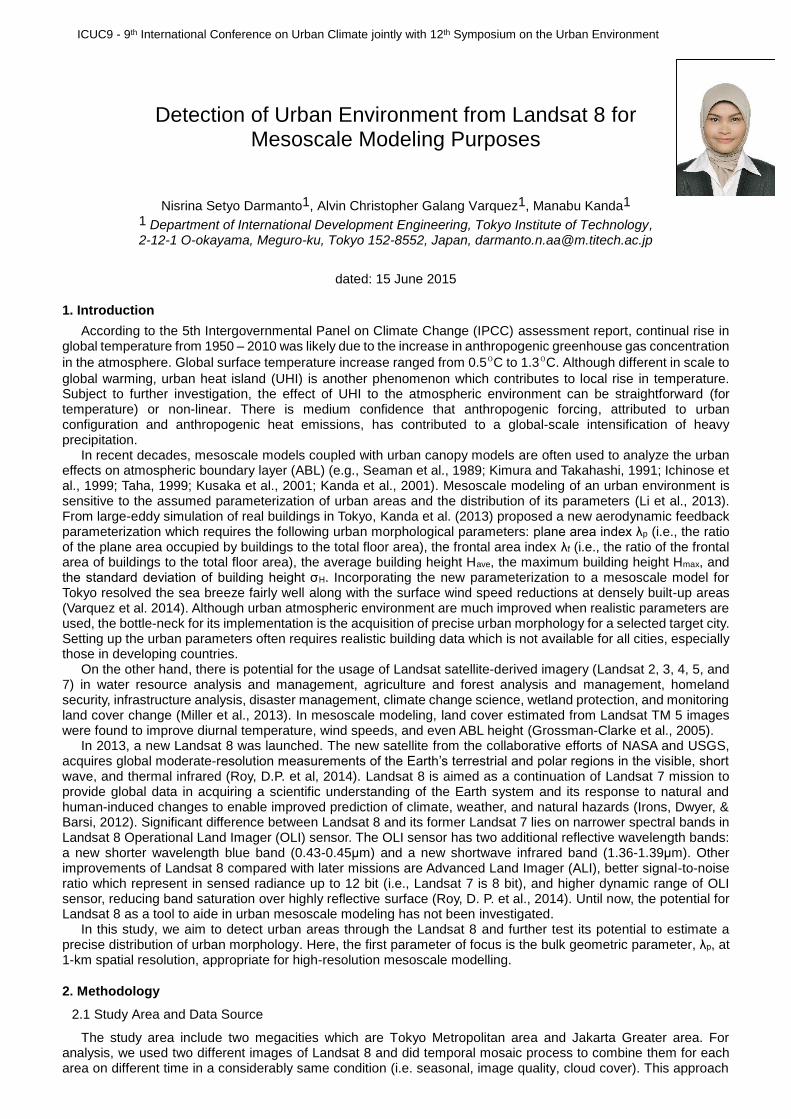
ICUC9 - 9th International Conference on Urban Climate jointly with 12th Symposium on the Urban Environment
Detection of Urban Environment from Landsat 8 for Mesoscale Modeling Purposes
Nisrina Setyo Darmanto1, Alvin Christopher Galang Varquez1, Manabu Kanda1 1 Department of International Development Engineering, Tokyo Institute of Technology, 2-12-1 O-okayama, Meguro-ku, Tokyo 152-8552, Japan, [email protected]
dated: 15 June 2015
1. Introduction
According to the 5th Intergovernmental Panel on Climate Change (IPCC) assessment report, continual rise in global temperature from 1950 – 2010 was likely due to the increase in anthropogenic greenhouse gas concentration
in the atmosphere. Global surface temperature increase ranged from 0.5ºC to 1.3ºC. Although different in scale to
global warming, urban heat island (UHI) is another phenomenon which contributes to local rise in temperature. Subject to further investigation, the effect of UHI to the atmospheric environment can be straightforward (for temperature) or non-linear. There is medium confidence that anthropogenic forcing, attributed to urban configuration and anthropogenic heat emissions, has contributed to a global-scale intensification of heavy precipitation.
In recent decades, mesoscale models coupled with urban canopy models are often used to analyze the urban effects on atmospheric boundary layer (ABL) (e.g., Seaman et al., 1989; Kimura and Takahashi, 1991; Ichinose et al., 1999; Taha, 1999; Kusaka et al., 2001; Kanda et al., 2001). Mesoscale modeling of an urban environment is sensitive to the assumed parameterization of urban areas and the distribution of its parameters (Li et al., 2013). From large-eddy simulation of real buildings in Tokyo, Kanda et al. (2013) proposed a new aerodynamic feedback parameterization which requires the following urban morphological parameters: plane area index λp (i.e., the ratio of the plane area occupied by buildings to the total floor area), the frontal area index λf (i.e., the ratio of the frontal area of buildings to the total floor area), the average building height Have, the maximum building height Hmax, and the standard deviation of building height σH. Incorporating the new parameterization to a mesoscale model for Tokyo resolved the sea breeze fairly well along with the surface wind speed reductions at densely built-up areas (Varquez et al. 2014). Although urban atmospheric environment are much improved when realistic parameters are used, the bottle-neck for its implementation is the acquisition of precise urban morphology for a selected target city. Setting up the urban parameters often requires realistic building data which is not available for all cities, especially those in developing countries.
On the other hand, there is potential for the usage of Landsat satellite-derived imagery (Landsat 2, 3, 4, 5, and 7) in water resource analysis and management, agriculture and forest analysis and management, homeland security, infrastructure analysis, disaster management, climate change science, wetland protection, and monitoring land cover change (Miller et al., 2013). In mesoscale modeling, land cover estimated from Landsat TM 5 images were found to improve diurnal temperature, wind speeds, and even ABL height (Grossman-Clarke et al., 2005).
In 2013, a new Landsat 8 was launched. The new satellite from the collaborative efforts of NASA and USGS, acquires global moderate-resolution measurements of the Earth’s terrestrial and polar regions in the visible, short wave, and thermal infrared (Roy, D.P. et al, 2014). Landsat 8 is aimed as a continuation of Landsat 7 mission to provide global data in acquiring a scientific understanding of the Earth system and its response to natural and human-induced changes to enable improved prediction of climate, weather, and natural hazards (Irons, Dwyer, & Barsi, 2012). Significant difference between Landsat 8 and its former Landsat 7 lies on narrower spectral bands in Landsat 8 Operational Land Imager (OLI) sensor. The OLI sensor has two additional reflective wavelength bands: a new shorter wavelength blue band (0.43-0.45μm) and a new shortwave infrared band (1.36-1.39μm). Other improvements of Landsat 8 compared with later missions are Advanced Land Imager (ALI), better signal-to-noise ratio which represent in sensed radiance up to 12 bit (i.e., Landsat 7 is 8 bit), and higher dynamic range of OLI sensor, reducing band saturation over highly reflective surface (Roy, D. P. et al., 2014). Until now, the potential for Landsat 8 as a tool to aide in urban mesoscale modeling has not been investigated.
In this study, we aim to detect urban areas through the Landsat 8 and further test its potential to estimate a precise distribution of urban morphology. Here, the first parameter of focus is the bulk geometric parameter, λp, at 1-km spatial resolution, appropriate for high-resolution mesoscale modelling.
2. Methodology
2.1 Study Area and Data Source
The study area include two megacities which are Tokyo Metropolitan area and Jakarta Greater area. For analysis, we used two different images of Landsat 8 and did temporal mosaic process to combine them for each area on different time in a considerably same condition (i.e. seasonal, image quality, cloud cover). This approach
INSERT PICTU RE
HERE
Nisrina Setyo
Darmanto
ICUC9 - 9th International Conference on Urban Climate jointly with 12th Symposium on the Urban Environment
was aimed to reduce false analysis during the classification process, especially due to cloud and shadowing effect in highly vertical built-up area.
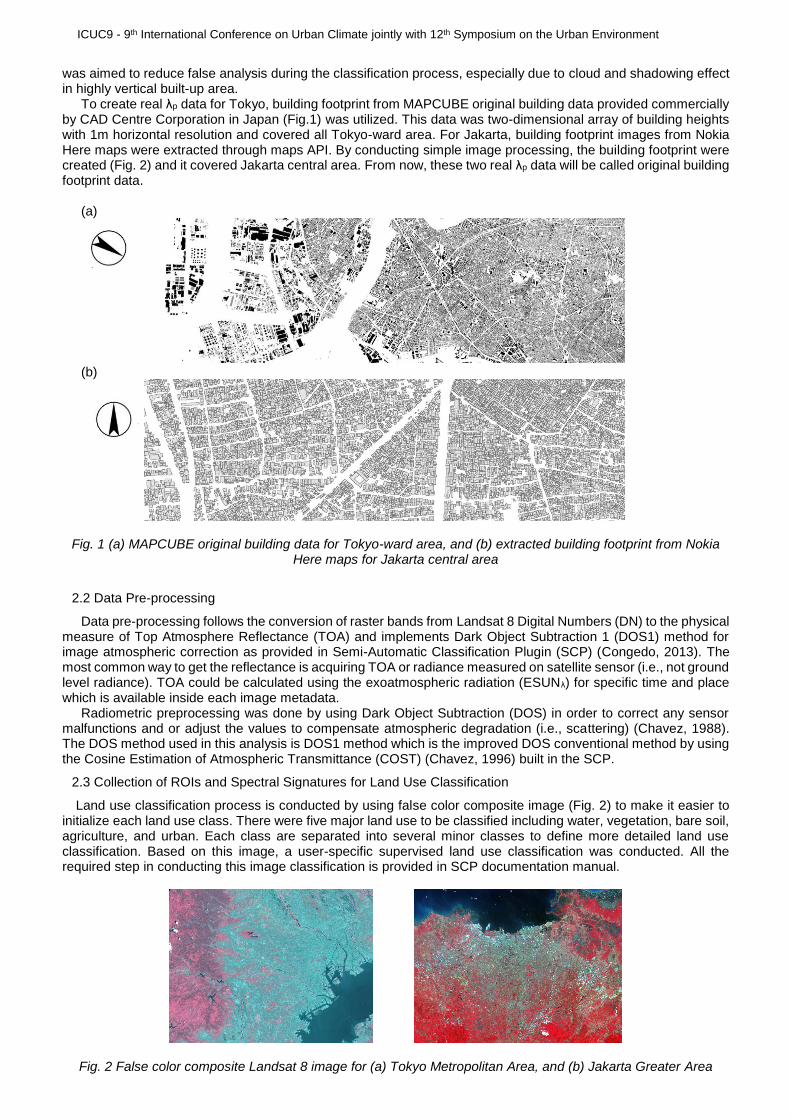
To create real λp data for Tokyo, building footprint from MAPCUBE original building data provided commercially by CAD Centre Corporation in Japan (Fig.1) was utilized. This data was two-dimensional array of building heights with 1m horizontal resolution and covered all Tokyo-ward area. For Jakarta, building footprint images from Nokia Here maps were extracted through maps API. By conducting simple image processing, the building footprint were created (Fig. 2) and it covered Jakarta central area. From now, these two real λp data will be called original building footprint data.
(a)
(b)
Fig. 1 (a) MAPCUBE original building data for Tokyo-ward area, and (b) extracted building footprint from Nokia Here maps for Jakarta central area
2.2 Data Pre-processing
Data pre-processing follows the conversion of raster bands from Landsat 8 Digital Numbers (DN) to the physical measure of Top Atmosphere Reflectance (TOA) and implements Dark Object Subtraction 1 (DOS1) method for image atmospheric correction as provided in Semi-Automatic Classification Plugin (SCP) (Congedo, 2013). The most common way to get the reflectance is acquiring TOA or radiance measured on satellite sensor (i.e., not ground level radiance). TOA could be calculated using the exoatmospheric radiation (ESUNλ) for specific time and place which is available inside each image metadata.
Radiometric preprocessing was done by using Dark Object Subtraction (DOS) in order to correct any sensor malfunctions and or adjust the values to compensate atmospheric degradation (i.e., scattering) (Chavez, 1988). The DOS method used in this analysis is DOS1 method which is the improved DOS conventional method by using the Cosine Estimation of Atmospheric Transmittance (COST) (Chavez, 1996) built in the SCP.
2.3 Collection of ROIs and Spectral Signatures for Land Use Classification
Land use classification process is conducted by using false color composite image (Fig. 2) to make it easier to initialize each land use class. There were five major land use to be classified including water, vegetation, bare soil, agriculture, and urban. Each class are separated into several minor classes to define more detailed land use classification. Based on this image, a user-specific supervised land use classification was conducted. All the required step in conducting this image classification is provided in SCP documentation manual.
Fig. 2 False color composite Landsat 8 image for (a) Tokyo Metropolitan Area, and (b) Jakarta Greater Area
ICUC9 - 9th International Conference on Urban Climate jointly with 12th Symposium on the Urban Environment
The first step requires the creation of ROIs. ROIs are defined as user-specified homogenous polygons which
represents the same land use classification. SCP is supported with region growing algorithm during the ROIs collection which detect similar pixels value on surrounding areas. Hence it is easier for the user to specify the similar land use on the neighboring selected area. Selected ROIs will be stored as a spectral-specific polygon shapefile which role as reference in creating the spectral signatures.
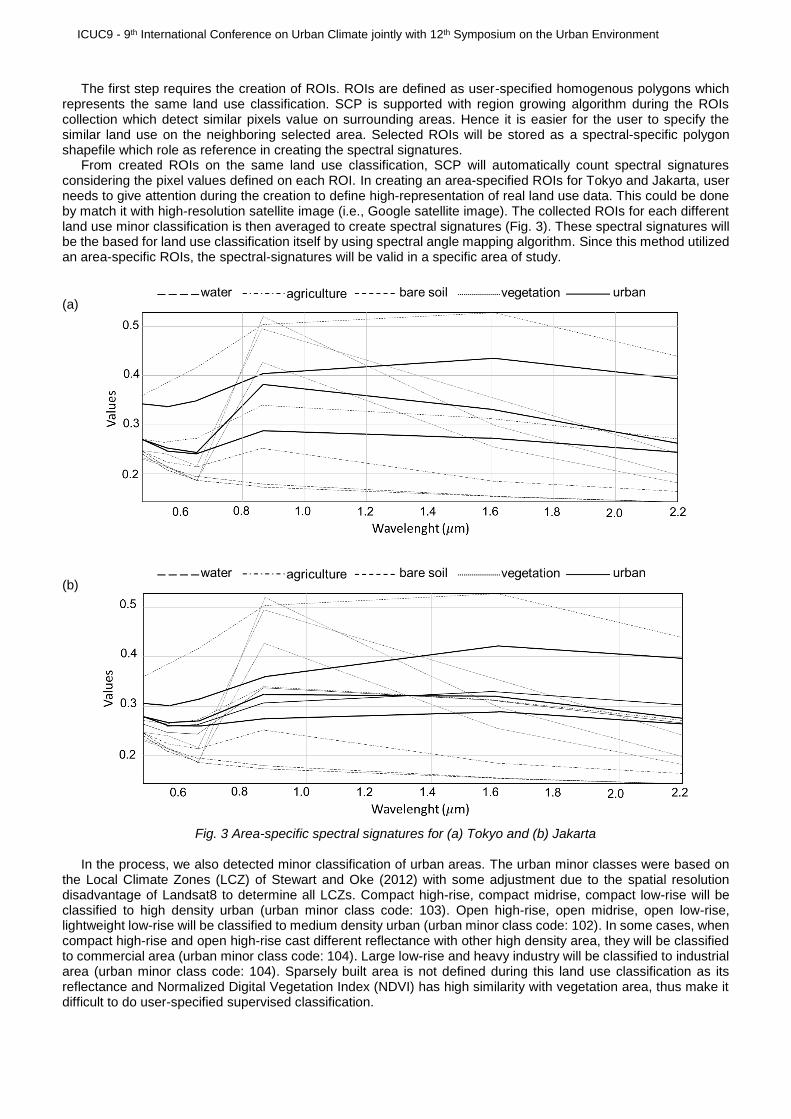
From created ROIs on the same land use classification, SCP will automatically count spectral signatures considering the pixel values defined on each ROI. In creating an area-specified ROIs for Tokyo and Jakarta, user needs to give attention during the creation to define high-representation of real land use data. This could be done by match it with high-resolution satellite image (i.e., Google satellite image). The collected ROIs for each different land use minor classification is then averaged to create spectral signatures (Fig. 3). These spectral signatures will be the based for land use classification itself by using spectral angle mapping algorithm. Since this method utilized an area-specific ROIs, the spectral-signatures will be valid in a specific area of study.
(a)
(b)
Fig. 3 Area-specific spectral signatures for (a) Tokyo and (b) Jakarta
In the process, we also detected minor classification of urban areas. The urban minor classes were based on
the Local Climate Zones (LCZ) of Stewart and Oke (2012) with some adjustment due to the spatial resolution disadvantage of Landsat8 to determine all LCZs. Compact high-rise, compact midrise, compact low-rise will be classified to high density urban (urban minor class code: 103). Open high-rise, open midrise, open low-rise, lightweight low-rise will be classified to medium density urban (urban minor class code: 102). In some cases, when compact high-rise and open high-rise cast different reflectance with other high density area, they will be classified to commercial area (urban minor class code: 104). Large low-rise and heavy industry will be classified to industrial area (urban minor class code: 104). Sparsely built area is not defined during this land use classification as its reflectance and Normalized Digital Vegetation Index (NDVI) has high similarity with vegetation area, thus make it difficult to do user-specified supervised classification.
ICUC9 - 9th International Conference on Urban Climate jointly with 12th Symposium on the Urban Environment
2.4 λp Creation from Original Building Data and Landsat 8 image
Since the objective of this work is to derive λp for mesoscale models, the λp data should be provided as λp in 1-km grid resolution. Thus, the original building footprint data is converted into 1-km grid data (i.e., raster map data) which consist of longitude, latitude, and λp value.
The result from land use classification were also treated in the same manner as the original building footprint data. Since the land use classification result has the same resolution with Landsat 8 image, each 1-km resolution of grid data will contain around 900~1000 30-m sub-grids. From these values, the each urban values (all urban minor class code) will be spatially calculated and extracted, then the other land uses will be left as zero values. Hence, the urban ratio in one 1-km grid could be defined. This urban ratio will be compared with λp created from original building data to create empirical equation of λp derived from original building footprint data and Landsat 8 land use classification.
3. Results and Discussion
3.1 Land use classification result
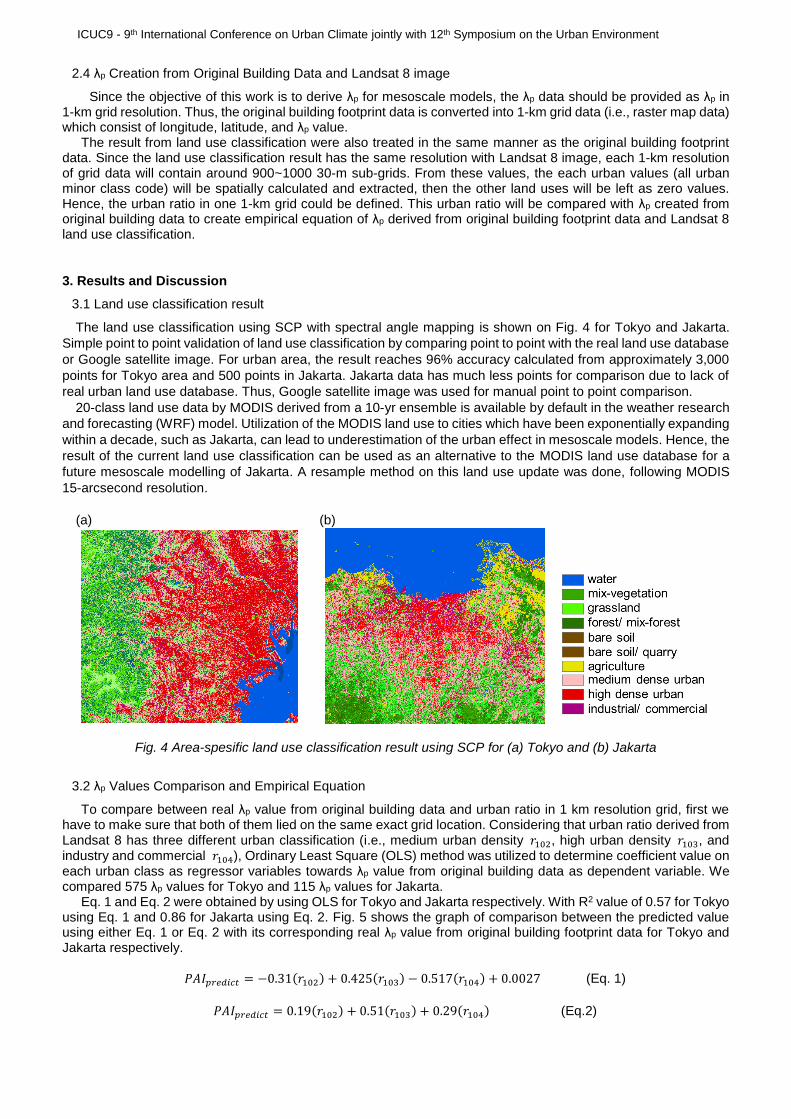
The land use classification using SCP with spectral angle mapping is shown on Fig. 4 for Tokyo and Jakarta.
Simple point to point validation of land use classification by comparing point to point with the real land use database
or Google satellite image. For urban area, the result reaches 96% accuracy calculated from approximately 3,000
points for Tokyo area and 500 points in Jakarta. Jakarta data has much less points for comparison due to lack of
real urban land use database. Thus, Google satellite image was used for manual point to point comparison.
20-class land use data by MODIS derived from a 10-yr ensemble is available by default in the weather research
and forecasting (WRF) model. Utilization of the MODIS land use to cities which have been exponentially expanding
within a decade, such as Jakarta, can lead to underestimation of the urban effect in mesoscale models. Hence, the
result of the current land use classification can be used as an alternative to the MODIS land use database for a
future mesoscale modelling of Jakarta. A resample method on this land use update was done, following MODIS
15-arcsecond resolution.
(a) (b)
Fig. 4 Area-spesific land use classification result using SCP for (a) Tokyo and (b) Jakarta
3.2 λp Values Comparison and Empirical Equation
To compare between real λp value from original building data and urban ratio in 1 km resolution grid, first we have to make sure that both of them lied on the same exact grid location. Considering that urban ratio derived from Landsat 8 has three different urban classification (i.e., medium urban density 𝑟102, high urban density 𝑟103, and industry and commercial 𝑟104), Ordinary Least Square (OLS) method was utilized to determine coefficient value on each urban class as regressor variables towards λp value from original building data as dependent variable. We compared 575 λp values for Tokyo and 115 λp values for Jakarta.
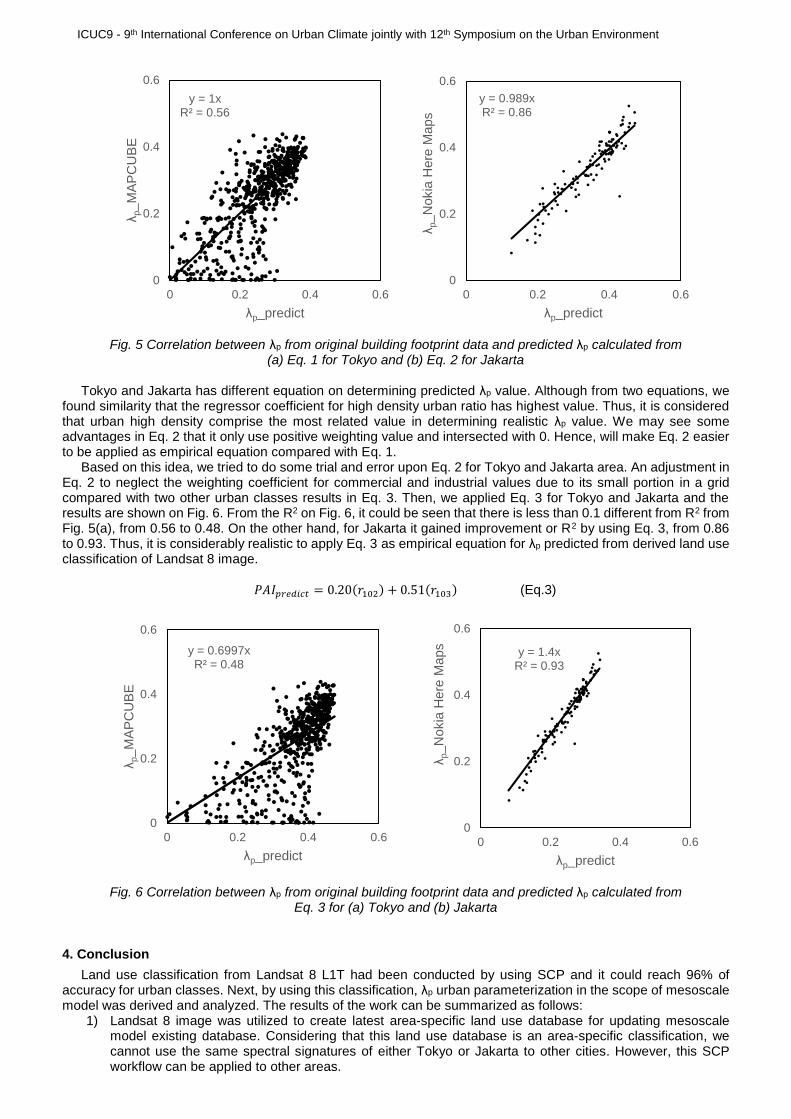
Eq. 1 and Eq. 2 were obtained by using OLS for Tokyo and Jakarta respectively. With R2 value of 0.57 for Tokyo using Eq. 1 and 0.86 for Jakarta using Eq. 2. Fig. 5 shows the graph of comparison between the predicted value using either Eq. 1 or Eq. 2 with its corresponding real λp value from original building footprint data for Tokyo and Jakarta respectively.
𝑃𝐴𝐼𝑝𝑟𝑒𝑑𝑖𝑐𝑡 = −0.31(𝑟102) + 0.425(𝑟103) − 0.517(𝑟104) + 0.0027 (Eq. 1)
𝑃𝐴𝐼𝑝𝑟𝑒𝑑𝑖𝑐𝑡 = 0.19(𝑟102) + 0.51(𝑟103) + 0.29(𝑟104) (Eq.2)
ICUC9 - 9th International Conference on Urban Climate jointly with 12th Symposium on the Urban Environment
Fig. 5 Correlation between λp from original building footprint data and predicted λp calculated from
(a) Eq. 1 for Tokyo and (b) Eq. 2 for Jakarta Tokyo and Jakarta has different equation on determining predicted λp value. Although from two equations, we
found similarity that the regressor coefficient for high density urban ratio has highest value. Thus, it is considered that urban high density comprise the most related value in determining realistic λp value. We may see some advantages in Eq. 2 that it only use positive weighting value and intersected with 0. Hence, will make Eq. 2 easier to be applied as empirical equation compared with Eq. 1.
Based on this idea, we tried to do some trial and error upon Eq. 2 for Tokyo and Jakarta area. An adjustment in Eq. 2 to neglect the weighting coefficient for commercial and industrial values due to its small portion in a grid compared with two other urban classes results in Eq. 3. Then, we applied Eq. 3 for Tokyo and Jakarta and the results are shown on Fig. 6. From the R2 on Fig. 6, it could be seen that there is less than 0.1 different from R2 from Fig. 5(a), from 0.56 to 0.48. On the other hand, for Jakarta it gained improvement or R2 by using Eq. 3, from 0.86 to 0.93. Thus, it is considerably realistic to apply Eq. 3 as empirical equation for λp predicted from derived land use classification of Landsat 8 image.
𝑃𝐴𝐼𝑝𝑟𝑒𝑑𝑖𝑐𝑡 = 0.20(𝑟102) + 0.51(𝑟103) (Eq.3)
Fig. 6 Correlation between λp from original building footprint data and predicted λp calculated from
Eq. 3 for (a) Tokyo and (b) Jakarta
4. Conclusion
Land use classification from Landsat 8 L1T had been conducted by using SCP and it could reach 96% of accuracy for urban classes. Next, by using this classification, λp urban parameterization in the scope of mesoscale model was derived and analyzed. The results of the work can be summarized as follows:
1) Landsat 8 image was utilized to create latest area-specific land use database for updating mesoscale model existing database. Considering that this land use database is an area-specific classification, we cannot use the same spectral signatures of either Tokyo or Jakarta to other cities. However, this SCP workflow can be applied to other areas.
y = 1xR² = 0.56
0
0.2
0.4
0.6
0 0.2 0.4 0.6
λp_M
AP
CU
BE
λp_predict
y = 0.989xR² = 0.86
0
0.2
0.4
0.6
0 0.2 0.4 0.6
λp_N
okia
Here
Maps
λp_predict
y = 0.6997xR² = 0.48
0
0.2
0.4
0.6
0 0.2 0.4 0.6
λp_M
AP
CU
BE
λp_predict
y = 1.4xR² = 0.93
0
0.2
0.4
0.6
0 0.2 0.4 0.6
λp_N
okia
Here
Maps
λp_predict
ICUC9 - 9th International Conference on Urban Climate jointly with 12th Symposium on the Urban Environment
2) From this land use classification, the urban area is extracted and spatially analyzed inside 1-km grid resolution to get the urban ratio.
3) Comparison between 1 km grid λp created from original building data, MAPCUBE and/or Nokia Here Maps, and urban ratio derived from Landsat 8 land use classification results that both of them has high correlation. Hence, we could construct λp bulk geometry parameter for 1-km grid by using urban ratio derived from Landsat 8 image.
4) A general empirical equation to convert urban ratio (from Landsat 8) to λp was validated for Tokyo and Jakarta. The same empirical equation can be applied to other cities around the world as long as the urban ratio is defined similar to this study.
These results are encouraging for the application of urban parameterization derived from satellite image in mesoscale model. The Landsat 8 image is capable to be used in constructing the λp data which may be used to derive the λf data in the next approach. However, since Landsat 8 image is provided in two-dimensional image, it may be less capable to derive other urban parameterizations which require three-dimensional relevance (i.e., buildings height). Thus, another approach by using 3D satellite image such as ASTER, GMTED, SRTM, and others topography elevation measuring satellite should be considered.
Acknowledgment
Authors would like to thank the atmospheric modelling laboratory member of Meteorological Department for the
idea of using Landsat 8 as reference. This research was supported by the Environment Research and Technology
Development Fund (S-14) of the Ministry of the Environment, Japan.
References
Chavez, P. S., 1988: An improved dark-object subtraction technique for atmospheric scattering correction of multispectral data. Remote Sensing of Environment, 24(3), pp. 459–479.
Congedo Luca, Munafo’ Michele, Macchi Silvia, 2013: Investigating the Relationship between Land Cover and Vulnerability to Climate Change in Dar es Salaam. Working Paper, Rome: Sapienza University. Available at: http://www.planning4adaptation.eu/Docs/papers/08_NWP-DoM_for_LCC_in_Dar_using_Landsattt_Imagery.pdf
Grossman-Clarke, S., and Coauthors, 2010: Urban Modifications in a Mesoscale Meteorological Model and the Effects on Near-Surface Variables in an Arid Metropolitan Region. Available at: http://dx.doi.org/10.1175/JAM2286.1 (Accessed: 9 June 2015)
Ichinose, T., Shimodozono, K. and Hanaki, K., 1999: Impact of anthropogenic heat on urban climate in Tokyo. Atmospheric Environment, 33(24-25), pp. 3897–3909.
Irons, James R., Dwyer, John L., and Barsi, Julia A., 2012: The next Landsat satellite: The Landsat Data Continuity Mission. NASA Publications, Paper 61.
Kanda, M., Inagaki, A., Miyamoto, T., Gryschka, M. and Raasch, S., 2013: A New Aerodynamic Parametrization for Real Urban Surfaces. Boundary-Layer Meteorology, 148(2), pp. 357–377.
Kanda, M., Inoue, Y. and Uno, I., 2001: Numerical Study On Cloud Lines Over An Urban Street In Tokyo. Boundary-Layer Meteorology, 98(2), pp. 251–273.
Kimura, F. and Takahashi, S., 1991: The effects of land-use and anthropogenic heating on the surface temperature in the Tokyo Metropolitan area: A numerical experiment. Atmospheric Environment. Part B. Urban Atmosphere, 25(2), pp. 155–164.
Kusaka, H., Kondo, H., Kikegawa, Y. and Kimura, F., 2001: A Simple Single-Layer Urban Canopy Model For Atmospheric Models: Comparison With Multi-Layer And Slab Models. Boundary-Layer Meteorology, 101(3), pp. 329–358.
Miller, H.M., Richardson, Leslie, Koontz, S.R., Loomis, John, and Koontz, Lynne, 2013: Users, uses, and value of Landsat satellite imagery—Results from the 2012 survey of users. U.S. Geological Survey Open-File Report 2013–1269, 51 p., http://dx.doi.org/10.3133/ofr20131269.
Roy, D. P., and Coauthors, 2014: Landsat-8: Science and product vision for terrestrial global change research. Remote Sensing of Environment, 145, pp. 154–172.
Seaman, N. L., Ludwig, F. L., Donall, E. G., Warner, T. T. and Bhumralkar, C. M., 1989: Numerical Studies of Urban Planetary Boundary-Layer Structure under Realistic Synoptic Conditions. Journal of Applied Meteorology, 28(8), pp. 760–781.
Stewart, I. D. and Oke, T. R., 2012: Local Climate Zones for Urban Temperature Studies. Bulletin of the American Meteorological Society, 93(12), pp. 1879–1900.
Taha, H., 1999: Modifying a Mesoscale Meteorological Model to Better Incorporate Urban Heat Storage: A Bulk-Parameterization Approach. Journal of Applied Meteorology, 38(4), pp. 466–473.
Varquez, A. C. G., Nakayoshi, M. and Kanda, M., 2014: The Effects of Highly Detailed Urban Roughness Parameters on a Sea-Breeze Numerical Simulation. Boundary-Layer Meteorology, 154(3), pp. 449–469.