Embed Size (px)
Citation preview
DEMOGRAPHIC RESEARCH VOLUME 35, ARTICLE 17, PAGES 471−504 PUBLISHED 25 AUGUST 2016 http://www.demographic-research.org/Volumes/Vol35/17/ DOI: 10.4054/DemRes.2016.35.17 Research Article
Insight on ‘typical’ longevity: An analysis of the modal lifespan by leading causes of death in Canada
Viorela Diaconu
Nadine Ouellette
Carlo G. Camarda
Robert Bourbeau
©2016 Viorela Diaconu et al. This open-access work is published under the terms of the Creative Commons Attribution NonCommercial License 2.0 Germany, which permits use, reproduction & distribution in any medium for non-commercial purposes, provided the original author(s) and source are given credit. See http:// creativecommons.org/licenses/by-nc/2.0/de/
Contents
1 Introduction 472 2 Background: Leading causes of death in Canada 475 3 Data and methods 479 3.1 Sources of data 479 3.2 Cause-specific modal age-at-death derivation 480 4 Results 484 4.1 Cause-specific differentials and trends in 𝑀�𝑘 484 4.2 Exploratory analysis of the pace of increase in 𝑀�𝑘 486 5 Discussion and conclusion 488 6 Acknowledgements 492 References 493 Appendix 500
Demographic Research: Volume 35, Article 17 Research Article
http://www.demographic-research.org 471
Insight on ‘typical’ longevity: An analysis of the modal lifespan by leading causes of death in Canada
Viorela Diaconu1
Nadine Ouellette2
Carlo G. Camarda3
Robert Bourbeau2
Abstract
BACKGROUND The longevity gains recorded in high-income countries since the 1960s are mainly due to a reduction in mortality from chronic degenerative diseases, which particularly affect older individuals. In recent years the adult modal age at death (M) gained increasing recognition as a lifespan indicator for monitoring improvements in old-age survival. However, studies of M by cause of death are lacking.
OBJECTIVE This work investigates trends in M by leading causes of death in Canada over the 1974–2011 period and identifies the causes of death that have been more responsive to improvements in lifestyle behaviors and medical progress.
METHODS We extend a recent method for estimating the all-cause M using a flexible P-spline approach to the context of cause-of-death analysis. Using data from the Canadian Vital Statistics Database for the 1974‒2011 period, we derive cause-specific modal age-at-death estimates and compare them in terms of levels and time-trends.
RESULTS Although modal age-at-death estimates for heart diseases, cerebrovascular diseases, and the three types of cancers studied (breast/prostate, colorectal, and trachea, bronchus, and lung) differ greatly in terms of levels, they have all followed a steady upward trend since the mid-1970s in Canada. Moreover, the increase in cause-specific modal age estimates occurred at a strikingly similar pace for most causes, except for breast cancer
1 Department of Demography, Université de Montréal, Canada. E-Mail: [email protected]. 2 Department of Demography, Université de Montréal, Canada. 3 Institut national d’études démographiques (INED), France.
Diaconu et al.: An analysis of the modal lifespan by leading causes of death in Canada
472 http://www.demographic-research.org
(females) and heart diseases (males), whose modal ages rose at a substantially faster pace.
CONTRIBUTION Our study introduces an innovative method for estimating cause-specific modal ages at death and provides the first available estimates of time-trends in M by leading causes of death.
1. Introduction
The spectacular longevity gains achieved by low mortality countries in the last two centuries are the direct consequence of ongoing progress in fighting a wide variety of diseases. During the first half of the 1900s, advances in immunization, sanitation, and nutrition led to the near-eradication of major infectious and parasitic diseases, as well as maternal, perinatal, and nutritional disorders (Horiuchi 1999, Omran 1971, Preston 1976). Throughout this period, life expectancy at birth increased steadily and very rapidly, reaching a level of about 65‒70 years old for both sexes combined by the mid-20th century (Human Mortality Database). As fewer individuals succumbed to these diseases in the early years of life and increasingly survived to older ages, the risk of developing chronic degenerative diseases became more likely. By the early 1950s these age-associated conditions replaced infectious diseases as the most common cause of death in industrialized societies. After the fall of mortality at young and middle ages to historically low levels, gains in life expectancy at birth slowed down for about ten years, leading some demographers to argue that mortality improvements were no longer possible.
However, the late 1960s ushered in a new era of progress characterized by the decline of chronic degenerative diseases, particularly cardiovascular diseases. Kannisto (2001) referred to an “era of delayed aging,” as mortality at older ages dropped faster than at younger ages and deaths above age 80 started to decline considerably for the first time (Kannisto et al. 1994). Thereafter, advances in the extension of human life were mainly fuelled by improvements in old-age survival (Meslé and Vallin 2006, Wilmoth et al. 2000). Consequently, the upturn in life expectancy at birth resumed but the pace of increase was slower during this new era than in preceding years.
Recent evidence suggests that life expectancy at birth underestimates progress made in longevity extension when such progress is principally driven by improvements in the survival of the elderly (Canudas-Romo 2010, Kannisto 2001). Therefore, life expectancy at some middle or early old ages, such as 50 or 65, takes center stage in analyses monitoring old-age survival. One of the main disadvantages of these lifespan
Demographic Research: Volume 35, Article 17
http://www.demographic-research.org 473
measures, however, is their dependence on an arbitrary selection of the age limit, and hence on an arbitrary definition of ‘old’ (Kannisto 2001). The conditionality upon survival to an age threshold constitutes another important disadvantage, as it reflects the average length of life still to be lived by the most robust individuals.
To make up for these shortcomings, Kannisto (2001), building on earlier work by Quetelet (1835) and Lexis (1877, 1878), proposed the late modal age at death (M) as a promising lifespan indicator in an era where the extension of human life is primarily due to the reduction of old-age mortality. Under a given mortality regime, this measure represents the most common (i.e., most frequent) or ‘typical’ length of life among adults. In the early years of its introduction to contemporary demography the attractiveness of M was its freedom from any arbitrary age limit. More recently, studies have also demonstrated that the late mode is solely determined by old-age survival and that the pattern of trends and differentials in M can differ greatly from those in life expectancy, at birth, or at some early old age (Canudas-Romo 2010, Cheung et al. 2009, Horiuchi et al. 2013, Office of National Statistics 2012). Therefore, a growing number of researchers have been monitoring longevity gains in low mortality countries through the lens of the late modal age at death (Brown et al. 2012, Canudas-Romo 2008, Cheung and Robine 2007, Cheung et al. 2005, 2009, Cheung, Robine, and Caselli 2008, Kannisto 2007, Ouellette and Bourbeau 2011, Ouellette, Bourbeau, and Camarda 2012, Robine 2001, Thatcher et al. 2010). Hence, M is becoming increasingly recognized as a key lifespan indicator in the era of delayed aging, also because of its usefulness in the parameterization of well-known mortality models (Horiuchi et al. 2013, Missov et al. 2015).
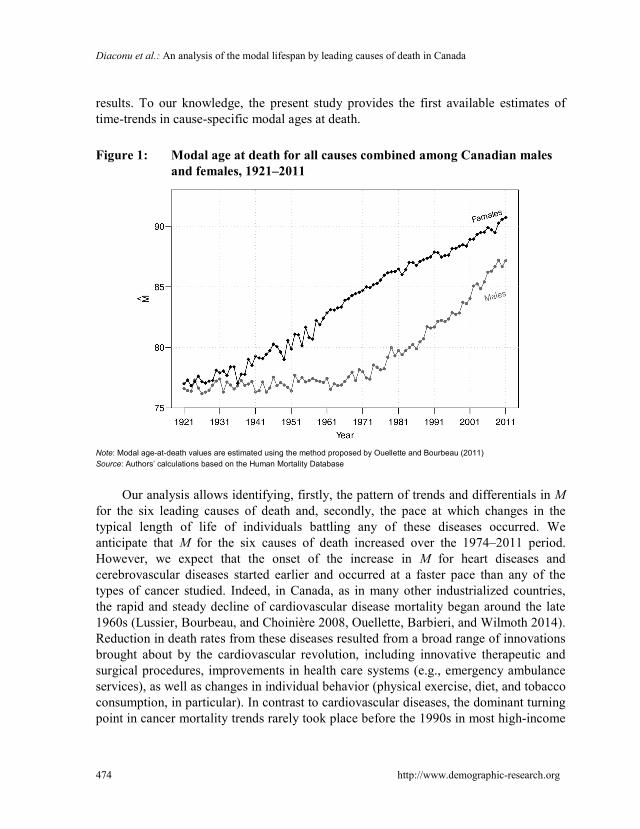
Pattern of trends in M reveal that in Canada the typical length of life of females and males increased substantially over the 1921‒2011 period (Figure 1). The onset of the upward trend is observed since the early 1930s and 1970s for females and males, respectively. To gain better understanding of the mechanisms that brought about these remarkable gains in the most common adult length of life in Canada, the analysis of M needs to be disentangled by cause of death. Accordingly, the objective of this paper is to investigate changes in modal age-at-death values for six leading causes of death in Canada during the 1974‒2011 period: 1. heart diseases, 2. cerebrovascular diseases, 3. trachea, bronchus, and lung cancer,4 4. breast cancer (females only), 5. prostate cancer (males only), and 6. colorectal cancer. We extend the earlier method by Ouellette and Bourbeau (2011), consisting of estimating the all-cause modal age at death using a flexible nonparametric approach, to the context of cause-of-death analysis. Our approach derives from the fundamental principles of the multiple decrement life table and has the advantage of ensuring coherence between cause-specific and all-cause
4 To lighten the text we will refer to trachea, bronchus, and lung cancers as simply ‘lung cancer.’
Diaconu et al.: An analysis of the modal lifespan by leading causes of death in Canada
474 http://www.demographic-research.org
results. To our knowledge, the present study provides the first available estimates of time-trends in cause-specific modal ages at death.
Figure 1: Modal age at death for all causes combined among Canadian males
and females, 1921‒2011
Note: Modal age-at-death values are estimated using the method proposed by Ouellette and Bourbeau (2011) Source: Authors’ calculations based on the Human Mortality Database
Our analysis allows identifying, firstly, the pattern of trends and differentials in M for the six leading causes of death and, secondly, the pace at which changes in the typical length of life of individuals battling any of these diseases occurred. We anticipate that M for the six causes of death increased over the 1974‒2011 period. However, we expect that the onset of the increase in M for heart diseases and cerebrovascular diseases started earlier and occurred at a faster pace than any of the types of cancer studied. Indeed, in Canada, as in many other industrialized countries, the rapid and steady decline of cardiovascular disease mortality began around the late 1960s (Lussier, Bourbeau, and Choinière 2008, Ouellette, Barbieri, and Wilmoth 2014). Reduction in death rates from these diseases resulted from a broad range of innovations brought about by the cardiovascular revolution, including innovative therapeutic and surgical procedures, improvements in health care systems (e.g., emergency ambulance services), as well as changes in individual behavior (physical exercise, diet, and tobacco consumption, in particular). In contrast to cardiovascular diseases, the dominant turning point in cancer mortality trends rarely took place before the 1990s in most high-income
Demographic Research: Volume 35, Article 17
http://www.demographic-research.org 475
countries (Ouellette, Barbieri, and Wilmoth 2014). It seems that during the 1970s and 1980s, when the cardiovascular revolution was in full force, progress against several types of cancer was modest at best. Medical advancement in this area perhaps required greater understanding of the cancer mechanisms at the cellular and molecular level, and hence its challenges were biologically more crucial than those of cardiovascular diseases (Horiuchi 1999). Whether or not our expectations are correct, the findings of the present study allow investigating if trends observed in all-cause M are an accurate representation of changes that occurred in mortality by leading cause or if it is the aggregate of various cause-specific death patterns. Moreover, an examination of changes in the shape of the trend as well as in the pace at which these changes occurred in recent years will provide further insight on future longevity trends. Accurate predictions of these trends are of great benefit to governments and policymakers when forecasting the cost of public pensions and health systems and when allocating their limited resources.
2. Background: Leading causes of death in Canada
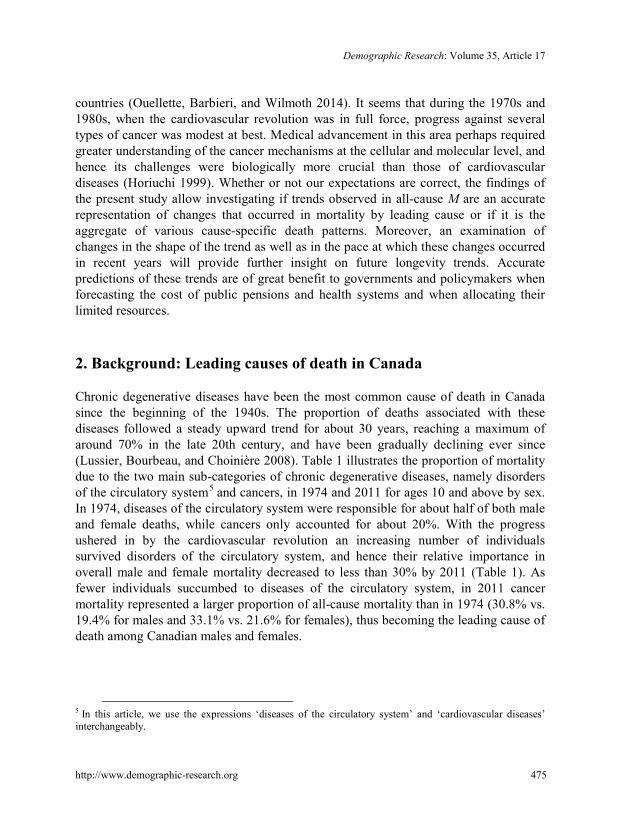
Chronic degenerative diseases have been the most common cause of death in Canada since the beginning of the 1940s. The proportion of deaths associated with these diseases followed a steady upward trend for about 30 years, reaching a maximum of around 70% in the late 20th century, and have been gradually declining ever since (Lussier, Bourbeau, and Choinière 2008). Table 1 illustrates the proportion of mortality due to the two main sub-categories of chronic degenerative diseases, namely disorders of the circulatory system5 and cancers, in 1974 and 2011 for ages 10 and above by sex. In 1974, diseases of the circulatory system were responsible for about half of both male and female deaths, while cancers only accounted for about 20%. With the progress ushered in by the cardiovascular revolution an increasing number of individuals survived disorders of the circulatory system, and hence their relative importance in overall male and female mortality decreased to less than 30% by 2011 (Table 1). As fewer individuals succumbed to diseases of the circulatory system, in 2011 cancer mortality represented a larger proportion of all-cause mortality than in 1974 (30.8% vs. 19.4% for males and 33.1% vs. 21.6% for females), thus becoming the leading cause of death among Canadian males and females.
5 In this article, we use the expressions ‘diseases of the circulatory system’ and ‘cardiovascular diseases’ interchangeably.
Diaconu et al.: An analysis of the modal lifespan by leading causes of death in Canada
476 http://www.demographic-research.org
Table 1: All-cause age-standardized death rate and mortality proportion for diseases of the circulatory system and cancers, Canadian males and females 10 years and above, 1974‒2011
Mortality proportion
All-cause death rate (per 100,000 deaths)a
Diseases of the circulatory system
Heart diseases
Cerebro-vascular diseases
Cancers Lung cancerb
Prostate / breast cancer
Colorectal cancer
Males
1974 1,204.8 53.1% 38.8% 9.5% 19.4% 5.4% 2.3% 2.6%
2011 612.8 27.4% 20.7% 4.6% 30.8% 8.5% 3.1% 3.5%
Females
1974 716.7 54.7% 38.5% 13.3% 21.6% 1.6% 4.4% 3.9%
2011 411.2 25.0% 17.0% 5.8% 33.1% 8.7% 4.8% 3.5%
a The standard population corresponds to the total population (both sexes) of Canada in 1993. b Lung cancer mortality includes all deaths from malignant neoplasms of trachea, bronchus, and lung as the underlying cause. Sources: Authors’ calculations based on the Canadian Vital Statistics Death Database and the Human Mortality Database
Demographic Research: Volume 35, Article 17
http://www.demographic-research.org 477
The majority of deaths from disorders of the circulatory system are the result of heart diseases and cerebrovascular diseases, accounting for more than 90% of all cardiovascular deaths above age 10 for both sexes (Table 1). The share attributable to disorders of the heart (about 75% for males and 70% for females) is considerably larger than that of cerebrovascular diseases (about 18% for males and 24% for females). About half of all male and female cancer deaths are attributed to the most diagnosed types of cancer in Canada: lung, breast (female), prostate (male), and colorectal cancer. Of these, in 1974, lung carcinoma was responsible for the highest proportion (29%) of all male deaths by malignant neoplasms. Females had an advantage, as a smaller percentage of their cancer mortality was due to this particular disease. However, by 2011 the proportion of female lung cancer mortality had almost reached that of males, as a growing number of females had taken up smoking over the previous decades. As for the remaining types of malignant neoplasms, the share of male and female mortality attributable to prostate/breast and colorectal cancer has increased slightly since 1974.
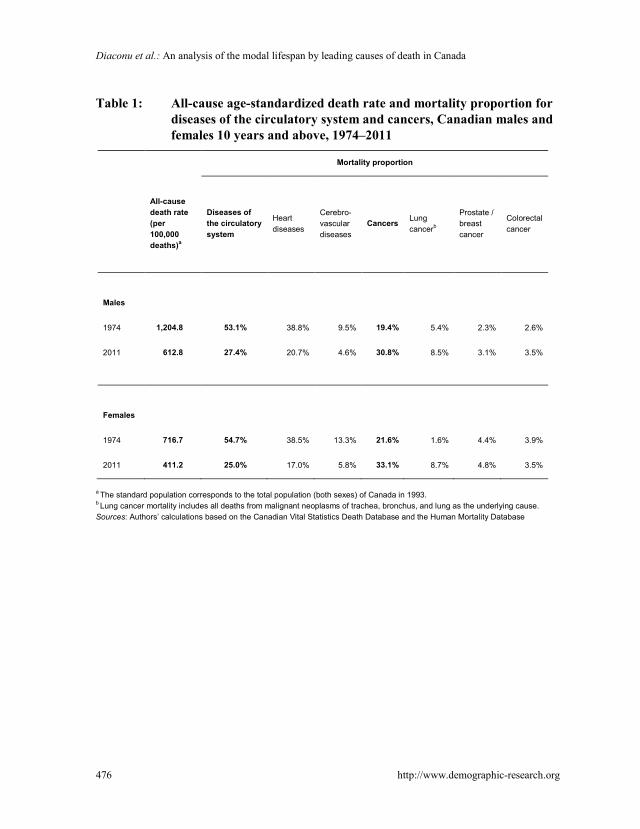
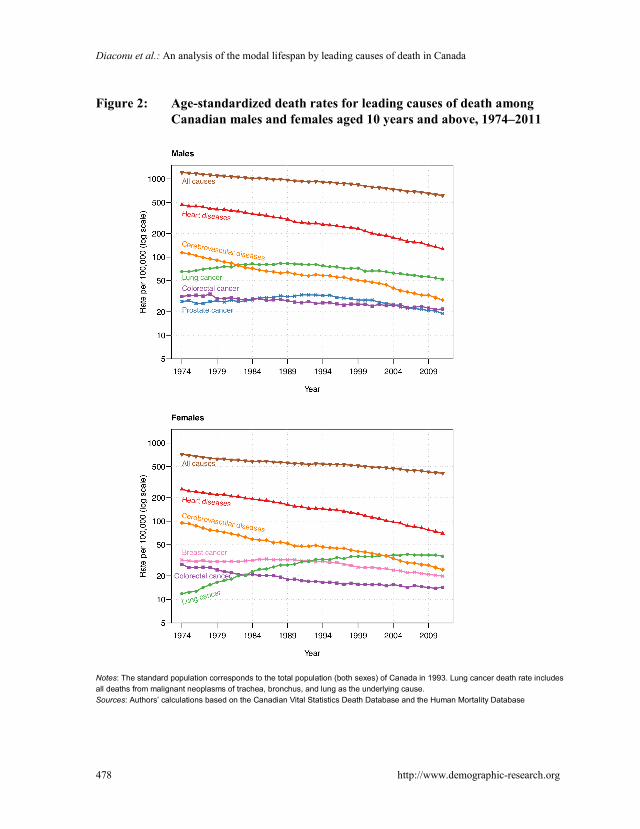
Mortality trends for the six leading causes of death shown in Figure 2 reveal that male and female death rates from heart diseases and cerebrovascular diseases have declined steadily since the mid-1970s. In 1974 these two illnesses claimed respectively 467 and 114 lives per 100,000 among males and 257 and 95 lives per 100,000 among females. Over time, mortality attributed to these main sub-categories of cardiovascular disorders decreased by approximately 75%. Despite a higher proportion of deaths caused by cancerous polyps in 2011 compared to 1974, cancer survival of Canadians aged 10 years and above improved over this period. Breast and prostate cancer death rates started to decline in the early 1990s after peaking at around 30 deaths per 100,000 individuals. By contrast, colorectal cancer mortality declined, albeit slowly, throughout the study period. Reduction in lung cancer death rates among Canadians has been observed among males since the 1990s, while females have yet to experience this reduction. It appears, however, that from 2000 onward female mortality from this disease leveled off at about 35 deaths per 100,000.
Diaconu et al.: An analysis of the modal lifespan by leading causes of death in Canada
478 http://www.demographic-research.org
Figure 2: Age-standardized death rates for leading causes of death among Canadian males and females aged 10 years and above, 1974‒2011
Notes: The standard population corresponds to the total population (both sexes) of Canada in 1993. Lung cancer death rate includes all deaths from malignant neoplasms of trachea, bronchus, and lung as the underlying cause. Sources: Authors’ calculations based on the Canadian Vital Statistics Death Database and the Human Mortality Database
Demographic Research: Volume 35, Article 17
http://www.demographic-research.org 479
3. Data and methods
3.1 Sources of data
The data used in this paper consist of observed death counts by single years of age (10 and above), sex, and underlying cause of death, covering the period 1974‒2011 in Canada. These cause-specific mortality series are taken from the Canadian Vital Statistics Death Database (CVSDD), which gathers demographic and medical (i.e., cause of death) information from all provincial and territorial vital statistics registries on all deaths that occur in Canada. Each Canadian province and territory is bound by law to register all deaths that occur in their territory; thus under-coverage is considered to be minimal. The information collected is known to be of very good quality and it is widely accepted that it can be used to accurately portray cause-specific mortality dynamics. Because data are gathered at the individual level, various confidentiality rules are applied before any analytical report is released or published in order to prevent the disclosure of any information deemed confidential. We were granted access to this individual-level dataset through the Data Liberation Initiative, a program initiated by Statistics Canada to improve access to data resources for Canadian postsecondary institutions.
In this dataset, causes of death are classified according to the World Health Organization International Classification of Diseases (ICD). As our study period extends from 1974 to 2011 it covers three revisions of the international classification, ICD-8 (1969‒1978), ICD-9 (1979‒1999), and ICD-10 (since 2000). The adoption of ICD-10 led to a significant increase in the number of codes, as existing causes of death are classified in greater detail and newly recognized diseases were added. To ensure the consistency of categories throughout the three revisions of the ICD we restricted our analysis to large groups of causes (Table A-1, Appendix). In this way we minimize the impact of the successive revisions on our results. To make our sample consistent over time, we have excluded Canadian residents deceased in the United States. Indeed, as of 2010, such individuals are no longer accounted for in the CVSDD. Moreover, individuals for whom the age at death is unknown are also removed from the analysis. The number of individuals excluded from the analysis remains below 1% in each calendar year.
These cause-specific data on deaths from the CVSDD are supplemented by estimates of population exposure by single years of age (10 and above), sex, and single calendar years (1974 to 2011) for Canada, taken from the Human Mortality Database.
Diaconu et al.: An analysis of the modal lifespan by leading causes of death in Canada
480 http://www.demographic-research.org
3.2 Cause-specific modal age-at-death derivation
Cause-specific analyses within a competing risks framework assume that an individual can die of any one of the 𝑚 types of death indexed by 𝑘 ∈ (1, 2, 3, … ,𝑚) . Let 𝐾 represent the whole set of possible types of failure (i.e., causes of death) and 𝑋 denote the lifespan of an individual describing the time elapsed between their birth and their death. Since death can occur at any moment and from any cause, we treat the survival time 𝑋 and the type (cause) of death 𝐾 as random variables. The joint distribution of these random variables can be described by various continuous functions.
The cause-specific hazard function, also known in demography as the cause-specific force of mortality, is defined as:
𝜇𝑘(𝑥) = lim∆𝑥→0
Pr(𝑥<𝑋<𝑥+∆𝑥,𝐾=𝑘|𝑋>𝑥)∆𝑥
(1)
and it represents the instantaneous risk of dying from cause 𝑘. The cause-specific density function provides information on the unconditional risk
of dying at age 𝑥 from cause 𝑘 and describes the distribution of deaths across ages. It can be written as follows:
𝑓𝑘(𝑥) = 𝜇𝑘(𝑥)𝑆(𝑥), (2) where
𝑆(𝑥) = exp�−∫ 𝜇(𝑢)𝑑𝑢𝑥
0 � (3) describes the all-cause survival function. It shows that to be at risk of dying from any given cause at a given age 𝑥, an individual must survive all causes of death until that age.
Assuming that the causes of death are mutually exclusive and mutually exhaustive (Preston, Heuveline, and Guillot 2001), the all-cause force of mortality is derived from cause-specific forces of mortality through summation.
Finally, the cause-specific modal age at death, 𝑀𝑘, defined as the age at which the highest proportion of deaths occur for a given cause 𝑘, is thus obtained by maximizing the corresponding density function:
𝑀𝑘 = max𝑥 𝑓𝑘(𝑥). (4) Whereas equations (1) to (4) are presented in a continuous setting, our observed
data are available for discrete units of time only, namely single years of age and
Demographic Research: Volume 35, Article 17
http://www.demographic-research.org 481
calendar years. Assumptions are thus required to first estimate the cause-specific forces of mortality, 𝜇𝑘(𝑥), and hence 𝑀𝑘.
Specifically, for a given calendar year and sex, let 𝑑𝑖𝑘 represent observed death counts by single years of age 𝑖 and cause of death 𝑘, and 𝑒𝑖 denote the population’s amount of exposure to the risk of dying for each age 𝑖. Under the assumption of a constant cause-specific force of mortality over each one-year age interval, i.e., 𝜇𝑘(𝑥) =𝜇𝑖𝑘 for all 𝑥 𝜖 [𝑖, 𝑖 + 1), death counts by single years of age and cause of death, 𝑑𝑖𝑘, are assumed to be realizations from a Poisson distribution with mean 𝑒𝑖 ∙ 𝜇𝑖𝑘 (section 4.5 in Alho and Spencer 2005, Brillinger 1986). Generally, 𝜇𝑖𝑘 can be estimated by the central death rate 𝑚𝑖𝑘 = 𝑑𝑖𝑘 𝑒𝑖⁄ . Although this straightforward approach is quite simple, it does not allow deriving with great precision the cause-specific density functions and the associated modal ages at death. To overcome these limitations, we smooth age- and cause-specific death rates in order to retain the continuity of the age patterns of mortality presented above.
Among the various nonparametric smoothing techniques, we opted for the P-splines method (as illustrated in the Appendix of Ouellette and Bourbeau (2011) for the derivation of the all-cause modal age at death), which combines the concept of (fixed-knot) B-splines with a roughness penalty. Compared to the competing techniques available, P-splines is the smoother that features the most desirable properties simultaneously (see Table 1 in the Rejoinder section of Eilers and Marx (1996) on p.121, and Appendix A, notably, of Eilers, Marx, and Durban (2015) for a comparison with O-splines). Moreover, this method has been proven highly effective for smoothing mortality rates and hence for obtaining smooth forces of mortality (Camarda 2008, 2012, Currie, Durban, and Eilers 2004).
Algebraically, cause-specific forces of mortality can be described by a combination of B-splines basis and cause-specific penalized coefficients:
𝜇𝑖𝑘 = exp(𝑩(𝑥𝑖)𝛼𝑘), (5)
where 𝑥𝑖 is such that 𝑥𝑖+1 − 𝑥𝑖 = 1 and coefficients 𝛼𝑘 are estimated by a penalized likelihood approach. The compromise between smoothness and precision (fit to the observed data) is controlled in the model by a smoothing parameter included in the penalty. For the present study we rely on the Bayesian Information Criterion (Schwarz 1978) to select the smoothing parameter, as this criterion has been shown to be the most suitable in the context of mortality data (Currie, Durban, and Eilers 2004).
With the cause-specific forces of mortality described in a smooth way, we can approximate the continuous forces of mortality, �̂�𝑘(𝑥), at any desired level of precision 𝛿 . Then, given smooth cause-specific forces of mortality at the chosen level of precision, we compute the all-cause survival functions using standard numerical
Diaconu et al.: An analysis of the modal lifespan by leading causes of death in Canada
482 http://www.demographic-research.org
integration techniques (see equation (3)). Cause-specific density functions and corresponding modal ages at death are ultimately derived using equations (2) and (4).
In practice, to approximate the continuous forces of mortality we evaluate the B-splines basis at fine grids of age and multiply them by the estimated coefficients:
�̂�𝑘(𝑥) ≈ exp(𝑩(𝑥�)𝛼�𝑘), (6)
where 𝑥� is such that 𝑥�𝑗+1 − 𝑥�𝑗 = 𝛿. In the present study, we set 𝛿 = 10−2, which leads to a precision up to the second decimal for the cause-specific modal age-at-death estimates.
This method of deriving 𝑀𝑘 has several advantages. The smooth densities are standardized with respect to the population exposure estimates, thus allowing proper comparison between ages, calendar years, and sex. In fact, these curves can be seen as the smooth representation of cause-specific age-at-death distributions obtained from a multiple decrement life table (see Figure A-1, Appendix), with the following two additional advantages: (1) the smooth densities are free from any parametric assumption regarding the shape of the age distribution of deaths, and (2) they are estimated with a great numerical precision that facilitates the identification of 𝑀𝑘.
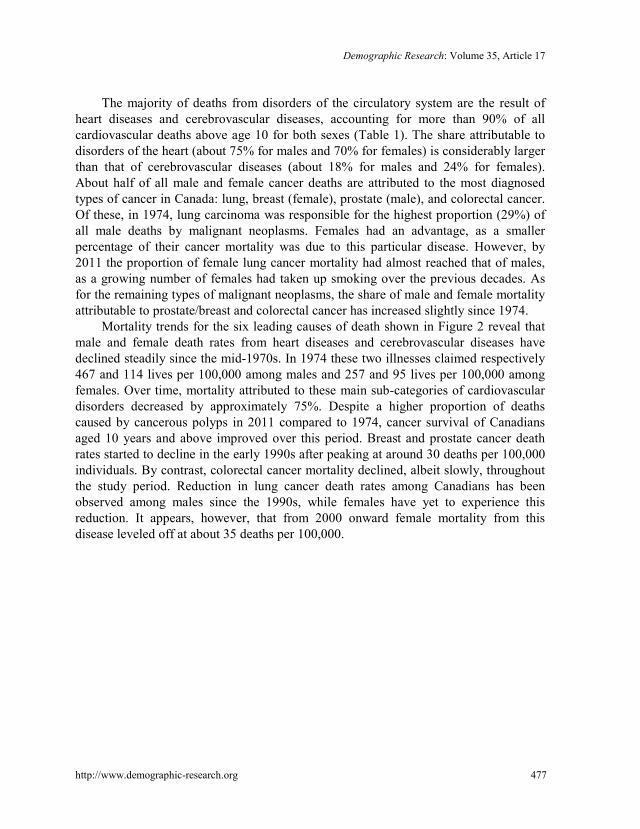
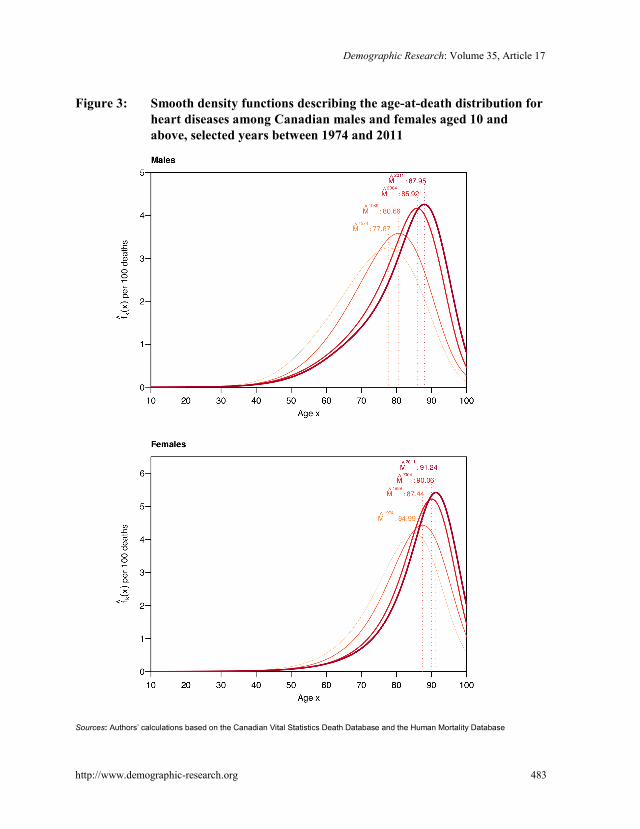
For illustration purposes, Figure 3 presents P-spline-smooth density curves for heart diseases by sex and for selected calendar years between 1974 and 2011, along with corresponding estimated modal ages at death (Figure A2 in the Appendix for the remaining five causes of death). For both males and females, the smooth age-at-death distributions for heart diseases progressively moved towards older ages over time and consequently so did their old-age death heap. Indeed, in 1974 the highest proportion of male and female deaths occurred at ages 77.67 and 84.99, respectively. By 2011 these values had increased to 87.95 and 91.24. While Figure 3 is informative, it only provides a snapshot at particular points in time of the changes in heart diseases’ 𝑀� since 1974. A more detailed analysis of period changes in cause-specific modal ages at death as well as simultaneous comparison between causes are best mirrored by the pattern of trends in 𝑀�𝑘 yearly values, as shown in the next section.
Demographic Research: Volume 35, Article 17
http://www.demographic-research.org 483
Figure 3: Smooth density functions describing the age-at-death distribution for heart diseases among Canadian males and females aged 10 and above, selected years between 1974 and 2011
Sources: Authors’ calculations based on the Canadian Vital Statistics Death Database and the Human Mortality Database
Diaconu et al.: An analysis of the modal lifespan by leading causes of death in Canada
484 http://www.demographic-research.org
4. Results
4.1 Cause-specific differentials and trends in 𝑴� 𝒌
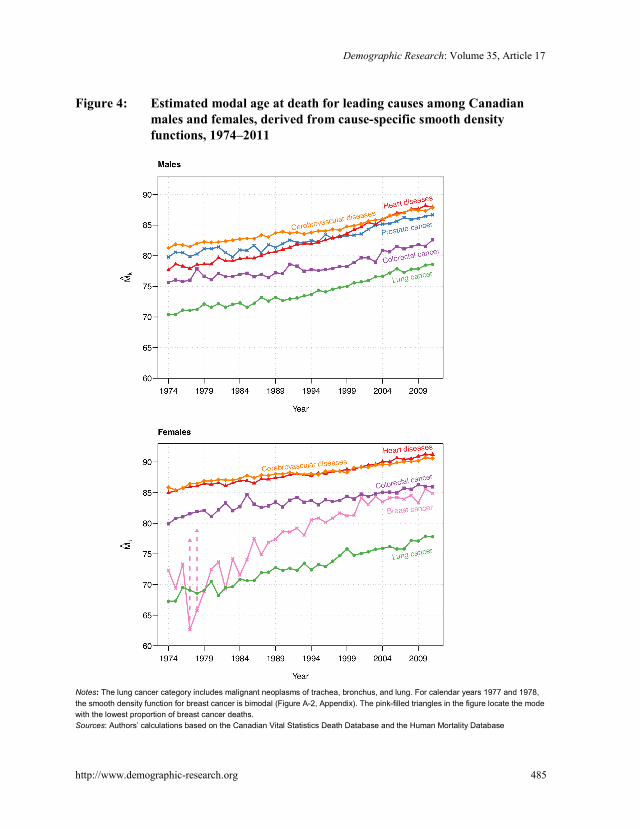
Figure 4 depicts cause-specific changes in the most frequent age at death such as measured by 𝑀�𝑘 for Canadian males and females between 1974 and 2011. It reveals important differences in levels between the various leading causes of death throughout the 38-year period studied. In general, the following ranking (from lowest to highest values) is observed: lung cancer, colorectal cancer, heart diseases, and cerebrovascular diseases. 6 For males, prostate cancer ranked in between colorectal cancer and heart diseases until the end of the 1990s and in between the two sub-categories of cardiovascular diseases after that. For females, 𝑀𝑘 estimates for lung and colorectal cancer bound those for breast cancer.7
Therefore, from 1974 to 2011 the greatest gap in modal age-at-death estimates is observed between lung cancer and cardiovascular diseases. Indeed, the majority of male lung cancer deaths occurred around the age of 70 years old in 1974, which is about 10 years earlier than for male cerebrovascular deaths. Nearly four decades later the 10-year gap is maintained and now opposes lung cancer to both cerebrovascular and heart diseases. An even wider gap is seen among females for these conditions. At the beginning of the study period the majority of females died a few years prior to their 70th birthday from lung cancer and about 15 years later from heart and cerebrovascular diseases. In 2011 the female modal age at death from lung cancer is postponed to age 77.8 and that from heart diseases to 91.2, yielding a 13.4-year gap.
Notable differences in 𝑀�𝑘 are also noticed between colorectal, prostate (males), and breast cancer (females). The results for males reveal that in 1974 Canadians typically died of colorectal cancer at the age of 75, that is, about four years earlier than those who died of prostate cancer. The gap in modal age-at-death estimates for these two malignant neoplasms remained quite stable throughout the study period: hence in 2011 males with prostate cancer still outlived by 4.1 years, in terms of modal age at death, those battling colorectal cancer. Similarly, females with colorectal cancer had a significant advantage over those with a breast tumor, especially until the mid-1990s.
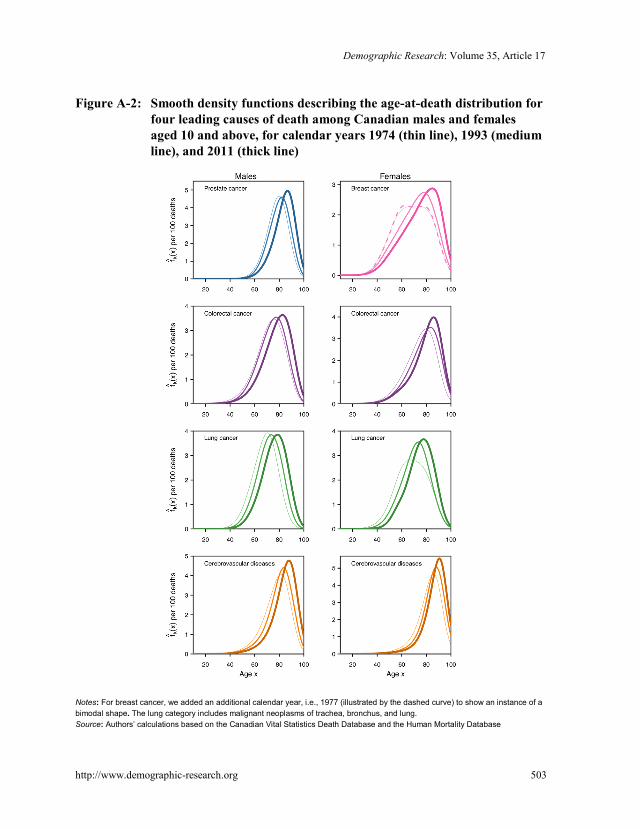
6 Note that while among males, 𝑀�𝑘 values for heart diseases are distinctively lower than those for cerebrovascular diseases until the late-1990s and then overlap, the two corresponding 𝑀�𝑘 series for females were very similar after 1974. 7 For calendar years 1977 and 1978 the density function describing the age distribution of breast cancer deaths is bimodal (Figure A-2, Appendix). That is, we can distinguish two modal ages at death. The bimodal shape of the density function could be explained by the fact that breast cancer is etiologically heterogeneous (see Anderson and Matsuno 2006 for further details). Analyses conducted in this paper are based on the ‘dominant’ mode, i.e., the age at which the highest proportion of deaths occurs.
Demographic Research: Volume 35, Article 17
http://www.demographic-research.org 485
Figure 4: Estimated modal age at death for leading causes among Canadian males and females, derived from cause-specific smooth density functions, 1974‒2011
Notes: The lung cancer category includes malignant neoplasms of trachea, bronchus, and lung. For calendar years 1977 and 1978, the smooth density function for breast cancer is bimodal (Figure A-2, Appendix). The pink-filled triangles in the figure locate the mode with the lowest proportion of breast cancer deaths. Sources: Authors’ calculations based on the Canadian Vital Statistics Death Database and the Human Mortality Database
Diaconu et al.: An analysis of the modal lifespan by leading causes of death in Canada
486 http://www.demographic-research.org
Later on, the most frequent age at death for breast cancer became progressively closer to that of colorectal cancer, reaching about 85 years by 2011.
Looking more closely at the females’ results, we notice a clear separation between the estimated modal age at death for cancers and cardiovascular diseases. The gap between these two groups of causes barely narrowed, despite the sustained increase in 𝑀�𝑘 over the 1974‒2011 period. The separation is less obvious when analyzing the males’ trends, as the relatively high level of 𝑀�𝑘 for prostate cancer mitigates it.
Despite important differences in terms of levels between the leading causes of death studied, trends in modal age at death for each cause are strikingly similar. Indeed, Figure 4 reveals quite linear and nearly parallel upward trends in 𝑀�𝑘 for most causes, except for heart diseases (males) and breast cancer (females). Looking at the males’ results, we notice a slightly faster pace of increase for heart diseases than for any other cause of death. Until the mid-1990s heart diseases ranked third in terms of highest modal age at death, behind cerebrovascular diseases and prostate cancer. Thanks to an average growth rate of 3.2 months per year, the mode for heart diseases surpassed that of prostate cancer in 1997 at the level of 82.8 years and then gradually reached that of cerebrovascular diseases. For causes of death other than heart diseases, the average growth rate is contained between 2.1 (cerebrovascular diseases) and 2.6 (lung cancer) months per year. Among females, the fastest increase in the most frequent age at death is observed for breast cancer and to some extent for lung cancer also. Indeed, throughout our study period 𝑀𝑘 estimates for these diseases were postponed on average by about 4.0 and 3.3 months per year, respectively. The modal age at death for heart diseases, cerebrovascular diseases, and colorectal cancer increased more moderately, as females with these pathogens gained, on average, 2 months per year or less in their typical length of life.
4.2 Exploratory analysis of the pace of increase in 𝑴� 𝒌
In order to assess, beyond visual inspection, whether the various 𝑀�𝑘 trends shown in Figure 4 are parallel, we conducted a simple statistical test. First, we modeled each 𝑀�𝑘 trend as a linear function of time. 8 Second, we performed, for males and females separately, an ANOVA test to determine whether the cause-specific slopes differ significantly from one another. Under the null hypothesis, increases in the estimated modal age at death occurred at the same pace for all causes over the 1974‒2011 period. We test this hypothesis under the alternative, stating that the modal age at death of at
8 Each linear regression model is a first approximation of the actual trend. For the various causes, these models explain between 85% (colorectal cancer among males) and 97% (heart diseases among females) of the variability in the data.
Demographic Research: Volume 35, Article 17
http://www.demographic-research.org 487
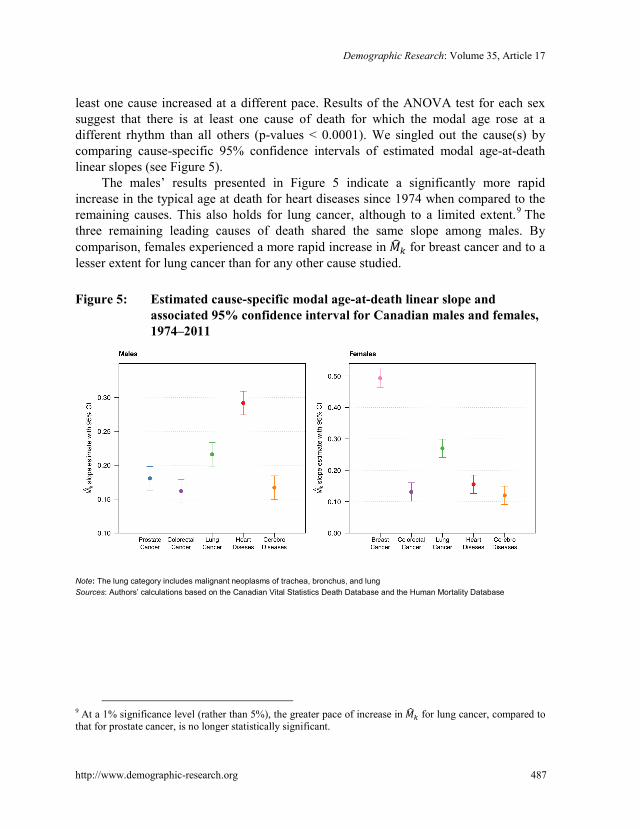
least one cause increased at a different pace. Results of the ANOVA test for each sex suggest that there is at least one cause of death for which the modal age rose at a different rhythm than all others (p-values < 0.0001). We singled out the cause(s) by comparing cause-specific 95% confidence intervals of estimated modal age-at-death linear slopes (see Figure 5).
The males’ results presented in Figure 5 indicate a significantly more rapid increase in the typical age at death for heart diseases since 1974 when compared to the remaining causes. This also holds for lung cancer, although to a limited extent.9 The three remaining leading causes of death shared the same slope among males. By comparison, females experienced a more rapid increase in 𝑀�𝑘 for breast cancer and to a lesser extent for lung cancer than for any other cause studied.
Figure 5: Estimated cause-specific modal age-at-death linear slope and
associated 95% confidence interval for Canadian males and females, 1974‒2011
Note: The lung category includes malignant neoplasms of trachea, bronchus, and lung Sources: Authors’ calculations based on the Canadian Vital Statistics Death Database and the Human Mortality Database
9 At a 1% significance level (rather than 5%), the greater pace of increase in 𝑀�𝑘 for lung cancer, compared to that for prostate cancer, is no longer statistically significant.
Diaconu et al.: An analysis of the modal lifespan by leading causes of death in Canada
488 http://www.demographic-research.org
5. Discussion and conclusion
Since the early 2000s the modal age at death (M) has gained increasing scientific interest for monitoring reductions in all-cause mortality at older ages in economically advanced countries. Despite this, studies of M trends by cause of death remain very scarce. Improvements in old-age survival from specific causes of death are, to date, usually assessed through decomposition analyses of changes in life expectancy at birth or at some older age such as 50 or 65 (Beltrán-Sánchez, Preston, and Canudas-Romo 2008, Glei, Meslé, and Vallin 2010, van Raalte, Martikainen, and Myrskylä 2014). However, recent findings substantiate that changes in life expectancy, unlike M, tend to underestimate age shifts in old-age mortality (Horiuchi et al. 2013). Accordingly, this paper is the first to analyze cause-specific trends in modal ages at death. We extend a recently developed method for deriving all-cause M estimates from Poisson regressions with P-splines (Ouellette and Bourbeau 2011) to the context of cause-of-death analysis. P-splines have gained much recognition in the past decade for smoothing mortality curves and have proved to be very efficient when using erratic data – a problem often encountered when refining the analysis of mortality by cause due to a small number of deaths.
The present work exploits mortality data from the Canadian Vital Statistics Death Database (CVSDD), which provides detailed information about individuals who died from a particular cause – an important advantage for the study of M. Indeed, while most cause-of-death data for national populations are available by 5-year age groups, there is currently no method for determining M from these aggregated mortality data in broad age groupings. Very few countries other than Canada have detailed high-quality data on deaths by cause and single year of age over a long period of time (the United States is one rare example). A possible limitation of our data series is that information on causes of death by single year of age in Canada from the CVSDD is available only from 1974 onward. Because the cardiovascular revolution was already in full swing by the mid-1970s, we are unable to identify the year of the onset of the increase in M for heart diseases and cerebrovascular diseases, as well as for the other causes of death. Moreover, we cannot determine the cause(s) of death responsible for the upward all-cause M trend for Canadian females observed prior to 1974 (Ouellette and Bourbeau 2011).
Our results firstly show notable differences between the various leading causes studied for each sex in terms of level of modal age-at-death values. These differences in level were expected to some degree, because age patterns of mortality differ greatly by cause of death (Horiuchi et al. 2003). Mortality attributed to various types of malignant neoplasms (especially those strongly associated with behavioral factors such as lung
Demographic Research: Volume 35, Article 17
http://www.demographic-research.org 489
cancer and colorectal cancer) increases faster in middle age, while chronic cardiovascular disease mortality rises steeply in old age.
Although cause-specific modal ages at death differ greatly in level, our results indicate that modal age values for leading causes among Canadian males and females increased steadily throughout the 1974‒2011 period. Moreover, the increase occurred at a strikingly similar pace for most causes, except for heart diseases (males), breast cancer (females), and to a lesser extent lung cancer (males and females). These findings suggest, on one hand, an extension of the ‘typical’ (i.e., modal) length of life attained by individuals battling any one of these diseases and, on the other hand, that this prolongation of life occurred at a similar cadence for all individuals regardless of the cause they were fighting.
The widespread and rapid decline of cardiovascular disease mortality, particularly for heart diseases and cerebrovascular diseases, was initiated in the 1960s by the cardiovascular revolution. The benefits brought about by this revolution in terms of technological advancement in preventive and curative medicine, as well as changes in behavioral patterns and lifestyles, ushered in a new era of progress in terms of adult and old-age survival. Evidence suggests that an important part of the decline in heart disease mortality since the late 1960s is due to the reduction in risk factors such as blood pressure, cholesterol, and smoking (Goldman and Cook 1984, Unal, Critchley, and Capewell 2004). Medical treatments, including secondary preventive therapies after myocardial infarction or revascularization, heart failure, and acute myocardial infraction treatments, would account for the rest of the decline (Ford et al. 2007, Unal, Critchley, and Capewell 2004).
As health improvements tend to affect several causes of death simultaneously, more efficient management of diseases and risk factors, supplemented by positive changes in individual behavior laid down by the cardiovascular revolution, benefited not only survival of diseases of the circulatory system but also of cancers. Evidence suggests that most cancers are associated with several modifiable risk factors. Indeed, smoking is responsible for approximately 30% of all types of cancers combined and accounts for 90% of lung cancer (Stein and Colditz 2004). A wide body of literature also identified physical activity as an important modifiable risk factor for cancers, especially for colon and breast cancer (Kampert et al. 1996, Paffenbarger, Lee, and Wing 1992, Thune and Furberg 2001). Indeed, high levels of physical activity lower the relative risk of colon cancer in males and females by about 30%‒40%, and of breast cancer in women by approximately 20%‒30% (Lee 2003). Hence, reduction in risk factors such as smoking and physical inactivity may have contributed to reducing cancer mortality in the elderly population, which resulted in extending the typical length of life of individuals battling these diseases.
Diaconu et al.: An analysis of the modal lifespan by leading causes of death in Canada
490 http://www.demographic-research.org
The cardiovascular revolution set the stage for further technical advancement in preventive and curative medicine, particularly in regard to early diagnosis and treatment of cancers. Indeed, the reduction in colon cancer mortality in Canada between 1970 and 2007 was mainly attributable to early detection by means of testing for the presence of blood in stools and colonoscopy, and to the early removal of pre-cancerous polyps via adjuvant chemotherapy (Edwards et al. 2005, Schatzkin et al. 1994). Early diagnosis has also played an important part in reducing breast cancer mortality, especially since the implementation of the breast-screening program established in all Canadian provinces in 1998 (Shields and Wilkins 2009). Moreover, breast-conserving surgery, radiation, and hormonal therapy proved to be very efficient in increasing the survival of females that tested positive for cancerous polyps in the breast, especially when the malignant cells were caught in the early stages of their development (Harlan et al. 2002, Mariotto et al. 2002, NIH 1991). While no identifiable risk factor has been associated with prostate cancer, its mortality is highly responsive to early diagnosis and efficacy of treatment. Evidence shows that wide use of the PSA (the prostate-specific antigen) test has played a decisive role in reducing death rates from this disease (Nam and Klotz 2009, Schröder et al. 2009). Among the various treatment options available for prostate cancer, observational studies demonstrated that radiation therapy and radical prostatectomy have the most beneficial effects on survival (Trock et al. 2008, Wong et al. 2006). Hence, medical progress in past decades regarding cancer diagnosis and treatment played a considerable role in improving cancer survival.
Improved old-age survival following this medical progress and changes in behavioral patterns and lifestyles may be responsible for the very similar pace of increase in modal age at death for most causes studied. Indeed, as individuals benefit from enhanced diagnostic methods, pharmaceutical regulation, and treatment options, and as they adopt healthier lifestyles and comply with medical protocol, they become less vulnerable to most pathologies. Individuals hence see their old-age frailty postponed to advanced ages, thus increasing their survival of the various health conditions until that age. The faster pace of growth in modal age at death observed for heart diseases (males), breast cancer (females), and to a lesser extent lung cancer (males and females) suggests that these causes were slightly more responsive to the improvements discussed above. Indeed, in high-income countries half of the decline in mortality from heart diseases is attributable to changes in risk factors, notably smoking cessation, and the remaining half to specific medical treatments (Bots and Grobbee 1996, Capewell et al. 2010, Unal, Critchley, and Capewell 2004). By contrast, improvements in breast cancer survival are in large part associated with the increased coverage of mammography screening and successful medical treatment (Lacey, Devesa, and Brinton 2002). The declining trend in breast cancer mortality, however, is quite unlikely to be related to changes in major risk factors, i.e., obesity and reduced and
Demographic Research: Volume 35, Article 17
http://www.demographic-research.org 491
delayed childbearing (Levi et al. 2005), as in many high-income countries a growing number of women have engaged in such behaviors in past years. In contrast to breast cancer, the fall in lung cancer mortality is for the most part linked to the declining trend in smoking prevalence observed in Canada since the mid-1900s (Corsi et al. 2014). However, further investigation is needed to identify the exact role played by improvements in health technologies and strategies in the extension of the typical length of life of each cause, and to what degree changes in lifestyle behaviors were more important than medical advances. In particular, it would be interesting to differentiate, for heart diseases as opposed to cerebrovascular diseases, the etiological characteristics that are susceptible to yielding a higher responsiveness to changes brought about by the cardiovascular revolution.
Also of interest is why the modal age at death for breast cancer increased more rapidly than any other type of cancer studied, and especially than prostate cancer. One possible explanation of the faster pace of increase in 𝑀� for breast cancer compared to prostate cancer (for example) may be the particular age domain over which each cause operates. Indeed, the risk of developing breast cancer increases rapidly during a woman’s reproductive period and slows down as she enters menopause (Lacey, Devesa, and Brinton 2002). Conversely, the risk of prostate cancer increases exponentially with age and develops more often in older than younger men (Crawford 2003). Consequently, from 1974 onward there was greater room for improvement in breast cancer survival than in prostate cancer survival, particularly at younger ages. The advancements made in screening and treatment since the mid-1970s were probably more effective in averting deaths from breast cancer occurring at younger old ages, thereby allowing its typical length of life to gradually converge towards that of prostate cancer. Future research should explore this avenue and determine whether improvements in the Canadian health care system's preventive and curative measures were indeed more successful in averting deaths from breast cancer than from prostate cancer.
To conclude, the strikingly similar and steady pace of increase in M for the majority of leading causes of death in Canada since 1974 was unexpected. At the onset of this paper, we had, instead, hypothesized variable cadences for M over time and across causes. These results do not appear specific to the Canadian context; preliminary analysis for the United States over the same period shows comparable outcomes (Diaconu et al. 2015). Moreover, the pace of increase in M for the six leading causes of death in Canada shows no obvious sign of deceleration during the period studied, including in recent years, thus suggesting that future longevity gains can be expected. These gains are likely to be substantial if significant advancements are made in terms of cancer mortality. The accuracy of these predictions may therefore provide important insight into future trends in human longevity, especially if steady or decreasing levels of
Diaconu et al.: An analysis of the modal lifespan by leading causes of death in Canada
492 http://www.demographic-research.org
old-age mortality compression accompany the continued rise in M by leading causes of death. Alongside the present analysis of trends in M by cause, a study of old-age cause-specific mortality dispersion would be highly desirable, to deepen our understanding of improvements in cause-specific survival.
6. Acknowledgements
This work was funded by the Fonds de recherche du Québec – Société et culture, by the Social Sciences and Humanities Research Council of Canada, by the French National Research Agency (ANR-12-FRAL-0003-01 DIMOCHA), and by the AXA project Mortality Divergence and Causes of Death (MODICOD). Analyses presented in this paper were conducted at the Quebec Interuniversity Centre for Social Statistics, part of the Canadian Research Data Centre Network, whose services and activities are funded by Quebec universities and several Canadian governmental agencies. We would like to thank participants at the 2013 Meeting of the Population Association of America and the XXVII IUSSP International Population Conference for valuable comments and suggestions.
Demographic Research: Volume 35, Article 17
http://www.demographic-research.org 493
References
Alho, J.M. and Spencer, B.D. (2005). Statistical demography and forecasting. New York: Springer.
Anderson, W.F. and Matsuno, R. (2006). Breast cancer heterogeneity: A mixture of at least two main types? Journal of the National Cancer Institute (98)14: 948‒951. doi:10.1093/jnci/djj295.
Beltrán-Sánchez, H., Preston, S.H., and Canudas-Romo, V. (2008). An integrated approach to causes-of-death analysis: Cause-deleted life tables and decomposition of life expectancy. Demographic Research 19(35): 1323‒1350. doi:10.4054/DemRes.2008.19.35.
Bots, M.L. and Grobbee, D.E. (1996). Decline of coronary heart disease mortality in the Netherlands from 1978 to 1985: Contribution of medical care and changes over time in presence of major cardiovascular risk factors. Journal of Cardiovascular Risk 3(3): 271‒276. doi:10.1097/00043798-199606000-00002.
Brillinger, D.R. (1986). The natural variability of vital rates and associated statistics. Biometrics 42: 693‒734. doi:10.2307/2530689.
Brown, D.C., Hayward, M.D., Montez, J.K., Hummer, R.A., Chiu, C.T., and Hidajat, M.M. (2012). The significance of education for mortality compression in the United States. Demography 49(3): 819‒840. doi:10.1007/s13524-012-0104-1.
Camarda, C.G. (2008). Smoothing methods for the analysis of mortality development. [PhD thesis], Madrid: Universidad Carlos III de Madrid, Department of Statistics.
Camarda, C.G. (2012). MortalitySmooth: An R package for smoothing Poisson counts with P-Splines. Journal of Statistical Software 50(1). doi:10.18637/jss.v050.i01.
Canudas-Romo, V. (2008). The modal age at death and the shifting mortality hypothesis. Demographic Research 19(30): 1179‒1204. doi:10.4054/DemRes. 2008.19.30.
Canudas-Romo, V. (2010). Three measures of longevity: Time trends and record value. Demography 47(2): 299‒312. doi:10.1353/dem.0.0098.
Capewell, S., Ford, E.S., Croft, J.B., Critchley, J.A., Greenlund, K.J., and Labarthe, D.R. (2010). Cardiovascular risk factor trends and potential for reducing coronary heart disease mortality in the United States of America. Bulletin of the World Health Organization 88(2): 120‒130. doi:10.2471/BLT.08.057885.
Diaconu et al.: An analysis of the modal lifespan by leading causes of death in Canada
494 http://www.demographic-research.org
Cheung, S.L.K. and Robine, J.-M. (2007). Increase in common longevity and the compression of mortality: The case of Japan. Population Studies 61(1): 85‒97. doi:10.1080/00324720601103833.
Cheung, S.L.K., Robine, J.-M., and Caselli, G. (2008). The use of cohort and period data to explore changes in adult longevity in low mortality countries. Genus 64(1–2): 101‒129.
Cheung, S.L.K., Robine, J.-M., Paccaud, F., and Marazzi, A. (2009). Dissecting the compression of mortality in Switzerland, 1876‒2005. Demographic Research 21(19): 569‒598. doi:10.4054/DemRes.2009.21.19.
Cheung, S.L.K., Robine, J.-M., Tu, E.J.-C., and Caselli, G. (2005). Three dimensions of the survival curve: Horizontalization, verticalization, and longevity extension. Demography 42(2): 243‒258. doi:10.1353/dem.2005.0012.
Corsi, D.J., Boyle, M.H., Lear, S.A., Chow, C.K., Teo, K.K., and Subramanian, S.V. (2014). Trends in smoking in Canada from 1950 to 2011: Progression of the tobacco epidemic according to the socioeconomic status and geography. Cancer Causes Control 25: 45‒57. doi:10.1007/s10552-013-0307-9.
Crawford, D.E. (2003). Epidemiology of prostate cancer. Urology 62(6, Supplement 1): 3‒12. doi:10.1016/j.urology.2003.10.013.
Currie, I.D., Durban, M., and Eilers, P.H.C. (2004). Smoothing and forecasting mortality rates. Statistical Modelling 4(4): 279‒298. doi:10.1191/1471082X04st 080oa.
Diaconu, V., Bourbeau, R., Ouellette, N., and Camarda, C.G. (2015). The changing age distribution of deaths by cause in Canada and the U.S. Paper presented at the 16th Conference of the ASMDA International Society, Piraeus, Greece, 30th June–4th July 2015.
Edwards, B.K., Brown, M.L., Wingo, P.A., Howe, H.L., Ward, E., Ries, L.A.G., Schrag, D., Jamison, P.M., Jemal, A., Wu, X.C., Friedman, C, Harlan, L., Warren, J, Anderson, R.N., and Pickle, L.W. (2005). Annual report to the nation on the status of cancer, 1975-2002, featuring population-based trends in cancer treatment. Journal of the National Cancer Institute 97(19): 1407‒1427. doi:10.1093/jnci/dji289.
Eilers, P.H.C. and Marx, B.D. (1996). Flexible smoothing with B-splines and penalties (with discussion). Statistical Science 11(2): 89‒121. doi:10.1214/ss/10384256 55.
Demographic Research: Volume 35, Article 17
http://www.demographic-research.org 495
Eilers, P.H.C., Marx, B.D., and Durban, M. (2015). Twenty years of P-splines. SORT 39(2): 149‒186.
Ford, E.S., Ajani, U.A., Croft, J.B., Critchley, J.A., Labarthe, D.R., Kottke, T.E., Giles, W.H., and Capewell, S. (2007). Explaining the decrease in U.S. deaths from coronary disease, 1980–2000. New England Journal of Medicine 356: 2388‒2398. doi:10.1056/NEJMsa053935.
Glei, D.A., Meslé, F., and Vallin, J. (2010). Diverging trends in life expectancy at age 50: A look at causes of death. In: Crimmins, E. M., Preston, S. H., and Cohen, B. (eds.). International differences in mortality at older ages. Washington DC: The National Academy Press.
Goldman, L.E.E. and Cook, E.F. (1984). The decline in ischemic heart disease mortality rates. Annals of Internal Medicine 101: 825‒836. doi:10.7326/0003-4819-101-6-825.
Harlan, L.C., Abrams, J., Warren, J.L., Clegg, L., Stevens, J., and Ballard-Barbash, R. (2002). Adjuvant therapy for breast cancer: Practice patterns of community physicians. Journal of Clinical Oncology 20(7): 1809‒1817. doi:10.1200/JCO.2 002.07.052.
Horiuchi, S. (1999). Epidemiological transitions in human history. In: United Nations (ed.) Health and mortality issues of global concern: Proceedings of the Symposium on Health and Mortality, Brussels, 19‒22 November 1997. New York: United Nations: 54‒71.
Horiuchi. S., Finch, C.E., Meslé, F., and Vallin, J. (2003). Differential patterns of age-related mortality increase in middle age and old age. Journal of Gerentology: Biological Sciences 58A(6): 495‒507. doi:10.1093/gerona/58.6.b495.
Horiuchi, S., Ouellette, N., Cheung, S.L.K., and Robine, J.-M. (2013). Modal age at adult death: Lifespan indicator in the era of longevity extension. Vienna Yearbook of Population Research 11: 37‒69. doi:10.1553/populationyearbook 2013s37.
Human Mortality Database (2015). University of California, Berkeley (USA), and Max Planck Institute for Demographic Research, Rostock (Germany). Available at http://www.mortality.org or http://www.humanmortality.de (data downloaded on 1/1/2015).
Kampert, J.B., Blair, S.N., Barlow, C.E, and Kohl, H.N. (1996). Physical activity, physical fitness, and all-cause and cancer mortality: A prospective study of men
Diaconu et al.: An analysis of the modal lifespan by leading causes of death in Canada
496 http://www.demographic-research.org
and women. Annals of Epidemiology 6(5): 452‒457. doi:10.1016/S1047-2797 (96)00059-2.
Kannisto, V. (2001). Mode and dispersion of the length of life. Population 13(1): 159‒171.
Kannisto, V. (2007). Central and dispersion indicators of individual life duration: New methods. In: Robine, J.-M., Crimmins, E.M., Horiuchi, S., and Zeng, Y. (eds.). Human longevity, individual life duration, and the growth of the oldest-old population. Dordrecht: Springer: 111‒129. doi:10.1007/978-1-4020-4848-7_5.
Kannisto, V., Lauritsen, J., Thatcher, A.R., and Vaupel, J.W. (1994). Reduction in mortality at advanced ages: Several decades of evidence from 27 countries. Population and Development Review 20(4): 793‒810. doi:10.2307/2137662.
Lacey, J.V., Devesa, S.S., and Brinton, L.A. (2002). Recent trends in breast cancer incidence and mortality. Environmental and Molecular Mutagenesis 39(2‒3): 82‒88. doi:10.1002/em.10062.
Lee, I.M. (2003). Physical activity and cancer prevention: Data from epidemiologic studies. Medicine & Science in Sports & Exercise 35(11): 1823‒1827. doi:10.1249/01.MSS.0000093620.27893.23.
Levi, F., Bosetti, C., Lucchini, F., Negri, E., and La Vecchia, C. (2005). Monitoring the decrease in breast cancer mortality in Europe. European Journal of Cancer Prevention 14(6): 497‒502. doi:10.1097/00008469-200512000-00002.
Lexis, W. (1877). Zur Theorie der Massenerscheinungen in der menschlichen Gesellschaft. Freiburg i.B.: Fr. Wagner’sche Buchhandlung.
Lexis, W. (1878). Sur la durée normale de la vie humaine et sur la théorie de la stabilité des rapports statistiques. Annales de Démographie Internationale 2(5): 447‒460.
Lussier, M.-H., Bourbeau, R., and Choinière, R. (2008). Does the recent evolution of Canadian mortality agree with the epidemiological transition theory? Demographic Research 18(19): 531‒568. doi:10.4054/DemRes.2008.18.19.
Mariotto, A., Feuer, E.J., Harlan, L.C., Wun, L.M., Johnson, K.A., and Abrams, J. (2002). Trends in use of adjuvant multi-agent chemotherapy and tamoxifen for breast cancer in the United States: 1975–1999. Journal of National Cancer Institute. 94(21): 1626‒1634. doi:10.1093/jnci/94.21.1626.
Meslé, F. and Vallin, J. (2006). Diverging trends in female old-age mortality: The United States and the Netherlands versus France and Japan. Population and Development Review 32(1): 123‒145. doi:10.1111/j.1728-4457.2006.00108.x.
Demographic Research: Volume 35, Article 17
http://www.demographic-research.org 497
Milan, A. (2011). Mortality: Causes of death, 2007. Statistics Canada publication no. 91-209-X.
Missov, T.I., Lenart, A., Németh, L., Canudas-Romo, V., and Vaupel, J.W. (2015). The Gompertz force of mortality in terms of the modal age at death. Demographic Research 32(36): 1031‒1048. doi:10.4054/DemRes.2015.32.36.
Nam, R.K. and Klotz, L.H. (2009). Trends in prostate cancer screening: Canada. In: Ankerst, D.P., Tangen, C.M., and Thompson, I.M. (eds.). Current clinical urology: Prostate cancer screening, New York: Humana Press: 23‒33.
NIH consensus conference (1991). Treatment of early-stage breast cancer. The Journal of American Medical Association 265(3): 391‒395.
Office of National Statistics (2012). Mortality in England and Wales: Average life span. London: Office of National Statistics.
Omran, A.R. (1971). The epidemiological transition: A theory of the epidemiology of population change. Millbank Memorial Fund Quarterly 49(4): 509‒538. doi:10.2307/3349375.
Ouellette, N., Barbieri, M., and Wilmoth, J. (2014). Period-based mortality change: Turning points in trends since 1950. Population and Development Review 40(1): 77‒106. doi:10.1111/j.1728-4457.2014.00651.x.
Ouellette, N. and Bourbeau, R. (2011). Changes in the age-at-death distribution in four low mortality countries: A nonparametric approach. Demographic Research 25(19): 595‒628. doi:10.4054/DemRes.2011.25.19.
Ouellette, N., Bourbeau, R., and Camarda, C.G. (2012). Regional disparities in Canadian adult and old-age mortality: A comparative study based on smoothed mortality ratio surfaces and age-at-death distributions. Canadian Studies in Population 39(3‒4): 79‒106.
Paffenbarger, R.S. Jr., Lee, I.M., and Wing, A.L. (1992). The influence of physical activity on the incidence of site-specific cancers in college alumni. Advances in Experimental Medicine and Biology 322: 7‒15. doi:10.1007/978-1-4684-7953-9_2.
Preston, S.H. (1976). Mortality patterns in national population: With special reference to recorded causes of death. New York: Academic Press.
Preston, S.H., Heuveline, P., and Guillot, M. (2001). Demography: Measuring and Modeling Population Processes. Malden: Wiley-Blackwell.
Diaconu et al.: An analysis of the modal lifespan by leading causes of death in Canada
498 http://www.demographic-research.org
Quetelet, A. (1835). Sur l'homme et le développement de ses facultés ou essai de physique sociale. London: Bossange & Co.
Robine, J.-M. (2001). Redéfinir les phases de la transition épidémiologique à travers l’étude de la dispersion des durées de vie: Le cas de la France. Population 56(1‒2): 199‒222. doi:10.2307/1534822.
Schatzkin, A., Freedman, L.S., Dawsey, S.M., and Lanza, E. (1994). Interpreting precursor studies: What polyp trials tell us about large-bowel cancer. Journal of the National Cancer Institute 86(14): 1053‒1057. doi:10.1093/jnci/86.14.1053.
Schröder, F.H., Hugosson, J., Roobol, M.J., Tammela, T.L. J., Ciatto, S., Nelen, V., Kwiatkowski,M., Lujan, M., Lilja, H., Zappa, M., Denis, L.J., Recker, F., Berenguer, A., Määttänen, L., Bangma, C.H., Aus, G., Villers, A., Rebillard, X., van der Kwast, T., Blijenberg, B.G., Moss, S.M., de Koning, H.J., and Auvinen, A. (2009). Screening and prostate cancer mortality in a randomized European study. New England Journal of Medicine 360: 1320‒1328. doi:10.1056/NEJM oa0810084.
Schwarz, G. (1978). Estimating the dimension of a model. The Annals of Statistics 6(2): 461‒464. doi:10.1214/aos/1176344136.
Shields, M. and Wilkins, K. (2009). An update on mammography use in Canada. Health Reports 20(3): 7‒19.
Stein, C.J. and Colditz, G.A. (2004). Modifiable risk factors for cancers. British Journal of Cancer 90: 299‒303. doi:10.1038/sj.bjc.6601509.
Thatcher, A.R., Cheung, S.L.K., Horiuchi, S., and Robine, J.-M. (2010). The compression of deaths above the mode. Demographic Research 22(17): 505‒538. doi:10.4054/DemRes.2010.22.17.
Thune, I. and Furberg, A.S. (2001). Physical activity and cancer risk: dose-response and cancer, all sites and site-specific. Medicine & Science in Sports & Exercise 33(6 Suppl): S530‒50. doi:10.1097/00005768-200106001-00025.
Trock, B., Han, M., Freedland, S., Humphreys, E., DeWeese, T.L., Partin, A.W., Walsh, P.C. (2008). Prostate cancer-specific survival following salvage radiotherapy vs. observation in men with biochemical recurrence after radical prostatectomy. Journal of the American Medical Association 299(23): 2760‒2769. doi:10.1001/jama.299.23.2760.
Demographic Research: Volume 35, Article 17
http://www.demographic-research.org 499
Unal, B., Critchley, J.A., and Capewell, S. (2004). Explaining the decline in coronary heart disease mortality in England and Wales between 1981 and 2000. Circulation 109(9): 1101‒1107. doi:10.1161/01.CIR.0000118498.35499.B2.
van Raalte, A., Martikainen, P., and Myrskylä, M. (2014). Lifespan variation by occupational class: Compression or stagnation over time? Demography 51(1): 73‒95. doi:10.1007/s13524-013-0253-x.
Wilmoth, J., Deegan, J.L., Lundström, H., and Horiuchi, S. (2000). Increase of maximum lifespan in Sweden, 1861‒1999. Science 289: 2366‒2368. doi:10.1126/science.289.5488.2366.
Wong, Y.-N., Mitra, N., Hudes, G., Localio, R., Schwartz, S., Wan, F., Montagnet, C., Armstrong, K. (2006). Survival associated with treatment vs. observation of localized prostate cancer in elderly men. Journal of the American Medical Association 296(22): 2683‒2693. doi:10.1001/jama.296.22.2683.
Diaconu et al.: An analysis of the modal lifespan by leading causes of death in Canada
500 http://www.demographic-research.org
Appendix
A: International Classification of Diseases (ICD) codes for the leading causes of death under study
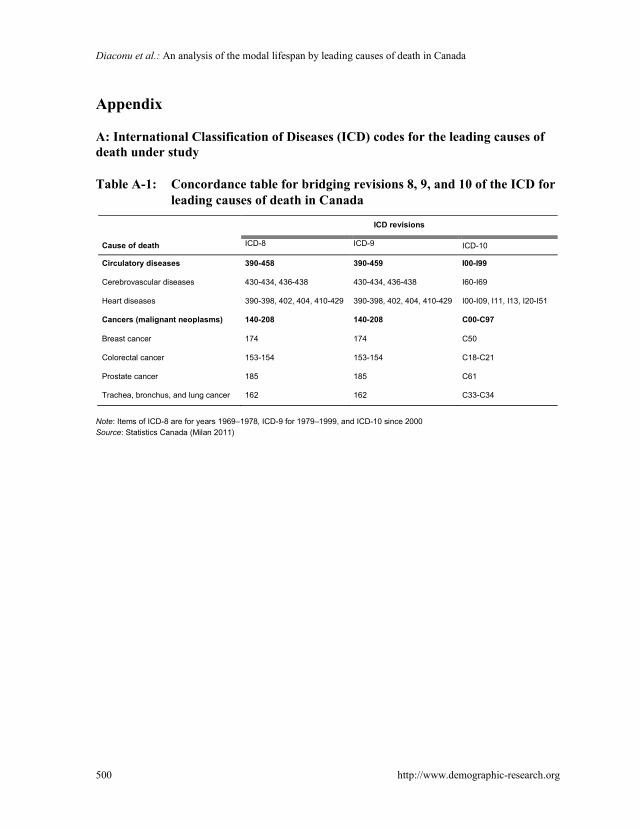
Table A-1: Concordance table for bridging revisions 8, 9, and 10 of the ICD for leading causes of death in Canada
ICD revisions
Cause of death ICD-8
ICD-9
ICD-10
Circulatory diseases 390-458 390-459 I00-I99
Cerebrovascular diseases 430-434, 436-438 430-434, 436-438 I60-I69
Heart diseases 390-398, 402, 404, 410-429 390-398, 402, 404, 410-429 I00-I09, I11, I13, I20-I51
Cancers (malignant neoplasms) 140-208 140-208 C00-C97
Breast cancer 174 174 C50
Colorectal cancer 153-154 153-154 C18-C21
Prostate cancer 185 185 C61
Trachea, bronchus, and lung cancer 162 162 C33-C34
Note: Items of ICD-8 are for years 1969–1978, ICD-9 for 1979–1999, and ICD-10 since 2000 Source: Statistics Canada (Milan 2011)
Demographic Research: Volume 35, Article 17
http://www.demographic-research.org 501
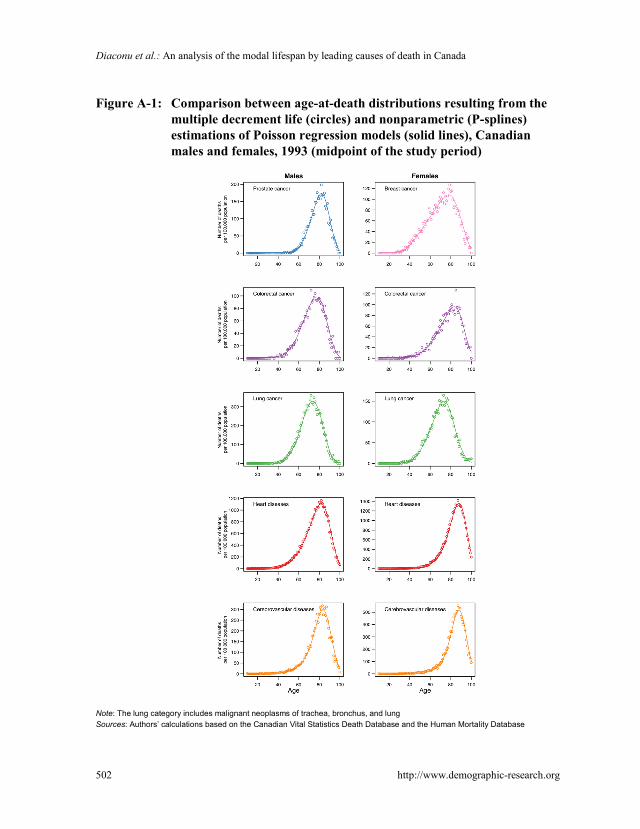
B: Comparison between multiple decrement life table age-at-death distributions and P-spline-smooth cause-specific density functions
Estimated smooth cause-specific density functions obtained from the P-spline method are standardized with respect to estimates of population exposure to risk, thus allowing proper comparison between ages, calendar years, and sex. These curves are in fact the smooth representation of cause-specific age-at-death distributions obtained from a multiple-decrement life table. For illustration purposes, we constructed a multiple-decrement table using all-cause annual probabilities of dying at age 𝑥, 𝑞𝑥, for Canada available in the Human Mortality Database and the proportion of observed deaths 𝜋𝑥𝑘 = 𝐷𝑘(𝑥,𝑥+1)
𝐷(𝑥,𝑥+1) , using data from the Canadian Vital Statistics Death Database.
Hence, for a given calendar year and sex, the probability of dying from cause 𝑘 is given by:
𝑞𝑥𝑘 = 𝑞𝑥 ∗ 𝜋𝑥𝑘. (B.1) Life table deaths from cause 𝑘 were calculated by multiplying the cause-specific
probability of dying by the number of individuals who survived all causes of death until age 𝑥:
𝑑𝑘(𝑥, 𝑥 + 1) = 𝑞𝑥𝑘 ∗ 𝑙𝑥. (B.2) Figure A-1 illustrates the age-at-death distributions by sex for all five leading
causes examined, as described by the life table distribution of deaths across the age range, and the corresponding P-spline-smooth density functions for calendar year 1993 (midpoint of our study period 1974‒2011). As expected, the density functions describe the life table cause-specific death distributions by age. In addition to being free from any parametric assumption on the shape of the curve, the smooth densities are estimated with great numerical precision, which facilitates the identification 𝑀�𝑘 (see section 3).
Diaconu et al.: An analysis of the modal lifespan by leading causes of death in Canada
502 http://www.demographic-research.org
Figure A-1: Comparison between age-at-death distributions resulting from the multiple decrement life (circles) and nonparametric (P-splines) estimations of Poisson regression models (solid lines), Canadian males and females, 1993 (midpoint of the study period)
Note: The lung category includes malignant neoplasms of trachea, bronchus, and lung Sources: Authors’ calculations based on the Canadian Vital Statistics Death Database and the Human Mortality Database
Demographic Research: Volume 35, Article 17
http://www.demographic-research.org 503
Figure A-2: Smooth density functions describing the age-at-death distribution for four leading causes of death among Canadian males and females aged 10 and above, for calendar years 1974 (thin line), 1993 (medium line), and 2011 (thick line)
Notes: For breast cancer, we added an additional calendar year, i.e., 1977 (illustrated by the dashed curve) to show an instance of a bimodal shape. The lung category includes malignant neoplasms of trachea, bronchus, and lung. Source: Authors’ calculations based on the Canadian Vital Statistics Death Database and the Human Mortality Database

Diaconu et al.: An analysis of the modal lifespan by leading causes of death in Canada
504 http://www.demographic-research.org