Embed Size (px)
Citation preview
Integrated Annual Report 2016

Integrated Annual Report 2016
Contents
Contents
p.
CEO Message 3
1 Annual Report of the Board of Directors 5
Business model
Financial review
Non-Financial performance review
Risks and uncertainties
2 Corporate Governance Statement 18
Deviations from the Corporate Governance Code
Composition and modus operandi of the Board and of other bodies and committees
Internal audit and risk management systems in relation to the financial statements
General Meetings and Shareholders’ rights
3 Explanatory Report of the Board of Directors 38
4 Statement of Members of the Board of Directors 41
5 Independent Auditors’ Report 42
6 Financial Statements 44
Income Statement
Statement of Comprehensive Income
Statement of Financial Position
Statement of Changes in Equity
Cash Flow Statement
Notes to the Financial Statements
7 Non-financial Performance Indicators 124
Independent Auditor’s Assurance Statement
Principles and boundaries of non-financial performance review
Non-financial Performance Review according to the United Nations Global Compact Criteria
WBCSD/CSI Non-financial performance indicators
Group memberships and cooperations 2016
About this Report
The 2016 TITAN Group Integrated Annual Report has been compiled in accordance with the International
Integrated Reporting Council Standards, the UK Corporate Governance Code, the International Financial
Reporting Standards and in compliance with the relevant obligations stipulated by Greek Law and the
European Directives.
This Report is available online at http://www.titan-cement.com/en/

Integrated Annual Report 2016
CEO Message
03
CEO MessageDear Shareholders and Stakeholders,
Over the past year, marked by mixed but on
balance favorable market developments, TITAN
made further progress along its key priorities of
balancing profitability and growth, building
operational excellence and nurturing the long term
sustainability of its business.
Strong results in the US drive organic growth
TITAN turnover and profitability continued growing for
a third consecutive year, driven primarily by market
growth in the USA and to a lesser extent operational
improvements in Egypt. Consolidated turnover
increased by 8% to €1,509 million and Earnings before
Interest, Tax, Depreciation and Amortization (EBITDA)
increased by 28.7% to €279 million. Net Profit after
minority interest and the provision for taxes (NPAT)
rose to €127 million, which includes a gain from a
deferred tax asset recognition of €90 million in the US,
associated with previously unrecognized carry-
forward net operating losses generated in previous
years.
In the US, demand for building materials continued
to grow within a generally positive economic
environment of low unemployment, consumer
confidence and infrastructure development. TITAN,
having aimplemented mi€200 llion investment
program over the last three years, was able to
capitalize on the market growth to increase sales
volumes, plant utilization and profitability, both in
cement and in its vertically integrated activities.
Egypt enjoyed a growth in demand and benefited
significantly from a decline in production costs as it
fuel selfsolidits goal ofprogressed towards -
relevanttheofcomponentsufficiency; the last
incoal millprogram, thecapital expenditure
plAlexandria inoperationscommencedant,
December. As a consequence, in spite of the
devaluation of the Egyptian pound by more than
50% in the course of the year, our operations
managed to improve profitability, even in EUR terms,
albeit from a low comparative basis.
In Greece, now in its seventh year of austerity, the
construction market remains in deep recession, with
limited spending on infrastructure projects and a
virtual halt in private housing construction. Our Greek
operations continued their strong export
performance in volume terms, but profitability was
negatively affected by competitive pressures in the
international trade destinations.
The markets of Southeastern Europe provided a
mixed picture, with our operations showing an overall
stable performance. Our joint venture in Turkey
benefited from the increased local demand for
infrastructure and private housing, but was
negatively affected, in EUR terms by the Turkish lira
devaluation.
Investing for organic growth and regional expansion
In line with our objective of geographical
diversification in selected regions, we extended our
geographical footprint in South America through the
acquisition of an equity stake in Cimento Apodi, a
Brazilian cement manufacturer. Cimento Apodi
operates an integrated cement plant and a grinding
plant in the state of Ceara in Northeast Brazil, with a
production capacity of over 2 million tons of cement
per year. Current demand for building materials in
Brazil is low; however, the fundamentals in terms of
urban population growth indicate stronger longer
term prospects.
Investments in existing operations stood at €151
million, primarily in relation to our activities in the US
and the solid fuel conversion project in Egypt.
Investment programs continued in the other regions
as well, mainly linked to sustaining business and
environmental improvements.
On the funding side, TITAN was able to raise a 5-year,
€300 million bond with a 3.5% coupon; Standard &
Poor’s reconfirmed the company’s “BB” rating, with
a positive outlook, highlighting the strong liquidity of
the Group.
Group initiatives towards operational excellence
We continuously invest in improving our
competitiveness, both through local initiatives led by
our regional management teams and centrally at
Group level. Current areas of focus include
excellence in operational maintenance, new digital
and IT infrastructure, enhanced product and process
innovation capacity, as well as two major Group-
wide initiatives, on procurement and people
development.
Our Group Procurement Transformation program,
which went through its first phase of implementation
in 2016, aims to optimize the number of suppliers and
build on long term value-added supplier relationships
with an emphasis on “total cost” reduction,
transparency and enhancement of our sustainability
impact on the supply chain.
The “Titan Leadership Platform”, a major program
addressing our employees announced in 2015, was
rolled out to all countries, promoting the behaviors
that drive strong leadership performance, through a
new personal development process. The program
ourraised bymaterial issuesmostaddresses the
employees in the 2015 survey and provides an
effective conduit through which our core values can
be further disseminated.
Aligning with the UN Sustainable Development Goals
Supporting the United Nations Agenda 2030 for
sustainable development, launched in late 2015, we
proceeded to complete materiality or social impact
Integrated Annual Report 2016
CEO Message
04
assessments at local level in all countries with majority
owned operations, including a first alignment with
the SDGs, which we will support through our existing
and new local and global partnerships. On the basis
of the regional inputs, the corporate materiality
matrix was reviewed and re-confirmed as an up-to-
date record of the priority issues that TITAN aims to
address through its sustainability strategy.
Our sustainability governance has been further
aestablishment ofenhanced through the
members ofcomprisingSustainability Committee,
the TITAN Board and its Executive Committee,
overseeing our long term commitment to sustainable
development.
Indicative highlights of our sustainability efforts in 2016
include the Group’s continuing focus on safety,
which resulted in a reduction in lost time incidents;
the increased use of waste or by-products as raw
materials; our Pennsucoofrecognitionthe
operations in Florida for their “zero waste”
performance; and the enhancement of the Group’s
partnerships with academia and educational-
support programs, in line with our European “Pact for
Youth” commitment.
Our investment in emission control and reduction,
where needed, continued, leading to a further
significant improvement in dust emissions; on the
other hand, CO2 emissions increased marginally, as
the improvement achieved through the increased
use of alternative fuels was not sufficient to
counteract an unfavorable fuel and product mix. In
the process of detailing our strategy in alignment with
the UN Agenda 2030, we will define within 2017 our
new long-range emissions targets.
A positive outlook for 2017
Prospects for TITAN in 2017 appear positive, despite
the considerable challenges and uncertainties
around the globe. The USA business is expected to
remain the main driver of growth and profitability,
thanks to the growth in demand and the benefits
accrued from our extensive investments.
In Greece, demand may decrease further due to a
the infrastructure projects pipeline;intiming gap
butcontinue,exports will increasinglyunder
competitive pressures. Southeastern Europe, in a
broader region of political instability and economic
weakness, will remain at its current levels of activity.
In Egypt, in spite of volatility in the short term,
demand is likely to be sustained and our operations
will benefit from the impact of the investment
program completed in late 2016. In Turkey, the
positive trend is likely to be reversed, as additional
cement production capacity comes on stream and
domestic challenges may affect demand. Finally, in
Brazil, demand is expected to begin to stabilize in
2017.
Based on the 2016 results and the outlook for 2017,
the Board of Directors is proposing to the General
Assembly of Shareholders the payment of a dividend
distribution of €0.10 per share and, in addition, a
return of capital of €1.00 per share.
We would like to thank our shareholders and
stakeholders for their support in the execution of our
strategy to deliver on growth and profitability, to
strengthen our competitiveness and to secure the
long term sustainability of our business.
Dimitri Papalexopoulos
Chief Executive Officer
1 Integrated Annual Report 2016
Annual Report of the Board of Directors for the year 01.01.2016-31.12.2016
05
Annual Report of the Board of Directors for the year 01.01.2016-31.12.2016 Business model
About TITAN Group
TITAN is an international cement and building
materials producer, with a history of more than 110
years. The Group’s business activities include the
production, transportation and distribution of
cement, concrete, aggregates, fly ash, mortars and
other building materials.
The Group is headquartered in Athens, Greece and
has operations in 14 countries, which are managed
under four geographic regions: USA; Greece and
Western Europe; Southeastern Europe; and Eastern
Mediterranean.
In 2016 TITAN generated a consolidated turnover of
€1,509 million and EBITDA of €279 million. At year-end
TITAN employed 5,482 people in total (2015: 5,654).
Governing objective
TITAN aims to grow as a multiregional, vertically
integrated cement producer, combining
entrepreneurial spirit and operational excellence
with respect for people, society and the
environment. This objective is translated into four
strategic priorities:
Geographic diversification: Expansion of the
Group's business through acquisitions and
greenfield developments into attractive new
markets
Vertical integration: Extension of the Group into
other product areas in the cement value chain
Continuous competitive improvement:
Implementation of new efficiencies throughout
the Group to reduce costs and to compete
more effectively
Focus on human capital and Corporate Social
Responsibility: Development of employees and
continuous improvement of the Group's good
relationships with all internal and external
stakeholders.
TITAN Values
TITAN’s values stem directly from the principles,
beliefs and vision of its founders back in 1902. They
are the core elements of TITAN’s culture and family
spirit, providing the foundations of the Group’s
operations and growth.
• Integrity
– Ethical business practices
– Transparency
– Open communication
• Know-how
– Enhancement of knowledge base
– Proficiency in every function
– Excellence in core competencies
• Value to the customer
– Anticipation of customer needs
– Innovative solutions
– High quality of products and services
• Delivering results
– Shareholder value
– Clear objectives
– High standards
• Continuous improvement
– Learning organization
– Willingness to change
– Rise to challenges
• Corporate Social Responsibility
– Safety first
– Sustainable development
– Stakeholder engagement
Value creation
TITAN is creating value through its products and
services; they serve the need for safe, durable,
resilient, affordable and sustainable housing and
infrastructure. The related core activities of the Group
include the extraction of raw materials and their
transformation into building products, the distribution
of the products to customers and the transfer of
know-how and expertise through collaborations with
customers and business partners, local communities
and academia.
Main raw materials used include limestone, clay,
gypsum, mineral aggregates, energy and water.
TITAN also operates systems for recycling, processing
and utilizing waste as alternative raw materials and
alternative fuels, thereby preserving valuable
resources and reducing the carbon footprint.
TITAN’s Research & Development activities include
the monitoring, integration and application within
TITAN Group of the global trends regarding the
environmental footprint reduction, the improvement
of cement and concrete products’ properties and
the development of new products.
In 2016, TITAN invested €150.6 million, of which €60.7
million were spent on environmental improvements.
The economic value created and distributed directly
to key stakeholders in 2016 was as follows:
1 Integrated Annual Report 2016
Annual Report of the Board of Directors for the year 01.01.2016-31.12.2016
06
• €272.6 million to employees for salaries, pensions
and social benefits, including additional benefits
beyond those provided by law
• €938.7 million to local and international suppliers.
• €80.6 million in taxes to national and local
authorities.
• €30.5 million to shareholders and minorities in
cash payments.
• €2.6 million in community projects.
Financial review
Development of activities and significant financial
events
In 2016, TITAN Group recorded a significant
improvement in profitability, thanks to the continuing
growth of the US market and the recovery of results
in Egypt. Consolidated turnover reached €1,509
million, posting an 8.0% increase compared to 2015.
Earnings Before Interest, Tax, Depreciation and
Amortization (EBITDA) increased by 28.7% reaching
€279 million. Net profit after minority interests and the
provision for taxes, stood at €127 million, compared
to €34 million in 2015. 2016 results include a gain from
a deferred tax asset recognition of €90 million in the
US, associated with previously unrecognized carry-
forward net operating losses generated in previous
years.
Group operating free cash flow in 2016, reached
€125 million compared to €64 million in the previous
year primarily as a result of the increase in EBITDA by
€62 million.
Group net debt at the end of 2016 stood at €661
million, €39 million higher compared to the end of
2015. The increase in Group debt was mainly due to
capital expenditure and the acquisition of the stake
in Cimento Apodi. On the flip side, the devaluation
of the Egyptian pound had a positive effect in the
Euro value of loans taken in local currency in Egypt.
In June 2016, Titan Global Finance Plc. (TGF) issued a
5-year bond of a total nominal amount of €300 million
with a coupon of 3.5% per annum. The proceeds of
the notes were used to repay the €197 million notes
due in January 2017 and to fund the investment
expenditures of the Group.
On June 7th 2016, Standard & Poor’s reconfirmed
TITAN’s credit rating as “BB” maintaining the positive
outlook and emphasizing on the strong liquidity of
the group.
Based on the strong improvement of Group
profitability, including the extraordinary tax results in
the US, in conjunction with the positive prospects for
2017, the Board of Directors is proposing to the
Annual General Assembly of Shareholders,
scheduled to take place on 12.5.2017, a dividend
distribution of €0.10 per share and, in addition, a
return of capital of €1.00 per share. Pursuant to article
16 paragraph 8 of L. 2190/1920, the final amounts to
be distributed per share will be increased by the
amount, corresponding to the treasury shares held
by the Company.
The common stock price of the Company closed at
€22.30 a share on 31 December 2016, increasing by
26.6% since 31 December 2015. During the same
period, the Athens Stock Exchange (ASE) General
Index posted a 1.9% increase.
Market overviews
Once again in 2016, the US market was the main
source of growth for the Group. The US economy’s
positive growth rates, low unemployment and the
improvement in consumer confidence and
economic sentiment, all drove demand growth
leading to higher capacity utilization rates at our
cement plants and vertically integrated activities.
The increase in sales, in conjunction with the €200m
capital expenditure program undertaken by the
Group over the last three years, has led to a
significant improvement in operating results.
Total turnover in the US for 2016 increased by 16.9%
and stood at €794 million, while EBITDA increased by
44.0% to €145 million. In 2016, the US represented 53%
of Group sales and 52% of operating profitability.
It is noted that in the 3rd Quarter of 2016, US recorded
a deferred income tax credit of approximately €90
million associated with the recognition of a deferred
tax asset for previously unrecognized net operating
losses carry-forward generated in periods prior to
2016.
In Greece the construction sector remained
stagnant close to fifty year lows, with demand
stemming mainly from public works. Cement
consumption was roughly at par with 2015, a year
during which building activity had almost come to a
standstill following the imposition of capital controls
in the country. At this juncture, the Greek market
accounts for approximately 6% of total Group
cement volumes. In order to even partly
compensate for the weak domestic demand, the
Group continued to export the largest share of the
Greek plants’ production, benefiting from low freight
rates and the strong US$, and despite increasing
international competition.
Total turnover for Group region Greece and Western
Europe in 2016 was €261 million and was 2.8% lower
than 2015. EBITDA reached €36 million versus €45
million in 2015, an 18.9% decline.
In the countries of Southeastern Europe, construction
activity exhibited regional variations, with demand
growing in the central Balkans countries but
declining in the east and west. Total sales volumes
increased but prices were, on average, lower. The
region has been a stable contributor to Titan’s
profitability over the last years, although cement
demand is considerably below the Group’s plants
capacity.
1 Integrated Annual Report 2016
Annual Report of the Board of Directors for the year 01.01.2016-31.12.2016
07
Group turnover in Southeastern Europe in 2016
posted a decline of 2.0% and reached €204 million
while EBITDA increased slightly by 0.8% to €56 million,
leading to an improvement in EBITDA margin from
26.8% in 2015 to 27.5% in 2016.
In Egypt, cement demand grew by approximately
5% in 2016 and our plants’ production output
recovered to high levels. Having completed the
investments which allow for the local grinding and
usage of solid fuels (on the investment in the third kiln
to that effect was completed in November 2016),
ensured both our energy sufficiency for full capacity
operation, as well as a significant reduction in
production costs. Operating results recorded a
significant improvement for four consecutive
quarters. The devaluation of the Egyptian pound, by
more than 50% in 2016, had a negative impact on
results, generating, among other effects, an
increased volatility in market prices.
In total, results in Egypt in 2016 improved, with
turnover increasing by 28.3% in local currency terms,
and by 3.5% in Euro-terms, reaching €249 million.
EBITDA grew more than twofold, reaching €41 million
in 2016 compared to €15 million in the previous year.
In Turkey, Adocim in which TITAN Group holds a 50%
share, reaped the benefits of strong demand for
both public and private works.
Net profit of the Turkish subsidiary attributable to the
Group, stood at €3.6 million in 2016, versus €4.0
million in 2015, negatively impacted by a 14%
decline in the value of the Turkish pound.
Prospects for 2017
Prospects for the Group in 2017 appear positive,
despite the considerable challenges and
uncertainties around the globe.
The recovery of the construction industry in the US
should continue, owing to a favorable mid-term
outlook. The Portland Cement Association (PCA)
expects cement demand to grow by 3.6% in the US
in 2017, and at even higher rates in the East coast,
where the Group is active, foreseeing an increase in
demand across all three main market segments, i.e.
residential construction, commercial real estate and
public infrastructure. The growth in demand, in
conjunction with the benefits accrued from the
extensive investments undertaken in the US, help
strengthen the Group’s position in the market, and
allow for an optimistic assessment of performance.
In Greece, demand is expected to remain at similar
or slightly lower levels compared to 2016. New
infrastructure projects do not seem sufficient to
sustain demand in 2017, following the completion of
the major highway projects. As regards private
residential activity, which traditionally has been the
main driver of demand, expectations are very low.
As a result, cement production in Greece, should
continue to be channeled, by and large, towards
export destinations, albeit in the context of a
deteriorating supply/demand balance.
Construction activity in the countries of Southeastern
Europe where the Group is present is expected to
remain at levels similar to those of 2016. The broader
region continues to be affected by political instability
and economic weakness. Although construction
activity has grown in some countries in the region, it
generally lacks momentum.
In Egypt, the adoption of an extensive adjustment
and structural reforms program, in conjuncture with
the devaluation of the Egyptian Lira by over 50%
create short term difficulties and volatility. At the
same time however, the program lays the
foundations for sustainable longer term growth.
Despite uncertainties and short term pressures,
demand for building materials will likely remain
resilient, owing to the requirements of an ever
increasing population, urbanization trends, as well as
the realization of large scale public works. Having
completed the investments for the utilization of solid
fuels at its plants, the Group has ensured fuel
sufficiency and improved its cost structure and plant
performance. Aiming to reduce costs even further
and also curtail its environmental footprint, the Group
is also moving ahead with investments for the use of
alternative fuels
In Turkey, following several years of continued
economic growth and the attendant increase in
construction activity, it is expected that the
challenges the country is facing, in combination with
the existing surplus of installed capacity, will
negatively impact the cement sector.
In Brazil the political and economic crisis is still running
its course. Following a decrease of over 10% in 2016
cement demand is expected to begin to stabilize in
2017.
Investments and disposals
Group capital expenditure for 2016 stood at €151
million compared to €173 million in 2015, focused
mostly on the expansion of activities in the US and
investments towards attaining energy self-sufficiency
in Egypt.
The Group is completing an ambitious investment
program which reached just over €320 million over
the two year period of 2015-2016, aimed at
improving cost-competitiveness and capturing
growth opportunities.
Consistent with its strategy for geographic
diversification, the Group expanded its activities to
South America in the third quarter of 2016, investing
in Cimento Apodi in Brazil, joining forces with
established local partners. Cimento Apodi owns a
modern integrated cement plant in Quixeré
operating since 2015 and a grinding cement plant in
Pecém port, close to the city of Fortaleza, operating
since 2011. The combined production capacity
1 Integrated Annual Report 2016
Annual Report of the Board of Directors for the year 01.01.2016-31.12.2016
08
exceeds 2 million tons of cement per year. Through
this €99 million investment, Titan Group enters a
market which, although currently undergoing a
deep crisis, has attractive medium term prospects.
The participation in Apodi is accounted for as an
equity investment. The effect on 2016 results was
immaterial for the Group.
Parent company financial results
In 2016, turnover at Titan Cement S.A. declined by
3.9% to €262 million while EBITDA stood at €30 million
versus €44 million in 2015. Net Profit after Tax (NPAT)
for 2016 reached €17 million versus €60 million in 2015
and includes €29 million dividend received from
subsidiaries abroad; the corresponding amount in
2015 was €55 million.
Treasury shares
The total number of treasury shares held by the
Company on 31st December 2016 was 3,957,191 of
which 3,871,677 were common shares and 85,514
were preferred shares. The corresponding nominal
value was €15,828,764, representing 4.68% of the
share capital of the Company. Voting rights held by
the Company represented 5.02% of total voting
rights.
Purchase of own shares
In implementation of the decision dated 17th June
2016 of the Annual General Meeting of Shareholders
and resolution dated 17th June 2016 of the Board of
Directors, the Company purchased in 2016 1,219,658
own common shares at a total purchase price of
€24,264,346 and 79,595 own preference shares at a
total purchase price of €928,266. The corresponding
nominal value of the total own shares purchased in
2016 was €5,197,012 representing 1.54% of the share
capital of the company.
Sale of treasury stock in the framework of Stock
Option Plans
In 2016, in the existing framework of approved Stock
Option Plans, the Company carried out off –
exchange sales of common treasury shares to TITAN
Group executives who exercised their stock options.
The corresponding common shares sold were
108,574 representing 0.13% of the share capital of the
Company and of a total nominal value and sales
price of €434,296.
Post balance sheet events
On 19 January 2017, Group subsidiary Titan Global
Finance PLC repaid at the maturity €88 million of the
outstanding 8.75% guaranteed notes.
Major transactions between company and related
parties
Transactions between the Company and related
entities, as these are defined according to IAS 24
were undertaken in line with ordinary market terms.
The amounts of sales and purchases undertaken in
2016, and the balances of payables and receivables
as at 31 December 2016 for the Group and the
Company, arising from transactions between related
parties are presented in Note 32 of the financial
statements.
The revenue presented relates to sales of goods to
subsidiaries, while purchases relate to purchases of
goods and services by the company from
subsidiaries.
Company receivables primarily relate to receivables
from cement sales to subsidiaries.
Company liabilities relate to four loans of total
nominal amount of €356 million (out of which the €42
million matured in January 2017) concluded with the
UK based subsidiary TITAN Global Finance Plc.
The remuneration of senior executives and members
of the Group’s Board of Directors for 2016 was at €8.2
million versus €6.2 million last year.
Going concern disclosure
The Board of Directors having taken into account:
• the Company’s financial position;
• the risks facing the Company that could impact
on its business model and capital adequacy;
and
• the fact that no material uncertainties are
identified to the Company’s ability to continue as
a going concern in the foreseeable future and in
any event over a period of at least twelve
months from the date of approval of the
Financial Statements
and states that it considers it appropriate for the
Company to continue to adopt the going concern
basis in preparing its Financial Statements and that
no material uncertainties are identified to the
Company’s ability to continue to adopt the going
concern basis in preparing its Financial Statements in
the foreseeable future and in any event over a
period of at least twelve months from the date of
approval of the Financial Statements.
Viability statement
The Board of Directors has assessed the prospects of
the Company having regard on its current position
and the major risks facing the Company over a
period of five years, which was considered as
appropriate to draw conclusions. Therefore, the
Board has a reasonable expectation that the
Company will be able to continue in operation and
1 Integrated Annual Report 2016
Annual Report of the Board of Directors for the year 01.01.2016-31.12.2016
09
meet its liabilities as they fall due over the period of
their assessment.
Annual report of the board of directors and financial
accounts for the fiscal year 2016
The Board of Directors considers that the Annual
Report and the Financial Accounts for the fiscal year
2016, taken as a whole, are fair, balanced and
understandable and provide the information
necessary for shareholders to assess the Company’s
performance, business model and strategy.
Non-financial performance review
Material issues
Materiality assessment is used as a basis for aligning
TITAN’s business priorities with stakeholders’ needs,
thereby ensuring the long-term sustainability of the
Group’s strategy.
Stakeholder engagement is an important element of
TITAN’s corporate social responsibility policy which
builds trust, improves understanding of the impacts of
operations and addresses stakeholder concerns,
while at the same time providing input to the
materiality assessment process. The method of
stakeholder communication and interaction varies
from operation to operation depending on local
practices.
In 2016, all regional operations except for Antea
cement plant (TITAN Albania) and Adocim cement
plant (ΤΙΤΑΝ Turkey) reviewed – and updated where
needed – their materiality assessments also taking
into consideration the outcomes of employee
opinion surveys, (completed in 2015), stakeholder
consultations (through sustainability initiatives like
Cement Sustainability Initiative (CSI), investors
roadshows, and meetings with local stakeholders.
The results have been collected by the CSR
Department to serve as a basis for the next review of
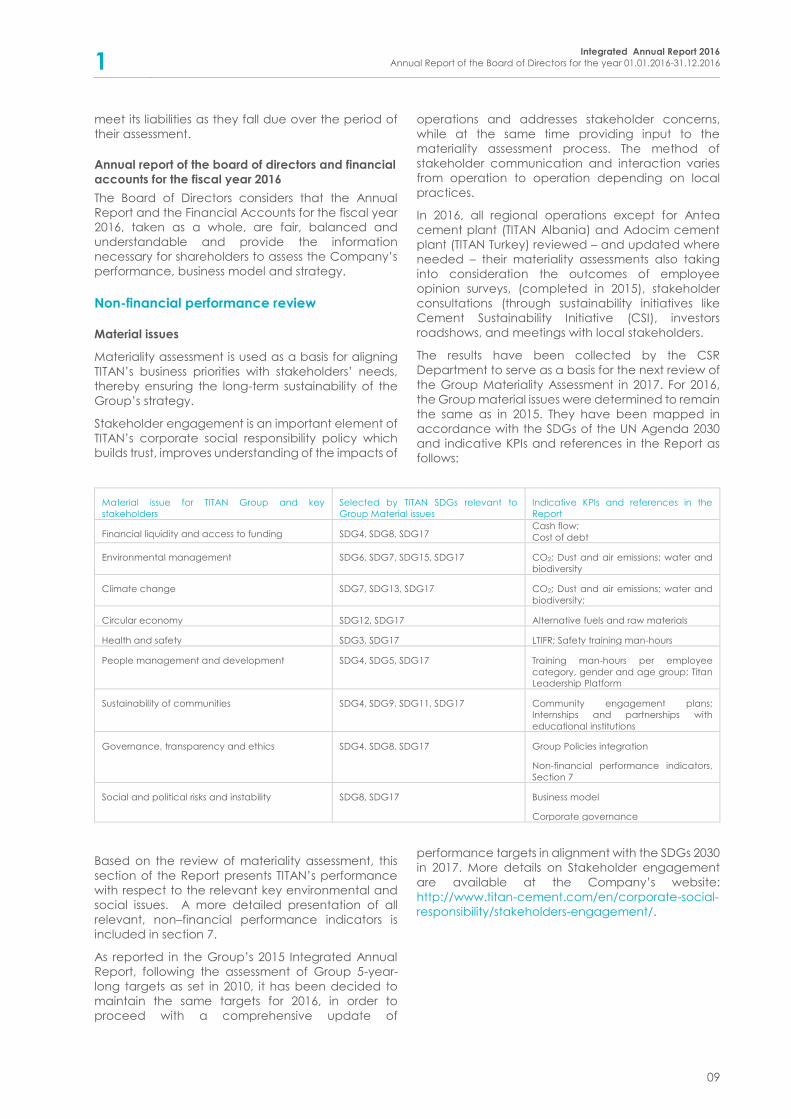
the Group Materiality Assessment in 2017. For 2016,
the Group material issues were determined to remain
the same as in 2015. They have been mapped in
accordance with the SDGs of the UN Agenda 2030
and indicative KPIs and references in the Report as
follows:
Material issue for TITAN Group and key
stakeholders
Selected by TITAN SDGs relevant to
Group Material issues
Indicative KPIs and references in the
Report
Financial liquidity and access to funding SDG4, SDG8, SDG17 Cash flow;
Cost of debt
Environmental management SDG6, SDG7, SDG15, SDG17 CO2; Dust and air emissions; water and
biodiversity
Climate change SDG7, SDG13, SDG17 CO2; Dust and air emissions; water and
biodiversity;
Circular economy SDG12, SDG17 Alternative fuels and raw materials
Health and safety SDG3, SDG17 LTIFR; Safety training man-hours
People management and development SDG4, SDG5, SDG17 Training man-hours per employee
category, gender and age group; Titan
Leadership Platform
Sustainability of communities SDG4, SDG9, SDG11, SDG17 Community engagement plans;
Internships and partnerships with
educational institutions
Governance, transparency and ethics SDG4, SDG8, SDG17 Group Policies integration
Non-financial performance indicators,
Section 7
Social and political risks and instability SDG8, SDG17 Business model
Corporate governance
Based on the review of materiality assessment, this
section of the Report presents TITAN’s performance
with respect to the relevant key environmental and
social issues. A more detailed presentation of all
relevant, non–financial performance indicators is
included in section 7.
As reported in the Group’s 2015 Integrated Annual
Report, following the assessment of Group 5-year-
long targets as set in 2010, it has been decided to
maintain the same targets for 2016, in order to
proceed with a comprehensive update of
performance targets in alignment with the SDGs 2030
in 2017. More details on Stakeholder engagement
are available at the Company’s website:
http://www.titan-cement.com/en/corporate-social-
responsibility/stakeholders-engagement/.
1 Integrated Annual Report 2016
Annual Report of the Board of Directors for the year 01.01.2016-31.12.2016
10
Environmental management
Environmental management systems
All Group cement plants have an environmental
management system, ISO14001 or similar. In 2016, a
revision of environmental management systems was
launched so as to fulfill new certification standards
defined by ISO14000/2015. All three TITAN cement
plants in Greece and one cement plant in Bulgaria
have already integrated those requirements and
have been certified accordingly.
Air emissions1
Aligning with WBCSD/CSI recommendations, main
pollutants like dust, NOx and SOx are covered with
continuous monitoring devices, while all minor
pollutants are measured by spot measurements.
TITAN Group invested heavily in new technologies to
reduce its air emission footprint. In 2016, Group
specific dust emissions decreased by about 33.0%,
compared to previous year, to 23.9g/tClinker (2015:
35.7g/tClinker)
Both NOx and SOx specific emissions remained at the
same level as 2015, at 1,702.9g/tClinker (2015:
1,705.8g/tClinker) and 205.6g/tClinker (2015:
206.0g/tClinker) respectively.2
Quarry rehabilitation and biodiversity
Quarry rehabilitation and biodiversity management
are a key focus area for TITAN, in the effort to mitigate
the adverse impacts from the extraction process and
to have a positive effect on biodiversity where
possible.
In 2016, new rehabilitation plans were developed for
the quarries of Beni Suef cement plant in Egypt,
increasing the percentage of the Group’s quarry
sites, where Quarry Rehabilitation Plans are in place
and implemented, to 87% (2015: 82%).
TITAN focuses also on assessing biodiversity at its
quarry sites, aiming at developing specific
management plans for the preservation of
biodiversity. Eight quarries (or 16%) of the Group sites
have been recognized as areas of high biodiversity
value and in six of these sites (or 75% of them) a
Biodiversity Management Plan (BMP), in line with the
WBCSD/CSI Biodiversity Management Plan (BMP)
Guidance, has been developed and is being
implemented. BMPs for the remaining two quarry
sites will start to be developed in 2017.
As of 31 December 2016, 93% of the wholly-owned
active quarries have an environmental
management system, ISO14001 or similar.
1 For CO2 emissions see “Climate change”
Water management
TITAN implements water management systems on its
sites to monitor and optimize the water use and
report water data in a consistent way, according to
the WBCSD/CSI. In 2016, specific water consumption
at the Group cement and grinding plants and their
attached quarries showed a further 11% decrease
compared to the previous year, reaching
255.1lt/tCement (2015: 287.1lt/tCement).
At Group level, 30.5 million m3 (2015: 31.8 million m3)
of water were withdrawn in total, out of which 9.1
million m3 (2015: 9.1 million m3) were consumed and
21.4 million m3 (2015: 22.7 million m3) were
discharged.
For the cement plants in particular, in 2016 the total
water withdrawal was 7.9 million m3 (2015: 8.2 million
m3), consumption was 3.8 million m3 (2015: 3.9 million
m3), and discharge was 4.1 million m3 (2015: 4.3
million m3).
Water recycling facilities are operating in 92% of the
cement plants. Approximately 30% of the Group’s
aggregates sites use water in their production
process and 80% of these sites operate water
recycling systems. Furthermore, 25.0 million m3 (2015:
23.6 million m3) of water were recycled at Group
level in 2016, which is equivalent to 82% of the total
water withdrawn. The total volume of recycled water
in the cement plants’ operations reached 18.1 million
m3 (2015: 17.4 million m3), which corresponds to
about 230%, more than twice the amount of water
withdrawn.
A new Waste Water Treatment Plant (WWTP) was
constructed at Sharr cement plant in Kosovo and has
been successfully in operation since March 2016. The
aim of this project is to improve the quality of the
water effluents before their discharge in the nearby
river. In addition to the Sharr cement plant needs, the
WWTP serves also part of the local community, who
have their sewage water treated by the plant.
Climate change
Climate change is among the most significant global
challenges today. As early as 2006, TITAN Group
adopted a climate change mitigation strategy to
address issues related to CO2 emissions and their
impact on sustainable development. Specific areas
relating to the CO2 mitigation strategy include
energy efficiency, use of alternative fuels and clinker
content in cement.
TITAN augmented its efforts and harmonized its
actions across all operations, in order to increase the
use of alternative fuels, preferably biomass, and
reduce the thermal energy consumption of the
facilities. In 2016, the thermal energy consumption of
the Group marginally improved, with a 1.0%
2 Further emission data provided in Section 7
1 Integrated Annual Report 2016
Annual Report of the Board of Directors for the year 01.01.2016-31.12.2016
11
decrease of the average specific consumption to
848.0kcal/kgClinker (2015: 856.0kcal/kgClinker). The use
of alternative fuels increased to about 8.6%Thermal basis
(2015: 6.8%Thermal basis) including the biomass use that
increased to about 2.1%Thermal basis (2015: 1.6%Thermal
basis). New business activities, in the form of subsidiary
companies, GAEA Bulgaria and Egypt, were initiated
with the objective of sourcing and producing
suitable alternative fuels for TITAN’s plants.
In 2016, in spite of the significant increase of the
overall alternative fuels use and the marginal
decrease in the specific thermal energy
COconsumption, specific 2 emissions increased
marginally by about 1.7% to 718.0kgCO2/tProduct
(2015: 706.1kgCO2/tProduct), mainly due to the forced
change of fuel mix in Egypt, as well as the reduction
in the sales of processed fly-ash, a cement substitute
material produced by US-based Separation
Technologies (ST) subsidiary.
Circular economy
Using alternative raw materials (2016: 5.1% of the
total raw materials for the production of clinker and
ofconsumptionreduce thecement) helps to
extracted (natural) raw materials as well as the
amounts of by-products that have to be landfilled. In
Greece and USA, TITAN implemented programs to
collect ready-mix concrete wastes and use them as
alternative raw materials for clinker and block
production, as aggregates for pavements, and in
other uses.
Similarly, using alternative fuels (2016: 163,357 t) helps
to conserve non-renewable fossil fuels, allows for
the landfilling ofminimizesenergy recovery and
waste while reducing the net amount of CO2
emissions. Dried sewage sludge, refinery sludge, tires,
RDF, agricultural wastes are alternative fuels used in
different Group cement plants.
US-based Separation Technology (ST) subsidiary
provides solutions for the management of fly ash,
thus minimizing the need, cost and risk associated
with landfilling and producing products that can be
used either as alternative raw materials or for energy
recovery.
In 2016, 80.8% of the waste produced by the Group
as part of everyday activities was collected, stored
and disposed of through authorized contractors for
reuse, recycling or recovering. In addition, TITAN
America’s Pennsuco Complex was certified by Zero
Waste Council as a Gold Level Zero Waste Facility,
becoming the only facility of its kind in USA to
demonstrate a greater than 90% diversion of wastes
from landfill use through reduction, reuse, recycling
or composting of discarded material.
sustainableCompany’stheMore details on
development can be found on its website:
http://www.titan-cement.com/en/corporate-social-
responsibility/sustainable-development/
Health and safety
TITAN constantly strives to raise the health and safety performance of direct employees and contractors and to urge suppliers and third parties to adopt similar practices.
The management of TITAN, from top management
to field level, is actively engaged in the application of the Group Health and Safety Policy. A process of assessing the current situation, proactively planning, setting targets and monitoring progress at all levels has led to significant improvements in the last decade. TITAN aims to join the top quartile of WBCSD/CSI members in terms of Lost Time Injury Frequency Rate.
In 2016 there were in total 29 Lost Time Injuries (LTIs)
(2015: 34 LTIs), a 14.7% decrease from 2015. The Lost
Time Injuries Frequency Rate (LTIFR) for own personnel decreased to 1.92 LTIs per million hours
(2015: 2.00 LTIs per million hours), a 4% improvement over 2015. LTIFR for contractors further improved to
0.73 LTIs per million hours (2015: 1.10 LTIs per million hours), a 33.6% decrease relative to 2015.
The Group regrets that, despite its focus on safety, there has been one third party fatality, in a road accident involving a mixer-truck driven by a contractor in Greece.
Committed to the continuous improvement of the health and safety performance in all its activities, TITAN pursued a variety of Group wide initiatives in
2016.
The decision to adopt in all business units a Group-
wide health surveillance system for dust, respirable crystalline silica and noise is an important landmark. Efforts, until recently made independently by individual business units, will be streamlined in 2017 under a new Group guideline.
Spurred by a number of incidents related to the need for isolation of energy sources in previous years, TITAN ran a Group-wide Lock-out Tag-out (LOTO)
campaign aiming at raising awareness, while at the same time producing practical, site-specific work instructions. The campaign helped to reduce the number of LOTO related LTIs from 9 in 2015 to 2 in 2016.
Safety training was enhanced by the addition of
“Training for the prevention of serious accidents”, a series of narrative sessions dedicated to the analysis
of the series of actions and decisions, which contributed to the occurrence of serious incidents or serious near misses at various TITAN locations over the years. The program, which is addressed at all plant
employees, commenced in 2016 and is expected to extend into 2018.
“Equipment for high level safety”, a compendium of
safety equipment covering the entire plant operation, has been completed as planned and distributed to all BUs for application.
1 Integrated Annual Report 2016
Annual Report of the Board of Directors for the year 01.01.2016-31.12.2016
12
In order to guide business units to better prepare
themselves before executing any task, existing
procedures regarding safety were complemented
with a new guideline on written Safe Work Plans.
Application of the guideline for selected tasks will
commence in 2017.
TITAN constantly strives to mine as much information
as possible from LTIs and near misses. To assist the
business units with this task, the Group produced and
distributed a step-by-step guide to root cause
analysis and will proceed with training and
application in 2017.
Audits by local, regional and Group safety teams
continued in 2016. Special emphasis was placed on
driving safety and on civil structures maintenance
programs.
In 2016, 1,304 (2015: 1,793) near misses were reported
by employees and contractors.
Training on health and safety in 2016 averaged 12.3
hours (2015: 8.6) per employee.
TITAN’s efforts to promote health and safety in society
at large continued in 2016, with activities addressed
especially at students. TITAN cement plants in
Greece hosted further safety training sessions for
engineering students, continuing the well-
established collaboration with the “Board of
European Students of Technology – BEST”. The
“Safety at Home Program”, directed towards
students up to junior high school level, continued in
2016, reaching a total of more than 50,000 children.
All trainers were TITAN volunteers.
More details on the Company’s policies on
Occupational Health and Safety are available on its
website: http://www.titan-
cement.com/en/corporate-social-
responsibility/care-for-our-people/occupational-
health-and-safety/
People management and development
TITAN recognizes the importance of being a
responsible employer and building long-term
relationships with employees founded on mutual trust,
reliability and shared values. For this reason, TITAN has
responded to the key areas identified by the 2015
employee engagement survey, namely leadership
and performance management.
To address these two areas, the new leadership
platform “Leading the TITAN Way”, announced in
2015, was launched in 2016. The platform describes
the fundamental behaviors that define good
leadership within TITAN and helps its people develop
their skills accordingly. The rollout and embedding in
the everyday operations was a main corporate
initiative throughout 2016.
A new Performance Development Process was also
designed, incorporating the principles of “Leading
the TITAN Way”. All managers were trained in the
implementation of the process.
Creating opportunities for the long-term
employment of competent and talented people is
good for TITAN as a business, but also contributes to
the sustainable development of local communities.
Within this context, initiatives benefiting young
people, established for many years in TITAN, were
further reinforced to strengthen collaborative
initiatives with educational institutions and
academia.
The conditions of employment provided by TITAN,
the level of engagement with its employees and the
continuous effort to improve their skills and
capacities are the elements that differentiate TITAN
in its local markets. In 2016, the overall turnover rate
was 14% (2015: 11%) mainly due to reorganization
and relocation of local services.
TITAN Group, as an employer, aims to promote life-
long learning among its people and enhance the
professional skills and competencies they need to
meet local and global challenges. For this reason,
training hours have increased in TITAN Group by 43%,
resulting to an overall number of 158,210 training
hours (compared to 110.776 in 2015). Beyond a great
emphasis on health and safety and on technical skills,
training programs that improve management
capabilities reached 15% of the total training hours in
2016.
TITAN’s commitment to international standards for
diversity and equal opportunities triggered the
update of relevant practices regarding recruitment
and people development. Particular focus was
given to women empowerment in specific markets,
where gender equality is not safeguarded by local
legislation, in order to provide them with skills to
enhance their employability and support self-
employment.
Labor rights are a material issue for all employees,
regulators and communities. TITAN Group policies
aim to ensure the freedom of association of
employees. The Group’s induction training program
raises awareness of this issue. Unions established by
employees participate in bilateral meetings with the
management on a yearly basis, as well as
stakeholder dialogue that addresses important issues
within the framework of sustainable development. In
cases of operations such as Adocim in Turkey, where
there is no local union, TITAN ensures that the national
legislation and collective bargaining agreements
are implemented.
Union representatives have the right to meet with line
management to discuss their concerns, suggest
improvements, and negotiate agreements on
various issues. Their suggestions on health and safety
conditions carry particular weight.
1 Integrated Annual Report 2016
Annual Report of the Board of Directors for the year 01.01.2016-31.12.2016
13
Sustainability of communities
Understanding global issues but taking action at
local level in each country of operation is decisive in
the implementation of TITAN's business model. TITAN
shares know-how, experience and other available
resources with local stakeholders in order to
contribute to the long-term sustainability and well-
being of neighboring communities.
The assessment of material issues at local level
underlined the importance of quality education and
new skills requested for employment and economic
growth. This is a common area of interest among
stakeholders due to the high rates of unemployment
in some countries, such as Greece, Kosovo and
Egypt, while the gap of skills remains an issue in all
markets, including the USA. To address this issue,
TITAN engaged with the European Pact for Youth, a
collaborative effort engaging businesses, social
partners, education and training providers, youth
organizations, teachers, trainers and academic
institutions to promote dialogue and partnerships in
support of youth employability and inclusion.
During 2016, a full mapping of all related activities
initiated by TITAN was developed identifying
examples of best practice that could be further
exploited. Indicative examples include the
collaboration with academic institutions and
students’ associations in Greece (such as the “BEST”),
in Bulgaria with the “Leaders Academy”, in Egypt
with the “Vocational Educational and Training
Center” of Alexandria and the federation of local
business associations. Further details on the Group’s
memberships and cooperation with stakeholders
and peers are available in the related table in
section 7 of this Report.
Moreover, through “REGENERATION”, the innovative
program designed by The Global Shapers
Community and supported by the World Economic
Forum, TITAN offered cumulatively 54 months of
training employment to promising graduates. TITAN
also contributed with experts in the implementation
of “RELOAD GREECE”, focused on mentoring and
training students of top UK universities, in order to
initiate the creation of new ventures with a social or
economic impact for Greece.
In total, from November 2015, when TITAN engaged
with the European Pact for Youth, until September
2016, when the first progress report was completed,
more than 400 partnership agreements (most with
Universities), were recorded focused on providing
opportunities for work-related experience,
internships, apprenticeships and training for 730
young people who benefitted from programs
implemented in nine countries during the reported
period.
3 Including the US, which was not included in the 2015 Integrated
Annual Report
Apart from the above Group-wide efforts, a number
of other community engagement programs,
addressing material issues with high priority at local
level were also pursued. One such case is the LAB
program in Kosovo (http://www.titan-
cement.com/en/corporate-social-responsibility/csr-
in-action/?entryID=601&pageNo=1), while another
was TITAN’s participation in the successful effort to
nominate Elefsis, the town where the Group’s first
plant was built in 1902, as the European Capital of
Culture 2021.
In 2016, the Group donated a total of €2,643,704
(2015: 2,674,3163) in cash and in kind for community
development programs, primarily in the areas of:
education, health and safety, the environment,
poverty and unemployment.
Governance, transparency and ethics
Good corporate governance is synonymous with
ethical business practices, transparency, open
communication, accountability and sustainable
development. TITAN is committed to follow
international standards in reporting annually
financial and non-financial performance to
stakeholders. Further information is provided in the
Corporate Governance Statement Section.
Policies update
Following a review of all Group policies in 2015, a
comprehensive Human Rights Policy was issued in
2016, expanding on the Group’s Code of Conduct.
Additional Group policies issued in 2016 are the
revised Anti-bribery and Corruption Policy, the
Competition Law Compliance Policy and Guidelines
and the Sanctions Policy.
The TITAN “Principles Day program”, launched in 2015
to emphasize TITAN’s Corporate Values and
Principles, continued to be rolled out in 2016 with
participants from Egypt and Turkey. As an on-going
program, it links TITAN’s Code of Conduct to its values
and Policies, while providing direction on ethical
dilemmas, increasing awareness and facilitating
dialogue on issues related to business ethics. So far,
the program has reached around 40% of the
management teams and will be continued across
the remaining operations in 2017. Further details on
the Group’s policies, are available in section 7, “Non-
financial performance review” according to the UN
Global Compact Criteria and related table of Group
policies.
Human Rights
Commitment to the rule of law and respect for
human rights are fundamental preconditions for
sound business and social progress. TITAN has been
1 Integrated Annual Report 2016
Annual Report of the Board of Directors for the year 01.01.2016-31.12.2016
14
committed to protecting and advancing human
rights as defined in the “Universal Declaration of
Human Rights (UNDHR)” and the “International Labor
Organization (ILO)” conventions.
The TITAN Group Code of Conduct and the related
policy safeguard TITAN’s commitments and aim to
promote respect for human rights within the areas of
TITAN’s influence and, in particular, respect for the
freedom of association, the value of diversity, equal
opportunities and elimination of all forms of
discrimination.
The responsibility to regularly examine in each
operation the potential risks for human rights abuse is
a responsibility of management at all levels and
employees are encouraged to report any potential
misconduct.
All significant suppliers - either global or local - are
expected to understand the significance of human
and labor rights and comply with respective laws
and international standards. In 2016, Sharr cement
plant (TITAN Kosovo) became the second TITAN
subsidiary after Antea cement plant (TITAN Albania)
to be certified according to SA8000. In addition, the
launch of the new Group Human Rights Policy
triggered a full review and update of contract
agreements in Egypt, an initiative which will be rolled
out to other countries by the end of 2017.
All TITAN Group operations have mechanisms for
employees to report grievances. In Greece and in
the USA, where 59% of TITAN employees are located,
anonymous grievance mechanisms are provided in
the form of email and telephone hotlines that enable
employees to raise concerns in confidence directly
to senior management. In 2016, ten cases were
reported through the Ethics Point in the US
operations, two of them related to misconduct and
inappropriate behavior. Nine of them were resolved
before the end of the year and one is still under
examination. Three cases, all related to human rights
and equal opportunities, were recorded and
resolved in Greece. During safety audits that are
conducted regularly by health and safety internal
and external experts, safety conditions and main
aspects of human rights concerns, such as working
hours, are examined.
Diversity and equal opportunities
Creating a culture of equal opportunities is not only
a prerequisite for meeting TITAN’s voluntary
commitment to the standards defined by the UNGC
principles and the UNDHR, but also an important part
of implementing its business strategy. Diversity and
multicultural development is also recognized as a
material issue for key stakeholders at both Group and
local level.
The Group Human Rights Policy and the Employee
Management Framework ensure equal opportunities
and fair treatment regardless of gender, age,
ethnicity, nationality, social origin and status, religion
or sexual orientation in the recruitment and people
development.
Women managers increased by 8% in 2016 resulting
in a total of 16% overall throughout the Group, with
the highest rates recorded in Serbia (37%), Bulgaria
(35%) and F.Y.R. of Macedonia (30%) and the lowest
in Egypt (just below 3%). Almost 13% of the new hires
were women and in total, the percentage of women
employed by TITAN remains stable at 11% of total
employment, as in 2015. Wages are aligned in line
with the rule of non-discrimination and equal
opportunities for all.
Further to the support of diversity, TITAN continued to
invest in employee development regardless of age.
In 2016, more than 30% of employees trained were
over 50 years old. TITAN’s employment policy focuses
on building long-term relationships with employees,
valuing the know-how, skills, competencies and
experience that come from an employee’s long
tenure with TITAN.
Value chain management
TITAN is committed to building strong and lasting
relationships with customers and suppliers, founded
on trust and mutual benefit. The Group actively seeks
out and favors business partners who have been also
committed to apply the UNGC principles within their
sphere of influence. Supporting local communities in
the areas where TITAN plants are located constitutes
an integral part of TITAN’s corporate philosophy. To
this end, we seek to maximize the collaboration with
local suppliers and contractors.
As part of its continuing efforts to enhance its
competitive position of each of its businesses, TITAN
Group has embarked on a Group Procurement
Transformation program. The objective is to address
both procurement spend, as well as overall business
effectiveness, through improved processes,
specifications, and quality and risk management.
More specifically, the target is to optimize the
number of suppliers and establish and maintain long
term value-added supplier relationships with an
emphasis on “total cost” reduction, transparency
and enhancement of the sustainability impact into
the supply chain.
The Group’s annual spend is about one billion euros.
Using a typical categorization, approximately 30-35%
of the Group’s spend base could be assigned to
“Global “categories (e.g. some solid fuels,
packaging material, shipping, etc.), 30-35% to
“Regional” (e.g. electrical power, certain spare parts,
etc.), and 30-35% to “Local” ones (e.g. road transport,
alternative fuels, contractors, etc.). In 2016,
approximately 4,500 people have been employed
by local suppliers to support TITAN operations
throughout the year.
1 Integrated Annual Report 2016
Annual Report of the Board of Directors for the year 01.01.2016-31.12.2016
15
Group Purchasing Manual provides a guide for the
selection of potential candidates and the
recommendation for the preferred bids. The
awarding process includes a list of specific criteria,
which take into consideration, beyond the standards
conditions of health and safety, also additional
aspects of environmental legislation, quality,
compliance with specifications and reliability, and
clauses regarding sustainability and localization.
Transparency
TITAN Group was among the first 500 signatories of
the United Nations Global Compact (UNGC) and is
also involved in local UNGC networks in Greece,
Egypt, F.Y.R. of Macedonia and Serbia. TITAN has
been a core member of the Cement Sustainability
Initiative (CSI) since its inception. CSI, a unique and
collaborative business-led initiative focused on
sustainable development, was launched by leading
cement companies under the auspices of the World
Business Council for Sustainable Development
(WBCSD). Since 2004, TITAN is also active through its
commitment to CSR Europe, the European business
network for corporate social responsibility and its
national partner organizations in Albania, Greece,
Kosovo and Serbia.
Independent verification of TITAN’s voluntary
commitments within the framework of UNGC and
WBCSD/CSI is a commitment underlining the priority
given to build trust with stakeholders, incorporate
their feedback and continue to improve
sustainability performance. From 2007 to 2015, TITAN
invited Det Norske Veritas (DNV) to undertake the
responsibility of independent assessment of its non-
financial performance. In 2016, the task was assigned
to ERM Certification and Verification Services Ltd.
(ERM CVS), another global, highly respected,
specialized in sustainability Assurance Company.
TITAN Cement Company S.A., the parent company
of TITAN Group, was included as a constituent of the
FTSE4Good Emerging Index, following an assessment
based on social, environmental and governance
criteria.
In relation to IFC’s investment in TITAN’s operations in
Egypt, in 2016 the Compliance Advisor Ombudsman
(CAO) conducted an investigation of IFC’s
compliance with its environmental and social
performance standards regarding TITAN Group’s
cement plant in Alexandria. The investigation is
ongoing. TITAN is supporting the CAO compliance
investigation process and continues working closely
with IFC in designing and implementing action plans
and initiatives that promote its environmental and
social performance in Egypt.
Risks and uncertainties
Principal risks in 2016
In 2016 the Board held in-depth discussions and
conducted a robust assessment of the principal
strategic, operational and financial risks that the
Group faces and which could significantly affect its
operations and financial statements.
These risks, outlined below, are closely monitored at
business unit and Group level and are managed
through policies and systems approved by the
Executive Committee.
Risk management is built into the daily activities of
TITAN and is an integral part of how TITAN works and
operates. As a result, principal risks can be identified
from multiple sources.
Accountability and clear division of roles and
responsibilities throughout the organization is part of
TITAN’s risk management. Business units and functions
are accountable for identifying and managing risks
in line with the Group management policies. In
parallel, though the ethics and compliance
programs implemented throughout TITAN’s
operations, the Group’s principles and values are
integrated in the day-to-day operations and the risk
management culture is reinforced across the Group.
The effectiveness of the systems and policies
implemented at business unit and Group level are
systematically reviewed, including in terms of
compliance with relevant standards of the Group.
Whenever weaknesses are identified, corrective
measures are taken.
During 2016, the Board regularly monitored Titan’s risk
management and internal control systems and
reviewed their effectiveness.
It should be noted, though, that risk management
and internal controls provide reasonable, but not
absolute assurance, as they are designed to reduce
the probability of occurrence of the relevant risks
and to mitigate their impact, but cannot preclude
such risks from materializing.
Financial risks
The Group, due to the nature of its business and its
geographical positioning, is exposed to financial
risks, which are managed by Group Finance and
Treasury.
The Group does not engage in speculative
transactions or transactions which are not related to
its commercial and business activities.
Liquidity risk
In order to manage liquidity risks and to ensure the
fulfilment of its financial obligations, the Group,
maintains sufficient cash and other liquid assets, as
well as extensive committed credit lines with several
1 Integrated Annual Report 2016
Annual Report of the Board of Directors for the year 01.01.2016-31.12.2016
16
international banks, which complement its operating
cash flows.
The Group’s financial position allows it to have
access to the international financial markets and
raise needed funds.
As previously mentioned, in June 2016, TITAN Global
Finance Plc issued a 5-year bond of a total nominal
amount of €300 million with a coupon of 3.50% per
annum, guaranteed by TITAN Cement Company S.A.
These notes are traded on the Global Exchange
Market (GEM), the exchange–regulated market of
the Irish Stock Exchange.
Group Treasury oversees Group funding as well as the
management of liquid assets.
Interest rate risk
The ratio of fixed to floating rates of the Group’s
borrowings is decided on the basis of market
conditions, Group strategy and financing
requirements. Occasionally, interest rate derivatives
may be used to minimize the relevant risk and
balance the mix of fixed and floating rates of the
Group’s borrowings.
On 31 December 2016, following the issuance of €300
million notes, by which part of existing fixed rate
notes of 8.75% coupon rate were refinanced prior to
their maturity, the Group’s ratio of fixed to floating
interest rates, taking into account outstanding cross
currency swaps, stood at 62%/38% (31 December
2015: 43%/57%). As of today, taking into account the
effectiveness of the interest rate swaps (from dollar
floating loan to dollar fixed loan) as well as the
repayment, at their maturity, of the remaining €88
million guaranteed notes of 8.75% coupon rate , the
ratio of fixed to floating interest rates stands at
75%/25%.
In 2016, the Group’s sensitivity to interest rates was
lower than it was in 2015, mainly due to lower floating
debt in absolute amount and the sharp devaluation
of the Egyptian Pound.
(For further details please refer to Note 33 on
Financial Statements)
Foreign currency risk
Group exposure in foreign currency derives from
existing or expected cash flows and from
acquisitions/investments denominated in currencies
other than the euro.
FX risks are managed using natural hedges, FX
derivatives/swaps and FX forwards. Borrowings
denominated in the same currency as the assets that
are being financed, create a natural hedge for
investments in foreign subsidiaries exposed to FX
conversion risk. Nonetheless, part of the financing of
Group activities in USA, Egypt and Albania, is in euro
and not in the local currencies. For this reason,
refinancing in local currencies along with FX hedging
transactions is regularly examined.
The Group’s net foreign currency transaction risk
mainly arises from USD, EGP, RSD, LEK, GBP, BRL and
TRY.
(For further details please refer to Note 33 on
Financial Statements)
Credit risk
The Group is not exposed to major credit risks relating
to customer receivables. Customer receivables
primarily derive from a large, widespread customer
base. The financial status of customers is constantly
monitored at business unit level and, where it is
deemed necessary, additional security is requested
to cover credit exposure. On 31 December 2016, all
outstanding doubtful receivables were adequately
covered by relevant provisions.
Credit risk relating to financial institutions’ inability to
meet their obligations towards the Group, is
mitigated by pre-set limits on the degree of exposure
to each individual financial institution. On 31
December 2016, the majority of Group liquidity was
held with investment grade financial institutions.
Similarly, the Group has entered into derivative
transactions only with investment grade financial
institutions.
Strategic and operational risks
Geopolitical risk
The Group operates and may seek new opportunities
in countries and regions that at times experience
political instability and consequent changes to the
operating and regulatory environment. These
changes may cause risks over the control, normal
operation and return on the Group’s investments.
The aforementioned risks are managed through ad-
hoc measures aiming at maximum protection of
TITAN’s regional investments.
Climate change and carbon pricing
Changes in legislation and public policies relating to
climate change could increase capital expenditure
and reduce future revenue and strategic growth
opportunities.
The Group closely monitors relevant regulatory
developments and takes proactive measures to
mitigate potential negative consequences.
At the same time TITAN continues its efforts to reduce
its carbon footprint.
(For more details on TITAN’s climate mitigation
strategy please refer to our website:
http://www.titan-
cement.com/UserFiles/File/csr/145211_TITAN_Group
_Climate_Mitigation_Strategy.pdf.
1 Integrated Annual Report 2016
Annual Report of the Board of Directors for the year 01.01.2016-31.12.2016
17
Risks arising from natural disasters
The Group operates in countries and regions such as
Greece, Egypt, Turkey and Florida in the USA which
are exposed to natural hazards (climate and
geological) such as typhoons, sandstorms,
earthquakes, etc.
Among the measures adopted by the Group to
mitigate the disastrous effects of these phenomena,
is the adoption of stricter designing standards for the
Group’s plants than the ones stipulated in the
relevant legislation. In addition, the Group has in
place emergency plans to safeguard its industrial
infrastructure and protect the lives of the Company’s
employees.
Health and safety
Ensuring health and safety and preventing accidents
at work is a priority for TITAN. The effort to improve
safety across the Group is continuous and includes
among other measures the recruitment of an
adequate number of safety engineers in all
production units. Particular emphasis is placed on
training and raising safety awareness and on strict
application of safety systems and processes.
TITAN’s Group Health and Safety Policy provides
assessment of all incidents, proactive planning,
setting of specific targets, safety training and
monitoring of progress. As a result, there was a further
reduction in lost time incidents in 2016.
Among other preventive measures, production and
construction sites are regularly audited by the
Group’s safety specialists. (For more details on Health
and Safety please refer to our website:
http://www.titan-cement.com/en/corporate-social-
responsibility/care-for-our-people/occupational-
health-and-safety/.
Environmental impact risk
With a view to continuous improvement of the
environmental impact of its operations, TITAN applies
in all its plants environmental management systems
to monitor and report their environmental impact.
The Group’s environmental management provides
targets for reduction of air emissions, protection of
biodiversity, water management and recycling and
quarry rehabilitation.
(For more details on the Group’s environmental
management please refer to our website:
http://www.titan-
cement.com/UserFiles/File/csr/144931_Group_Enviro
nmental_policy.pdf)
Production cost risk
Thermal energy, electricity and raw materials
constitute the most important elements of the
Group’s cost base. The fluctuation in the price of fossil
fuels poses a risk which affects production cost. In
order to reduce costs and also curtail its
environmental footprint, the Group is investing in low
energy-requirement equipment and in the use of
alternative fuels.
Ensuring access to the required quality and quantity
of raw materials is an additional priority, which is
taken into account when planning a new
investment. With regard to existing facilities, care is
taken to secure the adequacy of supply of raw
materials during their entire lifetime.
The Group is investing in the use of alternative raw
materials in order to gradually lessen its dependence
on natural raw materials. To this end, the Group has
set specific quantifiable targets for and monitors the
substitution of natural raw materials by alternative
raw materials, such as natural waste.
Corruption risk
According to the Corruption Perceptions Index
issued by Transparency International, the risk of
corruption in a number of countries where the Group
operates is increasing.
This index and the relevant reports per country are
monitored systematically by both the local
management and the Sustainability Committee at
Group level, so that appropriate policies are
designed and all necessary measures are taken to
effectively address the relevant risk.
The explicit provisions that have been included in the
Group Code of Conduct, the adoption and
implementation in 2016 of a specific Anti- Bribery and
Corruption Policy, the systematic training of
employees, the operation of hotlines for the
reporting of corruption cases and the internal
auditing of operations, are among the policies
implemented to effectively address these risks.
2 Integrated Annual Report 2016
Corporate Governance Statement
18
Corporate Governance Statement This Corporate Governance Statement constitutes a
special part of the Board of Directors' Annual Report
pursuant to the provisions of article 43bb of Law
2190/20 as it is now in force.
TITAN Cement Company S.A. (the Company), by
virtue of its Board of Directors’ resolution dated 16
December 2010, has voluntarily adopted the UK
Corporate Governance Code (the Code). A copy of
the Code (September 2014 version), can be found
on the website of the UK Financial Reporting Council
(https://www.frc.org.uk/Our-
Work/Publications/Corporate-Governance/UK-
Corporate-Governance-Code-2014.pdf). A Greek
translation of the Code can be found on the
Company’s website (http://www.titan-cement.com),
at the following address: http://www.titan-
cement.com/UserFiles/File/omilos/190118_Code-
company-government.pdf.
The Company has complied throughout 2016 with
the provisions of the Code except in the cases listed
below under the paragraph: “Deviations from the
Corporate Governance Code”; for any deviation
from a particular provision an explanation is included.
The Company, in addition to the provisions of the
Code, has complied throughout 2016 with all
relevant provisions of the Greek law (namely, Law
2190/1920 as it is now in force and Law 3016/2002).
Deviations from the Corporate Governance
Code
1. Board evaluation by external facilitator (Provision
B.6.2 of the Code)
The Board of Directors, to date, has not assigned the
evaluation of its performance to external
consultants, because it holds the view that the
existing procedure for the evaluation of the Board’s
performance by its members, including the self-
assessment of each member’s individual
performance, has proven to be both effective and
efficient. More specifically, the Board of Directors
believes that the anonymous self-assessment process
allows its members to answer openly and identify
without any reservations the weaknesses and
malfunctions that they see and to suggest the
adoption of measures for the improvement of the
performance of the Board of Directors and that of its
members. Despite the aforesaid, the Board of
Directors has decided, starting from the term in office
of the current Board, to appoint once every three
years an external consultant to conduct an
evaluation of its performance. Given that the Board
of Directors was elected in June 2016 and as a result
three new directors have very recently joined the
Board, the Board decided to use an external
facilitator either for the year 2017 or for the year 2018.
2. Performance-related remuneration schemes for
executive directors do not include provisions that
would enable the Company to recover bonuses
paid or withhold the payment of any bonus.
Furthermore, share option plans do not include a
requirement on executive directors to hold shares for
a period after leaving the Company (Provision D.1.1
of the Code).
The Company’s view is this is not necessary, as it pays
such sums following the assessment of each
executive director’s individual performance and
such sums cannot exceed the fixed upper limits set in
relation to their annual salary.
Moreover, the Company’s stock option plans
including the current one (Plan 2014) require
directors and senior officers of the Company to hold
a significant number of shares based on their
hierarchical level, for as long as they remain in the
Company; if they are in breach of this term, they
receive a smaller amount of option rights in the next
grant period.
The Plan 2014 does not include a requirement for
executive directors to hold shares for a period after
leaving the Company. This has not been deemed
relevant given that four out of seven executive
directors are core shareholders in the Company,
whilst the other executive directors have a long
service as senior officers in the Group. It should also
be noted that all relevant plans adopted by the
Company grant such rights sparingly and under
serious consideration and they include a long
maturity period and further strict requirements in
relation to their maturity and exercise.
Composition and modus operandi of the Board
and of other bodies and committees
Board of Directors
Resumes of the BOARD OF DIRECTORS
EFSTRATIOS - GEORGIOS ARAPOGLOU
CHAIRMAN
Non-executive Director since 17 June 2016
Independent, non-executive Director from 18.5.2010
until 17.6.2016 (2terms)
Member of the Nominations and Corporate
Governance Committee
Mr. Arapoglou has held a number of senior positions
in international investment banks in London (1977-
1991) and management positions in Greek banks
2 Integrated Annual Report 2016
Corporate Governance Statement
19
and subsidiaries of international banks in Greece
(1991-2000). He has served as Managing Director
and Global Head and Securities Industry of Citigroup
in London (1999-2004) and Chairman and Managing
Director of the National Bank of Greece (2004-2009).
He was elected to the position of Chairman of the
Hellenic Bank Association (2005-2009) and has
served as Managing Director of commercial banking
and executive member of the Board of Directors of
the investment group EFG – Hermes Holding SAE
(2010-2013).
He is Chairman and non-executive member of the
Board of Directors of Tsakos Energy Navigation (TEN)
LIMITED, a company listed on the New York Stock
Exchange, non-executive director of EFG Hermes
Holding SAE, listed on the stock exchanges of Cairo
and London, and non-executive director of Credit
Libanais SAL and of Bank Alfalah, listed on the Stock
Exchange of Karachi, representing the International
Finance Corporation (IFC) on the Bank’s Board.
He holds degrees in Mathematics, Naval
Architecture and Business Administration from Greek
and British universities. His age is 66 and his nationality
Greek.
NELLOS CANELLOPOULOS
VICE CHAIRMAN
Executive Director since 24 June 1992
Mr. Canellopoulos held the position of External
Relations Director of TITAN Group from 1996 until May
2016.
He has previously served in the Sales Division of TITAN
Group (1990-1996) and in Ionia S.A. (1989 and 1990).
Mr. Canellopoulos is Chairman of the Board of
Directors of the Paul and Alexandra Canellopoulos
Foundation and member of the Board of Directors of
the Hellenic Cement Industry Association. His age is
53 and his nationality Greek.
DIMITRI PAPALEXOPOULOS
CHIEF EXECUTIVE OFFICER
Executive Director since 24June 1992
Chief Executive Officer since 1996
Mr. Papalexopoulos started his career as a business
consultant of McKinsey & Company Inc. in USA and
Germany. Subsequently, he joined TITAN in 1989.
He is Vice-Chairman of the Board of Directors of the
Hellenic Federation of Enterprises (SEV) and of the
SEV Committee for Sustainable Development (SEV
VIAN) and member of the Board of Directors of the
Foundation for Economic and Industrial Research
(IOBE), the Hellenic Foundation for European and
Foreign Policy (ELIAMEP) and of the European Round
Table for Industrialists (ERT).
He studied Electrical Engineering (Dip. EL-Ing. ETH,
1985) at the Swiss Federal Institute of Technology
Zurich (FTH) and Business Administration (MBA 1987)
at Harvard University. His age is 55 and his nationality
Greek.
MICHAEL COLAKIDES
Executive Director- TITAN Group CFO
Executive Director since 12 January 2016
Mr. Colakides is TITAN Group CFO and Senior
Strategic Advisor since 2014.
He started his career at Citibank Greece as Head of
Corporate Finance and Local Corporate Banking
(1979 – 1993). In 1993 he was appointed executive
Vice Chairman at the National Bank of Greece and
Vice Chairman at ETEBA Bank S.A.
From 1994 to 2000, he served as CFO of TITAN Group
and was also responsible for a number of acquisitions
in Southeastern Europe and the US. He also served as
an executive director of the Board of the Company
(1998-2001).
From 2000 to 2007, he served as Vice Chairman and
Managing Director of Piraeus Bank S.A. overseeing
the domestic Wholesale and Retail Banking business
as well as the group’s International network and
activities. From 2007 to 2013 he was Deputy Chief
Executive Officer – Group Risk Executive of EFG
Eurobank Ergasias S.A.
He is a member of the Board of Directors of
EUROBANK CYPRUS Ltd.
He has a B.Sc. degree in Economics from the London
School of Economics and an MBA from the London
Business School. His age is 63 and his nationality
Cypriot.
DOROS CONSTANTINOU
Independent Non-Executive Director since 14 June
2013 (2nd term)
Senior Independent Director
Chairman of the Audit Committee
Mr. Constantinou is a non-executive director and
member of the Audit Committee of the Board of
Directors of Frigoglass S.A.I.C.
He was appointed Managing Director of Coca-Cola
Hellenic Group (2003-2011) and of Frigoglass S.A.I.C.
(2001-2003).
He started his career in Price-Waterhouse (1975-1985)
and he then joined the management team of
Hellenic Bottling Company (3E), where he was
appointed Finance Director of the Industrial Division
of the Group (1992-1995) and he later became the
Deputy Chief Financial Officer of the Group (1995-
1996) and Chief Financial Officer (1996-2000).
2 Integrated Annual Report 2016
Corporate Governance Statement
20
He studied economics in the University of Piraeus,
from which he graduated in 1974, specializing in
Business Administration. His age is 67 and his
nationality Cypriot.
HIRO ATHANASSIOU
Independent, Non-Executive Director since 17 June
2016 (1st term)
Chairman of the Remuneration Committee
Member of the Nominations and Corporate
Governance Committee
Mrs. Athanassiou is Chairman and Managing Director
of Unilever in Greece and Cyprus since 1 December
2013. She is the first woman to lead the company,
since its establishment, after a 28-year successful
career in Marketing, Sales and Exports, both in
Greece and abroad.
She is an independent non-executive director on the
Board of Directors of Piraeus Bank, director on the
Board of the Foundation for Economic and Industrial
Research (IOBE), director on the Board of the
Association of Greek Commercial Food Companies
(SEET), director on the Board of the Hellenic-Dutch
Association (HEDA), member of the Board of the
Hellenic Management Association (EEDE), and
member of the Hellenic Institute of Marketing (EIM),
the Women’s Organization of Managers and
Entrepreneurs (TOGME), the Leadership Sector
(THGE), and the Association of Chief Executive
Officers (EASE).
She holds a BA (Hons) in Marketing & Management
from Deree, The American College of Greece and
an MSc in International Relations and Personnel
Management from the London School of Economics
and Political Sciences. Her age is 57 and her
nationality Greek.
TAKIS-PANAGIOTIS CANELLOPOULOS
Executive Director since 10 May 2007
Mr. Canellopoulos was Investor Relations Director of
TITAN Group from 2001 until May 2016
From 1995 to 2001, he was a senior officer in the
Finance Department of TITAN Group. He had worked
previously as a financial analyst in AIG and the
Financing Division of EFG Eurobank.
He is member of the Board of Directors of
Canellopoulos Adamantiadis Insurance Co. (AIG
Hellas) and Grivalia Properties REIC and member of
the Union of Listed Companies (ENEISET).
He studied Economics (BA) at Brown University in USA
and Business Administration (MBA) at the New York
University / Stern School of Business in USA.
His age is 49 and his nationality Greek.
ALEXANDER MACRIDIS
Independent, Non-Executive Director since 17 June
2016 (1st term)
Member of the Remuneration Committee
Mr. Macridis is Chairman and managing Director of
Chryssafidis S.A., a construction materials distribution
company founded in 1882 and operating in the
Balkans and Africa.
He is a member of the Board of Aegean Airlines, IOBE,
The American College of Greece and Alba. He is
currently the Treasurer of the Federation of Greek
Industries (SEV) and serves on the Yale President's
Council on International Activities.
He holds a BA in Economics and Political Science
from Yale College, a JD from Yale Law School and
an MBA from Harvard Business School. His age is 55
and his nationality Greek.
DOMNA MIRASYESI-BERNITSA
Independent, Non-Executive Director since 14 June
2013 (2nd term)
Chairman of the Nominations and Corporate
Governance Committee
Mrs. Mirasyesi- Bernitsa is a qualified lawyer, member
of the Athens Bar Association. She is also a Partner at
Bernitsas Law Firm.
She has worked as a legal advisor at the Special
Legal Service of the Ministry for Foreign Affairs (1986-
1987) and at the Department of Political Science and
Public Administration of the University of Athens
(1985-1990). She is also a member of the Board of
Directors of St. Catherine’s British School.
She holds a bachelor’s degree from the Law School
of the UNIVERSITY OF ATHENS and has obtained a
master’s degree (LLM) in European Law from the
London School of Economics. Her age is 57 and her
nationality Greek.
IOANNA PAPADOPOULOU
Independent, Non-Executive Director since 17 June
2016 (1st term)
Member of the Audit Committee.
Mrs. Papadopoulou is Chairman and Managing
Director of E.J. Papadopoulos S.A., Biscuit & Food
Products Manufacturing Company, which was
founded in 1922. She also holds the position of
Chairman and Managing Director of Greek Food
Products S.A. and ΙΚΕ Akinita S.A.
She has studied Food Chemistry in England. Her age
is 65 and her nationality Greek.
2 Integrated Annual Report 2016
Corporate Governance Statement
21
ALEXANDRA PAPALEXOPOULOU – BENOPOULOU
Executive Director since 23 May 1995
Strategic Planning Director of TITAN Group since 1997
From 1992 to 1997 she worked as a senior officer in
the Group Exports Division. Previously, she had
worked for the OECD and the consultancy firm BOOZ,
Allen & Hamilton in Paris.
She has served as a member of the Board of Directors
of the National Bank of Greece (from 2010 until July
2015), of Frigoglass (from 2003 until February 2015)
and of Emporiki Bank (from 2007 until 2009).
Mrs. Papalexopoulou-Benopoulou is serving as
member of the Board of Directors in Coca-Cola HSC
AG, the Paul and Alexandra Canellopoulos
Foundation and ALBA Graduate Business School and
as trustee in The American College of Greece.
She has studied Economics at the Swarthmore
College, USA, and Business Administration (MBA) at
INSEAD, Fontainebleau, France. Her age is 51 and her
nationality Greek.
PLUTARCHOS SAKELLARIS
Independent, Non-Executive Director since 14 June
2013 (2nd term)
Member of the Audit Committee.
Mr. Sakellaris is a Professor of Economics and Finance
at the Athens University of Economics and Business.
He was Vice President of the European Investment
Bank (2008-2012). Prior to joining the EIB, he held the
position of the Chairman of the Council of Economic
Advisers at the Greek Ministry of Economy and
Finance and was representing Greece in the
Economic and Financial Committee of the European
Union and acted as Deputy to the Finance Minister
at the Eurogroup and ECOFIN Councils, as well as
Alternate Governor for Greece at the World Bank. He
has also been a member of the Board of Directors of
the National Bank of Greece and of the Greek Public
Debt Management Agency.
He has taught at the Department of Economics at
the University of Maryland, USA and other Universities
and he has worked as Economist at the Federal
Reserve Board and as Visiting Expert at the European
Central Bank (ECB).
He has graduated from Brandels University, in USA
(BA) in Economics and Computer Science. He also
holds a PhD in Economics from Yale University. His
age is 53 and his nationality Greek.
PETROS SABATACAKIS
Independent, Non-Executive Director since 2010 (3rd
term)
Member of the Remuneration Committee.
Mr. Sabatacakis is member of the Board of Directors
of National Bank of Greece since 2010. He was Chief
Risk Manager for Citigroup Inc. (1999-2004) and
member of the Management Committee and
Director of Citicorp and Citibank, N.A. From 1992 to
1997, he was in charge of the financial services
subsidiaries of the American International Group, its
treasury operations, as well as the market and credit
risk activities. He was a member of the executive
committee and partner of C.V. STARR. He has also
worked at Chemical Bank (now J.P. Morgan Chase).
He has served as Chairman of Plan International and
Childreach International (Non-profit Organization),
as trustee of the Athens College in Greece, and as
Chairman of the Gennadius Library.
He has earned three degrees from Columbia
University: a bachelor’s degree (BSc), a master’s
degree in Business Administration (MBA) and a PhD in
Economics. His age is 71 and his nationality Greek.
EFTHYMIOS VIDALIS
Executive Director since 15 June 2011
Group’s consultant on matters of Strategy and
Sustainable Development
From 2004 until 15.06.2011 he served as an
Independent Non-Executive director.
Mr. Vidalis has served as Managing Director (2001-
2011) and Chief Operating Officer (COO) (1998-2001)
of S&B INDUSTRIAL MINERALS S.A and was a member
of the company’s Board of Directors for 15 years. He
worked for Owens Corning in USA from 1981 until 1998
and from 1994 to 1998 he served as Chairman of the
global activities of Synthetic Materials (Composites)
and Insulation Materials consecutively.
He is a member of the Board of Directors of ALPHA
BANK and of Future Pipe Industries in Dubai.
He has served as Vice Chairman of the Hellenic
Federation of Enterprises (SEV) from 2010 until 2014,
as General Secretary of SEV from 2014 until June 2016
and as Chairman of SEV’s Committee for Sustainable
Development from 2008 until June 2016. From 2005 to
2009, he served as Chairman of the Greek Mining
Enterprises Association (SME).
He has studied Political Sciences (BA) and Business
Administration (MBA) at Harvard University. His age is
63 and his nationality is Greek.
BILL ZARKALIS
Executive Director since 14 June 2013
Head of TITAN Group’s US Region
Mr. Zarkalis has served as Chief Financial Officer (CFO)
of the TITAN Group from 2010 until May 2014 and as
Executive Director for Business Development and
Strategic Planning from 2008 until 2010.
2 Integrated Annual Report 2016
Corporate Governance Statement
22
For 18 years, he held a number of global business
leadership positions in USA and Switzerland with the
Dow Chemical Co. Among others, he served as Vice
President of Dow Automotive, Business Director for
Specialty Plastics & Elastomers, Business Director for
Synthetic Latex, etc.
He holds a bachelor’s degree in Chemical
Engineering from the National Technical University of
Athens (1985) and a master’s degree (MSc) from the
Pennsylvania State University in USA (1987). His age is
56 and his nationality Greek.
The Board of Directors’ role and competences
The Board of Directors is the Company's supreme
administrative body, which is responsible to
shareholders for the strategic direction and
performance of the Company. The Board of
Directors’ role and duty is to: determine the Group’s
long term objectives, strategy and risk appetite;
provide entrepreneurial leadership; set the
Company’s values and standards; ensure the
establishment and operation of effective internal
control and risk management systems; monitor and
resolve any conflicts of interest that may arise for
members of the Board of Directors and senior officers
vis-à-vis the interests of the Company; review
management performance; determine the
remuneration of Directors and senior executives ;
and ensure satisfactory dialogue with shareholders.
The Board of Directors is exclusively responsible for
taking decisions on important matters such as: the
approval of the Company's financial statements to
be submitted to the General Meeting; the approval
of the annual budget; increases in the Company’s
share capital where required by law or the
Company’s Articles of Association; the approval of
issuing corporate bonds, a power exercisable
concurrently with the power of the General Meeting
and subject to the provisions of Articles 8 and 9 of
Law 3156/2003; convening the General Meeting of
Shareholders; making recommendations on items of
the agenda at the General Meeting; preparing the
Annual Report and the other reports required by the
applicable legislation and the Code; appointing the
Company’s internal auditors and appointing the
Company's legal representatives and special
representatives and agents; and recommending to
the General Meeting the approval of stock options
schemes for executive directors and senior Group
employees.
Based on the Company’s Articles of Association, the
Board of Directors may delegate part of its powers to
the Executive Committee, whose scope of tasks and
responsibilities are stated herein below, as well as to
Company representatives, who are empowered to
represent the Company always acting jointly by two.
No individual has unfettered powers of decision or
representation of the Company.
The Company maintains directors’ and officers’
liability insurance cover for all Board directors and
Company officers. The cover also extends to
directors of subsidiary companies.
Composition of the Board of Directors
The current Company Board of Directors consists of
15 directors, all of whom were elected by the Annual
General Meeting of Shareholders dated 17 June
2016 for a three-year term expiring at the Annual
General Meeting of 2019.
The majority of the directors, namely eight out of 15
are non-executive directors and seven of them are
independent. Seven directors are executive
directors.
The duties of the Chairman of the Board and those of
the Managing Director are exercised by different
individuals, and the division of their responsibilities is
clearly established and expressly set out in the
Company’s Articles of Association and the
Company’s Internal Regulation.
Independent non-executive directors
The Independent non-executive directors were
elected as independent directors by the Annual
General Meeting dated 17 December 2016,
following relevant nomination by the Nomination
and Corporate Governance Committee and
subsequently by the Board.
The independent non-executive directors meet all
the independence requirements stipulated in Law
3016/2002 and in the UK Corporate Governance
Code. They also meet the additional independence
requirement which has been set by the Company,
according to which, independent non-executive
directors must not hold a larger than 0.1% stake in the
share capital of the Company.
In total, the independence criteria followed by the
Company are stated below. They can also be found
on the Company's website http://www.titan-
cement.comhttp://www.titan-cement.com at the
following address: http://www.titan-
cement.com/en/titan-group/corporate-
governance/board-of-directors
On the basis of the above, an independent non-
executive director of the Company:
1. Is independent in character and judgment and
free from circumstances which are likely to affect
their independence.
2. Does not hold directly or indirectly a larger than 0.1%
stake in the Company’s share capital and have no
dependence relationship with the Company or its
affiliates.
3. Is not and has not been Chairman or Chief
Executive Officer (CEO) or executive director or
2 Integrated Annual Report 2016
Corporate Governance Statement
23
officer or employee in the Company or the Group in
the last five years.
4. Does not have and had not in the last three years
any material business or employment relationship,
directly or indirectly, with the Company.
5. Does not have and had not received any
additional remuneration from the Company apart
from the director’s fee for participating in Company
board.
6. Does not have close family ties with any of the
Company’s advisers, directors or senior employees.
7. Is not executive director in a company, in which
executive directors of the Company serve as
independent non-executive directors and does not
have significant ties with other directors through
involvement in other companies or bodies.
8. Does not represent a significant shareholder.
9. Has not served on the board of the Company for
more than nine years from the date of first election.
The independent, non-executive directors of the
Board do not have executive or managerial duties,
however they contribute to the Board and its
Committees by: participating in the determination of
the Company’s strategy; monitoring the suitability
and effectiveness of the management, the internal
audit and the risk management systems; determining
the remuneration of the executive directors of the
Board; participating in the selection process of
suitable new candidates for the Board; and ensuring
the existence of a succession plan.
Independent non-executive directors meet, as
stated in the Code, once a year under the Senior
Independent Director, without the presence of the
Chairman and the executive directors, in order to
evaluate the performance of the Chairman. They
also hold meetings at least once annually under the
Chairman, without the presence of the executive
directors.
Such meetings with the non-executive directors were
actually held on 16 December 2016 and were led by
the Senior Independent Director and the Chairman.
Non-executive directors – Executive directors
As already mentioned, the majority of the Board of
Directors, namely eight members out of fifteen,
consists of non-executive directors.
Non-executive members of the Board of Directors
are: Mr. Efstratios – Georgios Arapoglou, Mrs. Hiro
Athanassiou, Mr. Doros Constantinou, Mr. Alexander
Macridis, Mrs. Domna Mirasyesi-Bernitsa, Mrs. Ioanna
Papadopoulou, Mr. Plutarchos Sakellaris and Mr.
Petros Sabatacakis.
Although the non-executive directors do not have
executive or managerial duties, they contribute to
the Board and its Committees by: participating in the
determination of the Company’s strategy;
monitoring the suitability and effectiveness of the
management, the internal audit and the risk
management systems through their participation in
the Audit Committee; determining the remuneration
of the executive directors of the Board through their
participation in the Remuneration Committee;
participating in the selection process of suitable new
candidates for the Board, in the existence of a
succession plan and in the promotion of corporate
governance through their participation in the
Nomination and Corporate Governance Committee.
The Board of Directors, in accordance with provision
B.1.1 of the Code, considers the following seven out
of a total of eight non-executive directors as
independent directors: Mrs. Hiro Athanassiou, Mr.
Doros Constantinou, Mr. Alexander Macridis, Mrs.
Domna Mirasyesi-Bernitsa, Mrs. Ioanna
Papadopoulou, Mr. Plutarchos Sakellaris and Mr.
Petros Sabatacakis.
The Chairman Mr. Efstratios- Georgios Arapoglou
(non-executive director), met on appointment the
independence criteria set out in provision B.1.1. of
the Code.
The seven (7) executive directors in the Board are: Mr.
Efthimios Vidalis, Mr. Michael Colakides, Mr. Bill
Zarkalis, Mr. Nellos Canellopoulos, Mr. Takis-
Panagiotis Canellopoulos, Mr. Dimitri
Papalexopoulos and Mrs. Alexandra
Papalexopoulou-Benopoulou.
Six out of a total of seven executive directors,
including the managing director, come from the
shareholding core or senior management and
provide their services pursuant to employment
agreements with the Company.
The Board of Directors, in accordance with provision
E.1.2.of the Code, states that all members of the
Board including the non-executive directors, have
developed an understanding of the views of the
major shareholders and of all investors in general
through detailed presentations to the Board made
by Messrs. Takis–Panagiotis Canellopoulos who has
served for a number of years as Investor Relations
Director and Mr. Michael Colakides, Group CFO, and
in their capacities have regularly met with
institutional investors and have participated in
various roadshows representing the Company.
Chairman
Mr. Efstratios-Georgios Arapoglou was elected by the
Board on 17.6.2016 as its Chairman. Mr. Arapoglou
who had already served on the Board during 2013-
2016 as Vice-Chairman and Senior Independent
Director, has a long and distinguished career in
commercial and investment banking in the US, the
UK, Egypt, Turkey and Greece.
2 Integrated Annual Report 2016
Corporate Governance Statement
24
The Chairman met on appointment the
independence criteria set out in provision B.1.1. of
the Code.
The Chairman’s main task is to ensure the efficient
operation of the Board, to facilitate a constructive
collaboration between the Board directors and to
ensure that decisions taken by the Board reflect the
principles and values adopted by the Company. The
Chairman also ensures that a satisfactory dialogue
with shareholders takes place and that all directors
are made aware of the Company’s major
shareholders’ issues and concerns.
The Chairman directs the Board meetings and is
responsible for setting the Board’s agenda,
arranging for the agenda, supporting documents
and other necessary information to be sent to
directors in good time before the meeting, ensuring
that non-executive directors are kept fully updated
so that they can effectively perform their monitoring
and decision-making role, and facilitating effective
communication with shareholders.
Mr. Arapoglou is also a member of the Nomination
and Corporate Governance Committee.
Vice-Chairman
By virtue of the resolution of the Board of Directors
dated 17 June 2016, Mr. Nellos Canellopoulos,
executive director, was appointed as Vice-
Chairman of the Board of Directors.
Mr. Canellopoulos comes from the shareholding core
and has also served for almost twenty years as Head
of Group External Relations.
Senior independent director
The Board has appointed Mr. Doros Constantinou,
who had already served on the board (2013-2016) as
independent director and chairs the Audit
Committee, as Senior Independent Director pursuant
to provision A.4.1 of the Code. In this capacity, Mr.
Constantinou has a duty, when required, to assist the
Chairman with his tasks and serve as an intermediary
for the other directors when necessary.
The Senior Independent Director is available to
shareholders, if they have concerns, which contact
with the Chairman, the Managing Director or other
executive directors has failed to resolve, or for which
such contact is inappropriate.
Company secretary
The Board of Directors has appointed the Company's
in-house counsel, Mrs. Eleni Papapanou, as the
Company Secretary, who provides governance,
advisory and legal support to all Board directors. The
Company Secretary acts as secretary to the Board
and its committees and ensures compliance with
corporate governance requirements. The Company
Secretary, when acting in such capacity, reports to
the Board of Directors and, in hierarchical terms,
does not report to any other department of the
Company.
Board of Directors meetings
Directors meet as often as required to enable them
to effectively discharge their respective duties and
responsibilities.
The schedule of the Board meetings is confirmed
during the last months of the previous year, in order
to ensure the highest possible attendance by the
directors.
Decisions are taken by the Board when more than
half of the directors are either present or represented
at the meeting and there is an absolute majority of
the directors present or represented approving the
decision. In any event, there must be at least three
directors physically present at the meeting.
Directors who are absent or unable to attend the
meeting for any reason are entitled to appoint as
proxy another director to vote in their name and on
their behalf.
Each director can be appointed as proxy only for
one director and vote in respect of her/him.
Independent members of the Board of Directors can
only be represented by other independent members.
Senior officers of the Company or the Group are
allowed to attend meetings of the Board of Directors
without voting rights, following an invitation by the
Chairman, when issues within their remit are being
discussed.
The agenda for the meeting of the Board is prepared
by the Chairman and is sent to directors in good
time ahead of the meeting, along with any
necessary information about the topics to be
discussed and the decisions to be taken by the
directors.
The minutes of the previous meeting are signed at
each subsequent meeting. Those minutes are kept
by the Company Secretary and record summaries of
the views of members of the Board of Directors, the
discussions which took place and any decisions
taken.
Nomination of board candidates
The Nominations and Corporate Governance
Committee is responsible for leading the process for
the selection of Board candidates and making
relevant recommendations to the Board.
The Committee evaluates the balance of skills,
experience, independence and knowledge on the
board and, in light of this evaluation, recommends
the role and capabilities required for a particular
candidate nomination. It also considers the need for
progressive refreshing of the Board.
2 Integrated Annual Report 2016
Corporate Governance Statement
25
The Committee ensures that the non-executive
candidates will have sufficient time to fulfill their
duties. The letter of their appointment as candidates
sets out their expected time commitment.
The candidates are carefully selected among a pool
of candidates, on the basis of their skills, experience,
knowledge, independence, time availability and
character and the value they are reasonably
expected to bring to the Board. For the selection of
the most suitable candidates, the Committee is
entitled, if it deems it necessary, to use the services of
external search consultants or open advertising.
However, to date the Committee has proceeded on
its own for the selection of appropriate candidates.
The Board applies on the nomination of candidates
and its composition the following rules:
A. The maximum number of directors on the Board is
fifteen (15);
B. At least ½ of the directors, without counting the
Chairman, must meet the independence criteria laid
down in the Greek laws and the Code. In addition,
they must not hold, directly or indirectly, a stake
larger than 0.1% in the Company’s share capital;
C. An independent director may not serve for more
than nine years in total;
D. Should the Chairman meet on appointment the
independence criteria of the Code, the Vice
Chairman may be elected among the executive
directors. Should the Chairman not meet on
appointment the independence criteria of the Code,
there should be at least one Vice Chairman elected
among the independent non-executive directors.
E. Non-executive directors should undertake that
they will have sufficient time to fulfill their duties.
Board diversity
TITAN recognizes the importance of promoting
diversity at the Board and all levels of the Group, in
particular in relation to gender but also in relation to
other aspects such as age, educational and
professional background, place of domicile,
nationality, etc. The Company through its Human
Rights Policy promotes diversity across the operations
of TITAN Group and supports the recruitment and
development of talented employees, regardless of
their gender or ethnic background. Likewise, the
Board promotes diversity in its composition as well as
in the composition of the Board committees through
the nomination of more women as well as of directors
of different age and of different educational and
professional background (see also page 27 under
Nominations and Corporate Governance
Committee). As a result, during 2016 the number of
women in the Board was doubled from 2 to 4 and
one out of the three members of each Board
committee is a woman. Diversity at Board level has
also been promoted through a balanced mixture of
academic and professional skills. More specifically,
the Board includes directors coming from the
banking sector, the corporate/business sector, legal
and audit services as well as from the academic
community. During its annual evaluation the Board
considers diversity as part of its performance and
effectiveness review.
Obligations of Board Directors
On joining the Board, all directors receive formal
induction. Moreover, throughout their term in office,
the Chairman ensures that they constantly expand
their skills in areas of importance to the Company
and their knowledge of the Company.
The directors are obliged to attend the scheduled
Board and Committee meetings and to allocate the
time required to satisfactorily discharge their duties.
To that end, before their election they have a duty
to inform the Board of Directors about their other
important professional commitments and
directorships with a broad indication of the time
involved as well as of any subsequent changes.
The executive directors, who offer their services to
the Company on the basis of an employment
relationship or a contract for the provision of services,
are not allowed to serve on the Board of more than
two other listed companies.
The non-executive directors are obliged to disclose
to the Chairman of the Board any factual
information that could result in a change of their
status as non-executive or independent directors.
Conflicts of interests
All directors must immediately disclose to the Board
whether they have any personal interest that
conflicts, or it is possible to conflict, with the interests
of the Company or its affiliates in relation to a
transaction or arrangement with the Company or its
affiliates. Given their access to privileged information,
they must not use such information to directly or
indirectly purchase or sell shares in the Company or
its affiliates, which are traded on a regulated market,
for their own benefit or for members of their family.
They must also not disclose that information to other
persons or induce third parties to purchase or sell
shares in the Company or its affiliates, which are
traded on a regulated market, based on the
aforesaid privileged information to which they have
access.
Furthermore, directors, during their term of office,
must not serve as directors on the Boards, or as
officers or employees of business entities that are
competitors to the Company or the Group’s
companies, and generally they must abstain from
any actions, either when acting on their behalf or on
behalf of third parties, that fall under any the
Company’s objectives, without the approval of the
General Meeting of Shareholders. In the event that
2 Integrated Annual Report 2016
Corporate Governance Statement
26
they acquire any such status, they need to inform
immediately the Chairman of the Board of Directors
and resign from the Company’s Board of Directors.
Board Committees
The Board Committees have been set up by the
Board and are comprised entirely of independent,
non-executive members with the exception of the
Nomination and Corporate Governance Committee,
to which the Chairman, a non- executive director, is
a member.
The Board Committees are entitled to retain the
services of specialists and of technical, financial,
legal or other consultants.
Audit committee
Chairman: Doros Constantinou, independent, non-
executive Board member
Members:
• Plutarchos Sakellaris, independent, non-
executive Board member
• Ioanna Papadopoulou, independent, non-
executive Board member
Alternate members:
• Alexander Macridis, independent, non-
executive Board member
• Petros Sabatacakis, independent, non-executive
Board member
The Audit Committee consists exclusively of
independent members of the Board of Directors who
have extensive management, accounting and
auditing knowledge and experience. The ordinary
and alternate members were elected by the
General Meeting of Shareholders on 17 June 2016.
The Committee’s extensive auditing powers include
monitoring the financial reporting process,
monitoring the effectiveness of the internal control,
internal audit and risk management systems,
monitoring the statutory audit of the annual
Company and consolidated accounts and
reviewing and monitoring the independence of the
statutory auditor, and in particular the provision of
additional services to the Company. The Committee
is also responsible to monitor and review the
implementation of the confidential reporting
procedure; this procedure involves employees
reporting any infringement of the Company’s
Corporate Values or the Company’s Code of
Conduct to management via the “direct telephone
line of communication” (Hotline) which is in
operation.
The Audit Committee’s duties and competences
and its internal regulation have been posted to the
Company's website (http://www.titan-
cement.com/en/) at the link: http://www.titan-
cement.com/en/titan-group/corporate-
governance/board-of-directors-committees/audit-
committee/
The Audit Committee holds at least four scheduled
meetings per year. It also holds unscheduled
meetings whenever this is considered necessary.
In 2016, the Audit Committee held five meetings on 8
March, 10 May, 26 July, 31 October and 1 December
2016.
During 2016, the Audit Committee also held two
separate meetings (8 March and 26 July 2016) with
the external auditors without any executive directors
or other Company employees present. During the
aforesaid meetings, the Audit Committee confirmed
the effectiveness of the audit process applied by the
external auditors and confirmed their objectivity and
independence.
Consequently, the Audit Committee recommended
the re-appointment for a second consecutive year
of PwC as external auditors for the financial year 2016.
The Board unanimously agreed with the Audit
Committee’s recommendation and the
reappointment of PWC as external auditors for the
financial year 2016 was approved by the Annual
General Meeting on 17 June 2016. The remuneration
of the external auditors for the financial year 2016,
following relevant recommendation by the Audit
Committee and the Board, was set by the Annual
General Meeting as follows:
- For the statutory audit of the Company’s financial
statements, up to the amount of €105,000 plus VAT;
- For the statutory audit of consolidated financial
statements, up to the amount of €105,000, plus VAT;
and
- For the tax audit of the Company, up to the amount
of €70,000 plus VAT.
During 2016, PwC also undertook the statutory audit
of 45 subsidiaries of TITAN Group established both in
Greece and worldwide.
The total cost for the statutory audit of the Company
and the above 45 subsidiaries and the statutory tax
audit of the Company and its subsidiaries in Greece
for the year 2016, under the exchange rates
prevailing at the time of agreement, is estimated to
amount to €1,196,000 compared to €1,220,000 paid
in 2015.
Following prior approval by the Audit Committee,
PwC provided, in 2016, additional audit related
services, of a total amount of €61,000 (for bond
assurance as well as due to increased scope
following the acquisitions in Brazil and Turkey) as well
as non audit related services, of a total amount of
€82,350, representing in total 11.98% of PwC’s total
fees for conducting the statutory audit for the
Company and the Group’s subsidiaries worldwide.
The additional non audit related services involved
tax and accounting services provided to the
Company and its subsidiaries for their needs in the
financial year 2016. For the financial year 2015, the
total amount of fees paid to PwC for their additional
auditing and consulting services was 156,505 euros.
2 Integrated Annual Report 2016
Corporate Governance Statement
27
The Audit Committee decided that the objectivity
and independence of the external auditors for the
2016 audit has been fully safeguarded. The
independence of the external auditors has been also
confirmed in writing by the external auditors
themselves in a letter addressed to the Audit
Committee.
Remuneration committee
Chairman: Hiro Athanassiou, independent, non-
executive Board member
Members: Alexander Macridis, independent, non-
executive Board member
Petros Sabatacakis, independent, non-executive
Board member
The Remuneration Committee consists exclusively of
independent members of the Board of Directors.
The members of the Committee were appointed by
virtue of a Board decision dated 17 June 2016.
The Committee’s task is to recommend the levels of
the annual remuneration of executive directors and
of senior Group officers on the basis of their
performance and importance of position and to
review on a regular basis the remuneration policy
followed by the Company based on the market
trends with regard to the pay rates and the human
resources management. The Committee also
recommends the levels of remuneration of non-
executive directors on the basis of their time
commitment and responsibilities.
Over the course of the year, the Remuneration
Committee held one meeting on 6 May 2016. The
main subject of the meeting was to make a
recommendation regarding the total remuneration
(annual salary, bonus, stock grant and retirement
fund contributions) during 2016 of the Chief
Executive Director and the other executive members
of the Board as well as of the senior Group officers
including the Group Internal Audit Director.
The Remuneration Committee also made a
recommendation on the level of retirement
compensation of the previous Chairman, Mr.
Andreas Canellopoulos, who completed his term in
office in June 2016. The level of his retirement
compensation was recommended in accordance
with the Remuneration Policy of the Company and
on the basis of his years of service in the Company.
The Remuneration Committee also recommended
the level of the annual remuneration of the new
Chairman of the Board and of the other non-
executive directors for the year 2016, on the basis of
their performance, the time commitment and the
responsibilities of their role.
The above recommendations of the Remuneration
Committee were subsequently approved by the
Board. The recommendations of the Remuneration
Committee on the level of remuneration of the Board
members (executive and non-executive directors)
for their participation in the Board and the Board
committees in 2016 was subsequently submitted for
pre-approval to the Annual General Meeting.
The Remuneration Committee’s duties and
competences and its internal regulation have been
posted to the Company's website http://www.titan-
cement.com/en/ at the link: http://www.titan-
cement.com/en/titan-group/corporate-
governance/board-of-directors-
committees/remuneration-committee/
Nominations and corporate governance committee
Chairman: Domna Mirasyesi- Bernitsa, independent,
non-executive Board member
Members: Efstratios-Georgios Arapoglou, non-
executive Board member
Hiro Athanassiou, independent, non-executive
Board member
The Nominations and Corporate Governance
Committee consists of three non-executive directors
of the Board, two of whom are independent. The
Chairman of the Board, who is a non-executive
director, is the third member of the Committee. The
present members of the Committee were appointed
by virtue of the Board of Directors’ decision dated 17
June 2016.
All members of the Committee have extensive
experience in business administration and corporate
governance.
The main tasks of this Committee is to search and
recommend suitable Board candidates, to ensure
that plans are in place for orderly succession for
appointments to the Board and to senior
management, to evaluate the balance of skills,
experience, independence and knowledge on the
Board and to ensure its progressive and appropriate
refreshing.
In view of the end of the three-year term of the Board
and the election of a new Board by the 2016 Annual
General Meeting for a new three year term, during
2016 the Committee successfully led a formal,
rigorous and transparent process for the selection
and nomination of three new independent directors
to replace an equal number of directors who would
not be nominated for a new term (two of whom due
to completion of nine years of service on the board
and one, the ex-Chairman, due to retirement after
45 years of service on the Board and 20 as Chairman).
The Committee, after evaluating the balance of skills,
experience, independence and knowledge on the
board, prepared a description of the role and
capabilities required for the three new directors. In
brief, all three new directors should meet the
independence criteria in accordance with the Code,
the Greek legislation and the Company (see above
in page 22 under Independent non-executive
2 Integrated Annual Report 2016
Corporate Governance Statement
28
directors). They should also have distinguished
careers, business experience and a global
perspective and they should be able to allocate
sufficient time to the Company in order to discharge
their responsibilities effectively.
The search for suitable candidates was conducted
on merit, against objective criteria. Given the
importance of diversity, the Committee
recommended the increase of the number of
women on Board from two to four and as a result two
of the three new members were women. The
Committee was satisfied that diversity on the Board
was also promoted through the different
educational and professional backgrounds of the
directors and also through the participation in the
Board of two directors with permanent domicile in
the U.S. Finally, given the geographical presence of
TITAN, the Board has set the goal to pursue, at the
next Board election, the participation of more non-
Greek directors on the Board.
The Committee was also actively involved in the
nomination of the new non-executive Chairman, Mr.
Arapoglou, who undertook responsibility for
leadership of the Board in June 2016. Mr. Arapoglou
was already serving as Vice Chairman and Senior
Independent Director and, for this reason, the
Committee had adequate evidence of his
commitment and availability. His global perspective
and sound business judgment provided a solid
foundation for his nomination by the Committee.
In 2016, in addition to the various meetings with the
candidates, the Committee held two meetings, on
22 February and 7 March, with the following agenda:
a. Performance evaluation of the Board and its
Committees in 2015 on the basis of the annual
assessment questionnaire and submission of
report to the Board;
b. Review of the contents of the Corporate
Governance Statement that was part of the
Annual Corporate Governance Report for the
year 2015;
c. Completion of the search and selection process
of new board candidates and nomination of
three new directors; and
d. Review of the existing plans for the orderly
succession of the Chairman, the Managing
Director and the senior officers of the Company.
The Nomination and Corporate Governance
Committee’s duties and competences and its
internal regulation have been posted on the
Company's website http://www.titan-
cement.com/en/ at the following address:
http://www.titan-cement.com/en/titan-
group/corporate-governance/board-of-directors-
committees/nomination-and-corporate-
governance-committee/
Other committees with Board members’
participation
In addition to the above three Committees of the
Board of Directors, the Board has established the
following Committees which consist of executive
directors and relevant senior officers of the Company
Executive committee
Chairman: Dimitri Papalexopoulos, Chief Executive
Officer
Members: Michael Colakides, Executive Director,
Group Chief Financial Officer
Bill Zarkalis, executive director, Head of U.S. Region
Alexandra Papalexopoulou-Benopoulou, executive
director, Strategic Planning Director
Sokratis Baltzis, Head of Egypt region and Group
Trading
Konstantinos Derdemezis, Head of Serbia, F.Y.R. of
Macedonia, Albania and Kosovo Region
John Kollas, Head of TITAN Group Human Resources
Christos Panagopoulos, Head of Turkey and Bulgaria
Region
Yanni Paniaras, Group Corporate Affairs Executive
Director, Head of Greek Region,
Fokion Tasoulas, Head of TITAN Group Technology
and Engineering
The day-to-day management has been delegated
by the Board to the Executive Committee.
Within this context, the Executive Committee,
chaired by the Group CEO, is the senior
management body on all aspects of the Company’s
strategy and operations. The Executive Committee
invites the appropriate functional heads according
to the agenda topics.
The Executive Committee’s duties and
competences and its internal regulation have been
posted to the Company's website http://www.titan-
cement.com/en/ at the link: http://www.titan-
cement.com/en/titan-group/corporate-
governance/other-committees/executive-
committee/
Sustainability committee
CHAIRMAN: Dimitri Papalexopoulos, Chief Executive
Officer
Members: Nellos Canellopoulos, Vice Chairman,
Executive Board Director
Takis-Panagiotis Canellopoulos, Executive Board
Director
Efthymios Vidalis, Executive Board Director
Fokion Tasoulas, Group Engineering &Technology &
Director
John Kollas, Group Human Resources Director
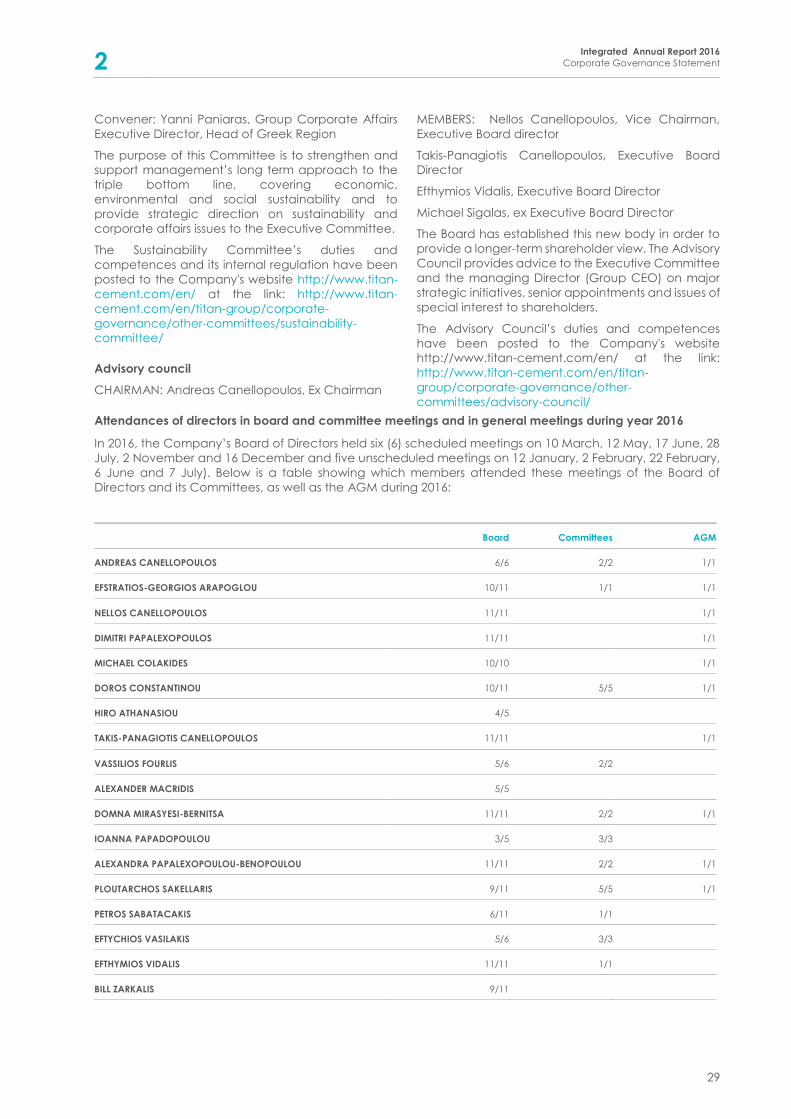
2 Integrated Annual Report 2016
Corporate Governance Statement
29
Convener: Yanni Paniaras, Group Corporate Affairs
Executive Director, Head of Greek Region
The purpose of this Committee is to strengthen and
support management’s long term approach to the
triple bottom line, covering economic,
environmental and social sustainability and to
provide strategic direction on sustainability and
corporate affairs issues to the Executive Committee.
The Sustainability Committee’s duties and
competences and its internal regulation have been
posted to the Company's website http://www.titan-
cement.com/en/ at the link: http://www.titan-
cement.com/en/titan-group/corporate-
governance/other-committees/sustainability-
committee/
Advisory council
CHAIRMAN: Andreas Canellopoulos, Ex Chairman
MEMBERS: Nellos Canellopoulos, Vice Chairman,
Executive Board director
Takis-Panagiotis Canellopoulos, Executive Board
Director
Efthymios Vidalis, Executive Board Director
Michael Sigalas, ex Executive Board Director
The Board has established this new body in order to
provide a longer-term shareholder view. The Advisory
Council provides advice to the Executive Committee
and the managing Director (Group CEO) on major
strategic initiatives, senior appointments and issues of
special interest to shareholders.
The Advisory Council’s duties and competences
have been posted to the Company's website
http://www.titan-cement.com/en/ at the link:
http://www.titan-cement.com/en/titan-
group/corporate-governance/other-
committees/advisory-council/
Attendances of directors in board and committee meetings and in general meetings during year 2016
In 2016, the Company’s Board of Directors held six (6) scheduled meetings on 10 March, 12 May, 17 June, 28
July, 2 November and 16 December and five unscheduled meetings on 12 January, 2 February, 22 February,
6 June and 7 July). Below is a table showing which members attended these meetings of the Board of
Directors and its Committees, as well as the AGM during 2016:
Board Committees AGM
ANDREAS CANELLOPOULOS 6/6 2/2 1/1
EFSTRATIOS-GEORGIOS ARAPOGLOU 10/11 1/1 1/1
NELLOS CANELLOPOULOS 11/11 1/1
DIMITRI PAPALEXOPOULOS 11/11 1/1
MICHAEL COLAKIDES 10/10 1/1
DOROS CONSTANTINOU 10/11 5/5 1/1
HIRO ATHANASIOU 4/5
TAKIS-PANAGIOTIS CANELLOPOULOS 11/11 1/1
VASSILIOS FOURLIS 5/6 2/2
ALEXANDER MACRIDIS 5/5
DOMNA MIRASYESI-BERNITSA 11/11 2/2 1/1
IOANNA PAPADOPOULOU 3/5 3/3
ALEXANDRA PAPALEXOPOULOU-BENOPOULOU 11/11 2/2 1/1
PLOUTARCHOS SAKELLARIS 9/11 5/5 1/1
PETROS SABATACAKIS 6/11 1/1
EFTYCHIOS VASILAKIS 5/6 3/3
EFTHYMIOS VIDALIS 11/11 1/1
BILL ZARKALIS 9/11
2 Integrated Annual Report 2016
Corporate Governance Statement
30
Annual evaluation of Board performance
The Board undertook in 2016 an annual self-
evaluation of its performance and that of its
committees and individual directors by filling out a
special, detailed questionnaire which had been
prepared by the Company Secretary. The
questionnaire was divided into eight units under the
titles Leadership, Composition-Effectiveness,
Operation of Board-Information and Support,
Financial and Business Reporting – Relations with
Shareholders, Remuneration, Performance of Board
Committees, Directors’ Attendance at the Board
and committee meetings and the Shareholders
Meetings and Directors’ Individual Performance
evaluation. Each member’s contribution to the
Board was evaluated with a score, ranging from one
to four, corresponding to poor, average, very good
and excellent contribution.
The questionnaires were filled out anonymously and
sent to the Company Secretary.
Remuneration of Board members for their
participation in the Board and its committees in 2016
The Annual General Meeting of 17June 2016,
following the same recommendation of the Board
and the Remuneration Committee decided, in
accordance with article 24 section 2 of Law
2190/1920, the increase by 25% of the annual
remuneration paid to Board directors during 2016,
given that there was no increase during the last two
years (2014 and 2015) and that the level of the
remuneration was low compared with the peer
companies.
More specifically, the AGM decided the payment of
a total gross amount of €580,000 (€464,000 in 2015) as
follows:
- gross amount of €450,000 as remuneration for
participation on the Board, i.e. gross amount of
€30,000 for each director;
- gross amount of €65,000 for the 3 members of the
Audit Committee, i.e. gross amount of €25,000 for the
Chairman and gross amount of €20,000 for each
member;
- gross amount of €32,500 for the three members of
the Remuneration Committee, i.e. gross amount of
€12,500 for the Chairman and gross amount of
€10,000 for each member; and
- gross Amount of €32,500 for the 3 members of the
Nomination and Corporate Governance Committee,
i.e. gross amount of €12,500 for the Chairman and
gross amount of €10,000 for each member.
The AGM of 17 June 2016 also preapproved,
following relevant Board recommendation, in
accordance with article 24 section 2 of Law
2190/1920:
-the payment of additional annual remuneration of
a gross amount of €168,000 plus stamp tax to the new
non-executive Chairman Mr. Arapoglou ( i.e. €84,000
plus stamp tax gross for the semester June 2016-
December 2016) and
-the payment of additional remuneration of a gross
amount of €135,000 plus stamp duty to the executive
director Mr. Vidalis, who does not provide his services
under an employment contract with the Company,
as a result of his increased duties mainly in the areas
of sustainable development and strategy.
Pursuant to article 24 section 2 of Law 2190/1920, all
aforementioned payments will be submitted for final
approval to the Annual General Meeting for the
financial year 2016 which will be held within the first
semester of 2017.
Remuneration of executive directors during 2016
In 2016, the salaries and all kinds of gross
remuneration paid to 6 executive directors who
provided their services on the basis of employment
contracts amounted to the gross amount of
€3,987,357 (€3,422,000 in 2015).
In 2016, the additional amount of €918,478 (€520,000
in 2015) was paid for the retirement plans of the six
above executive directors.
In 2016, the gross remuneration paid to the ex-
Chairman, Mr A. Canellopoulos, who was a non-
executive director, was €151,220. Mr Canellopoulos
also received a retirement compensation of a gross
amount of €336,000.
The executive directors who were released to serve
as non-executive directors in other companies and
to retain their relevant earnings, received in 2016
remuneration as follows:
Mrs. Alexandra Papalexopoulou-Benopoulou, gross
remuneration of €83,500 for serving on the board of
Coca-Cola HBC AG;
Mr. Takis-Panagiotis Canellopoulos, gross
remuneration of €10,000 for serving on the board of
“Grivalia Properties REIC”; and
Mr. Efthimios Vidalis, gross remuneration of €46,000 for
serving on the board of Alpha Bank.
Mr. Michael Colakides, gross remuneration of €17,500
for serving on the board of Eurobank Cyprus LTD.
Remuneration policy for executive directors and
senior officers
The levels of remuneration of the executive directors
and senior officers are decided by the Board
following recommendation of the Remuneration
Committee.
Such remuneration consists of a fixed part, i.e. the
salary, which is determined on the basis of the
applicable salaries system and the annual
2 Integrated Annual Report 2016
Corporate Governance Statement
31
performance assessment, and of a variable part,
which is linked with the achievement of individual
and corporate goals. The corporate goals are linked
with performance in terms of financial ratios (EBITDA
and ROACE) at Group level and at Region level, as
well as with performance in other areas, such as the
safety at work. The individual goals are personal and
they are linked with the position that each officer
serves.
Annual bonus awards vary depending on the
importance of the position of the executive director
/ senior officer, but in no event may the bonus
exceed:
A. 100% of the fixed annual remuneration (i.e.
salary), when the targets set have been fully met;
or,
B. 120% of the fixed annual remuneration (i.e.
salary), if the officer has over-performed on the
targets set.
The assessment of the performance of the executive
directors and senior executives is carried out by the
Chief Executive Officer and the assessment of the
performance of the Managing Director is carried out
by the Board of Directors.
The executive directors do not participate in
discussions relating to the determination of their
individual remuneration.
The Group Human Resources Department provides
on a yearly basis to the Remuneration Committee
data from the labor market, so that the remuneration
level and/or the plans for variable compensation are
adjusted accordingly. The main aim is to attract and
keep high-caliber professionals who with their
knowledge, skills and integrity will add value to the
Company.
Executive directors and senior officers of the Group
are granted long-term incentives through stock
option schemes which are linked to Group
performance, are approved by the General Meeting
of Shareholders, have a three-year maturity period
and are subject to specific vesting requirements i.e.
achievement of certain targets.
Executive directors and senior officers also benefit
from pension-savings plans and other additional
voluntary allowances, which, may at any time be
recalled or amended at the Company’s discretion.
The Company offers to the executive directors who
have an employment relationship with the Company,
additional rights under pension and benefit plans
based on the applicable practices in the relevant
markets where the Company is operating, which
may at any time be recalled or amended at the
Company’s discretion.
Stock option plans for executive members of the
Board of Directors and senior officers of the
Company and Group
Aiming to align the long-term personal goals of its
senior executives with the interests of the Company
and its shareholders, the Company has adopted and
implements since 2000 stock option plans. All
relevant plans (2000, 2004, 2007, 2010 and 2014 Plans)
have been approved by the General Meeting of
Shareholders, had a three-year maturity period and
their beneficiaries were executive directors and
senior Group officers. Non-executive directors were
not eligible to participate in these plans.
Under the 2000 Plan, 48 beneficiaries exercised their
stock option rights and purchased 119,200 ordinary
shares at a sale price of €29.35 per share, as well as
451,900 ordinary shares at a sale price of €14.68 per
share.
Under the 2004 Plan, 63 beneficiaries exercised their
stock option rights and purchased 186,000 ordinary
shares at a purchase price equal to the nominal
price of the share, namely €4 per share.
Under the 2007 Plan, 103 beneficiaries exercised their
stock option rights and purchased 61,804 ordinary
shares of the Company at a price equal to the
nominal price of each share, namely €4 per share.
Finally, under the 2010 Plan, 104 beneficiaries
exercised their stock option rights and purchased
459,678 ordinary shares of the Company were
exercised at a price equal to the nominal price of
each share, namely €4 per share.
In total, to date under the aforesaid Plans 1,278,582
ordinary shares have been acquired by the
beneficiaries representing 1.51% of the Company’s
paid capital.
To date, only the 2014 Plan is still running.
The 2014 Plan, as did the previous Plans, favors the
long-term holding of a significant number of
Company shares by the executive directors and the
Group officers; it also includes as a vesting
requirement the holding of a minimum number of
Company shares depending on the officer’s rank;
any breach of this requirement will result in a
decrease of the number of share option rights for the
next grant period.
All Plans were designed to prevent high-risk
behaviors of their beneficiaries, executive directors
and senior officers of the Company, which might
impact negatively the Company’s share price. For
this reason, they have an attractive strike price in
relation to the exchange price of the Company’s
share at the time that they are granted.
A detailed description of the Plans is available on the
Company’s website http://www.titan-cement.com/
link:
2 Integrated Annual Report 2016
Corporate Governance Statement
32
http://ir.titan.gr/titan/app/cms?lang=en&page=pro
gramma.paroxis.dikaiomaton.proairesis.metoxon
Internal audit and risk management systems in
relation to the financial statements
The key elements of the system of internal controls
utilized in order to avoid errors in the preparation of
the financial statements and to provide reliable
financial information are the following:
The assurance mechanism regarding the integrity of
the Group’s financial statements consists of a
combination of the embedded risk management
processes, the applied financial control activities, the
relevant information technology utilized, and the
financial information prepared, communicated and
monitored.
Each month the Group’s subsidiaries submit financial
and non-financial data to the Group’s consolidation
department and provide explanatory information
where necessary.
In consolidating the financial results and statements,
the Group utilizes specialized consolidation software
and specialized software for reconciling
intercompany transactions. These tools come with
built-in control mechanisms and they have been
parameterized in accordance with the Group
needs. Finally, the above tools use best-practices
regarding the consolidation process, which the
Group has to a large extent adopted.
The Group’s management reviews on a monthly
basis the consolidated financial statements and the
Group’s Management Information (MI) – both sets of
information being prepared in accordance with IFRS
and in a manner that facilitates their understanding.
The monthly monitoring of the financial statements
and Group MI and their analysis carried-out by the
relevant departments, are key elements of the
controlling mechanism regarding the quality and
integrity of financial results.
The Group’s external auditors review the mid-year
financial statements of the Company, the Group
and its material subsidiaries and audit the full-year
financial statements of the aforementioned. In
addition, the Group’s external auditors inform the
Audit Committee about the outcome of their reviews
and audits.
The Audit Committee, during its quarterly, meetings
prior to the financial reporting, is informed by the
Group CFO and the other competent Group officers
about the performance of the Group, monitors the
Company and consolidated accounts and the
financial reporting process and reports accordingly
to the Board. During these meetings, the Audit
Committee is also informed on the management of
the financial risks and monitors the effectiveness of
the risk management system.
The approval of the financial statements (Company
and Consolidated) by the Board, is made after
relevant recommendation of the Audit Committee.
Internal audit
Internal audit is carried out by the Group Internal
Audit, which is an independent department with its
own written regulation, reporting directly to the
Board of Directors’ Audit Committee.
Internal audit consists of 17 executives who have the
necessary training and experience to duly carry out
their work.
Internal Audit’s primary role is to evaluate the internal
controls that have been put in place for all Group
functions in terms of their adequacy and
effectiveness. Internal Audit’s functions also include:
• monitoring implementation and compliance
with the Company’s Internal Regulation, Code of
Conduct, Articles of Association and applicable
laws in all jurisdictions in which the Group
operates;
• reporting to the Board of Directors any conflict of
interest situations relating to the members of the
Board of Directors or the Company’s executives
towards the Company’s interests, as such
situations may be identified in the frames of the
internal audit;
• monitoring the relationship and transactions of
the Company with the related parties, as defined
in the International Accounting Standard 24, as
well the audit of the Company’s dealings with
companies with a higher than 10% participation
in their capital by members of the Board of
Directors or shareholders of the Company with
more than 10%.
During the year 2016, 42 written reports from the
Internal Audit Division relating to all audits of Group
functions were submitted to the Audit Committee,
and via it to the Board of Directors. From the audits
conducted, 27 were scheduled, 5 were special and
10 were recurring.
A three-month progress and an annual report of the
work of the Internal Audit Department with reference
to the most important audit findings, was submitted
to the Audit Committee.
During the year 2016, the Audit Committee held
regular private meetings with the Group’s Internal
Audit Director to discuss functional and
organizational issues. All information requested was
provided and briefings were given about the audit
systems currently in place, their effectiveness and the
progress of audits. Following a report from the Audit
Committee, the Board of Directors approved the
audit schedule for 2017 and specified the functions
and points on which internal audit must focus.
2 Integrated Annual Report 2016
Corporate Governance Statement
33
Information required by Article 10(1) of
European Parliament and Council Directive
2004/25/EC
The information required by Article 10(1) of European
Parliament and Council Directive 2004/25/EC is
contained, pursuant to Article 4 (7) of Law 3556/2007,
in the Explanatory Report, which is part of the Board
of Directors’ Annual Report and is set out above.
General Meetings and Shareholders’ Rights
The General Meeting’s modus operandi-Powers
According to Article 12 of the Company’s Articles of
Association, the General Meeting of Shareholders is
the Company’s supreme body and is entitled to
decide on all corporate affairs.
The General Meeting is the sole body competent to
decide on:
a. Amendments to the Articles of Association, other
than those which are decided on by the Board
of Directors pursuant to law (Article 11(5), Article
13(2) and (13), and Article 17b (4) of Codified
Law 2190/1920).
b. Increases or reductions in the share capital, with
the exception of those cases where that power
lies with the Board of Directors pursuant to Law or
the Articles of Association, and increases or
reductions required by the provisions of other
laws.
c. The distribution of the annual profits, save for the
case referred to in Article 34(2)(f) of Codified
Law 2190/1920.
d. The election of members and stand-in members
of the Board of Directors, apart from the cases
cited in Article 25 of the Articles of Association,
relating to the election of members by the Board
of Directors to replace members who have
resigned, passed away or been removed from
their post, for the remainder of the term in office
of the members being replaced and provided
that said members cannot be replaced by the
stand-in members elected by the General
Meeting.
e. Approval of the annual accounts (annual
financial statements).
f. The issuing of corporate bonds, in parallel with
the right of the Board of Directors to issue such
bonds in accordance with Article 28 of the
Articles of Association.
g. The election of auditors.
h. The extension of the Company’s term, merger,
split, conversion, revival, or winding up of the
Company.
i. The appointment of liquidators.
j. The filing of actions against members of the
Board of Directors for acting ultra vires or for
infringing the law or the Articles of Association
and
k. All other issues relating to the Company for which
the General Meeting is granted competence by
the law or the Articles of Association.
The General Meeting meets at the seat of the
Company or in another municipality within the
prefecture where the seat is located or in another
municipality bordering the place of its seat at least
once every fiscal year and within 6 months at the
most from the end of that fiscal year. It may also
meet within the boundaries of the municipality where
the Athens Exchange has its registered offices.
The notice for the General Meeting must include at
least the data defined by article 26 of the Law
2190/1920 and is published as provided in Law
2190/1920. More specifically, the notice for the
General Meeting must include place and precise
address, date and time of the meeting, the items on
the agenda clearly stated, the shareholders entitled
to take part, and precise instructions about how
shareholders can take part in the meeting and
exercise their rights in person or via a representative,
including the forms that the Company is utilizing for
that purpose.
The minimum information which should be stated in
the notice also includes information about the
minority rights and the time period in which such
minority rights can be exercised, the record date with
an indication that only shareholders on the record
date can attend and vote at the General Meeting,
a notice of the place where the full text of
documents and drafts of decisions proposed by the
Board of Directors for all items on the agenda are
available, a reference to the Company’s website
where all the above information is available, and the
forms which must be used when shareholders vote
via a representative.
The notice for the General Meeting must be
published in full or in summary format (which must
necessarily include an express reference to the
website where the full text of the invitation and
information required by Article 27(3) of Codified Law
2190/1920 is available) in the publications specified
in Article 26(2) of Codified Law 2190/1920, in the
Sociétés Anonymes and Limited Liability Companies
Bulletin of the Government Gazette and on the
ATHEX and Company websites.
The Company arranges for the notice of the Annual
General Meeting and related papers to be sent to
shareholders at least 20 working days before the
meeting and published pursuant to the provisions
above. For other general meetings the notice and
related papers are sent and published at least 14
working days in advance.
The full text of the notice is published in electronic
news services with a national and European reach,
in order to effectively disseminate information to
investors and to ensure rapid, non-discriminatory
access to such information.
2 Integrated Annual Report 2016
Corporate Governance Statement
34
Right to attend General Meetings
All shareholders are entitled to take part in the
General Meetings.
To take part, holders of shares must have been
shareholders at the start of the fifth day before the
date of the General Meeting (Record date).
Such persons can demonstrate that they are
shareholders by submitting a written certificate from
Hellenic Exchanges S.A. or, alternatively, by the
Company connecting online to the files and records
of Hellenic Exchanges S.A.
The original or online certificate proving that they are
shareholders must be presented to the Company no
later than the third day before the date of the
General Meeting.
Other than this requirement, the exercise of the right
to participate in the General Meeting does not
require shareholders to block their shares or comply
with any other formalities which limit the ability to sell
or transfer their shares in the time period between the
record date and the date of the General Meeting.
Shareholders or their representatives who have not
complied with these formalities may only take part in
the General Meeting with its permission.
Shareholders may attend the General Meetings
either in person or through one or more
representatives, whether shareholders or not. Each
shareholder may appoint up to 3 representatives. If a
shareholder holds shares in the Company which
appear in more than one securities account, this
limitation does not prevent the shareholder from
appointing different representatives for the shares
which appear in each securities account.
A representative who acts for more than one
shareholder may vote differently on behalf of each
shareholder.
Legal entities may participate in the General
Meeting by appointing up to three natural persons as
their representatives.
Shareholder representatives can be appointed and
removed in writing, such notice being sent to the
Company in the same way, at least three days
before the date set for the General Meeting.
The Company has forms available on its website,
which must be filled out and sent by shareholders in
order to appoint a representative. These forms allow
shareholders to authorize their proxies to exercise
their voting rights at the meeting and to direct them
to vote for or against, or to abstain from voting on
each item of the agenda. Abstentions do not count
in tallying the vote negatively or positively in relation
to a decision.
The Company’s Articles of Association do not
provide for shareholders’ participation in the General
Meeting and for the exercise of their voting rights
remotely or by correspondence.
Shareholder representatives are obliged to inform
the Company before the General Meeting starts
about any information which shareholders should be
aware of so that they can determine whether there
is a risk of the representative serving interests other
than their own interests.
Conflicts of interest may arise in cases where the
representative:
a. is a shareholder who controls the Company or is
another legal entity or person controlled by that
shareholder;
b. is a member of the Board of Directors or of the
management team of the Company or a
shareholder who controls the Company, or
another legal person or entity controlled by a
shareholder who controls the Company;
c. is an employee or certified public accountant of
the Company or a shareholder who controls the
Company, or another legal person or entity
controlled by a shareholder who controls the
Company;
d. is the spouse or a first degree relative of one of
the natural persons referred to above.
All Board directors should attend the General
Meeting and the chairmen of the Board committees
should be available to answer questions.
Quorum – Majority
According to the law and the Articles of Association,
the General Meeting has a quorum and can validly
decide on the items of the agenda when
shareholders representing at least 1/5 of the paid up
share capital are present or represented at the
meeting.
If this quorum is not achieved at the first meeting, the
Meeting will reconvene within 20 days from the date
on which it was not possible to hold the meeting. The
new Meeting has a quorum and can take valid
decisions on the items on the initial agenda,
irrespective of the percentage of the paid up share
capital represented in the Meeting. In all the above
cases, decisions of the General Meeting are taken by
absolute majority of the votes represented at it.
By way of exception, in the case of decisions relating
to a change in the Company’s nationality; a change
in the business object; an increase in shareholders’
obligations; an increase in share capital not provided
for by the Articles of Association in line with Article
13(1) and (2) of Codified Law 2190/1920 unless
required by law or done by capitalizing reserves; a
reduction in share capital unless done in
accordance with Article 16(6) of Codified Law
2190/1920; a change in the profit distribution; the
merger, split, conversion, revival, extension of term or
winding up of the Company; the granting or renewal
of powers to the Board of Directors to increase the
2 Integrated Annual Report 2016
Corporate Governance Statement
35
share capital in accordance with Article 13(1) hereof,
and all other cases specified by law, the General
Meeting has a quorum and is validly met on the items
of the agenda when shareholders representing at
least 2/3 of the paid up share capital are present or
represented at the meeting. In all the above cases,
decisions of the General Meeting are taken by 2/3
majority of the votes represented at it.
If this qualified quorum is not achieved, the General
Meeting will be invited to convene and will
reconvene within 20 days from the date on which the
meeting could not take place, and will have a
quorum and be validly met on the items on the initial
agenda if at least ½ of the paid-up share capital is
represented at it. If this quorum is not achieved, the
General Meeting will be called and will convene
again within 20 days and will have a quorum and be
validly met on the items on the initial agenda when
at least 1/5 of the paid-up share capital is
represented at it.
In all the above cases, decisions of the General
Meeting are taken by 2/3 majority of the votes
represented at it.
No other invitation is required if the initial invitation
specifies the place and time of any repeat meetings
that might be held if a quorum is not achieved at the
first meeting, provided that at least ten full days
elapse between the meeting which was cancelled
and the repeat meeting.
Shareholders’ Rights
Right to attend General Meetings
As explained in detail above, shareholders are
entitled to attend General Meetings in person or via
representatives who may or may not be shareholders.
Right to vote at General Meetings:
Every share, apart from preferred shares to which no
voting rights are attached, comes with a voting right.
Rights of preferred shareholders
According to the decision of the Company’s Annual
General Meeting of Shareholders of 27 June 1990,
which decided to increase the Company’s share
capital by issuing preferred shares without voting
rights, the privileges granted to preferred shares
without voting rights are:
A. The right to receive a first dividend from the
profits of each year before ordinary shareholders,
and in the case where no dividend is distributed
or the dividend distributed in one or more years
is lower than the first dividend, to receive
payment on that first dividend on a preferential
and cumulative basis for those years, from the
profits generated in subsequent years. Holders of
non-voting preferred shares are also entitled, on
the same terms as holders of ordinary shares, to
receive any additional dividend paid in any form.
It should be noted that following amendments to
the provisions of Article 45(2) of Codified Law
2190/1920 on the profits of Sociétés Anonymes to
be distributed, in accordance with Article 79(8)
of Law 3604/2007, the obligation to distribute 6%
of the paid-up share capital as the minimum
mandatory first dividend was abolished, and it is
now mandatory to distribute 35% of the net
profits, thus making the right of preferred shares
to the first dividend redundant
B. Preferential return of capital paid up by holders
of non-voting preferred shares from the product
of the liquidation of corporate assets in the event
of the Company being wound up. Holders of
non-voting preferred shares are entitled, on
equal terms with the holders of ordinary shares,
to a further participation, proportionately, in the
product of liquidation of assets, if this product is
greater than the total paid-up share capital.
Priority rights
In any event of share capital increase, when that
increase does not result from a contribution in kind or
the issue of bonds with the right of conversion into
shares, priority rights are granted on the entire new
capital or bond issue to the Shareholders of the
Company at the time of issue, proportionate to their
holding in the existing share capital.
Where the Company’s share capital is increased with
shares from only one of the classes of shares the
Company has issued, the priority right is granted to
shareholders in the other class only after it is not
exercised by shareholders in the class to which the
new shares belong.
Pursuant to article 13(10) of Law 2190/1920, priority
rights may be limited or abolished by decision of the
General Meeting of Shareholders, requiring a special
increased quorum and majority, pursuant to the
provisions of Article 29(3) and (4) and Article 31(2) of
Law 2190/1920.
Right to receive a copy of the financial statements
and reports of the BOD and Auditors
Ten days prior to the Ordinary General Meeting,
each shareholder may request the annual Financial
Statements and relevant reports of the Board of
Directors and Auditors from the Company.
Minority rights
Following an application submitted by any
Shareholder to the Company within at least five full
days prior to the General Meeting, the Board of
Directors shall be obliged to provide the General
Meeting with the requested specific information on
the Company’s affairs, to the extent that it may be
useful for the actual assessment of the items on the
2 Integrated Annual Report 2016
Corporate Governance Statement
36
agenda. The Board of Directors may provide a single
response to shareholder requests relating to the
same matter. The obligation to provide information
does not exist when the information requested is
already available on the Company's website,
especially in the form of questions and answers. The
Board of Directors may refuse to provide such
information on a serious, substantive ground which
shall be cited in the minutes. Such ground may,
under the circumstances, be representation of the
applicant shareholders on the Board of Directors in
line with Article 18(3) or (6) of Law 2190/1920.
At the request of Shareholders representing 1/20 of
the paid-up share capital:
A. The Board of Directors shall be obliged to
convene an extra-ordinary General Meeting
within a time period of 45 days from the date of
service of the relevant request on the Chairman
of the Board of Directors. This application must
contain the items on the agenda of the
requested Meeting. Where the General Meeting
is not convened by the Board of Directors within
20 days from service of the request, it shall be
convened by the applicant shareholders at the
Company’s expense by decision of the Single-
Member Court of First Instance at the seat of the
Company, which decision shall be issued in line
with the injunctive relief procedure. This decision
shall state the time and place of the meeting
and the items on the agenda.
B. The Board of Directors shall be obliged to enter
additional items on the agenda of the General
Meeting that has already been convened,
provided that it receives the relevant request
within at least 15 days prior to the General
Meeting. The additional items shall be published
or notified by the Board of Directors at least 7
days before the General Meeting. That request
to have additional items included in the agenda
shall be accompanied by the reasons for such
inclusion or a draft decision for approval by the
General Meeting and the revised agenda shall
be published in the same manner as the previous
agenda, 13 days before the date of the General
Meeting, and shall also be made available to
shareholders on the Company’s website, along
with the reasoning or draft decision submitted by
the shareholders.
C. At least 6 days before the date of the General
Meeting, the Board of Directors is obliged to
provide shareholders with drafts of decisions on
the items which have been included in the initial
or revised agenda, by uploading the same on
the Company’s website, if a request to that
effect is received by the Board of Directors at
least 7 days before the date of the General
Meeting.
The Board of Directors is not obliged to include
items in the agenda or publish or disclose them
along with the reasoning and drafts of decisions
submitted to shareholders in accordance with
the aforementioned two sections if the content
thereof is clearly in conflict with the law and
morals.
D. The Chairman of the General Meeting shall be
obliged – only once – to postpone the making of
decisions by the General Meeting, whether
ordinary or extraordinary, on all or certain items,
setting a new date for the General Meeting as
per the shareholders’ request, provided it is not
more than 30 days from the date of the
postponed General Meeting. A postponed
General Meeting which reconvenes shall be
deemed a continuation of the previous one and
for this reason no repetition of the publication
requirements shall be required, and new
shareholders may also participate, provided that
they comply with the obligations for
participation in the General Meeting.
E. The Board of Directors shall be obliged to
announce to the Annual General Meeting the
amounts that have in the last two-year period
been paid to each member of the Board of
Directors or to the Company directors, as well as
any benefits granted to these persons due to any
reason or contract concluded between them
and the Company. The Board of Directors may
refuse to provide such information on a serious,
substantive ground which shall be cited in the
minutes. Such ground may, under the
circumstances, be representation of the
applicant shareholders on the Board of Directors
in line with Article 18(3) or (6) of Law 2190/1920.
Any doubts about the validity or otherwise of the
reasons for refusal to provide information may be
decided by the Single-Member Court of First
Instance at the company’s seat.
F. Decisions on any item on the agenda of the
General Meeting shall be taken by a call of
names.
G. In addition, shareholders representing 1/20 of the
paid-up share capital are entitled to request that
the Single-Member Court of First Instance at the
Company’s seat audit the Company in the
manner specified in Article 40 of Codified Law
2190/1920. In any event, the request for an audit
must be submitted within three years from the
approval of the financial statements of the fiscal
year in which the contested transactions were
effected.
Following an application made by Shareholders
representing 1/5 of the paid-up share capital, which
shall be submitted to the Company at least 5 full days
prior to the General Meeting, the Board of Directors
shall be obliged to provide the General Meeting with
information on the course of corporate affairs and
the state of the Company’s assets. The Board of
Directors may refuse to provide such information on
serious, substantive grounds which shall be cited in
the minutes. Such grounds may, under the
circumstances, be representation of the applicant
2 Integrated Annual Report 2016
Corporate Governance Statement
37
shareholders on the Board of Directors in line with
Article 18(3) or (6) of Law 2190/1920, where the
relevant members of the Board of Directors have
taken adequate cognizance of these matters. Any
doubts about the validity or otherwise of the reasons
for refusal to provide information may be decided by
the Single-Member Court of First Instance at the
Company’s seat.
In all the above cases where rights are exercised, the
applicant shareholders are obliged to demonstrate
that they are in fact shareholders, and the number of
shares they hold, when exercising their right. A
certificate from Hellenic Exchanges S.A. (HELEX) or
confirmation that they are shareholders by means of
the online connection between HELEX and the
Company constitute evidence for this.
Moreover, shareholders representing 1/5 of the paid-
up share capital shall be entitled to request an audit
of the Company from the Single-Member Court of
First Instance, which has jurisdiction over the area of
the Company’s registered offices, in case from the
overall course of the Company’s affairs it may be
concluded that the Company is not being
administered in accordance with the principles of
sound and prudent management laid down in
Article 40 of Codified Law 2190/1920.
Right to dividends
According to the Articles of Association, the
minimum mandatory dividend to be distributed
each year by the Company is equal to the minimum
mandatory dividend specified by law (Article 45 of
Codified Law 2190/1920), which according to Article
3 of Development Law 148/1967 is at least 35% of the
Company’s net profits, after all necessary
withholdings to establish the statutory reserve.
Dividends must be paid within two months from the
date of the Annual General Meeting approving the
Company’s annual financial statements.
The place and method of payment is announced in
notices published in the press, the Daily Price Bulletin
and both the Athens Exchange and Company
websites.
Dividends which remain unclaimed for a period of
five years from the date on which they become
payable may not be claimed and are forfeited to
the State.
Right to the product of liquidation
On completion of the liquidation, the liquidators
return the contributions of the Shareholders in
accordance with the Articles of Association and
distribute to them the balance from the liquidation of
the Company’s assets in proportion to their share in
the paid-up share capital of the Company.
Shareholders’ liability:
Shareholders’ liability is limited to the nominal value
of the shares held.
Exclusive jurisdiction of the courts – applicable law:
Each Shareholder, regardless of where he or she
resides, is – in dealings with the Company – deemed
to have the location of the registered offices of the
Company as his/her legal place of residence, and is
subject to Greek Law. Any dispute between the
Company and the Shareholders or any third party is
to be resolved by recourse to the Ordinary Courts;
legal actions may be brought against the Company
only before the Courts of Athens.
Shareholder information and services
Shareholder relations and the provision of
information to shareholders have been assigned to
the following departments:
• Investor relations department
The Investor Relations Department is responsible for
monitoring Company relations with its Shareholders
and investors, and for ensuring that information is
provided to investors and financial analysts in
Greece and abroad on an equal footing in good
time and that such information is up-to-date. The aim
is to generate long-term relationships with the
investment community and retain the high level of
trust that investors have in the Group.
Investor Relations Senior Officer: Mrs. Afroditi Sylla,
22a Halkidos St., GR-11143, Athens Tel: 0030 210-
2591163, Fax: 0030 210-2591106, e-mail: [email protected].
• Shareholder services department
This Department is responsible for providing timely
information to shareholders and for facilitating them
when exercising the rights granted to them by the
law and Articles of Association of the Company.
Shareholder Services Manager: Ms. Nitsa Kalesi, 22a
Halkidos St., GR 11143, Athens, Tel: 0030 210-2591257,
Fax: 0030 210-2591238, e-mail: [email protected]
• Corporate announcements department
This Department is responsible for communications
between the Company and the Hellenic Capital
Market Commission and the Athens Exchange,
Company compliance with the obligations set forth
in Laws 4443/2016 and 3556/2007, compliance with
the relevant decisions of the Hellenic Capital Market
Commission and for sending published Company
reports to all competent authorities and the media.
The Company’s website address is: www.titan-
cement.com
Reuters code: TTNr.AT, TTNm.AT
Bloomberg code: TITK GA, TITP GA.
3 Integrated Annual Report 2016
Explanatory Report of the Board of Directors
38
Explanatory Report of the Board of Directors (Pursuant to article 4 paragraph 7 of Law 3556/2007)
1. Structure of the Company’s share capital
The Company’s share capital amounts to euro
€338,530,112, and is divided into €84,632,528 shares
with a nominal value of €4 each, of which
€77,063,568 are common shares representing
91.057% of the total share capital and €7,568,960 are
preferred shares without voting rights, representing
approximately 8.943%, of the total share capital.
All shares are registered and listed for trading in the
Securities Market of the Athens Exchange (under
“Large Cap” classification).
Each share carries all the rights and obligations set
out in law and in the Articles of Association of the
Company. Ownership of a share automatically
signifies acceptance of the Articles of Association of
the Company and of the decisions made in
accordance with those by the various corporate
bodies.
Each common share grants the holder one vote. The
preferred shares carry no voting rights.
In accordance with the resolution dated 27.06.90 of
the Ordinary General Meeting of Shareholders of the
Company, on the basis of which an increase in the
share capital of the Company through the issuance
of preferred non-voting shares had been decided,
the privileges conferred to holders of preferred non-
voting shares were as follows:
A. Receipt, in priority to common shares, of a first
dividend from the profits of each financial year;
in the event of non-distribution of dividend or of
distribution of a dividend lower than the first
dividend, in one or more financial years, holders
of preferred shares would be entitled to a
preferential payment of this first dividend
cumulatively and corresponding to the financial
years in question, from the profits of subsequent
years. Holders of preferred non-voting shares
would be entitled, on equal terms with holders of
common shares, to receive any additional
dividend which would be distributed in any form.
However, it is worth noting that after the
amendment by virtue of article 79 section 8 of
Law 3604/2007, of the provisions of article 45
section 2 of Law 2190/1920 governing the
distribution of profit, the mandatory distribution
of a first minimum dividend equal to 6% of the
paid up share capital has been abolished and
companies are obliged to distribute annually
35% of their net profit. Consequently, the above
privilege of receipt of a first dividend by the
holders of preferred non-voting shares has
thereafter become redundant.
B. Preferential return of the capital paid up by
holders of preferred non-voting shares from the
product of the liquidation of Company assets in
the event of the Company being dissolved.
Holders of preferred non-voting shares will share
on a pro rata basis the liquidation proceeds with
holders of common stock, if the proceeds in
question are higher than the total paid-up share
capital.
The liability of the shareholders is limited to the
nominal value of the shares they hold.
2. Restrictions on transfer of Company shares
The Company shares are freely negotiable on the
Athens Stock Exchange and are transferred as
provided by law. The Articles of Association of the
Company do not include any restrictions on the
transfer of shares.
3. Significant direct or indirect holdings in the sense
of articles 9 to 11 of Law 3556/2007
On 31 December 2016 the following shareholders
held more than 5% of the total voting rights in the
Company including voting rights relating to shares
which are co-owned by some of them and are held
in a joint investment account:
“E.D.Y.V.E.M. Hellenic Construction Materials,
Industrial, Commercial Transportation Public
Company Limited”, holding 11.03% of the total
voting rights in the Company;
Mr. Andreas L. Canellopoulos, holding 10.72% of
the total voting rights in the Company;
The “Paul and Alexandra Canellopoulos
Foundation” holding 9.96% of the total voting
rights in the Company; and
Mr. Leonidas A. Canellopoulos, holding 6.25% of
the total voting rights in the Company.
TITAN Cement Company S.A., holding 5.02% of
the voting rights in the Company. These shares
are treasury stock and, therefore, their voting
rights are suspended.
FMR LLC (Fidelity), holding 5% of the voting rights
in the Company
On 22 March 2017 the shareholders who held more
than 5% of the total voting rights in the Company
were as above.
4. Shares conferring special control rights
None of the Company shares carry any special rights
of control.
5. Restrictions on voting rights
With the exception of the preferred non-voting
shares, the Articles of Association of the Company
contain no restrictions on voting rights.
3 Integrated Annual Report 2016
Explanatory Report of the Board of Directors
39
6. Agreements between shareholders of the
Company, which are known to the Company and
contain restrictions on the transfer of shares or on the
exercise of voting rights
It is known to the Company that the Statutes of
“E.D.Y.V.E.M. Hellenic Construction Materials,
Industrial, Commercial Transportation Public
Company Limited” of Nicosia - Cyprus, holding in
total 8,498,847 common Company shares, which
represent 11.03% of the total voting rights in the
Company and which have been contributed to it
(E.D.Y.V.E.M.) by the Company Directors Messrs.
Andreas Canellopoulos, Dimitri Papalexopoulos,
Nellos Canellopoulos, Alexandra Papalexopoulou-
Benopoulou, Panagiotis (Takis) Canellopoulos and
other Company shareholders, include restrictions on
the transfer of the Company (TITAN Cement
Company S.A.) shares held by it.
7. Rules for the appointment and substitution of
Directors and for the amendment of the Articles of
Association, which deviate from the provisions of
Codified Law 2190/1920
The Company’s Articles of Association (article 25),
within the powers vested by Codified Law 2190/1920
as it is now in force, provide the following regarding
the appointment and substitution of its Directors:
a. The Board of Directors may elect Directors to
replace any of its members who have resigned,
are deceased or lost their status in any other
way, provided that the replacement of the
aforementioned Directors is not possible by
substitute Directors elected by the General
Meeting. The above-mentioned election by the
Board of Directors is effected by a decision of at
least seven of the remaining Directors and is valid
for the remaining term of office of the Director
being replaced.
b. The remaining Directors may continue to
manage and represent the Company even if the
missing Directors are not replaced as per the
previous paragraph, provided that they are
more than half the number of Directors prior to
the occurrence of the above-mentioned events.
c. In any case, the remaining Directors, irrespective
of their number, may convoke the General
Meeting for the sole purpose of electing a new
Board of Directors.
The provisions of the Company’s Articles of
Association regarding the amendment of their own
provisions do not deviate from the provisions of
Codified Law 2190/1920.
8. Competence of the Board of Directors or of the
appointed members thereof for the issuing of new
shares or the repurchase of shares/share buy-back
of the Company pursuant to article 16 of Codified
Law 2190/1920
According to the provisions of article 6 par. 3 of the
Company’s Articles of Association, the General
Meeting may, by a resolution passed by the
extraordinary quorum and majority of article 20 of
the Articles of Association, delegate to the Board of
Directors the power to increase the share capital by
a decision of its own, pursuant to the provisions of
article 13, par. 1, subparagraph (c) of Codified Law
2190/1920 and without prejudice to par. 4 of the
same article.
Also, according to the provisions of article 13, par. 13
of Codified Law 2190/1920, by a resolution of the
General Meeting passed under an increased
quorum and majority in accordance with the
provisions of paragraphs 3 and 4 of article 29 and of
paragraph 2 of article 31 of Codified Law 2190/1920,
a program can be established for the offering of
shares to the Directors and to the Company’s
personnel, as well as to personnel of affiliated
companies, in the form of stock options, in
accordance with the specific terms of such
resolution, a summary of which is subject to the
publication formalities of article 7b of Codified Law
2190/1920. The par value of the shares offered may
not exceed, in total, one tenth (1/10) of the paid-up
capital on the date of the resolution of the General
Meeting. The Board of Directors issues a decision
regarding every other related detail, which is not
otherwise regulated by the General Meeting and,
depending on the number of security-holders who
have exercised their options, the Board of Directors
decides on the corresponding increase of the
Company’s share capital and on the issuing of new
shares.
According to the provisions of article 16 of Codified
Law 2190/1920, subject to prior approval by the
General Meeting, the Company may acquire its own
shares, under the responsibility of the Board of
Directors, provided that the par value of the shares
acquired, including the shares previously acquired
and still held by the Company, does not exceed one
tenth (1/10) of its paid-up share capital. The
resolution of the General Meeting must also
determine the terms and conditions of the
acquisitions, the maximum number of shares that
may be acquired, the duration of the period for
which the authorization is given, which may not
exceed 24 months, and, in the case of acquisition for
value, the maximum and minimum consideration.
In line with the above provisions, the General
Meeting of Shareholders by virtue of its decision
dated 17.6.2016, has approved the share buy-back
of common and preferred treasury shares by the
Company in accordance with article 16 paragraph
1 of Law 2190/1920. More specifically, the General
Meeting of Shareholders has approved the share
buy–back of up to 10% of the Company’s paid up
share capital, within a 24 month period, namely from
18 June 2016 until 17 June 2018, at a maximum
purchase price of €40 per share and at a minimum
3 Integrated Annual Report 2016
Explanatory Report of the Board of Directors
40
purchase price equal to the nominal value of the
Company share, namely €4 per share, provided that
the Board of Directors considers such share buy-back
to be beneficial compared to any other available
investment opportunity and provided that the
Company has sufficient liquidity.
To date, in implementation of the abovementioned
resolution of the General Meeting dated 17 June
2016, the Company has bought back 1,303,641
treasury shares (1,219,658 common shares and
83,983 preferred shares without voting rights).
On 22.3.2017, the total number of own shares held by
the Company in implementation of the above
resolution of the General Meeting of Shareholders
dated 17.6.2016 as well as of relevant past resolutions
of the General Meeting of Shareholders amounts to
3,871,677 common shares representing 5.02% voting
rights in the Company and to 89,902 preferred shares
without voting rights. The total number of own shares
( 3,961,579) currently held by the Company represent
in total 4.68%, of the Company’s paid up share
capital.
9. Significant agreements put in force, amended or
terminated in the event of a change in the control of
the Company, following a public offer
The Company has no agreements which become
effective, are amended or terminated in the event
of a change in the control of the Company
specifically following a public offer.
It should be noted, though, that there are loan and
other agreements in place, which provide, as it is
common in such agreements, the right of the
counterparty, lending bank or bond holder, to
request, under certain conditions, the early
repayment of the loan or bond or their exit from the
Group companies where they participate, as the
case may be, in the event of a change of control in
the Company. However, this right is not granted
specifically in case the change of control in the
Company results from a public offer.
The most significant agreements which include a
change of control clause are the following:
a. A Multicurrency Revolving Facility Agreement up
to the amount of €300 million entered into
among the Group’s subsidiary TITAN Global
Finance PLC, a syndicate of lending banks and
the Company as Guarantor;
b. A euro Bond issue of a nominal amount of €300
million (on 31 December 2016 €287.17 million
outstanding), issued by the TITAN Global Finance
PLC and guaranteed by the Company
c. A euro Bond issue of a nominal amount of €300
million (on 31 December 2016 €300 million
outstanding), issued by the TITAN Global Finance
PLC and guaranteed by the Company
d. A Revolving Facility Agreement up to the
amount of USD 50 million entered into among the
Group’s subsidiary TITAN America LLC, HSBC and
the Company as Guarantor;
e. A Revolving Committed Facility Agreement up
to the amount of USD 15 million entered into
among the Group’s subsidiary TITAN America
LLC, Wells Fargo and the Company as
Guarantor;
f. A Revolving Facility Agreement for an amount
up to Egyptian Pounds 670 million entered into
among the Group’s subsidiary Beni Suef Cement
Company S.A., a syndicate of lending banks and
the Company as Guarantor;
g. A Revolving Committed Facility Agreement for
an amount up to Egyptian Pounds 150 million
entered into among the Group’s subsidiary
Alexandria Portland Cement Company S.A.,
HSBC Egypt and the Company as Guarantor;
h. A Shareholders’ Agreement entered into among
TITAN Egyptian Investments Limited, Alexandria
Development Limited, TITAN Cement Company
S.A. and International Finance Corporation (IFC)
relating to the purchase by the latter of a
minority interest in TITAN’s investments in Egypt
and
i. A Shareholders’ Agreement entered into among
TITAN Cement Cyprus Limited, Aemos Cement
Limited, TITAN Cement Company S.A. and
International Finance Corporation (IFC) relating
to the purchase by the latter of a minority interest
in TITAN’s investments in Serbia, FYROM and
Kosovo.
10. Significant agreements with members of the
Board of Directors or employees of the Company
The Company has no significant agreements with
members of the Board of Directors or its employees
with regard to the payment of compensation,
especially in the case of resignation or dismissal
without good reason or termination of their period of
office or employment due to a public offer.
4 Integrated Annual Report 2016
Statement of Members of the Board of Directors
41
Statement of Members of the Board of Directors (In accordance with article 4 par. 2 of Law 3556/2007)
We,
1. Efstratios-Georgios Arapoglou, Chairman,
2. Dimitri Papalexopoulos, Chief Executive Officer and
3. Takis-Panagiotis Canellopoulos, Director, as designated by the Board of Directors
hereby declare that, to the best of our knowledge:
A. the enclosed Financial Statements of TITAN Cement Company S.A. for the period of 1 January 2016 to 31
December 2016 which have been drawn up in accordance with the applicable accounting standards,
reflect in a true manner the assets and liabilities, equity and results of TITAN Cement Company S.A. as well
as of the businesses included in the Group consolidation taken as a whole.
B. the enclosed Report of the Board of Directors reflects in a true manner the development, performance
and financial position of TITAN Cement Company S.A. as well as of the businesses included in Group
consolidation taken as a whole, including a description of the principal risks and uncertainties faced by
them.
Athens, 22 March 2017
Efstratios-Georgios Arapoglou Dimitri Papalexopoulos Takis-Panagiotis Canellopoulos
Chairman Chief Executive Officer Director
[Translation from the original text in Greek] Independent Auditor’s Report To the Shareholders of “Titan Cement Company S.A.” Report on the Audit of the Separate and Consolidated Financial Statements We have audited the accompanying separate and consolidated financial statements of “Titan Cement Company S.A.” which comprise the separate and consolidated statement of financial position as of 31 December 2016 and the separate and consolidated income statement and statement of comprehensive income, statement of changes in equity and cash flow statement for the year then ended and a summary of significant accounting policies and other explanatory information. Management’s Responsibility for the Separate and Consolidated Financial Statements
Management is responsible for the preparation and fair presentation of these separate and consolidated financial statements in accordance with International Financial Reporting Standards, as adopted by the European Union, and for such internal control as management determines is necessary to enable the preparation of separate and consolidated financial statements that are free from material misstatement, whether due to fraud or error. Auditor’s Responsibility Our responsibility is to express an opinion on these separate and consolidated financial statements based on our audit. We conducted our audit in accordance with International Standards on Auditing which have been transposed into Greek Law (GG/B’/2848/23.10.2012). Those standards require that we comply with ethical requirements and plan and perform the audit to obtain reasonable assurance about whether the separate and consolidated financial statements are free from material misstatement. An audit involves performing procedures to obtain audit evidence about the amounts and disclosures in the separate and consolidated financial statements. The procedures selected depend on the auditor's judgment, including the assessment of the risks of material misstatement of the separate and consolidated financial statements, whether due to fraud or error. In making those risk assessments, the auditor considers internal control relevant to the entity's preparation and fair presentation of the separate and consolidated financial statements in order to design audit procedures that are appropriate in the circumstances, but not for the purpose of expressing an opinion on the effectiveness of the entity's internal control. An audit also includes evaluating the appropriateness of accounting policies used and the reasonableness of accounting estimates made by management, as well as evaluating the overall presentation of the separate and consolidated financial statements. We believe that the audit evidence we have obtained is sufficient and appropriate to provide a basis for our audit opinion.
Opinion In our opinion, the separate and consolidated financial statements present fairly, in all material respects, the financial position of the “Titan Cement Company S.A.” and its subsidiaries as of December 31, 2016, and their financial performance and cash flows for the year then ended in accordance with International Financial Reporting Standards, as adopted by the European Union. Report on Other Legal and Regulatory Requirements Taking into consideration, that management is responsible for the preparation of the Board of Directors’ report and Corporate Governance Statement that is included to this report according to provisions of paragraph 5 article 2 of Law 4336/2015 (part B), we note the following: a) In the Board of Directors’ Report is included the Corporate Governance Statement that
contains the information that is required by article 43bb of Codified Law 2190/1920.
b) In our opinion, the Board of Directors’ report has been prepared in accordance with the legal requirements of articles 43a and 107A and paragraph 1 (c and d) of article 43bb of the Codified Law 2190/1920 and the content of the Board of Directors’ report is consistent with the accompanying financial statements for the year ended 31/12/2016.
c) Based on the knowledge we obtained from our audit for the Company “Titan Cement Company S.A.” and its environment, we have not identified any material misstatement to the Board of Directors report.
Αthens, 23 March 2017 The Certified Auditor Accountant
Kifissias Av. 268, 153 32 Halandri SOEL Reg. 113
Konstantinos Michalatos SOEL Reg. No 17701
6 Integrated Annual Report 2016
Financial Statements
44
Financial Statements
The Annual Financial Statements presented on pages on pages 45 to 123 both for the Group and the Parent
Company, have been approved by the Board of Directors on 22 March 2016.
.
EFSTRATIOS -GEORGIOS ATH. ARAPOGLOU DIMITRIOS TH. PAPALEXOPOULOS
Chairman of the Board of Directors Chief Executive Officer
Financial Consolidation
Senior Manager
Passport No K00215552 ID No ΑΒ291692 ID No ΑN023225
ID No AB309500 ID No ΑΚ031353
MICHAEL H. COLAKIDES GRIGORIOS D. DIKAIOS ATHANASIOS S. DANAS
Chief Financial Officer Finance Director Greece
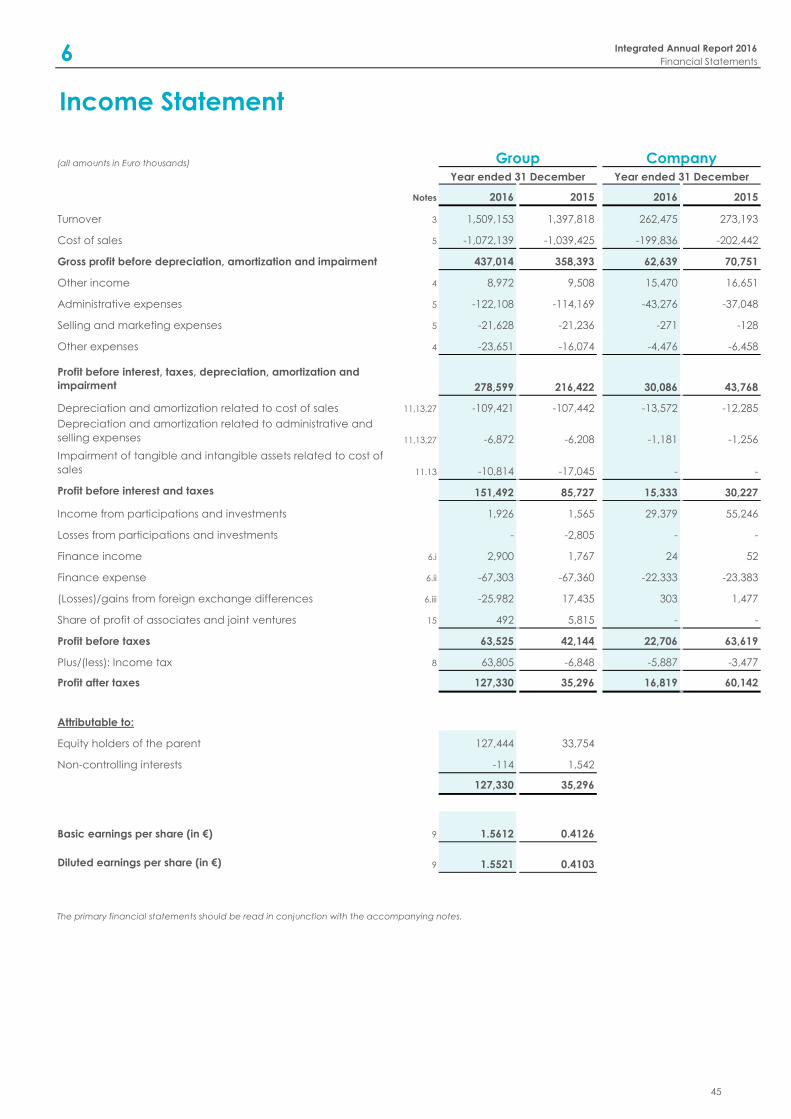
Notes 2016 2015 2016 2015
Turnover 3 1,509,153 1,397,818 262,475 273,193
Cost of sales 5 -1,072,139 -1,039,425 -199,836 -202,442
Gross profit before depreciation, amortization and impairment 437,014 358,393 62,639 70,751
Other income 4 8,972 9,508 15,470 16,651
Administrative expenses 5 -122,108 -114,169 -43,276 -37,048
Selling and marketing expenses 5 -21,628 -21,236 -271 -128
Other expenses 4 -23,651 -16,074 -4,476 -6,458
Profit before interest, taxes, depreciation, amortization and
impairment 278,599 216,422 30,086 43,768
Depreciation and amortization related to cost of sales 11,13,27 -109,421 -107,442 -13,572 -12,285
Depreciation and amortization related to administrative and
selling expenses 11,13,27 -6,872 -6,208 -1,181 -1,256
Impairment of tangible and intangible assets related to cost of
sales 11.13 -10,814 -17,045 - -
Profit before interest and taxes 151,492 85,727 15,333 30,227
Income from participations and investments 1,926 1,565 29,379 55,246
Losses from participations and investments - -2,805 - -
Finance income 6.i 2,900 1,767 24 52
Finance expense 6.ii -67,303 -67,360 -22,333 -23,383
(Losses)/gains from foreign exchange differences 6.iii -25,982 17,435 303 1,477
Share of profit of associates and joint ventures 15 492 5,815 - -
Profit before taxes 63,525 42,144 22,706 63,619
Plus/(less): Income tax 8 63,805 -6,848 -5,887 -3,477
Profit after taxes 127,330 35,296 16,819 60,142
Attributable to:
Equity holders of the parent 127,444 33,754
Non-controlling interests -114 1,542
127,330 35,296
Basic earnings per share (in €) 9 1.5612 0.4126
Diluted earnings per share (in €) 9 1.5521 0.4103
Year ended 31 December Year ended 31 December
The primary financial statements should be read in conjunction with the accompanying notes.
Income Statement
Group Company(all amounts in Euro thousands)
Integrated Annual Report 2016
Financial Statements6
45
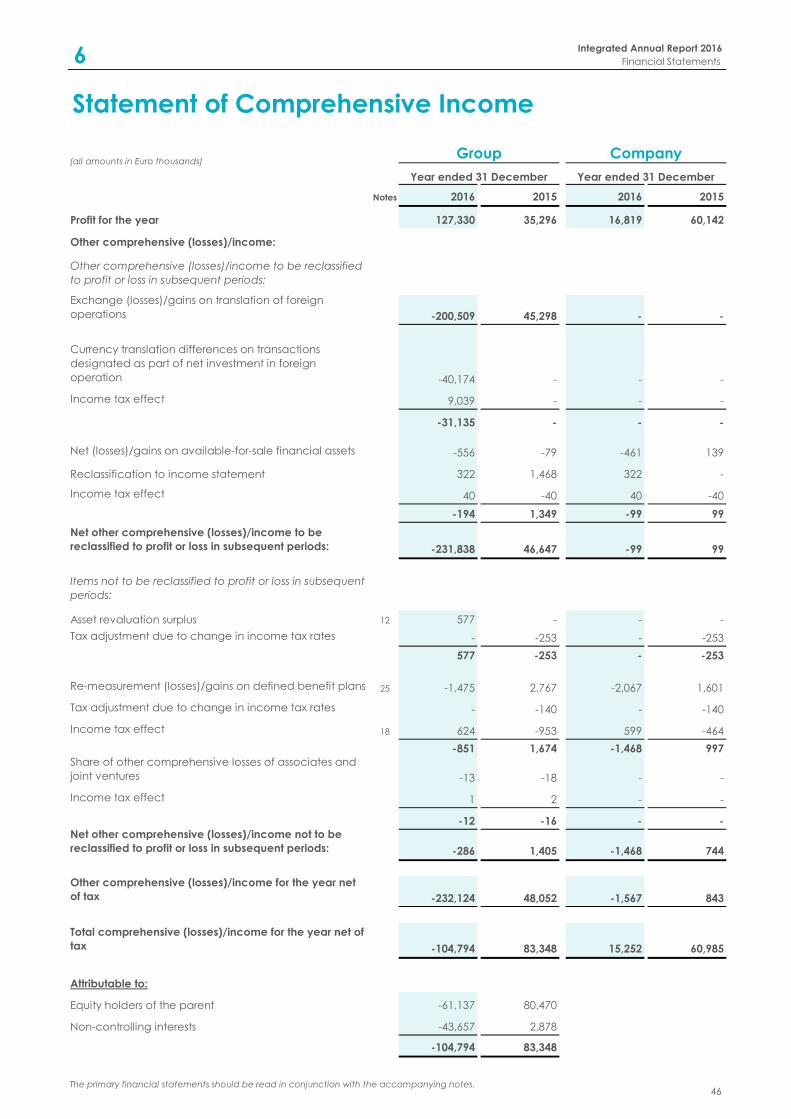
Notes 2016 2015 2016 2015
Profit for the year 127,330 35,296 16,819 60,142
Other comprehensive (losses)/income:
Other comprehensive (losses)/income to be reclassified
to profit or loss in subsequent periods:
Exchange (losses)/gains on translation of foreign
operations -200,509 45,298 - -
Currency translation differences on transactions
designated as part of net investment in foreign
operation -40,174 - - -
Income tax effect 9,039 - - -
-31,135 - - -
Net (losses)/gains on available-for-sale financial assets -556 -79 -461 139
Reclassification to income statement 322 1,468 322 -
Income tax effect 40 -40 40 -40
-194 1,349 -99 99
Net other comprehensive (losses)/income to be
reclassified to profit or loss in subsequent periods: -231,838 46,647 -99 99
Items not to be reclassified to profit or loss in subsequent
periods:
Asset revaluation surplus 12 577 - - -
Tax adjustment due to change in income tax rates - -253 - -253
577 -253 - -253
Re-measurement (losses)/gains on defined benefit plans 25 -1,475 2,767 -2,067 1,601
Tax adjustment due to change in income tax rates - -140 - -140
Income tax effect 18 624 -953 599 -464
-851 1,674 -1,468 997
Share of other comprehensive losses of associates and
joint ventures -13 -18 - -
Income tax effect 1 2 - -
-12 -16 - -
Net other comprehensive (losses)/income not to be
reclassified to profit or loss in subsequent periods: -286 1,405 -1,468 744
Other comprehensive (losses)/income for the year net
of tax -232,124 48,052 -1,567 843
Total comprehensive (losses)/income for the year net of
tax -104,794 83,348 15,252 60,985
Attributable to:
Equity holders of the parent -61,137 80,470
Non-controlling interests -43,657 2,878
-104,794 83,348
Year ended 31 December Year ended 31 December
The primary financial statements should be read in conjunction with the accompanying notes.
Statement of Comprehensive Income
Group Company(all amounts in Euro thousands)
Integrated Annual Report 2016
Financial Statements6
46
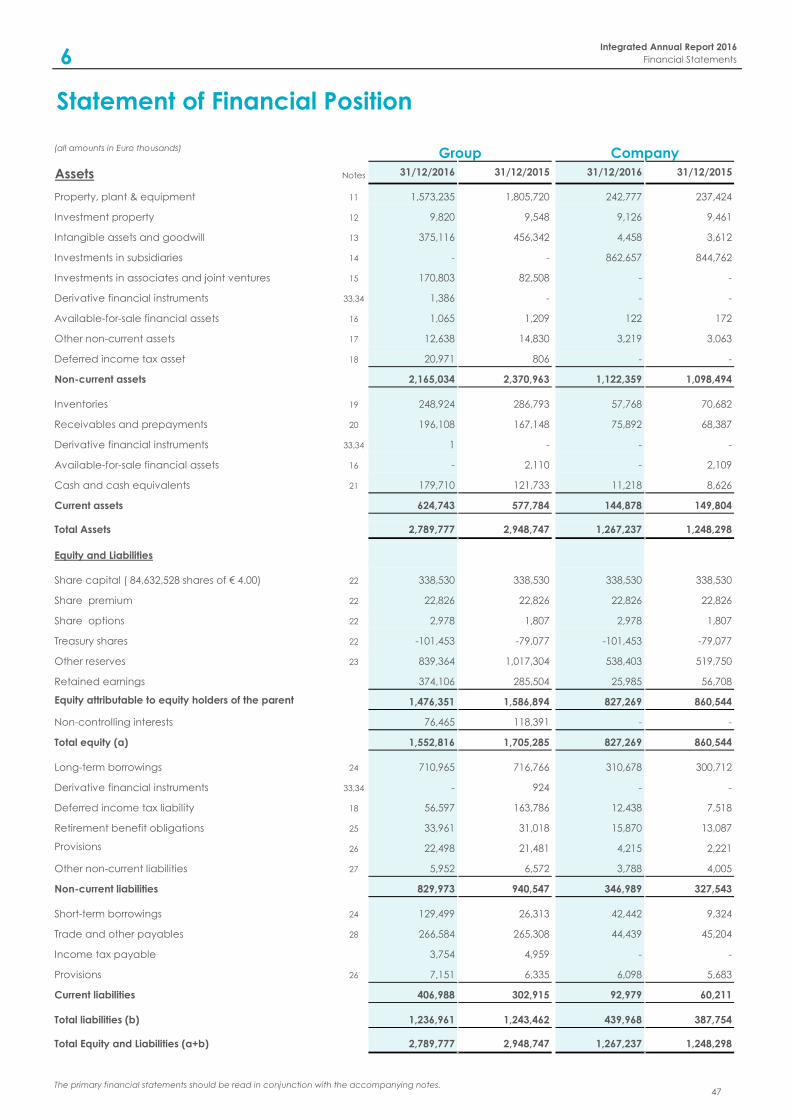
(all amounts in Euro thousands)
Assets Notes 31/12/2016 31/12/2015 31/12/2016 31/12/2015
Property, plant & equipment 11 1,573,235 1,805,720 242,777 237,424
Investment property 12 9,820 9,548 9,126 9,461
Intangible assets and goodwill 13 375,116 456,342 4,458 3,612
Investments in subsidiaries 14 - - 862,657 844,762
Investments in associates and joint ventures 15 170,803 82,508 - -
Derivative financial instruments 33,34 1,386 - - -
Available-for-sale financial assets 16 1,065 1,209 122 172
Other non-current assets 17 12,638 14,830 3,219 3,063
Deferred income tax asset 18 20,971 806 - -
Non-current assets 2,165,034 2,370,963 1,122,359 1,098,494
Inventories 19 248,924 286,793 57,768 70,682
Receivables and prepayments 20 196,108 167,148 75,892 68,387
Derivative financial instruments 33,34 1 - - -
Available-for-sale financial assets 16 - 2,110 - 2,109
Cash and cash equivalents 21 179,710 121,733 11,218 8,626
Current assets 624,743 577,784 144,878 149,804
Total Assets 2,789,777 2,948,747 1,267,237 1,248,298
Equity and Liabilities
Share capital ( 84,632,528 shares of € 4.00) 22 338,530 338,530 338,530 338,530
Share premium 22 22,826 22,826 22,826 22,826
Share options 22 2,978 1,807 2,978 1,807
Treasury shares 22 -101,453 -79,077 -101,453 -79,077
Other reserves 23 839,364 1,017,304 538,403 519,750
Retained earnings 374,106 285,504 25,985 56,708
Equity attributable to equity holders of the parent 1,476,351 1,586,894 827,269 860,544
Non-controlling interests 76,465 118,391 - -
Total equity (a) 1,552,816 1,705,285 827,269 860,544
Long-term borrowings 24 710,965 716,766 310,678 300,712
Derivative financial instruments 33,34 - 924 - -
Deferred income tax liability 18 56,597 163,786 12,438 7,518
Retirement benefit obligations 25 33,961 31,018 15,870 13,087
Provisions 26 22,498 21,481 4,215 2,221
Other non-current liabilities 27 5,952 6,572 3,788 4,005
Non-current liabilities 829,973 940,547 346,989 327,543
Short-term borrowings 24 129,499 26,313 42,442 9,324
Trade and other payables 28 266,584 265,308 44,439 45,204
Income tax payable 3,754 4,959 - -
Provisions 26 7,151 6,335 6,098 5,683
Current liabilities 406,988 302,915 92,979 60,211
Total liabilities (b) 1,236,961 1,243,462 439,968 387,754
Total Equity and Liabilities (a+b) 2,789,777 2,948,747 1,267,237 1,248,298
The primary financial statements should be read in conjunction with the accompanying notes.
CompanyGroup
Statement of Financial Position
Integrated Annual Report 2016
Financial Statements6
47
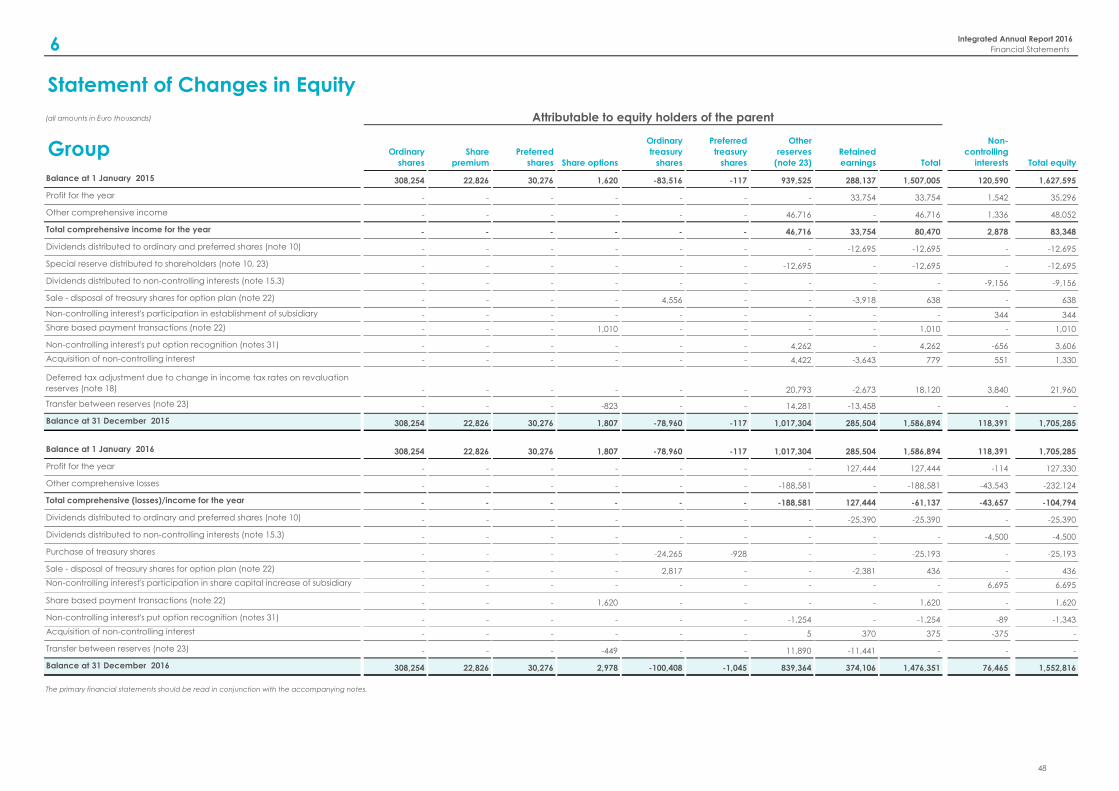
(all amounts in Euro thousands)
Group Ordinary
shares
Share
premium
Preferred
shares Share options
Ordinary
treasury
shares
Preferred
treasury
shares
Other
reserves
(note 23)
Retained
earnings Total
Non-
controlling
interests Total equity
Balance at 1 January 2015 308,254 22,826 30,276 1,620 -83,516 -117 939,525 288,137 1,507,005 120,590 1,627,595
Profit for the year - - - - - - - 33,754 33,754 1,542 35,296
Other comprehensive income - - - - - - 46,716 - 46,716 1,336 48,052
Total comprehensive income for the year - - - - - - 46,716 33,754 80,470 2,878 83,348
Dividends distributed to ordinary and preferred shares (note 10) - - - - - - - -12,695 -12,695 - -12,695
Special reserve distributed to shareholders (note 10, 23) - - - - - - -12,695 - -12,695 - -12,695
Dividends distributed to non-controlling interests (note 15.3) - - - - - - - - - -9,156 -9,156
Sale - disposal of treasury shares for option plan (note 22) - - - - 4,556 - - -3,918 638 - 638
Non-controlling interest's participation in establishment of subsidiary - - - - - - - - - 344 344
Share based payment transactions (note 22) - - - 1,010 - - - - 1,010 - 1,010
Non-controlling interest's put option recognition (notes 31) - - - - - - 4,262 - 4,262 -656 3,606
Acquisition of non-controlling interest - - - - - - 4,422 -3,643 779 551 1,330
Deferred tax adjustment due to change in income tax rates on revaluation
reserves (note 18) - - - - - - 20,793 -2,673 18,120 3,840 21,960
Transfer between reserves (note 23) - - - -823 - - 14,281 -13,458 - - -
Balance at 31 December 2015 308,254 22,826 30,276 1,807 -78,960 -117 1,017,304 285,504 1,586,894 118,391 1,705,285
- - - - - - - - -
Balance at 1 January 2016 308,254 22,826 30,276 1,807 -78,960 -117 1,017,304 285,504 1,586,894 118,391 1,705,285
Profit for the year - - - - - - - 127,444 127,444 -114 127,330
Other comprehensive losses - - - - - - -188,581 - -188,581 -43,543 -232,124
Total comprehensive (losses)/income for the year - - - - - - -188,581 127,444 -61,137 -43,657 -104,794
Dividends distributed to ordinary and preferred shares (note 10) - - - - - - - -25,390 -25,390 - -25,390
Dividends distributed to non-controlling interests (note 15.3) - - - - - - - - - -4,500 -4,500
Purchase of treasury shares - - - - -24,265 -928 - - -25,193 - -25,193
Sale - disposal of treasury shares for option plan (note 22) - - - - 2,817 - - -2,381 436 - 436
Non-controlling interest's participation in share capital increase of subsidiary - - - - - - - - - 6,695 6,695
Share based payment transactions (note 22) - - - 1,620 - - - - 1,620 - 1,620
Non-controlling interest's put option recognition (notes 31) - - - - - - -1,254 - -1,254 -89 -1,343
Acquisition of non-controlling interest - - - - - - 5 370 375 -375 -
Transfer between reserves (note 23) - - - -449 - - 11,890 -11,441 - - -
Balance at 31 December 2016 308,254 22,826 30,276 2,978 -100,408 -1,045 839,364 374,106 1,476,351 76,465 1,552,816
The primary financial statements should be read in conjunction with the accompanying notes.
Statement of Changes in Equity
Attributable to equity holders of the parent
6 Integrated Annual Report 2016
Financial Statements
48
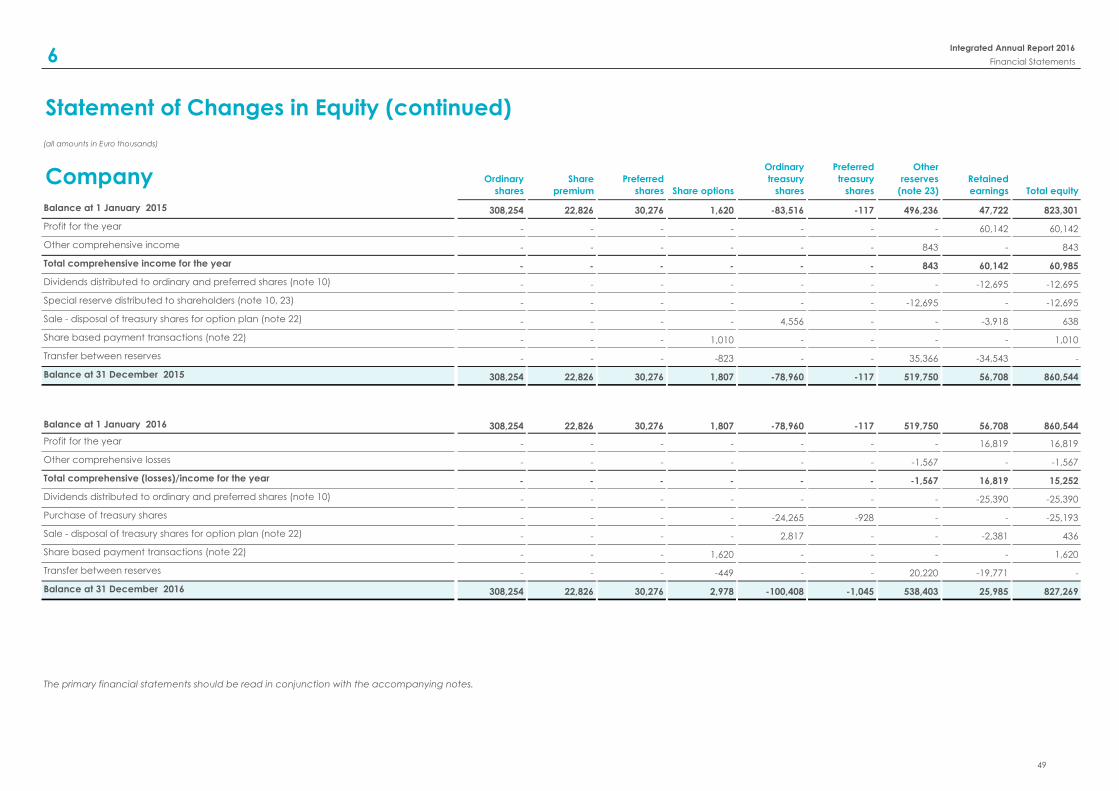
(all amounts in Euro thousands)
Company Ordinary
shares
Share
premium
Preferred
shares Share options
Ordinary
treasury
shares
Preferred
treasury
shares
Other
reserves
(note 23)
Retained
earnings Total equity
Balance at 1 January 2015 308,254 22,826 30,276 1,620 -83,516 -117 496,236 47,722 823,301
Profit for the year - - - - - - - 60,142 60,142
Other comprehensive income - - - - - - 843 - 843
Total comprehensive income for the year - - - - - - 843 60,142 60,985
Dividends distributed to ordinary and preferred shares (note 10) - - - - - - - -12,695 -12,695
Special reserve distributed to shareholders (note 10, 23) - - - - - - -12,695 - -12,695
Sale - disposal of treasury shares for option plan (note 22) - - - - 4,556 - - -3,918 638
Share based payment transactions (note 22) - - - 1,010 - - - - 1,010
Transfer between reserves - - - -823 - - 35,366 -34,543 -
Balance at 31 December 2015 308,254 22,826 30,276 1,807 -78,960 -117 519,750 56,708 860,544
- - - - - - -
Balance at 1 January 2016 308,254 22,826 30,276 1,807 -78,960 -117 519,750 56,708 860,544
Profit for the year - - - - - - - 16,819 16,819
Other comprehensive losses - - - - - - -1,567 - -1,567
Total comprehensive (losses)/income for the year - - - - - - -1,567 16,819 15,252
Dividends distributed to ordinary and preferred shares (note 10) - - - - - - - -25,390 -25,390
Purchase of treasury shares - - - - -24,265 -928 - - -25,193
Sale - disposal of treasury shares for option plan (note 22) - - - - 2,817 - - -2,381 436
Share based payment transactions (note 22) - - - 1,620 - - - - 1,620
Transfer between reserves - - - -449 - - 20,220 -19,771 -
Balance at 31 December 2016 308,254 22,826 30,276 2,978 -100,408 -1,045 538,403 25,985 827,269
Statement of Changes in Equity (continued)
The primary financial statements should be read in conjunction with the accompanying notes.
Integrated Annual Report 2016
Financial Statements6
49
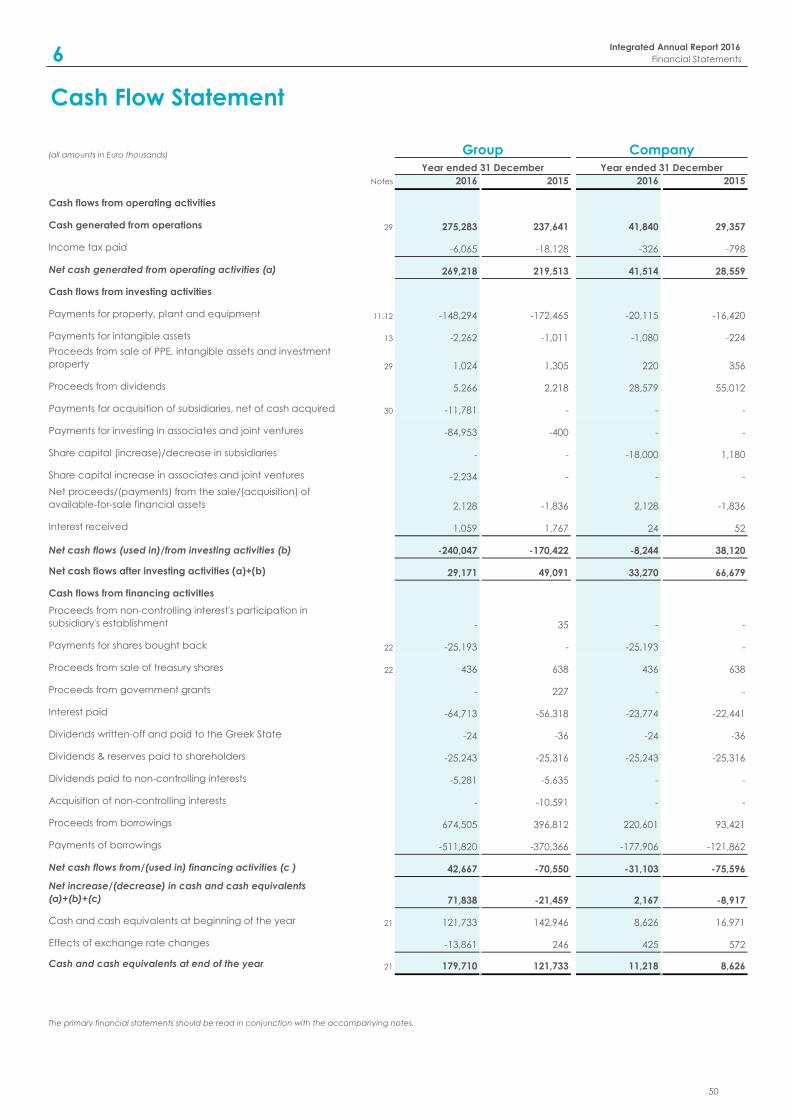
Notes 2016 2015 2016 2015
Cash flows from operating activities
Cash generated from operations 29 275,283 237,641 41,840 29,357
Income tax paid -6,065 -18,128 -326 -798
Net cash generated from operating activities (a) 269,218 219,513 41,514 28,559
Cash flows from investing activities
Payments for property, plant and equipment 11.12 -148,294 -172,465 -20,115 -16,420
Payments for intangible assets 13 -2,262 -1,011 -1,080 -224
Proceeds from sale of PPE, intangible assets and investment
property 29 1,024 1,305 220 356
Proceeds from dividends 5,266 2,218 28,579 55,012
Payments for acquisition of subsidiaries, net of cash acquired 30 -11,781 - - -
Payments for investing in associates and joint ventures -84,953 -400 - -
Share capital (increase)/decrease in subsidiaries - - -18,000 1,180
Share capital increase in associates and joint ventures -2,234 - - -
Net proceeds/(payments) from the sale/(acquisition) of
available-for-sale financial assets 2,128 -1,836 2,128 -1,836
Interest received 1,059 1,767 24 52
-240,047 -170,422 -8,244 38,120
Net cash flows after investing activities (a)+(b) 29,171 49,091 33,270 66,679
Cash flows from financing activities
Proceeds from non-controlling interest's participation in
subsidiary's establishment - 35 - -
Payments for shares bought back 22 -25,193 - -25,193 -
Proceeds from sale of treasury shares 22 436 638 436 638
Proceeds from government grants - 227 - -
Interest paid -64,713 -56,318 -23,774 -22,441
Dividends written-off and paid to the Greek State -24 -36 -24 -36
Dividends & reserves paid to shareholders -25,243 -25,316 -25,243 -25,316
Dividends paid to non-controlling interests -5,281 -5,635 - -
Acquisition of non-controlling interests - -10,591 - -
Proceeds from borrowings 674,505 396,812 220,601 93,421
Payments of borrowings -511,820 -370,366 -177,906 -121,862
Net cash flows from/(used in) financing activities (c ) 42,667 -70,550 -31,103 -75,596
Net increase/(decrease) in cash and cash equivalents
(a)+(b)+(c) 71,838 -21,459 2,167 -8,917
Cash and cash equivalents at beginning of the year 21 121,733 142,946 8,626 16,971
Effects of exchange rate changes -13,861 246 425 572
Cash and cash equivalents at end of the year 21 179,710 121,733 11,218 8,626
CompanyGroup
Cash Flow Statement
The primary financial statements should be read in conjunction with the accompanying notes.
Year ended 31 December Year ended 31 December
Net cash flows (used in)/from investing activities (b)
(all amounts in Euro thousands)
Integrated Annual Report 2016
Financial Statements6
50
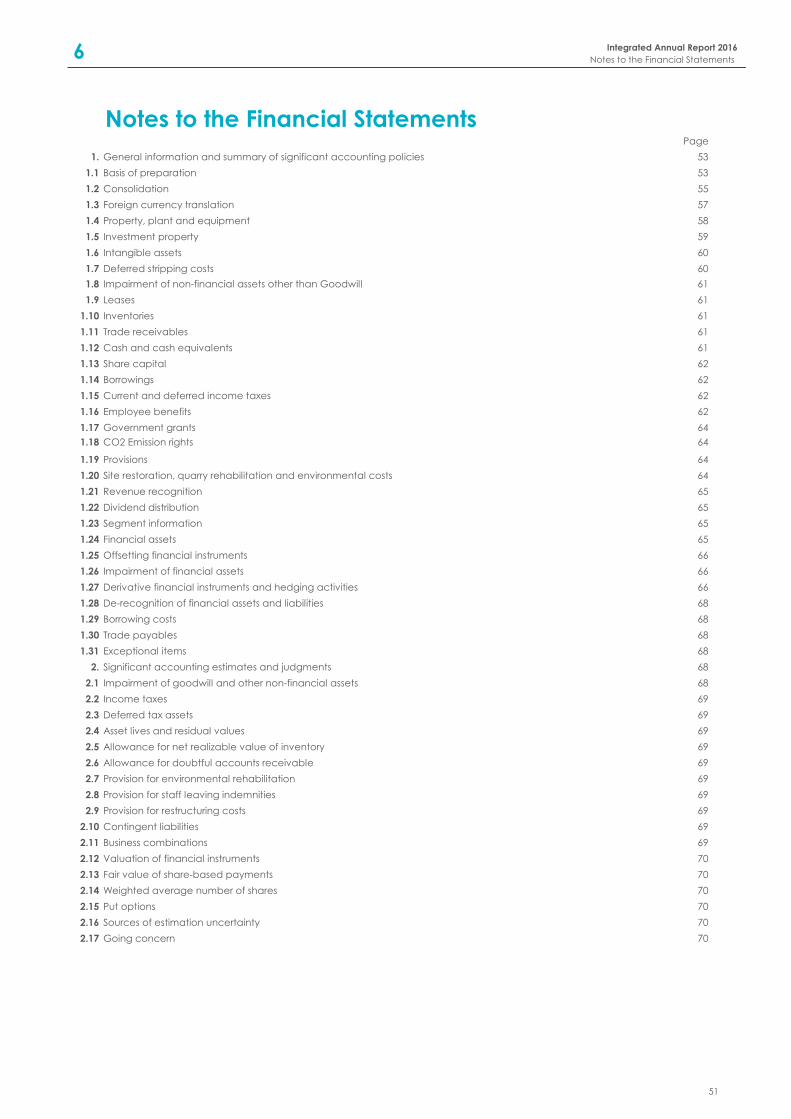
Notes to the Financial StatementsPage
1. General information and summary of significant accounting policies 53
1.1 Basis of preparation 53
1.2 Consolidation 55
1.3 Foreign currency translation 57
1.4 Property, plant and equipment 58
1.5 Investment property 59
1.6 Intangible assets 60
1.7 Deferred stripping costs 60
1.8 Impairment of non-financial assets other than Goodwill 61
1.9 Leases 61
1.10 Inventories 61
1.11 Trade receivables 61
1.12 Cash and cash equivalents 61
1.13 Share capital 62
1.14 Borrowings 62
1.15 Current and deferred income taxes 62
1.16 Employee benefits 62
1.17 Government grants 64
1.18 CO2 Emission rights 64
1.19 Provisions 64
1.20 Site restoration, quarry rehabilitation and environmental costs 64
1.21 Revenue recognition 65
1.22 Dividend distribution 65
1.23 Segment information 65
1.24 Financial assets 65
1.25 Offsetting financial instruments 66
1.26 Impairment of financial assets 66
1.27 Derivative financial instruments and hedging activities 66
1.28 De-recognition of financial assets and liabilities 68
1.29 Borrowing costs 68
1.30 Trade payables 68
1.31 Exceptional items 68
2. Significant accounting estimates and judgments 68
2.1 Impairment of goodwill and other non-financial assets 68
2.2 Income taxes 69
2.3 Deferred tax assets 69
2.4 Asset lives and residual values 69
2.5 Allowance for net realizable value of inventory 69
2.6 Allowance for doubtful accounts receivable 69
2.7 Provision for environmental rehabilitation 69
2.8 Provision for staff leaving indemnities 69
2.9 Provision for restructuring costs 69
2.10 Contingent liabilities 69
2.11 Business combinations 69
2.12 Valuation of financial instruments 70
2.13 Fair value of share-based payments 70
2.14 Weighted average number of shares 70
2.15 Put options 70
2.16 Sources of estimation uncertainty 70
2.17 Going concern 70
Integrated Annual Report 2016
Notes to the Financial Statements6
51
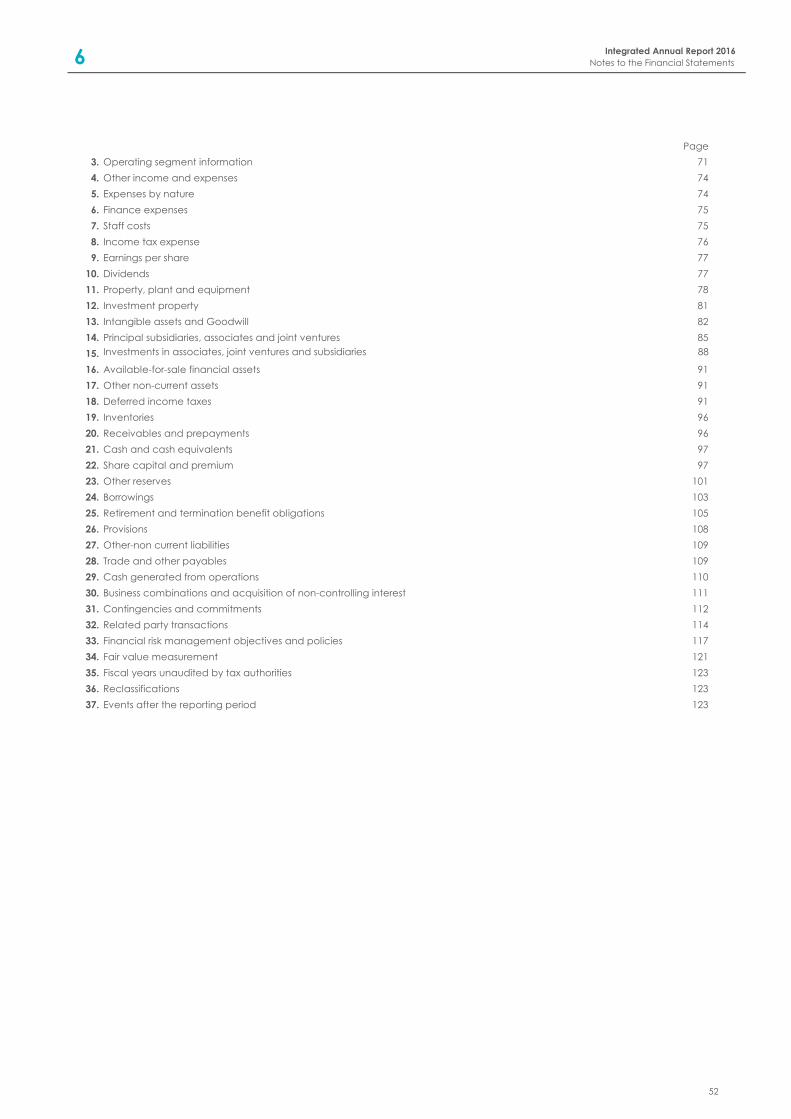
Page
3. Operating segment information 71
4. Other income and expenses 74
5. Expenses by nature 74
6. Finance expenses 75
7. Staff costs 75
8. Income tax expense 76
9. Earnings per share 77
10. Dividends 77
11. Property, plant and equipment 78
12. Investment property 81
13. Intangible assets and Goodwill 82
14. Principal subsidiaries, associates and joint ventures 85
15. Investments in associates, joint ventures and subsidiaries 88
16. Available-for-sale financial assets 91
17. Other non-current assets 91
18. Deferred income taxes 91
19. Inventories 96
20. Receivables and prepayments 96
21. Cash and cash equivalents 97
22. Share capital and premium 97
23. Other reserves 101
24. Borrowings 103
25. Retirement and termination benefit obligations 105
26. Provisions 108
27. Other-non current liabilities 109
28. Trade and other payables 109
29. Cash generated from operations 110
30. Business combinations and acquisition of non-controlling interest 111
31. Contingencies and commitments 112
32. Related party transactions 114
33. Financial risk management objectives and policies 117
34. Fair value measurement 121
35. Fiscal years unaudited by tax authorities 123
36. Reclassifications 123
37. Events after the reporting period 123
Integrated Annual Report 2016
Notes to the Financial Statements6
52
6 Integrated Annual Report 2016
Notes to the Financial Statements
53
1. General information and summary of
significant accounting policies
Titan Cement Co. S.A. (the Company) and, its
subsidiaries (collectively the Group) are engaged in
the production, trade and distribution of a wide
range of construction materials, including cement,
concrete, aggregates, cement blocks, dry mortars
and fly ash. The Group operates primarily in Greece,
the Balkans, Egypt, Turkey, the USA and Brazil.
Information on the Group’s structure is provided in
note 14. Information on other related party
relationships of the Group and the Company is
provided in note 32.
The Company is a limited liability company
incorporated and domiciled in Greece at 22A
Halkidos Street - 111 43 Athens with the registration
number in the General Electronic Commercial
Registry: 224301000 (formerly the Register of Sociétés
Anonymes Number: 6013/06/Β/86/90) and is listed
on the Athens Stock Exchange.
These annual financial statements (the financial
statements) were approved for issue by the Board
of Directors on March 22, 2017.
Summary of significant accounting policies
The principal accounting policies adopted in the
preparation of these financial statements are set
out below:
1.1 Basis of preparation
These financial statements comprise the separate
financial statement of the Company and the
consolidated financial statements of the Group.
They have been prepared in accordance with
International Financial Reporting Standards (IFRS), as
issued by the International Accounting Standards
Board (IASB) and as adopted by the European
Union and interpretations issued by the IFRS
Interpretations Committee.
These financial statements have been prepared
under the historical cost convention, as modified by
the revaluation of available-for-sale financial assets,
investment property, and derivative financial
instruments that have been measured at fair value.
The preparation of financial statements, in
conformity with IFRS, requires the use of certain
critical accounting estimates. It also requires
management to exercise its judgment in the
process of applying the accounting policies. The
areas involving a higher degree of judgment or
complexity, or areas where assumptions and
estimates are significant to the financial statements
are disclosed in Significant Accounting Estimates
and Judgments in note 2.
The financial statements have been prepared with
the same accounting policies of the prior financial
year, except for the adoption of the new or revised
standards, amendments and/or interpretations that
are mandatory for the periods beginning on or after
1 January 2016.
1.1.1 New standards, amendments to standards and
interpretations issued and effective for the current
financial year that have no significant impact on the
financial statements of the Group and the Company
IAS 19R (Amendment) “Employee Benefits”
These narrow scope amendments apply to
contributions from employees or third parties to
defined benefit plans and simplify the accounting
for contributions that are independent of the
number of years of employee service, for example,
employee contributions that are calculated
according to a fixed percentage of salary.
IFRS 11 (Amendment) “Joint Arrangements”
This amendment requires an investor to apply the
principles of business combination accounting
when it acquires an interest in a joint operation that
constitutes a ‘business’.
IAS 16 and IAS 38 (Amendments) “Clarification of
Acceptable Methods of Depreciation and
Amortisation
This amendment clarifies that the use of revenue-
based methods to calculate the depreciation of an
asset is not appropriate and it also clarifies that
revenue is generally presumed to be an
inappropriate basis for measuring the consumption
of the economic benefits embodied in an
intangible asset.
IAS 27 (Amendment) “Separate financial
statements”
This amendment allows entities to use the equity
method to account for investments in subsidiaries,
joint ventures and associates in their separate
financial statements and clarifies the definition of
separate financial statements.
IAS 1 (Amendments) “Disclosure initiative”
These amendments clarify guidance in IAS 1 on
materiality and aggregation, the presentation of
sub-totals, the structure of financial statements and
the disclosure of accounting policies.
IFRS 10, IFRS 12 and IAS 28 (Amendments)
“Investment entities: Applying the consolidation
exception”
These amendments clarify the application of the
consolidation exception for investment entities and
their subsidiaries.
Annual Improvements to IFRSs 2012
The amendments set out below describe the key
changes to certain IFRSs following the publication of
the results of the IASB’s 2010-12 cycle of the annual
improvements project.
6 Integrated Annual Report 2016
Notes to the Financial Statements
54
IFRS 2 “Share-based payment”
The amendment clarifies the definition of a ‘vesting
condition’ and separately defines ‘performance
condition’ and ‘service condition’.
IFRS 3 “Business combinations”
The amendment clarifies that an obligation to pay
contingent consideration which meets the definition
of a financial instrument is classified as a financial
liability or as equity, on the basis of the definitions in
IAS 32 “Financial instruments: Presentation”. It also
clarifies that all non-equity contingent consideration,
both financial and non-financial, is measured at fair
value through profit or loss.
IFRS 8 “Operating segments”
The amendment requires disclosure of the
judgments made by management in aggregating
operating segments.
IFRS 13 “Fair value measurement”
The amendment clarifies that the standard does not
remove the ability to measure short-term
receivables and payables at invoice amounts in
cases where the impact of not discounting is
immaterial.
IAS 16 “Property, plant and equipment” and IAS 38
“Intangible assets”
Both standards are amended to clarify how the
gross carrying amount and the accumulated
depreciation are treated where an entity uses the
revaluation model.
IAS 24 “Related party disclosures”
The standard is amended to include, as a related
party, an entity that provides key management
personnel services to the reporting entity or to the
parent of the reporting entity.
Annual Improvements to IFRSs 2014
The amendments set out below describe the key
changes to four IFRSs.
IFRS 5 “Non-current assets held for sale and
discontinued operations”
The amendment clarifies that, when an asset (or
disposal group) is reclassified from ‘held for sale’ to
‘held for distribution’, or vice versa, this does not
constitute a change to a plan of sale or distribution,
and does not have to be accounted for as such.
IFRS 7 “Financial instruments: Disclosures”
The amendment adds specific guidance to help
management determine whether the terms of an
arrangement to service a financial asset which has
been transferred constitute continuing involvement
and clarifies that the additional disclosure required
by the amendments to IFRS 7, ‘Disclosure –
Offsetting financial assets and financial liabilities’ is
not specifically required for all interim periods, unless
required by IAS 34.
IAS 19 “Employee benefits”
The amendment clarifies that, when determining
the discount rate for post-employment benefit
obligations, it is the currency that the liabilities are
denominated in that is important, and not the
country where they arise.
IAS 34 “Interim financial reporting”
The amendment clarifies what is meant by the
reference in the standard to ‘information disclosed
elsewhere in the interim financial report’.
1.1.2 New standards, amendments to standards and
interpretations issued but not yet effective nor early
adopted by the Group and the Company
IFRS 9 “Financial Instruments” and subsequent
amendments to IFRS 9 and IFRS 7 (effective for
annual periods beginning on or after 1 January
2018)
IFRS 9 replaces the guidance in IAS 39 which deals
with the classification and measurement of financial
assets and financial liabilities and it also includes an
expected credit losses model that replaces the
incurred loss impairment model used today. IFRS 9
establishes a more principle-based approach to
hedge accounting and addresses inconsistencies
and weaknesses in the current model in IAS 39. At
this stage the Group is not able to estimate the
impact of the adoption of the new standard on the
financial statements, as it has not yet finalized its
detailed assessment of the application of IFRS 9. The
Group plans to adopt the new standard on the
required effective date (1.1.2018).
IFRS 15 “Revenue from Contracts with Customers”
(effective for annual periods beginning on or after 1
January 2018)
IFRS 15 has been issued in May 2014. The objective
of the standard is to provide a single,
comprehensive revenue recognition model for all
contracts with customers to improve comparability
within industries, across industries, and across capital
markets. It contains principles that an entity will
apply to determine the measurement of revenue
and timing of when it is recognised. The underlying
principle is that an entity will recognise revenue to
depict the transfer of goods or services to customers
at an amount that the entity expects to be entitled
to in exchange for those goods or services. At this
stage, the Group is not able to estimate the impact
of the new standard on the financial statements
and it will make more detailed assessments of the
impact over the next twelve months. The Group
plans to adopt the new standard on the required
effective date (1.1.2018).
IFRS 16 “Leases” (effective for annual periods
beginning on or after 1 January 2019)
6 Integrated Annual Report 2016
Notes to the Financial Statements
55
IFRS 16 has been issued in January 2016 and
supersedes IAS 17. The objective of the standard is
to ensure the lessees and lessors provide relevant
information in a manner that faithfully represents
those transactions. IFRS 16 introduces a single lessee
accounting model and requires a lessee to
recognise assets and liabilities for all leases with a
term of more than 12 months, unless the underlying
asset is of low value. IFRS 16 substantially carries
forward the lessor accounting requirements in IAS 17.
Accordingly, a lessor continues to classify its leases
as operating leases or finance leases, and to
account for those two types of leases differently.
The Group is currently investigating the impact of
IFRS 16 on its financial statements. The standard has
not yet been endorsed by the EU.
IAS 12 (Amendments) “Recognition of Deferred Tax
Assets for Unrealised Losses” (effective for annual
periods beginning on or after 1 January 2017)
These amendments clarify the accounting for
deferred tax assets for unrealised losses on debt
instruments measured at fair value. The
amendments have not yet been endorsed by the
EU.
IAS 7 (Amendments) “Disclosure initiative” (effective
for annual periods beginning on or after 1 January
2017)
These amendments require entities to provide
disclosures that enable users of financial statements
to evaluate changes in liabilities arising from
financing activities. The amendments have not yet
been endorsed by the EU.
IFRS 2 (Amendments) “Classification and
measurement of Shared-based Payment
transactions” (effective for annual periods
beginning on or after 1 January 2018)
The amendment clarifies the measurement basis for
cash-settled, share-based payments and the
accounting for modifications that change an
award from cash-settled to equity-settled. It also
introduces an exception to the principles in IFRS 2
that will require an award to be treated as if it was
wholly equity-settled, where an employer is obliged
to withhold an amount for the employee’s tax
obligation associated with a share-based payment
and pay that amount to the tax authority. The
amendments have not yet been endorsed by the
EU.
IFRS 4 (Amendments) “Applying IFRS 9 Financial
instruments with IFRS 4 Insurance contracts”
(effective for annual periods beginning on or after 1
January 2018)
The amendments introduce two approaches. The
amended standard will: a) give all companies that
issue insurance contracts the option to recognise in
other comprehensive income, rather than profit or
loss, the volatility that could arise when IFRS 9 is
applied before the new insurance contracts
standard is issued; and b) give companies whose
activities are predominantly connected with
insurance an optional temporary exemption from
applying IFRS 9 until 2021. The entities that defer the
application of IFRS 9 will continue to apply the
existing financial instruments standard—IAS 39. The
amendments have not yet been endorsed by the
EU.
IAS 40 (Amendments) “Transfers of Investment
Property” (effective for annual periods beginning on
or after 1 January 2018)
The amendments clarified that to transfer to, or from,
investment properties there must be a change in
use. To conclude if a property has changed use
there should be an assessment of whether the
property meets the definition and the change must
be supported by evidence. The amendments have
not yet been endorsed by the EU.
IFRIC 22 “Foreign currency transactions and
advance consideration” (effective for annual
periods beginning on or after 1 January 2018)
The interpretation provides guidance on how to
determine the date of the transaction when
applying the standard on foreign currency
transactions, IAS 21. The Interpretation applies
where an entity either pays or receives
consideration in advance for foreign currency-
denominated contracts. The interpretation has not
yet been endorsed by the EU.
Annual Improvements to IFRSs 2014 (2014 – 2016
Cycle) (effective for annual periods beginning on or
after 1 January 2017)
The amendments set out below describe the key
changes to two IFRSs. The amendments have not
yet been endorsed by the EU.
IFRS 12 “Disclosures of Interests in Other Entities”
The amendement clarified that the disclosures
requirement of IFRS 12 are applicable to interest in
entities classified as held for sale except for
summarised financial information.
IAS 28 “Investments in associates and Joint
ventures”
The amendements clarified that when venture
capital organisations, mutual funds, unit trusts and
similar entities use the election to measure their
investments in associates or joint ventures at fair
value through profit or loss (FVTPL), this election
should be made separately for each associate or
joint venture at initial recognition.
1.2 Consolidation
Subsidiaries
The consolidated financial statements comprise the
financial statements of the Company and its
subsidiaries. Subsidiaries are all entities (including
6 Integrated Annual Report 2016
Notes to the Financial Statements
56
special purpose entities) over which the Group has
control. The Group controls an entity when the
Group is exposed to, or has rights to, variable returns
from its involvement with the entity and has the
ability to affect those returns through its power over
the entity. Subsidiaries are fully consolidated from
the date on which control is transferred to the
Group. They are deconsolidated from the date that
control ceases.
The Group uses the full acquisition method of
accounting to account for business combinations.
The consideration transferred for the acquisition of a
subsidiary is the fair values of the assets transferred,
the liabilities incurred and the equity interests issued
by the Group. The consideration transferred
includes the fair value of any asset or liability
resulting from a contingent consideration
arrangement. Acquisition related costs are
expensed as incurred. Identifiable assets acquired
and liabilities and contingent liabilities assumed in a
business combination are measured initially at their
fair values at the acquisition date. The Group
recognises any non-controlling interest in the
acquiree on an acquisition-by-acquisition basis
either at fair value or at the non-controlling interest’s
proportionate share of the acquiree’s net assets.
If the business combination is achieved in stages,
the acquisition date carrying value of the acquirer’s
previously held equity interest in the acquiree is re-
measured to fair value at the acquisition date; any
gains or losses arising from such re-measurement are
recognized in the income statement.
Any contingent consideration to be transferred by
the Group is recognised at fair value at the
acquisition date. Subsequent changes to the fair
value of the contingent consideration that is
deemed to be an asset or liability is recognised in
accordance with IAS 39 either in profit or loss or as a
change to other comprehensive income.
Contingent consideration that is classified as equity
is not re-measured, and its subsequent settlement is
accounted for within equity.
Goodwill is initially measured at cost, being the
excess of the aggregate of the consideration
transferred, the amount recognised for non-
controlling interest and the fair value of any other
participation previously held in the subsidiary
acquired over the net identifiable assets acquired
and liabilities assumed. If the fair value of the net
assets acquired is in excess of the aggregate
consideration transferred, the amount recognized
for non-controlling interest and the fair value of any
other participation previously held in the subsidiary
acquired the gain is recognised in profit or loss (note
1.6).
Any profit or loss and any item of the Statement of
Other Comprehensive Income is allocated between
the share-holders of the parent and the non-
controlling interest, even if the allocation results in a
deficit balance of the non-controlling interest.
In the Company’s separate financial statements,
investments in subsidiaries are account for at cost
less impairment, if any. Cost is adjusted to reflect
changes in consideration arising from contingent
consideration amendments.
The subsidiaries’ financial statements are prepared
as of the same reporting date and using the same
accounting policies as the parent company. Intra-
group transactions, balances and unrealised
gains/losses on transactions between group
companies are eliminated.
Changes in ownership interests in subsidiaries
without change of control
Transactions with non-controlling interests that do
not result in loss of control are accounted for as
transactions with the owners in their capacity as
owners. The difference between consideration paid
and the relevant share acquired of the carrying
value of net assets of the subsidiary is recorded in
equity. Gains or losses on disposals to non-
controlling interests are also recorded in equity.
Disposal of subsidiaries
When the Group ceases to have control any
retained interest in the entity is re-measured to its
fair value at the date when control is lost, with the
change in carrying amount recognised in profit or
loss. The fair value is the initial carrying amount for
the purposes of subsequently accounting for the
retained interest as an associate, joint venture or
financial asset. In addition, any amounts previously
recognised in other comprehensive income in
respect of that entity are accounted for as if the
Group had directly disposed of the related assets or
liabilities. This may mean that amounts previously
recognised in other comprehensive income are
reclassified to profit or loss.
Joint arrangements
Investments in joint arrangements are classified as
either joint operations or joint ventures depending
on the contractual rights and obligations each
investor has rather than the legal structure of the
joint arrangement. The Group has assessed the
nature of its joint arrangement and determined it to
be a joint venture. Joint ventures are consolidated
with the equity method of consolidation.
Under the equity method of accounting, interests in
joint ventures are initially recognized at cost and
adjusted thereafter to recognize the Group’s share
of the post-acquisition profits or losses and
movements in other comprehensive income. When
the Group’s share of losses in a joint venture equals
or exceeds its interests in the joint ventures (which
includes any long-term interests that, in substance,
form part of the Group’s net investment in the joint
ventures), the Group does not recognize further
6 Integrated Annual Report 2016
Notes to the Financial Statements
57
losses, unless it has incurred obligations or made
payments on behalf of the joint ventures.
Unrealized gains on transactions between the
Group and its joint ventures are eliminated to the
extent of the Group’s interest in the joint ventures.
Unrealized losses are also eliminated unless the
transaction provides evidence of an impairment of
the asset transferred. Accounting policies of joint
ventures have been adjusted where necessary to
ensure consistency with the policies adopted by the
Group. The financial statements of the joint venture
are prepared for the same reporting date with the
parent company.
In the Company’s stand-alone financial statements,
the investment in joint ventures is stated at cost less
impairment, if any.
Associates
Associates are entities over which the Group has
significant influence (holds directly or indirectly 20%
or more of the voting power of the entity) but which
it does not control. Investments in associates are
accounted for using the equity method of
accounting and are initially recognised at cost. The
Group’s investment in associates includes goodwill
(net of any cumulative impairments losses)
identified on acquisition.
Under the equity method the Group’s share of the
post-acquisition profits or losses is recognised in the
income statement and its share of post-acquisition
movements in other comprehensive income is
recognized in other comprehensive income with a
corresponding adjustment to the carrying amount
of the investment. When the Group’s share of
losses in an associate equals or exceeds its interest
in the associate, the Group does not recognize
further losses, unless the Group has incurred legal or
constructive obligations or made payments on
behalf of the associates.
If the ownership interest in an associate is reduced
but significant influence is retained, only a
proportionate share of the amount previously
recognized in other comprehensive income is
reclassified to profit or loss where appropriate.
The Group determines at each reporting date
whether there is any objective evidence that the
investment in the associate is impaired. If this is the
case, the Group calculates the amount of the
impairment as the difference between the
recoverable amount of the associate and its
carrying value and recognizes the amount
adjacent to “share of profit/(loss) of associates and
joint ventures” in the income statement.
Profit and losses resulting from upstream and
downstream transactions between the Group and
its associate are recognized in the Group’s financial
statements only to the extent of unrelated investor’s
interests in the associates. Unrealized gains on
transactions between the Group and its associates
are eliminated to the extent of the Group’s interest
in the associates; unrealized losses are also
eliminated unless the transaction provides evidence
of an impairment of the asset transferred.
Accounting policies of associates have been
adjusted where necessary to ensure consistency
with the policies adopted by the Group.
The financial statements of the associates are
prepared for the same reporting date with the
Parent Company.
In the Company’s separate financial statements,
the investment in associates is stated at cost less
impairment, if any.
Commitments to purchase interests held by non-
controlling interests
As part of the acquisition process of certain entities,
the Group has granted third party shareholders the
option to require the Group to purchase their shares
subject to predetermined conditions (a “put”
option). These shareholders could be either
international institutions, or private investors who are
essentially financial or industrial investors or former
shareholders of the acquired entities (note 31).
The Group applies the following policy for the
recognition of put options:
• Non-controlling interest is still attributed its share
of profit and losses (and other changes in equity).
• The non-controlling interest is reclassified as a
financial liability at each reporting date, as if the
acquisition took place at that date.
Any difference between the fair value of the liability
under the put option at the end of the reporting
period and the non-controlling interest reclassified is
calculated based on the current policy of the
Group for acquisitions of non-controlling interests.
If the put option is ultimately exercised, the amount
recognized as the financial liability at that date will
be extinguished by the payment of the exercise
price. If the put option expires unexercised, the
position will be unwound such that the non-
controlling interest at that date is reclassified back
to equity and the financial liability is derecognized.
1.3 Foreign currency translation
Functional and presentation currency
Items included in the financial statements of each
entity in the Group are measured in the functional
currency, which is the currency of the primary
economic environment in which each Group entity
operates. The consolidated financial statements
are presented in Euros, which is the functional and
presentation currency of the Company and the
presentation currency of the Group.
Transactions and balances
6 Integrated Annual Report 2016
Notes to the Financial Statements
58
Foreign currency transactions are translated into the
functional currency using the exchange rates (i.e.
spot rates) prevailing at the dates of the
transactions or valuation where items are re-
measured. Foreign exchange gains and losses
resulting from the settlement of such transactions
and from the translation at year-end exchange
rates of monetary assets and liabilities denominated
in foreign currencies are recognised in the income
statement, except when deferred in other
comprehensive income as qualifying net investment
hedges. When the related investment is disposed of,
the cumulative amount is reclassified to profit or loss.
Exchange differences arising from intragroup long
term loans and receivables that are designated as
part of a reporting entity's net investment in a
foreign operation shall be recognised in profit or loss
in the separate financial statements of the reporting
entity, or, of the individual financial statements of
the foreign operation, as appropriate. In the
consolidated financial statements such exchange
differences shall be recognized in other
comprehensive income and included in "currency
translation differences reserve on transactions
designated as part of net investment in foreign
operation" in other reserves. Where settlement of
these intragroup long term loans and receivables is
planned or is likely to occur in the foreseeable future,
then these transactions cease to form part of the
net investment in the foreign operation. The
exchange differences arising up to that date are
recognized in other comprehensive income and
after that date, they are recognized in profit or loss.
On disposal of the net investment in a foreign
operation, the accumulated in other reserves
exchange differences are reclassified from equity to
profit or loss.
Translation differences on non-monetary financial
assets and liabilities, such as equity investments held
at fair value are included in the income statement.
Translation differences on non-monetary financial
assets, such as equities classified as available-for-
sale, are included in other comprehensive income.
Group companies
The financial statements of all group entities (none
of which operate in a hyperinflationary economy)
that have a functional currency different from the
presentation currency are translated into the
presentation currency as follows:
• Assets and liabilities for each balance sheet
presented are translated at the closing rate at
the date of the balance sheet.
• Income and expenses for each statement of
profit or loss and statement of comprehensive
income are translated at average exchange
rates (unless this is not a reasonable
approximation of the cumulative effect of the
rates prevailing on the transaction dates, in
which case income and expenses are
translated at the dates of the transactions).
• All exchange differences resulting from the
above are recognised in other comprehensive
income and subsequently included in "foreign
currency translation reserve".
• On the disposal of a foreign operation (partly or
fully disposed), the cumulative exchange
differences relating to that particular foreign
operation, recognized in the "foreign currency
translation reserve" within equity, are
recognised in the income statement as part of
the gain or loss on sale. On the partial disposal
of a foreign subsidiary, the proportionate share
of the cumulative amount is re-attributed to the
non-controlling interest in that operation.
On consolidation, exchange differences arising from
the translation of borrowings designated as hedges
of investments in foreign entities, are taken to other
comprehensive income and included under
"currency translation differences on derivative
hedging position" in other reserves.
Goodwill and fair value adjustments arising on the
acquisition of a foreign entity are treated as assets
and liabilities of the foreign entity and translated at
the closing rate. Exchange differences arising are
recognized in other comprehensive income.
1.4 Property, plant and equipment
Property, plant and equipment (PPE) is stated at
historical cost less accumulated depreciation and
impairment losses, except for land (excluding
quarries), which is shown at cost less impairment
losses.
Cost includes expenditure that is directly
attributable to the acquisition of the items and any
environmental rehabilitation costs to the extent that
they have been recognised as a provision (refer to
note 1.20). Subsequent costs are included in the
asset’s carrying amount or recognised as a
separate asset, as appropriate, only when it is
probable that future economic benefits associated
with the item will flow to the entity and the cost of
the item can be measured reliably. The carrying
amount of the replaced part is derecognized. All
other repairs and maintenance are charged to the
income statement as incurred. Subsequent costs
are depreciated over the remaining useful life of the
related asset or to the date of the net major
subsequent cost whichever is the sooner.
Depreciation, with the exception of quarries and
land, is calculated using the straight-line method to
allocate the cost of the assets to their residual
values over their estimated useful lives as follows:
6 Integrated Annual Report 2016
Notes to the Financial Statements
59
Buildings Up to 50 years
Plant and machinery Up to 40 years
Motor vehicles 5 to 20 years
Office equipment furniture and fittings
(including computer equipment and software
integral to the operation of the hardware) 2 to 10 years
Minor value assets Up to 2 years
Land on which quarries are located is depreciated
on a depletion basis. This depletion is recorded as
the material extraction process advances based on
the unit-of-production method. Other land is not
depreciated.
The assets’ residual values and useful lives are
reviewed, and adjusted if appropriate, at each
reporting date. Where the carrying amount of an
asset is greater than its estimated recoverable
amount, it is written down immediately to its
recoverable amount (refer to note 1.8- Impairment
of non-financial assets other than Goodwill).
An item of PPE and any significant part initially
recognised is derecognised upon disposal or when
no future economic benefits are expected from its
use or disposal. Gains and losses on disposals are
determined by comparing proceeds with carrying
amount and are included in operating profit.
Interest costs on borrowings specifically used to
finance the construction of PPE are capitalised
during the construction period if recognition criteria
are met (refer to note 1.29).
1.5 Investment property
Investment property is property held for long-term
rental yields or for capital appreciation or both and
that is not occupied by any of the subsidiaries of the
Group. Owner-occupied properties are held for
production and administrative purposes. This
distinguishes owner-occupied property from
investment property.
Investment property is measured initially at cost,
including related transaction costs and where
applicable borrowing costs (refer to 1.29).
After initial recognition investment property is
carried at fair value. Fair value reflects market
conditions at the reporting date and is determined
internally on an annual basis by management or
external valuators. The best evidence of fair value is
provided by current prices in an active market for
similar property in the same location and condition
and subject to the same lease terms and other
conditions (comparable transactions). When such
identical conditions are not present, the Group
takes account of, and makes allowances for,
differences from the comparable properties in
location, nature and condition of the property or in
contractual terms of leases and other contracts
relating to the property.
A gain or loss arising from a change in the fair value
of investment property is recognized in the period in
which it arises in the income statement within “other
income” or “other expense” as appropriate.
Subsequent expenditure is capitalised to the asset’s
carrying amount only when it is probable that future
economic benefits associated with the expenditure
will flow to the Group and the cost of the item can
be measured reliably. All other repairs and
maintenance costs are expensed when incurred.
When part of an investment property is replaced,
the carrying amount of the replaced part is
derecognised.
The fair value of investment property does not
reflect future capital expenditure that will improve
or enhance the property and does not reflect the
related future benefits from this future expenditure
other than those a rational market participant
would take into account when determining the
value of the property.
Where the Group disposes of a property at fair
value in an arm’s length transaction, the carrying
value immediately prior to the sale is adjusted to the
transaction price, and the adjustment is recorded in
the income statement within net gain from fair
value adjustment on investment property.
Investment properties are derecognised when they
have been disposed.
If an investment property becomes owner-
occupied, it is reclassified as PPE. Its fair value at the
date of reclassification becomes its deemed cost
for subsequent accounting purposes.
If an item of owner-occupied property becomes an
investment property because its use has changed,
IAS 16 is applied up to the date of transfer, since
investment property is measured at fair value. The
property is fair valued at the date of transfer and
any revaluation gain or loss, being the difference
between fair value and the previous carrying
amount, is accounted for as a revaluation surplus or
deficit in equity in accordance with IAS 16.
Revaluation surplus is recognized directly in equity
through other comprehensive income, unless there
was an impairment loss recognized for the same
property in prior years. In this case, the surplus up to
the extent of this impairment loss is recognized in
profit or loss and any further increase is recognized
directly in equity through other comprehensive
income. Any revaluation deficit is recognized in
profit or loss.
6 Integrated Annual Report 2016
Notes to the Financial Statements
60
1.6 Intangible assets
Goodwill
Goodwill arises on the acquisition of subsidiaries and
represents the excess of the aggregate of the
consideration transferred and the amount
recognised for non-controlling interest over the net
identifiable assets acquired and liabilities assumed.
If the excess of the aggregate of the consideration
transferred and the amount recognised for non-
controlling interest over the net identifiable assets
acquired and liabilities assumed is smaller than the
fair value of the net assets of the acquired
subsidiary, the difference is recognized in the profit
or loss. Goodwill represents the future economic
benefits arising from assets that are not capable of
being individually identified and separately
recognized in a business combination.
Goodwill is not amortized. After initial recognition, it
is measured at cost less any accumulated
impairment losses.
For the purpose of impairment testing, goodwill
acquired in a business combination is, from the
acquisition date, allocated to each cash-
generating-unit that is expected to benefit from the
synergies of the combination. Each unit or group of
units to which the goodwill is allocated represents
the lowest level within the entity at which the
goodwill is monitored for internal management
purposes. Goodwill is monitored at the operating
segment level.
Impairment reviews are undertaken annually (even
if there is no indication of impairment) or more
frequently if events or changes in circumstances
indicate a potential impairment. The carrying value
of goodwill is compared to the recoverable amount,
which is the higher of the value-in-use and the fair
value less costs to sell. Any impairment is recognised
immediately as an expense and is not subsequently
reversed.
Where goodwill has been allocated to a cash-
generating-unit (CGU) and part of the operation
within that unit is disposed of, the goodwill
associated with the disposed operation is included
in the carrying amount of the operation when
determining the gain or loss on disposal. Goodwill
disposed in these circumstances is measured based
on the relative values of the disposed operation
and the portion of the cash-generating unit
retained.
Other intangible assets
Intangible assets acquired separately are measured
on initial recognition at cost. The cost of intangible
assets acquired in a business combination is their fair
value at the date of acquisition. Following initial
recognition, intangible assets are carried at cost less
any accumulated amortisation and accumulated
impairment losses. Internally generated intangible
assets, excluding capitalised development costs
(note 1.7), are not capitalised and expenditure is
reflected in profit and loss in the period in which the
expenditure is incurred.
The Group’s intangible assets have a finite useful life.
Intangible assets with finite lives are amortised over
the useful economic life and assessed for
impairment whenever there is an indication that the
intangible asset may be impaired. The amortisation
period and the amortisation method for an
intangible asset with a finite useful life are reviewed
at least at the end of each reporting period.
Changes in the expected useful life or the expected
pattern of consumption of future economic benefits
embodied in the asset are considered to modify the
amortisation period or method, as appropriate, and
are treated as changes in accounting estimates.
The amortisation expense on intangible assets with
finite lives is recognised in the income statement as
the expense category that is consistent with the
function of the intangible assets.
Acquired computer software programs and licenses
are capitalised on the basis of costs incurred to
acquire and bring to use the specific software when
these are expected to generate economic benefits
beyond one year. Costs associated with developing
or maintaining computer software programs are
recognised as an expense as incurred.
The amortization methods used for the Group’s
intangibles are as follows:
Amortization
Method
Useful Lives
Patents, trademarks and
customer relationships
straight-line
basis
up to 20 years
Licenses (mining permits) straight-line
basis /
depletion
method
shorter of: the
permit period and
the estimated life
of the underlying
quarry
unit-of-production
method
Development costs (quarries
under operating leases)
note 1.7 note 1.7
Computer software straight-line
basis
3 to 7 years
Gains or losses arising from derecognition of an
intangible asset are measured as the difference
between the net disposal proceeds and the
carrying amount of the asset and are recognised in
the income statement when the asset is
derecognised.
1.7 Deferred stripping costs
Stripping costs comprise the removal of overburden
and other waste products. Stripping costs incurred
in the development of a quarry before production
commences are capitalised as follows:
6 Integrated Annual Report 2016
Notes to the Financial Statements
61
Where such costs are incurred on quarry land that
is owned by the Group, these are included within
the carrying amount of the related quarry, under
PPE and subsequently depreciated over the life of
the quarry on a units-of-production basis. Where
such costs are incurred on quarries held under an
operating lease, these are included under
‘Development expenditure’ under Intangible assets
and amortised over the shorter of the lease term
and the useful life of the quarry.
1.8 Impairment of non-financial assets other than
Goodwill
Assets that have an indefinite useful life (land not
related to quarries) are not subject to amortisation
and are tested annually for impairment. Assets that
are subject to amortisation are reviewed for
impairment whenever events or changes in
circumstances indicate that the carrying amount
may not be recoverable. An impairment loss is
recognised, as an expense immediately, for the
amount by which the asset’s carrying amount
exceeds its recoverable amount. For the purposes
of assessing impairment, assets are grouped at the
lowest levels for which there are separately
identifiable cash flows (cash-generating units). Non-
financial assets other than goodwill that suffered
impairment are reviewed for possible reversal of the
impairment at each reporting date. An asset’s
recoverable amount is the higher of an asset or
cash generating units (CGU) fair value less costs of
sell and its value-in-use.
1.9 Leases
Where a Group entity is the lessee
Leases where substantially all the risks and rewards
of ownership are retained by the lessor are classified
as operating leases. Payments made under
operating leases (net of any incentives received
from the lessor) are charged to the income
statement on a straight-line basis over the period of
the lease.
Leases of PPE where the Group has substantially all
the risks and rewards of ownership are classified as
finance leases. Finance leases are capitalised at the
commencement of the lease at the lower of the fair
value of the leased property or the present value of
the minimum lease payments, each determined at
the inception of the lease. Each lease payment is
allocated between the liability and finance charges.
The corresponding rental obligations, net of finance
charges, are included in liabilities. The interest
element of the finance cost is charged to the
income statement over the lease period so as to
produce a constant periodic rate of interest on the
remaining balance of the liability for each period.
PPE acquired under finance leases are depreciated
over the shorter of the useful life of the asset and the
lease term.
Leases are classified as finance leases or operating
leases at the inception of the lease.
Where a Group entity is the lessor
Leases in which the Group entity does not transfer
substantially all the risks and benefits of ownership of
an asset are classified as operating leases.
Operating leases of PPE are recognized according
to their nature in the statement of financial position.
Payments made under operating leases are
charged to profit or loss on a straight-line basis over
the period of the lease.
Initial direct costs incurred in negotiating an
operating lease are added to the carrying amount
of the leased asset and recognised over the lease
term on the same basis as rental income.
Contingent rents are recognised as revenue in the
period in which they are earned.
1.10 Inventories
Inventories are stated at the lower of cost and net
realisable value. Cost is determined using the
weighted average cost method. The cost of finished
goods and work in progress comprises raw materials,
direct labour, other direct costs and related
production overheads (based on normal operating
capacity) but excludes borrowing costs. Net
realisable value is the estimated selling price in the
ordinary course of business, less the estimated costs
of completion and selling expenses.
Appropriate allowance is made for damaged,
obsolete and slow moving items. Write-downs to net
realisable value and inventory losses are expensed
in cost of sales in the period in which the write-
downs or losses occur.
1.11 Trade receivables
Trade receivables are amounts due from customers
for merchandise sold or services performed in the
ordinary course of business. If collection is expected
in one year or less (or in the normal operating cycle
of the business if longer), they are classified as
current assets. If not, they are presented as non-
current assets.
Trade receivables are recognised initially at fair
value and subsequently measured at amortised
cost using the effective interest method, less
provision for impairment.
1.12 Cash and cash equivalents
In the statement of cash flows, cash and cash
equivalents comprise cash on hand, deposits held
at call with banks, other short-term highly liquid
investments, and bank overdrafts, if they exist. Bank
overdrafts are included within borrowings in current
liabilities in the balance sheet. The components of
cash and cash equivalents have a negligible risk of
change in value.
6 Integrated Annual Report 2016
Notes to the Financial Statements
62
1.13 Share capital
Ordinary shares and non-redeemable non-voting
preferred shares with minimum statutory non-
discretionary dividend features are classified as
equity. Share capital represents the value of
company’s shares in issue. Any excess of the fair
value of the consideration received over the par
value of the shares issued is recognized as “share
premium” in shareholders’ equity.
Incremental external costs directly attributable to
the issue of new shares or share options are shown in
equity as a deduction, net of tax, from the
proceeds.
Where the Company or its subsidiaries purchases
the Company’s own equity share capital (treasury
shares), the consideration paid including any
attributable incremental external costs net of
income taxes is deducted from total shareholders’
equity until they are cancelled or sold. Where such
shares are subsequently sold or reissued, any
consideration received, net of any directly
attributed incremental transaction costs and the
related income tax effect, is included in
shareholders’ equity.
1.14 Borrowings
Borrowings are recognised initially at fair value, net
of transaction costs incurred. In subsequent periods,
borrowings are carried at amortised cost using the
effective interest method. Any difference between
proceeds (net of transaction costs) and the
redemption value is recognised in the income
statement over the period of the borrowings using
the effective interest method.
Fees paid on the establishment of loan facilities are
recognized as transactions costs of the loan to the
extent that it is probable that some or all of the
facility will be drawn down. In this case, the fee is
deferred until the draw down occurs. To the extent
there is no evidence that it is probable that some or
all of the facility will be drawn down, the fee is
capitalised as a prepayment for liquidity services
and amortised over the period of the facility to
which it relates.
Borrowings are classified as current liabilities unless
the Group entity has an unconditional right to defer
settlement for at least 12 months after the balance
sheet date.
1.15 Current and deferred income taxes
The tax expense for the period comprises current
and deferred tax. Tax is recognised in the income
statement, except to the extent that it relates to
items recognised in other comprehensive income or
directly in equity. In this case, the tax is also
recognised in other comprehensive income or
directly in equity, respectively.
Current income tax is calculated on the basis of the
tax laws enacted or substantively enacted at the
reporting date in the countries where the Company
and its subsidiaries operate and generate taxable
income. Management periodically evaluates
positions taken in tax returns with respect to
situations in which applicable tax regulation is
subject to interpretation. It establishes provisions
where appropriate on the basis of amounts
expected to be paid to the tax authorities.
Deferred income tax is recognised using the liability
method, on temporary differences arising between
the tax bases of assets and liabilities and their
carrying amounts in the financial statements.
However, if the deferred income tax arises from
initial recognition of an asset or liability in a
transaction other than a business combination that
at the time of the transaction affects neither
accounting nor taxable profit and loss, it is not
accounted for.
Deferred tax assets are recognised for all
deductible temporary differences, the carry forward
of unused tax credits and any unused tax losses.
Deferred tax assets are recognised to the extent
that it is probable that taxable profit will be
available against which the deductible temporary
differences, and the carry forward of unused tax
credits and unused tax losses can be utilized.
Deferred tax liabilities are recognised for taxable
temporary differences arising on investments in
subsidiaries, joint arrangements and associates,
except where the Group is able to control the
reversal of the temporary difference and it is
probable that the temporary difference will not
reverse in the foreseeable future. Deferred income
tax is determined using tax rates (and laws) that
have been enacted or substantively enacted at the
reporting date and are expected to apply when
the related deferred income tax asset is realised or
the related deferred income tax liability is settled.
Deferred income tax assets and liabilities are offset
when there is a legally enforceable right to offset
current tax assets against current tax liabilities and
when the deferred income taxes assets and
liabilities relate to income taxes levied by the same
taxation authority on either the same taxable entity
or different taxable entities where there is an
intention to settle the balances on a net basis.
1.16 Employee benefits
Pension and other retirement obligations
The Group operates various pension and other
retirement schemes, including both defined benefit
and defined contribution pension plans in
accordance with the local conditions and practices
in the countries in which it operates. A defined
contribution plan is a pension plan under which the
Group pays fixed contributions into a separate
entity. The Group has no legal or constructive
6 Integrated Annual Report 2016
Notes to the Financial Statements
63
obligations to pay further contributions if the fund
does not hold sufficient assets to pay all employees
the benefits relating to employee service in the
current and prior periods. A defined benefit plan is a
pension plan that is not a defined contribution plan.
Typically defined benefit plans define an amount of
pension benefit that an employee will receive on
retirement, usually dependent on one or more
factors such as age, years of service and
compensation.
The liability recognized in the statement of financial
position in respect of defined benefit pension or
retirement plans is the present value of the defined
benefit obligation at the reporting date less the fair
value of plan assets.
The defined benefit obligation is calculated
annually by independent actuaries using the
projected unit credit method. The present value of
the defined benefit obligation is determined by
discounting the estimated future cash outflows
using interest rates of high quality corporate bonds
or government bonds which have terms to maturity
approximating to the terms of the related pension
obligation.
Past service costs are recognized in profit or loss on
the earlier of:
– The date of the plan amendment or
curtailment, and
– The date that the Group recognizes
restructuring-related costs
Net interest is calculated by applying the discount
rate to the net defined benefit liability or asset. The
Group recognizes the following changes in the net
defined benefit obligation:
Service costs comprising current service costs, past-
service costs, gains and losses on curtailments and
non-routine settlements under other operating
expenses/income
Net interest expense or income under finance
expenses
Re-measurements, comprising of the actuarial gains
and losses, the effect of the asset ceiling, excluding
net interest (not applicable to the Group) and the
return on plan assets (excluding net interest), are
recognized immediately in the statement of
financial position with a corresponding debit or
credit to retained earnings through other
comprehensive income (OCI) in the period in which
they occur. Re-measurements are not reclassified to
profit or loss in subsequent periods.
For defined contribution plans, the Group pays
contributions to publicly or privately administered
pension insurance plans on a mandatory,
contractual or voluntary basis. Once the
contributions have been paid, the Group has no
further payment obligations. The regular
contributions constitute net periodic costs for the
year in which they are due and as such are
included in staff costs.
Termination benefits
Termination benefits are payable whenever an
employee’s employment is terminated by the
Group, before the normal retirement date or
whenever an employee accepts voluntary
redundancy in exchange for these benefits.
The Group recognises termination benefits when it is
demonstrably committed to a termination when the
entity has a detailed formal plan to terminate the
employment of current employees without
possibility of withdrawal. The obligating event is the
termination and not the service. In the case of an
offer made to encourage voluntary redundancy,
the termination benefits are measured based on
the number of employees expected to accept the
offer. Benefits falling due more than 12 months after
the end of the reporting period are discounted to
their present value.
Profit sharing and bonus plans
A liability for employee benefits in the form of profit
sharing and bonus plans is recognised in other
provisions when the following conditions are met:
– there is a formal plan and the amounts to
be paid are determined before the time of issuing
the financial statements; or
– past practice has created a valid
expectation by employees that they will receive a
bonus/ profit sharing and the amount can be
determined before the time of issuing the financial
statements.
Share-based payments
Share options are granted to certain members of
senior management at a discount to the market
price of the shares at par value on the respective
dates of the grants and are exercisable at those
prices. The options must be exercised within twelve
months of their respective vesting period. The
scheme has a contractual option term of three
years.
The fair value of the employee services received in
exchange for the grant of the options is recognised
as an expense during the vesting period, which is
the period over which all of the specific vesting
conditions are to be satisfied. The total amount to
be expensed over the vesting period is determined
by reference to the fair value of the options granted,
specified by the date of grant:
– Including any market performance
conditions (for example, an entity’s share price);
– Excluding the impact if any service and
non-market performance vesting conditions (for
example profitability, sales growth targets and
6 Integrated Annual Report 2016
Notes to the Financial Statements
64
remaining an employee of the entity over a
specified time period); and
– Including the impact of any non-vesting
conditions (for example, the requirement for
employees to save)
At the end of each reporting date, the Group
revises its estimates of the number of options that
are expected to vest and recognises the impact of
the revision of original estimates, if any, in
administrative expenses and cost of goods sold in
the income statement, with a corresponding
adjustment to equity. When the options are
exercised, the Company issues new shares. The
proceeds received net of any directly attributable
transaction costs are credited to share capital
(nominal value) and share premium reserve.
1.17 Government grants
Government grants are recognised at their fair
value where there is a reasonable assurance that
the grant will be received and the Group will
comply with all attached conditions.
Government grants are recognized in profit or loss
on a systematic basis over the periods in which the
Group recognizes as expenses the related costs for
which the grants are intended to compensate.
Specifically, government grants whose primary
condition is that the Group should purchase,
construct or otherwise acquire non-current assets
are recognized as deferred revenue in the
statement of financial position and transferred to
profit or loss on a systematic and rational basis over
the useful lives of the related assets.
1.18 CO2 Emission rights
Emission rights are accounted for under the net
liability method, based on which the Group
recognizes a liability for emissions when the
emissions are made and are in excess of the
allowances allocated. The Group has chosen to
measure the net liability on the basis of the period
for which the irrevocable right to the cumulative
emissions rights have been received. Emission rights
purchases in excess of those required to cover its
shortages are recognized as intangible asset.
Proceeds from the sale of granted emission rights
are recorded as a reduction to cost of sales.
1.19 Provisions
Provisions represent liabilities of uncertain timing or
amount and are recognised when the Group has a
present legal or constructive obligation as a result of
past events, it is probable that an outflow of
resources will be required to settle the obligation,
and a reliable estimate of the amount can be
made. Where the Group expects a provision to be
reimbursed, for example under an insurance
contract, the reimbursement is recognised as a
separate asset but only when the reimbursement is
virtually certain. The expense relating to any
provision is presenting in the income statement net
of any reimbursement.
Provisions are not recognized for future operating
losses. The Group recognises a provision for onerous
contracts when the economic benefits to be
derived from a contract are less than the
unavoidable costs of meeting the obligations under
the contract.
Restructuring provisions comprise lease termination
penalties and employee termination payments, and
are recognised in the period in which the Group
becomes legally or constructively committed to
payment. Costs related to the ongoing activities of
the Group are not provided for in advance.
Where the effect of the time value of money is
material, provisions is measured at the present value
of the expenditure expected to be required to
settle the obligation using a pre-tax rate that reflects
current market assessments of the time value of
money and the risks specific to the obligation. The
increase in the provision due the passage of time is
recognized as a finance expense.
1.20 Site restoration, quarry rehabilitation and
environmental costs
Companies within the Group are generally required
to restore the land used for quarries and processing
sites at the end of their producing lives to a
condition acceptable to the relevant authorities
and consistent with the Group’s environmental
policies. Provisions for environmental restoration are
recognised when the Group has a present legal or
constructive obligation as a result of past events
and, it is probable that an outflow of resources will
be required to settle the obligation and the amount
has been reliably estimated.
Provisions associated with environmental damage
represent the estimated future cost of remediation.
Estimating the future costs of these obligations is
complex and requires management to use
judgment.
The estimation of these costs is based on an
evaluation of currently available facts with respect
to each individual site and considers factors such as
existing technology, currently enacted laws and
regulations and prior experience in remediation of
sites. Inherent uncertainties exist in such evaluations
primarily due to unknown conditions, changing
governmental regulations and legal standards
regarding liability, the protracted length of the
clean-up periods and evolving technologies. The
environmental and remediation liabilities provided
for reflect the information available to
management at the time of determination of the
liability and are adjusted periodically as
remediation efforts progress or as additional
technical or legal information becomes available.
6 Integrated Annual Report 2016
Notes to the Financial Statements
65
Estimated costs associated with such rehabilitation
activities are measured at the present value of
future cash outflows expected to be incurred. When
the effect of the passage of time is not significant,
the provision is calculated based on discounted
cash flows. Where a closure and environmental
obligation arises from quarry/mine development
activities or relate to the decommissioning PPE the
provision can be capitalized as part of the cost of
the associated asset (intangible or tangible). The
capitalized cost is depreciated over the useful life of
the asset and any change in the net present value
of the expected liability is included in finance costs,
unless they arise from changes in accounting
estimates of valuation.
1.21 Revenue recognition
Revenue is recognized to the extent that it is
probable that the economic benefits will flow to the
Group and the revenue can be reliably measured.
Revenue is measured at the fair value of the
consideration received or receivable, and
represents amounts receivable for the sale of goods
and services stated net of value-added tax, rebates
and discounts.
Revenue from the sale of goods is recognised when
significant risks and rewards of ownership of the
goods are transferred to the buyer (usually upon
delivery and customer acceptance) and the
realization of the related receivable is reasonably
assured.
Revenue arising from services is recognised in the
accounting period in which the services are
rendered, by reference to stage of completion of
the specific transaction and assessed on the basis
of the actual service provided as a proportion of
the total services to be provided.
Revenue from rental income arising, from operating
leases, is accounted for on a straight-line basis over
the lease terms.
Interest income is recognised using the effective
interest method. If there is an impairment of loans or
receivables, their carrying value is reduced to their
recoverable amount, which is the present value of
the future cash flows discounting with the initial
effective interest rate. Afterwards, the interest
income is recognised with the same interest rate
(the initial effective interest rate) multiplied with the
impaired carrying value.
Dividend income is recognised when the right to
receive the payment is established.
1.22 Dividend distribution
Dividend to the Company’s shareholders is
recognized in the financial statements in the period
in which the Board of Directors’ proposed dividend
is ratified at the Shareholders’ Annual General
Meeting.
1.23 Segment information
Segment information is presented on the same basis
as the internal information provided to the chief
operating decision maker. The chief operating
decision maker is the person (or the group of
persons) that allocates resources to and assesses
the operating results of the segments.
For management purposes, the Group is structured
in four regions: Greece and Western Europe, North
America, South East Europe and Eastern
Mediterranean. Each region is a set of countries. The
aggregation of countries is based on proximity of
operations and to an extent in similarity of
economic and political conditions. Each region has
a regional Chief Executive Officer (CEO) who
reports to the Group's CEO. In addition, the Finance
Department is organized also by region for effective
financial controlling and performance monitoring.
1.24 Financial assets
Classification
The Group classifies its financial assets in the
following categories: at fair value through profit or
loss, loans and receivables and available for sale.
The classification depends on the purpose for which
the financial assets were acquired. Management
determines the classification of its financial assets at
initial recognition.
Financial assets at fair value through profit or loss
Financial assets at fair value through profit or loss
are financial assets held for trading. A financial
asset is classified in this category if acquired
principally for the purpose of selling in the short term.
Derivatives are also categorized as held for trading
unless they are designated as hedges. Assets in this
category are classified as current assets if expected
to be settled within 12 months, otherwise they are
classified as non-current.
Loans and receivables
Loans and receivables are non-derivative financial
assets with fixed or determinable payments that are
not quoted in an active market. They are included
in current assets, except for maturities greater than
12 months after the end of the reporting period.
These are classified as non-current assets.
Available-for-sale financial assets
Available-for-sale financial assets are non-
derivatives that are either designated in this
category or not classified in any of the other
categories. They are included in non-current assets
unless the investment matures or management
intends to dispose of it within 12 months of the end
of the reporting period.
Recognition and measurement
Regular purchases and sales of financial assets are
recognised on the trade-date. This is the date on
6 Integrated Annual Report 2016
Notes to the Financial Statements
66
which the group commits to purchase or sell the
asset. Investments are initially recognised at fair
value plus transaction costs for all financial assets
not carried at fair value through profit or loss.
Financial assets carried at fair value through profit or
loss is initially recognised at fair value, and
transaction costs are expensed in the income
statement. Financial assets are derecognised when
the rights to receive cash flows from the investments
have expired or have been transferred and the
Group has transferred substantially all risks and
rewards of ownership. Available-for-sale financial
assets and financial assets at fair value through
profit or loss are subsequently carried at fair value.
Loans and receivables are subsequently carried at
amortised cost using the effective interest method.
Gains or losses arising from changes in the fair value
of the ‘financial assets at fair value through profit or
loss’ category are presented in the income
statement within the period in which they arise.
Changes in the fair value of monetary and non-
monetary securities classified as available for sale
are recognised in other comprehensive income.
When securities classified as available for sale are
sold or impaired, the accumulated fair value
adjustments recognised in equity are included in
the income statement.
Dividends on available-for-sale equity instruments
are recognised in the income statement when the
group’s right to receive payments is established.
1.25 Offsetting financial instruments
Financial assets and liabilities are offset and the net
amount reported in the balance sheet when there is
a legally enforceable right to offset recognised
amounts, and there is an intention to settle on the
net basis the liability or realise the asset and settle
the liability simultaneously. The legally enforceable
right to offset should not depend on future events
but it should apply in the ordinary course of business.
However, it should be allowed for the related
amounts to be set off in certain circumstances, such
as bankruptcy or the termination of a contract.
1.26 Impairment of financial assets
Assets carried at amortised cost
The Group assesses at the end of each reporting
period whether there is objective evidence that a
financial asset or group of financial assets is
impaired. A financial asset or a group of financial
assets is impaired and impairment losses are
incurred only if there is objective evidence of
impairment as a result of one or more events that
occurred after the initial recognition of the asset (a
‘loss event’) and that loss event (or events) has an
impact on the estimated future cash flows of the
financial asset or group of financial assets that can
be reliably estimated.
Evidence of impairment may include indications
that the debtors or a group of debtors is
experiencing significant financial difficulty, default
or delinquency in interest or principal payments, the
probability that they will enter bankruptcy or other
financial reorganisation, and where observable
data indicate that there is a measurable decrease
in the estimated future cash flows.
For loans and receivables category, the amount of
the loss is measured as the difference between the
asset’s carrying amount and the present value of
estimated future cash flows (excluding future credit
losses that have not been incurred) discounted at
the financial asset’s original effective interest rate.
The carrying amount of the asset is reduced and
the amount of the loss is recognised in the income
statement.
If, in a subsequent period, the amount of the
impairment loss decreases and the decrease can
be related objectively to an event occurring after
the impairment was recognised (such as an
improvement in the debtor’s credit rating), the
reversal of the previously recognised impairment
loss is recognised in the income statement.
Assets classified as available-for-sale
The Group assesses at the end of each reporting
period whether there is objective evidence that a
financial asset or a group of financial assets is
impaired. In the case of equity investments
classified as available- for- sale, a significant or
prolonged decline in the fair value of the security
below its cost is also evidence that the assets are
impaired. If any such evidence exists for available-
for-sale financial assets, the cumulative loss –
measured as the difference between the
acquisition cost and the current fair value, less any
impairment loss on that financial asset previously
recognised in profit or loss – is removed from equity
and recognised in profit or loss. Impairment losses
recognised in the consolidated income statement
on equity instruments are not reversed through the
consolidated income statement. If, in a subsequent
period, the fair value of a debt instrument classified
as available- for- sale increases and the increase
can be objectively related to an event occurring
after the impairment loss was recognised in profit or
loss, the impairment loss is reversed through the
consolidated income statement.
1.27 Derivative financial instruments and hedging
activities
Derivatives are initially recognized at fair value on
the date a derivative contract is entered into and
are subsequently periodically re-measured at their
fair value. Derivatives are carried as financial assets
when the fair value is positive and as financial
liabilities when the fair value is negative.
Any gains or losses arising from changes in the fair
value of derivatives are taken directly to profit or
6 Integrated Annual Report 2016
Notes to the Financial Statements
67
loss, except for the effective portion of cash flow
hedges, which is recognized in other
comprehensive income (OCI) and later is
reclassified to profit or loss when the hedge item
affects profit or loss.
For the purpose of hedge accounting, hedges are
classified as:
• Fair value hedges when hedging the exposure
to changes in the fair value of a recognized asset or
liability or an unrecognized firm commitment
• Cash flow hedges when hedging the exposure
to variability in cash flows that is either attributable
to a particular risk associated with a recognized
asset or liability or a highly probable forecast
transaction or the foreign currency risk in an
unrecognized firm commitment
• Hedges of a net investment in a foreign
operation
At the inception of the hedge relationship, Group
formally designates and documents the hedge
relationship between hedging instruments and
hedged items, to which it wishes to apply hedge
accounting and the risk management objective
and strategy for undertaking the hedge. The
documentation includes identification of the
hedging instrument, the hedged item or transaction,
the nature of the risk being hedged and how the
entity will assess the effectiveness of changes in the
hedging instrument’s fair value in offsetting the
exposure to changes in the hedged item’s fair value
or cash flows attributable to the hedged risk. Such
hedges are expected to be highly effective in
achieving offsetting changes in fair value or cash
flows and are assessed on an ongoing basis to
determine that they actually have been highly
effective throughout the financial reporting periods
for which they were designated.
The full fair value of a hedging derivative is classified
as a non-current asset or liability when the
remaining hedged item is more than 12 months and
as a current asset or liability when the remaining
maturity of the hedged item is less than 12 months.
Hedges that meet the strict criteria for hedge
accounting are accounted for, as described below:
Fair value hedges
Changes in the fair value of derivatives that are
designated and qualify as fair value hedges are
recorded in the income statement, together with
any changes in the fair value of the hedged asset
or liability that are attributable to the hedged risk.
The gain or loss relating both to the effective and
ineffective portion of interest rate swaps hedging
fixed rate borrowings is recognized in the income
statement within “Finance income/expense”.
Cash flow hedges
The effective portion of gains or losses from
measuring cash flow hedging instruments is
recognized in OCI and accumulated in reserves, in
the account “translation differences on derivate
hedging position”. The gain or loss relating to the
ineffective portion is recognized immediately in the
income statement within “Finance
income/expenses”.
Amounts accumulated in equity are reclassified to
profit or loss in the periods when the hedged item
affects profit or loss.
When a hedging instrument expires or is sold or
terminated, or when a hedge no longer meets the
criteria for hedge accounting, any cumulative gain
or loss existing in equity at that time remains in
equity and is recognised when the forecast
transaction is ultimately recognised in profit or loss.
When a forecast transaction is no longer expected
to occur, the cumulative gain or loss that was
reported in equity is immediately reclassified to
profit or loss.
Net investment hedge
Hedges of net investments in foreign entities are
accounted for similarly to cash flow hedges. Where
the hedging instrument is a derivative, any gain or
loss on the hedging instrument relating to the
effective portion of the hedge is recognised in
currency translation differences on derivative
hedging position in other reserves. The gain or loss
relating to the ineffective portion is recognised
immediately in other income/expenses in the
income statement. However, where the hedging
instrument is not a derivative (for example, a foreign
currency borrowing), all foreign exchange gains or
losses arising on the translation of a borrowing that
hedges such an investment (including any
ineffective portion of the hedge) are recognized in
equity in “translation differences on derivative
hedging position” in “other reserves”.
Gains or losses accumulated in equity are included
in the income statement when the foreign
operation is partially disposed of or sold. The
Group’s ‘other reserves’ include gains that have
resulted from such hedging activities carried out in
the past.
Derivatives that do not qualify for hedge
accounting
Certain derivative transactions, do not qualify for
hedge accounting under rules in IFRS. Any gains or
losses arising from changes in the fair value of
financial instruments that are not part of a hedging
relationship are included in finance
income/(expenses), or gain/(loss) from foreign
exchange differences in the income statement for
the period in which they arise.
6 Integrated Annual Report 2016
Notes to the Financial Statements
68
1.28 De-recognition of financial assets and liabilities
Financial assets: A financial asset (or, where
applicable a part of a financial asset or part of a
group of similar financial assets) is derecognized
when:
• the rights to receive cash flows from the asset
have expired;
• the Group retains the right to receive cash flows
from the asset, but has assumed an obligation to
pay them in full without material delay to a third
party under a “pass-through” arrangement; or
• the Group has transferred its rights to receive
cash flows from the asset and either (a) has
transferred substantially all the risks and rewards of
the assets, or (b) has neither transferred nor retained
substantially all the risks and rewards of the asset,
but has transferred control of the asset.
Where the Group has transferred its rights to receive
cash flows from an asset and has neither transferred
nor retained substantially all the risks and rewards of
the asset nor transferred control of the asset, the
asset is recognized to the extent of the Group’s
continuing involvement in the asset. A respective
liability is also recognized.
Continuing involvement that takes the form of a
guarantee over the transferred asset is measured at
the lower of the original carrying amount of the
asset and the maximum amount of consideration
that the Group could be required to repay.
Financial liabilities: A financial liability is
derecognized when the obligation under the
liability is discharged or cancelled or expires. Where
an existing financial liability is replaced by another
from the same lender on substantially different terms,
or the terms of an existing liability are substantially
modified, such an exchange or modification is
treated as a de-recognition of the original liability
and the recognition of a new liability. The difference
in the respective carrying amounts is recognized in
the consolidated statement of income.
1.29 Borrowing costs
Borrowing costs directly attributable to the
acquisition, construction or production of a
qualifying which is an asset that necessarily takes a
substantial period of time to get ready for its
intended use or sale are capitalized as part of the
cost of the respective assets until such as the asset is
substantially ready for its intended use or sale.
Qualifying assets are assets that necessarily take a
substantial period of time to get ready for their
intended use or sale. All other borrowing costs are
expensed in the profit of loss in the period in which
they are occurred. Borrowing costs consist of
interest and other costs that an entity incurs in
connection with the borrowing of funds.
1.30 Trade payables
Trade payables are obligations to pay for goods or
services that have been acquired in the ordinary
course of business from suppliers. Accounts payable
are classified as current liabilities if payment is due
within one year or less (or in the normal operating
cycle of the business if longer). If not, they are
presented as non-current liabilities.
Trade payables are recognised initially at fair value
and subsequently measured at amortised cost using
the effective interest method.
1.31 Exceptional items
Exceptional items are disclosed separately in the
financial statements where it is necessary to do so
to provide further understanding of the financial
performance of the group. They are material items
of income or expense that have been shown
separately due to the significance of their nature or
amount. Examples of exceptional items include
gains/losses on disposal of non-current assets,
restructuring costs and other unusual gains or losses.
2. Significant accounting estimates and
judgments
The preparation of the financial statements requires
management to make estimations and judgments
that affect the reported disclosures. On an ongoing
basis, management evaluates its estimates, which
are presented bellow in paragraphs 2.1 to 2.17.
Estimates and judgements are continually
evaluated and are based on historical experience
and other factors, including expectations of future
events that are believed to be reasonable under
the circumstances.
These management’s estimation and assumptions
form the basis for making judgments about the
carrying value of assets and liabilities that are not
readily available from other sources. The resulting
accounting estimates will, by definition, seldom
equal the related actual results. The estimates and
assumptions that have a significant risk of causing a
material adjustment to the carrying amounts of
assets and liabilities within the next financial year
are discussed below.
2.1 Impairment of goodwill and other non-financial
assets
Management tests annually whether goodwill has
suffered any impairment, in accordance with the
accounting policy stated in paragraph 1.6. The
recoverable amounts of cash-generating units have
been determined based on value-in-use
calculations. The basic assumptions that are used in
the calculations are explained further in note 13.
These calculations require the use of estimates
6 Integrated Annual Report 2016
Notes to the Financial Statements
69
which mainly relate to future earnings and discount
rates.
Non-financial assets are reviewed for impairment
whenever events or changes in circumstances
indicate that the carrying amount may not be
recoverable, in accordance with the accounting
policy stated in paragraph 1.8.
2.2 Income taxes
Group entities are subject to income taxes in
numerous jurisdictions. Significant judgment is
required in determining the worldwide provision for
income taxes. There are many transactions and
calculations for which the ultimate tax
determination is uncertain during the ordinary
course of business. Where the final tax outcome of
these matters is different from the amounts that
were initially recorded, such differences will impact
the income tax and deferred tax provisions in the
period in which such determination is made.
2.3 Deferred tax assets
Deferred tax assets are recognized for unused tax
losses to the extent that it is probable that taxable
profit will be available against which the losses can
be utilized. Significant management judgment is
required to determine the amount of deferred tax
assets that can be recognized, based upon the
likely timing and the level of future taxable profits
together with future tax planning strategies. Further
details on taxes are disclosed in note 8.
2.4 Asset lives and residual values
PPE are depreciated over their estimated useful
lives. The actual lives of the assets are assessed
annually and may vary depending on a number of
factors. In reassessing asset lives, factors such as
technological innovation, product lifecycles, life-of-
mine and maintenance programmes are taken into
account.
2.5 Allowance for net realizable value of inventory
The allowance for net realizable value of inventory,
in accordance with the accounting policy as stated
in paragraph 1.10, represents management’s best
estimate, based on historic sales trends and its
assessment on quality and volume, of the extent to
which the stock on hand at the reporting date will
be sold below cost.
2.6 Allowance for doubtful accounts receivable
The Group impairs the trade receivables, when
there is evidence or indication that the full or part of
a receivable collection is not probable. The Group’s
management periodically reassess the adequately
of the allowance for doubtful accounts receivable
using parameters such as its credit policy, reports
from its legal counsel on recent developments of
the cases they are handling, and its
judgment/estimate about the impact of other
factors affecting the recoverability of the
receivables.
2.7 Provision for environmental rehabilitation
The Group recognizes a provision for environmental
rehabilitation and, more specifically, a provision for
future restoration of land disturbed, as of the
reporting date, as a result of past activity and in line
with the prevailing environmental legislation of each
country in which it operates or the binding group
practices. The provision for environmental
rehabilitation is re-estimated on an annual basis and
it reflects the present value of the expected
restoration costs, using estimated cash flows as of
the reporting date and is calculated based on the
area of the land disturbed at the reporting date
and the cost of rehabilitation per metric unit of land
at the level of the broader area of interest. Given
the complexity of the calculations and the
significant assumptions therein. Management
provides at the reporting date its best estimate in
relation to the present value of the aforementioned
liability.
2.8 Provision for staff leaving indemnities
The cost for the staff leaving indemnities is
determined based on actuarial valuations. The
actuarial valuation requires management making
assumptions about future salary increases, discount
rates, mortality rates, etc. Management, at each
reporting date when the provision is re-examined,
tries to give its best estimate regarding the above
mentioned parameters.
2.9 Provision for restructuring costs
The Group estimates the level of provision required
for restructuring costs based on historical
experience as well as other specific relevant factors.
2.10 Contingent liabilities
The existence of contingent liabilities requires from
management making assumptions and estimates
continuously related to the possibility that future
events may or may not occur as well as the effects
that those events may have on the activities of the
Group.
2.11 Business combinations
On the acquisition of a company or business, a
determination of the fair value and the useful lives
of tangible and intangible assets acquired is
performed, which requires the application of
judgement. Future events could cause the
assumptions used by the Group to change which
could have an impact on the results and net
position of the Group. Further information on
business combination is given in paragraph 1.2.
6 Integrated Annual Report 2016
Notes to the Financial Statements
70
2.12 Valuation of financial instruments
The valuation of derivative financial instruments is
based on the market position at the reporting date.
The value of the derivative instruments fluctuates on
a daily basis and the actual amounts realised may
differ materially from their value at the reporting
date. Further information on financial instruments is
given in paragraph 1.27.
2.13 Fair value of share-based payments
Fair values used in calculating the amount to be
expensed as a share-based payment is subject to a
level of uncertainty. The Group is required to
calculate the fair value of the cash-settled
instruments granted to employees in terms of the
share option schemes, and the share-based
payment charges relating to empowerment
transactions. These fair values are calculated by
applying a valuation model, which is in itself
judgmental, and takes into account certain
inherently uncertain assumptions. The basic
assumptions that are used in the calculations are
explained further in note 22. Further information on
share based payments is given in paragraph 1.16d.
2.14 Weighted average number of shares
Using the weighted average number of shares
during the period reflects the possibility that the
amount of shareholders’ capital varied during the
period as a result of a larger or smaller number of
shares being outstanding at any time. Judgment is
required to determine the number of shares and the
timing when shares are issued. The calculation of
the weighted average number of shares impacts
the calculation of basic and diluted earnings per
share.
2.15 Put options
Put options were granted to the remaining non-
controlling shareholders of the Group subsidiary
Antea Cement SHA, entitling them to sell their
interests in Antea Cement SHA at future contracted
dates. The Group has recognized the fair value of
the non-controlling interests, being the present
value of the future estimated option price, as other
current liability in the statement of financial position
with a corresponding entry reducing non-controlling
interests. The present value and timing of the
expected redemptions and amounts need to be
determined at each reporting date.
2.16 Sources of estimation uncertainty
There are no significant assumptions made
concerning the future or other sources of estimation
uncertainty that have been identified as giving rise
to a significant risk of causing a material adjustment
to the carrying amount of assets and liabilities within
the next financial year.
2.17 Going concern
Management have taken into account the
following: a) the Company’s financial position, b)
the risks facing the Company that could impact on
its business model and capital adequacy and c)
the fact that no material uncertainties are identified
to the Company’s ability to continue as a going
concern in the foreseeable future and in any event
over a period of at least twelve months from the
date of approval of the Financial Statements and
states that it considers it appropriate for the
Company to continue to adopt the going concern
basis in preparing its Financial Statements and that
no material uncertainties are identified to the
Company’s ability to continue to adopt the going
concern basis in preparing its Financial Statements
in the foreseeable future and in any event over a
period of at least twelve months from the date of
approval of the Financial Statements.
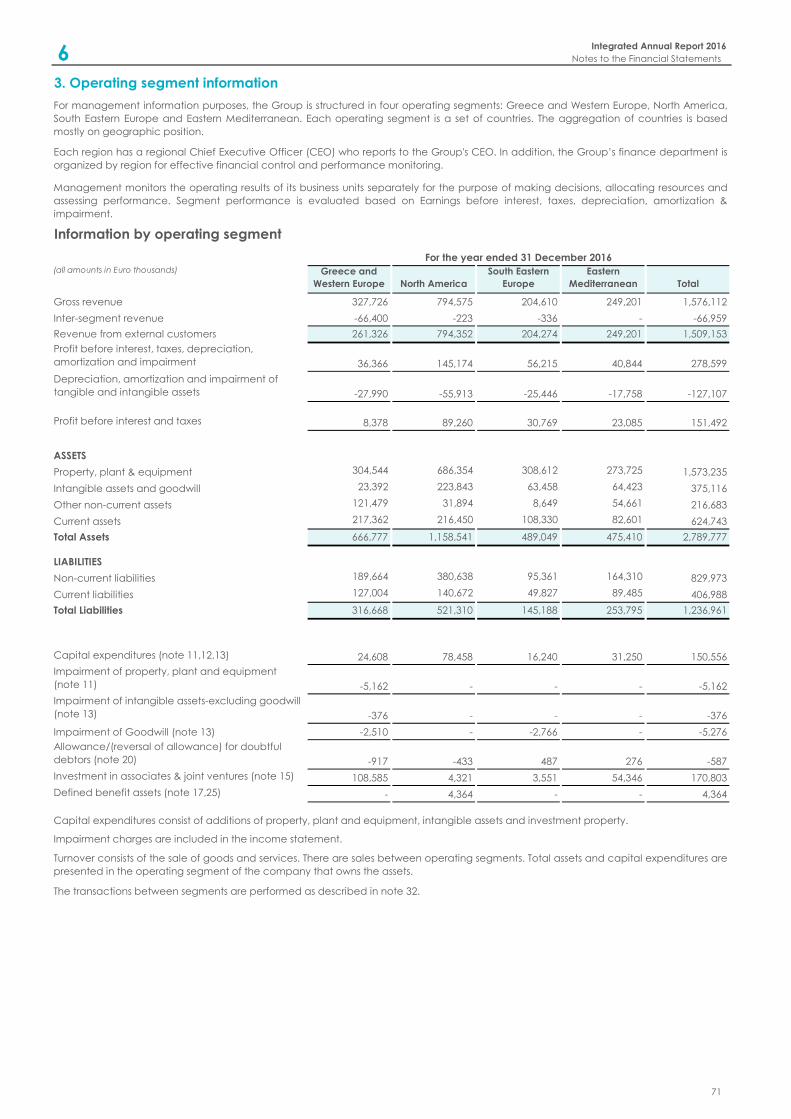
Information by operating segment
Greece and
Western Europe North America
South Eastern
Europe
Eastern
Mediterranean Total
Gross revenue 327,726 794,575 204,610 249,201 1,576,112
Inter-segment revenue -66,400 -223 -336 - -66,959
Revenue from external customers 261,326 794,352 204,274 249,201 1,509,153
Profit before interest, taxes, depreciation,
amortization and impairment 36,366 145,174 56,215 40,844 278,599
Depreciation, amortization and impairment of
tangible and intangible assets -27,990 -55,913 -25,446 -17,758 -127,107
Profit before interest and taxes 8,378 89,260 30,769 23,085 151,492
ASSETS
Property, plant & equipment 304,544 686,354 308,612 273,725 1,573,235
Intangible assets and goodwill 23,392 223,843 63,458 64,423 375,116
Other non-current assets 121,479 31,894 8,649 54,661 216,683
Current assets 217,362 216,450 108,330 82,601 624,743
Total Assets 666,777 1,158,541 489,049 475,410 2,789,777
LIABILITIES
Non-current liabilities 189,664 380,638 95,361 164,310 829,973
Current liabilities 127,004 140,672 49,827 89,485 406,988
Total Liabilities 316,668 521,310 145,188 253,795 1,236,961
Capital expenditures (note 11,12,13) 24,608 78,458 16,240 31,250 150,556
Impairment of property, plant and equipment
(note 11) -5,162 - - - -5,162
Impairment of intangible assets-excluding goodwill
(note 13) -376 - - - -376
Impairment of Goodwill (note 13) -2,510 - -2,766 - -5,276
Allowance/(reversal of allowance) for doubtful
debtors (note 20) -917 -433 487 276 -587
Investment in associates & joint ventures (note 15) 108,585 4,321 3,551 54,346 170,803
Defined benefit assets (note 17,25) - 4,364 - - 4,364
Capital expenditures consist of additions of property, plant and equipment, intangible assets and investment property.
Impairment charges are included in the income statement.
Turnover consists of the sale of goods and services. There are sales between operating segments. Total assets and capital expenditures are
presented in the operating segment of the company that owns the assets.
The transactions between segments are performed as described in note 32.
Management monitors the operating results of its business units separately for the purpose of making decisions, allocating resources and
assessing performance. Segment performance is evaluated based on Earnings before interest, taxes, depreciation, amortization &
impairment.
Each region has a regional Chief Executive Officer (CEO) who reports to the Group's CEO. In addition, the Group’s finance department is
organized by region for effective financial control and performance monitoring.
For management information purposes, the Group is structured in four operating segments: Greece and Western Europe, North America,
South Eastern Europe and Eastern Mediterranean. Each operating segment is a set of countries. The aggregation of countries is based
mostly on geographic position.
For the year ended 31 December 2016
3. Operating segment information
(all amounts in Euro thousands)
Integrated Annual Report 2016
Notes to the Financial Statements6
71
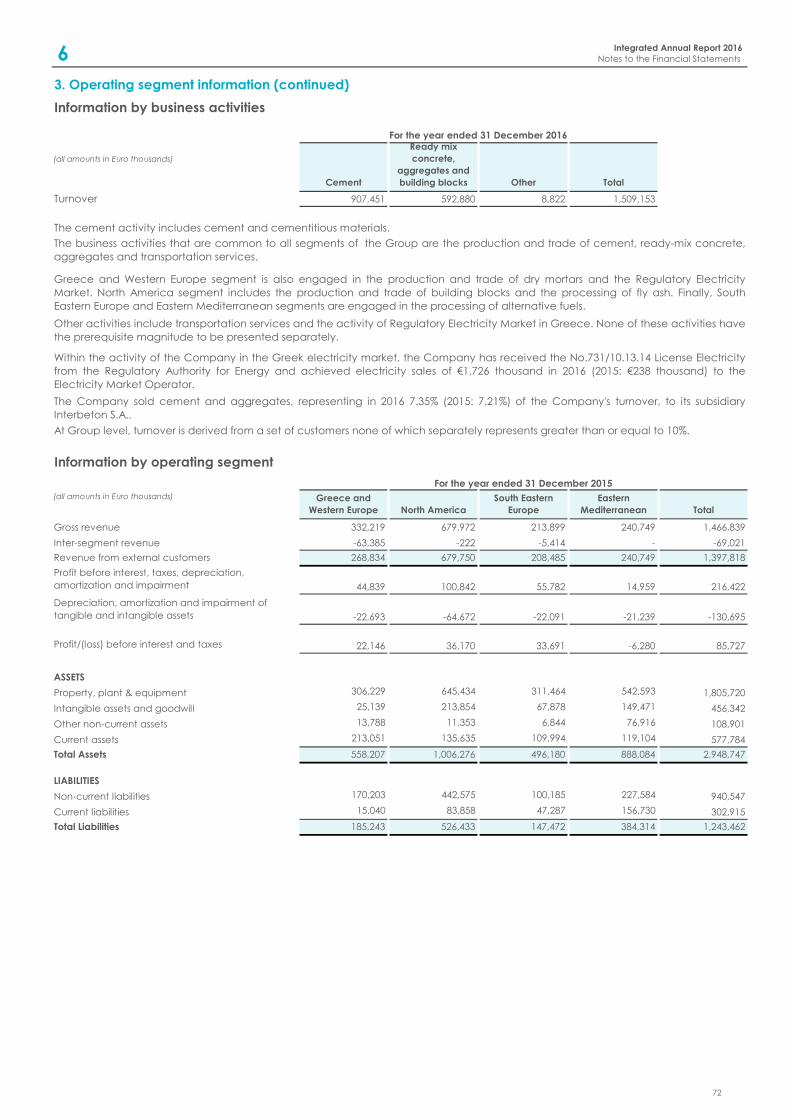
Information by business activities
Cement
Ready mix
concrete,
aggregates and
building blocks Other Total
Turnover 907,451 592,880 8,822 1,509,153
Information by operating segment
Greece and
Western Europe North America
South Eastern
Europe
Eastern
Mediterranean Total
Gross revenue 332,219 679,972 213,899 240,749 1,466,839
Inter-segment revenue -63,385 -222 -5,414 - -69,021
Revenue from external customers 268,834 679,750 208,485 240,749 1,397,818
Profit before interest, taxes, depreciation,
amortization and impairment 44,839 100,842 55,782 14,959 216,422
Depreciation, amortization and impairment of
tangible and intangible assets -22,693 -64,672 -22,091 -21,239 -130,695
Profit/(loss) before interest and taxes 22,146 36,170 33,691 -6,280 85,727
ASSETS
Property, plant & equipment 306,229 645,434 311,464 542,593 1,805,720
Intangible assets and goodwill 25,139 213,854 67,878 149,471 456,342
Other non-current assets 13,788 11,353 6,844 76,916 108,901
Current assets 213,051 135,635 109,994 119,104 577,784
Total Assets 558,207 1,006,276 496,180 888,084 2,948,747
LIABILITIES
Non-current liabilities 170,203 442,575 100,185 227,584 940,547
Current liabilities 15,040 83,858 47,287 156,730 302,915
Total Liabilities 185,243 526,433 147,472 384,314 1,243,462
For the year ended 31 December 2015
At Group level, turnover is derived from a set of customers none of which separately represents greater than or equal to 10%.
(all amounts in Euro thousands)
3. Operating segment information (continued)
The cement activity includes cement and cementitious materials.
Other activities include transportation services and the activity of Regulatory Electricity Market in Greece. None of these activities have
the prerequisite magnitude to be presented separately.
The Company sold cement and aggregates, representing in 2016 7.35% (2015: 7.21%) of the Company's turnover, to its subsidiary
Interbeton S.A..
Within the activity of the Company in the Greek electricity market, the Company has received the No.731/10.13.14 License Electricity
from the Regulatory Authority for Energy and achieved electricity sales of €1,726 thousand in 2016 (2015: €238 thousand) to the
Electricity Market Operator.
Greece and Western Europe segment is also engaged in the production and trade of dry mortars and the Regulatory Electricity
Market. North America segment includes the production and trade of building blocks and the processing of fly ash. Finally, South
Eastern Europe and Eastern Mediterranean segments are engaged in the processing of alternative fuels.
The business activities that are common to all segments of the Group are the production and trade of cement, ready-mix concrete,
aggregates and transportation services.
For the year ended 31 December 2016
(all amounts in Euro thousands)
Integrated Annual Report 2016
Notes to the Financial Statements6
72
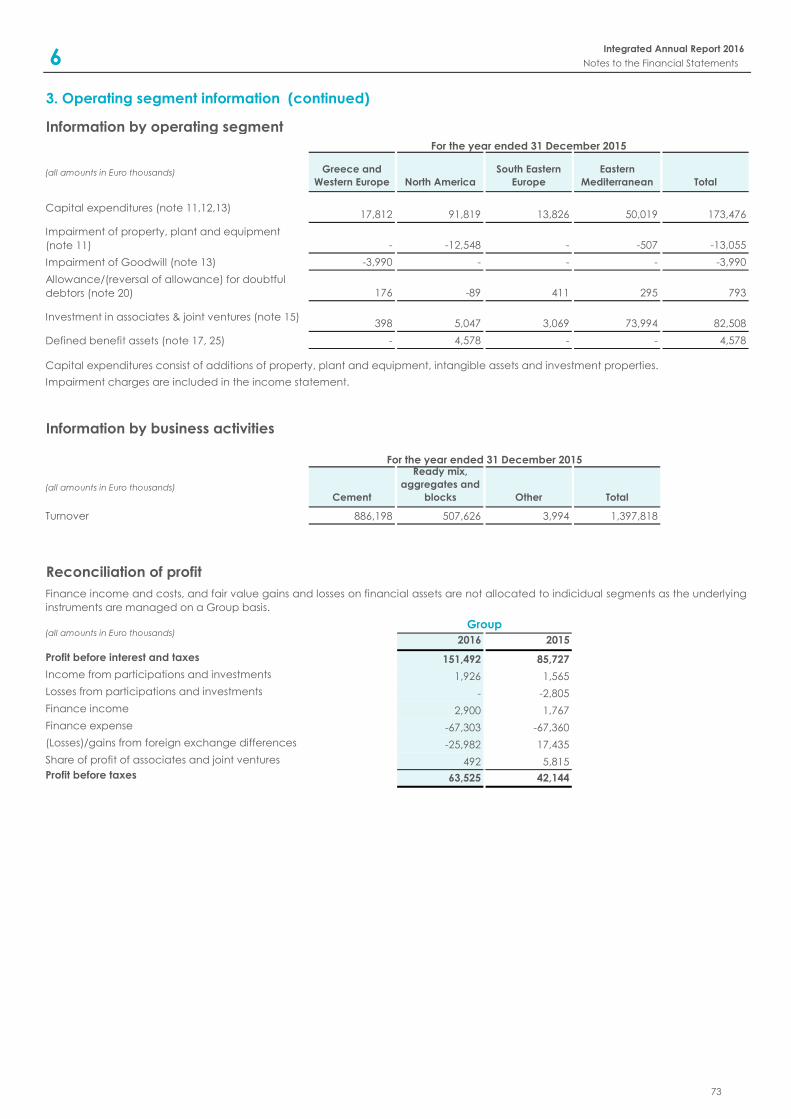
Information by operating segment
(all amounts in Euro thousands) Greece and
Western Europe North America
South Eastern
Europe
Eastern
Mediterranean Total
Capital expenditures (note 11,12,13)17,812 91,819 13,826 50,019 173,476
Impairment of property, plant and equipment
(note 11) - -12,548 - -507 -13,055
Impairment of Goodwill (note 13) -3,990 - - - -3,990
Allowance/(reversal of allowance) for doubtful
debtors (note 20) 176 -89 411 295 793
Investment in associates & joint ventures (note 15)398 5,047 3,069 73,994 82,508
Defined benefit assets (note 17, 25) - 4,578 - - 4,578
Information by business activities
(all amounts in Euro thousands)Cement
Ready mix,
aggregates and
blocks Other Total
Turnover 886,198 507,626 3,994 1,397,818
Reconciliation of profit
2016 2015
Profit before interest and taxes 151,492 85,727
Income from participations and investments 1,926 1,565
Losses from participations and investments - -2,805
Finance income 2,900 1,767
Finance expense -67,303 -67,360
(Losses)/gains from foreign exchange differences -25,982 17,435
Share of profit of associates and joint ventures 492 5,815
Profit before taxes 63,525 42,144
Finance income and costs, and fair value gains and losses on financial assets are not allocated to indicidual segments as the underlying
instruments are managed on a Group basis.
Group
Impairment charges are included in the income statement.
Capital expenditures consist of additions of property, plant and equipment, intangible assets and investment properties.
3. Operating segment information (continued)
For the year ended 31 December 2015
For the year ended 31 December 2015
(all amounts in Euro thousands)
Integrated Annual Report 2016
Notes to the Financial Statements6
73
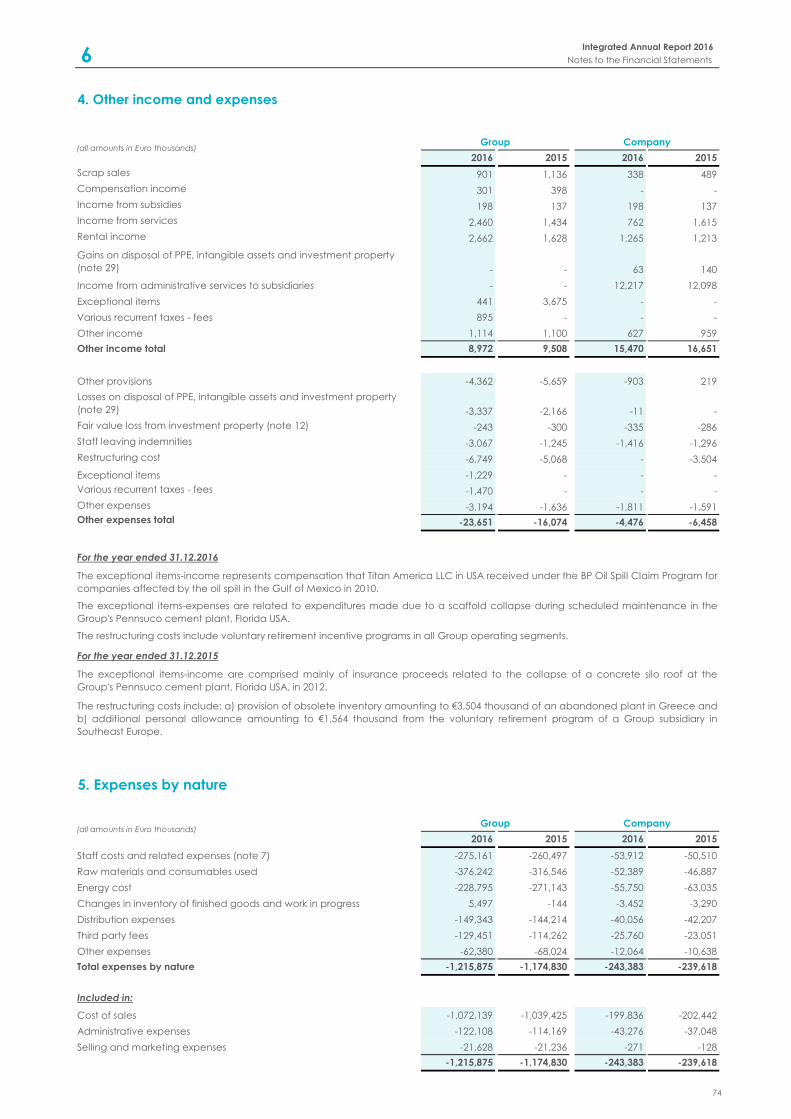
4. Other income and expenses
2016 2015 2016 2015
Scrap sales 901 1,136 338 489
Compensation income 301 398 - -
Income from subsidies 198 137 198 137
Income from services 2,460 1,434 762 1,615
Rental income 2,662 1,628 1,265 1,213
Gains on disposal of PPE, intangible assets and investment property
(note 29) - - 63 140
Income from administrative services to subsidiaries - - 12,217 12,098
Exceptional items 441 3,675 - -
Various recurrent taxes - fees 895 - - -
Other income 1,114 1,100 627 959
Other income total 8,972 9,508 15,470 16,651
Other provisions -4,362 -5,659 -903 219
Losses on disposal of PPE, intangible assets and investment property
(note 29) -3,337 -2,166 -11 -
Fair value loss from investment property (note 12) -243 -300 -335 -286
Staff leaving indemnities -3,067 -1,245 -1,416 -1,296
Restructuring cost -6,749 -5,068 - -3,504
Exceptional items -1,229 - - -
Various recurrent taxes - fees -1,470 - - -
Other expenses -3,194 -1,636 -1,811 -1,591
Other expenses total -23,651 -16,074 -4,476 -6,458
2016 2015 2016 2015
Staff costs and related expenses (note 7) -275,161 -260,497 -53,912 -50,510
Raw materials and consumables used -376,242 -316,546 -52,389 -46,887
Energy cost -228,795 -271,143 -55,750 -63,035
Changes in inventory of finished goods and work in progress 5,497 -144 -3,452 -3,290
Distribution expenses -149,343 -144,214 -40,056 -42,207
Third party fees -129,451 -114,262 -25,760 -23,051
Other expenses -62,380 -68,024 -12,064 -10,638
Total expenses by nature -1,215,875 -1,174,830 -243,383 -239,618
Included in:
Cost of sales -1,072,139 -1,039,425 -199,836 -202,442
Administrative expenses -122,108 -114,169 -43,276 -37,048
Selling and marketing expenses -21,628 -21,236 -271 -128
-1,215,875 -1,174,830 -243,383 -239,618
The exceptional items-expenses are related to expenditures made due to a scaffold collapse during scheduled maintenance in the
Group's Pennsuco cement plant, Florida USA.
The exceptional items-income are comprised mainly of insurance proceeds related to the collapse of a concrete silo roof at the
Group's Pennsuco cement plant, Florida USA, in 2012.
The restructuring costs include voluntary retirement incentive programs in all Group operating segments.
The exceptional items-income represents compensation that Titan America LLC in USA received under the BP Oil Spill Claim Program for
companies affected by the oil spill in the Gulf of Mexico in 2010.
Group Company
Group Company
5. Expenses by nature
For the year ended 31.12.2015
The restructuring costs include: a) provision of obsolete inventory amounting to €3,504 thousand of an abandoned plant in Greece and
b) additional personal allowance amounting to €1,564 thousand from the voluntary retirement program of a Group subsidiary in
Southeast Europe.
(all amounts in Euro thousands)
(all amounts in Euro thousands)
For the year ended 31.12.2016
Integrated Annual Report 2016
Notes to the Financial Statements6
74
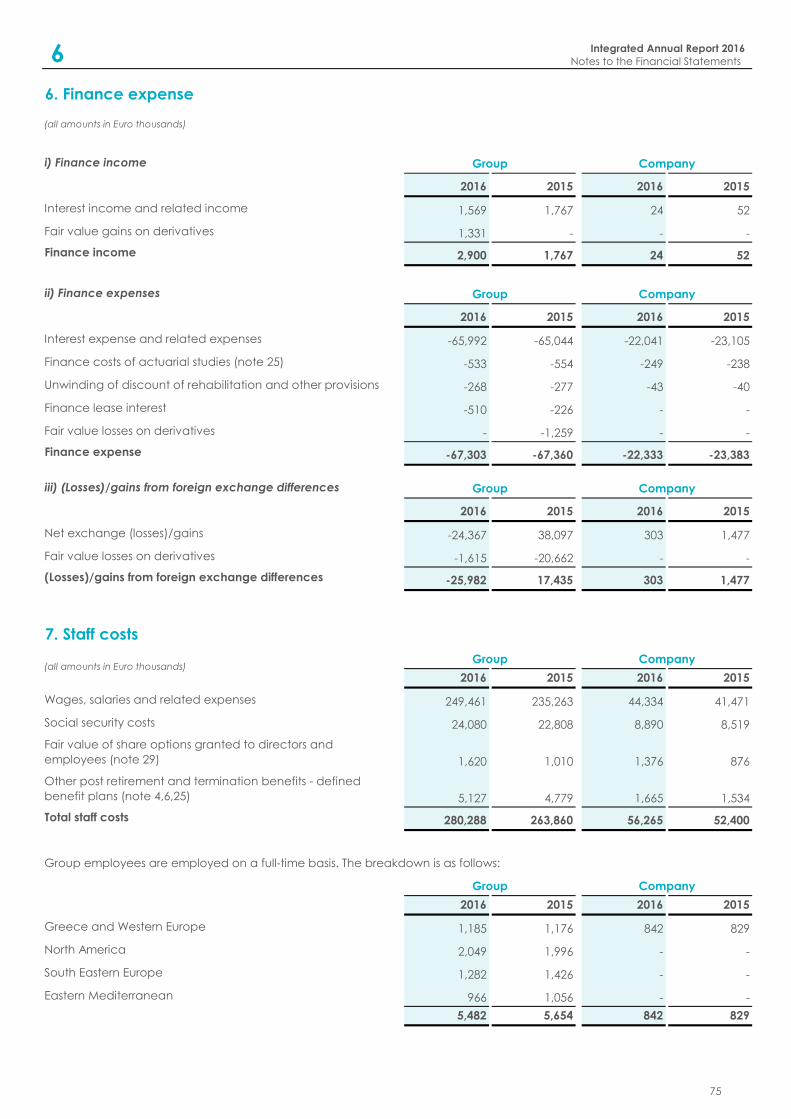
6. Finance expense
(all amounts in Euro thousands)
i) Finance income
2016 2015 2016 2015
Interest income and related income 1,569 1,767 24 52
Fair value gains on derivatives 1,331 - - -
Finance income 2,900 1,767 24 52
ii) Finance expenses
2016 2015 2016 2015
Interest expense and related expenses -65,992 -65,044 -22,041 -23,105
Finance costs of actuarial studies (note 25) -533 -554 -249 -238
Unwinding of discount of rehabilitation and other provisions -268 -277 -43 -40
Finance lease interest -510 -226 - -
Fair value losses on derivatives - -1,259 - -
Finance expense -67,303 -67,360 -22,333 -23,383
iii) (Losses)/gains from foreign exchange differences
2016 2015 2016 2015
Net exchange (losses)/gains -24,367 38,097 303 1,477
Fair value losses on derivatives -1,615 -20,662 - -
(Losses)/gains from foreign exchange differences -25,982 17,435 303 1,477
7. Staff costs
2016 2015 2016 2015
Wages, salaries and related expenses 249,461 235,263 44,334 41,471
Social security costs 24,080 22,808 8,890 8,519
Fair value of share options granted to directors and
employees (note 29) 1,620 1,010 1,376 876
Other post retirement and termination benefits - defined
benefit plans (note 4,6,25) 5,127 4,779 1,665 1,534
Total staff costs 280,288 263,860 56,265 52,400
2016 2015 2016 2015
Greece and Western Europe 1,185 1,176 842 829
North America 2,049 1,996 - -
South Eastern Europe 1,282 1,426 - -
Eastern Mediterranean 966 1,056 - -
5,482 5,654 842 829
(all amounts in Euro thousands)
Group employees are employed on a full-time basis. The breakdown is as follows:
Group Company
Group Company
Group Company
Group Company
Group Company
Integrated Annual Report 2016
Notes to the Financial Statements6
75
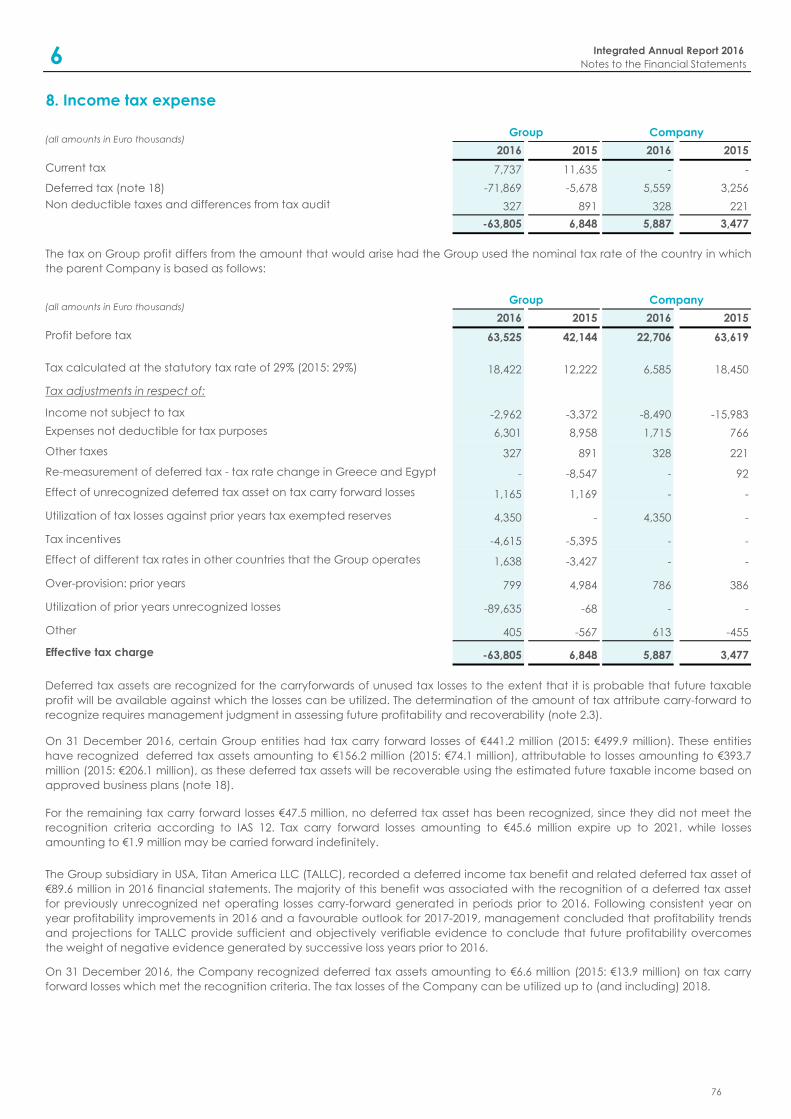
8. Income tax expense
2016 2015 2016 2015
Current tax 7,737 11,635 - -
Deferred tax (note 18) -71,869 -5,678 5,559 3,256
Non deductible taxes and differences from tax audit 327 891 328 221
-63,805 6,848 5,887 3,477
2016 2015 2016 2015
Profit before tax 63,525 42,144 22,706 63,619
Tax calculated at the statutory tax rate of 29% (2015: 29%) 18,422 12,222 6,585 18,450
Tax adjustments in respect of:
Income not subject to tax -2,962 -3,372 -8,490 -15,983
Expenses not deductible for tax purposes 6,301 8,958 1,715 766
Other taxes 327 891 328 221
Re-measurement of deferred tax - tax rate change in Greece and Egypt - -8,547 - 92
Effect of unrecognized deferred tax asset on tax carry forward losses 1,165 1,169 - -
Utilization of tax losses against prior years tax exempted reserves 4,350 - 4,350 -
Tax incentives -4,615 -5,395 - -
Effect of different tax rates in other countries that the Group operates 1,638 -3,427 - -
Over-provision: prior years 799 4,984 786 386
Utilization of prior years unrecognized losses -89,635 -68 - -
Other 405 -567 613 -455
Effective tax charge -63,805 6,848 5,887 3,477
Group
On 31 December 2016, certain Group entities had tax carry forward losses of €441.2 million (2015: €499.9 million). These entities
have recognized deferred tax assets amounting to €156.2 million (2015: €74.1 million), attributable to losses amounting to €393.7
million (2015: €206.1 million), as these deferred tax assets will be recoverable using the estimated future taxable income based on
approved business plans (note 18).
Company(all amounts in Euro thousands)
Group
The tax on Group profit differs from the amount that would arise had the Group used the nominal tax rate of the country in which
the parent Company is based as follows:
Deferred tax assets are recognized for the carryforwards of unused tax losses to the extent that it is probable that future taxable
profit will be available against which the losses can be utilized. The determination of the amount of tax attribute carry-forward to
recognize requires management judgment in assessing future profitability and recoverability (note 2.3).
(all amounts in Euro thousands)Company
The Group subsidiary in USA, Titan America LLC (TALLC), recorded a deferred income tax benefit and related deferred tax asset of
€89.6 million in 2016 financial statements. The majority of this benefit was associated with the recognition of a deferred tax asset
for previously unrecognized net operating losses carry-forward generated in periods prior to 2016. Following consistent year on
year profitability improvements in 2016 and a favourable outlook for 2017-2019, management concluded that profitability trends
and projections for TALLC provide sufficient and objectively verifiable evidence to conclude that future profitability overcomes
the weight of negative evidence generated by successive loss years prior to 2016.
On 31 December 2016, the Company recognized deferred tax assets amounting to €6.6 million (2015: €13.9 million) on tax carry
forward losses which met the recognition criteria. The tax losses of the Company can be utilized up to (and including) 2018.
For the remaining tax carry forward losses €47.5 million, no deferred tax asset has been recognized, since they did not meet the
recognition criteria according to IAS 12. Tax carry forward losses amounting to €45.6 million expire up to 2021, while losses
amounting to €1.9 million may be carried forward indefinitely.
Integrated Annual Report 2016
Notes to the Financial Statements6
76
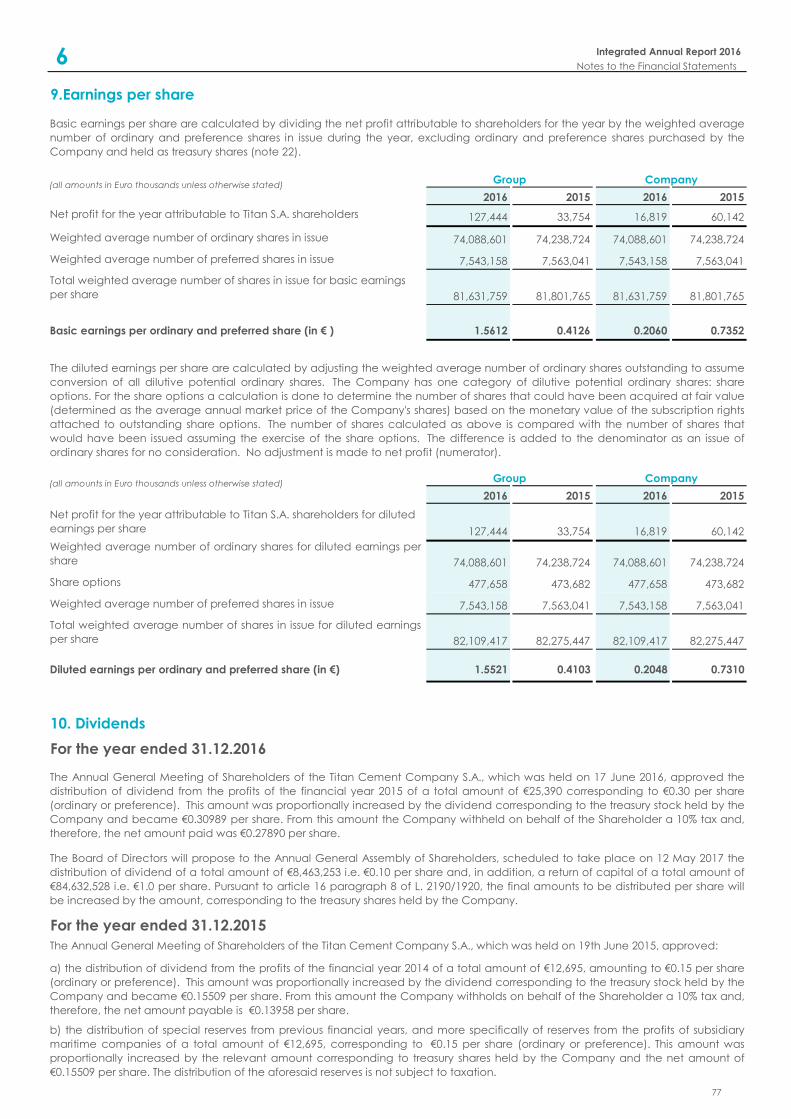
9.Earnings per share
2016 2015 2016 2015
Net profit for the year attributable to Titan S.A. shareholders 127,444 33,754 16,819 60,142
Weighted average number of ordinary shares in issue 74,088,601 74,238,724 74,088,601 74,238,724
Weighted average number of preferred shares in issue 7,543,158 7,563,041 7,543,158 7,563,041
Total weighted average number of shares in issue for basic earnings
per share 81,631,759 81,801,765 81,631,759 81,801,765
Basic earnings per ordinary and preferred share (in € ) 1.5612 0.4126 0.2060 0.7352
2016 2015 2016 2015
Net profit for the year attributable to Titan S.A. shareholders for diluted
earnings per share 127,444 33,754 16,819 60,142
Weighted average number of ordinary shares for diluted earnings per
share 74,088,601 74,238,724 74,088,601 74,238,724
Share options 477,658 473,682 477,658 473,682
Weighted average number of preferred shares in issue 7,543,158 7,563,041 7,543,158 7,563,041
Total weighted average number of shares in issue for diluted earnings
per share 82,109,417 82,275,447 82,109,417 82,275,447
Diluted earnings per ordinary and preferred share (in €) 1.5521 0.4103 0.2048 0.7310
10. Dividends
The Annual General Meeting of Shareholders of the Titan Cement Company S.A., which was held on 17 June 2016, approved the
distribution of dividend from the profits of the financial year 2015 of a total amount of €25,390 corresponding to €0.30 per share
(ordinary or preference). This amount was proportionally increased by the dividend corresponding to the treasury stock held by the
Company and became €0.30989 per share. From this amount the Company withheld on behalf of the Shareholder a 10% tax and,
therefore, the net amount paid was €0.27890 per share.
Basic earnings per share are calculated by dividing the net profit attributable to shareholders for the year by the weighted average
number of ordinary and preference shares in issue during the year, excluding ordinary and preference shares purchased by the
Company and held as treasury shares (note 22).
The diluted earnings per share are calculated by adjusting the weighted average number of ordinary shares outstanding to assume
conversion of all dilutive potential ordinary shares. The Company has one category of dilutive potential ordinary shares: share
options. For the share options a calculation is done to determine the number of shares that could have been acquired at fair value
(determined as the average annual market price of the Company's shares) based on the monetary value of the subscription rights
attached to outstanding share options. The number of shares calculated as above is compared with the number of shares that
would have been issued assuming the exercise of the share options. The difference is added to the denominator as an issue of
ordinary shares for no consideration. No adjustment is made to net profit (numerator).
Group Company
Group Company
For the year ended 31.12.2016
(all amounts in Euro thousands unless otherwise stated)
(all amounts in Euro thousands unless otherwise stated)
b) the distribution of special reserves from previous financial years, and more specifically of reserves from the profits of subsidiary
maritime companies of a total amount of €12,695, corresponding to €0.15 per share (ordinary or preference). This amount was
proportionally increased by the relevant amount corresponding to treasury shares held by the Company and the net amount of
€0.15509 per share. The distribution of the aforesaid reserves is not subject to taxation.
The Annual General Meeting of Shareholders of the Titan Cement Company S.A., which was held on 19th June 2015, approved:
a) the distribution of dividend from the profits of the financial year 2014 of a total amount of €12,695, amounting to €0.15 per share
(ordinary or preference). This amount was proportionally increased by the dividend corresponding to the treasury stock held by the
Company and became €0.15509 per share. From this amount the Company withholds on behalf of the Shareholder a 10% tax and,
therefore, the net amount payable is €0.13958 per share.
For the year ended 31.12.2015
The Board of Directors will propose to the Annual General Assembly of Shareholders, scheduled to take place on 12 May 2017 the
distribution of dividend of a total amount of €8,463,253 i.e. €0.10 per share and, in addition, a return of capital of a total amount of
€84,632,528 i.e. €1.0 per share. Pursuant to article 16 paragraph 8 of L. 2190/1920, the final amounts to be distributed per share will
be increased by the amount, corresponding to the treasury shares held by the Company.
Integrated Annual Report 2016
Notes to the Financial Statements6
77
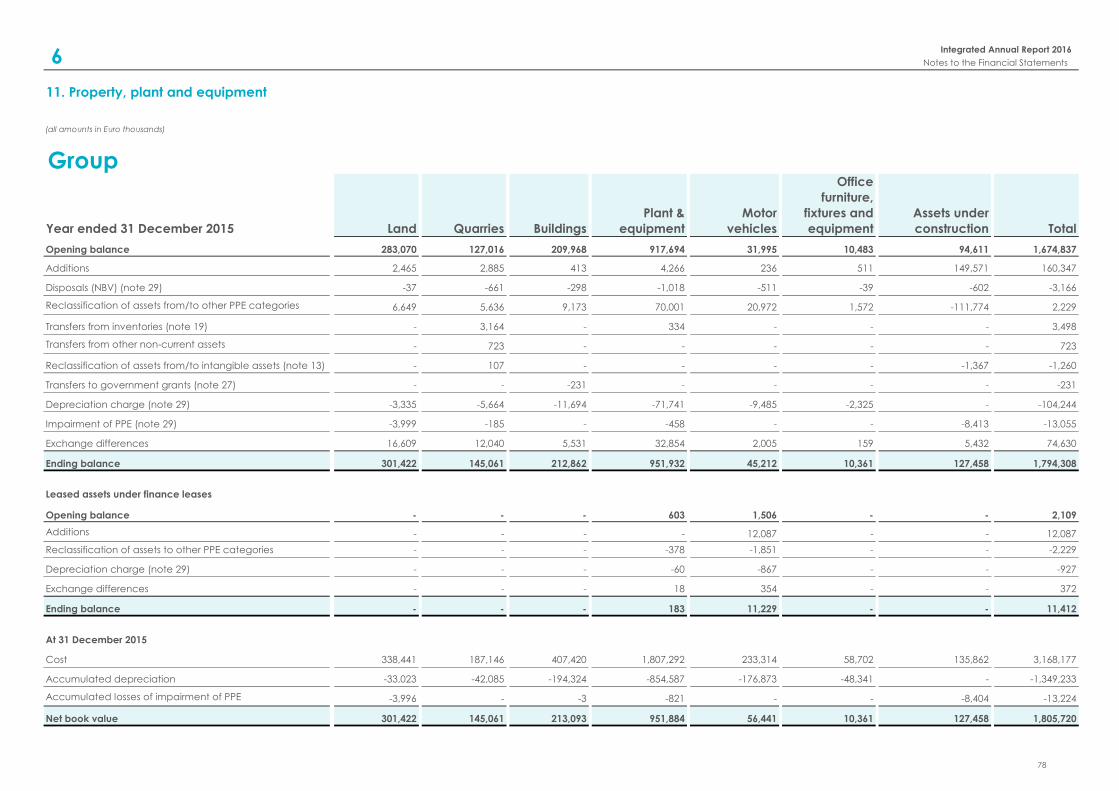
11. Property, plant and equipment
(all amounts in Euro thousands)
Group
Year ended 31 December 2015 Land Quarries Buildings
Plant &
equipment
Motor
vehicles
Office
furniture,
fixtures and
equipment
Assets under
construction Total
Opening balance 283,070 127,016 209,968 917,694 31,995 10,483 94,611 1,674,837
Additions 2,465 2,885 413 4,266 236 511 149,571 160,347
Disposals (NBV) (note 29) -37 -661 -298 -1,018 -511 -39 -602 -3,166
Reclassification of assets from/to other PPE categories 6,649 5,636 9,173 70,001 20,972 1,572 -111,774 2,229
Transfers from inventories (note 19) - 3,164 - 334 - - - 3,498
Transfers from other non-current assets - 723 - - - - - 723
Reclassification of assets from/to intangible assets (note 13) - 107 - - - - -1,367 -1,260
Transfers to government grants (note 27) - - -231 - - - - -231
Depreciation charge (note 29) -3,335 -5,664 -11,694 -71,741 -9,485 -2,325 - -104,244
Impairment of PPE (note 29) -3,999 -185 - -458 - - -8,413 -13,055
Exchange differences 16,609 12,040 5,531 32,854 2,005 159 5,432 74,630
Ending balance 301,422 145,061 212,862 951,932 45,212 10,361 127,458 1,794,308
Opening balance - - - 603 1,506 - - 2,109
Additions - - - - 12,087 - - 12,087
Reclassification of assets to other PPE categories - - - -378 -1,851 - - -2,229
Depreciation charge (note 29) - - - -60 -867 - - -927
Exchange differences - - - 18 354 - - 372
Ending balance - - - 183 11,229 - - 11,412
At 31 December 2015
Cost 338,441 187,146 407,420 1,807,292 233,314 58,702 135,862 3,168,177
Accumulated depreciation -33,023 -42,085 -194,324 -854,587 -176,873 -48,341 - -1,349,233
Accumulated losses of impairment of PPE -3,996 - -3 -821 - - -8,404 -13,224
Net book value 301,422 145,061 213,093 951,884 56,441 10,361 127,458 1,805,720
Leased assets under finance leases
Integrated Annual Report 2016
Notes to the Financial Statements6
78
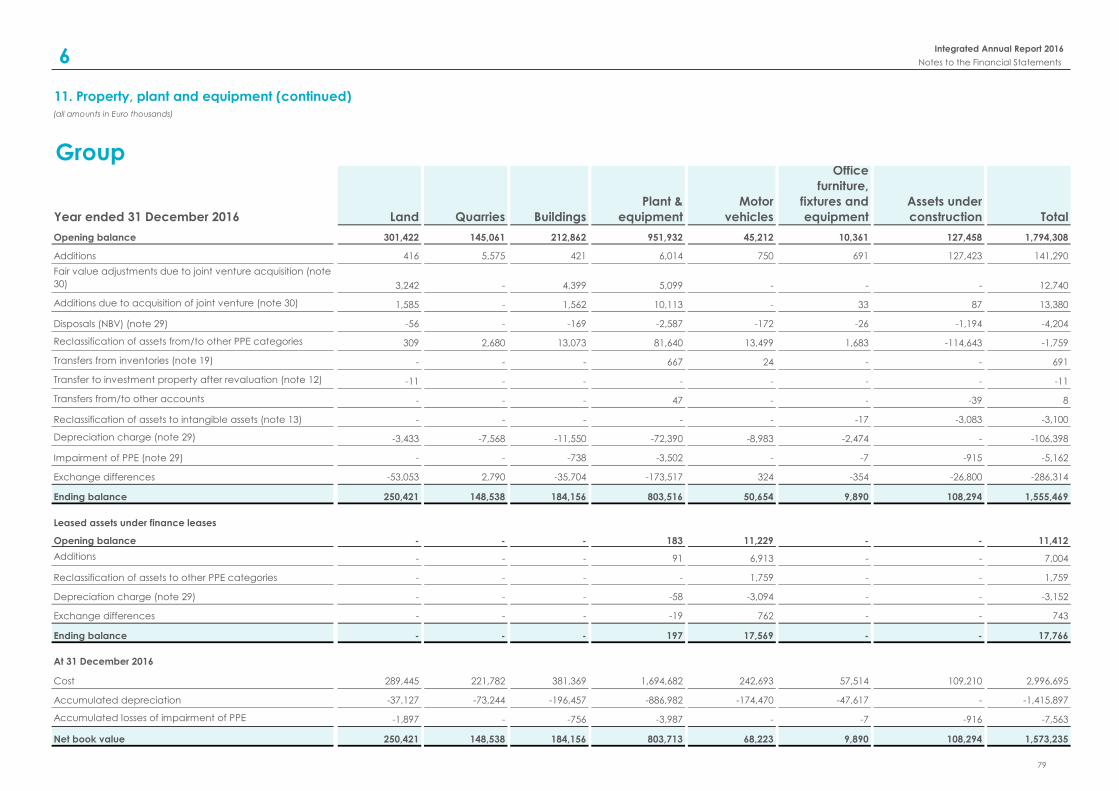
11. Property, plant and equipment (continued)(all amounts in Euro thousands)
Group
Year ended 31 December 2016 Land Quarries Buildings
Plant &
equipment
Motor
vehicles
Office
furniture,
fixtures and
equipment
Assets under
construction Total
Opening balance 301,422 145,061 212,862 951,932 45,212 10,361 127,458 1,794,308
Additions 416 5,575 421 6,014 750 691 127,423 141,290
Fair value adjustments due to joint venture acquisition (note
30) 3,242 - 4,399 5,099 - - - 12,740
Additions due to acquisition of joint venture (note 30) 1,585 - 1,562 10,113 - 33 87 13,380
Disposals (NBV) (note 29) -56 - -169 -2,587 -172 -26 -1,194 -4,204
Reclassification of assets from/to other PPE categories 309 2,680 13,073 81,640 13,499 1,683 -114,643 -1,759
Transfers from inventories (note 19) - - - 667 24 - - 691
Transfer to investment property after revaluation (note 12) -11 - - - - - - -11
Transfers from/to other accounts - - - 47 - - -39 8
Reclassification of assets to intangible assets (note 13) - - - - - -17 -3,083 -3,100
Depreciation charge (note 29) -3,433 -7,568 -11,550 -72,390 -8,983 -2,474 - -106,398
Impairment of PPE (note 29) - - -738 -3,502 - -7 -915 -5,162
Exchange differences -53,053 2,790 -35,704 -173,517 324 -354 -26,800 -286,314
Ending balance 250,421 148,538 184,156 803,516 50,654 9,890 108,294 1,555,469
Opening balance - - - 183 11,229 - - 11,412
Additions - - - 91 6,913 - - 7,004
Reclassification of assets to other PPE categories - - - - 1,759 - - 1,759
Depreciation charge (note 29) - - - -58 -3,094 - - -3,152
Exchange differences - - - -19 762 - - 743
Ending balance - - - 197 17,569 - - 17,766
At 31 December 2016
Cost 289,445 221,782 381,369 1,694,682 242,693 57,514 109,210 2,996,695
Accumulated depreciation -37,127 -73,244 -196,457 -886,982 -174,470 -47,617 - -1,415,897
Accumulated losses of impairment of PPE -1,897 - -756 -3,987 - -7 -916 -7,563
Net book value 250,421 148,538 184,156 803,713 68,223 9,890 108,294 1,573,235
Leased assets under finance leases
Integrated Annual Report 2016
Notes to the Financial Statements6
79
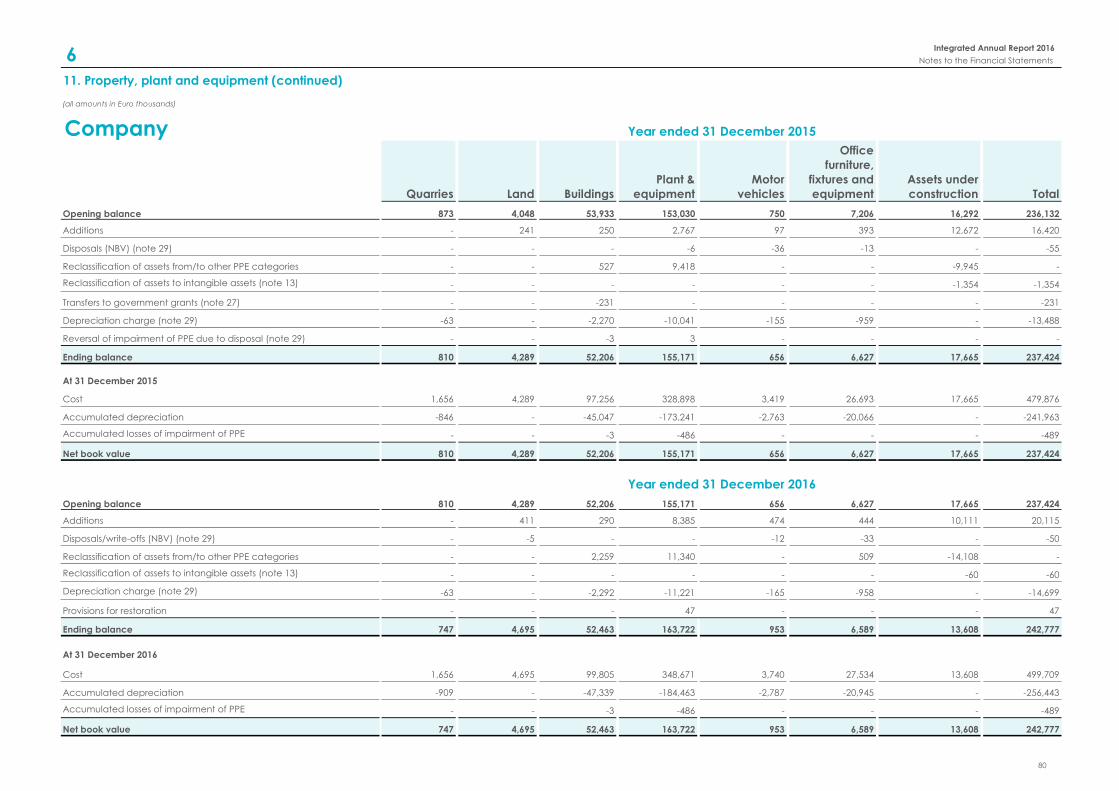
11. Property, plant and equipment (continued)
(all amounts in Euro thousands)
Company
Quarries Land Buildings
Plant &
equipment
Motor
vehicles
Office
furniture,
fixtures and
equipment
Assets under
construction Total
Opening balance 873 4,048 53,933 153,030 750 7,206 16,292 236,132
Additions - 241 250 2,767 97 393 12,672 16,420
Disposals (NBV) (note 29) - - - -6 -36 -13 - -55
Reclassification of assets from/to other PPE categories - - 527 9,418 - - -9,945 -
Reclassification of assets to intangible assets (note 13) - - - - - - -1,354 -1,354
Transfers to government grants (note 27) - - -231 - - - - -231
Depreciation charge (note 29) -63 - -2,270 -10,041 -155 -959 - -13,488
Reversal of impairment of PPE due to disposal (note 29) - - -3 3 - - - -
Ending balance 810 4,289 52,206 155,171 656 6,627 17,665 237,424
At 31 December 2015
Cost 1,656 4,289 97,256 328,898 3,419 26,693 17,665 479,876
Accumulated depreciation -846 - -45,047 -173,241 -2,763 -20,066 - -241,963
Accumulated losses of impairment of PPE - - -3 -486 - - - -489
Net book value 810 4,289 52,206 155,171 656 6,627 17,665 237,424
- - - - - - - -
Opening balance 810 4,289 52,206 155,171 656 6,627 17,665 237,424
Additions - 411 290 8,385 474 444 10,111 20,115
Disposals/write-offs (NBV) (note 29) - -5 - - -12 -33 - -50
Reclassification of assets from/to other PPE categories - - 2,259 11,340 - 509 -14,108 -
Reclassification of assets to intangible assets (note 13) - - - - - - -60 -60
Depreciation charge (note 29) -63 - -2,292 -11,221 -165 -958 - -14,699
Provisions for restoration - - - 47 - - - 47
Ending balance 747 4,695 52,463 163,722 953 6,589 13,608 242,777
At 31 December 2016
Cost 1,656 4,695 99,805 348,671 3,740 27,534 13,608 499,709
Accumulated depreciation -909 - -47,339 -184,463 -2,787 -20,945 - -256,443
Accumulated losses of impairment of PPE - - -3 -486 - - - -489
Net book value 747 4,695 52,463 163,722 953 6,589 13,608 242,777
Year ended 31 December 2015
Year ended 31 December 2016
Integrated Annual Report 2016
Notes to the Financial Statements6
80
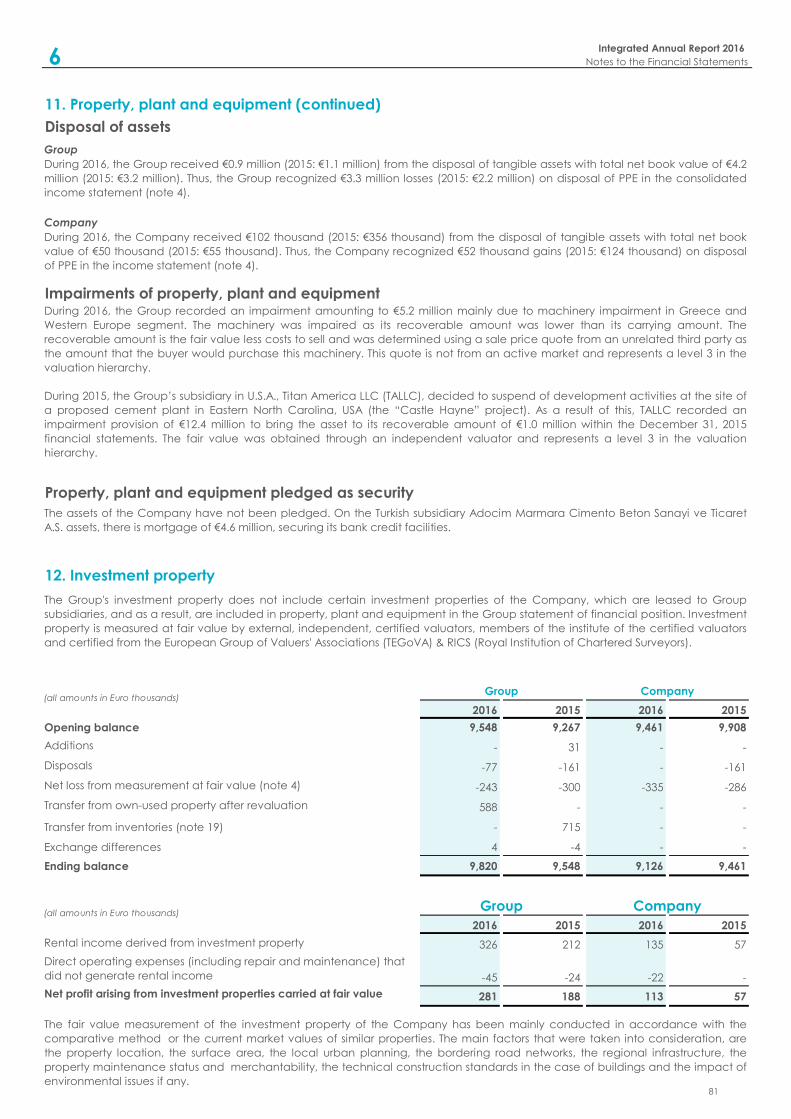
11. Property, plant and equipment (continued)
Disposal of assets
Impairments of property, plant and equipment
Property, plant and equipment pledged as security
12. Investment property
2016 2015 2016 2015
Opening balance 9,548 9,267 9,461 9,908
Additions - 31 - -
Disposals -77 -161 - -161
Net loss from measurement at fair value (note 4) -243 -300 -335 -286
Transfer from own-used property after revaluation 588 - - -
Transfer from inventories (note 19) - 715 - -
Exchange differences 4 -4 - -
Ending balance 9,820 9,548 9,126 9,461
2016 2015 2016 2015
Rental income derived from investment property 326 212 135 57
Direct operating expenses (including repair and maintenance) that
did not generate rental income -45 -24 -22 -
Net profit arising from investment properties carried at fair value 281 188 113 57
The fair value measurement of the investment property of the Company has been mainly conducted in accordance with the
comparative method or the current market values of similar properties. The main factors that were taken into consideration, are
the property location, the surface area, the local urban planning, the bordering road networks, the regional infrastructure, the
property maintenance status and merchantability, the technical construction standards in the case of buildings and the impact of
environmental issues if any.
The Group's investment property does not include certain investment properties of the Company, which are leased to Group
subsidiaries, and as a result, are included in property, plant and equipment in the Group statement of financial position. Investment
property is measured at fair value by external, independent, certified valuators, members of the institute of the certified valuators
and certified from the European Group of Valuers' Associations (TEGoVA) & RICS (Royal Institution of Chartered Surveyors).
Group Company
Group Company
(all amounts in Euro thousands)
(all amounts in Euro thousands)
The assets of the Company have not been pledged. On the Turkish subsidiary Adocim Marmara Cimento Beton Sanayi ve Ticaret
A.S. assets, there is mortgage of €4.6 million, securing its bank credit facilities.
During 2015, the Group’s subsidiary in U.S.A., Titan America LLC (TALLC), decided to suspend of development activities at the site of
a proposed cement plant in Eastern North Carolina, USA (the “Castle Hayne” project). As a result of this, TALLC recorded an
impairment provision of €12.4 million to bring the asset to its recoverable amount of €1.0 million within the December 31, 2015
financial statements. The fair value was obtained through an independent valuator and represents a level 3 in the valuation
hierarchy.
During 2016, the Group received €0.9 million (2015: €1.1 million) from the disposal of tangible assets with total net book value of €4.2
million (2015: €3.2 million). Thus, the Group recognized €3.3 million losses (2015: €2.2 million) on disposal of PPE in the consolidated
income statement (note 4).
Company
During 2016, the Company received €102 thousand (2015: €356 thousand) from the disposal of tangible assets with total net book
value of €50 thousand (2015: €55 thousand). Thus, the Company recognized €52 thousand gains (2015: €124 thousand) on disposal
of PPE in the income statement (note 4).
Group
During 2016, the Group recorded an impairment amounting to €5.2 million mainly due to machinery impairment in Greece and
Western Europe segment. The machinery was impaired as its recoverable amount was lower than its carrying amount. The
recoverable amount is the fair value less costs to sell and was determined using a sale price quote from an unrelated third party as
the amount that the buyer would purchase this machinery. This quote is not from an active market and represents a level 3 in the
valuation hierarchy.
Integrated Annual Report 2016
Notes to the Financial Statements6
81
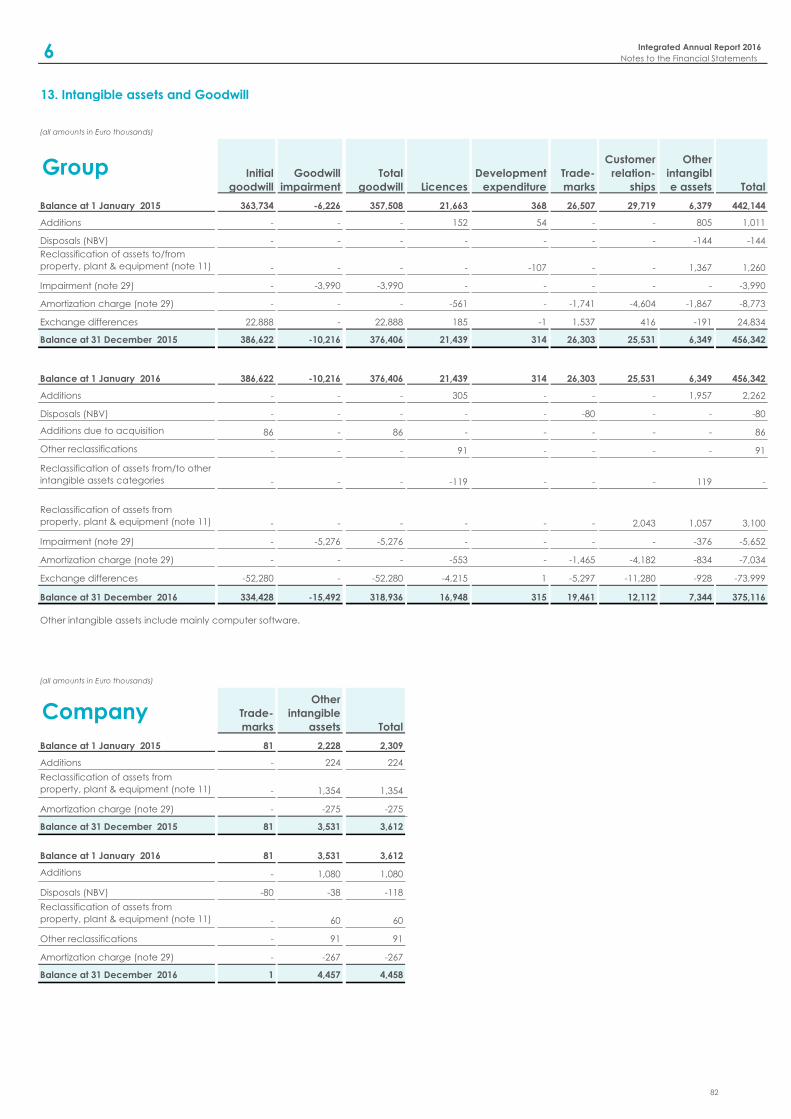
13. Intangible assets and Goodwill
(all amounts in Euro thousands)
Group Initial
goodwill
Goodwill
impairment
Total
goodwill Licences
Development
expenditure
Trade-
marks
Customer
relation-
ships
Other
intangibl
e assets Total
Balance at 1 January 2015 363,734 -6,226 357,508 21,663 368 26,507 29,719 6,379 442,144
Additions - - - 152 54 - - 805 1,011
Disposals (NBV) - - - - - - - -144 -144
Reclassification of assets to/from
property, plant & equipment (note 11) - - - - -107 - - 1,367 1,260
Impairment (note 29) - -3,990 -3,990 - - - - - -3,990
Amortization charge (note 29) - - - -561 - -1,741 -4,604 -1,867 -8,773
Exchange differences 22,888 - 22,888 185 -1 1,537 416 -191 24,834
Balance at 31 December 2015 386,622 -10,216 376,406 21,439 314 26,303 25,531 6,349 456,342
Balance at 1 January 2016 386,622 -10,216 376,406 21,439 314 26,303 25,531 6,349 456,342
Additions - - - 305 - - - 1,957 2,262
Disposals (NBV) - - - - - -80 - - -80
Additions due to acquisition 86 - 86 - - - - - 86
Other reclassifications - - - 91 - - - - 91
Reclassification of assets from/to other
intangible assets categories - - - -119 - - - 119 -
Reclassification of assets from
property, plant & equipment (note 11) - - - - - - 2,043 1,057 3,100
Impairment (note 29) - -5,276 -5,276 - - - - -376 -5,652
Amortization charge (note 29) - - - -553 - -1,465 -4,182 -834 -7,034
Exchange differences -52,280 - -52,280 -4,215 1 -5,297 -11,280 -928 -73,999
Balance at 31 December 2016 334,428 -15,492 318,936 16,948 315 19,461 12,112 7,344 375,116
(all amounts in Euro thousands)
Company Trade-
marks
Other
intangible
assets Total
Balance at 1 January 2015 81 2,228 2,309
Additions - 224 224
Reclassification of assets from
property, plant & equipment (note 11) - 1,354 1,354
Amortization charge (note 29) - -275 -275
Balance at 31 December 2015 81 3,531 3,612
Balance at 1 January 2016 81 3,531 3,612
Additions - 1,080 1,080
Disposals (NBV) -80 -38 -118
Reclassification of assets from
property, plant & equipment (note 11) - 60 60
Other reclassifications - 91 91
Amortization charge (note 29) - -267 -267
Balance at 31 December 2016 1 4,457 4,458
Other intangible assets include mainly computer software.
Integrated Annual Report 2016
Notes to the Financial Statements6
82
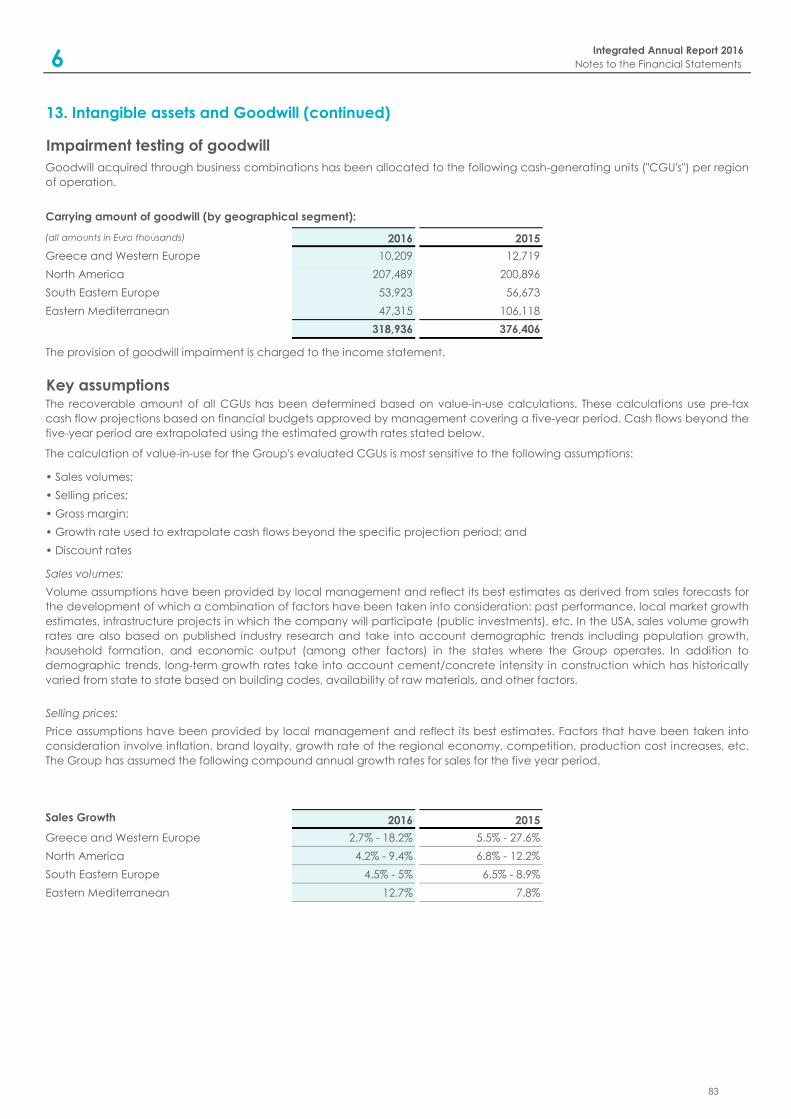
13. Intangible assets and Goodwill (continued)
Impairment testing of goodwill
Carrying amount of goodwill (by geographical segment):
(all amounts in Euro thousands) 2016 2015
Greece and Western Europe 10,209 12,719
North America 207,489 200,896
South Eastern Europe 53,923 56,673
Eastern Mediterranean 47,315 106,118
318,936 376,406
Key assumptions
Sales Growth 2016 2015
Greece and Western Europe 2.7% - 18.2% 5.5% - 27.6%
North America 4.2% - 9.4% 6.8% - 12.2%
South Eastern Europe 4.5% - 5% 6.5% - 8.9%
Eastern Mediterranean 12.7% 7.8%
Goodwill acquired through business combinations has been allocated to the following cash-generating units ("CGU's") per region
of operation.
Price assumptions have been provided by local management and reflect its best estimates. Factors that have been taken into
consideration involve inflation, brand loyalty, growth rate of the regional economy, competition, production cost increases, etc.
Τhe Group has assumed the following compound annual growth rates for sales for the five year period.
Selling prices:
• Selling prices;
The provision of goodwill impairment is charged to the income statement.
• Discount rates
Volume assumptions have been provided by local management and reflect its best estimates as derived from sales forecasts for
the development of which a combination of factors have been taken into consideration: past performance, local market growth
estimates, infrastructure projects in which the company will participate (public investments), etc. In the USA, sales volume growth
rates are also based on published industry research and take into account demographic trends including population growth,
household formation, and economic output (among other factors) in the states where the Group operates. In addition to
demographic trends, long-term growth rates take into account cement/concrete intensity in construction which has historically
varied from state to state based on building codes, availability of raw materials, and other factors.
Sales volumes:
• Gross margin;
The recoverable amount of all CGUs has been determined based on value-in-use calculations. These calculations use pre-tax
cash flow projections based on financial budgets approved by management covering a five-year period. Cash flows beyond the
five-year period are extrapolated using the estimated growth rates stated below.
The calculation of value-in-use for the Group's evaluated CGUs is most sensitive to the following assumptions:
• Sales volumes;
• Growth rate used to extrapolate cash flows beyond the specific projection period; and
Integrated Annual Report 2016
Notes to the Financial Statements6
83
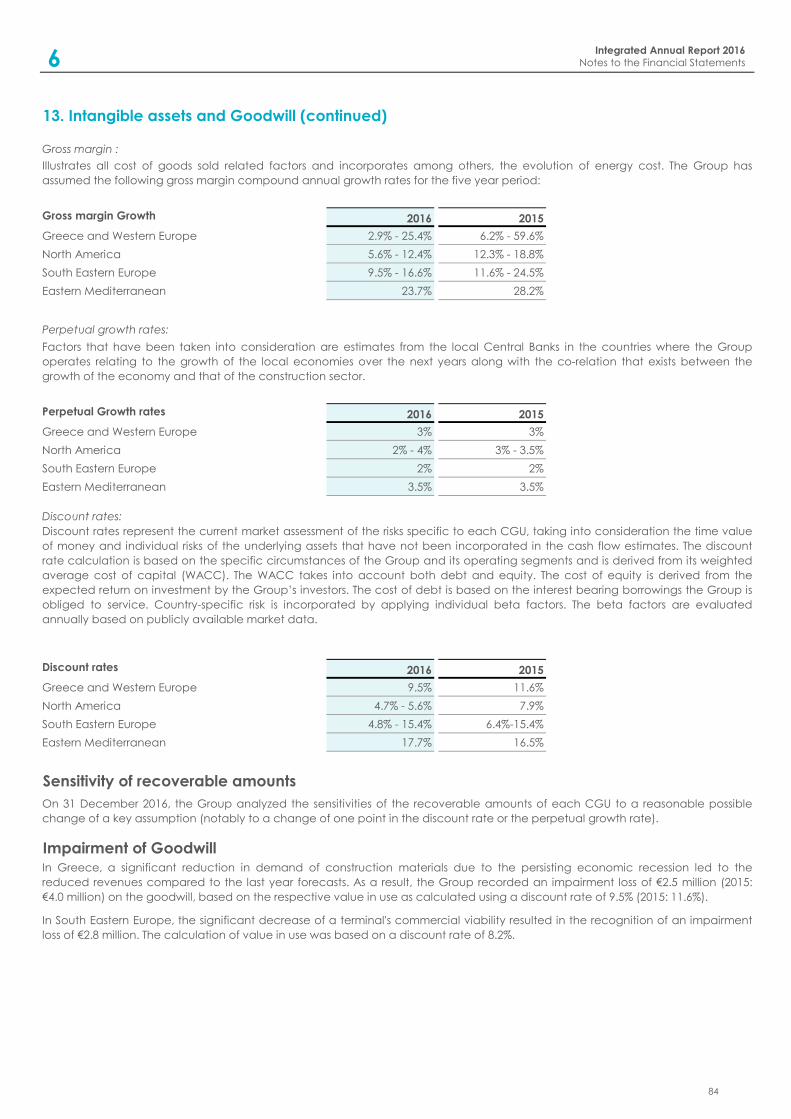
13. Intangible assets and Goodwill (continued)
Gross margin Growth 2016 2015
Greece and Western Europe 2.9% - 25.4% 6.2% - 59.6%
North America 5.6% - 12.4% 12.3% - 18.8%
South Eastern Europe 9.5% - 16.6% 11.6% - 24.5%
Eastern Mediterranean 23.7% 28.2%
Perpetual Growth rates 2016 2015
Greece and Western Europe 3% 3%
North America 2% - 4% 3% - 3.5%
South Eastern Europe 2% 2%
Eastern Mediterranean 3.5% 3.5%
Discount rates 2016 2015
Greece and Western Europe 9.5% 11.6%
North America 4.7% - 5.6% 7.9%
South Eastern Europe 4.8% - 15.4% 6.4%-15.4%
Eastern Mediterranean 17.7% 16.5%
In South Eastern Europe, the significant decrease of a terminal's commercial viability resulted in the recognition of an impairment
loss of €2.8 million. The calculation of value in use was based on a discount rate of 8.2%.
On 31 December 2016, the Group analyzed the sensitivities of the recoverable amounts of each CGU to a reasonable possible
change of a key assumption (notably to a change of one point in the discount rate or the perpetual growth rate).
Discount rates:
Discount rates represent the current market assessment of the risks specific to each CGU, taking into consideration the time value
of money and individual risks of the underlying assets that have not been incorporated in the cash flow estimates. The discount
rate calculation is based on the specific circumstances of the Group and its operating segments and is derived from its weighted
average cost of capital (WACC). The WACC takes into account both debt and equity. The cost of equity is derived from the
expected return on investment by the Group’s investors. The cost of debt is based on the interest bearing borrowings the Group is
obliged to service. Country-specific risk is incorporated by applying individual beta factors. The beta factors are evaluated
annually based on publicly available market data.
Sensitivity of recoverable amounts
In Greece, a significant reduction in demand of construction materials due to the persisting economic recession led to the
reduced revenues compared to the last year forecasts. As a result, the Group recorded an impairment loss of €2.5 million (2015:
€4.0 million) on the goodwill, based on the respective value in use as calculated using a discount rate of 9.5% (2015: 11.6%).
Impairment of Goodwill
Perpetual growth rates:
Factors that have been taken into consideration are estimates from the local Central Banks in the countries where the Group
operates relating to the growth of the local economies over the next years along with the co-relation that exists between the
growth of the economy and that of the construction sector.
Gross margin :
Illustrates all cost of goods sold related factors and incorporates among others, the evolution of energy cost. Τhe Group has
assumed the following gross margin compound annual growth rates for the five year period:
Integrated Annual Report 2016
Notes to the Financial Statements6
84
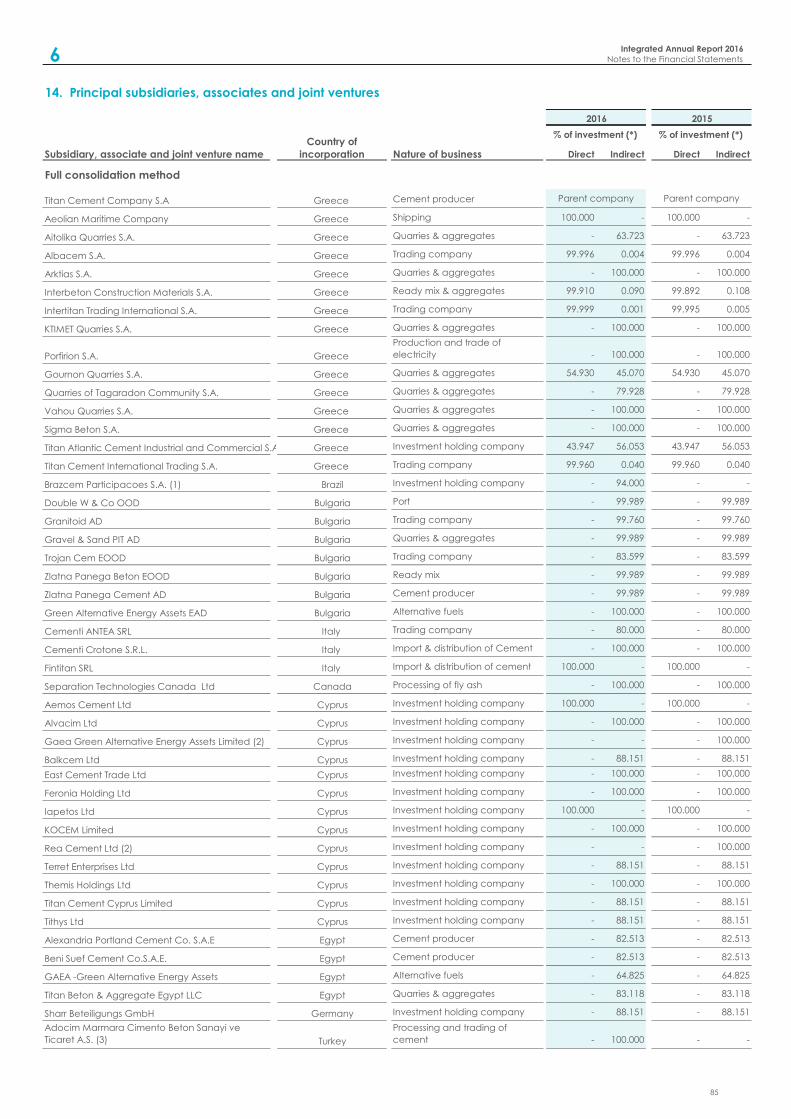
14. Principal subsidiaries, associates and joint ventures
Direct Indirect Direct Indirect
Full consolidation method
Τitan Cement Company S.A Greece Cement producer
Aeolian Maritime Company Greece Shipping 100.000 - 100.000 -
Aitolika Quarries S.A. Greece Quarries & aggregates - 63.723 - 63.723
Albacem S.A. Greece Trading company 99.996 0.004 99.996 0.004
Arktias S.A. Greece Quarries & aggregates - 100.000 - 100.000
Interbeton Construction Materials S.A. Greece Ready mix & aggregates 99.910 0.090 99.892 0.108
Intertitan Trading International S.A. Greece Trading company 99.999 0.001 99.995 0.005
KTIMET Quarries S.A. Greece Quarries & aggregates - 100.000 - 100.000
Porfirion S.A. Greece
Production and trade of
electricity - 100.000 - 100.000
Gournon Quarries S.A. Greece Quarries & aggregates 54.930 45.070 54.930 45.070
Quarries of Tagaradon Community S.A. Greece Quarries & aggregates - 79.928 - 79.928
Vahou Quarries S.A. Greece Quarries & aggregates - 100.000 - 100.000
Sigma Beton S.A. Greece Quarries & aggregates - 100.000 - 100.000
Titan Atlantic Cement Industrial and Commercial S.A. Greece Investment holding company 43.947 56.053 43.947 56.053
Titan Cement International Trading S.A. Greece Trading company 99.960 0.040 99.960 0.040
Brazcem Participacoes S.A. (1) Brazil Investment holding company - 94.000 - -
Double W & Co OOD Bulgaria Port - 99.989 - 99.989
Granitoid AD Bulgaria Trading company - 99.760 - 99.760
Gravel & Sand PIT AD Bulgaria Quarries & aggregates - 99.989 - 99.989
Trojan Cem EOOD Bulgaria Trading company - 83.599 - 83.599
Zlatna Panega Beton EOOD Bulgaria Ready mix - 99.989 - 99.989
Zlatna Panega Cement AD Bulgaria Cement producer - 99.989 - 99.989
Green Alternative Energy Assets EAD Bulgaria Alternative fuels - 100.000 - 100.000
Cementi ANTEA SRL Italy Trading company - 80.000 - 80.000
Cementi Crotone S.R.L. Italy Import & distribution of Cement - 100.000 - 100.000
Fintitan SRL Italy Import & distribution of cement 100.000 - 100.000 -
Separation Technologies Canada Ltd Canada Processing of fly ash - 100.000 - 100.000
Aemos Cement Ltd Cyprus Investment holding company 100.000 - 100.000 -
Alvacim Ltd Cyprus Investment holding company - 100.000 - 100.000
Gaea Green Alternative Energy Assets Limited (2) Cyprus Investment holding company - - - 100.000
Balkcem Ltd Cyprus Investment holding company - 88.151 - 88.151
East Cement Trade Ltd Cyprus Investment holding company - 100.000 - 100.000
Feronia Holding Ltd Cyprus Investment holding company - 100.000 - 100.000
Iapetos Ltd Cyprus Investment holding company 100.000 - 100.000 -
KOCEM Limited Cyprus Investment holding company - 100.000 - 100.000
Rea Cement Ltd (2) Cyprus Investment holding company - - - 100.000
Terret Enterprises Ltd Cyprus Investment holding company - 88.151 - 88.151
Themis Holdings Ltd Cyprus Investment holding company - 100.000 - 100.000
Titan Cement Cyprus Limited Cyprus Investment holding company - 88.151 - 88.151
Tithys Ltd Cyprus Investment holding company - 88.151 - 88.151
Alexandria Portland Cement Co. S.A.E Egypt Cement producer - 82.513 - 82.513
Beni Suef Cement Co.S.A.E. Egypt Cement producer - 82.513 - 82.513
GAEA -Green Alternative Energy Assets Egypt Alternative fuels - 64.825 - 64.825
Titan Beton & Aggregate Egypt LLC Egypt Quarries & aggregates - 83.118 - 83.118
Sharr Beteiligungs GmbH Germany Investment holding company - 88.151 - 88.151
Adocim Marmara Cimento Beton Sanayi ve
Ticaret A.S. (3) Turkey
Processing and trading of
cement - 100.000 - -
Parent company Parent company
2016 2015
Subsidiary, associate and joint venture name
Country of
incorporation Nature of business
% of investment (*) % of investment (*)
Integrated Annual Report 2016
Notes to the Financial Statements6
85
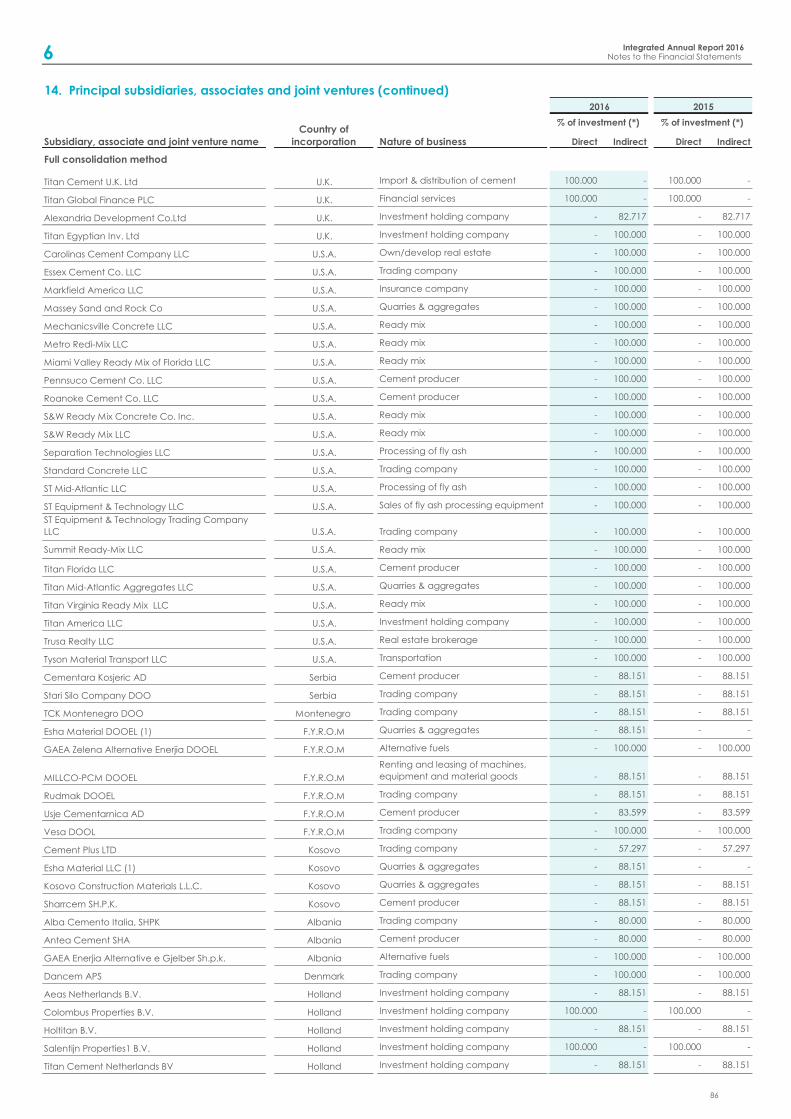
14. Principal subsidiaries, associates and joint ventures (continued)
Direct Indirect Direct Indirect
Full consolidation method
Titan Cement U.K. Ltd U.K. Import & distribution of cement 100.000 - 100.000 -
Titan Global Finance PLC U.K. Financial services 100.000 - 100.000 -
Alexandria Development Co.Ltd U.K. Investment holding company - 82.717 - 82.717
Titan Egyptian Inv. Ltd U.K. Investment holding company - 100.000 - 100.000
Carolinas Cement Company LLC U.S.A. Own/develop real estate - 100.000 - 100.000
Essex Cement Co. LLC U.S.A. Trading company - 100.000 - 100.000
Markfield America LLC U.S.A. Insurance company - 100.000 - 100.000
Massey Sand and Rock Co U.S.A. Quarries & aggregates - 100.000 - 100.000
Mechanicsville Concrete LLC U.S.A. Ready mix - 100.000 - 100.000
Metro Redi-Mix LLC U.S.A. Ready mix - 100.000 - 100.000
Miami Valley Ready Mix of Florida LLC U.S.A. Ready mix - 100.000 - 100.000
Pennsuco Cement Co. LLC U.S.A. Cement producer - 100.000 - 100.000
Roanoke Cement Co. LLC U.S.A. Cement producer - 100.000 - 100.000
S&W Ready Mix Concrete Co. Inc. U.S.A. Ready mix - 100.000 - 100.000
S&W Ready Mix LLC U.S.A. Ready mix - 100.000 - 100.000
Separation Technologies LLC U.S.A. Processing of fly ash - 100.000 - 100.000
Standard Concrete LLC U.S.A. Trading company - 100.000 - 100.000
ST Mid-Atlantic LLC U.S.A. Processing of fly ash - 100.000 - 100.000
ST Equipment & Technology LLC U.S.A. Sales of fly ash processing equipment - 100.000 - 100.000
ST Equipment & Technology Trading Company
LLC U.S.A. Trading company - 100.000 - 100.000
Summit Ready-Mix LLC U.S.A. Ready mix - 100.000 - 100.000
Titan Florida LLC U.S.A. Cement producer - 100.000 - 100.000
Titan Mid-Atlantic Aggregates LLC U.S.A. Quarries & aggregates - 100.000 - 100.000
Titan Virginia Ready Mix LLC U.S.A. Ready mix - 100.000 - 100.000
Τitan Αmerica LLC U.S.A. Investment holding company - 100.000 - 100.000
Trusa Realty LLC U.S.A. Real estate brokerage - 100.000 - 100.000
Tyson Material Transport LLC U.S.A. Transportation - 100.000 - 100.000
Cementara Kosjeric AD Serbia Cement producer - 88.151 - 88.151
Stari Silo Company DOO Serbia Trading company - 88.151 - 88.151
TCK Montenegro DOO Montenegro Trading company - 88.151 - 88.151
Esha Material DOOEL (1) F.Y.R.O.M Quarries & aggregates - 88.151 - -
GAEA Zelena Alternative Enerjia DOOEL F.Y.R.O.M Alternative fuels - 100.000 - 100.000
MILLCO-PCM DOOEL F.Y.R.O.M
Renting and leasing of machines,
equipment and material goods - 88.151 - 88.151
Rudmak DOOEL F.Y.R.O.M Trading company - 88.151 - 88.151
Usje Cementarnica AD F.Y.R.O.M Cement producer - 83.599 - 83.599
Vesa DOOL F.Y.R.O.M Trading company - 100.000 - 100.000
Cement Plus LTD Kosovo Trading company - 57.297 - 57.297
Esha Material LLC (1) Kosovo Quarries & aggregates - 88.151 - -
Kosovo Construction Materials L.L.C. Kosovo Quarries & aggregates - 88.151 - 88.151
Sharrcem SH.P.K. Kosovo Cement producer - 88.151 - 88.151
Alba Cemento Italia, SHPK Albania Trading company - 80.000 - 80.000
Antea Cement SHA Albania Cement producer - 80.000 - 80.000
GAEA Enerjia Alternative e Gjelber Sh.p.k. Albania Alternative fuels - 100.000 - 100.000
Dancem APS Denmark Trading company - 100.000 - 100.000
Aeas Netherlands B.V. Holland Investment holding company - 88.151 - 88.151
Colombus Properties B.V. Holland Investment holding company 100.000 - 100.000 -
Holtitan B.V. Holland Investment holding company - 88.151 - 88.151
Salentijn Properties1 B.V. Holland Investment holding company 100.000 - 100.000 -
Titan Cement Netherlands BV Holland Investment holding company - 88.151 - 88.151
2016 2015
Subsidiary, associate and joint venture name
Country of
incorporation Nature of business
% of investment (*) % of investment (*)
Integrated Annual Report 2016Notes to the Financial Statements6
86
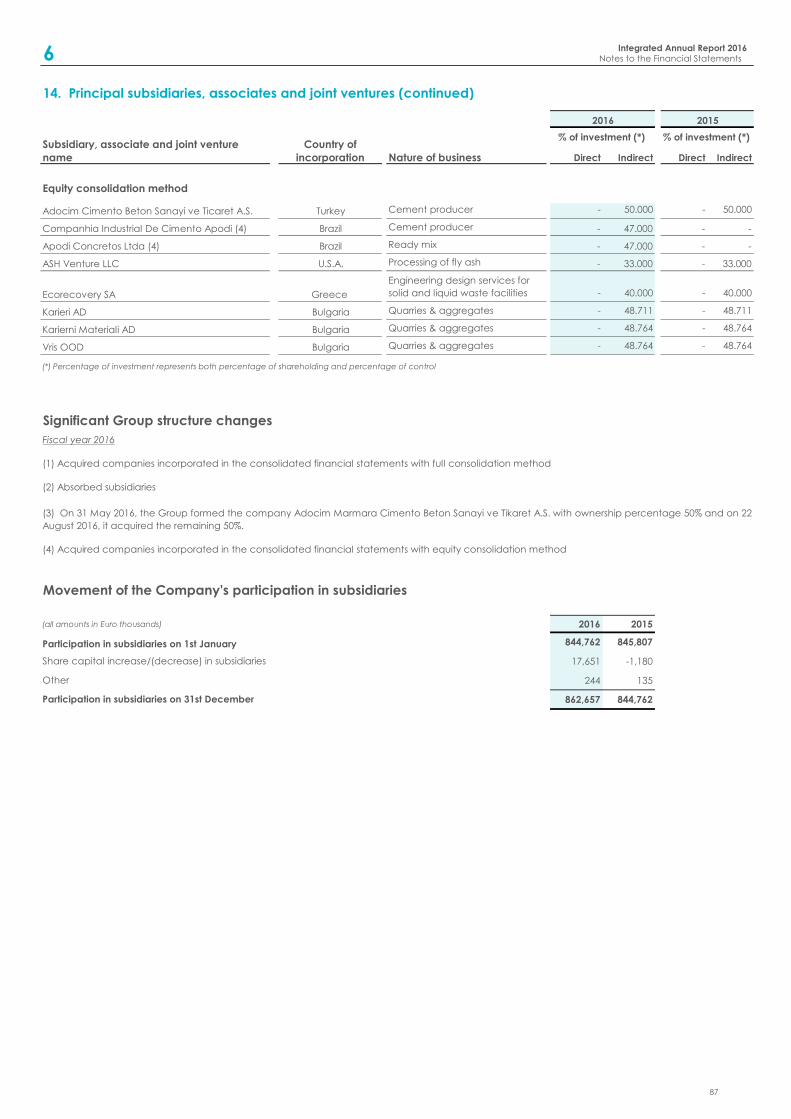
14. Principal subsidiaries, associates and joint ventures (continued)
Direct Indirect Direct Indirect
Equity consolidation method
Adocim Cimento Beton Sanayi ve Ticaret A.S. Turkey Cement producer - 50.000 - 50.000
Companhia Industrial De Cimento Apodi (4) Brazil Cement producer - 47.000 - -
Apodi Concretos Ltda (4) Brazil Ready mix - 47.000 - -
ASH Venture LLC U.S.A. Processing of fly ash - 33.000 - 33.000
Ecorecovery SA Greece
Engineering design services for
solid and liquid waste facilities - 40.000 - 40.000
Karieri AD Bulgaria Quarries & aggregates - 48.711 - 48.711
Karierni Materiali AD Bulgaria Quarries & aggregates - 48.764 - 48.764
Vris OOD Bulgaria Quarries & aggregates - 48.764 - 48.764
99.989
(all amounts in Euro thousands) 2016 2015
844,762 845,807
17,651 -1,180
244 135
862,657 844,762Participation in subsidiaries on 31st December
Share capital increase/(decrease) in subsidiaries
Other
(*) Percentage of investment represents both percentage of shareholding and percentage of control
Movement of the Company's participation in subsidiaries
Participation in subsidiaries on 1st January
Significant Group structure changes
Fiscal year 2016
(3) On 31 May 2016, the Group formed the company Adocim Marmara Cimento Beton Sanayi ve Tikaret A.S. with ownership percentage 50% and on 22
August 2016, it acquired the remaining 50%.
(2) Absorbed subsidiaries
(1) Acquired companies incorporated in the consolidated financial statements with full consolidation method
(4) Acquired companies incorporated in the consolidated financial statements with equity consolidation method
2016 2015
Subsidiary, associate and joint venture
name
Country of
incorporation Nature of business
% of investment (*) % of investment (*)
Integrated Annual Report 2016Notes to the Financial Statements6
87
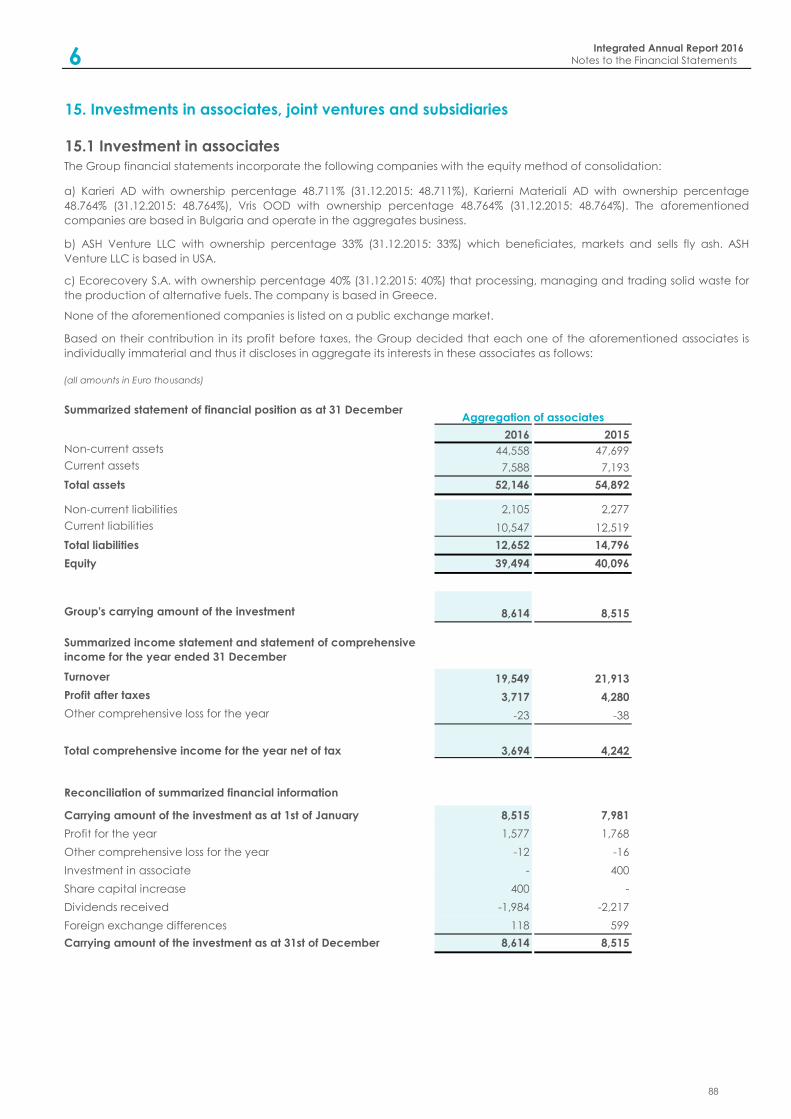
15. Investments in associates, joint ventures and subsidiaries
15.1 Investment in associates
(all amounts in Euro thousands)
Summarized statement of financial position as at 31 December
2016 2015
Non-current assets 44,558 47,699
Current assets 7,588 7,193
Total assets 52,146 54,892
Non-current liabilities 2,105 2,277
Current liabilities 10,547 12,519
Total liabilities 12,652 14,796
Equity 39,494 40,096
Group's carrying amount of the investment 8,614 8,515
Summarized income statement and statement of comprehensive
income for the year ended 31 December
Turnover 19,549 21,913
Profit after taxes 3,717 4,280
Other comprehensive loss for the year -23 -38
Total comprehensive income for the year net of tax 3,694 4,242
Reconciliation of summarized financial information
Carrying amount of the investment as at 1st of January 8,515 7,981
Profit for the year 1,577 1,768
Other comprehensive loss for the year -12 -16
Investment in associate - 400
Share capital increase 400 -
Dividends received -1,984 -2,217
Foreign exchange differences 118 599
Carrying amount of the investment as at 31st of December 8,614 8,515
Based on their contribution in its profit before taxes, the Group decided that each one of the aforementioned associates is
individually immaterial and thus it discloses in aggregate its interests in these associates as follows:
Aggregation of associates
b) ASH Venture LLC with ownership percentage 33% (31.12.2015: 33%) which beneficiates, markets and sells fly ash. ASH
Venture LLC is based in USA.
c) Ecorecovery S.A. with ownership percentage 40% (31.12.2015: 40%) that processing, managing and trading solid waste for
the production of alternative fuels. The company is based in Greece.
None of the aforementioned companies is listed on a public exchange market.
The Group financial statements incorporate the following companies with the equity method of consolidation:
a) Karieri AD with ownership percentage 48.711% (31.12.2015: 48.711%), Karierni Materiali AD with ownership percentage
48.764% (31.12.2015: 48.764%), Vris OOD with ownership percentage 48.764% (31.12.2015: 48.764%). The aforementioned
companies are based in Bulgaria and operate in the aggregates business.
Integrated Annual Report 2016
Notes to the Financial Statements6
88
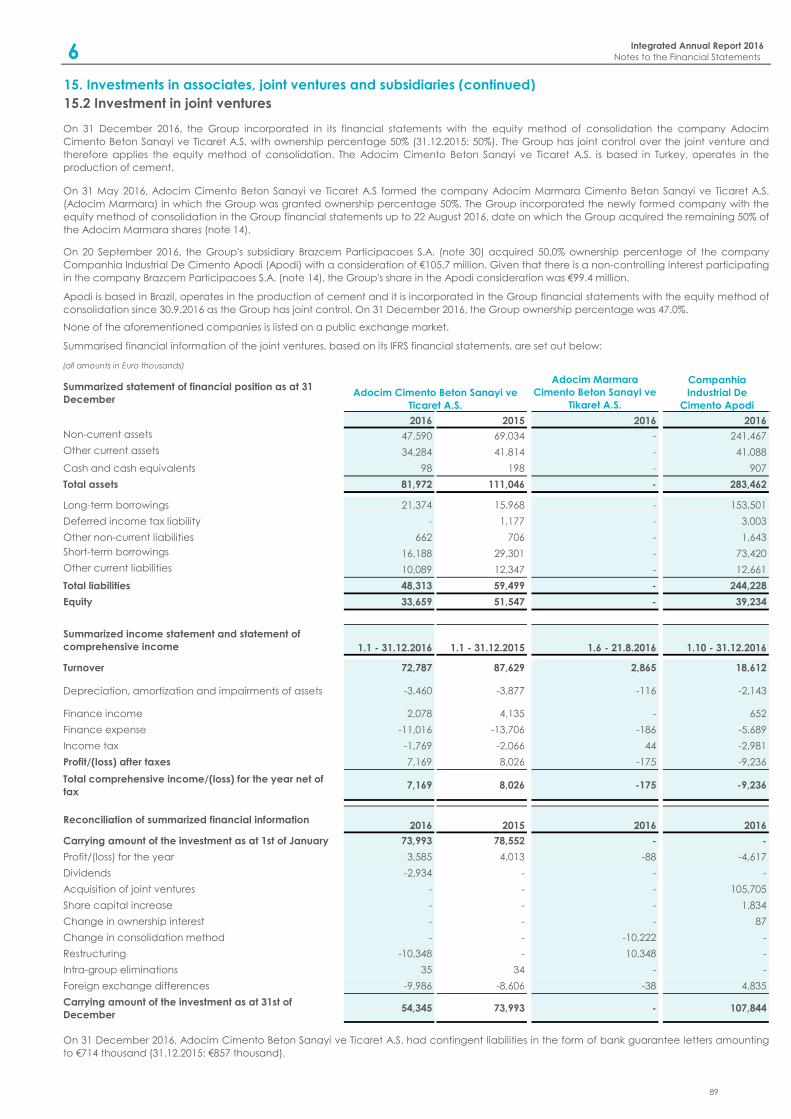
15. Investments in associates, joint ventures and subsidiaries (continued)
15.2 Investment in joint ventures
(all amounts in Euro thousands)
Summarized statement of financial position as at 31
December
Adocim Marmara
Cimento Beton Sanayi ve
Tikaret A.S.
2016 2015 2016 2016
Non-current assets 47,590 69,034 - 241,467
Other current assets 34,284 41,814 - 41,088
Cash and cash equivalents 98 198 - 907
Total assets 81,972 111,046 - 283,462
Long-term borrowings 21,374 15,968 - 153,501
Deferred income tax liability - 1,177 - 3,003
Other non-current liabilities 662 706 - 1,643
Short-term borrowings 16,188 29,301 - 73,420
Other current liabilities 10,089 12,347 - 12,661
Total liabilities 48,313 59,499 - 244,228
Equity 33,659 51,547 - 39,234
Summarized income statement and statement of
comprehensive income 1.1 - 31.12.2016 1.1 - 31.12.2015 1.6 - 21.8.2016 1.10 - 31.12.2016
Turnover 72,787 87,629 2,865 18,612
Depreciation, amortization and impairments of assets -3,460 -3,877 -116 -2,143
Finance income 2,078 4,135 - 652
Finance expense -11,016 -13,706 -186 -5,689
Income tax -1,769 -2,066 44 -2,981
Profit/(loss) after taxes 7,169 8,026 -175 -9,236
Total comprehensive income/(loss) for the year net of
tax7,169 8,026 -175 -9,236
Reconciliation of summarized financial information2016 2015 2016 2016
Carrying amount of the investment as at 1st of January 73,993 78,552 - -
Profit/(loss) for the year 3,585 4,013 -88 -4,617
Dividends -2,934 - - -
Acquisition of joint ventures - - - 105,705
Share capital increase - - - 1,834
Change in ownership interest - - - 87
Change in consolidation method - - -10,222 -
Restructuring -10,348 - 10,348 -
Intra-group eliminations 35 34 - -
Foreign exchange differences -9,986 -8,606 -38 4,835
Carrying amount of the investment as at 31st of
December54,345 73,993 - 107,844
Adocim Cimento Beton Sanayi ve
Ticaret A.S.
Companhia
Industrial De
Cimento Apodi
On 31 December 2016, the Group incorporated in its financial statements with the equity method of consolidation the company Adocim
Cimento Beton Sanayi ve Ticaret A.S. with ownership percentage 50% (31.12.2015: 50%). The Group has joint control over the joint venture and
therefore applies the equity method of consolidation. The Adocim Cimento Beton Sanayi ve Ticaret A.S. is based in Turkey, operates in the
production of cement.
Apodi is based in Brazil, operates in the production of cement and it is incorporated in the Group financial statements with the equity method of
consolidation since 30.9.2016 as the Group has joint control. On 31 December 2016, the Group ownership percentage was 47.0%.
Summarised financial information of the joint ventures, based on its IFRS financial statements, are set out below:
On 31 May 2016, Adocim Cimento Beton Sanayi ve Ticaret A.S formed the company Adocim Marmara Cimento Beton Sanayi ve Ticaret A.S.
(Adocim Marmara) in which the Group was granted ownership percentage 50%. Τhe Group incorporated the newly formed company with the
equity method of consolidation in the Group financial statements up to 22 August 2016, date on which the Group acquired the remaining 50% of
the Adocim Marmara shares (note 14).
None of the aforementioned companies is listed on a public exchange market.
On 31 December 2016, Adocim Cimento Beton Sanayi ve Ticaret A.S. had contingent liabilities in the form of bank guarantee letters amounting
to €714 thousand (31.12.2015: €857 thousand).
On 20 September 2016, the Group's subsidiary Brazcem Participacoes S.A. (note 30) acquired 50,0% ownership percentage of the company
Companhia Industrial De Cimento Apodi (Apodi) with a consideration of €105.7 million. Given that there is a non-controlling interest participating
in the company Brazcem Participacoes S.A. (note 14), the Group's share in the Apodi consideration was €99.4 million.
Integrated Annual Report 2016
Notes to the Financial Statements6
89
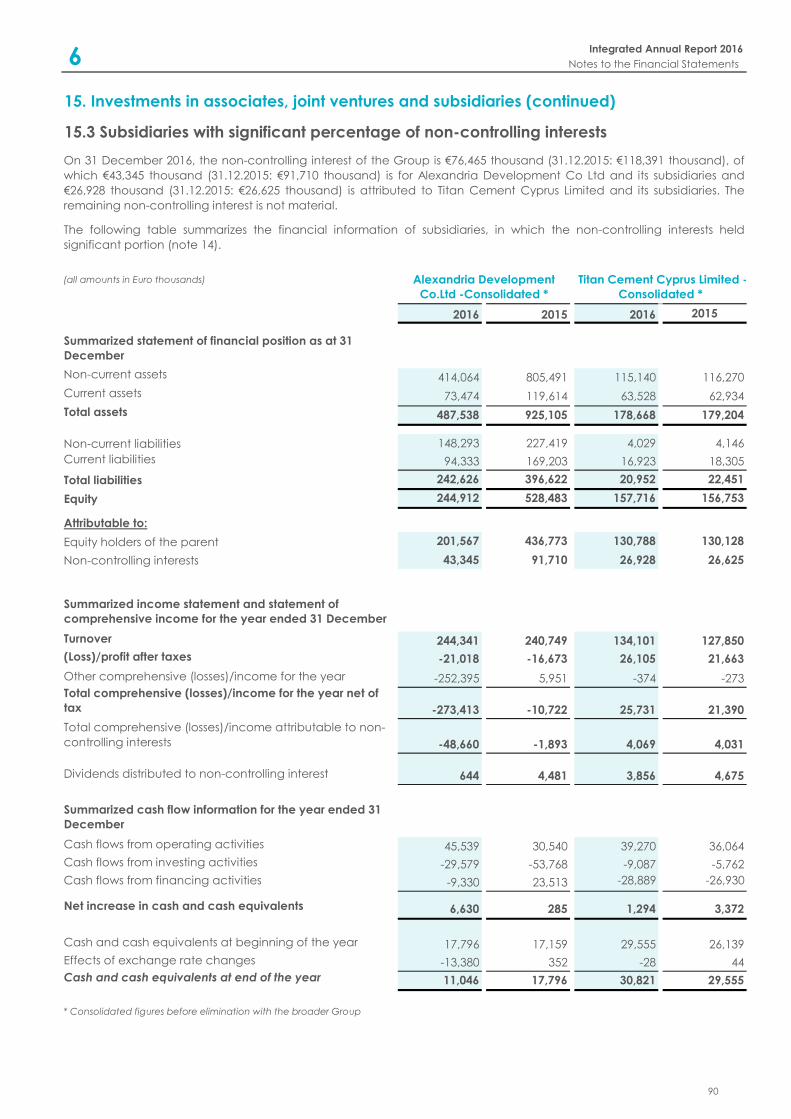
15. Investments in associates, joint ventures and subsidiaries (continued)
15.3 Subsidiaries with significant percentage of non-controlling interests
(all amounts in Euro thousands)
2016 2015 2016 2015
Non-current assets 414,064 805,491 115,140 116,270
Current assets 73,474 119,614 63,528 62,934
Total assets 487,538 925,105 178,668 179,204
Non-current liabilities 148,293 227,419 4,029 4,146
Current liabilities 94,333 169,203 16,923 18,305
Total liabilities 242,626 396,622 20,952 22,451
Equity 244,912 528,483 157,716 156,753
Attributable to:
Equity holders of the parent 201,567 436,773 130,788 130,128
Non-controlling interests 43,345 91,710 26,928 26,625
Turnover 244,341 240,749 134,101 127,850
(Loss)/profit after taxes -21,018 -16,673 26,105 21,663
Other comprehensive (losses)/income for the year -252,395 5,951 -374 -273
Total comprehensive (losses)/income for the year net of
tax -273,413 -10,722 25,731 21,390
Total comprehensive (losses)/income attributable to non-
controlling interests -48,660 -1,893 4,069 4,031
Dividends distributed to non-controlling interest 644 4,481 3,856 4,675
Cash flows from operating activities 45,539 30,540 39,270 36,064
Cash flows from investing activities -29,579 -53,768 -9,087 -5,762
Cash flows from financing activities -9,330 23,513 -28,889 -26,930
Net increase in cash and cash equivalents 6,630 285 1,294 3,372
Cash and cash equivalents at beginning of the year 17,796 17,159 29,555 26,139
Effects of exchange rate changes -13,380 352 -28 44
Cash and cash equivalents at end of the year 11,046 17,796 30,821 29,555
* Consolidated figures before elimination with the broader Group
The following table summarizes the financial information of subsidiaries, in which the non-controlling interests held
significant portion (note 14).
Alexandria Development
Co.Ltd -Consolidated *
Titan Cement Cyprus Limited -
Consolidated *
On 31 December 2016, the non-controlling interest of the Group is €76,465 thousand (31.12.2015: €118,391 thousand), of
which €43,345 thousand (31.12.2015: €91,710 thousand) is for Alexandria Development Co Ltd and its subsidiaries and
€26,928 thousand (31.12.2015: €26,625 thousand) is attributed to Titan Cement Cyprus Limited and its subsidiaries. The
remaining non-controlling interest is not material.
Summarized statement of financial position as at 31
December
Summarized income statement and statement of
comprehensive income for the year ended 31 December
Summarized cash flow information for the year ended 31
December
Integrated Annual Report 2016
Notes to the Financial Statements6
90
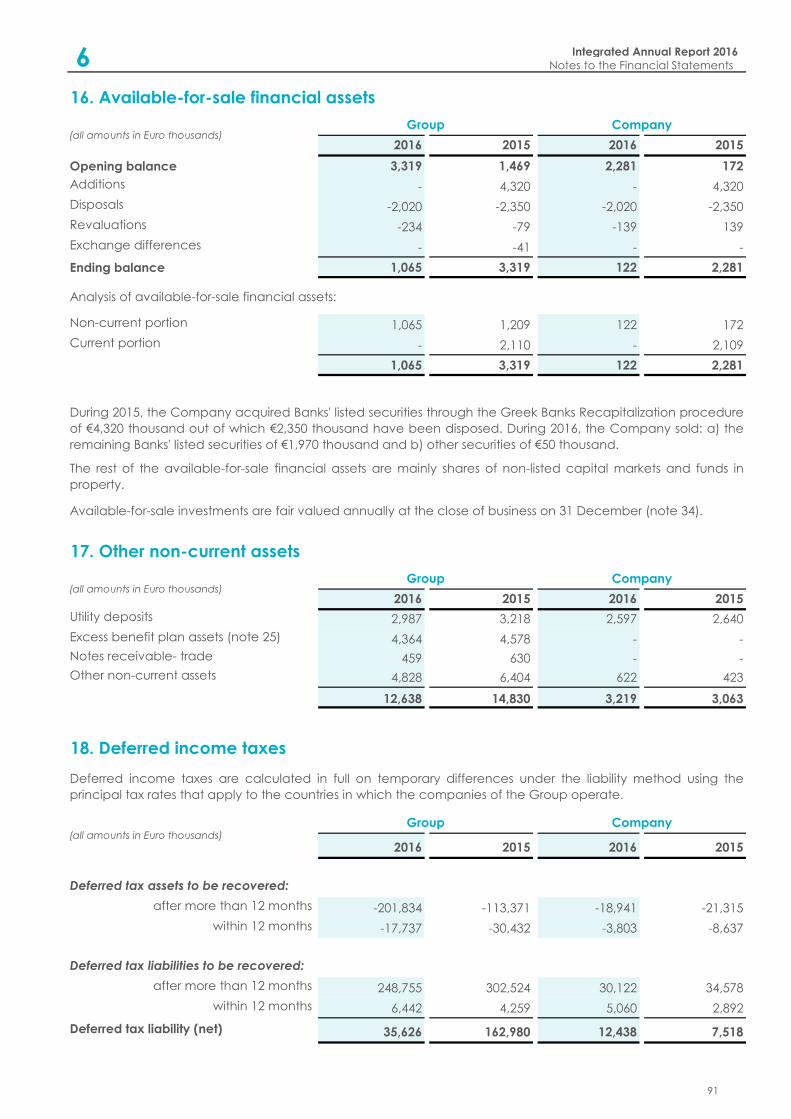
2016 2015 2016 2015
Opening balance 3,319 1,469 2,281 172
Additions - 4,320 - 4,320
Disposals -2,020 -2,350 -2,020 -2,350
Revaluations -234 -79 -139 139
Exchange differences - -41 - -
Ending balance 1,065 3,319 122 2,281
Non-current portion 1,065 1,209 122 172
Current portion - 2,110 - 2,109
1,065 3,319 122 2,281
2016 2015 2016 2015
Utility deposits 2,987 3,218 2,597 2,640
Excess benefit plan assets (note 25) 4,364 4,578 - -
Notes receivable- trade 459 630 - -
Other non-current assets 4,828 6,404 622 423
12,638 14,830 3,219 3,063
2016 2015 2016 2015
Deferred tax assets to be recovered:
after more than 12 months -201,834 -113,371 -18,941 -21,315
within 12 months -17,737 -30,432 -3,803 -8,637
Deferred tax liabilities to be recovered:
after more than 12 months 248,755 302,524 30,122 34,578
within 12 months 6,442 4,259 5,060 2,892
Deferred tax liability (net) 35,626 162,980 12,438 7,518
18. Deferred income taxes
Analysis of available-for-sale financial assets:
(all amounts in Euro thousands)
(all amounts in Euro thousands)
(all amounts in Euro thousands)
Deferred income taxes are calculated in full on temporary differences under the liability method using the
principal tax rates that apply to the countries in which the companies of the Group operate.
Group Company
The rest of the available-for-sale financial assets are mainly shares of non-listed capital markets and funds in
property.
Available-for-sale investments are fair valued annually at the close of business on 31 December (note 34).
Group Company
17. Other non-current assets
During 2015, the Company acquired Banks' listed securities through the Greek Banks Recapitalization procedure
of €4,320 thousand out of which €2,350 thousand have been disposed. During 2016, the Company sold: a) the
remaining Banks' listed securities of €1,970 thousand and b) other securities of €50 thousand.
Group Company
16. Available-for-sale financial assets
Integrated Annual Report 2016
Notes to the Financial Statements6
91
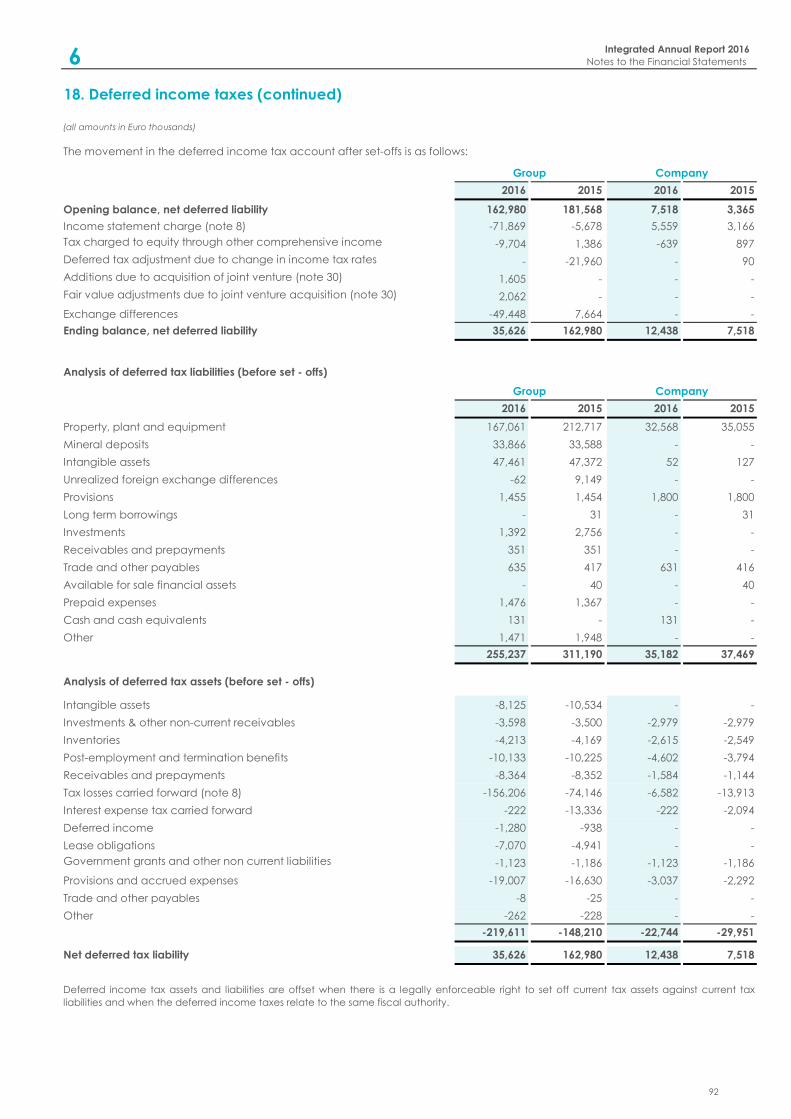
(all amounts in Euro thousands)
2016 2015 2016 2015
Opening balance, net deferred liability 162,980 181,568 7,518 3,365
Income statement charge (note 8) -71,869 -5,678 5,559 3,166
Tax charged to equity through other comprehensive income -9,704 1,386 -639 897
Deferred tax adjustment due to change in income tax rates - -21,960 - 90
Additions due to acquisition of joint venture (note 30) 1,605 - - -
Fair value adjustments due to joint venture acquisition (note 30) 2,062 - - -
Exchange differences -49,448 7,664 - -
Ending balance, net deferred liability 35,626 162,980 12,438 7,518
2016 2015 2016 2015
Property, plant and equipment 167,061 212,717 32,568 35,055
Mineral deposits 33,866 33,588 - -
Intangible assets 47,461 47,372 52 127
Unrealized foreign exchange differences -62 9,149 - -
Provisions 1,455 1,454 1,800 1,800
Long term borrowings - 31 - 31
Investments 1,392 2,756 - -
Receivables and prepayments 351 351 - -
Trade and other payables 635 417 631 416
Available for sale financial assets - 40 - 40
Prepaid expenses 1,476 1,367 - -
Cash and cash equivalents 131 - 131 -
Other 1,471 1,948 - -
255,237 311,190 35,182 37,469
Analysis of deferred tax assets (before set - offs)
Intangible assets -8,125 -10,534 - -
Investments & other non-current receivables -3,598 -3,500 -2,979 -2,979
Inventories -4,213 -4,169 -2,615 -2,549
Post-employment and termination benefits -10,133 -10,225 -4,602 -3,794
Receivables and prepayments -8,364 -8,352 -1,584 -1,144
Tax losses carried forward (note 8) -156,206 -74,146 -6,582 -13,913
Interest expense tax carried forward -222 -13,336 -222 -2,094
Deferred income -1,280 -938 - -
Lease obligations -7,070 -4,941 - -
Government grants and other non current liabilities -1,123 -1,186 -1,123 -1,186
Provisions and accrued expenses -19,007 -16,630 -3,037 -2,292
Trade and other payables -8 -25 - -
Other -262 -228 - -
-219,611 -148,210 -22,744 -29,951
Net deferred tax liability 35,626 162,980 12,438 7,518
Deferred income tax assets and liabilities are offset when there is a legally enforceable right to set off current tax assets against current tax
liabilities and when the deferred income taxes relate to the same fiscal authority.
Analysis of deferred tax liabilities (before set - offs)
Group Company
18. Deferred income taxes (continued)
The movement in the deferred income tax account after set-offs is as follows:
Group Company
Integrated Annual Report 2016
Notes to the Financial Statements6
92
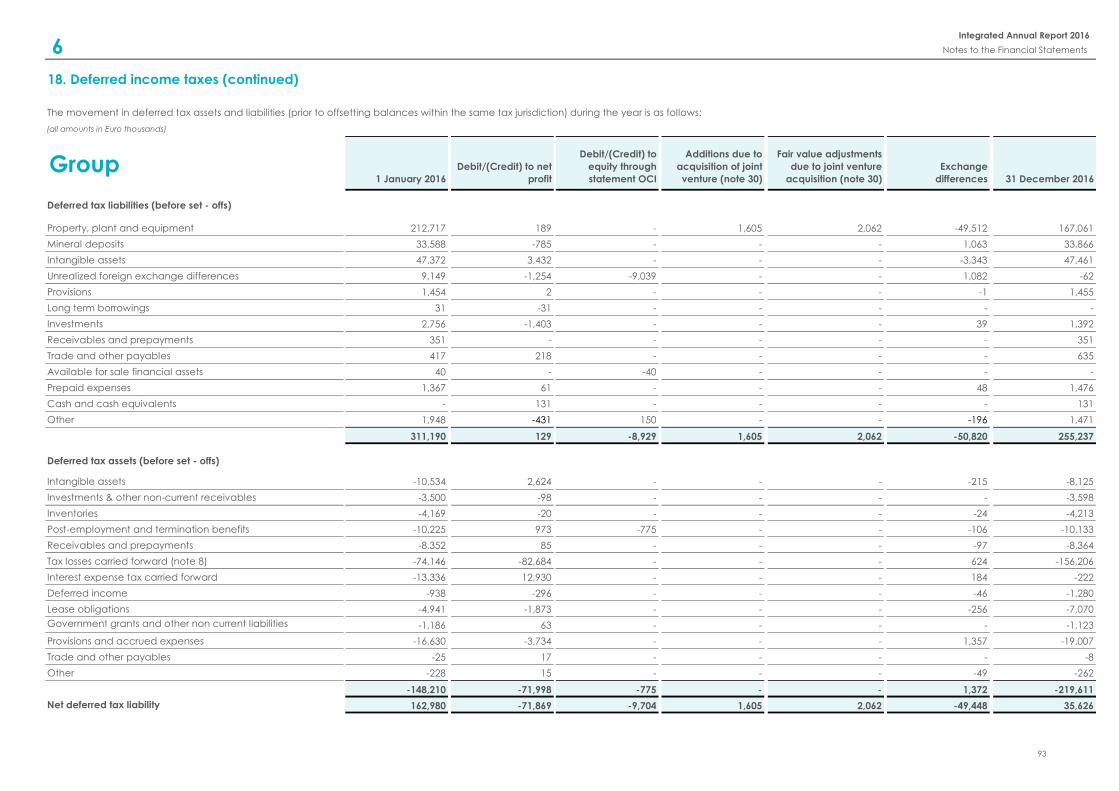
(all amounts in Euro thousands)
Group1 January 2016
Debit/(Credit) to net
profit
Debit/(Credit) to
equity through
statement OCI
Additions due to
acquisition of joint
venture (note 30)
Fair value adjustments
due to joint venture
acquisition (note 30)
Exchange
differences 31 December 2016
Deferred tax liabilities (before set - offs)
Property, plant and equipment 212,717 189 - 1,605 2,062 -49,512 167,061
Mineral deposits 33,588 -785 - - - 1,063 33,866
Intangible assets 47,372 3,432 - - - -3,343 47,461
Unrealized foreign exchange differences 9,149 -1,254 -9,039 - - 1,082 -62
Provisions 1,454 2 - - - -1 1,455
Long term borrowings 31 -31 - - - - -
Investments 2,756 -1,403 - - - 39 1,392
Receivables and prepayments 351 - - - - - 351
Trade and other payables 417 218 - - - - 635
Available for sale financial assets 40 - -40 - - - -
Prepaid expenses 1,367 61 - - - 48 1,476
Cash and cash equivalents - 131 - - - - 131
Other 1,948 -431 150 - - -196 1,471
311,190 129 -8,929 1,605 2,062 -50,820 255,237
Deferred tax assets (before set - offs)
Intangible assets -10,534 2,624 - - - -215 -8,125
Investments & other non-current receivables -3,500 -98 - - - - -3,598
Inventories -4,169 -20 - - - -24 -4,213
Post-employment and termination benefits -10,225 973 -775 - - -106 -10,133
Receivables and prepayments -8,352 85 - - - -97 -8,364
Tax losses carried forward (note 8) -74,146 -82,684 - - - 624 -156,206
Interest expense tax carried forward -13,336 12,930 - - - 184 -222
Deferred income -938 -296 - - - -46 -1,280
Lease obligations -4,941 -1,873 - - - -256 -7,070
Government grants and other non current liabilities -1,186 63 - - - - -1,123
Provisions and accrued expenses -16,630 -3,734 - - - 1,357 -19,007
Trade and other payables -25 17 - - - - -8
Other -228 15 - - - -49 -262
-148,210 -71,998 -775 - - 1,372 -219,611
Net deferred tax liability 162,980 -71,869 -9,704 1,605 2,062 -49,448 35,626
18. Deferred income taxes (continued)
The movement in deferred tax assets and liabilities (prior to offsetting balances within the same tax jurisdiction) during the year is as follows:
Integrated Annual Report 2016
Notes to the Financial Statements6
93
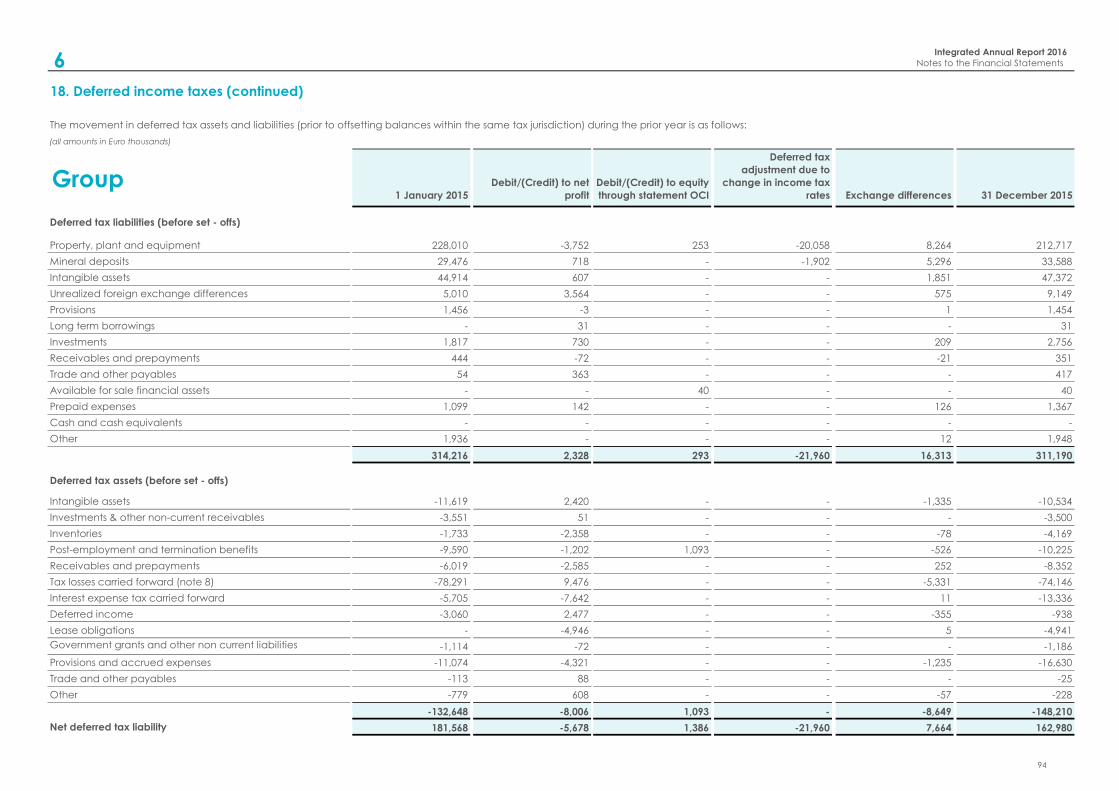
(all amounts in Euro thousands)
Group 1 January 2015
Debit/(Credit) to net
profit
Debit/(Credit) to equity
through statement OCI
Deferred tax
adjustment due to
change in income tax
rates Exchange differences 31 December 2015
Deferred tax liabilities (before set - offs)
Property, plant and equipment 228,010 -3,752 253 -20,058 8,264 212,717
Mineral deposits 29,476 718 - -1,902 5,296 33,588
Intangible assets 44,914 607 - - 1,851 47,372
Unrealized foreign exchange differences 5,010 3,564 - - 575 9,149
Provisions 1,456 -3 - - 1 1,454
Long term borrowings - 31 - - - 31
Investments 1,817 730 - - 209 2,756
Receivables and prepayments 444 -72 - - -21 351
Trade and other payables 54 363 - - - 417
Available for sale financial assets - - 40 - - 40
Prepaid expenses 1,099 142 - - 126 1,367
Cash and cash equivalents - - - - - -
Other 1,936 - - - 12 1,948
314,216 2,328 293 -21,960 16,313 311,190
Deferred tax assets (before set - offs)
Intangible assets -11,619 2,420 - - -1,335 -10,534
Investments & other non-current receivables -3,551 51 - - - -3,500
Inventories -1,733 -2,358 - - -78 -4,169
Post-employment and termination benefits -9,590 -1,202 1,093 - -526 -10,225
Receivables and prepayments -6,019 -2,585 - - 252 -8,352
Tax losses carried forward (note 8) -78,291 9,476 - - -5,331 -74,146
Interest expense tax carried forward -5,705 -7,642 - - 11 -13,336
Deferred income -3,060 2,477 - - -355 -938
Lease obligations - -4,946 - - 5 -4,941
Government grants and other non current liabilities -1,114 -72 - - - -1,186
Provisions and accrued expenses -11,074 -4,321 - - -1,235 -16,630
Trade and other payables -113 88 - - - -25
Other -779 608 - - -57 -228
-132,648 -8,006 1,093 - -8,649 -148,210
Net deferred tax liability 181,568 -5,678 1,386 -21,960 7,664 162,980
The movement in deferred tax assets and liabilities (prior to offsetting balances within the same tax jurisdiction) during the prior year is as follows:
18. Deferred income taxes (continued)
Integrated Annual Report 2016
Notes to the Financial Statements6
94
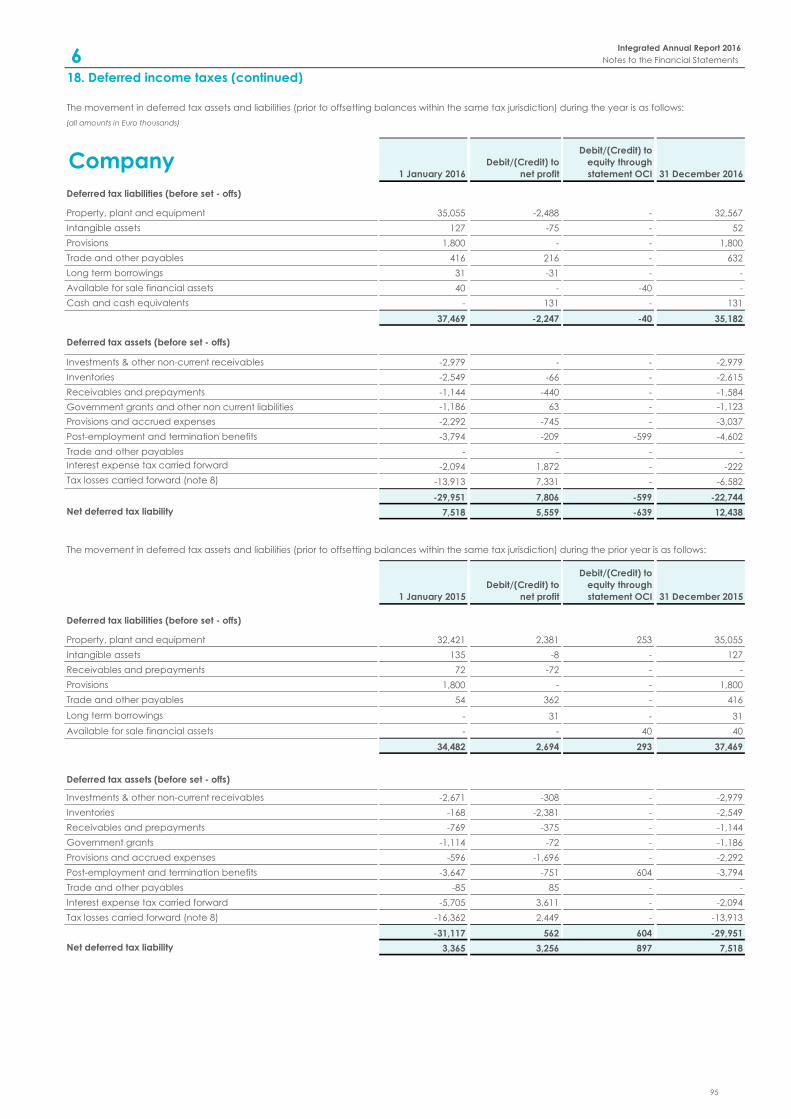
18. Deferred income taxes (continued)
(all amounts in Euro thousands)
Company1 January 2016
Debit/(Credit) to
net profit
Debit/(Credit) to
equity through
statement OCI 31 December 2016
Deferred tax liabilities (before set - offs)
Property, plant and equipment 35,055 -2,488 - 32,567
Intangible assets 127 -75 - 52
Provisions 1,800 - - 1,800
Trade and other payables 416 216 - 632
Long term borrowings 31 -31 - -
Available for sale financial assets 40 - -40 -
Cash and cash equivalents - 131 - 131
37,469 -2,247 -40 35,182
Deferred tax assets (before set - offs)
Investments & other non-current receivables -2,979 - - -2,979
Inventories -2,549 -66 - -2,615
Receivables and prepayments -1,144 -440 - -1,584
Government grants and other non current liabilities -1,186 63 - -1,123
Provisions and accrued expenses -2,292 -745 - -3,037
Post-employment and termination benefits -3,794 -209 -599 -4,602
Trade and other payables - - - -
Interest expense tax carried forward -2,094 1,872 - -222
Tax losses carried forward (note 8) -13,913 7,331 - -6,582
-29,951 7,806 -599 -22,744
Net deferred tax liability 7,518 5,559 -639 12,438
1 January 2015
Debit/(Credit) to
net profit
Debit/(Credit) to
equity through
statement OCI 31 December 2015
Deferred tax liabilities (before set - offs)
Property, plant and equipment 32,421 2,381 253 35,055
Intangible assets 135 -8 - 127
Receivables and prepayments 72 -72 - -
Provisions 1,800 - - 1,800
Trade and other payables 54 362 - 416
Long term borrowings - 31 - 31
Available for sale financial assets - - 40 40
34,482 2,694 293 37,469
Deferred tax assets (before set - offs)
Investments & other non-current receivables -2,671 -308 - -2,979
Inventories -168 -2,381 - -2,549
Receivables and prepayments -769 -375 - -1,144
Government grants -1,114 -72 - -1,186
Provisions and accrued expenses -596 -1,696 - -2,292
Post-employment and termination benefits -3,647 -751 604 -3,794
Trade and other payables -85 85 - -
Interest expense tax carried forward -5,705 3,611 - -2,094
Tax losses carried forward (note 8) -16,362 2,449 - -13,913
-31,117 562 604 -29,951
Net deferred tax liability 3,365 3,256 897 7,518
The movement in deferred tax assets and liabilities (prior to offsetting balances within the same tax jurisdiction) during the year is as follows:
The movement in deferred tax assets and liabilities (prior to offsetting balances within the same tax jurisdiction) during the prior year is as follows:
Integrated Annual Report 2016
Notes to the Financial Statements6
95
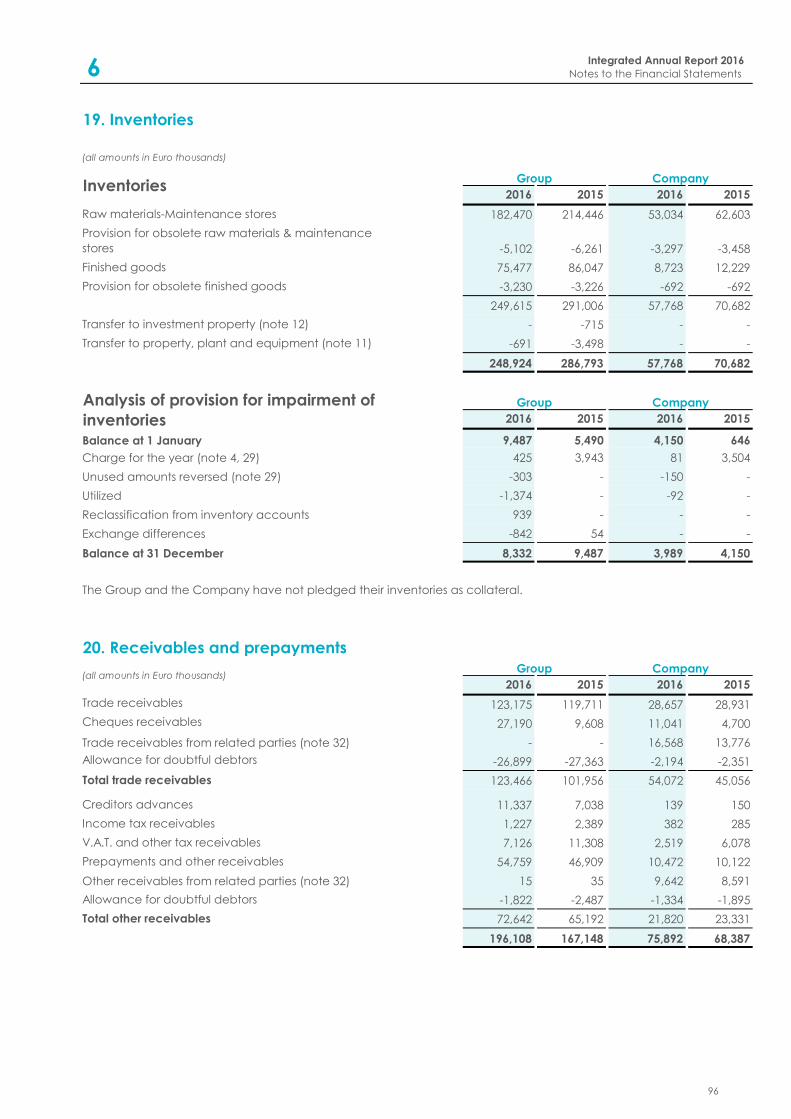
19. Inventories
(all amounts in Euro thousands)
2016 2015 2016 2015
182,470 214,446 53,034 62,603
-5,102 -6,261 -3,297 -3,458
75,477 86,047 8,723 12,229
-3,230 -3,226 -692 -692
249,615 291,006 57,768 70,682
- -715 - -
-691 -3,498 - -
248,924 286,793 57,768 70,682
2016 2015 2016 2015
Balance at 1 January 9,487 5,490 4,150 646
Charge for the year (note 4, 29) 425 3,943 81 3,504
Unused amounts reversed (note 29) -303 - -150 -
Utilized -1,374 - -92 -
Reclassification from inventory accounts 939 - - -
Exchange differences -842 54 - -
Balance at 31 December 8,332 9,487 3,989 4,150
20. Receivables and prepayments
2016 2015 2016 2015
Trade receivables 123,175 119,711 28,657 28,931
Cheques receivables 27,190 9,608 11,041 4,700
Trade receivables from related parties (note 32) - - 16,568 13,776
Allowance for doubtful debtors -26,899 -27,363 -2,194 -2,351
123,466 101,956 54,072 45,056
11,337 7,038 139 150
1,227 2,389 382 285
7,126 11,308 2,519 6,078
54,759 46,909 10,472 10,122
Other receivables from related parties (note 32) 15 35 9,642 8,591
-1,822 -2,487 -1,334 -1,895
72,642 65,192 21,820 23,331
196,108 167,148 75,892 68,387
Company
(all amounts in Euro thousands)
Analysis of provision for impairment of
inventories
Group Company
Group Company
The Group and the Company have not pledged their inventories as collateral.
Transfer to investment property (note 12)
Raw materials-Maintenance stores
Provision for obsolete raw materials & maintenance
stores
Finished goods
Provision for obsolete finished goods
Inventories
Transfer to property, plant and equipment (note 11)
Group
Total other receivables
Allowance for doubtful debtors
Creditors advances
Prepayments and other receivables
Income tax receivables
V.A.T. and other tax receivables
Total trade receivables
Integrated Annual Report 2016
Notes to the Financial Statements6
96
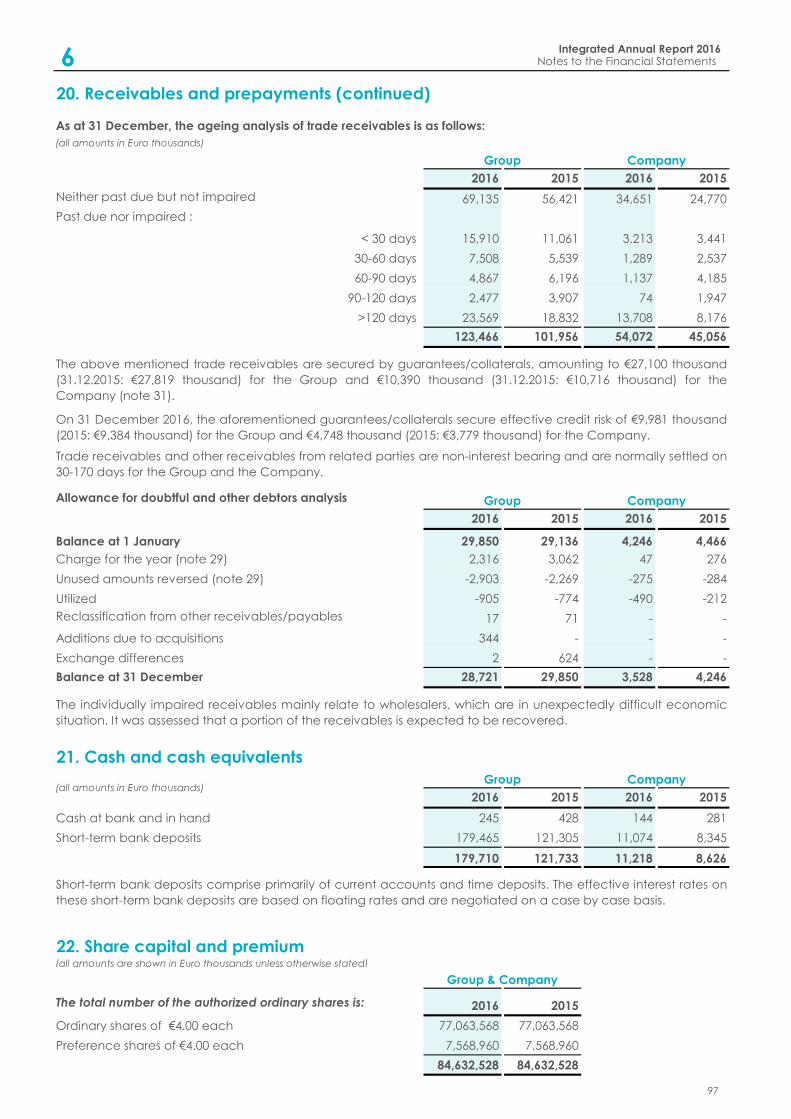
(all amounts in Euro thousands)
2016 2015 2016 2015
Neither past due but not impaired 69,135 56,421 34,651 24,770
Past due nor impaired :
< 30 days 15,910 11,061 3,213 3,441
30-60 days 7,508 5,539 1,289 2,537
60-90 days 4,867 6,196 1,137 4,185
90-120 days 2,477 3,907 74 1,947
>120 days 23,569 18,832 13,708 8,176
123,466 101,956 54,072 45,056
2016 2015 2016 2015
Balance at 1 January 29,850 29,136 4,246 4,466
Charge for the year (note 29) 2,316 3,062 47 276
Unused amounts reversed (note 29) -2,903 -2,269 -275 -284
Utilized -905 -774 -490 -212
Reclassification from other receivables/payables 17 71 - -
Additions due to acquisitions 344 - - -
Exchange differences 2 624 - -
Balance at 31 December 28,721 29,850 3,528 4,246
- - - -
2016 2015 2016 2015
Cash at bank and in hand 245 428 144 281
Short-term bank deposits 179,465 121,305 11,074 8,345
179,710 121,733 11,218 8,626
(all amounts are shown in Euro thousands unless otherwise stated)
The total number of the authorized ordinary shares is: 2016 2015
Ordinary shares of €4.00 each 77,063,568 77,063,568
Preference shares of €4.00 each 7,568,960 7,568,960
84,632,528 84,632,528
Short-term bank deposits comprise primarily of current accounts and time deposits. The effective interest rates on
these short-term bank deposits are based on floating rates and are negotiated on a case by case basis.
On 31 December 2016, the aforementioned guarantees/collaterals secure effective credit risk of €9,981 thousand
(2015: €9,384 thousand) for the Group and €4,748 thousand (2015: €3,779 thousand) for the Company.
The individually impaired receivables mainly relate to wholesalers, which are in unexpectedly difficult economic
situation. It was assessed that a portion of the receivables is expected to be recovered.
Group & Company
22. Share capital and premium
Group Company(all amounts in Euro thousands)
21. Cash and cash equivalents
20. Receivables and prepayments (continued)
Group Company
Group Company
As at 31 December, the ageing analysis of trade receivables is as follows:
Trade receivables and other receivables from related parties are non-interest bearing and are normally settled on
30-170 days for the Group and the Company.
The above mentioned trade receivables are secured by guarantees/collaterals, amounting to €27,100 thousand
(31.12.2015: €27,819 thousand) for the Group and €10,390 thousand (31.12.2015: €10,716 thousand) for the
Company (note 31).
Allowance for doubtful and other debtors analysis
Integrated Annual Report 2016Notes to the Financial Statements6
97
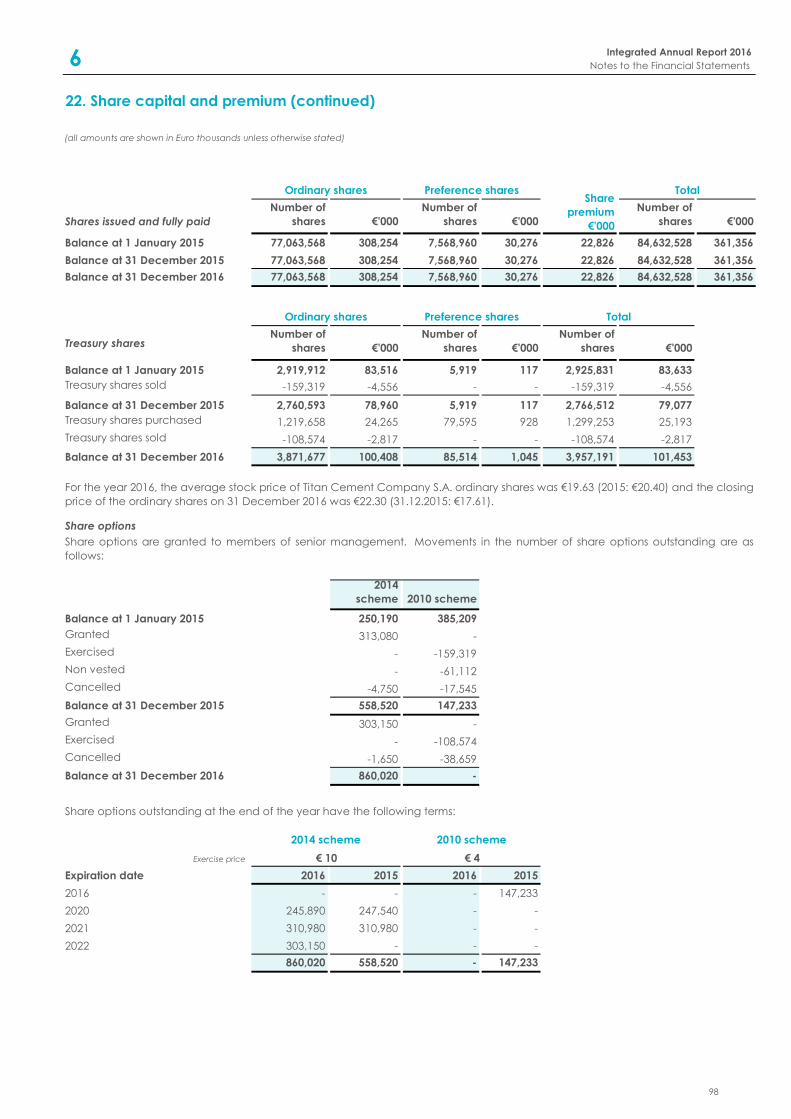
Shares issued and fully paid
Number of
shares €'000
Number of
shares €'000
Number of
shares €'000
Balance at 1 January 2015 77,063,568 308,254 7,568,960 30,276 22,826 84,632,528 361,356
Balance at 31 December 2015 77,063,568 308,254 7,568,960 30,276 22,826 84,632,528 361,356
Balance at 31 December 2016 77,063,568 308,254 7,568,960 30,276 22,826 84,632,528 361,356
Treasury shares Number of
shares €'000
Number of
shares €'000
Number of
shares €'000
Balance at 1 January 2015 2,919,912 83,516 5,919 117 2,925,831 83,633
Treasury shares sold -159,319 -4,556 - - -159,319 -4,556
Balance at 31 December 2015 2,760,593 78,960 5,919 117 2,766,512 79,077
Treasury shares purchased 1,219,658 24,265 79,595 928 1,299,253 25,193
Treasury shares sold -108,574 -2,817 - - -108,574 -2,817
Balance at 31 December 2016 3,871,677 100,408 85,514 1,045 3,957,191 101,453
Share options
2014
scheme 2010 scheme
Balance at 1 January 2015 250,190 385,209
Granted 313,080 -
Exercised - -159,319
Non vested - -61,112
Cancelled -4,750 -17,545
Balance at 31 December 2015 558,520 147,233
Granted 303,150 -
Exercised - -108,574
Cancelled -1,650 -38,659
Balance at 31 December 2016 860,020 -
Exercise price
Expiration date 2016 2015 2016 2015
2016 - - - 147,233
2020 245,890 247,540 - -
2021 310,980 310,980 - -
2022 303,150 - - -
860,020 558,520 - 147,233
22. Share capital and premium (continued)
(all amounts are shown in Euro thousands unless otherwise stated)
TotalShare
premium
€'000
Ordinary shares
€ 4€ 10
2014 scheme 2010 scheme
Preference shares
Ordinary shares
For the year 2016, the average stock price of Titan Cement Company S.A. ordinary shares was €19.63 (2015: €20.40) and the closing
price of the ordinary shares on 31 December 2016 was €22.30 (31.12.2015: €17.61).
Share options are granted to members of senior management. Movements in the number of share options outstanding are as
follows:
Share options outstanding at the end of the year have the following terms:
Preference shares Total
Integrated Annual Report 2016
Notes to the Financial Statements6
98
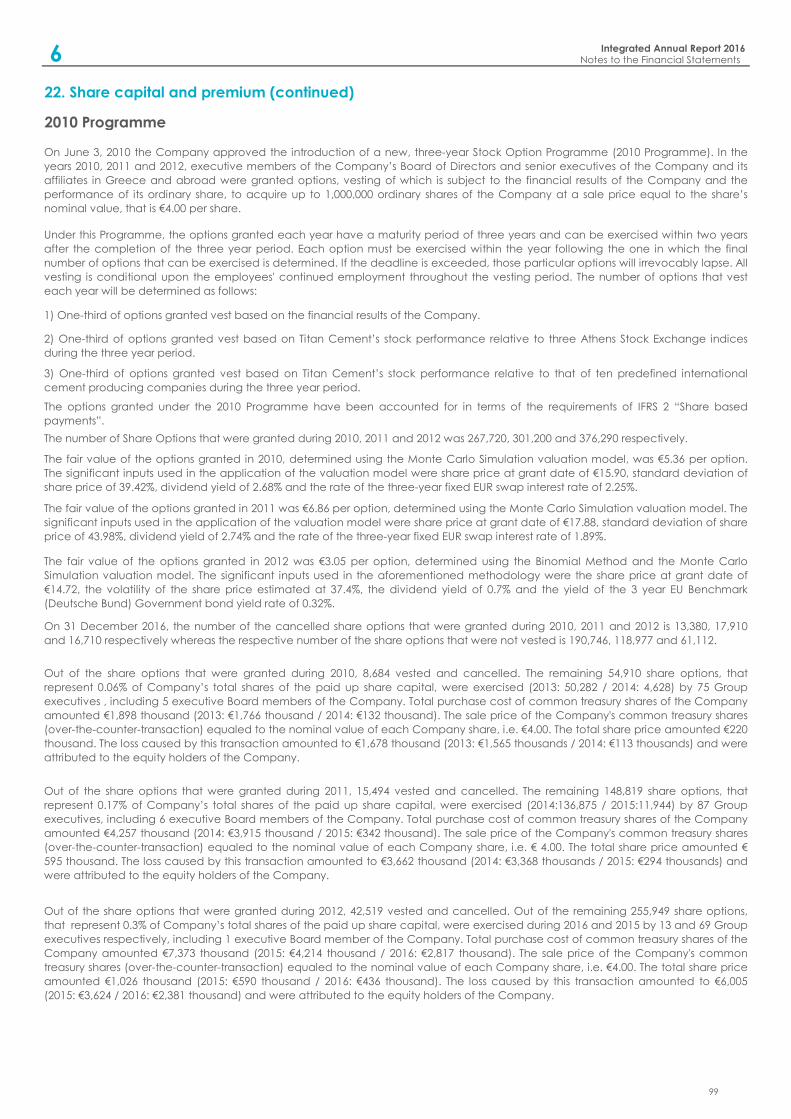
22. Share capital and premium (continued)
2010 Programme
The number of Share Options that were granted during 2010, 2011 and 2012 was 267,720, 301,200 and 376,290 respectively.
The fair value of the options granted in 2010, determined using the Monte Carlo Simulation valuation model, was €5.36 per option.
The significant inputs used in the application of the valuation model were share price at grant date of €15.90, standard deviation of
share price of 39.42%, dividend yield of 2.68% and the rate of the three-year fixed EUR swap interest rate of 2.25%.
On June 3, 2010 the Company approved the introduction of a new, three-year Stock Option Programme (2010 Programme). In the
years 2010, 2011 and 2012, executive members of the Company’s Board of Directors and senior executives of the Company and its
affiliates in Greece and abroad were granted options, vesting of which is subject to the financial results of the Company and the
performance of its ordinary share, to acquire up to 1,000,000 ordinary shares of the Company at a sale price equal to the share’s
nominal value, that is €4.00 per share.
Under this Programme, the options granted each year have a maturity period of three years and can be exercised within two years
after the completion of the three year period. Each option must be exercised within the year following the one in which the final
number of options that can be exercised is determined. If the deadline is exceeded, those particular options will irrevocably lapse. All
vesting is conditional upon the employees' continued employment throughout the vesting period. The number of options that vest
each year will be determined as follows:
1) One-third of options granted vest based on the financial results of the Company.
2) One-third of options granted vest based on Titan Cement’s stock performance relative to three Athens Stock Exchange indices
during the three year period.
3) One-third of options granted vest based on Titan Cement’s stock performance relative to that of ten predefined international
cement producing companies during the three year period.
The options granted under the 2010 Programme have been accounted for in terms of the requirements of IFRS 2 “Share based
payments”.
On 31 December 2016, the number of the cancelled share options that were granted during 2010, 2011 and 2012 is 13,380, 17,910
and 16,710 respectively whereas the respective number of the share options that were not vested is 190,746, 118,977 and 61,112.
Out of the share options that were granted during 2010, 8,684 vested and cancelled. The remaining 54,910 share options, that
represent 0.06% of Company’s total shares of the paid up share capital, were exercised (2013: 50,282 / 2014: 4,628) by 75 Group
executives , including 5 executive Board members of the Company. Total purchase cost of common treasury shares of the Company
amounted €1,898 thousand (2013: €1,766 thousand / 2014: €132 thousand). The sale price of the Company's common treasury shares
(over-the-counter-transaction) equaled to the nominal value of each Company share, i.e. €4.00. The total share price amounted €220
thousand. The loss caused by this transaction amounted to €1,678 thousand (2013: €1,565 thousands / 2014: €113 thousands) and were
attributed to the equity holders of the Company.
The fair value of the options granted in 2012 was €3.05 per option, determined using the Binomial Method and the Monte Carlo
Simulation valuation model. The significant inputs used in the aforementioned methodology were the share price at grant date of
€14.72, the volatility of the share price estimated at 37.4%, the dividend yield of 0.7% and the yield of the 3 year EU Benchmark
(Deutsche Bund) Government bond yield rate of 0.32%.
The fair value of the options granted in 2011 was €6.86 per option, determined using the Monte Carlo Simulation valuation model. The
significant inputs used in the application of the valuation model were share price at grant date of €17.88, standard deviation of share
price of 43.98%, dividend yield of 2.74% and the rate of the three-year fixed EUR swap interest rate of 1.89%.
Out of the share options that were granted during 2011, 15,494 vested and cancelled. The remaining 148,819 share options, that
represent 0.17% of Company’s total shares of the paid up share capital, were exercised (2014:136,875 / 2015:11,944) by 87 Group
executives, including 6 executive Board members of the Company. Total purchase cost of common treasury shares of the Company
amounted €4,257 thousand (2014: €3,915 thousand / 2015: €342 thousand). The sale price of the Company's common treasury shares
(over-the-counter-transaction) equaled to the nominal value of each Company share, i.e. € 4.00. The total share price amounted €
595 thousand. The loss caused by this transaction amounted to €3,662 thousand (2014: €3,368 thousands / 2015: €294 thousands) and
were attributed to the equity holders of the Company.
Out of the share options that were granted during 2012, 42,519 vested and cancelled. Out of the remaining 255,949 share options,
that represent 0.3% of Company’s total shares of the paid up share capital, were exercised during 2016 and 2015 by 13 and 69 Group
executives respectively, including 1 executive Board member of the Company. Total purchase cost of common treasury shares of the
Company amounted €7,373 thousand (2015: €4,214 thousand / 2016: €2,817 thousand). The sale price of the Company's common
treasury shares (over-the-counter-transaction) equaled to the nominal value of each Company share, i.e. €4.00. The total share price
amounted €1,026 thousand (2015: €590 thousand / 2016: €436 thousand). The loss caused by this transaction amounted to €6,005
(2015: €3,624 / 2016: €2,381 thousand) and were attributed to the equity holders of the Company.
Integrated Annual Report 2016Notes to the Financial Statements6
99
22. Share capital and premium (continued)
2014 Programme
The vesting period of the stock options that were granted in 2014, 2015 and those that will be granted in 2016 shall be three years.
Therefore, the relevant option rights shall become mature in December of 2016, 2017 and 2018 respectively, provided that the
beneficiaries are still employees of the Group. After the completion of the three-year vesting period, the final option rights number,
which the beneficiaries will be entitled to exercise, shall be determined by the Board of Directors, within the first four months of 2017,
2018 and 2019 respectively and shall depend:
On 20 June 2014, the General Meeting approved the introduction of a new, three-year Stock Option Programme. According to this
Programme, the Company’s Board of Directors can grant option up to 1,000,000 ordinary shares of the Company at a sale price
equal to €10.00 per share. Beneficiaries of the Stock Option Plan are the executive members of the Board of Directors of the
Company, the managers and the employees who have the same rank in affiliated companies inside and outside Greece and finally
a limited number of the other employees who stand out on a continuous basis for their good performance and have a high potential
for advancement.
a) By 50% on the average three year Return on Average Capital Employed (ROACE) compared to the target of each year period, as
this will be determined by the Board of Directors before granting the relevant option rights.
b) By 50% on the overall performance of the Company's common share compared to the average overall performance of the shares
of the ten predefined international cement producing companies.
The fair value of the options granted in 2014 was €7.39 per option, determined using the Binomial Method and the Monte Carlo
Simulation valuation model. The significant inputs used in the aforementioned methodologies were the share price at grant date of
€25.32, the employee forfeiture rate 9.2%, the volatility of the share price estimated at 47.2%, the dividend yield of 0.376% and the
yield of the 3 year EU Benchmark (Deutsche Bund) Government bond yield rate of 0.083%.
The fair value of the options granted in 2015 was €4.14 per option, determined using the Binomial Method and the Monte Carlo
Simulation valuation model. The significant inputs used in the aforementioned methodologies were the share price at grant date of
€19.55, the employee forfeiture rate 9.2%, the volatility of the share price estimated at 40.61%, the dividend yield of 0.59% and the
yield of the 1 year EURIBOR rate of 0.166%.
The fair value of the options granted in 2016 was €5.17 per option, determined using the Binomial Method and the Monte Carlo
Simulation valuation model. The significant inputs used in the aforementioned methodologies were the share price at grant date of
€20.38, the employee forfeiture rate 9.2%, the volatility of the share price estimated at 42.80%, the dividend yield of 0.87% and the
yield of the 1 year EURIBOR rate of -0.15%.
The Beneficiaries shall be entitled to exercise their stock option rights, either in whole or in part, within the first five days of each month,
paying the Company the relevant amounts until the expiration date of their stock options, i.e. until December of the third year after
these stock options have been vested.
The options granted under the 2014 Programme have been accounted for in terms of the requirements of IFRS 2 “Share based
payments”.
The number of Share Options that were granted during 2014, 2015 and 2016 was 250,190, 313,080 and 303,150 respectively.
On 31 December 2016 the number of the cancelled share options that were granted during 2014, 2015 was 4.300 and 2.100
respectively.
Integrated Annual Report 2016
Notes to the Financial Statements6
100
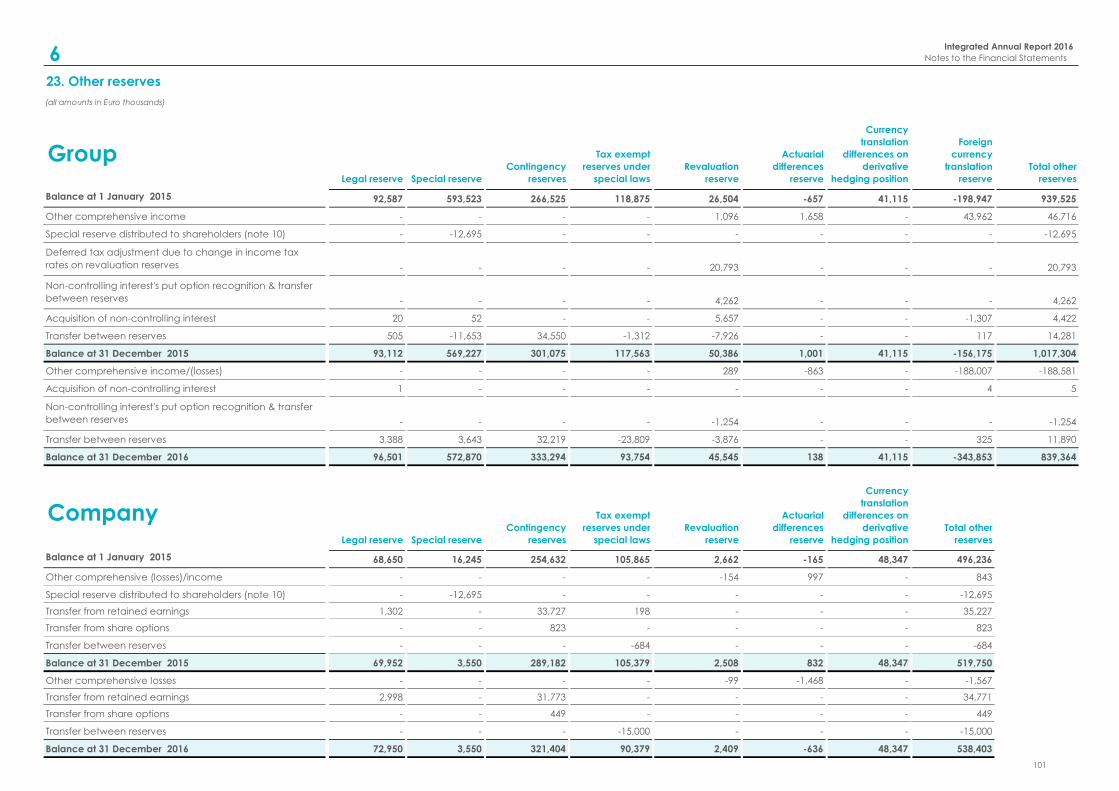
23. Other reserves
(all amounts in Euro thousands)
GroupLegal reserve Special reserve
Contingency
reserves
Tax exempt
reserves under
special laws
Revaluation
reserve
Actuarial
differences
reserve
Currency
translation
differences on
derivative
hedging position
Foreign
currency
translation
reserve
Total other
reserves
Balance at 1 January 2015 92,587 593,523 266,525 118,875 26,504 -657 41,115 -198,947 939,525
Other comprehensive income - - - - 1,096 1,658 - 43,962 46,716
Special reserve distributed to shareholders (note 10) - -12,695 - - - - - - -12,695
Deferred tax adjustment due to change in income tax
rates on revaluation reserves - - - - 20,793 - - - 20,793
Non-controlling interest's put option recognition & transfer
between reserves - - - - 4,262 - - - 4,262
Acquisition of non-controlling interest 20 52 - - 5,657 - - -1,307 4,422
Transfer between reserves 505 -11,653 34,550 -1,312 -7,926 - - 117 14,281
Balance at 31 December 2015 93,112 569,227 301,075 117,563 50,386 1,001 41,115 -156,175 1,017,304
Other comprehensive income/(losses) - - - - 289 -863 - -188,007 -188,581
Acquisition of non-controlling interest 1 - - - - - - 4 5
Non-controlling interest's put option recognition & transfer
between reserves - - - - -1,254 - - - -1,254
Transfer between reserves 3,388 3,643 32,219 -23,809 -3,876 - - 325 11,890
Balance at 31 December 2016 96,501 572,870 333,294 93,754 45,545 138 41,115 -343,853 839,364
CompanyLegal reserve Special reserve
Contingency
reserves
Tax exempt
reserves under
special laws
Revaluation
reserve
Actuarial
differences
reserve
Currency
translation
differences on
derivative
hedging position
Total other
reserves
Balance at 1 January 2015 68,650 16,245 254,632 105,865 2,662 -165 48,347 496,236
Other comprehensive (losses)/income - - - - -154 997 - 843
Special reserve distributed to shareholders (note 10) - -12,695 - - - - - -12,695
Transfer from retained earnings 1,302 - 33,727 198 - - - 35,227
Transfer from share options - - 823 - - - - 823
Transfer between reserves - - - -684 - - - -684
Balance at 31 December 2015 69,952 3,550 289,182 105,379 2,508 832 48,347 519,750
Other comprehensive losses - - - - -99 -1,468 - -1,567
Transfer from retained earnings 2,998 - 31,773 - - - - 34,771
Transfer from share options - - 449 - - - - 449
Transfer between reserves - - - -15,000 - - - -15,000
Balance at 31 December 2016 72,950 3,550 321,404 90,379 2,409 -636 48,347 538,403
Integrated Annual Report 2016
Notes to the Financial Statements6
101
The Actuarial Differences Reserve records the re-measurement gains and losses (actuarial gains and losses)
arising from the actuarial studies performed by the Group's subsidiaries for various benefit, pension or other
retirement schemes (note 25).
Moreover, Foreign Currency Translation Reserve includes the currency translation differences reserve on
transactions designated as part of net investment in foreign operations. During the last quarter of 2016, the
Group subsidiary Titan Egyptian Investment Ltd (TEIL) decided to renew the loan of €76.9 million that had entered
into with its subsidiary in Egypt, Alexandria Portland Cement Co. S.A.E. (APCC) in 2010. According to its
accounting policy, the Group recognizes in its consolidated financial statements the aforementioned intergroup
loan as part of the net investment in the Egyptian operation. On 31 December 2016, this reserve has a debit
balance of €23.2 million.
The Currency Translation Differences on Derivative Hedging Position Reserve illustrates the exchange differences
arising from the translation into euro of loans in foreign currency, which have been designated as net investment
hedges for certain Group subsidiaries abroad. It also illustrates the exchange differences arising from the
valuation of financial instruments used as cash flow hedges for transactions in foreign currencies.
Certain Group companies are obliged according to the applicable commercial law to retain a percentage of
their annual net profits as legal reserve. This reserve cannot be distributed during the operational life of the
company.
The Contingency Reserves include, among others, reserves formed by the Company and certain Group
subsidiaries by applying developmental laws. These reserves have exhausted their tax liability or have been
permanently exempted from taxation, so there is no additional tax charge for the Group and the Company
from their distribution. Based on the decision of the General Meeting of 17 June 2016 the "special & contingency
reserves" have increased by €31.8 million due to the transfer from "retained earnings".
The Foreign Currency Translation Reserve is used to record exchange differences arising from the translation of
the financial statements of foreign subsidiaries.
23. Other reserves (continued)
The Revaluation Reserve includes: a) €42.8 million (2015: €48.2 million) as the fair value of tangible and intangible
assets that the Group had in Egypt through its participation in the joint venture Lafarge-Titan Egyptian
Investments Ltd, until it fully acquired the joint venture and b) the €0.2 million (2015: €1.4 million) debit difference
between the fair value and the book value arising from the recognition of the put option of the non-controlling
interests for the sale of ANTEA Cement SHA's shares.
The distribution of the remaining aforementioned reserves can be carried out after the approval of the
shareholders at the Annual General Meeting and the payment of the applicable tax. The Group has no intention
to distribute the remaining amount of these reserves and consequently, has not calculated the income tax that
would arise from such distribution.
The Tax Exempt Reserves under Special Laws, according to the Greek tax legislation, are exempt from income
tax, provided that they are not distributed to the shareholders.
Integrated Annual Report 2016
Notes to the Financial Statements6
102
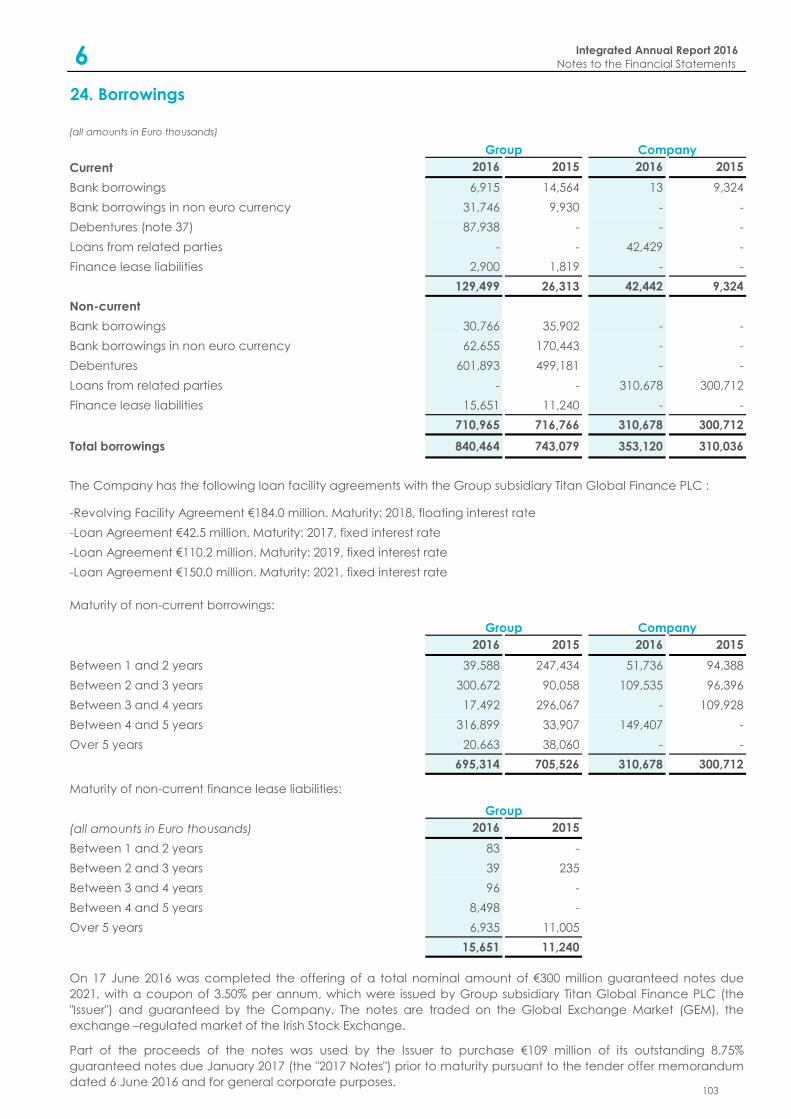
(all amounts in Euro thousands)
Current 2016 2015 2016 2015
Bank borrowings 6,915 14,564 13 9,324
Bank borrowings in non euro currency 31,746 9,930 - -
Debentures (note 37) 87,938 - - -
Loans from related parties - - 42,429 -
Finance lease liabilities 2,900 1,819 - -
129,499 26,313 42,442 9,324
Non-current
Bank borrowings 30,766 35,902 - -
Bank borrowings in non euro currency 62,655 170,443 - -
Debentures 601,893 499,181 - -
Loans from related parties - - 310,678 300,712
Finance lease liabilities 15,651 11,240 - -
710,965 716,766 310,678 300,712
Total borrowings 840,464 743,079 353,120 310,036
The Company has the following loan facility agreements with the Group subsidiary Titan Global Finance PLC :
-Revolving Facility Agreement €184.0 million. Maturity: 2018, floating interest rate
-Loan Agreement €42.5 million. Maturity: 2017, fixed interest rate
-Loan Agreement €110.2 million. Maturity: 2019, fixed interest rate
-Loan Agreement €150.0 million. Maturity: 2021, fixed interest rate
2016 2015 2016 2015
Between 1 and 2 years 39,588 247,434 51,736 94,388
Between 2 and 3 years 300,672 90,058 109,535 96,396
Between 3 and 4 years 17,492 296,067 - 109,928
Between 4 and 5 years 316,899 33,907 149,407 -
Over 5 years 20,663 38,060 - -
695,314 705,526 310,678 300,712
(all amounts in Euro thousands) 2016 2015
Between 1 and 2 years 83 -
Between 2 and 3 years 39 235
Between 3 and 4 years 96 -
Between 4 and 5 years 8,498 -
Over 5 years 6,935 11,005
15,651 11,240
Group Company
24. Borrowings
Part of the proceeds of the notes was used by the Issuer to purchase €109 million of its outstanding 8.75%
guaranteed notes due January 2017 (the "2017 Notes") prior to maturity pursuant to the tender offer memorandum
dated 6 June 2016 and for general corporate purposes.
On 17 June 2016 was completed the offering of a total nominal amount of €300 million guaranteed notes due
2021, with a coupon of 3.50% per annum, which were issued by Group subsidiary Titan Global Finance PLC (the
"Issuer") and guaranteed by the Company. The notes are traded on the Global Exchange Market (GEM), the
exchange –regulated market of the Irish Stock Exchange.
Maturity of non-current borrowings:
CompanyGroup
Maturity of non-current finance lease liabilities:
Group
Integrated Annual Report 2016
Notes to the Financial Statements6
103
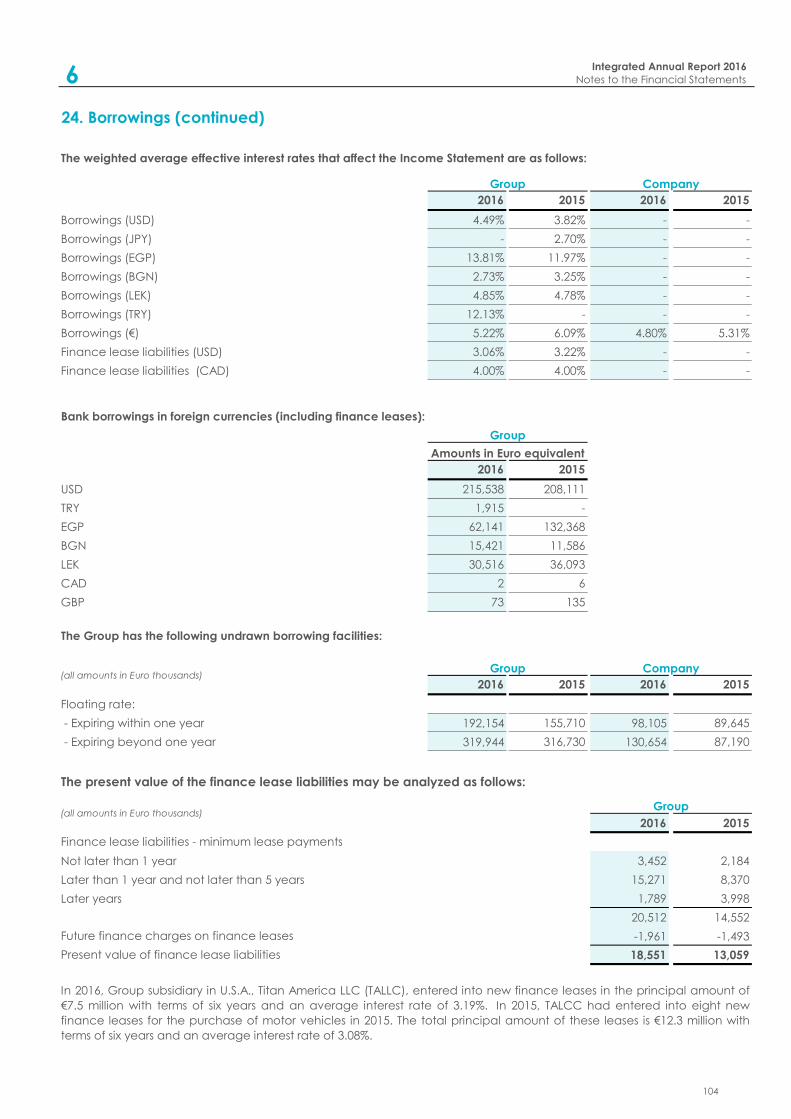
2016 2015 2016 2015
Borrowings (USD) 4.49% 3.82% - -
Borrowings (JPY) - 2.70% - -
Borrowings (EGP) 13.81% 11.97% - -
Borrowings (BGN) 2.73% 3.25% - -
Borrowings (LEK) 4.85% 4.78% - -
Borrowings (TRY) 12.13% - - -
Borrowings (€) 5.22% 6.09% 4.80% 5.31%
Finance lease liabilities (USD) 3.06% 3.22% - -
Finance lease liabilities (CAD) 4.00% 4.00% - -
2016 2015
USD 215,538 208,111
TRY 1,915 -
EGP 62,141 132,368
BGN 15,421 11,586
LEK 30,516 36,093
CAD 2 6
GBP 73 135
2016 2015 2016 2015
Floating rate:
- Expiring within one year 192,154 155,710 98,105 89,645
- Expiring beyond one year 319,944 316,730 130,654 87,190
2016 2015
Not later than 1 year 3,452 2,184
Later than 1 year and not later than 5 years 15,271 8,370
Later years 1,789 3,998
20,512 14,552
-1,961 -1,493
18,551 13,059
In 2016, Group subsidiary in U.S.A., Titan America LLC (TALLC), entered into new finance leases in the principal amount of
€7.5 million with terms of six years and an average interest rate of 3.19%. In 2015, TALCC had entered into eight new
finance leases for the purchase of motor vehicles in 2015. The total principal amount of these leases is €12.3 million with
terms of six years and an average interest rate of 3.08%.
Finance lease liabilities - minimum lease payments
Future finance charges on finance leases
Present value of finance lease liabilities
The Group has the following undrawn borrowing facilities:
Group
The present value of the finance lease liabilities may be analyzed as follows:
(all amounts in Euro thousands)
(all amounts in Euro thousands)
Group Company
The weighted average effective interest rates that affect the Income Statement are as follows:
Group
Amounts in Euro equivalent
24. Borrowings (continued)
CompanyGroup
Bank borrowings in foreign currencies (including finance leases):
Integrated Annual Report 2016
Notes to the Financial Statements6
104
25. Retirement and termination benefit obligations
Greece
Greek labor legislation requires that the payment of retirement and termination indemnities is based on the
number of years of service to the Company by the employees and on their final remuneration. The Group grants
retirement indemnities which exceed the legal requirements. These retirement indemnities are unfunded and the
liabilities arising from such obligations are actuarially valued by an independent firm of actuaries. The last
actuarial valuation was undertaken in December 2016. The principal actuarial assumptions used were a discount
rate of 1.5% (2015: 1.9%), future salary increases of 1.75% (2015: 2%) and no change in future pensions.
USA
The Group's U.S. subsidiaries operate defined benefit plans and other post-retirement benefit plans. The method
of accounting for the latter, as well as the valuation assumptions and the frequency of valuations are similar to
those used for defined benefit plans.
All of the Group's U.S. subsidiaries' defined benefit pension plans and all but one of its other post-retirement plans
have been frozen as to new participants and credited service. One post-retirement benefit plan exists (for certain
active and former employees) whereby eligible retirees receive benefits consisting primarily of assistance with
medical insurance costs between the dates of early retirement and Medicare eligibility.
On 31 December 2016 the plan assets of the Group's subsidiaries in the US have invested approximately 58%
(2015: 57%) in equity instruments quated in US and international stock markets and 42% (2015: 43%) in fixed
investments (US and international bonds). The discount rate that has been adopted for the study of the pension
plans of the Group's subsidiaries in the U.S. was 4% (2015: 4%).
Multi-employer plan
Certain employees participate in a union sponsored, defined benefit multi-employer pension plan. This plan is not
administered by the Group's U.S. subsidiaries and contributions are determined in accordance with the provisions
of the negotiated labor contract. These contributions are affected by the funded status of the plan.
Excess benefit plan
This plan is intended to constitute an unfunded plan of deferred compensation for a selected group of highly
compensated employees under the Employee Income Security Act of 1974 ("ERISA"). For this purpose the Group's
U.S. subsidiary created an irrevocable trust to facilitate the payment of deferred compensation to participants
under this plan. Under this plan the participants are eligible to defer from 0% to 20% of eligible compensation for
the applicable plan year. In 2012, the Group's U.S. subsidiary suspended its matching amounts for all
contributions. On 31 December 2016 and 2015, plan assets totaled €4,364 thousand and €4,578 thousands,
respectively, and are classified as other non current assets in the accompanying consolidated statement of
financial position (note 17). There were no costs for the plan for the year ended 31 December 2016 or 2015.
Integrated Annual Report 2016Notes to the Financial Statements6
105
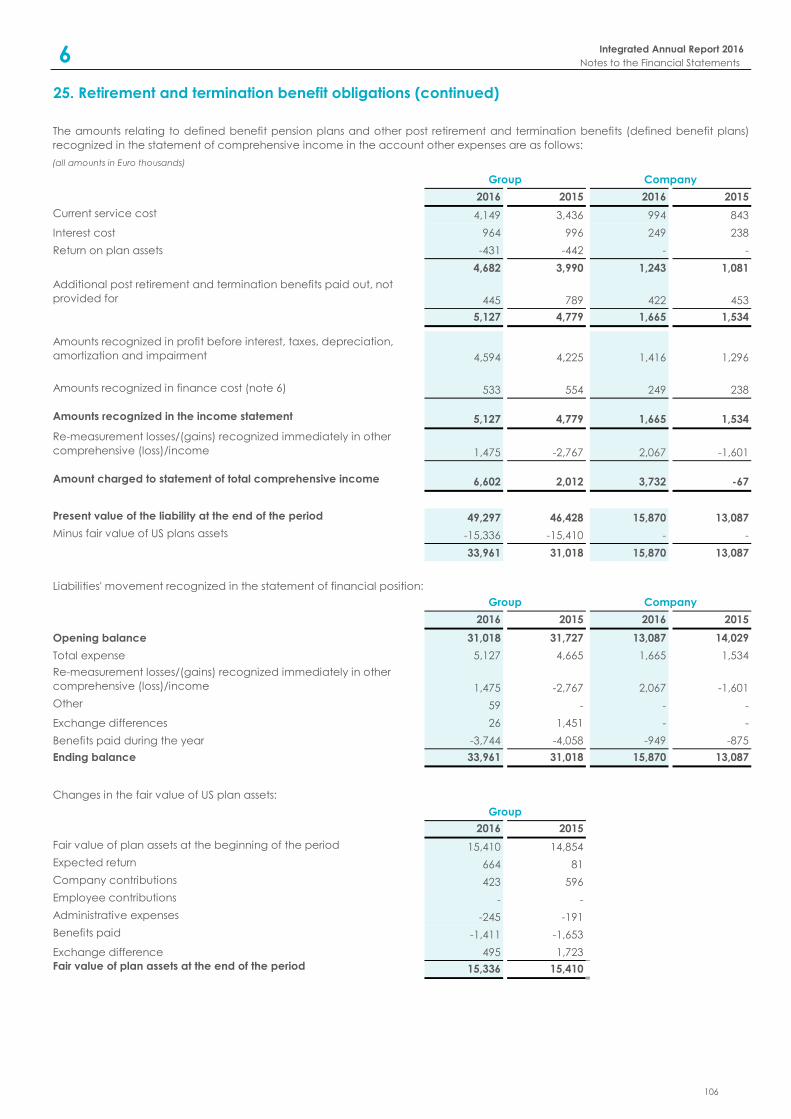
(all amounts in Euro thousands)
2016 2015 2016 2015
Current service cost 4,149 3,436 994 843
Interest cost 964 996 249 238
Return on plan assets -431 -442 - -
4,682 3,990 1,243 1,081
Additional post retirement and termination benefits paid out, not
provided for 445 789 422 453
5,127 4,779 1,665 1,534
Amounts recognized in profit before interest, taxes, depreciation,
amortization and impairment 4,594 4,225 1,416 1,296
Amounts recognized in finance cost (note 6) 533 554 249 238
Amounts recognized in the income statement 5,127 4,779 1,665 1,534
Re-measurement losses/(gains) recognized immediately in οther
comprehensive (loss)/income 1,475 -2,767 2,067 -1,601
Amount charged to statement of total comprehensive income 6,602 2,012 3,732 -67
Present value of the liability at the end of the period 49,297 46,428 15,870 13,087
Minus fair value of US plans assets -15,336 -15,410 - -
33,961 31,018 15,870 13,087
2016 2015 2016 2015
Opening balance 31,018 31,727 13,087 14,029
Total expense 5,127 4,665 1,665 1,534
Re-measurement losses/(gains) recognized immediately in οther
comprehensive (loss)/income 1,475 -2,767 2,067 -1,601
Other 59 - - -
Exchange differences 26 1,451 - -
Benefits paid during the year -3,744 -4,058 -949 -875
Ending balance 33,961 31,018 15,870 13,087
2016 2015
Fair value of plan assets at the beginning of the period 15,410 14,854
Expected return 664 81
Company contributions 423 596
Employee contributions - -
Administrative expenses -245 -191
Benefits paid -1,411 -1,653
Exchange difference 495 1,723
Fair value of plan assets at the end of the period 15,336 15,410
25. Retirement and termination benefit obligations (continued)
Group Company
Group
Group Company
The amounts relating to defined benefit pension plans and other post retirement and termination benefits (defined benefit plans)
recognized in the statement of comprehensive income in the account other expenses are as follows:
Liabilities' movement recognized in the statement of financial position:
Changes in the fair value of US plan assets:
Integrated Annual Report 2016
Notes to the Financial Statements6
106
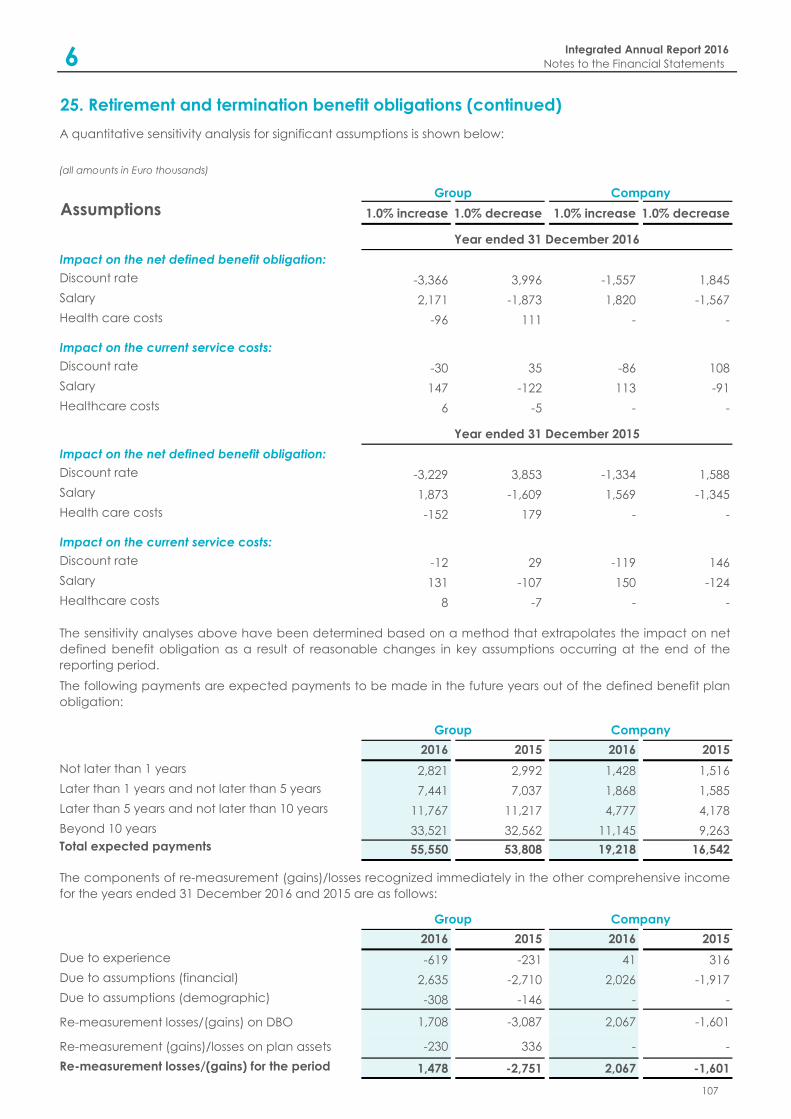
(all amounts in Euro thousands)
Assumptions 1.0% increase 1.0% decrease 1.0% increase 1.0% decrease
Discount rate -3,366 3,996 -1,557 1,845
Salary 2,171 -1,873 1,820 -1,567
Health care costs -96 111 - -
Discount rate -30 35 -86 108
Salary 147 -122 113 -91
Healthcare costs 6 -5 - -
Discount rate -3,229 3,853 -1,334 1,588
Salary 1,873 -1,609 1,569 -1,345
Health care costs -152 179 - -
Discount rate -12 29 -119 146
Salary 131 -107 150 -124
Healthcare costs 8 -7 - -
2016 2015 2016 2015
Not later than 1 years 2,821 2,992 1,428 1,516
Later than 1 years and not later than 5 years 7,441 7,037 1,868 1,585
Later than 5 years and not later than 10 years 11,767 11,217 4,777 4,178
Beyond 10 years 33,521 32,562 11,145 9,263
Total expected payments 55,550 53,808 19,218 16,542
2016 2015 2016 2015
Due to experience -619 -231 41 316
Due to assumptions (financial) 2,635 -2,710 2,026 -1,917
Due to assumptions (demographic) -308 -146 - -
Re-measurement losses/(gains) on DBO 1,708 -3,087 2,067 -1,601
Re-measurement (gains)/losses on plan assets -230 336 - -
Re-measurement losses/(gains) for the period 1,478 -2,751 2,067 -1,601
25. Retirement and termination benefit obligations (continued)
The sensitivity analyses above have been determined based on a method that extrapolates the impact on net
defined benefit obligation as a result of reasonable changes in key assumptions occurring at the end of the
reporting period.
The following payments are expected payments to be made in the future years out of the defined benefit plan
obligation:
A quantitative sensitivity analysis for significant assumptions is shown below:
Group Company
Impact on the current service costs:
Year ended 31 December 2016
Year ended 31 December 2015
Impact on the net defined benefit obligation:
Impact on the current service costs:
Impact on the net defined benefit obligation:
Group Company
The components of re-measurement (gains)/losses recognized immediately in the other comprehensive income
for the years ended 31 December 2016 and 2015 are as follows:
Group Company
Integrated Annual Report 2016
Notes to the Financial Statements6
107
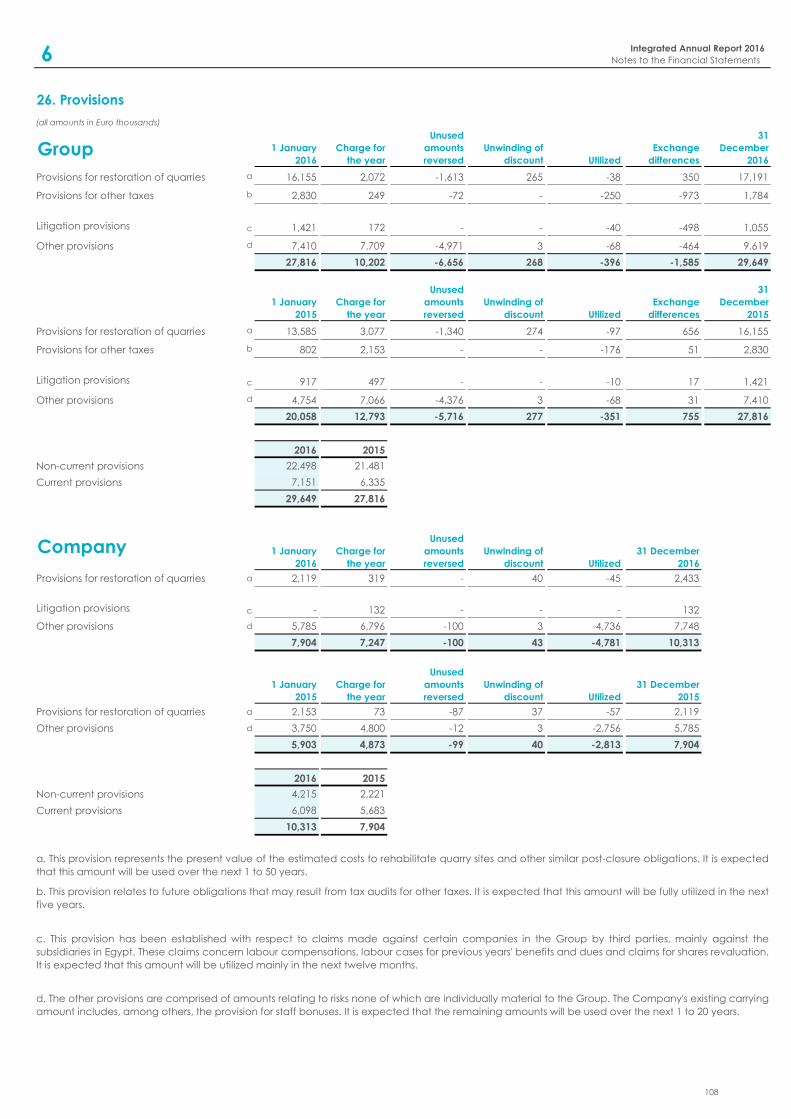
26. Provisions
(all amounts in Euro thousands)
Group 1 January
2016
Charge for
the year
Unused
amounts
reversed
Unwinding of
discount Utilized
Exchange
differences
31
December
2016
Provisions for restoration of quarries a 16,155 2,072 -1,613 265 -38 350 17,191
Provisions for other taxes b 2,830 249 -72 - -250 -973 1,784
Litigation provisions c 1,421 172 - - -40 -498 1,055
Other provisions d 7,410 7,709 -4,971 3 -68 -464 9,619
27,816 10,202 -6,656 268 -396 -1,585 29,649
1 January
2015
Charge for
the year
Unused
amounts
reversed
Unwinding of
discount Utilized
Exchange
differences
31
December
2015
Provisions for restoration of quarries a 13,585 3,077 -1,340 274 -97 656 16,155
Provisions for other taxes b 802 2,153 - - -176 51 2,830
Litigation provisions c 917 497 - - -10 17 1,421
Other provisions d 4,754 7,066 -4,376 3 -68 31 7,410
20,058 12,793 -5,716 277 -351 755 27,816
2016 2015
Non-current provisions 22,498 21,481
Current provisions 7,151 6,335
29,649 27,816
Company 1 January
2016
Charge for
the year
Unused
amounts
reversed
Unwinding of
discount Utilized
31 December
2016
Provisions for restoration of quarries a 2,119 319 - 40 -45 2,433
Litigation provisions c - 132 - - - 132
Other provisions d 5,785 6,796 -100 3 -4,736 7,748
7,904 7,247 -100 43 -4,781 10,313
1 January
2015
Charge for
the year
Unused
amounts
reversed
Unwinding of
discount Utilized
31 December
2015
Provisions for restoration of quarries a 2,153 73 -87 37 -57 2,119
Other provisions d 3,750 4,800 -12 3 -2,756 5,785
5,903 4,873 -99 40 -2,813 7,904
2016 2015
Non-current provisions 4,215 2,221
Current provisions 6,098 5,683
10,313 7,904
b. This provision relates to future obligations that may result from tax audits for other taxes. It is expected that this amount will be fully utilized in the next
five years.
d. The other provisions are comprised of amounts relating to risks none of which are individually material to the Group. The Company's existing carrying
amount includes, among others, the provision for staff bonuses. It is expected that the remaining amounts will be used over the next 1 to 20 years.
a. This provision represents the present value of the estimated costs to rehabilitate quarry sites and other similar post-closure obligations. It is expected
that this amount will be used over the next 1 to 50 years.
c. This provision has been established with respect to claims made against certain companies in the Group by third parties, mainly against the
subsidiaries in Egypt. These claims concern labour compensations, labour cases for previous years' benefits and dues and claims for shares revaluation.
It is expected that this amount will be utilized mainly in the next twelve months.
Integrated Annual Report 2016
Notes to the Financial Statements6
108
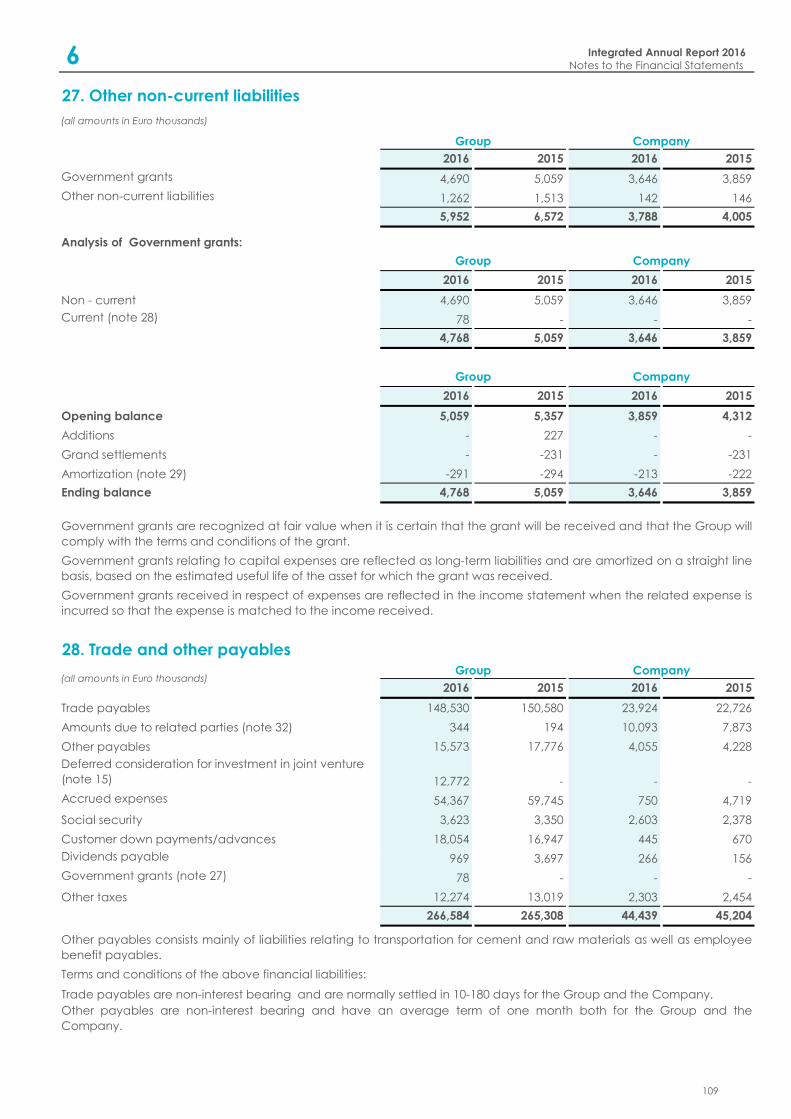
(all amounts in Euro thousands)
2016 2015 2016 2015
Government grants 4,690 5,059 3,646 3,859
Other non-current liabilities 1,262 1,513 142 146
5,952 6,572 3,788 4,005
Analysis of Government grants:
2016 2015 2016 2015
Non - current 4,690 5,059 3,646 3,859
Current (note 28) 78 - - -
4,768 5,059 3,646 3,859
2016 2015 2016 2015
Opening balance 5,059 5,357 3,859 4,312
Additions - 227 - -
Grand settlements - -231 - -231
Amortization (note 29) -291 -294 -213 -222
Ending balance 4,768 5,059 3,646 3,859
2016 2015 2016 2015
Trade payables 148,530 150,580 23,924 22,726
Amounts due to related parties (note 32) 344 194 10,093 7,873
Other payables 15,573 17,776 4,055 4,228
Deferred consideration for investment in joint venture
(note 15) 12,772 - - -
Accrued expenses 54,367 59,745 750 4,719
Social security 3,623 3,350 2,603 2,378
Customer down payments/advances 18,054 16,947 445 670
Dividends payable 969 3,697 266 156
Government grants (note 27) 78 - - -
Other taxes 12,274 13,019 2,303 2,454
266,584 265,308 44,439 45,204
27. Other non-current liabilities
CompanyGroup
CompanyGroup
28. Trade and other payables
Terms and conditions of the above financial liabilities:
Group
Government grants relating to capital expenses are reflected as long-term liabilities and are amortized on a straight line
basis, based on the estimated useful life of the asset for which the grant was received.
Government grants are recognized at fair value when it is certain that the grant will be received and that the Group will
comply with the terms and conditions of the grant.
Group Company
Trade payables are non-interest bearing and are normally settled in 10-180 days for the Group and the Company.
Other payables are non-interest bearing and have an average term of one month both for the Group and the
Company.
Company
Other payables consists mainly of liabilities relating to transportation for cement and raw materials as well as employee
benefit payables.
Government grants received in respect of expenses are reflected in the income statement when the related expense is
incurred so that the expense is matched to the income received.
(all amounts in Euro thousands)
Integrated Annual Report 2016
Notes to the Financial Statements6
109

2016 2015 2016 2015
Profit after taxes 127,330 35,296 16,819 60,142
Adjustments for:
Taxes (note 8) -63,805 6,848 5,887 3,477
Depreciation (note 11) 109,550 105,171 14,699 13,488
Amortization of intangibles (note 13) 7,034 8,773 267 275
Amortization of government grants received (note 27) -291 -294 -213 -222
Impairment of assets (note 11,13) 10,814 17,045 - -
Net loss/(profit) on sale of property, plant and equipment (note 4) 3,337 2,166 -52 -140
Provision for impairment of debtors charged to income statement (note 20) -587 793 -719 -220
Provision for inventory obsolescence (note 19) 122 3,943 -161 3,504
Provision for restoration of quarries (note 26a) 724 2,011 314 -34
Provision for litigation (note 26c) 172 497 132 -
Other provisions 4,655 5,975 2,092 2,035
Provision for retirement and termination benefit obligations 4,306 3,362 716 660
Decrease of investment property (note 12) 243 300 335 286
Expenses from participations and investments - 2,805 - -
Income from participations and investments -1,580 -1,565 -107 -134
Dividend income -346 - -29,272 -55,112
Finance income (note 6) -1,569 -1,767 -24 -52
Interest expense and related expenses (note 6) 66,502 65,270 22,041 23,105
Net losses on financial instruments (note 6) 284 21,921 - -
Losses/(gains) from foreign exchange differences (note 6) 24,367 -38,097 -1,021 -628
Share stock options (note 7) 1,620 1,010 1,376 876
Share in profit of associates and joint ventures (note 15) -492 -5,815 - -
Changes in working capital:
(Increase)/decrease in inventories -5,091 -8,402 13,075 -1,356
Increase in trade and other receivables -48,341 -5,876 -5,589 -15,367
(Increase)/decrease in operating long-term receivables and payables -344 -3,128 37 -
Increase/(decrease) in trade payables 36,669 19,399 1,208 -5,226
Cash generated from operations 275,283 237,641 41,840 29,357
Net book amount 4,361 3,471 168 216
Net (losses)/gains on sales (note 4) -3,337 -2,166 52 140
Proceeds from disposals 1,024 1,305 220 356
29. Cash generated from operations
In the cash flow statement, proceeds from the sale of tangible and intangible assets, and investment property
Group Company(all amounts in Euro thousands)
Integrated Annual Report 2016
Notes to the Financial Statements6
110
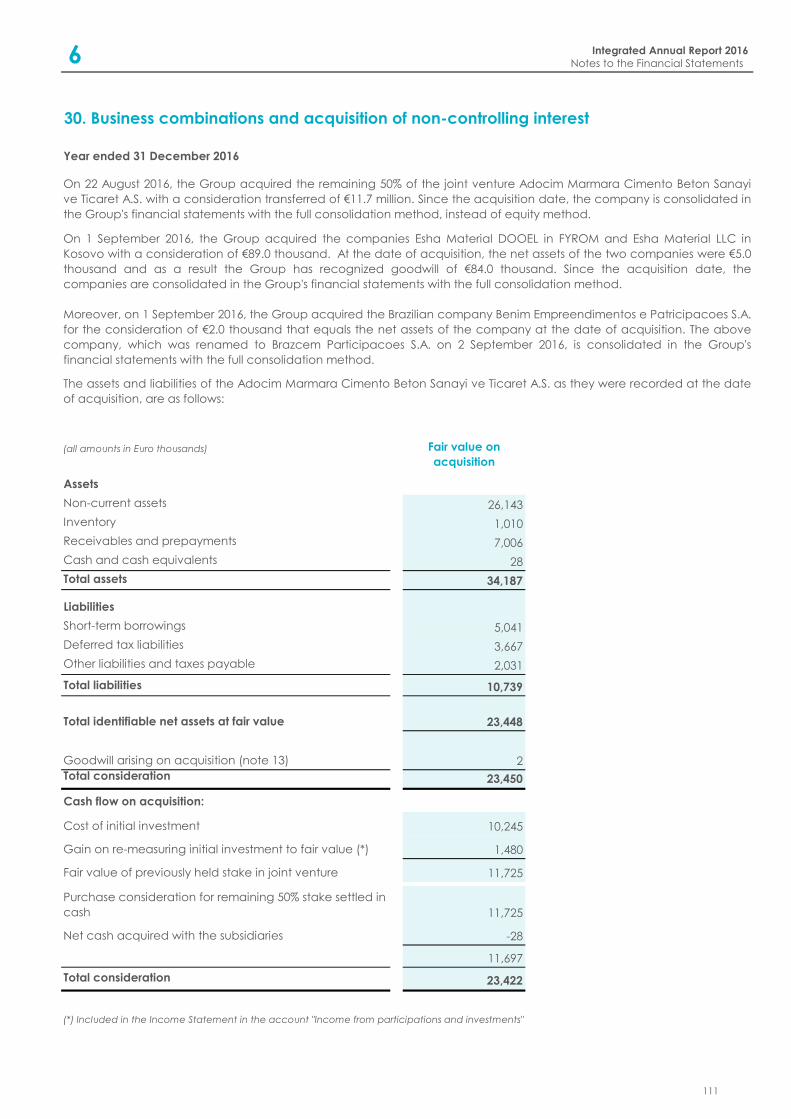
(all amounts in Euro thousands) Fair value on
acquisition
Assets
Non-current assets 26,143
Inventory 1,010
Receivables and prepayments 7,006
Cash and cash equivalents 28
Total assets 34,187
Liabilities
Short-term borrowings 5,041
Deferred tax liabilities 3,667
Other liabilities and taxes payable 2,031
Total liabilities 10,739
23,448
2
Total consideration 23,450
Cash flow on acquisition:
10,245
1,480
11,725
11,725
-28
11,697
Total consideration 23,422
Purchase consideration for remaining 50% stake settled in
cash
Goodwill arising on acquisition (note 13)
Total identifiable net assets at fair value
Fair value of previously held stake in joint venture
Net cash acquired with the subsidiaries
30. Business combinations and acquisition of non-controlling interest
Moreover, on 1 September 2016, the Group acquired the Brazilian company Benim Empreendimentos e Patricipacoes S.A.
for the consideration of €2.0 thousand that equals the net assets of the company at the date of acquisition. The above
company, which was renamed to Brazcem Participacoes S.A. on 2 September 2016, is consolidated in the Group's
financial statements with the full consolidation method.
The assets and liabilities of the Adocim Marmara Cimento Beton Sanayi ve Ticaret A.S. as they were recorded at the date
of acquisition, are as follows:
Year ended 31 December 2016
On 1 September 2016, the Group acquired the companies Esha Material DOOEL in FYROM and Esha Material LLC in
Kosovo with a consideration of €89.0 thousand. At the date of acquisition, the net assets of the two companies were €5.0
thousand and as a result the Group has recognized goodwill of €84.0 thousand. Since the acquisition date, the
companies are consolidated in the Group's financial statements with the full consolidation method.
On 22 August 2016, the Group acquired the remaining 50% of the joint venture Adocim Marmara Cimento Beton Sanayi
ve Ticaret A.S. with a consideration transferred of €11.7 million. Since the acquisition date, the company is consolidated in
the Group's financial statements with the full consolidation method, instead of equity method.
Cost of initial investment
Gain on re-measuring initial investment to fair value (*)
(*) Included in the Income Statement in the account "Income from participations and investments"
Integrated Annual Report 2016
Notes to the Financial Statements6
111
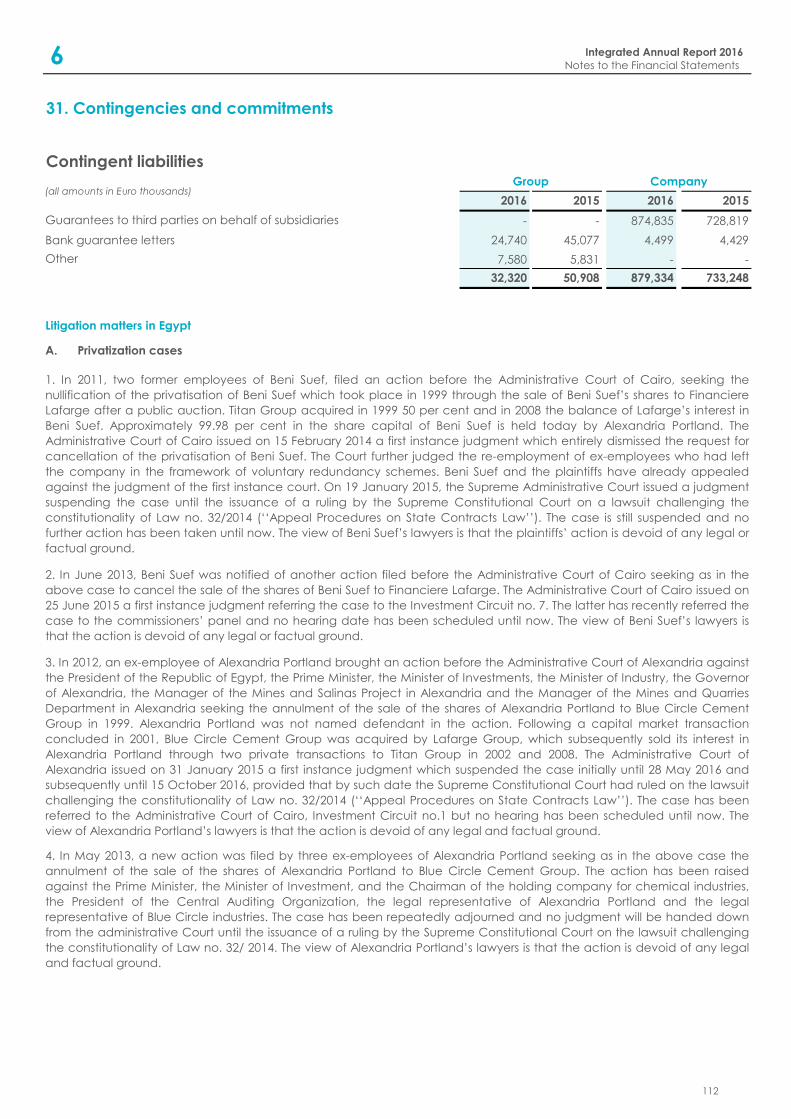
2016 2015 2016 2015
- - 874,835 728,819
24,740 45,077 4,499 4,429
7,580 5,831 - -
32,320 50,908 879,334 733,248
(all amounts in Euro thousands)
2. In June 2013, Beni Suef was notified of another action filed before the Administrative Court of Cairo seeking as in the
above case to cancel the sale of the shares of Beni Suef to Financiere Lafarge. The Administrative Court of Cairo issued on
25 June 2015 a first instance judgment referring the case to the Investment Circuit no. 7. The latter has recently referred the
case to the commissioners’ panel and no hearing date has been scheduled until now. The view of Beni Suef’s lawyers is
that the action is devoid of any legal or factual ground.
4. In May 2013, a new action was filed by three ex-employees of Alexandria Portland seeking as in the above case the
annulment of the sale of the shares of Alexandria Portland to Blue Circle Cement Group. The action has been raised
against the Prime Minister, the Minister of Investment, and the Chairman of the holding company for chemical industries,
the President of the Central Auditing Organization, the legal representative of Alexandria Portland and the legal
representative of Blue Circle industries. The case has been repeatedly adjourned and no judgment will be handed down
from the administrative Court until the issuance of a ruling by the Supreme Constitutional Court on the lawsuit challenging
the constitutionality of Law no. 32/ 2014. The view of Alexandria Portland’s lawyers is that the action is devoid of any legal
and factual ground.
1. In 2011, two former employees of Beni Suef, filed an action before the Administrative Court of Cairo, seeking the
nullification of the privatisation of Beni Suef which took place in 1999 through the sale of Beni Suef’s shares to Financiere
Lafarge after a public auction. Titan Group acquired in 1999 50 per cent and in 2008 the balance of Lafarge’s interest in
Beni Suef. Approximately 99.98 per cent in the share capital of Beni Suef is held today by Alexandria Portland. The
Administrative Court of Cairo issued on 15 February 2014 a first instance judgment which entirely dismissed the request for
cancellation of the privatisation of Beni Suef. The Court further judged the re-employment of ex-employees who had left
the company in the framework of voluntary redundancy schemes. Beni Suef and the plaintiffs have already appealed
against the judgment of the first instance court. On 19 January 2015, the Supreme Administrative Court issued a judgment
suspending the case until the issuance of a ruling by the Supreme Constitutional Court on a lawsuit challenging the
constitutionality of Law no. 32/2014 (‘‘Appeal Procedures on State Contracts Law’’). The case is still suspended and no
further action has been taken until now. The view of Beni Suef’s lawyers is that the plaintiffs’ action is devoid of any legal or
factual ground.
3. In 2012, an ex-employee of Alexandria Portland brought an action before the Administrative Court of Alexandria against
the President of the Republic of Egypt, the Prime Minister, the Minister of Investments, the Minister of Industry, the Governor
of Alexandria, the Manager of the Mines and Salinas Project in Alexandria and the Manager of the Mines and Quarries
Department in Alexandria seeking the annulment of the sale of the shares of Alexandria Portland to Blue Circle Cement
Group in 1999. Alexandria Portland was not named defendant in the action. Following a capital market transaction
concluded in 2001, Blue Circle Cement Group was acquired by Lafarge Group, which subsequently sold its interest in
Alexandria Portland through two private transactions to Titan Group in 2002 and 2008. The Administrative Court of
Alexandria issued on 31 January 2015 a first instance judgment which suspended the case initially until 28 May 2016 and
subsequently until 15 October 2016, provided that by such date the Supreme Constitutional Court had ruled on the lawsuit
challenging the constitutionality of Law no. 32/2014 (‘‘Appeal Procedures on State Contracts Law’’). The case has been
referred to the Administrative Court of Cairo, Investment Circuit no.1 but no hearing has been scheduled until now. The
view of Alexandria Portland’s lawyers is that the action is devoid of any legal and factual ground.
A. Privatization cases
Group Company
Contingent liabilities
Guarantees to third parties on behalf of subsidiaries
Bank guarantee letters
Other
Litigation matters in Egypt
31. Contingencies and commitments
Integrated Annual Report 2016
Notes to the Financial Statements6
112
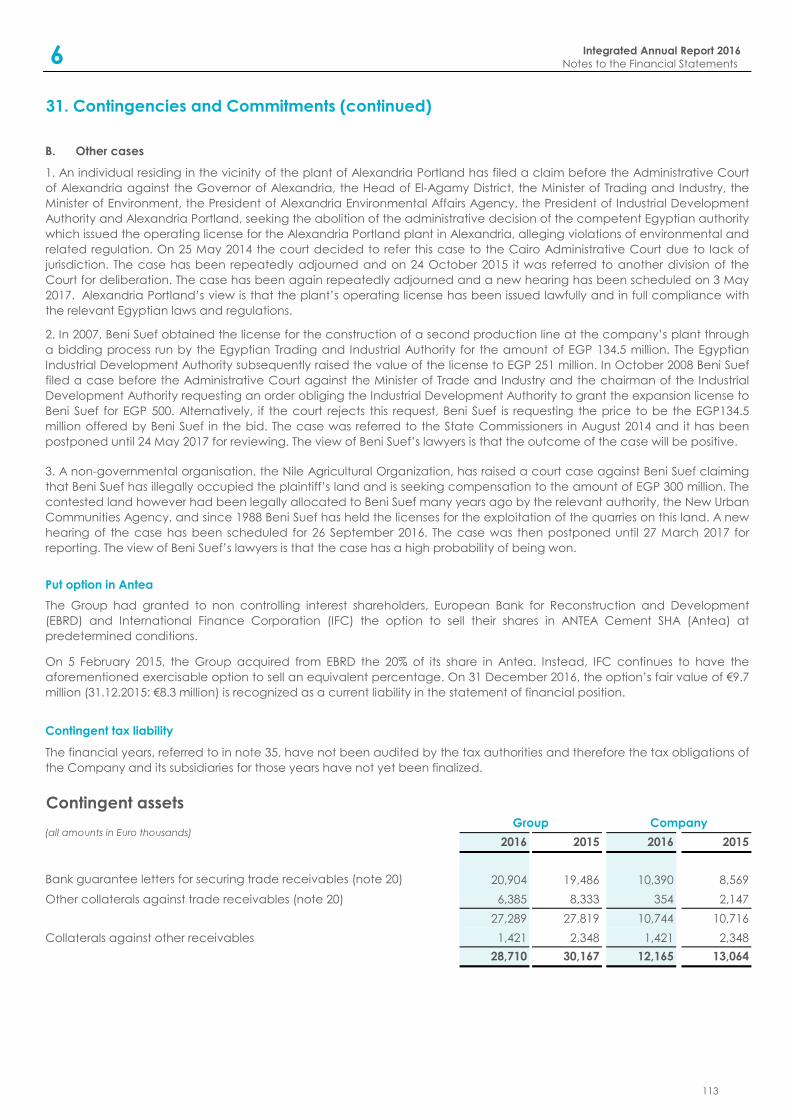
31. Contingencies and Commitments (continued)
2016 2015 2016 2015
20,904 19,486 10,390 8,569
6,385 8,333 354 2,147
27,289 27,819 10,744 10,716
1,421 2,348 1,421 2,348
28,710 30,167 12,165 13,064
Bank guarantee letters for securing trade receivables (note 20)
Other collaterals against trade receivables (note 20)
Collaterals against other receivables
Contingent tax liability
Group Company
The financial years, referred to in note 35, have not been audited by the tax authorities and therefore the tax obligations of
the Company and its subsidiaries for those years have not yet been finalized.
Contingent assets
(all amounts in Euro thousands)
On 5 February 2015, the Group acquired from EBRD the 20% of its share in Antea. Instead, IFC continues to have the
aforementioned exercisable option to sell an equivalent percentage. On 31 December 2016, the option’s fair value of €9.7
million (31.12.2015: €8.3 million) is recognized as a current liability in the statement of financial position.
Put option in Antea
B. Other cases
1. An individual residing in the vicinity of the plant of Alexandria Portland has filed a claim before the Administrative Court
of Alexandria against the Governor of Alexandria, the Head of El-Agamy District, the Minister of Trading and Industry, the
Minister of Environment, the President of Alexandria Environmental Affairs Agency, the President of Industrial Development
Authority and Alexandria Portland, seeking the abolition of the administrative decision of the competent Egyptian authority
which issued the operating license for the Alexandria Portland plant in Alexandria, alleging violations of environmental and
related regulation. On 25 May 2014 the court decided to refer this case to the Cairo Administrative Court due to lack of
jurisdiction. The case has been repeatedly adjourned and on 24 October 2015 it was referred to another division of the
Court for deliberation. The case has been again repeatedly adjourned and a new hearing has been scheduled on 3 May
2017. Alexandria Portland’s view is that the plant’s operating license has been issued lawfully and in full compliance with
the relevant Egyptian laws and regulations.
2. In 2007, Beni Suef obtained the license for the construction of a second production line at the company’s plant through
a bidding process run by the Egyptian Trading and Industrial Authority for the amount of EGP 134.5 million. The Egyptian
Industrial Development Authority subsequently raised the value of the license to EGP 251 million. In October 2008 Beni Suef
filed a case before the Administrative Court against the Minister of Trade and Industry and the chairman of the Industrial
Development Authority requesting an order obliging the Industrial Development Authority to grant the expansion license to
Beni Suef for EGP 500. Alternatively, if the court rejects this request, Beni Suef is requesting the price to be the EGP134.5
million offered by Beni Suef in the bid. The case was referred to the State Commissioners in August 2014 and it has been
postponed until 24 May 2017 for reviewing. The view of Beni Suef’s lawyers is that the outcome of the case will be positive.
3. A non-governmental organisation, the Nile Agricultural Organization, has raised a court case against Beni Suef claiming
that Beni Suef has illegally occupied the plaintiff’s land and is seeking compensation to the amount of EGP 300 million. The
contested land however had been legally allocated to Beni Suef many years ago by the relevant authority, the New Urban
Communities Agency, and since 1988 Beni Suef has held the licenses for the exploitation of the quarries on this land. A new
hearing of the case has been scheduled for 26 September 2016. The case was then postponed until 27 March 2017 for
reporting. The view of Beni Suef’s lawyers is that the case has a high probability of being won.
The Group had granted to non controlling interest shareholders, European Bank for Reconstruction and Development
(EBRD) and International Finance Corporation (IFC) the option to sell their shares in ANTEA Cement SHA (Antea) at
predetermined conditions.
Integrated Annual Report 2016
Notes to the Financial Statements6
113
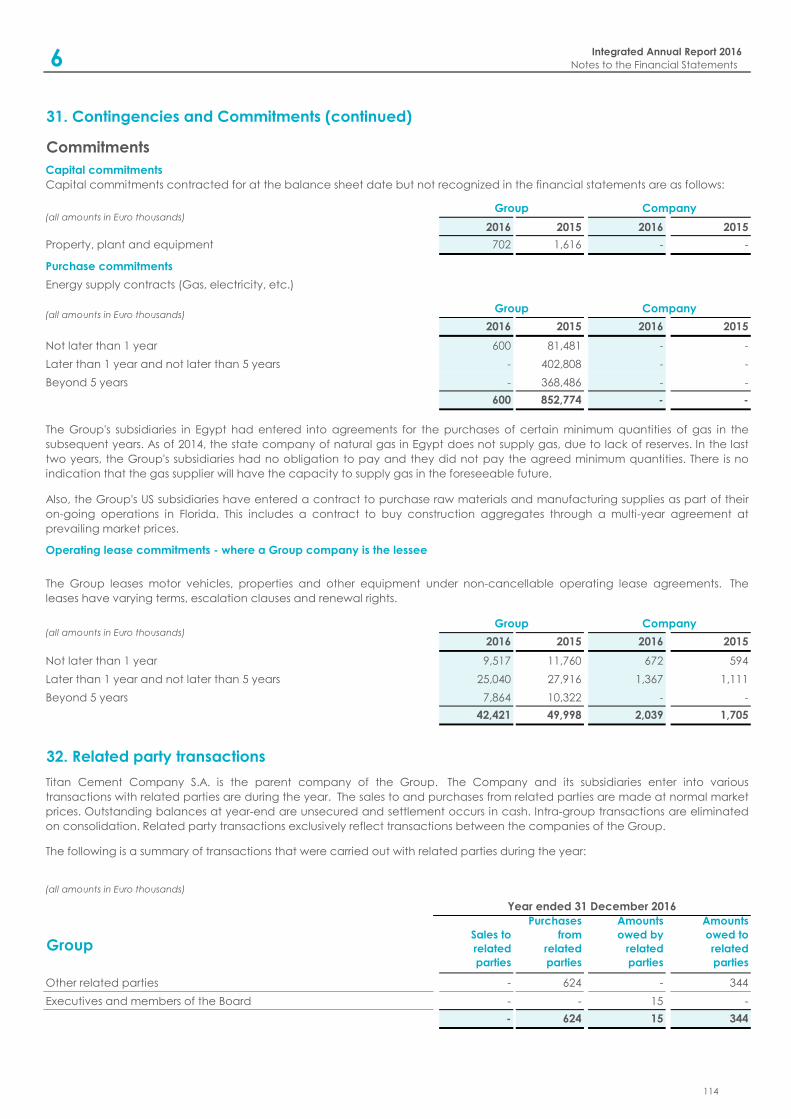
31. Contingencies and Commitments (continued)
2016 2015 2016 2015
702 1,616 - -
2016 2015 2016 2015
Not later than 1 year 600 81,481 - -
Later than 1 year and not later than 5 years - 402,808 - -
Beyond 5 years - 368,486 - -
600 852,774 - -
2016 2015 2016 2015
Not later than 1 year 9,517 11,760 672 594
Later than 1 year and not later than 5 years 25,040 27,916 1,367 1,111
Beyond 5 years 7,864 10,322 - -
42,421 49,998 2,039 1,705
32. Related party transactions
(all amounts in Euro thousands)
Group Sales to
related
parties
Purchases
from
related
parties
Amounts
owed by
related
parties
Amounts
owed to
related
parties
- 624 - 344
- - 15 -
- 624 15 344
Other related parties
Executives and members of the Board
Titan Cement Company S.A. is the parent company of the Group. The Company and its subsidiaries enter into various
transactions with related parties are during the year. The sales to and purchases from related parties are made at normal market
prices. Outstanding balances at year-end are unsecured and settlement occurs in cash. Intra-group transactions are eliminated
on consolidation. Related party transactions exclusively reflect transactions between the companies of the Group.
The following is a summary of transactions that were carried out with related parties during the year:
Year ended 31 December 2016
Capital commitments contracted for at the balance sheet date but not recognized in the financial statements are as follows:
Capital commitments
Commitments
Company
Group Company
Property, plant and equipment
Purchase commitments
Group Company
(all amounts in Euro thousands)
Energy supply contracts (Gas, electricity, etc.)
(all amounts in Euro thousands)
(all amounts in Euro thousands)
The Group's subsidiaries in Egypt had entered into agreements for the purchases of certain minimum quantities of gas in the
subsequent years. As of 2014, the state company of natural gas in Egypt does not supply gas, due to lack of reserves. In the last
two years, the Group's subsidiaries had no obligation to pay and they did not pay the agreed minimum quantities. There is no
indication that the gas supplier will have the capacity to supply gas in the foreseeable future.
Also, the Group's US subsidiaries have entered a contract to purchase raw materials and manufacturing supplies as part of their
on-going operations in Florida. This includes a contract to buy construction aggregates through a multi-year agreement at
prevailing market prices.
Operating lease commitments - where a Group company is the lessee
The Group leases motor vehicles, properties and other equipment under non-cancellable operating lease agreements. The
leases have varying terms, escalation clauses and renewal rights.
Group
Integrated Annual Report 2016
Notes to the Financial Statements6
114
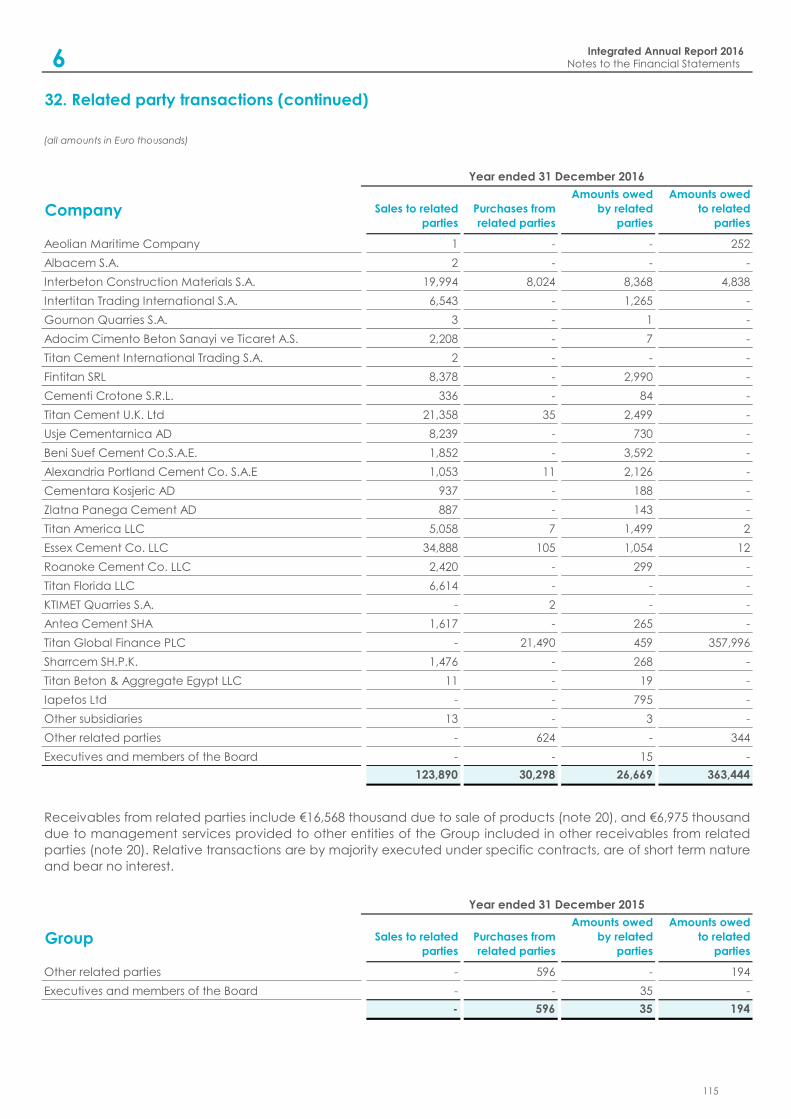
Sales to related
parties
Purchases from
related parties
Amounts owed
by related
parties
Amounts owed
to related
parties
1 - - 252
2 - - -
19,994 8,024 8,368 4,838
6,543 - 1,265 -
3 - 1 -
2,208 - 7 -
2 - - -
8,378 - 2,990 -
336 - 84 -
21,358 35 2,499 -
8,239 - 730 -
1,852 - 3,592 -
1,053 11 2,126 -
937 - 188 -
887 - 143 -
5,058 7 1,499 2
34,888 105 1,054 12
2,420 - 299 -
6,614 - - -
- 2 - -
1,617 - 265 -
- 21,490 459 357,996
1,476 - 268 -
11 - 19 -
- - 795 -
13 - 3 -
- 624 - 344
- - 15 -
123,890 30,298 26,669 363,444
Sales to related
parties
Purchases from
related parties
Amounts owed
by related
parties
Amounts owed
to related
parties
- 596 - 194
- - 35 -
- 596 35 194
Intertitan Trading International S.A.
Gournon Quarries S.A.
Roanoke Cement Co. LLC
Other related parties
Executives and members of the Board
Other related parties
Executives and members of the Board
Titan Beton & Aggregate Egypt LLC
Iapetos Ltd
Other subsidiaries
Group
Receivables from related parties include €16,568 thousand due to sale of products (note 20), and €6,975 thousand
due to management services provided to other entities of the Group included in other receivables from related
parties (note 20). Relative transactions are by majority executed under specific contracts, are of short term nature
and bear no interest.
Year ended 31 December 2015
Titan Cement International Trading S.A.
Fintitan SRL
Adocim Cimento Beton Sanayi ve Ticaret A.S.
Aeolian Maritime Company
Albacem S.A.
Interbeton Construction Materials S.A.
(all amounts in Euro thousands)
Company
Year ended 31 December 2016
32. Related party transactions (continued)
Titan Florida LLC
KTIMET Quarries S.A.
Antea Cement SHA
Cementara Kosjeric AD
Τitan Αmerica LLC
Titan Global Finance PLC
Sharrcem SH.P.K.
Essex Cement Co. LLC
Cementi Crotone S.R.L.
Zlatna Panega Cement AD
Titan Cement U.K. Ltd
Usje Cementarnica AD
Beni Suef Cement Co.S.A.E.
Alexandria Portland Cement Co. S.A.E
Integrated Annual Report 2016Notes to the Financial Statements6
115
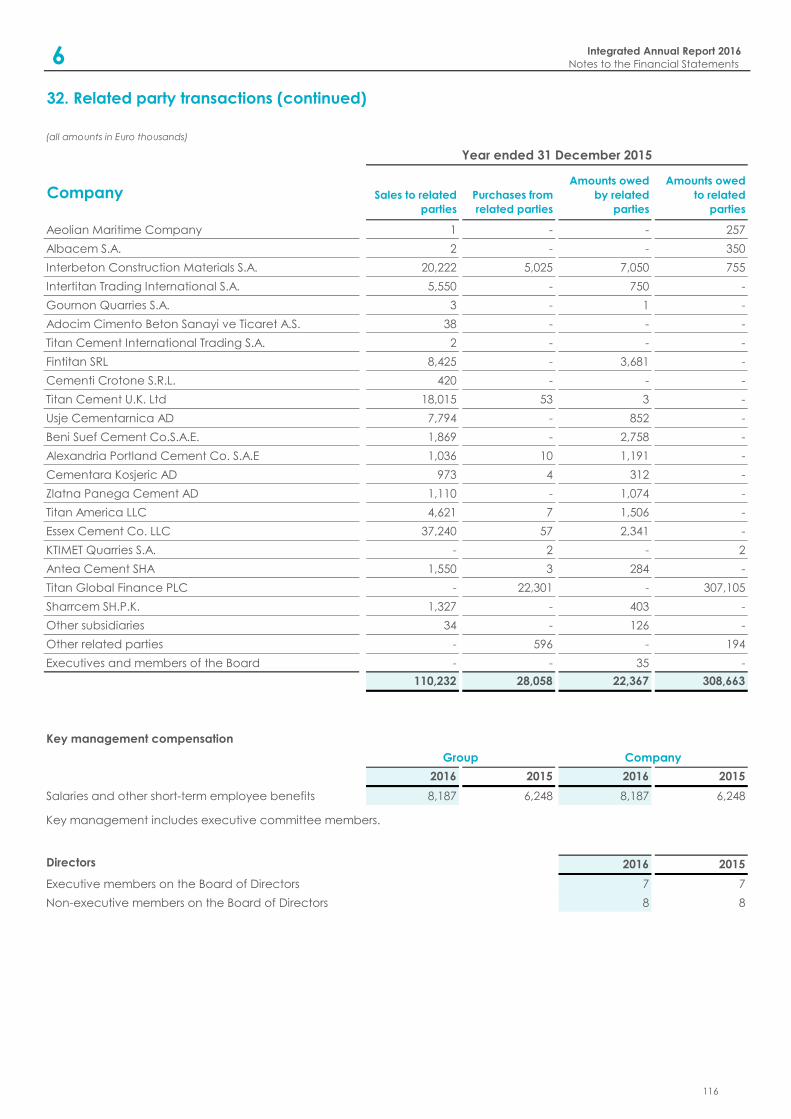
32. Related party transactions (continued)
Sales to related
parties
Purchases from
related parties
Amounts owed
by related
parties
Amounts owed
to related
parties
1 - - 257
2 - - 350
20,222 5,025 7,050 755
5,550 - 750 -
3 - 1 -
38 - - -
2 - - -
8,425 - 3,681 -
420 - - -
18,015 53 3 -
7,794 - 852 -
1,869 - 2,758 -
1,036 10 1,191 -
973 4 312 -
1,110 - 1,074 -
4,621 7 1,506 -
37,240 57 2,341 -
- 2 - 2
1,550 3 284 -
- 22,301 - 307,105
1,327 - 403 -
34 - 126 -
- 596 - 194
- - 35 -
110,232 28,058 22,367 308,663
2016 2015 2016 2015
Salaries and other short-term employee benefits 8,187 6,248 8,187 6,248
Key management includes executive committee members.
2016 2015
Executive members on the Board of Directors 7 7
Non-executive members on the Board of Directors 8 8
Titan Cement International Trading S.A.
Company
Aeolian Maritime Company
Albacem S.A.
Interbeton Construction Materials S.A.
Intertitan Trading International S.A.
Gournon Quarries S.A.
Adocim Cimento Beton Sanayi ve Ticaret A.S.
(all amounts in Euro thousands)
Year ended 31 December 2015
Antea Cement SHA
Fintitan SRL
Cementi Crotone S.R.L.
Titan Cement U.K. Ltd
Usje Cementarnica AD
Beni Suef Cement Co.S.A.E.
Alexandria Portland Cement Co. S.A.E
Cementara Kosjeric AD
Zlatna Panega Cement AD
Τitan Αmerica LLC
Essex Cement Co. LLC
KTIMET Quarries S.A.
Titan Global Finance PLC
Sharrcem SH.P.K.
Group Company
Directors
Other subsidiaries
Other related parties
Executives and members of the Board
Key management compensation
Integrated Annual Report 2016
Notes to the Financial Statements6
116
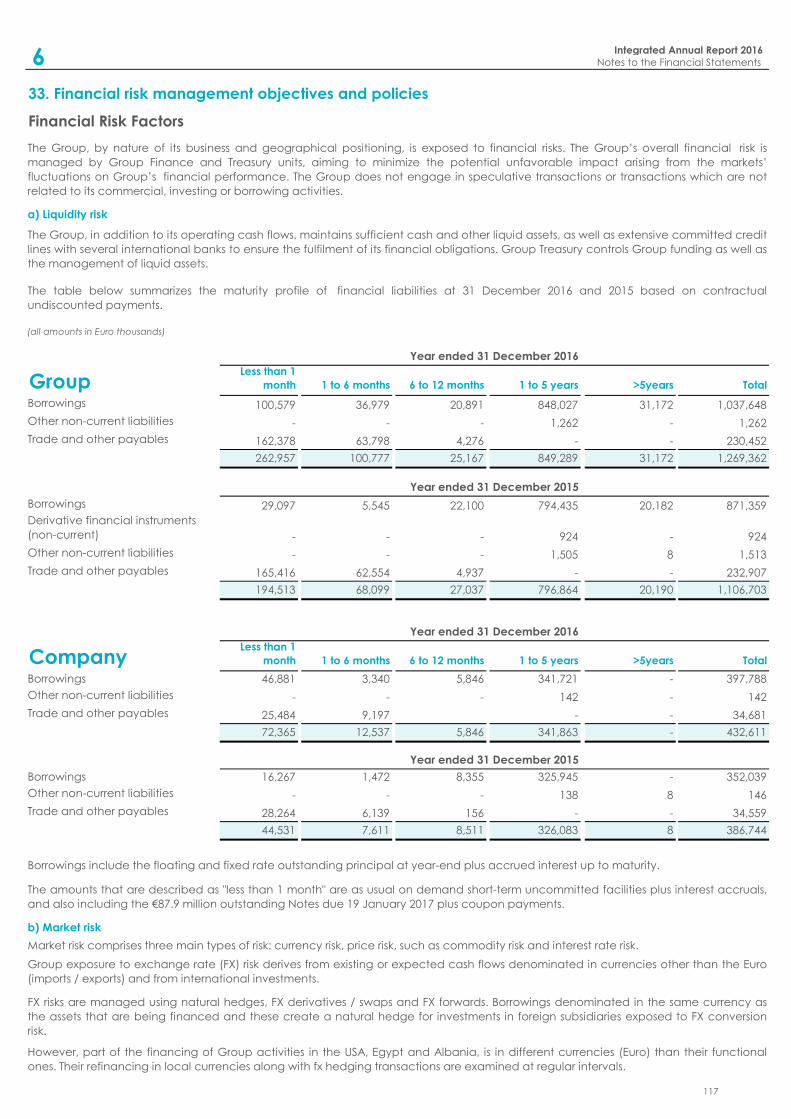
(all amounts in Euro thousands)
Group Less than 1
month 1 to 6 months 6 to 12 months 1 to 5 years >5years Total
Borrowings 100,579 36,979 20,891 848,027 31,172 1,037,648
Other non-current liabilities - - - 1,262 - 1,262
Trade and other payables 162,378 63,798 4,276 - - 230,452
262,957 100,777 25,167 849,289 31,172 1,269,362
Borrowings 29,097 5,545 22,100 794,435 20,182 871,359
Derivative financial instruments
(non-current) - - - 924 - 924
Other non-current liabilities - - - 1,505 8 1,513
Trade and other payables 165,416 62,554 4,937 - - 232,907
194,513 68,099 27,037 796,864 20,190 1,106,703
CompanyLess than 1
month 1 to 6 months 6 to 12 months 1 to 5 years >5years Total
Borrowings 46,881 3,340 5,846 341,721 - 397,788
Other non-current liabilities - - - 142 - 142
Trade and other payables 25,484 9,197 - - 34,681
72,365 12,537 5,846 341,863 - 432,611
73% 27%
Borrowings 16,267 1,472 8,355 325,945 - 352,039
Other non-current liabilities - - - 138 8 146
Trade and other payables 28,264 6,139 156 - - 34,559
44,531 7,611 8,511 326,083 8 386,744
82% 18% 0%
33. Financial risk management objectives and policies
The Group, in addition to its operating cash flows, maintains sufficient cash and other liquid assets, as well as extensive committed credit
lines with several international banks to ensure the fulfilment of its financial obligations. Group Treasury controls Group funding as well as
the management of liquid assets.
a) Liquidity risk
Financial Risk Factors
The Group, by nature of its business and geographical positioning, is exposed to financial risks. The Group’s overall financial risk is
managed by Group Finance and Treasury units, aiming to minimize the potential unfavorable impact arising from the markets’
fluctuations on Group’s financial performance. The Group does not engage in speculative transactions or transactions which are not
related to its commercial, investing or borrowing activities.
The table below summarizes the maturity profile of financial liabilities at 31 December 2016 and 2015 based on contractual
undiscounted payments.
Year ended 31 December 2016
Year ended 31 December 2015
Year ended 31 December 2016
FX risks are managed using natural hedges, FX derivatives / swaps and FX forwards. Borrowings denominated in the same currency as
the assets that are being financed and these create a natural hedge for investments in foreign subsidiaries exposed to FX conversion
risk.
However, part of the financing of Group activities in the USA, Egypt and Albania, is in different currencies (Euro) than their functional
ones. Their refinancing in local currencies along with fx hedging transactions are examined at regular intervals.
Borrowings include the floating and fixed rate outstanding principal at year-end plus accrued interest up to maturity.
The amounts that are described as "less than 1 month" are as usual on demand short-term uncommitted facilities plus interest accruals,
and also including the €87.9 million outstanding Notes due 19 January 2017 plus coupon payments.
b) Market risk
Group exposure to exchange rate (FX) risk derives from existing or expected cash flows denominated in currencies other than the Euro
(imports / exports) and from international investments.
Market risk comprises three main types of risk: currency risk, price risk, such as commodity risk and interest rate risk.
Year ended 31 December 2015
Integrated Annual Report 2016
Notes to the Financial Statements6
117
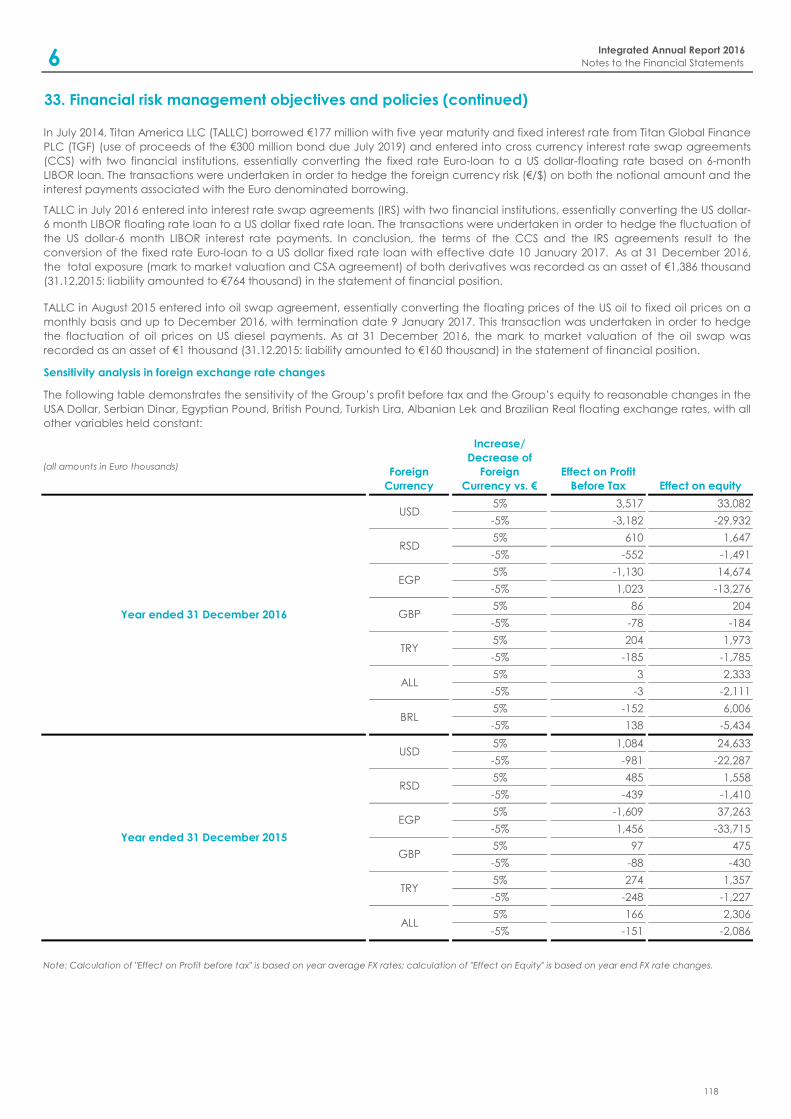
(all amounts in Euro thousands)Foreign
Currency
Increase/
Decrease of
Foreign
Currency vs. €
Effect on Profit
Before Tax Effect on equity
5% 3,517 33,082
-5% -3,182 -29,932
5% 610 1,647
-5% -552 -1,491
5% -1,130 14,674
-5% 1,023 -13,276
5% 86 204
-5% -78 -184
5% 204 1,973
-5% -185 -1,785
5% 3 2,333
-5% -3 -2,111
5% -152 6,006
-5% 138 -5,434
5% 1,084 24,633
-5% -981 -22,287
5% 485 1,558
-5% -439 -1,410
5% -1,609 37,263
-5% 1,456 -33,715
5% 97 475
-5% -88 -430
5% 274 1,357
-5% -248 -1,227
5% 166 2,306
-5% -151 -2,086
EGP
GBP
TRY
Note: Calculation of "Effect on Profit before tax" is based on year average FX rates; calculation of "Effect on Equity" is based on year end FX rate changes.
33. Financial risk management objectives and policies (continued)
In July 2014, Titan America LLC (TALLC) borrowed €177 million with five year maturity and fixed interest rate from Titan Global Finance
PLC (TGF) (use of proceeds of the €300 million bond due July 2019) and entered into cross currency interest rate swap agreements
(CCS) with two financial institutions, essentially converting the fixed rate Euro-loan to a US dollar-floating rate based on 6-month
LIBOR loan. The transactions were undertaken in order to hedge the foreign currency risk (€/$) on both the notional amount and the
interest payments associated with the Euro denominated borrowing.
USD
TALLC in July 2016 entered into interest rate swap agreements (IRS) with two financial institutions, essentially converting the US dollar-
6 month LIBOR floating rate loan to a US dollar fixed rate loan. The transactions were undertaken in order to hedge the fluctuation of
the US dollar-6 month LIBOR interest rate payments. In conclusion, the terms of the CCS and the IRS agreements result to the
conversion of the fixed rate Euro-loan to a US dollar fixed rate loan with effective date 10 January 2017. As at 31 December 2016,
the total exposure (mark to market valuation and CSA agreement) of both derivatives was recorded as an asset of €1,386 thousand
(31.12.2015: liability amounted to €764 thousand) in the statement of financial position.
TALLC in August 2015 entered into oil swap agreement, essentially converting the floating prices of the US oil to fixed oil prices on a
monthly basis and up to December 2016, with termination date 9 January 2017. This transaction was undertaken in order to hedge
the flactuation of oil prices on US diesel payments. As at 31 December 2016, the mark to market valuation of the oil swap was
recorded as an asset of €1 thousand (31.12.2015: liability amounted to €160 thousand) in the statement of financial position.
ALL
BRL
Year ended 31 December 2015
USD
RSD
EGP
GBP
TRY
ALL
Sensitivity analysis in foreign exchange rate changes
The following table demonstrates the sensitivity of the Group’s profit before tax and the Group’s equity to reasonable changes in the
USΑ Dollar, Serbian Dinar, Egyptian Pound, British Pound, Turkish Lira, Albanian Lek and Brazilian Real floating exchange rates, with all
other variables held constant:
Year ended 31 December 2016
RSD
Integrated Annual Report 2016
Notes to the Financial Statements6
118
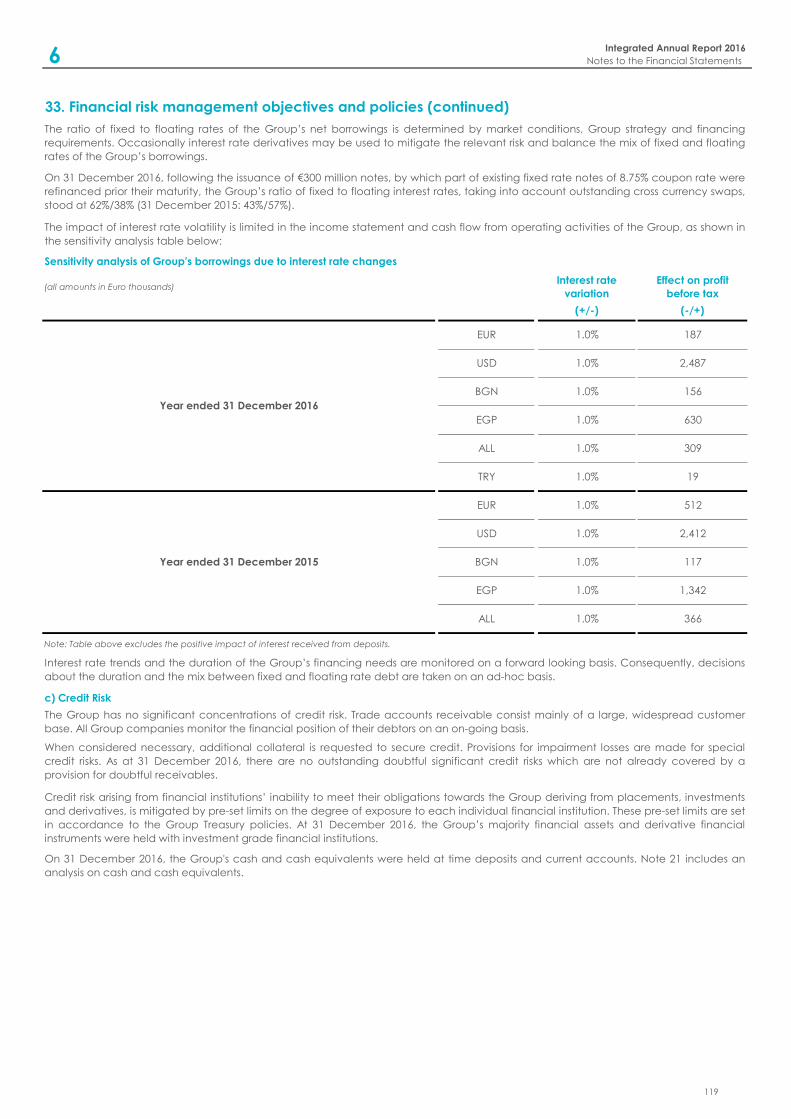
Interest rate
variation
Effect on profit
before tax
(+/-) (-/+)
Sensitivity analysis of Group's borrowings due to interest rate changes
(all amounts in Euro thousands)
The ratio of fixed to floating rates of the Group’s net borrowings is determined by market conditions, Group strategy and financing
requirements. Occasionally interest rate derivatives may be used to mitigate the relevant risk and balance the mix of fixed and floating
rates of the Group’s borrowings.
On 31 December 2016, following the issuance of €300 million notes, by which part of existing fixed rate notes of 8.75% coupon rate were
refinanced prior their maturity, the Group’s ratio of fixed to floating interest rates, taking into account outstanding cross currency swaps,
stood at 62%/38% (31 December 2015: 43%/57%).
The impact of interest rate volatility is limited in the income statement and cash flow from operating activities of the Group, as shown in
the sensitivity analysis table below:
33. Financial risk management objectives and policies (continued)
366
1.0% 19
1.0% 512
1.0% 2,412
1.0% 117
1.0% 1,342
1.0%
On 31 December 2016, the Group's cash and cash equivalents were held at time deposits and current accounts. Note 21 includes an
analysis on cash and cash equivalents.
Note: Table above excludes the positive impact of interest received from deposits.
Interest rate trends and the duration of the Group’s financing needs are monitored on a forward looking basis. Consequently, decisions
about the duration and the mix between fixed and floating rate debt are taken on an ad-hoc basis.
c) Credit Risk
The Group has no significant concentrations of credit risk. Trade accounts receivable consist mainly of a large, widespread customer
base. All Group companies monitor the financial position of their debtors on an on-going basis.
When considered necessary, additional collateral is requested to secure credit. Provisions for impairment losses are made for special
credit risks. As at 31 December 2016, there are no outstanding doubtful significant credit risks which are not already covered by a
provision for doubtful receivables.
Credit risk arising from financial institutions’ inability to meet their obligations towards the Group deriving from placements, investments
and derivatives, is mitigated by pre-set limits on the degree of exposure to each individual financial institution. These pre-set limits are set
in accordance to the Group Treasury policies. At 31 December 2016, the Group’s majority financial assets and derivative financial
instruments were held with investment grade financial institutions.
Year ended 31 December 2015
EUR
USD
BGN
EGP
ALL
Year ended 31 December 2016
EUR
BGN
EGP
ALL
USD 2,487
1.0% 187
1.0%
TRY
156
1.0% 630
1.0% 309
1.0%
Integrated Annual Report 2016
Notes to the Financial Statements6
119
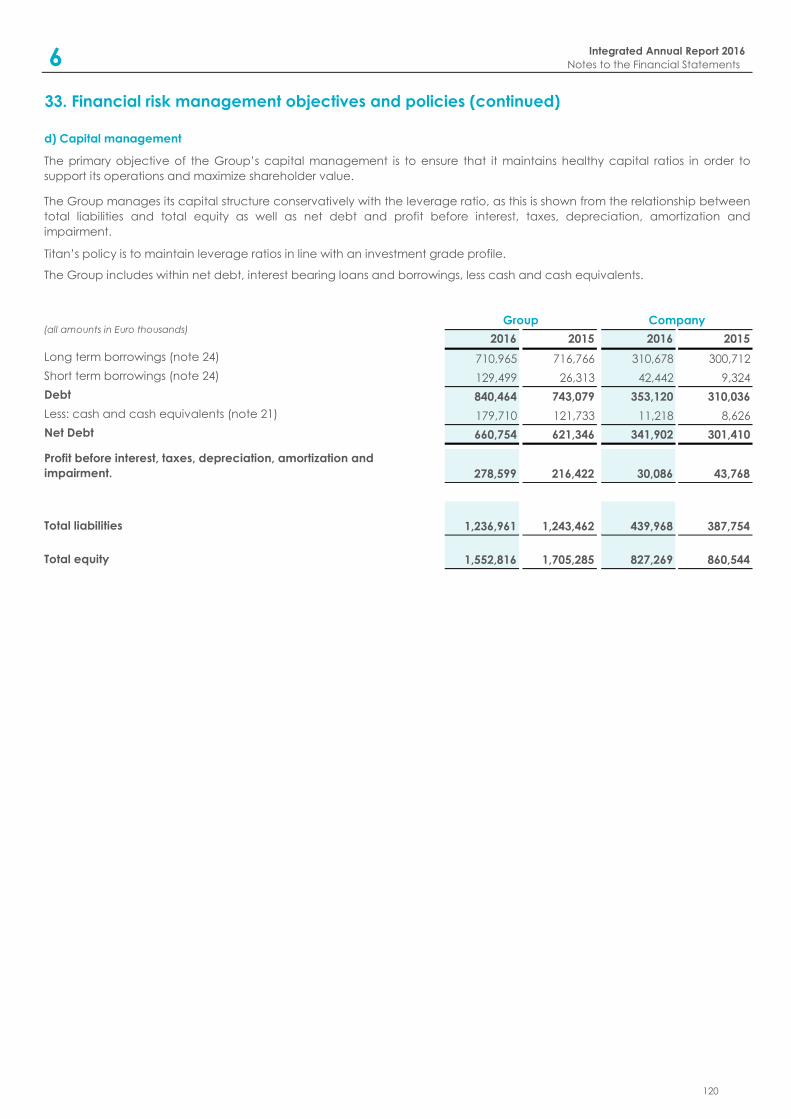
2016 2015 2016 2015
710,965 716,766 310,678 300,712
129,499 26,313 42,442 9,324
840,464 743,079 353,120 310,036
179,710 121,733 11,218 8,626
660,754 621,346 341,902 301,410
278,599 216,422 30,086 43,768
1,236,961 1,243,462 439,968 387,754
1,552,816 1,705,285 827,269 860,544
Long term borrowings (note 24)
Short term borrowings (note 24)
The Group manages its capital structure conservatively with the leverage ratio, as this is shown from the relationship between
total liabilities and total equity as well as net debt and profit before interest, taxes, depreciation, amortization and
impairment.
Titan’s policy is to maintain leverage ratios in line with an investment grade profile.
The Group includes within net debt, interest bearing loans and borrowings, less cash and cash equivalents.
Group Company(all amounts in Euro thousands)
The primary objective of the Group’s capital management is to ensure that it maintains healthy capital ratios in order to
support its operations and maximize shareholder value.
33. Financial risk management objectives and policies (continued)
d) Capital management
Debt
Less: cash and cash equivalents (note 21)
Net Debt
Total liabilities
Total equity
Profit before interest, taxes, depreciation, amortization and
impairment.
Integrated Annual Report 2016
Notes to the Financial Statements6
120
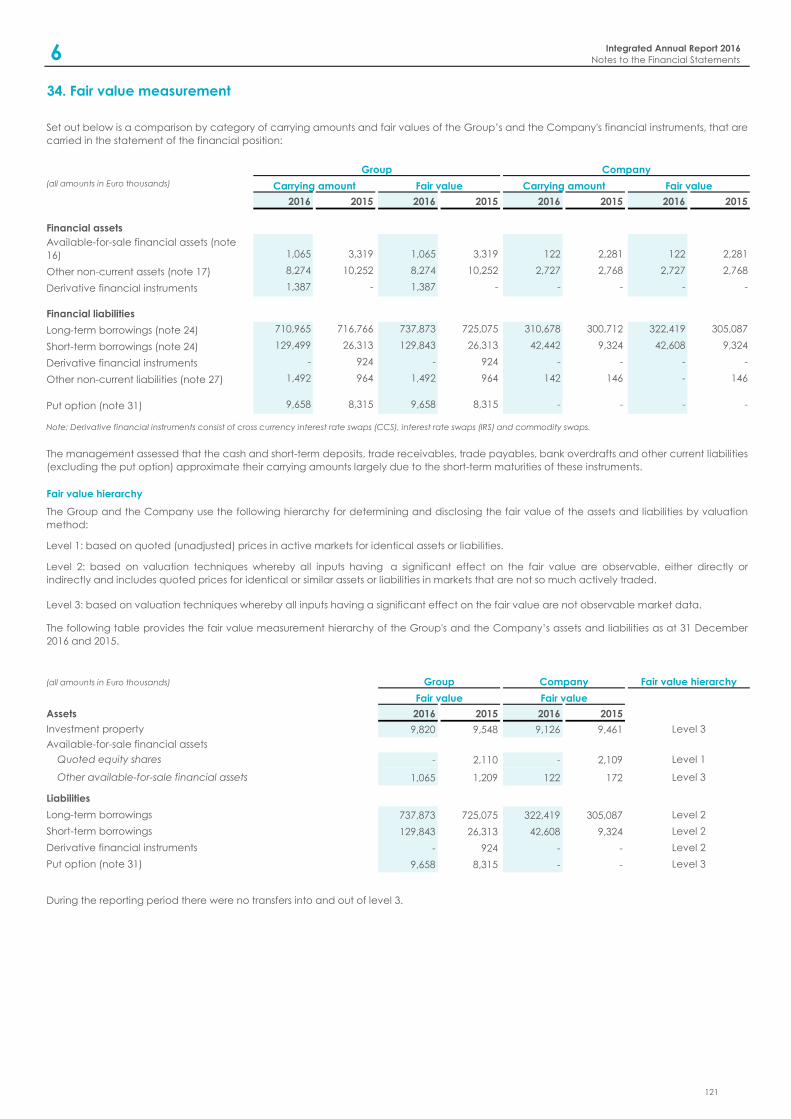
2016 2015 2016 2015 2016 2015 2016 2015
1,065 3,319 1,065 3,319 122 2,281 122 2,281
8,274 10,252 8,274 10,252 2,727 2,768 2,727 2,768
1,387 - 1,387 - - - - -
710,965 716,766 737,873 725,075 310,678 300,712 322,419 305,087
129,499 26,313 129,843 26,313 42,442 9,324 42,608 9,324
- 924 - 924 - - - -
1,492 964 1,492 964 142 146 - 146
9,658 8,315 9,658 8,315 - - - -
2016 2015 2016 2015
9,820 9,548 9,126 9,461
- 2,110 - 2,109
1,065 1,209 122 172
737,873 725,075 322,419 305,087
129,843 26,313 42,608 9,324
- 924 - -
9,658 8,315 - -
Fair value
Set out below is a comparison by category of carrying amounts and fair values of the Group’s and the Company's financial instruments, that are
carried in the statement of the financial position:
Group Company
34. Fair value measurement
Financial liabilities
(all amounts in Euro thousands) Carrying amount Fair value Carrying amount
Available-for-sale financial assets (note
16)
Other non-current assets (note 17)
Derivative financial instruments
Financial assets
The management assessed that the cash and short-term deposits, trade receivables, trade payables, bank overdrafts and other current liabilities
(excluding the put option) approximate their carrying amounts largely due to the short-term maturities of these instruments.
Long-term borrowings (note 24)
Short-term borrowings (note 24)
Put option (note 31)
Note: Derivative financial instruments consist of cross currency interest rate swaps (CCS), interest rate swaps (IRS) and commodity swaps.
Derivative financial instruments
Other non-current liabilities (note 27)
Level 2: based on valuation techniques whereby all inputs having a significant effect on the fair value are observable, either directly or
indirectly and includes quoted prices for identical or similar assets or liabilities in markets that are not so much actively traded.
Level 3: based on valuation techniques whereby all inputs having a significant effect on the fair value are not observable market data.
Fair value hierarchy
The Group and the Company use the following hierarchy for determining and disclosing the fair value of the assets and liabilities by valuation
method:
Level 1: based on quoted (unadjusted) prices in active markets for identical assets or liabilities.
Assets
The following table provides the fair value measurement hierarchy of the Group's and the Company’s assets and liabilities as at 31 December
2016 and 2015.
Group Company Fair value hierarchy
Fair value Fair value
(all amounts in Euro thousands)
Investment property
Long-term borrowings
Liabilities
Available-for-sale financial assets
Other available-for-sale financial assets
Quoted equity shares
Level 3
Level 3
Level 2
Level 1
Level 2
Level 2
Level 3
During the reporting period there were no transfers into and out of level 3.
Short-term borrowings
Derivative financial instruments
Put option (note 31)
Integrated Annual Report 2016
Notes to the Financial Statements6
121
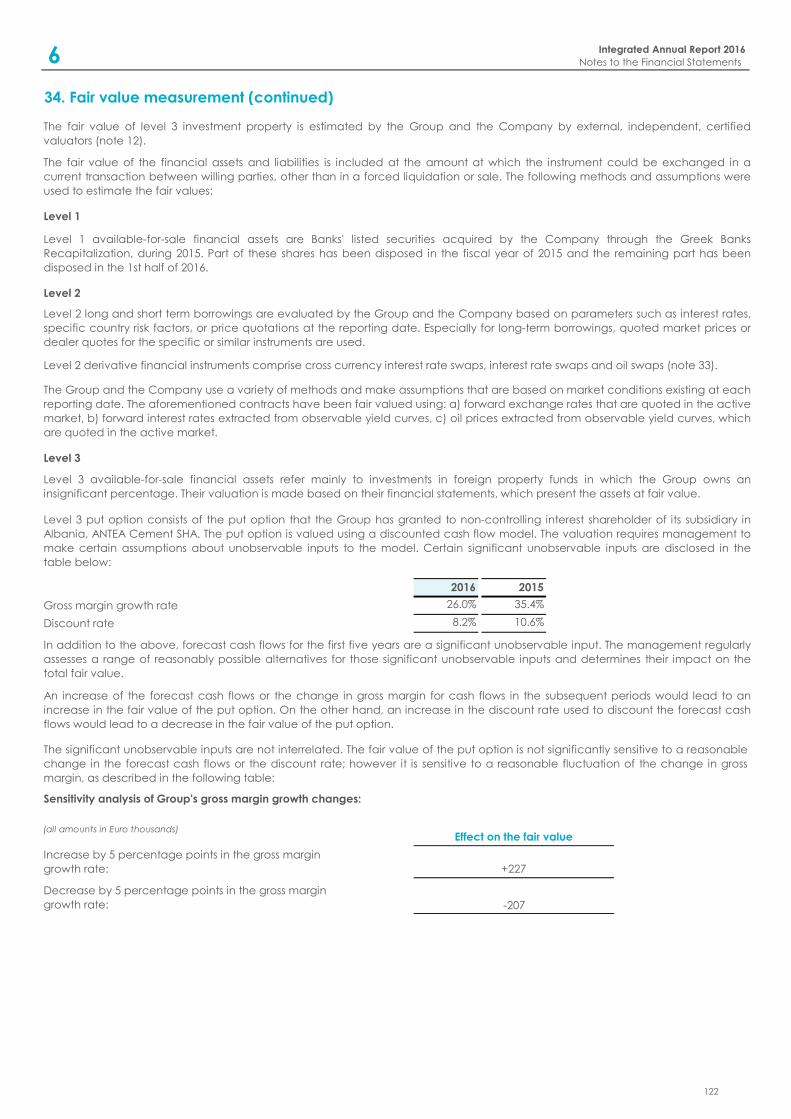
34. Fair value measurement (continued)
Level 1
Level 2
Level 3
2016 2015
26.0% 35.4%
8.2% 10.6%
Increase by 5 percentage points in the gross margin
growth rate:
Decrease by 5 percentage points in the gross margin
growth rate:
In addition to the above, forecast cash flows for the first five years are a significant unobservable input. The management regularly
assesses a range of reasonably possible alternatives for those significant unobservable inputs and determines their impact on the
total fair value.
An increase of the forecast cash flows or the change in gross margin for cash flows in the subsequent periods would lead to an
increase in the fair value of the put option. On the other hand, an increase in the discount rate used to discount the forecast cash
flows would lead to a decrease in the fair value of the put option.
The significant unobservable inputs are not interrelated. The fair value of the put option is not significantly sensitive to a reasonable
change in the forecast cash flows or the discount rate; however it is sensitive to a reasonable fluctuation of the change in gross
margin, as described in the following table:
Sensitivity analysis of Group's gross margin growth changes:
Effect on the fair value
+227
-207
Discount rate
The fair value of level 3 investment property is estimated by the Group and the Company by external, independent, certified
valuators (note 12).
Level 2 derivative financial instruments comprise cross currency interest rate swaps, interest rate swaps and oil swaps (note 33).
(all amounts in Euro thousands)
Level 3 put option consists of the put option that the Group has granted to non-controlling interest shareholder of its subsidiary in
Albania, ANTEA Cement SHA. The put option is valued using a discounted cash flow model. The valuation requires management to
make certain assumptions about unobservable inputs to the model. Certain significant unobservable inputs are disclosed in the
table below:
Gross margin growth rate
The fair value of the financial assets and liabilities is included at the amount at which the instrument could be exchanged in a
current transaction between willing parties, other than in a forced liquidation or sale. The following methods and assumptions were
used to estimate the fair values:
Τhe Group and the Company use a variety of methods and make assumptions that are based on market conditions existing at each
reporting date. The aforementioned contracts have been fair valued using: a) forward exchange rates that are quoted in the active
market, b) forward interest rates extracted from observable yield curves, c) oil prices extracted from observable yield curves, which
are quoted in the active market.
Level 1 available-for-sale financial assets are Banks' listed securities acquired by the Company through the Greek Banks
Recapitalization, during 2015. Part of these shares has been disposed in the fiscal year of 2015 and the remaining part has been
disposed in the 1st half of 2016.
Level 3 available-for-sale financial assets refer mainly to investments in foreign property funds in which the Group owns an
insignificant percentage. Their valuation is made based on their financial statements, which present the assets at fair value.
Level 2 long and short term borrowings are evaluated by the Group and the Company based on parameters such as interest rates,
specific country risk factors, or price quotations at the reporting date. Especially for long-term borrowings, quoted market prices or
dealer quotes for the specific or similar instruments are used.
Integrated Annual Report 2016
Notes to the Financial Statements6
122
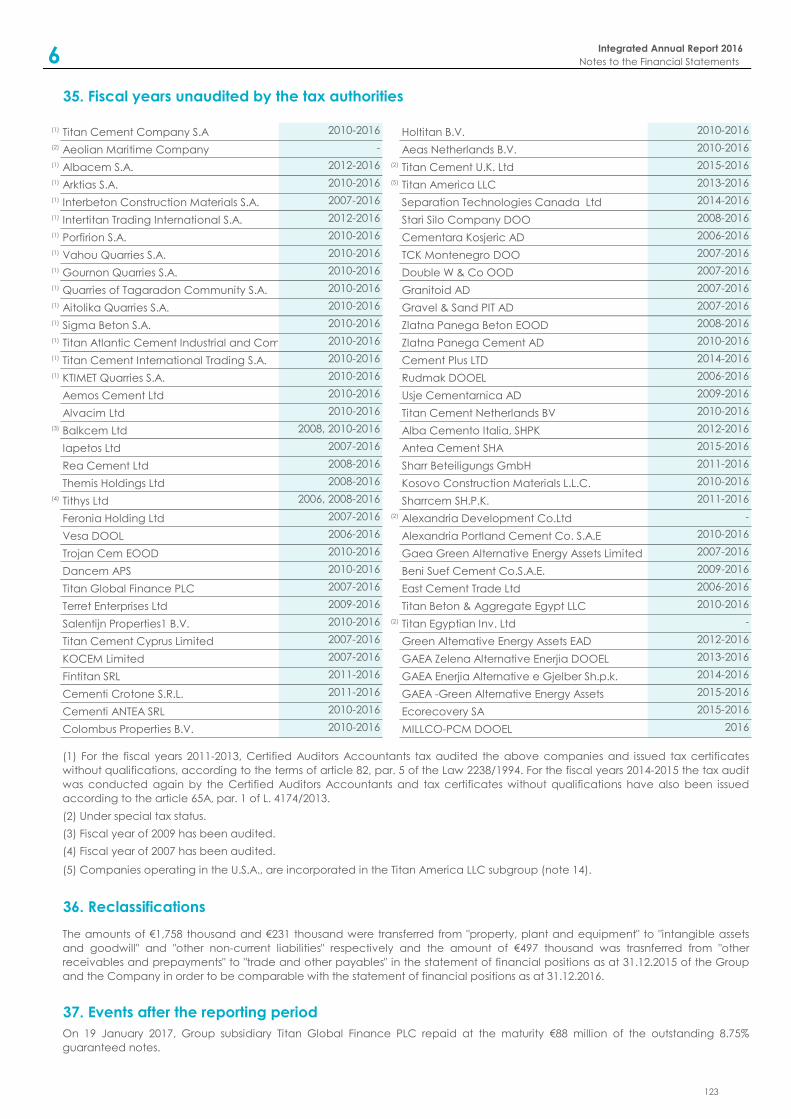
35. Fiscal years unaudited by the tax authorities
(1) Τitan Cement Company S.A 2010-2016 Holtitan B.V. 2010-2016
(2) Aeolian Maritime Company - Aeas Netherlands B.V. 2010-2016
(1) Albacem S.A. 2012-2016 (2) Titan Cement U.K. Ltd 2015-2016
(1) Arktias S.A. 2010-2016 (5) Τitan Αmerica LLC 2013-2016
(1) Interbeton Construction Materials S.A. 2007-2016 Separation Technologies Canada Ltd 2014-2016
(1) Intertitan Trading International S.A. 2012-2016 Stari Silo Company DOO 2008-2016
(1) Porfirion S.A. 2010-2016 Cementara Kosjeric AD 2006-2016
(1) Vahou Quarries S.A. 2010-2016 TCK Montenegro DOO 2007-2016
(1) Gournon Quarries S.A. 2010-2016 Double W & Co OOD 2007-2016
(1) Quarries of Tagaradon Community S.A. 2010-2016 Granitoid AD 2007-2016
(1) Aitolika Quarries S.A. 2010-2016 Gravel & Sand PIT AD 2007-2016
(1) Sigma Beton S.A. 2010-2016 Zlatna Panega Beton EOOD 2008-2016
(1) Titan Atlantic Cement Industrial and Commercial S.A.2010-2016 Zlatna Panega Cement AD 2010-2016
(1) Titan Cement International Trading S.A. 2010-2016 Cement Plus LTD 2014-2016
(1) KTIMET Quarries S.A. 2010-2016 Rudmak DOOEL 2006-2016
Aemos Cement Ltd 2010-2016 Usje Cementarnica AD 2009-2016
Alvacim Ltd 2010-2016 Titan Cement Netherlands BV 2010-2016
(3) Balkcem Ltd 2008, 2010-2016 Alba Cemento Italia, SHPK 2012-2016
Iapetos Ltd 2007-2016 Antea Cement SHA 2015-2016
Rea Cement Ltd 2008-2016 Sharr Beteiligungs GmbH 2011-2016
Themis Holdings Ltd 2008-2016 Kosovo Construction Materials L.L.C. 2010-2016
(4) Tithys Ltd 2006, 2008-2016 Sharrcem SH.P.K. 2011-2016
Feronia Holding Ltd 2007-2016 (2) Alexandria Development Co.Ltd -
Vesa DOOL 2006-2016 Alexandria Portland Cement Co. S.A.E 2010-2016
Trojan Cem EOOD 2010-2016 Gaea Green Alternative Energy Assets Limited 2007-2016
Dancem APS 2010-2016 Beni Suef Cement Co.S.A.E. 2009-2016
Titan Global Finance PLC 2007-2016 East Cement Trade Ltd 2006-2016
Terret Enterprises Ltd 2009-2016 Titan Beton & Aggregate Egypt LLC 2010-2016
Salentijn Properties1 B.V. 2010-2016 (2) Titan Egyptian Inv. Ltd -
Titan Cement Cyprus Limited 2007-2016 Green Alternative Energy Assets EAD 2012-2016
KOCEM Limited 2007-2016 GAEA Zelena Alternative Enerjia DOOEL 2013-2016
Fintitan SRL 2011-2016 GAEA Enerjia Alternative e Gjelber Sh.p.k. 2014-2016
Cementi Crotone S.R.L. 2011-2016 GAEA -Green Alternative Energy Assets 2015-2016
Cementi ANTEA SRL 2010-2016 Ecorecovery SA 2015-2016
Colombus Properties B.V. 2010-2016 MILLCO-PCM DOOEL 2016
36. Reclassifications
37. Events after the reporting period
On 19 January 2017, Group subsidiary Titan Global Finance PLC repaid at the maturity €88 million of the outstanding 8.75%
guaranteed notes.
(5) Companies operating in the U.S.A., are incorporated in the Titan America LLC subgroup (note 14).
(1) For the fiscal years 2011-2013, Certified Auditors Accountants tax audited the above companies and issued tax certificates
without qualifications, according to the terms of article 82, par. 5 of the Law 2238/1994. For the fiscal years 2014-2015 the tax audit
was conducted again by the Certified Auditors Accountants and tax certificates without qualifications have also been issued
according to the article 65A, par. 1 of L. 4174/2013.
(2) Under special tax status.
(4) Fiscal year of 2007 has been audited.
(3) Fiscal year of 2009 has been audited.
The amounts of €1,758 thousand and €231 thousand were transferred from "property, plant and equipment" to "intangible assets
and goodwill" and "other non-current liabilities" respectively and the amount of €497 thousand was trasnferred from "other
receivables and prepayments" to "trade and other payables" in the statement of financial positions as at 31.12.2015 of the Group
and the Company in order to be comparable with the statement of financial positions as at 31.12.2016.
Integrated Annual Report 2016
Notes to the Financial Statements6
123
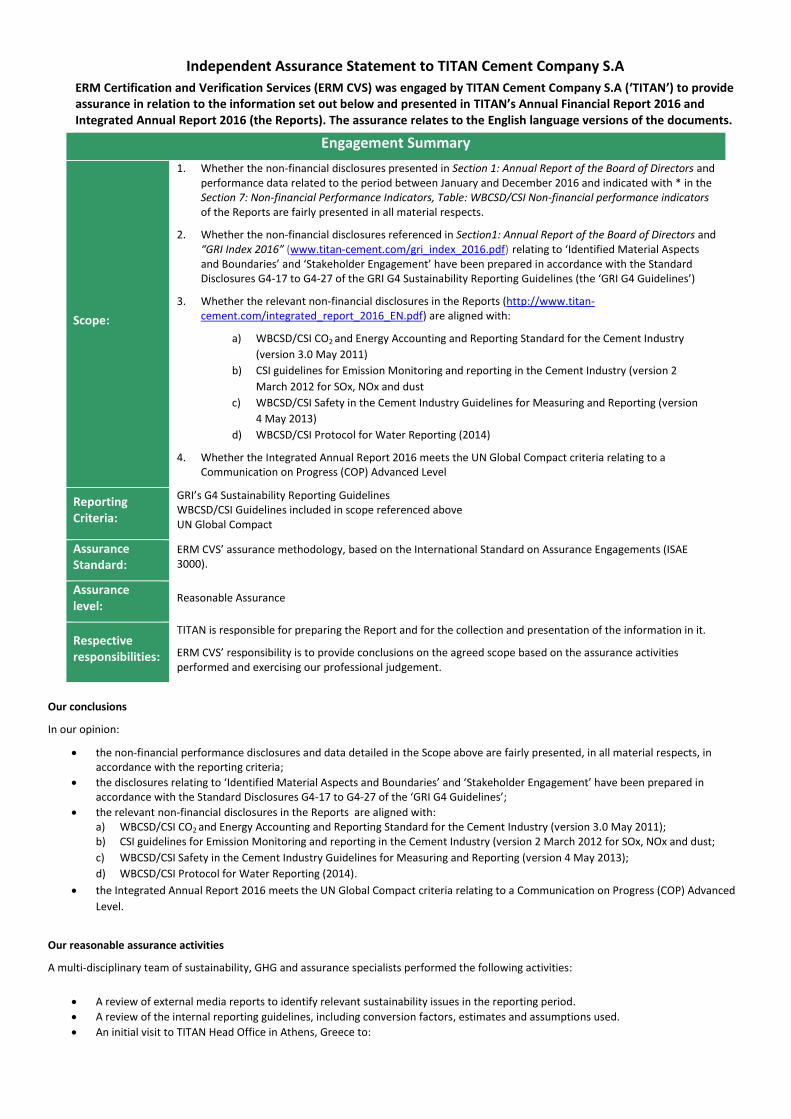
Independent Assurance Statement to TITAN Cement Company S.A
ERM Certification and Verification Services (ERM CVS) was engaged by TITAN Cement Company S.A (‘TITAN’) to provide assurance in relation to the information set out below and presented in TITAN’s Annual Financial Report 2016 and Integrated Annual Report 2016 (the Reports). The assurance relates to the English language versions of the documents.
Engagement Summary
Scope:
1. Whether the non-financial disclosures presented in Section 1: Annual Report of the Board of Directors and performance data related to the period between January and December 2016 and indicated with * in the Section 7: Non-financial Performance Indicators, Table: WBCSD/CSI Non-financial performance indicators of the Reports are fairly presented in all material respects.
2. Whether the non-financial disclosures referenced in Section1: Annual Report of the Board of Directors and “GRI Index 2016” (www.titan-cement.com/gri_index_2016.pdf) relating to ‘Identified Material Aspects and Boundaries’ and ‘Stakeholder Engagement’ have been prepared in accordance with the Standard Disclosures G4-17 to G4-27 of the GRI G4 Sustainability Reporting Guidelines (the ‘GRI G4 Guidelines’)
3. Whether the relevant non-financial disclosures in the Reports (http://www.titan-cement.com/integrated_report_2016_EN.pdf) are aligned with:
a) WBCSD/CSI CO2 and Energy Accounting and Reporting Standard for the Cement Industry
(version 3.0 May 2011)
b) CSI guidelines for Emission Monitoring and reporting in the Cement Industry (version 2
March 2012 for SOx, NOx and dust
c) WBCSD/CSI Safety in the Cement Industry Guidelines for Measuring and Reporting (version
4 May 2013)
d) WBCSD/CSI Protocol for Water Reporting (2014)
4. Whether the Integrated Annual Report 2016 meets the UN Global Compact criteria relating to a Communication on Progress (COP) Advanced Level
Reporting Criteria:
GRI’s G4 Sustainability Reporting Guidelines WBCSD/CSI Guidelines included in scope referenced above UN Global Compact
Assurance Standard:
ERM CVS’ assurance methodology, based on the International Standard on Assurance Engagements (ISAE 3000).
Assurance level:
Reasonable Assurance
Respective responsibilities:
TITAN is responsible for preparing the Report and for the collection and presentation of the information in it.
ERM CVS’ responsibility is to provide conclusions on the agreed scope based on the assurance activities performed and exercising our professional judgement.
Our conclusions
In our opinion:
the non-financial performance disclosures and data detailed in the Scope above are fairly presented, in all material respects, in accordance with the reporting criteria;
the disclosures relating to ‘Identified Material Aspects and Boundaries’ and ‘Stakeholder Engagement’ have been prepared in accordance with the Standard Disclosures G4-17 to G4-27 of the ‘GRI G4 Guidelines’;
the relevant non-financial disclosures in the Reports are aligned with: a) WBCSD/CSI CO2 and Energy Accounting and Reporting Standard for the Cement Industry (version 3.0 May 2011); b) CSI guidelines for Emission Monitoring and reporting in the Cement Industry (version 2 March 2012 for SOx, NOx and dust;
c) WBCSD/CSI Safety in the Cement Industry Guidelines for Measuring and Reporting (version 4 May 2013);
d) WBCSD/CSI Protocol for Water Reporting (2014).
the Integrated Annual Report 2016 meets the UN Global Compact criteria relating to a Communication on Progress (COP) Advanced
Level.
Our reasonable assurance activities
A multi-disciplinary team of sustainability, GHG and assurance specialists performed the following activities:
A review of external media reports to identify relevant sustainability issues in the reporting period.
A review of the internal reporting guidelines, including conversion factors, estimates and assumptions used.
An initial visit to TITAN Head Office in Athens, Greece to:
o Interview relevant staff to understand TITAN’s strategy, policies, management and reporting systems for the non-financial
performance;
o Interview relevant staff to understand and evaluate the data management systems and processes (including internal review processes) used for collecting and reporting performance information.
Visits to TITAN operations in Albania (Antea Cement) and Egypt (Cairo and Beni Suef) to verify the source data underlying the performance information and review local activities regarding environmental and safety management, labour and human rights and stakeholder/community engagement.
An analytical review and desktop testing of the year end data submitted by all sites included in the consolidated performance information, including an assessment of the conclusions of accredited third-party verification bodies relating to the verification of Scope 1 GHG emissions that fall within the scope of the EU emissions trading scheme (EU ETS).
A second visit to TITAN Head Office in Athens, Greece to: o review the activities and results of stakeholder engagement and evidence underlying Titan’s updated materiality
assessment; o test the effectiveness of internal controls in relation to the accuracy and completeness of the corporate consolidated data
for the relevant indicators; o collect additional evidence through interviews and documentation review to support management assertions covered by
our engagement.
Reviewing selected evidence related to the design, information collection, and production of the Report in accordance with the report criteria.
Reviewing the presentation of information relevant to the scope of our work in the Report to ensure consistency.
The limitations of our engagement
The reliability of the assured data is subject to inherent uncertainties, given the available methods for determining, calculating or estimating the underlying information. It is important to understand our assurance conclusions in this context. Our independent assurance statement provides no assurance on the maintenance and integrity of the website, including controls used to achieve this, and in particular whether any changes may have occurred to the information since it was first published.
Our Observations
We have provided TITAN with a separate detailed management report. Without affecting the conclusions presented above, we have the following key observations:
TITAN has a comprehensive set of Group policies and has strengthened and revised a number of these in 2016 including Human
Rights, Anti-bribery and Corruption, and Competition Law. TITAN should consider enhancing the implementation of Group policies by
developing performance standards to provide operations with a set of comparable and auditable performance expectations (beyond
local legislation and market norms) through which alignment with Group policies can be measured.
TITAN identifies corruption as a strategic and operational risk in a number of countries in which it operates. While TITAN has implemented whistleblowing hotlines in Greece and the USA, employees in other countries have limited mechanisms to anonymously report potential non-compliances with the company’s Code of Conduct and related group policies. We recommend that priority is given to an early extension of an anonymous local language hotline system to all countries of operation in order to improve corporate monitoring of possible non-compliances with the Group policies.
Jennifer Iansen-Rogers Partner, Head of Corporate Assurance
21 March 2017
ERM Certification and Verification Services, London
www.ermcvs.com
Email: [email protected]
ERM CVS is a member of the ERM Group. The work that ERM CVS conducts for clients is solely related to independent assurance activities and auditor training. Our processes are designed and implemented to ensure that the work we undertake with clients is free from bias and conflict of interest. ERM CVS and the staff that have undertaken work on this assurance exercise provide no consultancy related services to TITAN Cement Company S.A in any respect.
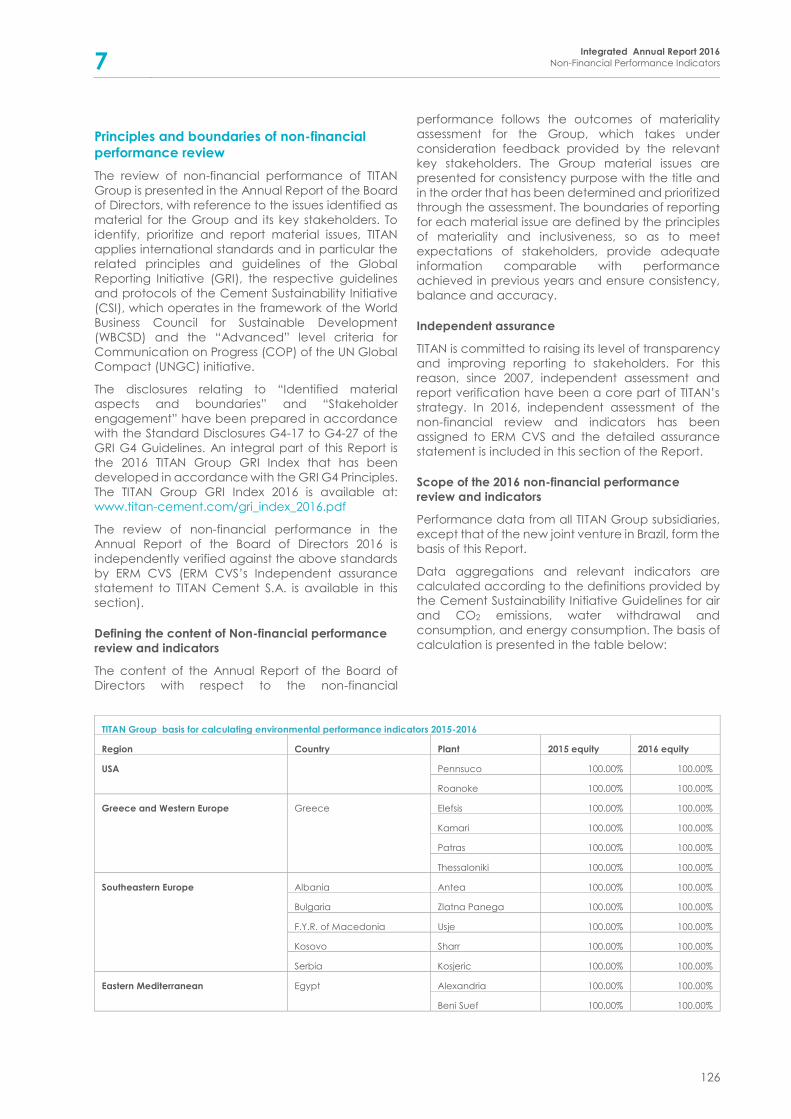
7 Integrated Annual Report 2016
Non-Financial Performance Indicators
126
Principles and boundaries of non-financial
performance review
The review of non-financial performance of TITAN
Group is presented in the Annual Report of the Board
of Directors, with reference to the issues identified as
material for the Group and its key stakeholders. To
identify, prioritize and report material issues, TITAN
applies international standards and in particular the
related principles and guidelines of the Global
Reporting Initiative (GRI), the respective guidelines
and protocols of the Cement Sustainability Initiative
(CSI), which operates in the framework of the World
Business Council for Sustainable Development
(WBCSD) and the “Advanced” level criteria for
Communication on Progress (COP) of the UN Global
Compact (UNGC) initiative.
The disclosures relating to “Identified material
aspects and boundaries” and “Stakeholder
engagement” have been prepared in accordance
with the Standard Disclosures G4-17 to G4-27 of the
GRI G4 Guidelines. An integral part of this Report is
the 2016 TITAN Group GRI Index that has been
developed in accordance with the GRI G4 Principles.
The TITAN Group GRI Index 2016 is available at:
www.titan-cement.com/gri_index_2016.pdf
The review of non-financial performance in the
Annual Report of the Board of Directors 2016 is
independently verified against the above standards
by ERM CVS (ERM CVS’s Independent assurance
statement to TITAN Cement S.A. is available in this
section).
Defining the content of Non-financial performance
review and indicators
The content of the Annual Report of the Board of
Directors with respect to the non-financial
performance follows the outcomes of materiality
assessment for the Group, which takes under
consideration feedback provided by the relevant
key stakeholders. The Group material issues are
presented for consistency purpose with the title and
in the order that has been determined and prioritized
through the assessment. The boundaries of reporting
for each material issue are defined by the principles
of materiality and inclusiveness, so as to meet
expectations of stakeholders, provide adequate
information comparable with performance
achieved in previous years and ensure consistency,
balance and accuracy.
Independent assurance
TITAN is committed to raising its level of transparency
and improving reporting to stakeholders. For this
reason, since 2007, independent assessment and
report verification have been a core part of TITAN’s
strategy. In 2016, independent assessment of the
non-financial review and indicators has been
assigned to ERM CVS and the detailed assurance
statement is included in this section of the Report.
Scope of the 2016 non-financial performance
review and indicators
Performance data from all TITAN Group subsidiaries,
except that of the new joint venture in Brazil, form the
basis of this Report.
Data aggregations and relevant indicators are
calculated according to the definitions provided by
the Cement Sustainability Initiative Guidelines for air
and CO2 emissions, water withdrawal and
consumption, and energy consumption. The basis of
calculation is presented in the table below:
TITAN Group basis for calculating environmental performance indicators 2015-2016
Region Country Plant 2015 equity 2016 equity
USA Pennsuco 100.00% 100.00%
Roanoke 100.00% 100.00%
Greece and Western Europe Greece Elefsis 100.00% 100.00%
Kamari 100.00% 100.00%
Patras 100.00% 100.00%
Thessaloniki 100.00% 100.00%
Southeastern Europe Albania Antea 100.00% 100.00%
Bulgaria Zlatna Panega 100.00% 100.00%
F.Y.R. of Macedonia Usje 100.00% 100.00%
Kosovo Sharr 100.00% 100.00%
Serbia Kosjeric 100.00% 100.00%
Eastern Mediterranean Egypt Alexandria 100.00% 100.00%
Beni Suef 100.00% 100.00%
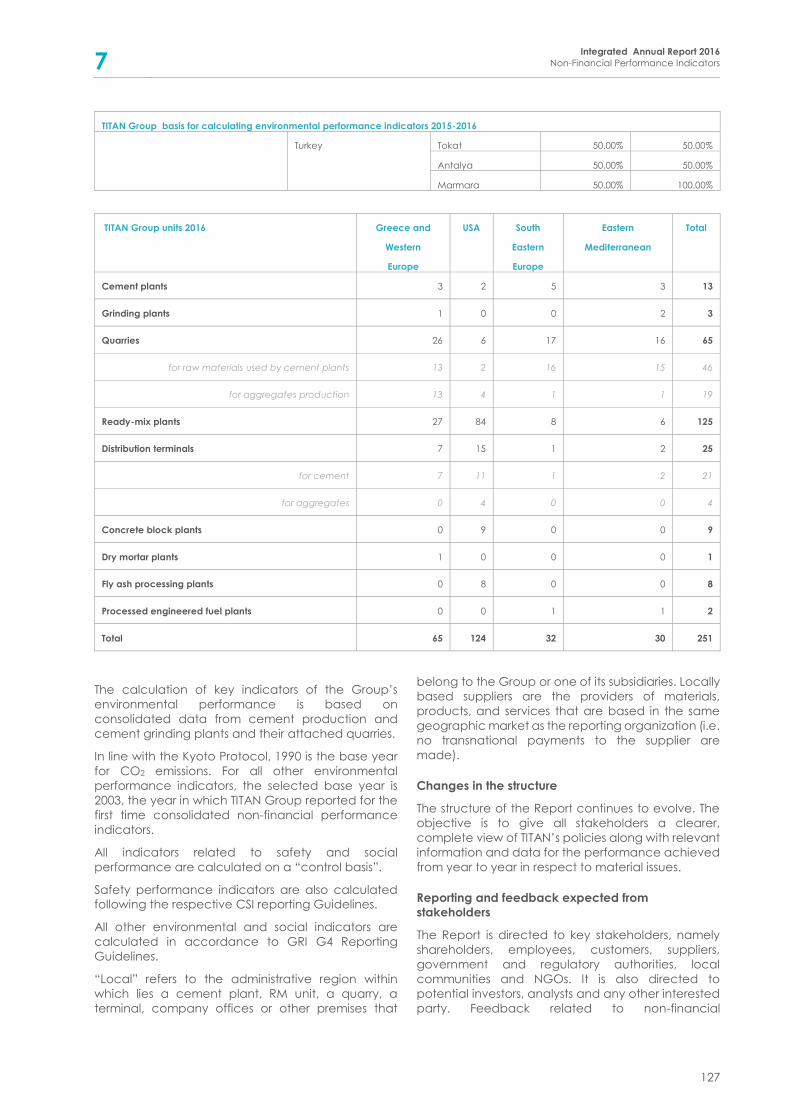
7 Integrated Annual Report 2016
Non-Financial Performance Indicators
127
TITAN Group basis for calculating environmental performance indicators 2015-2016
Turkey Tokat 50.00% 50.00%
Antalya 50.00% 50.00%
Marmara 50.00% 100.00%
TITAN Group units 2016
Greece and
Western
Europe
USA South
Eastern
Europe
Eastern
Mediterranean
Total
Cement plants 3 2 5 3 13
Grinding plants 1 0 0 2 3
Quarries 26 6 17 16 65
for raw materials used by cement plants 13 2 16 15 46
for aggregates production 13 4 1 1 19
Ready-mix plants 27 84 8 6 125
Distribution terminals 7 15 1 2 25
for cement 7 11 1 2 21
for aggregates 0 4 0 0 4
Concrete block plants 0 9 0 0 9
Dry mortar plants 1 0 0 0 1
Fly ash processing plants 0 8 0 0 8
Processed engineered fuel plants 0 0 1 1 2
Total 65 124 32 30 251
The calculation of key indicators of the Group’s
environmental performance is based on
consolidated data from cement production and
cement grinding plants and their attached quarries.
In line with the Kyoto Protocol, 1990 is the base year
for CO2 emissions. For all other environmental
performance indicators, the selected base year is
2003, the year in which TITAN Group reported for the
first time consolidated non-financial performance
indicators.
All indicators related to safety and social
performance are calculated on a “control basis”.
Safety performance indicators are also calculated
following the respective CSI reporting Guidelines.
All other environmental and social indicators are
calculated in accordance to GRI G4 Reporting
Guidelines.
“Local” refers to the administrative region within
which lies a cement plant, RM unit, a quarry, a
terminal, company offices or other premises that
belong to the Group or one of its subsidiaries. Locally
based suppliers are the providers of materials,
products, and services that are based in the same
geographic market as the reporting organization (i.e.
no transnational payments to the supplier are
made).
Changes in the structure
The structure of the Report continues to evolve. The
objective is to give all stakeholders a clearer,
complete view of TITAN’s policies along with relevant
information and data for the performance achieved
from year to year in respect to material issues.
Reporting and feedback expected from
stakeholders
The Report is directed to key stakeholders, namely
shareholders, employees, customers, suppliers,
government and regulatory authorities, local
communities and NGOs. It is also directed to
potential investors, analysts and any other interested
party. Feedback related to non-financial
7 Integrated Annual Report 2016
Non-Financial Performance Indicators
128
performance is welcome and should be addressed
to the following email address: [email protected]
For more information, please visit our website:
www.titan-cement.com or contact: Maria Alexiou,
TITAN Group CSR Senior Manager, at [email protected], or
at Halkidos Street, 111 43 Athens, Greece.
GRI and UN Global Compact
TITAN declares that this Report and information
provided in the GRI Index fulfils GRI G4 principles and
is in accordance with Core. This Report has been
externally verified against the GRI principles including
the GRI Index 2016.
TITAN has followed GRI Reporting Guidelines since
2003 when the first Group CSR and Sustainability
Report was issued. Following the GRI Guidelines has
supported overall improvements in both internal and
external communications, measuring long-term
performance and expanding the scope of
engagement with stakeholders.
The Report also meets the “Advanced” level criteria
for the UN Global Compact Communication on
Progress (COP), as well as the WBCSD/CSI guidelines
for reporting non-financial performance related to
specific issues.
Μore detail on the scope and boundaries of the
assurance is included in the “Independent Auditors
Assurance Statement” in this section.
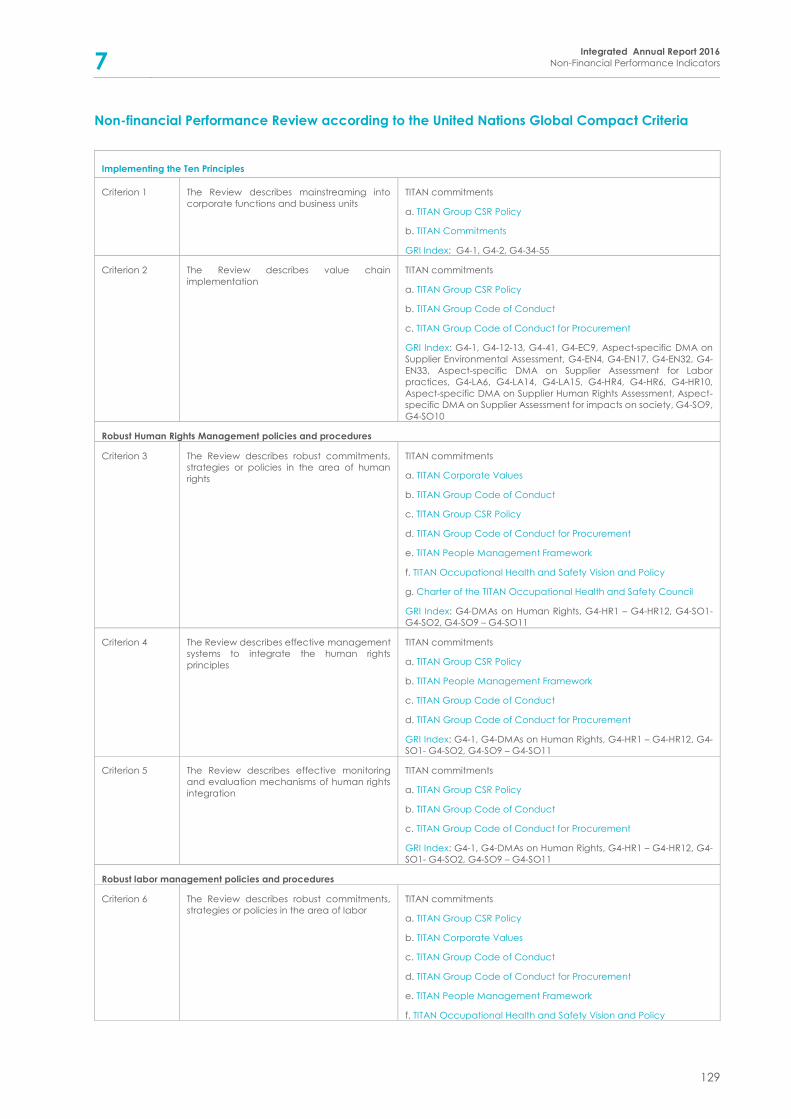
7 Integrated Annual Report 2016
Non-Financial Performance Indicators
129
Non-financial Performance Review according to the United Nations Global Compact Criteria
Implementing the Ten Principles
Criterion 1 The Review describes mainstreaming into
corporate functions and business units
TITAN commitments
a. TITAN Group CSR Policy
b. TITAN Commitments
GRI Index: G4-1, G4-2, G4-34-55
Criterion 2 The Review describes value chain
implementation
TITAN commitments
a. TITAN Group CSR Policy
b. TITAN Group Code of Conduct
c. TITAN Group Code of Conduct for Procurement
GRI Index: G4-1, G4-12-13, G4-41, G4-EC9, Aspect-specific DMA on
Supplier Environmental Assessment, G4-EN4, G4-EN17, G4-EN32, G4-
EN33, Aspect-specific DMA on Supplier Assessment for Labor
practices, G4-LA6, G4-LA14, G4-LA15, G4-HR4, G4-HR6, G4-HR10,
Aspect-specific DMA on Supplier Human Rights Assessment, Aspect-
specific DMA on Supplier Assessment for impacts on society, G4-SO9,
G4-SO10
Robust Human Rights Management policies and procedures
Criterion 3 The Review describes robust commitments,
strategies or policies in the area of human
rights
TITAN commitments
a. TITAN Corporate Values
b. TITAN Group Code of Conduct
c. TITAN Group CSR Policy
d. TITAN Group Code of Conduct for Procurement
e. TITAN People Management Framework
f. TITAN Occupational Health and Safety Vision and Policy
g. Charter of the TITAN Occupational Health and Safety Council
GRI Index: G4-DMAs on Human Rights, G4-HR1 – G4-HR12, G4-SO1-
G4-SO2, G4-SO9 – G4-SO11
Criterion 4 The Review describes effective management
systems to integrate the human rights
principles
TITAN commitments
a. TITAN Group CSR Policy
b. TITAN People Management Framework
c. TITAN Group Code of Conduct
d. TITAN Group Code of Conduct for Procurement
GRI Index: G4-1, G4-DMAs on Human Rights, G4-HR1 – G4-HR12, G4-
SO1- G4-SO2, G4-SO9 – G4-SO11
Criterion 5 The Review describes effective monitoring
and evaluation mechanisms of human rights
integration
TITAN commitments
a. TITAN Group CSR Policy
b. TITAN Group Code of Conduct
c. TITAN Group Code of Conduct for Procurement
GRI Index: G4-1, G4-DMAs on Human Rights, G4-HR1 – G4-HR12, G4-
SO1- G4-SO2, G4-SO9 – G4-SO11
Robust labor management policies and procedures
Criterion 6 The Review describes robust commitments,
strategies or policies in the area of labor
TITAN commitments
a. TITAN Group CSR Policy
b. TITAN Corporate Values
c. TITAN Group Code of Conduct
d. TITAN Group Code of Conduct for Procurement
e. TITAN People Management Framework
f. TITAN Occupational Health and Safety Vision and Policy
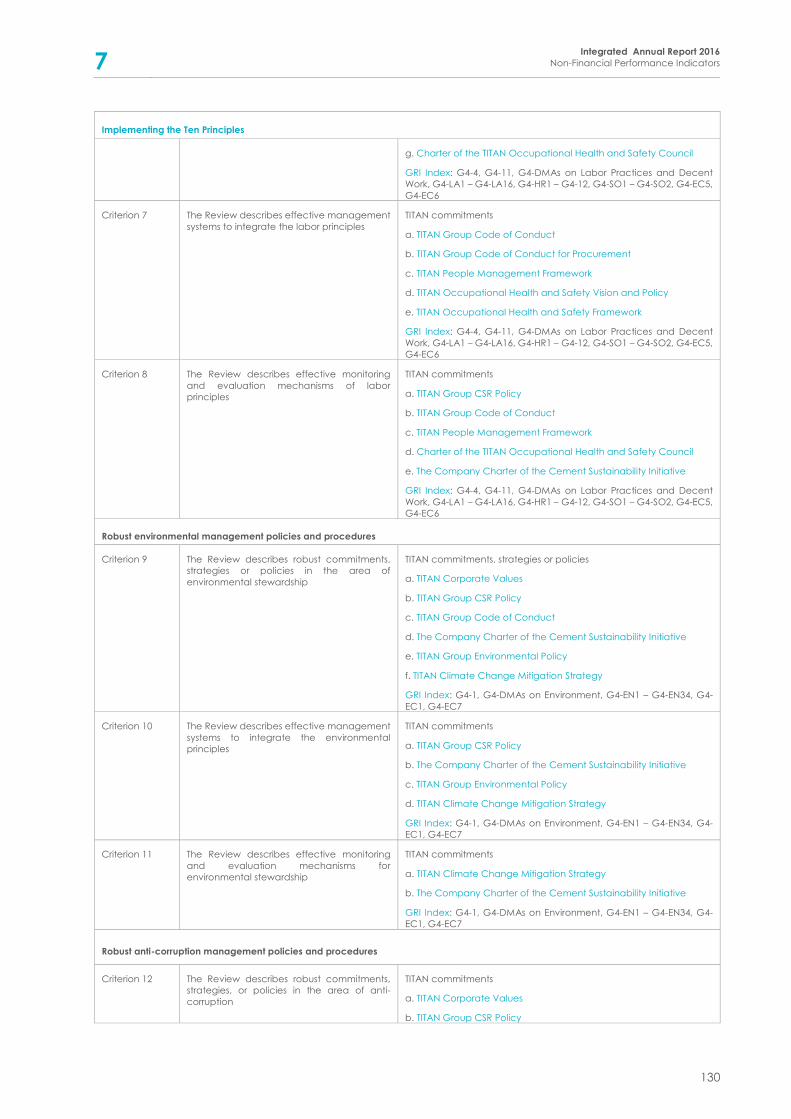
7 Integrated Annual Report 2016
Non-Financial Performance Indicators
130
Implementing the Ten Principles
g. Charter of the TITAN Occupational Health and Safety Council
GRI Index: G4-4, G4-11, G4-DMAs on Labor Practices and Decent
Work, G4-LA1 – G4-LA16, G4-HR1 – G4-12, G4-SO1 – G4-SO2, G4-EC5,
G4-EC6
Criterion 7 The Review describes effective management
systems to integrate the labor principles
TITAN commitments
a. TITAN Group Code of Conduct
b. TITAN Group Code of Conduct for Procurement
c. TITAN People Management Framework
d. TITAN Occupational Health and Safety Vision and Policy
e. TITAN Occupational Health and Safety Framework
GRI Index: G4-4, G4-11, G4-DMAs on Labor Practices and Decent
Work, G4-LA1 – G4-LA16, G4-HR1 – G4-12, G4-SO1 – G4-SO2, G4-EC5,
G4-EC6
Criterion 8 The Review describes effective monitoring
and evaluation mechanisms of labor
principles
TITAN commitments
a. TITAN Group CSR Policy
b. TITAN Group Code of Conduct
c. TITAN People Management Framework
d. Charter of the TITAN Occupational Health and Safety Council
e. The Company Charter of the Cement Sustainability Initiative
GRI Index: G4-4, G4-11, G4-DMAs on Labor Practices and Decent
Work, G4-LA1 – G4-LA16, G4-HR1 – G4-12, G4-SO1 – G4-SO2, G4-EC5,
G4-EC6
Robust environmental management policies and procedures
Criterion 9 The Review describes robust commitments,
strategies or policies in the area of
environmental stewardship
TITAN commitments, strategies or policies
a. TITAN Corporate Values
b. TITAN Group CSR Policy
c. TITAN Group Code of Conduct
d. The Company Charter of the Cement Sustainability Initiative
e. TITAN Group Environmental Policy
f. TITAN Climate Change Mitigation Strategy
GRI Index: G4-1, G4-DMAs on Environment, G4-EN1 – G4-EN34, G4-
EC1, G4-EC7
Criterion 10 The Review describes effective management
systems to integrate the environmental
principles
TITAN commitments
a. TITAN Group CSR Policy
b. The Company Charter of the Cement Sustainability Initiative
c. TITAN Group Environmental Policy
d. TITAN Climate Change Mitigation Strategy
GRI Index: G4-1, G4-DMAs on Environment, G4-EN1 – G4-EN34, G4-
EC1, G4-EC7
Criterion 11 The Review describes effective monitoring
and evaluation mechanisms for
environmental stewardship
TITAN commitments
a. TITAN Climate Change Mitigation Strategy
b. The Company Charter of the Cement Sustainability Initiative
GRI Index: G4-1, G4-DMAs on Environment, G4-EN1 – G4-EN34, G4-
EC1, G4-EC7
Robust anti-corruption management policies and procedures
Criterion 12 The Review describes robust commitments,
strategies, or policies in the area of anti-
corruption
TITAN commitments
a. TITAN Corporate Values
b. TITAN Group CSR Policy
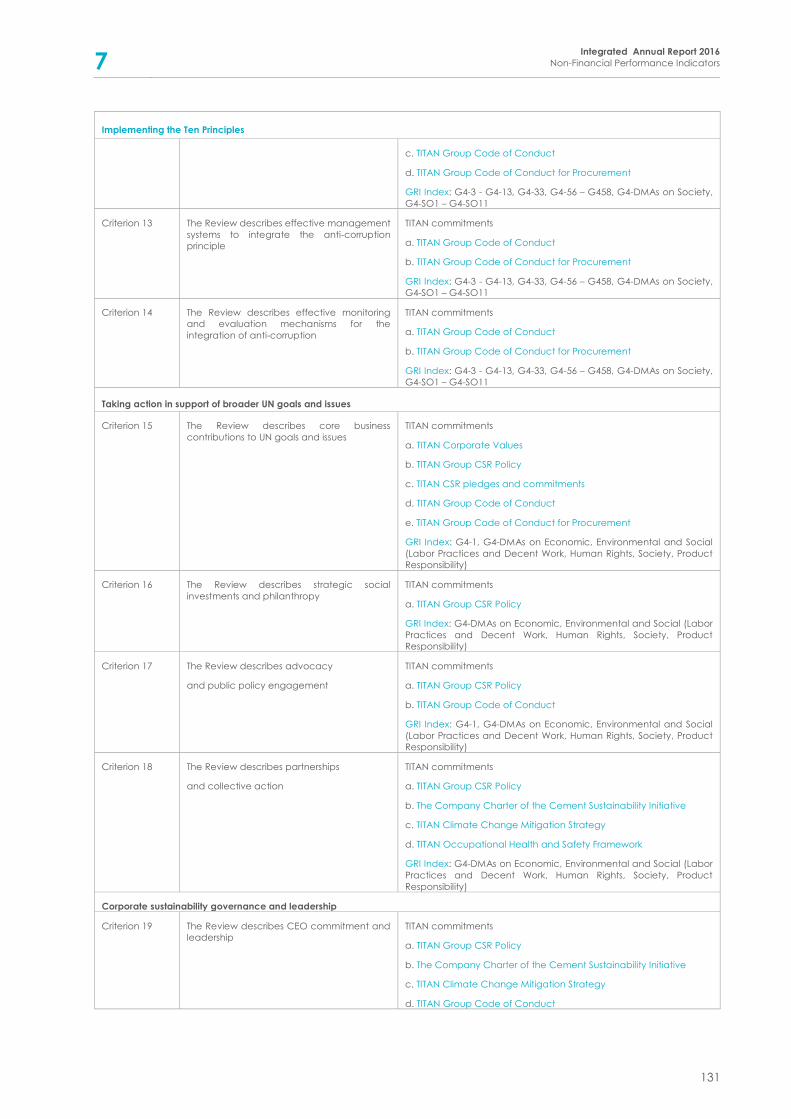
7 Integrated Annual Report 2016
Non-Financial Performance Indicators
131
Implementing the Ten Principles
c. TITAN Group Code of Conduct
d. TITAN Group Code of Conduct for Procurement
GRI Index: G4-3 - G4-13, G4-33, G4-56 – G458, G4-DMAs on Society,
G4-SO1 – G4-SO11
Criterion 13 The Review describes effective management
systems to integrate the anti-corruption
principle
TITAN commitments
a. TITAN Group Code of Conduct
b. TITAN Group Code of Conduct for Procurement
GRI Index: G4-3 - G4-13, G4-33, G4-56 – G458, G4-DMAs on Society,
G4-SO1 – G4-SO11
Criterion 14 The Review describes effective monitoring
and evaluation mechanisms for the
integration of anti-corruption
TITAN commitments
a. TITAN Group Code of Conduct
b. TITAN Group Code of Conduct for Procurement
GRI Index: G4-3 - G4-13, G4-33, G4-56 – G458, G4-DMAs on Society,
G4-SO1 – G4-SO11
Taking action in support of broader UN goals and issues
Criterion 15 The Review describes core business
contributions to UN goals and issues
TITAN commitments
a. TITAN Corporate Values
b. TITAN Group CSR Policy
c. TITAN CSR pledges and commitments
d. TITAN Group Code of Conduct
e. TITAN Group Code of Conduct for Procurement
GRI Index: G4-1, G4-DMAs on Economic, Environmental and Social
(Labor Practices and Decent Work, Human Rights, Society, Product
Responsibility)
Criterion 16 The Review describes strategic social
investments and philanthropy
TITAN commitments
a. TITAN Group CSR Policy
GRI Index: G4-DMAs on Economic, Environmental and Social (Labor
Practices and Decent Work, Human Rights, Society, Product
Responsibility)
Criterion 17 The Review describes advocacy
and public policy engagement
TITAN commitments
a. TITAN Group CSR Policy
b. TITAN Group Code of Conduct
GRI Index: G4-1, G4-DMAs on Economic, Environmental and Social
(Labor Practices and Decent Work, Human Rights, Society, Product
Responsibility)
Criterion 18 The Review describes partnerships
and collective action
TITAN commitments
a. TITAN Group CSR Policy
b. The Company Charter of the Cement Sustainability Initiative
c. TITAN Climate Change Mitigation Strategy
d. TITAN Occupational Health and Safety Framework
GRI Index: G4-DMAs on Economic, Environmental and Social (Labor
Practices and Decent Work, Human Rights, Society, Product
Responsibility)
Corporate sustainability governance and leadership
Criterion 19 The Review describes CEO commitment and
leadership
TITAN commitments
a. TITAN Group CSR Policy
b. The Company Charter of the Cement Sustainability Initiative
c. TITAN Climate Change Mitigation Strategy
d. TITAN Group Code of Conduct
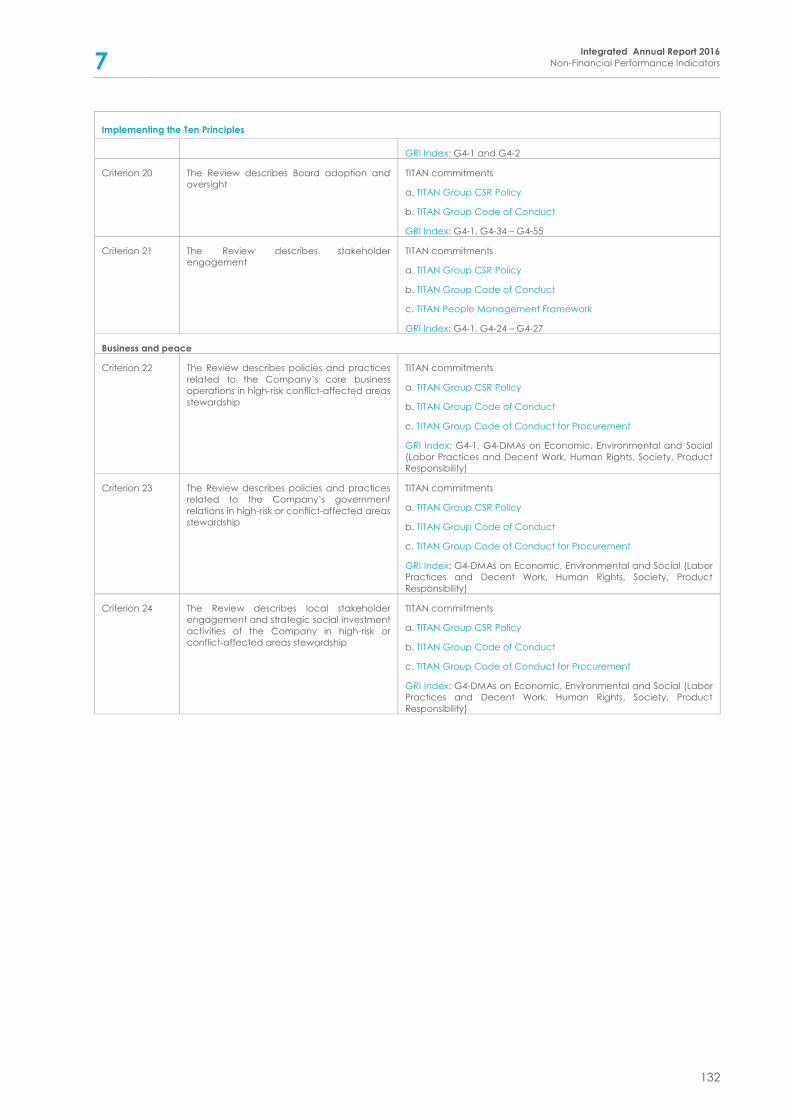
7 Integrated Annual Report 2016
Non-Financial Performance Indicators
132
Implementing the Ten Principles
GRI Index: G4-1 and G4-2
Criterion 20 The Review describes Board adoption and
oversight
TITAN commitments
a. TITAN Group CSR Policy
b. TITAN Group Code of Conduct
GRI Index: G4-1, G4-34 – G4-55
Criterion 21 The Review describes stakeholder
engagement
TITAN commitments
a. TITAN Group CSR Policy
b. TITAN Group Code of Conduct
c. TITAN People Management Framework
GRI Index: G4-1, G4-24 – G4-27
Business and peace
Criterion 22 The Review describes policies and practices
related to the Company’s core business
operations in high-risk conflict-affected areas
stewardship
TITAN commitments
a. TITAN Group CSR Policy
b. TITAN Group Code of Conduct
c. TITAN Group Code of Conduct for Procurement
GRI Index: G4-1, G4-DMAs on Economic, Environmental and Social
(Labor Practices and Decent Work, Human Rights, Society, Product
Responsibility)
Criterion 23 The Review describes policies and practices
related to the Company’s government
relations in high-risk or conflict-affected areas
stewardship
TITAN commitments
a. TITAN Group CSR Policy
b. TITAN Group Code of Conduct
c. TITAN Group Code of Conduct for Procurement
GRI Index: G4-DMAs on Economic, Environmental and Social (Labor
Practices and Decent Work, Human Rights, Society, Product
Responsibility)
Criterion 24 The Review describes local stakeholder
engagement and strategic social investment
activities of the Company in high-risk or
conflict-affected areas stewardship
TITAN commitments
a. TITAN Group CSR Policy
b. TITAN Group Code of Conduct
c. TITAN Group Code of Conduct for Procurement
GRI Index: G4-DMAs on Economic, Environmental and Social (Labor
Practices and Decent Work, Human Rights, Society, Product
Responsibility)
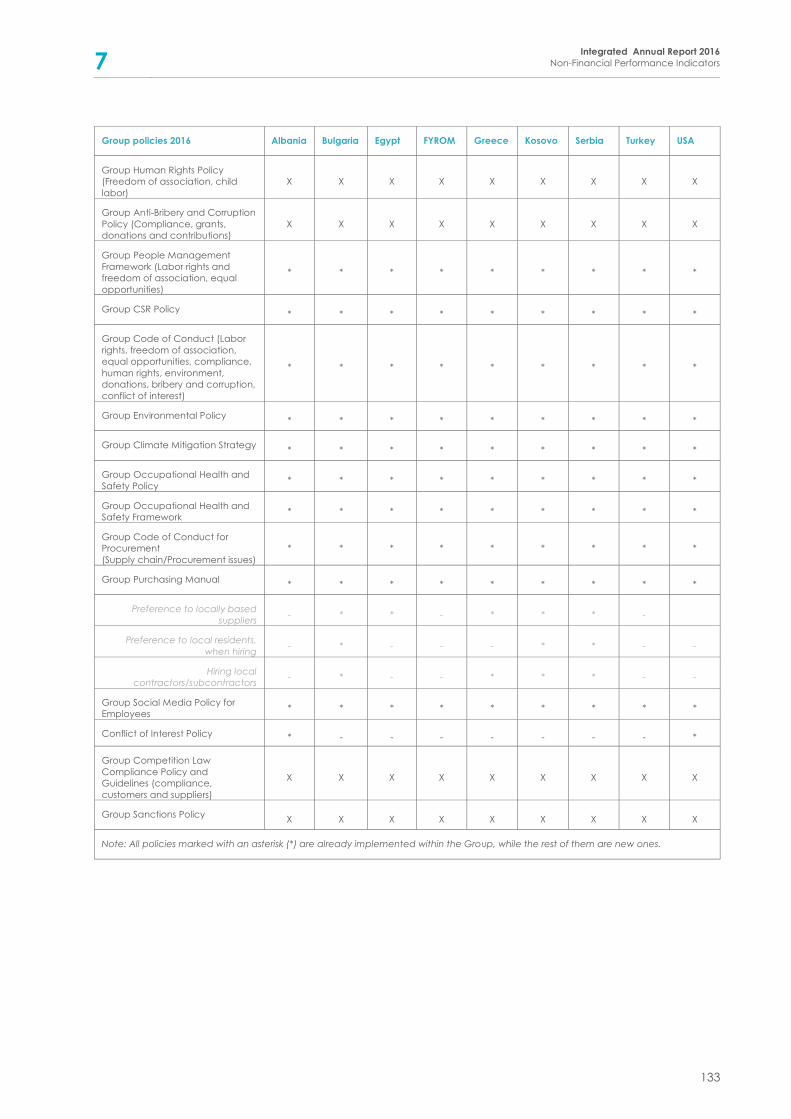
7 Integrated Annual Report 2016
Non-Financial Performance Indicators
133
Group policies 2016 Albania Bulgaria Egypt FYROM Greece Kosovo Serbia Turkey USA
Group Human Rights Policy
(Freedom of association, child
labor)
X X X X X X X X X
Group Anti-Bribery and Corruption
Policy (Compliance, grants,
donations and contributions)
X X X X X X X X X
Group People Management
Framework (Labor rights and
freedom of association, equal
opportunities)
* * * * * * * * *
Group CSR Policy * * * * * * * * *
Group Code of Conduct (Labor
rights, freedom of association,
equal opportunities, compliance,
human rights, environment,
donations, bribery and corruption,
conflict of interest)
* * * * * * * * *
Group Environmental Policy * * * * * * * * *
Group Climate Mitigation Strategy * * * * * * * * *
Group Occupational Health and
Safety Policy * * * * * * * * *
Group Occupational Health and
Safety Framework * * * * * * * * *
Group Code of Conduct for
Procurement
(Supply chain/Procurement issues)
* * * * * * * * *
Group Purchasing Manual * * * * * * * * *
Preference to locally based
suppliers - * * - * * * -
Preference to local residents,
when hiring - * - - - * * - -
Hiring local
contractors/subcontractors - * - - * * * - -
Group Social Media Policy for
Employees * * * * * * * * *
Conflict of Interest Policy * - - - - - - - *
Group Competition Law
Compliance Policy and
Guidelines (compliance,
customers and suppliers)
X X X X X X X X X
Group Sanctions Policy X X X X X X X X X
Note: All policies marked with an asterisk (*) are already implemented within the Group, while the rest of them are new ones.
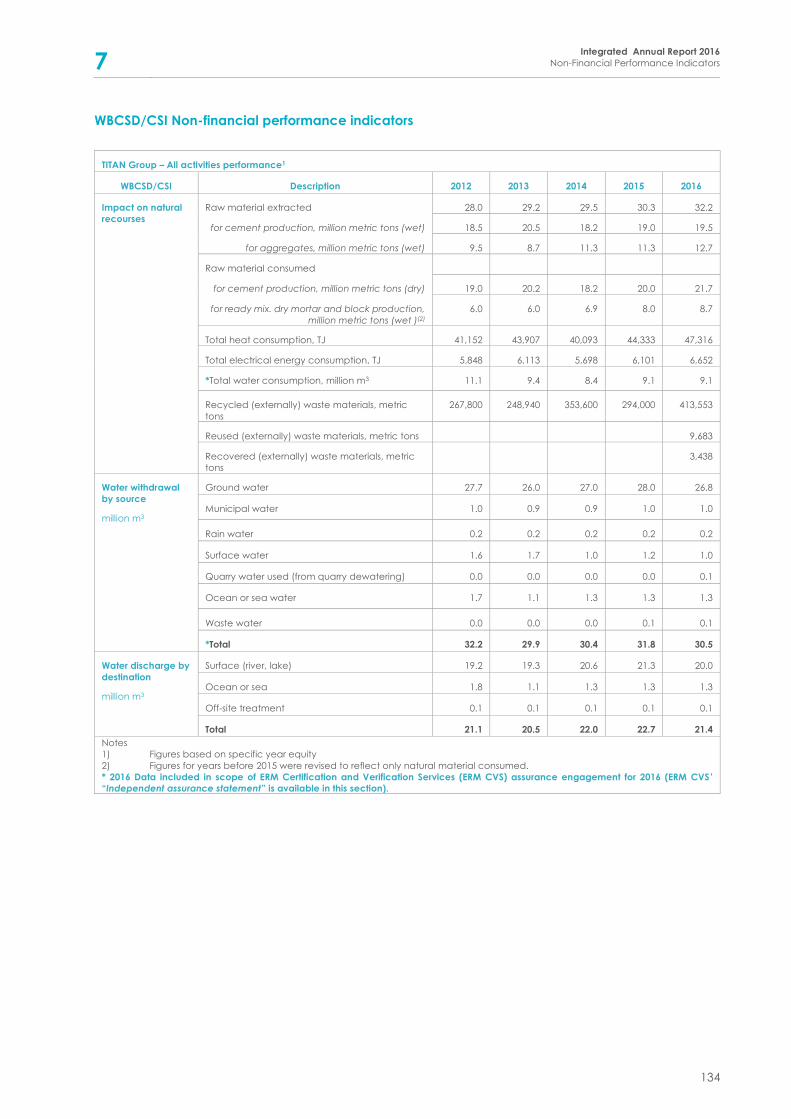
7 Integrated Annual Report 2016
Non-Financial Performance Indicators
134
WBCSD/CSI Non-financial performance indicators
TITAN Group – All activities performance1
WBCSD/CSI Description 2012 2013 2014 2015 2016
Impact on natural
recourses
Raw material extracted 28.0 29.2 29.5 30.3 32.2
for cement production, million metric tons (wet) 18.5 20.5 18.2 19.0 19.5
for aggregates, million metric tons (wet) 9.5 8.7 11.3 11.3 12.7
Raw material consumed
for cement production, million metric tons (dry) 19.0 20.2 18.2 20.0 21.7
for ready mix. dry mortar and block production,
million metric tons (wet )(2)
6.0 6.0 6.9 8.0 8.7
Total heat consumption, TJ 41,152 43,907 40,093 44,333 47,316
Total electrical energy consumption, TJ 5,848 6,113 5,698 6,101 6,652
*Total water consumption, million m3 11.1 9.4 8.4 9.1 9.1
Recycled (externally) waste materials, metric
tons
267,800 248,940 353,600 294,000 413,553
Reused (externally) waste materials, metric tons 9,683
Recovered (externally) waste materials, metric
tons
3,438
Water withdrawal
by source
million m3
Ground water 27.7 26.0 27.0 28.0 26.8
Municipal water 1.0 0.9 0.9 1.0 1.0
Rain water 0.2 0.2 0.2 0.2 0.2
Surface water 1.6 1.7 1.0 1.2 1.0
Quarry water used (from quarry dewatering) 0.0 0.0 0.0 0.0 0.1
Ocean or sea water 1.7 1.1 1.3 1.3 1.3
Waste water 0.0 0.0 0.0 0.1 0.1
*Total 32.2 29.9 30.4 31.8 30.5
Water discharge by
destination
million m3
Surface (river, lake) 19.2 19.3 20.6 21.3 20.0
Ocean or sea 1.8 1.1 1.3 1.3 1.3
Off-site treatment 0.1 0.1 0.1 0.1 0.1
Total 21.1 20.5 22.0 22.7 21.4
Notes
1) Figures based on specific year equity
2) Figures for years before 2015 were revised to reflect only natural material consumed.
* 2016 Data included in scope of ERM Certification and Verification Services (ERM CVS) assurance engagement for 2016 (ERM CVS ’
“Independent assurance statement” is available in this section).
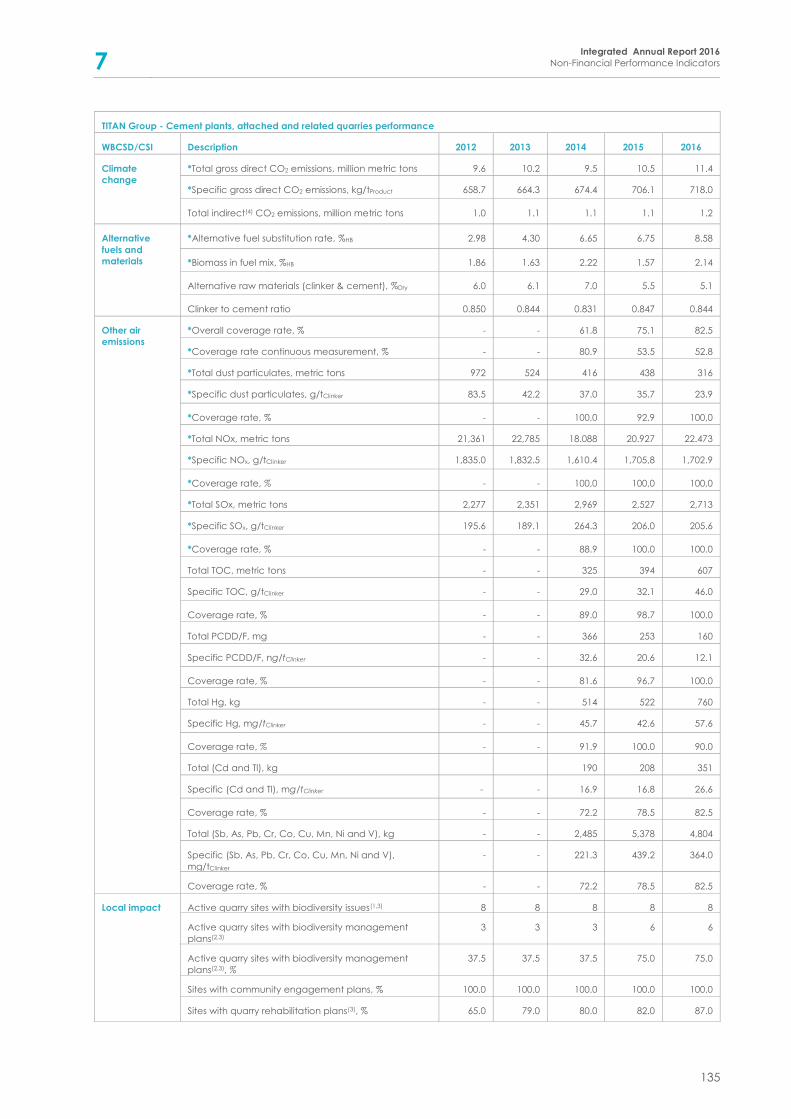
7 Integrated Annual Report 2016
Non-Financial Performance Indicators
135
TITAN Group - Cement plants, attached and related quarries performance
WBCSD/CSI Description 2012 2013 2014 2015 2016
Climate
change
*Total gross direct CO2 emissions, million metric tons 9.6 10.2 9.5 10.5 11.4
*Specific gross direct CO2 emissions, kg/tProduct 658.7 664.3 674.4 706.1 718.0
Total indirect(4) CO2 emissions, million metric tons 1.0 1.1 1.1 1.1 1.2
Alternative
fuels and
materials
*Alternative fuel substitution rate, %HB 2.98 4.30 6.65 6.75 8.58
*Biomass in fuel mix, %HB 1.86 1.63 2.22 1.57 2.14
Alternative raw materials (clinker & cement), %Dry 6.0 6.1 7.0 5.5 5.1
Clinker to cement ratio 0.850 0.844 0.831 0.847 0.844
Other air
emissions
*Overall coverage rate, % - - 61.8 75.1 82.5
*Coverage rate continuous measurement, % - - 80.9 53.5 52.8
*Total dust particulates, metric tons 972 524 416 438 316
*Specific dust particulates, g/tClinker 83.5 42.2 37.0 35.7 23.9
*Coverage rate, % - - 100,0 92,9 100,0
*Total NOx, metric tons 21,361 22,785 18.088 20.927 22.473
*Specific NOx, g/tClinker 1,835.0 1,832.5 1,610.4 1,705,8 1,702.9
*Coverage rate, % - - 100,0 100,0 100,0
*Total SOx, metric tons 2,277 2,351 2,969 2,527 2,713
*Specific SOx, g/tClinker 195.6 189.1 264.3 206.0 205.6
*Coverage rate, % - - 88.9 100.0 100.0
Total TOC, metric tons - - 325 394 607
Specific TOC, g/tClinker - - 29.0 32.1 46.0
Coverage rate, % - - 89.0 98.7 100.0
Total PCDD/F, mg - - 366 253 160
Specific PCDD/F, ng/tClinker - - 32.6 20.6 12.1
Coverage rate, % - - 81.6 96.7 100.0
Total Hg, kg - - 514 522 760
Specific Hg, mg/tClinker - - 45.7 42.6 57.6
Coverage rate, % - - 91.9 100.0 90.0
Total (Cd and Tl), kg 190 208 351
Specific (Cd and Tl), mg/tClinker - - 16.9 16.8 26.6
Coverage rate, % - - 72.2 78.5 82.5
Total (Sb, As, Pb, Cr, Co, Cu, Mn, Ni and V), kg - - 2,485 5,378 4,804
Specific (Sb, As, Pb, Cr, Co, Cu, Mn, Ni and V),
mg/tClinker
- - 221.3 439.2 364.0
Coverage rate, % - - 72.2 78.5 82.5
Local impact Active quarry sites with biodiversity issues(1,3) 8 8 8 8 8
Active quarry sites with biodiversity management
plans(2,3)
3 3 3 6 6
Active quarry sites with biodiversity management
plans(2,3), %
37.5 37.5 37.5 75.0 75.0
Sites with community engagement plans, % 100.0 100.0 100.0 100.0 100.0
Sites with quarry rehabilitation plans(3), % 65.0 79.0 80.0 82.0 87.0
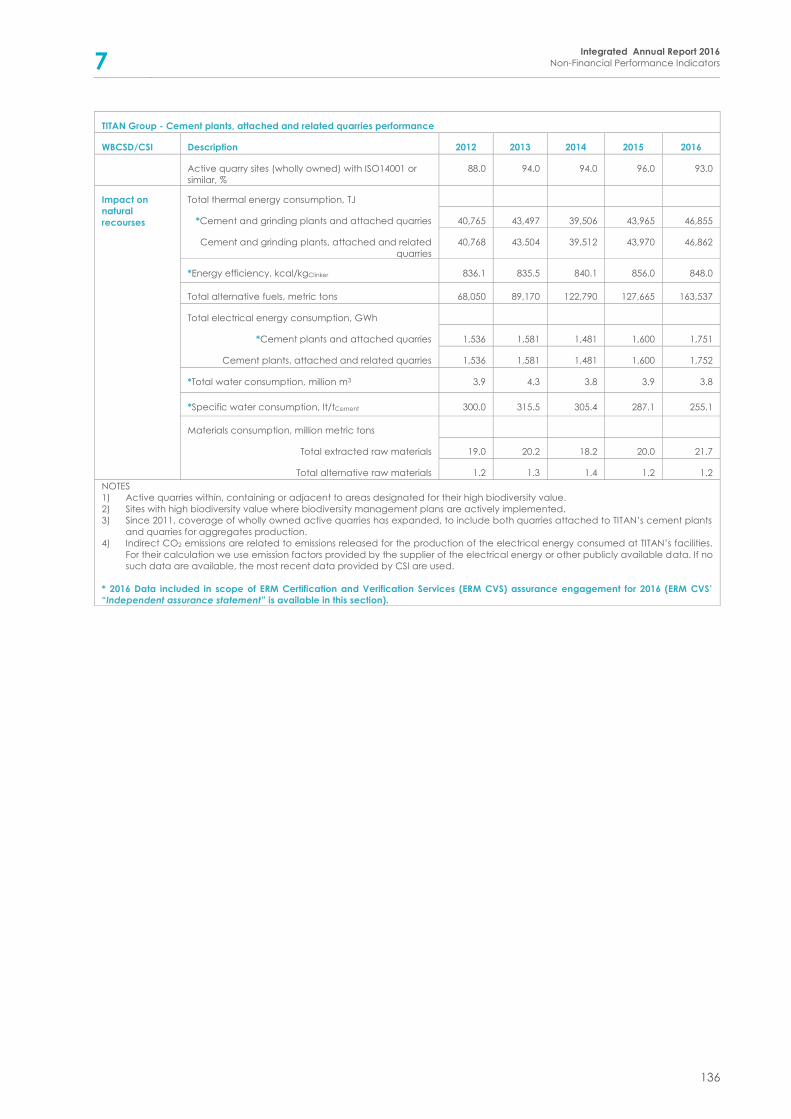
7 Integrated Annual Report 2016
Non-Financial Performance Indicators
136
TITAN Group - Cement plants, attached and related quarries performance
WBCSD/CSI Description 2012 2013 2014 2015 2016
Active quarry sites (wholly owned) with ISO14001 or
similar, %
88.0 94.0 94.0 96.0 93.0
Impact on
natural
recourses
Total thermal energy consumption, TJ
*Cement and grinding plants and attached quarries 40,765 43,497 39,506 43,965 46,855
Cement and grinding plants, attached and related
quarries
40,768 43,504 39,512 43,970 46,862
*Energy efficiency, kcal/kgClinker 836.1 835.5 840.1 856.0 848.0
Total alternative fuels, metric tons 68,050 89,170 122,790 127,665 163,537
Total electrical energy consumption, GWh
*Cement plants and attached quarries 1,536 1,581 1,481 1,600 1,751
Cement plants, attached and related quarries 1,536 1,581 1,481 1,600 1,752
*Total water consumption, million m3 3.9 4.3 3.8 3.9 3.8
*Specific water consumption, lt/tCement 300.0 315.5 305.4 287.1 255.1
Materials consumption, million metric tons
Total extracted raw materials 19.0 20.2 18.2 20.0 21.7
Total alternative raw materials 1.2 1.3 1.4 1.2 1.2
NOTES
1) Active quarries within, containing or adjacent to areas designated for their high biodiversity value.
2) Sites with high biodiversity value where biodiversity management plans are actively implemented.
3) Since 2011, coverage of wholly owned active quarries has expanded, to include both quarries attached to TITAN’s cement plants
and quarries for aggregates production.
4) Indirect CO2 emissions are related to emissions released for the production of the electrical energy consumed at TITAN’s facilities.
For their calculation we use emission factors provided by the supplier of the electrical energy or other publicly available data. If no
such data are available, the most recent data provided by CSI are used.
* 2016 Data included in scope of ERM Certification and Verification Services (ERM CVS) assurance engagement for 2016 (ERM CVS’
“Independent assurance statement” is available in this section).
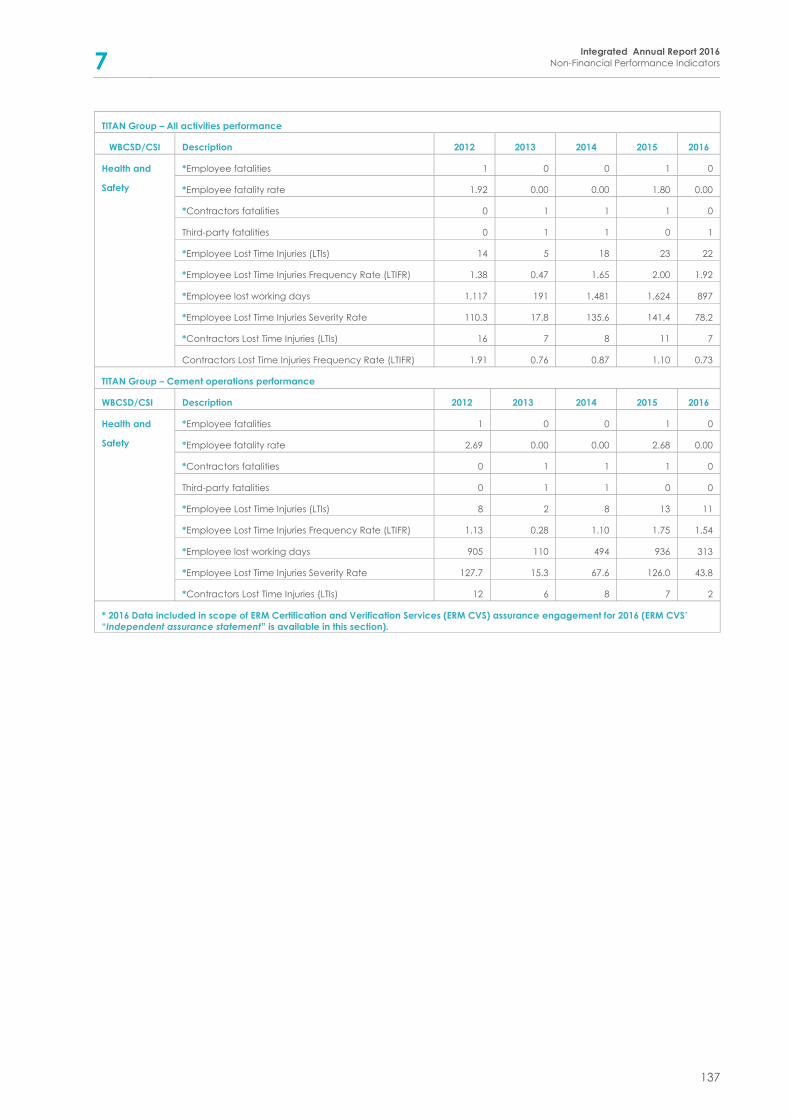
7 Integrated Annual Report 2016
Non-Financial Performance Indicators
137
TITAN Group – All activities performance
WBCSD/CSI Description 2012 2013 2014 2015 2016
Health and
Safety
*Employee fatalities 1 0 0 1 0
*Employee fatality rate 1.92 0.00 0.00 1.80 0.00
*Contractors fatalities 0 1 1 1 0
Third-party fatalities 0 1 1 0 1
*Employee Lost Time Injuries (LTIs) 14 5 18 23 22
*Employee Lost Time Injuries Frequency Rate (LTIFR) 1.38 0.47 1.65 2.00 1.92
*Employee lost working days 1,117 191 1,481 1,624 897
*Employee Lost Time Injuries Severity Rate 110.3 17.8 135.6 141.4 78.2
*Contractors Lost Time Injuries (LTIs) 16 7 8 11 7
Contractors Lost Time Injuries Frequency Rate (LTIFR) 1.91 0.76 0.87 1.10 0.73
TITAN Group – Cement operations performance
WBCSD/CSI Description 2012 2013 2014 2015 2016
Health and
Safety
*Employee fatalities 1 0 0 1 0
*Employee fatality rate 2.69 0.00 0.00 2.68 0.00
*Contractors fatalities 0 1 1 1 0
Third-party fatalities 0 1 1 0 0
*Employee Lost Time Injuries (LTIs) 8 2 8 13 11
*Employee Lost Time Injuries Frequency Rate (LTIFR) 1.13 0.28 1.10 1.75 1.54
*Employee lost working days 905 110 494 936 313
*Employee Lost Time Injuries Severity Rate 127.7 15.3 67.6 126.0 43.8
*Contractors Lost Time Injuries (LTIs) 12 6 8 7 2
* 2016 Data included in scope of ERM Certification and Verification Services (ERM CVS) assurance engagement for 2016 (ERM CVS’
“Independent assurance statement” is available in this section).
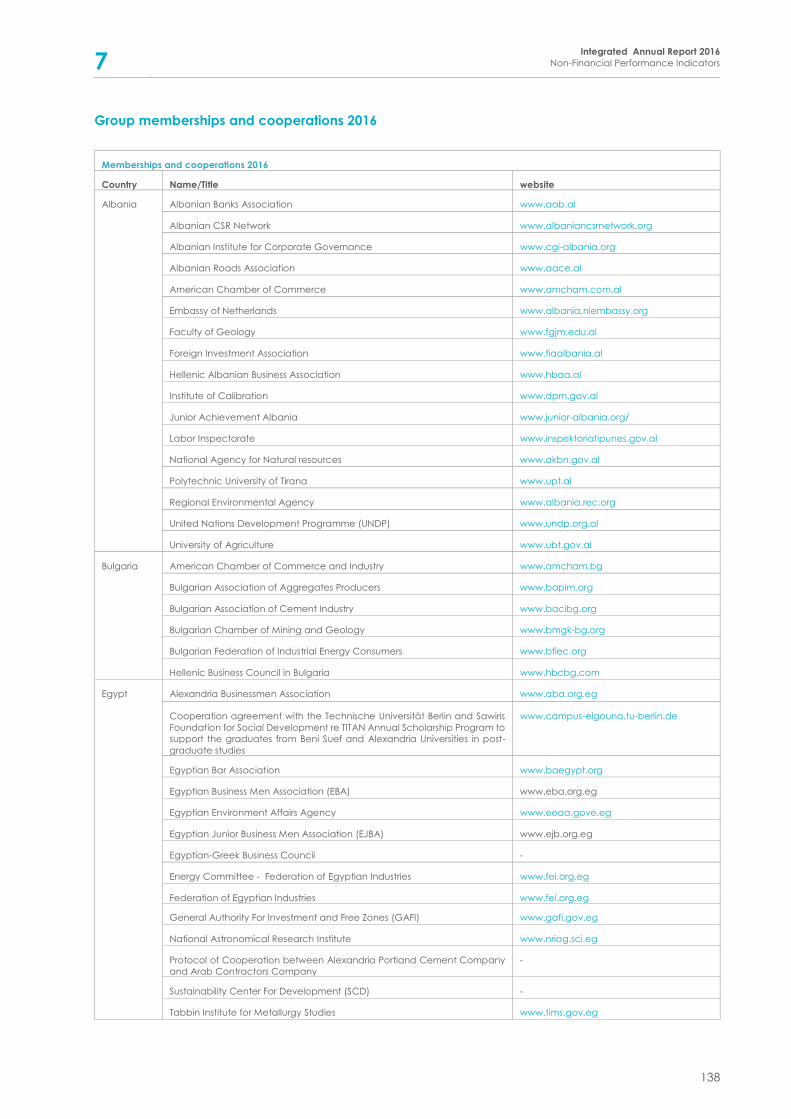
7 Integrated Annual Report 2016
Non-Financial Performance Indicators
138
Group memberships and cooperations 2016
Memberships and cooperations 2016
Country Name/Title website
Albania Albanian Banks Association www.aab.al
Albanian CSR Network www.albaniancsrnetwork.org
Albanian Institute for Corporate Governance www.cgi-albania.org
Albanian Roads Association www.aace.al
American Chamber of Commerce www.amcham.com.al
Embassy of Netherlands www.albania.nlembassy.org
Faculty of Geology www.fgjm.edu.al
Foreign Investment Association www.fiaalbania.al
Hellenic Albanian Business Association www.hbaa.al
Institute of Calibration www.dpm.gov.al
Junior Achievement Albania www.junior-albania.org/
Labor Inspectorate www.inspektoriatipunes.gov.al
National Agency for Natural resources www.akbn.gov.al
Polytechnic University of Tirana www.upt.al
Regional Environmental Agency www.albania.rec.org
United Nations Development Programme (UNDP) www.undp.org.al
University of Agriculture www.ubt.gov.al
Bulgaria American Chamber of Commerce and Industry www.amcham.bg
Bulgarian Association of Aggregates Producers www.bapim.org
Bulgarian Association of Cement Industry www.bacibg.org
Bulgarian Chamber of Mining and Geology www.bmgk-bg.org
Bulgarian Federation of Industrial Energy Consumers www.bfiec.org
Hellenic Business Council in Bulgaria www.hbcbg.com
Egypt Alexandria Businessmen Association www.aba.org.eg
Cooperation agreement with the Technische Universität Berlin and Sawiris
Foundation for Social Development re TITAN Annual Scholarship Program to
support the graduates from Beni Suef and Alexandria Universities in post-
graduate studies
www.campus-elgouna.tu-berlin.de
Egyptian Bar Association www.baegypt.org
Egyptian Business Men Association (EBA) www.eba.org.eg
Egyptian Environment Affairs Agency www.eeaa.gove.eg
Egyptian Junior Business Men Association (EJBA) www.ejb.org.eg
Egyptian-Greek Business Council -
Energy Committee - Federation of Egyptian Industries www.fei.org.eg
Federation of Egyptian Industries www.fei.org.eg
General Authority For Investment and Free Zones (GAFI) www.gafi.gov.eg
National Astronomical Research Institute www.nriag.sci.eg
Protocol of Cooperation between Alexandria Portland Cement Company
and Arab Contractors Company
-
Sustainability Center For Development (SCD) -
Tabbin Institute for Metallurgy Studies www.tims.gov.eg
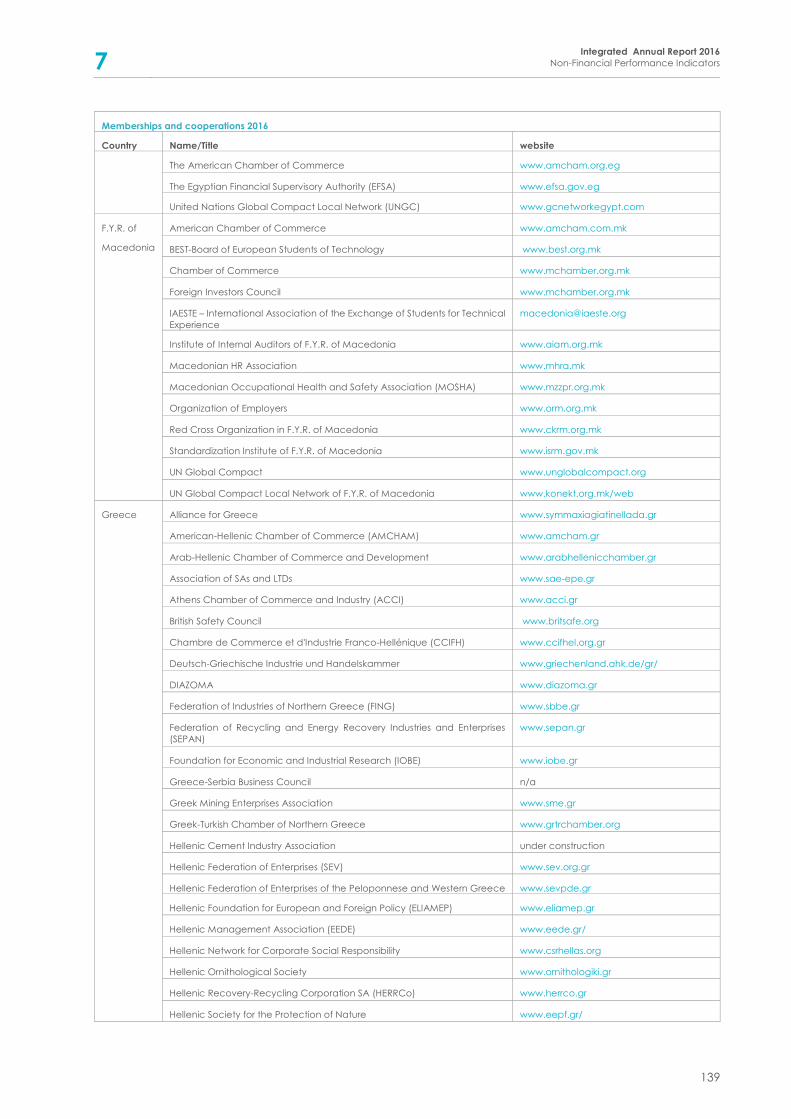
7 Integrated Annual Report 2016
Non-Financial Performance Indicators
139
Memberships and cooperations 2016
Country Name/Title website
The American Chamber of Commerce www.amcham.org.eg
The Egyptian Financial Supervisory Authority (EFSA) www.efsa.gov.eg
United Nations Global Compact Local Network (UNGC) www.gcnetworkegypt.com
F.Y.R. of
Macedonia
American Chamber of Commerce www.amcham.com.mk
BEST-Board of European Students of Technology www.best.org.mk
Chamber of Commerce www.mchamber.org.mk
Foreign Investors Council www.mchamber.org.mk
IAESTE – International Association of the Exchange of Students for Technical
Experience
Institute of Internal Auditors of F.Y.R. of Macedonia www.aiam.org.mk
Macedonian HR Association www.mhra.mk
Macedonian Occupational Health and Safety Association (MOSHA) www.mzzpr.org.mk
Organization of Employers www.orm.org.mk
Red Cross Organization in F.Y.R. of Macedonia www.ckrm.org.mk
Standardization Institute of F.Y.R. of Macedonia www.isrm.gov.mk
UN Global Compact www.unglobalcompact.org
UN Global Compact Local Network of F.Y.R. of Macedonia www.konekt.org.mk/web
Greece Alliance for Greece www.symmaxiagiatinellada.gr
American-Hellenic Chamber of Commerce (AMCHAM) www.amcham.gr
Arab-Hellenic Chamber of Commerce and Development www.arabhellenicchamber.gr
Association of SAs and LTDs www.sae-epe.gr
Athens Chamber of Commerce and Industry (ACCI) www.acci.gr
British Safety Council www.britsafe.org
Chambre de Commerce et d'Industrie Franco-Hellénique (CCIFH) www.ccifhel.org.gr
Deutsch-Griechische Industrie und Handelskammer www.griechenland.ahk.de/gr/
DIAZOMA www.diazoma.gr
Federation of Industries of Northern Greece (FING) www.sbbe.gr
Federation of Recycling and Energy Recovery Industries and Enterprises
(SEPAN)
www.sepan.gr
Foundation for Economic and Industrial Research (IOBE) www.iobe.gr
Greece-Serbia Business Council n/a
Greek Mining Enterprises Association www.sme.gr
Greek-Turkish Chamber of Northern Greece www.grtrchamber.org
Hellenic Cement Industry Association under construction
Hellenic Federation of Enterprises (SEV) www.sev.org.gr
Hellenic Federation of Enterprises of the Peloponnese and Western Greece www.sevpde.gr
Hellenic Foundation for European and Foreign Policy (ELIAMEP) www.eliamep.gr
Hellenic Management Association (EEDE) www.eede.gr/
Hellenic Network for Corporate Social Responsibility www.csrhellas.org
Hellenic Ornithological Society www.ornithologiki.gr
Hellenic Recovery-Recycling Corporation SA (HERRCo) www.herrco.gr
Hellenic Society for the Protection of Nature www.eepf.gr/
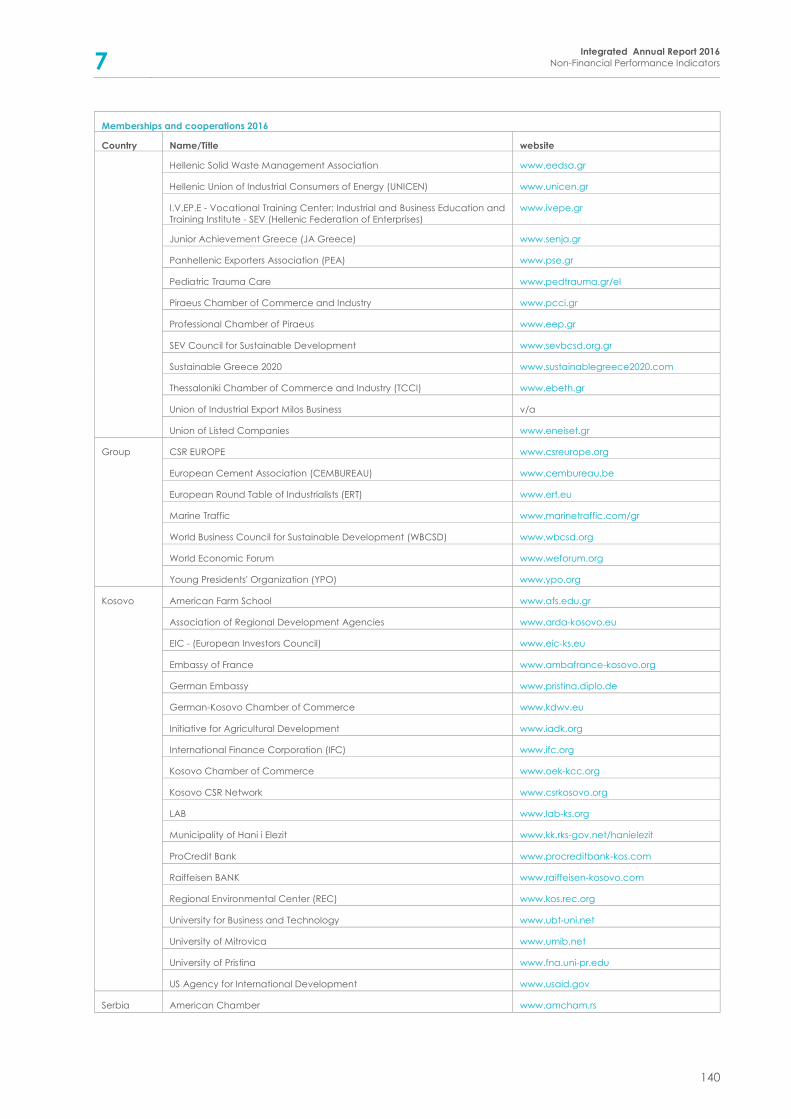
7 Integrated Annual Report 2016
Non-Financial Performance Indicators
140
Memberships and cooperations 2016
Country Name/Title website
Hellenic Solid Waste Management Association www.eedsa.gr
Hellenic Union of Industrial Consumers of Energy (UNICEN) www.unicen.gr
I.V.EP.E - Vocational Training Center: Industrial and Business Education and
Training Institute - SEV (Hellenic Federation of Enterprises)
www.ivepe.gr
Junior Achievement Greece (JA Greece) www.senja.gr
Panhellenic Exporters Association (PEA) www.pse.gr
Pediatric Trauma Care www.pedtrauma.gr/el
Piraeus Chamber of Commerce and Industry www.pcci.gr
Professional Chamber of Piraeus www.eep.gr
SEV Council for Sustainable Development www.sevbcsd.org.gr
Sustainable Greece 2020 www.sustainablegreece2020.com
Thessaloniki Chamber of Commerce and Industry (TCCI) www.ebeth.gr
Union of Industrial Export Milos Business ν/α
Union of Listed Companies www.eneiset.gr
Group CSR EUROPE www.csreurope.org
European Cement Association (CEMBUREAU) www.cembureau.be
European Round Table of Industrialists (ERT) www.ert.eu
Marine Traffic www.marinetraffic.com/gr
World Business Council for Sustainable Development (WBCSD) www.wbcsd.org
World Economic Forum www.weforum.org
Young Presidents' Organization (YPO) www.ypo.org
Kosovo American Farm School www.afs.edu.gr
Association of Regional Development Agencies www.arda-kosovo.eu
EIC - (European Investors Council) www.eic-ks.eu
Embassy of France www.ambafrance-kosovo.org
German Embassy www.pristina.diplo.de
German-Kosovo Chamber of Commerce www.kdwv.eu
Initiative for Agricultural Development www.iadk.org
International Finance Corporation (IFC) www.ifc.org
Kosovo Chamber of Commerce www.oek-kcc.org
Kosovo CSR Network www.csrkosovo.org
LAB www.lab-ks.org
Municipality of Hani i Elezit www.kk.rks-gov.net/hanielezit
ProCredit Bank www.procreditbank-kos.com
Raiffeisen BANK www.raiffeisen-kosovo.com
Regional Environmental Center (REC) www.kos.rec.org
University for Business and Technology www.ubt-uni.net
University of Mitrovica www.umib.net
University of Pristina www.fna.uni-pr.edu
US Agency for International Development www.usaid.gov
Serbia American Chamber www.amcham.rs
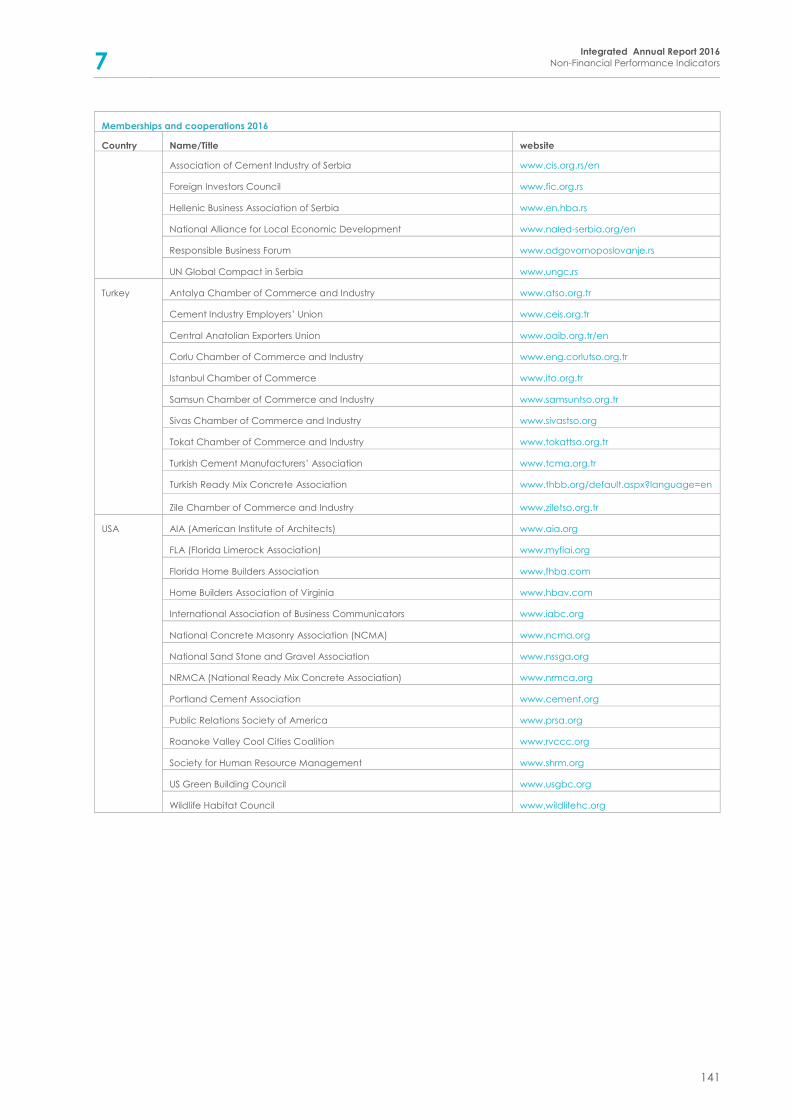
7 Integrated Annual Report 2016
Non-Financial Performance Indicators
141
Memberships and cooperations 2016
Country Name/Title website
Association of Cement Industry of Serbia www.cis.org.rs/en
Foreign Investors Council www.fic.org.rs
Hellenic Business Association of Serbia www.en.hba.rs
National Alliance for Local Economic Development www.naled-serbia.org/en
Responsible Business Forum www.odgovornoposlovanje.rs
UN Global Compact in Serbia www.ungc.rs
Turkey Antalya Chamber of Commerce and Industry www.atso.org.tr
Cement Industry Employers’ Union www.ceis.org.tr
Central Anatolian Exporters Union www.oaib.org.tr/en
Corlu Chamber of Commerce and Industry www.eng.corlutso.org.tr
Istanbul Chamber of Commerce www.ito.org.tr
Samsun Chamber of Commerce and Industry www.samsuntso.org.tr
Sivas Chamber of Commerce and Industry www.sivastso.org
Tokat Chamber of Commerce and Industry www.tokattso.org.tr
Turkish Cement Manufacturers’ Association www.tcma.org.tr
Turkish Ready Mix Concrete Association www.thbb.org/default.aspx?language=en
Zile Chamber of Commerce and Industry www.ziletso.org.tr
USA AIA (American Institute of Architects) www.aia.org
FLA (Florida Limerock Association) www.myflai.org
Florida Home Builders Association www.fhba.com
Home Builders Association of Virginia www.hbav.com
International Association of Business Communicators www.iabc.org
National Concrete Masonry Association (NCMA) www.ncma.org
National Sand Stone and Gravel Association www.nssga.org
NRMCA (National Ready Mix Concrete Association) www.nrmca.org
Portland Cement Association www.cement.org
Public Relations Society of America www.prsa.org
Roanoke Valley Cool Cities Coalition www.rvccc.org
Society for Human Resource Management www.shrm.org
US Green Building Council www.usgbc.org
Wildlife Habitat Council www.wildlifehc.org

TITAN Cement Company S.A.22A Halkidos Str.11143 Athens, GreeceTel: +30 210 2591111www.titan-cement.com