Embed Size (px)
Citation preview
REFER TO DISCLOSURE SECTION AT THE END OF THE NOTES page 1 of 13
Interlink Telecom (ITEL) (2017E TP: Bt7.20)
IPO Price Bt5.20
Mai ‐ Technology September 14, 2016
Firm steps ahead
Share data
Reuters / Bloomberg ITEL.BK / ITEL TB
Market Mai
Post‐IPO Paid‐up Shares (m) 500.00
Pre‐IPO Paid‐up Shares (m) 300.00
Par (Bt) 1.00 Dividend Policy Not less than 40% of separated
net profit IPO Summary
No. of IPO shares (mn shares) 200.00
IPO price (Bt) 5.20
First trading day September 14, 2016 Lead Underwriters Finansia Syrus Securities
Financial Advisors Finansia Syrus Securities
Major Shareholders Pre‐IPO Post‐IPO
ILINK 99.99% 59.99%
Pre‐emptive rights ‐ 12.00%
IPO ‐ 28.00%
Others 0.01% 0.01%
Purpose of fundraising
Reserved as working capital; enhancing its
network efficiency, expanding data center service
and repaying loans
Note
KT ZMICO is a co‐underwriter of the IPO of
ITEL.
Waraporn Wiboonkanarak
Analyst, no. 2482
66 (0) 2624‐6273
Entering a growth mode
We view that ITEL is entering an earnings growth mode, as the firm will reap the benefits from its fiber optic networks across the country. Our forecast calls for ITEL’s earnings to achieve a 77% CAGR during 2016‐18E and we derive a DCF‐based target price of Bt7.20/share, implying 26x PER of the 2017 EPS estimate.
A subsidiary of ILINK ITEL, a subsidiary of ILINK, engages in the telecom business. ITEL began its business by providing telecom signal installation services.
The firm later expanded its business by investing in its own fiber optic networks for lease to general clients, which should help strengthen its business growth outlook in the long term. Furthermore, ITEL also
provides data center services to support growing data usage. Solid business growth
ITEL looks attractive, in our view, as its business is entering a growth mode while the firm is reaping the benefits from its extensive fiber optic network coverage nationwide. With its high operating leverage,
the firm’s successful marketing will result in higher profitability. We thus project ITEL’s earnings growth at a 77%CAGR in the next three years. Growth with partners ITEL applies a business concept in which it tries to turn competitors
into partners. In light of this, the firm has collaborated with AIT and WHA to invest in a new data center. While the business partnership model implies that ITEL will gain smaller returns in the short term (depending on its equity in each project), we believe potential synergies from the partnerships should yield greater benefits in terms of business growth in the long run.
Financials and Valuation
FY Ended 31 Dec 2014 2015 2016E 2017E 2018E
Revenues (Btmn) 234 430 736 993 1,066
Net profit (Btmn) 9 31 68 138 170
EPS (Bt) 0.03 0.10 0.14 0.28 0.34
Norm. EPS (Bt) 0.03 0.10 0.14 0.28 0.34
Norm. EPS growth (%) nm 251.6% 33.6% 102.0% 23.3%
Dividend (Bt) 0.00 0.00 0.05 0.11 0.14
BV (Bt) 0.98 1.08 2.80 3.02 3.25
FY Ended 31 Dec 2014 2015 2016E 2017E 2018E
PER (x) nm nm 38.10 18.86 15.29
EV/EBITDA (x) nm nm 11.26 8.57 7.36
PBV (x) nm nm 1.86 1.72 1.60
Dividend yield (%) nm nm 1.0% 2.1% 2.6%
ROE (%) 3.0% 9.9% 7.9% 9.5% 10.9%
Net gearing (%) 294.2% 491.7% 46.3% 45.1% 32.4%
IPO Report

REFER TO DISCLOSURE SECTION AT THE END OF THE NOTES page 2 of 13
Investment Summary and Valuation Entering a growth stage Interlink Telecom (ITEL) is a wholly‐owned subsidiary of SET‐listed Interlink Communication Plc. (ILINK), which has been spun off to provide telecom network service and reap the benefits from its parent company’s specialization in the cabling business. The proceeds from the initial public offering (IPO) of 200mn new shares will be spent on enhancing its network stability and efficiency, expanding data center service, repaying loans and reserved as working capital. ITEL looks attractive as its business is entering a growth mode while the firm is reaping the benefits from fiber optic network coverage across the country. With its network quality and services, ITEL should be able to gain a stronger awareness among potential clients, which will enhance its revenue growth going forward. Also, given its high operating leverage, the firm’s successful marketing is a significant factor to boost profitability. We project ITEL’s earnings growth at a 77%CAGR in the next three years vs. estimated revenue growth of 35% CAGR during the same period. The highlight for ITEL is its investment in fiber optic networks in entirety and its service from its own networks, which can facilitate stable high‐speed data communication, thus reducing risk regarding data mix‐ups between different networks. Moreover, the firm’s networks laid out on the rail poles along railways coupled with roadways neglected by other operators differentiate its network and gain attractiveness in the eyes of clients. As ITEL’s networks are not physically duplicated, they can act as spare networks for each other in case one network goes out of service, helping to minimize business risks. The telecom network provider market is not extremely competitive given its capital‐intensive nature while clients focus on service‐oriented companies. Furthermore, the business generates recurring income, making providers resilient to changing economic conditions. Utilizing its business expertise and experience, ITEL also invests in telecom engineering services to external clients as another area for growth, especially during the time when telecommunication service providers continue to invest in their networks. While its engineering services can generate revenue in the short term, revenue from this segment is more sensitive to economic factors.
Target price derived at Bt7.20/share In terms of valuation, we adopt the Discount Cash Flow method given that this can better reflect the firm’s potential benefit from its telecom network than a relative approach. Our 2017E target price for ITEL is estimated at Bt7.20/share, based on 9.2% WACC and a long‐term growth rate of 3%. The derived target price implies 2017E PER of 26x, which is higher than the average PER of domestic peers (15x). We believe ITEL deserves to trade at a premium given its brighter three‐year outlook for its business growth vs. peers.
Figure 1: ITEL’s Valuation
Source: KT Zmico Research
2017E 2018E 2019E 2020E 2021E Key AssumptionsNOPLAT 185 214 218 228 230 Risk‐free rate (Rf) % 5.00 Depreciation 121 126 131 136 141 Market return (Rm) % 15.00 Less CAPEX (121) (50) (50) (50) (50) Market risk premium (Rm‐Rf) % 10.00
Change in working capital (138) (28) 131 (49) (13) Beta 0.60
Free cashflow to Firm (FCFF) 48 262 430 265 308 Cost of equity (Ke) % 11.00 Debt‐to‐capital ratio (%) 27.93
Summary of PV of FCFE 979 Perpetual growth rate (%) 3.00 PV of terminal cashflow 3,310 WACC (%) 9.18
Enterprise value 4,289 Less net debt 686 Equity value 3,603 Outstanding shares (mn) 500Fair value per share (Bt) 7.21
REFER TO DISCLOSURE SECTION AT THE END OF THE NOTES page 3 of 13
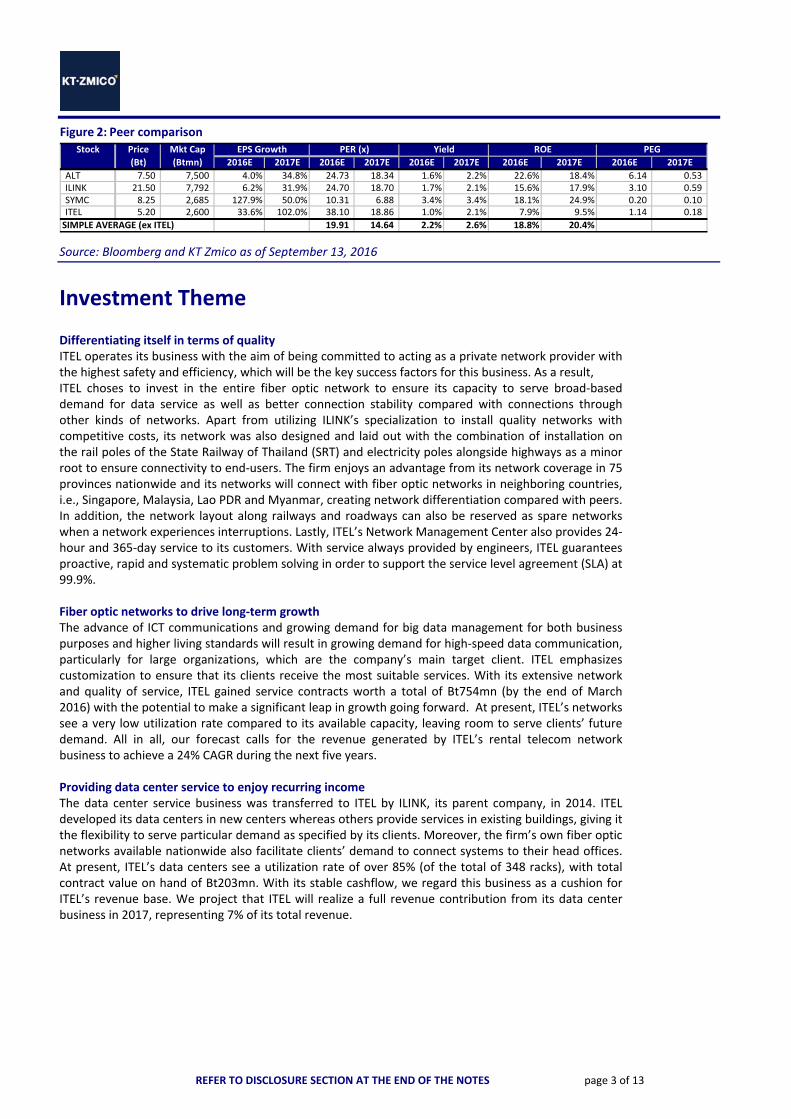
Figure 2: Peer comparison
Source: Bloomberg and KT Zmico as of September 13, 2016
Investment Theme Differentiating itself in terms of quality ITEL operates its business with the aim of being committed to acting as a private network provider with the highest safety and efficiency, which will be the key success factors for this business. As a result, ITEL choses to invest in the entire fiber optic network to ensure its capacity to serve broad‐based demand for data service as well as better connection stability compared with connections through other kinds of networks. Apart from utilizing ILINK’s specialization to install quality networks with competitive costs, its network was also designed and laid out with the combination of installation on the rail poles of the State Railway of Thailand (SRT) and electricity poles alongside highways as a minor root to ensure connectivity to end‐users. The firm enjoys an advantage from its network coverage in 75 provinces nationwide and its networks will connect with fiber optic networks in neighboring countries, i.e., Singapore, Malaysia, Lao PDR and Myanmar, creating network differentiation compared with peers. In addition, the network layout along railways and roadways can also be reserved as spare networks when a network experiences interruptions. Lastly, ITEL’s Network Management Center also provides 24‐hour and 365‐day service to its customers. With service always provided by engineers, ITEL guarantees proactive, rapid and systematic problem solving in order to support the service level agreement (SLA) at 99.9%. Fiber optic networks to drive long‐term growth The advance of ICT communications and growing demand for big data management for both business purposes and higher living standards will result in growing demand for high‐speed data communication, particularly for large organizations, which are the company’s main target client. ITEL emphasizes customization to ensure that its clients receive the most suitable services. With its extensive network and quality of service, ITEL gained service contracts worth a total of Bt754mn (by the end of March 2016) with the potential to make a significant leap in growth going forward. At present, ITEL’s networks see a very low utilization rate compared to its available capacity, leaving room to serve clients’ future demand. All in all, our forecast calls for the revenue generated by ITEL’s rental telecom network business to achieve a 24% CAGR during the next five years. Providing data center service to enjoy recurring income The data center service business was transferred to ITEL by ILINK, its parent company, in 2014. ITEL developed its data centers in new centers whereas others provide services in existing buildings, giving it the flexibility to serve particular demand as specified by its clients. Moreover, the firm’s own fiber optic networks available nationwide also facilitate clients’ demand to connect systems to their head offices. At present, ITEL’s data centers see a utilization rate of over 85% (of the total of 348 racks), with total contract value on hand of Bt203mn. With its stable cashflow, we regard this business as a cushion for ITEL’s revenue base. We project that ITEL will realize a full revenue contribution from its data center business in 2017, representing 7% of its total revenue.
Stock Price Mkt Cap
(Bt) (Btmn) 2016E 2017E 2016E 2017E 2016E 2017E 2016E 2017E 2016E 2017E
ALT u 7.50 7,500 4.0% 34.8% 24.73 18.34 1.6% 2.2% 22.6% 18.4% 6.14 0.53 ILINK 21.50 7,792 6.2% 31.9% 24.70 18.70 1.7% 2.1% 15.6% 17.9% 3.10 0.59 SYMC n 8.25 2,685 127.9% 50.0% 10.31 6.88 3.4% 3.4% 18.1% 24.9% 0.20 0.10 ITEL 5.20 2,600 33.6% 102.0% 38.10 18.86 1.0% 2.1% 7.9% 9.5% 1.14 0.18
SIMPLE AVERAGE (ex ITEL) 19.91 14.64 2.2% 2.6% 18.8% 20.4%
ROE PEGEPS Growth PER (x) Yield
REFER TO DISCLOSURE SECTION AT THE END OF THE NOTES page 4 of 13
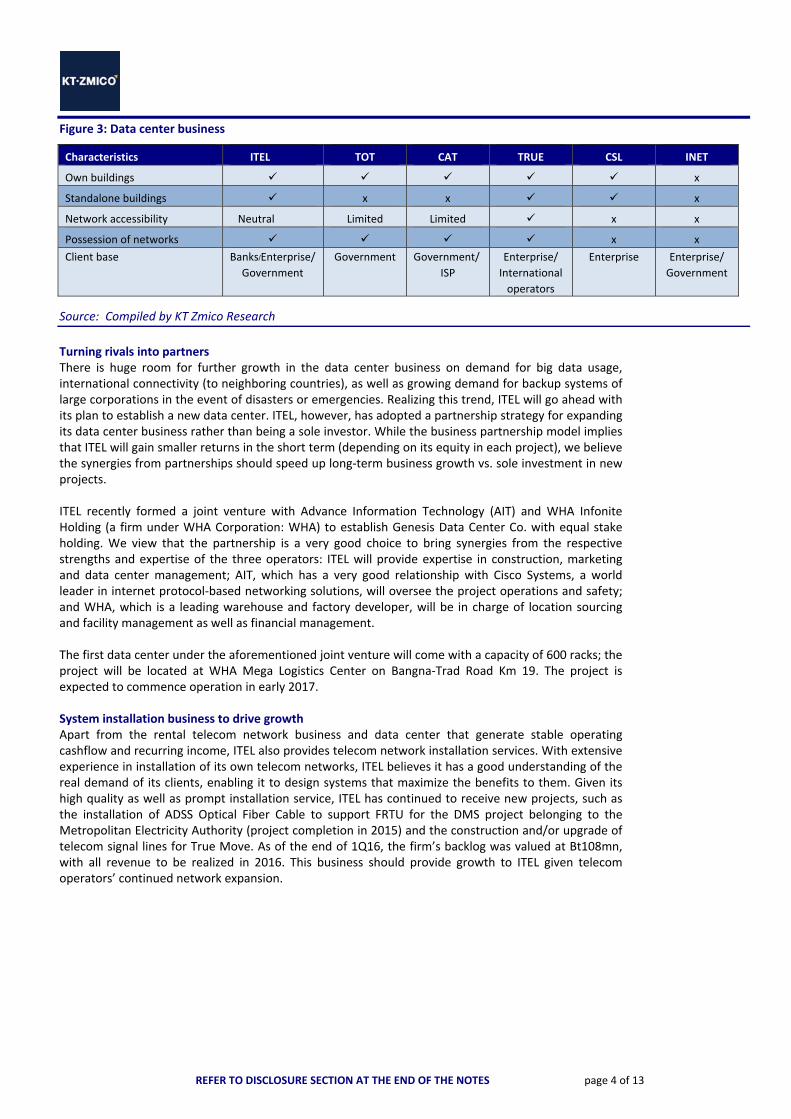
Figure 3: Data center business Characteristics ITEL TOT CAT TRUE CSL INET
Own buildings x
Standalone buildings x x x
Network accessibility Neutral Limited Limited x x
Possession of networks x x
Client base Banks/Enterprise/ Government
Government Government/
ISP
Enterprise/
International
operators
Enterprise Enterprise/
Government
Source: Compiled by KT Zmico Research
Turning rivals into partners There is huge room for further growth in the data center business on demand for big data usage, international connectivity (to neighboring countries), as well as growing demand for backup systems of large corporations in the event of disasters or emergencies. Realizing this trend, ITEL will go ahead with its plan to establish a new data center. ITEL, however, has adopted a partnership strategy for expanding its data center business rather than being a sole investor. While the business partnership model implies that ITEL will gain smaller returns in the short term (depending on its equity in each project), we believe the synergies from partnerships should speed up long‐term business growth vs. sole investment in new projects. ITEL recently formed a joint venture with Advance Information Technology (AIT) and WHA Infonite Holding (a firm under WHA Corporation: WHA) to establish Genesis Data Center Co. with equal stake holding. We view that the partnership is a very good choice to bring synergies from the respective strengths and expertise of the three operators: ITEL will provide expertise in construction, marketing and data center management; AIT, which has a very good relationship with Cisco Systems, a world leader in internet protocol‐based networking solutions, will oversee the project operations and safety; and WHA, which is a leading warehouse and factory developer, will be in charge of location sourcing and facility management as well as financial management. The first data center under the aforementioned joint venture will come with a capacity of 600 racks; the project will be located at WHA Mega Logistics Center on Bangna‐Trad Road Km 19. The project is expected to commence operation in early 2017. System installation business to drive growth Apart from the rental telecom network business and data center that generate stable operating cashflow and recurring income, ITEL also provides telecom network installation services. With extensive experience in installation of its own telecom networks, ITEL believes it has a good understanding of the real demand of its clients, enabling it to design systems that maximize the benefits to them. Given its high quality as well as prompt installation service, ITEL has continued to receive new projects, such as the installation of ADSS Optical Fiber Cable to support FRTU for the DMS project belonging to the Metropolitan Electricity Authority (project completion in 2015) and the construction and/or upgrade of telecom signal lines for True Move. As of the end of 1Q16, the firm’s backlog was valued at Bt108mn, with all revenue to be realized in 2016. This business should provide growth to ITEL given telecom operators’ continued network expansion.
REFER TO DISCLOSURE SECTION AT THE END OF THE NOTES page 5 of 13
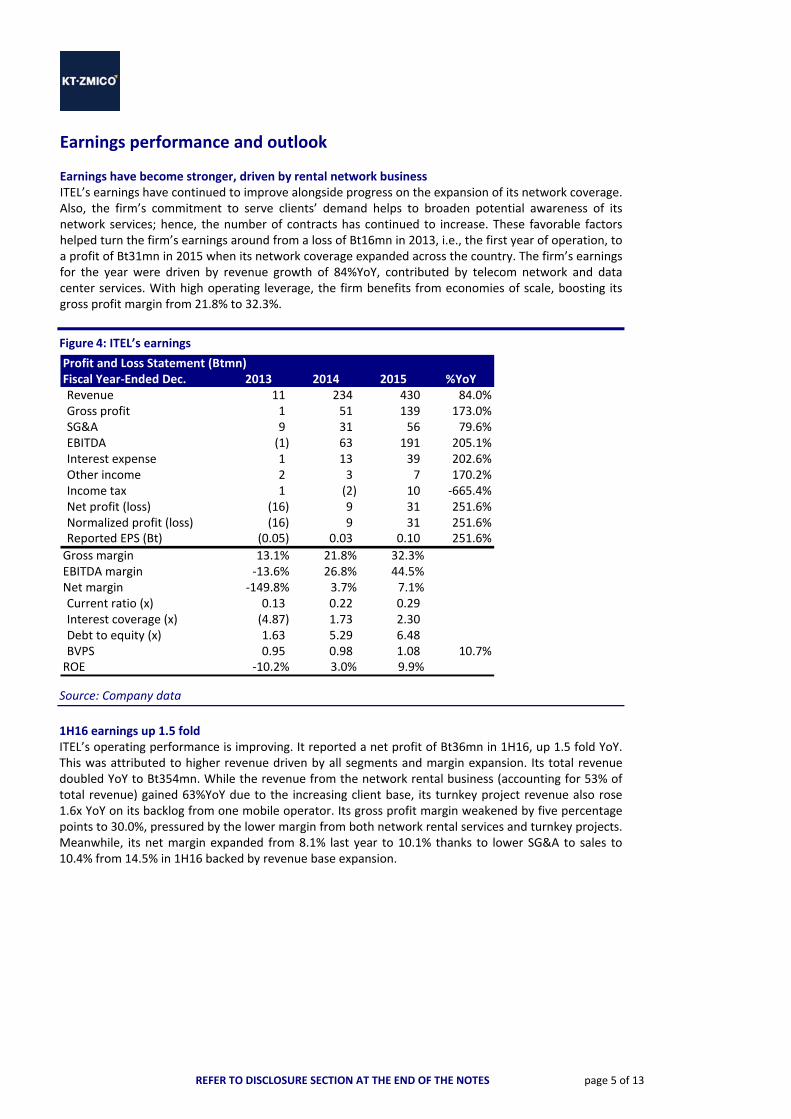
Earnings performance and outlook Earnings have become stronger, driven by rental network business ITEL’s earnings have continued to improve alongside progress on the expansion of its network coverage. Also, the firm’s commitment to serve clients’ demand helps to broaden potential awareness of its network services; hence, the number of contracts has continued to increase. These favorable factors helped turn the firm’s earnings around from a loss of Bt16mn in 2013, i.e., the first year of operation, to a profit of Bt31mn in 2015 when its network coverage expanded across the country. The firm’s earnings for the year were driven by revenue growth of 84%YoY, contributed by telecom network and data center services. With high operating leverage, the firm benefits from economies of scale, boosting its gross profit margin from 21.8% to 32.3%.
Figure 4: ITEL’s earnings Source: Company data
1H16 earnings up 1.5 fold ITEL’s operating performance is improving. It reported a net profit of Bt36mn in 1H16, up 1.5 fold YoY. This was attributed to higher revenue driven by all segments and margin expansion. Its total revenue doubled YoY to Bt354mn. While the revenue from the network rental business (accounting for 53% of total revenue) gained 63%YoY due to the increasing client base, its turnkey project revenue also rose 1.6x YoY on its backlog from one mobile operator. Its gross profit margin weakened by five percentage points to 30.0%, pressured by the lower margin from both network rental services and turnkey projects. Meanwhile, its net margin expanded from 8.1% last year to 10.1% thanks to lower SG&A to sales to 10.4% from 14.5% in 1H16 backed by revenue base expansion.
Profit and Loss Statement (Btmn)Fiscal Year‐Ended Dec. 2013 2014 2015 %YoYRevenue 11 234 430 84.0%Gross profit 1 51 139 173.0%SG&A 9 31 56 79.6%EBITDA (1) 63 191 205.1%Interest expense 1 13 39 202.6%Other income 2 3 7 170.2%Income tax 1 (2) 10 ‐665.4%Net profit (loss) (16) 9 31 251.6%Normalized profit (loss) (16) 9 31 251.6%Reported EPS (Bt) (0.05) 0.03 0.10 251.6%
Gross margin 13.1% 21.8% 32.3%EBITDA margin ‐13.6% 26.8% 44.5%Net margin ‐149.8% 3.7% 7.1%Current ratio (x) 0.13 0.22 0.29 Interest coverage (x) (4.87) 1.73 2.30 Debt to equity (x) 1.63 5.29 6.48 BVPS 0.95 0.98 1.08 10.7%ROE ‐10.2% 3.0% 9.9%

REFER TO DISCLOSURE SECTION AT THE END OF THE NOTES page 6 of 13
Figure 5: ITEL’s 1H16 operating results Source: Company data
Earnings to achieve a 77% CAGR during 2016‐18E We expect ITEL’s three‐year earnings to deliver a CAGR of 77%, from Bt30.7mn in 2015 to Bt170mn in 2018. Earnings growth drivers should include the expansion of all the core businesses. With over 60% of revenue being contributed by the network/data center rental businesses for which fixed costs are high, ITEL will benefit from economies of scale, boosting its gross profit margin from 29.4% in 2016 to 32.9% in 2018.
1) With the availability of ITEL’s fiber optic networks as well as its emphasis on service quality, the firm should be able to continue to expand the client base for its network rental service. We project revenue growth of 33% CAGR in the next three years, thanks largely to client base expansion. We expect the gross profit margin from this business to widen from 28.6% in 2015 to 37.9% in 2018, reaping the benefits from economies of scale.
2) Similar to the aforementioned network rental service, data center rental service is also expected to show the same growth direction. Utilization is expected to reach 95% in 2017 from 85% currently. This will result in revenue growth of 40% CAGR during 2016‐2018 before becoming more stable afterward (once full utilization is reached). The gross profit margin is expected to improve from 46.3% in 2015 to 37‐39% during 2016‐2018. Note that the extraordinarily high GPM in 2015 was due to the fact that the firm did not fully book depreciation costs arising from the renovation of buildings and infrastructure for one client that the firm began providing service for near the end of the year. Nevertheless, the contribution from this business will be able to increase through shared profit from the JV in the new data center. We estimate that ITEL will recognize shared profit of Bt7mn from its JV in 2017, the first year of operation.
3) Our conservative estimate calls for ITEL’s telecom network installation service to report revenue growth of 20% CAGR during 2016‐18E alongside the growth in the telecom industry, with an assumed gross profit margin of 17%‐18% in 2016‐2017 and 23% in 2018.
Profit and Loss Statement (Btmn)Fiscal Year‐Ended Dec. 2Q15 1Q16 2Q16 %QoQ %YoY 1H16 %YoY 2016ERevenue 79 160 194 21.3% 145.8% 354 100.6% 736 Gross profit 28 44 62 39.2% 120.1% 106 71.9% 217 SG&A 13 17 (20) ‐215.2% ‐249.5% (3) ‐110.1% 78 EBITDA 13 62 102 64.7% 661.3% 165 173.5% 288 Interest expense 10 13 13 ‐2.4% 31.2% 26 45.4% 57 Other income 0 0 1 259.2% 122.3% 1 ‐78.4% 4 Income tax 0 3 6 106.8% 1288.0% 9 57.6% 17 Net profit (loss) 2 12 24 108.2% 1248.7% 36 149.9% 68 Normalized profit (loss) 2 12 24 108.2% 1248.7% 36 149.9% 68 Reported EPS (Bt) 0.01 0.04 0.08 108.2% 1248.7% 0.12 149.9% 0.14
Gross margin 35.5% 27.7% 31.8% 30.0% 29.4%EBITDA margin 17.1% 38.9% 52.8% 46.6% 39.2%Net margin 2.3% 7.3% 12.5% 10.1% 9.3%Current ratio (x) 0.27 0.31 0.31 1.31 Interest coverage (x) 1.23 2.13 3.40 2.75 2.50 Debt to equity (x) ‐ 6.46 6.47 6.47 1.07 BVPS 1.03 1.12 1.20 17.9% 17.2% 1.20 17.2% 2.80 ROE 12.6% 18.8% 18.8% 7.9%

REFER TO DISCLOSURE SECTION AT THE END OF THE NOTES page 7 of 13
Figure 6: Earnings assumptions
Source: ITEL, KTZ Research
Figure 7: Operational summary
Source: ITEL, KTZ Research
2013 2014 2015 2016E 2017E 2018ERevenue from network rental 8 115 280 416 551 660 Revenue from turnkey projects 3 116 125 261 374 337 Revenue from data center ‐ 3 25 58 68 68 Total 11 234 430 736 993 1,066
%YoYRevenue from network rental 1387.1% 143.4% 48.6% 32.3% 19.9%Revenue from turnkey projects 3757.6% 7.9% 109.2% 42.9% ‐9.7%Revenue from data center 780.0% 134.9% 17.9% ‐0.2%Total 2075.4% 84.0% 71.2% 34.9% 7.4%
Revenue mixRevenue from network rental 72.1% 49.3% 65.2% 56.6% 55.5% 62.0%Revenue from turnkey projects 27.9% 49.5% 29.1% 35.5% 37.6% 31.6%Revenue from data center 0.0% 1.2% 5.7% 7.9% 6.9% 6.4%
GPM by businessRevenue from network rental ‐20.5% 17.6% 28.6% 31.3% 36.1% 37.9%Revenue from turnkey projects 2.6% 24.0% 18.2% 17.3% 24.0%Revenue from data center 23.8% 46.3% 36.9% 39.0% 38.9%Overall GPM 13.1% 21.8% 32.3% 29.4% 30.9% 32.9%
Revenue Structure
‐
200
400
600
800
1,000
1,200
2013 2014 2015 2016E 2017E 2018E
Network rental Network installation Data Center
Btmnmn
GPM by business
0.0%
10.0%
20.0%
30.0%
40.0%
50.0%
2014 2015 2016E 2017E 2018E
Network rental Network installation
Data Center Overall
REFER TO DISCLOSURE SECTION AT THE END OF THE NOTES page 8 of 13
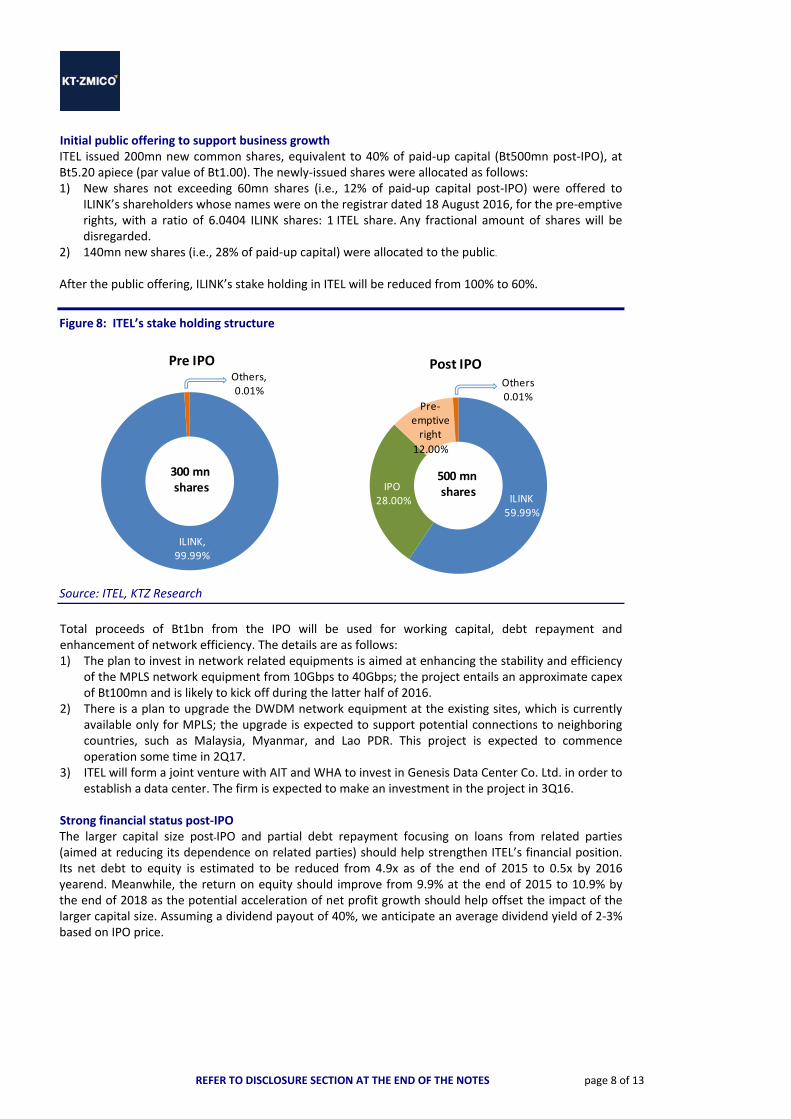
Initial public offering to support business growth ITEL issued 200mn new common shares, equivalent to 40% of paid‐up capital (Bt500mn post‐IPO), at Bt5.20 apiece (par value of Bt1.00). The newly‐issued shares were allocated as follows: 1) New shares not exceeding 60mn shares (i.e., 12% of paid‐up capital post‐IPO) were offered to
ILINK’s shareholders whose names were on the registrar dated 18 August 2016, for the pre‐emptive rights, with a ratio of 6.0404 ILINK shares: 1 ITEL share. Any fractional amount of shares will be disregarded.
2) 140mn new shares (i.e., 28% of paid‐up capital) were allocated to the public. After the public offering, ILINK’s stake holding in ITEL will be reduced from 100% to 60%.
Figure 8: ITEL’s stake holding structure
Source: ITEL, KTZ Research
Total proceeds of Bt1bn from the IPO will be used for working capital, debt repayment and enhancement of network efficiency. The details are as follows: 1) The plan to invest in network related equipments is aimed at enhancing the stability and efficiency
of the MPLS network equipment from 10Gbps to 40Gbps; the project entails an approximate capex of Bt100mn and is likely to kick off during the latter half of 2016.
2) There is a plan to upgrade the DWDM network equipment at the existing sites, which is currently available only for MPLS; the upgrade is expected to support potential connections to neighboring countries, such as Malaysia, Myanmar, and Lao PDR. This project is expected to commence operation some time in 2Q17.
3) ITEL will form a joint venture with AIT and WHA to invest in Genesis Data Center Co. Ltd. in order to establish a data center. The firm is expected to make an investment in the project in 3Q16.
Strong financial status post‐IPO The larger capital size post-IPO and partial debt repayment focusing on loans from related parties (aimed at reducing its dependence on related parties) should help strengthen ITEL’s financial position. Its net debt to equity is estimated to be reduced from 4.9x as of the end of 2015 to 0.5x by 2016 yearend. Meanwhile, the return on equity should improve from 9.9% at the end of 2015 to 10.9% by the end of 2018 as the potential acceleration of net profit growth should help offset the impact of the larger capital size. Assuming a dividend payout of 40%, we anticipate an average dividend yield of 2‐3% based on IPO price.
ILINK, 99.99%
Others, 0.01%
300 mnshares
Pre IPO
ILINK 59.99%
IPO28.00%
Pre‐emptive right
12.00%
Others 0.01%
Post IPO
500 mnshares
REFER TO DISCLOSURE SECTION AT THE END OF THE NOTES page 9 of 13
Risk factors Risks in regard to dependence on a key client ITEL earns revenue from a key client, which accounted for 32% and 44% of total revenue in 2015 and 1Q16, respectively. The heavy dependence on this particular client may imply that the firm will be at risk if the client reduces or cancels ITEL’s service. However, if ITEL is able to maintain its service quality and ability to solve any network problem in a prompt manner in order to minimize the damage that the client may encounter, the firm is very unlikely to lose this key client or other clients. Risks in regard to competition among telecom network service providers The capital‐intensive nature along with the great expertise required is a key barrier to entry into the telecom network service business. Hence, the market is dominated by a few players, which leads to a less intensely competitive environment. As ITEL has positioned itself as a neutral operator focusing only on high‐speed data service, the firm’s clients can be confident that ITEL will not act as a direct competitor providing internet service to end‐users. Risks in regard to telecom business license ITEL received a telecom business license (Type III) granted by the NBTC for a duration of 15 years ending 2027. The company is allowed to install its fiber optic networks along the rail lines belonging to the SRT for a lease duration of 30 years ending 2042. Hence, the firm is exposed to the risk of a failure to extend the telecom business license while the long‐term lease contract obligation with SRT continues. Provided that ITEL conducts its business in compliance with the NBTC’s regulations and under good corporate governance, we see no reason for the NBTC to refuse to grant a license extension to ITEL.
REFER TO DISCLOSURE SECTION AT THE END OF THE NOTES page 10 of 13
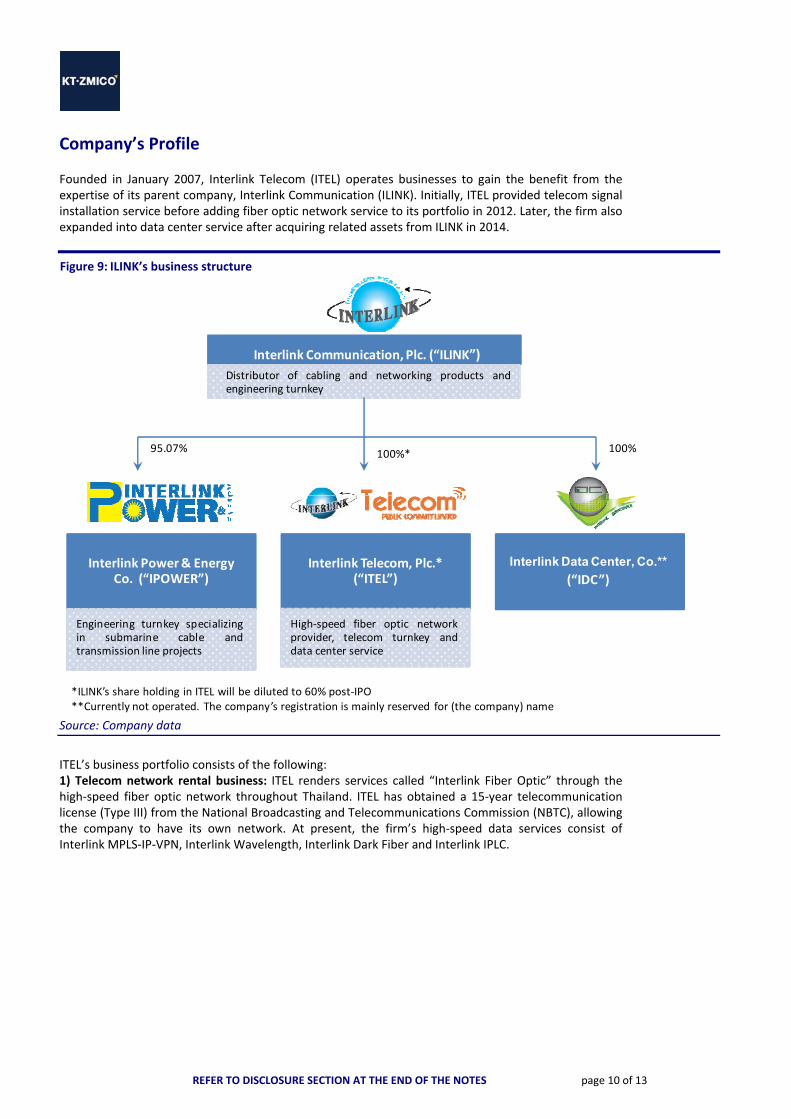
Company’s Profile Founded in January 2007, Interlink Telecom (ITEL) operates businesses to gain the benefit from the expertise of its parent company, Interlink Communication (ILINK). Initially, ITEL provided telecom signal installation service before adding fiber optic network service to its portfolio in 2012. Later, the firm also expanded into data center service after acquiring related assets from ILINK in 2014.
Figure 9: ILINK’s business structure
Source: Company data
ITEL’s business portfolio consists of the following: 1) Telecom network rental business: ITEL renders services called “Interlink Fiber Optic” through the high‐speed fiber optic network throughout Thailand. ITEL has obtained a 15‐year telecommunication license (Type III) from the National Broadcasting and Telecommunications Commission (NBTC), allowing the company to have its own network. At present, the firm’s high‐speed data services consist of Interlink MPLS‐IP‐VPN, Interlink Wavelength, Interlink Dark Fiber and Interlink IPLC.
Interlink Power & Energy Co. (“IPOWER”)
Engineering turnkey specializingin submarine cable andtransmission line projects
Interlink Telecom, Plc.* (“ITEL”)
High‐speed fiber optic network provider, telecom turnkey and data center service
Interlink Data Center, Co.** (“IDC”)
*ILINK’s share holding in ITEL will be diluted to 60% post‐IPO**Currently not operated. The company’s registration is mainly reserved for (the company) name
Interlink Communication, Plc. (“ILINK”)
Distributor of cabling and networking products and engineering turnkey
100%*95.07% 100%

REFER TO DISCLOSURE SECTION AT THE END OF THE NOTES page 11 of 13
Figure 10: ITEL’s high‐speed telecom network services
Source: Company data
Figure 11: Details on ITEL’s high‐speed telecom network services
Service Bandwidth Technology Usage Average
contract
duration
1. Interlink MPLS IP‐VPN 1Mbps – 10 Gbps MPLS &
DWDM
Connection among offices with more than
two branches
15 months
2. Interlink Wavelength 1 – 10Gbps DWDM Connection for big data communication
that requires bandwidth of 1Gbps upwards
12 months
3. Interlink Dark Fiber Unlimited ‐ High‐speed network pathway rental service
for users requiring big data connection;
already own equipment and prefer to
manage the network by themselves
18 months
4. Interlink IPLC 1Mbps – 10 Gbps MPLS &
DWDM
Connection with overseas networks 12 months
Source: Company data
2) Data center service: ITEL acquired the data center’s relevant assets from ILINK in 2014 to take advantage of its strength from the possession of its own networks. Its data center service is operated under the TIER 3 category, covering co‐location, virtual server and disaster recovery services. 3) Telecom network installation services: Utilizing its long experience and expertise in the telecom business, ITEL provides telecom network solution service, ranging from consultancy service, design, and installation of high‐speed telecom systems. The major client group for this service includes telecom service providers. To avoid conflicts of interest within the ILINK group, ITEL’s telecom engineering services are limited to fiber optic and telecom signal works only, with composite submarine cable works excluded. In the future, the firm will provide design, construction and solution services for data center projects.
Interlink Wavelength
Interlink MPLS IP‐VPN
Interlink Dark Fiber Interlink IPLC
high‐speed telecom network
services
REFER TO DISCLOSURE SECTION AT THE END OF THE NOTES page 12 of 13
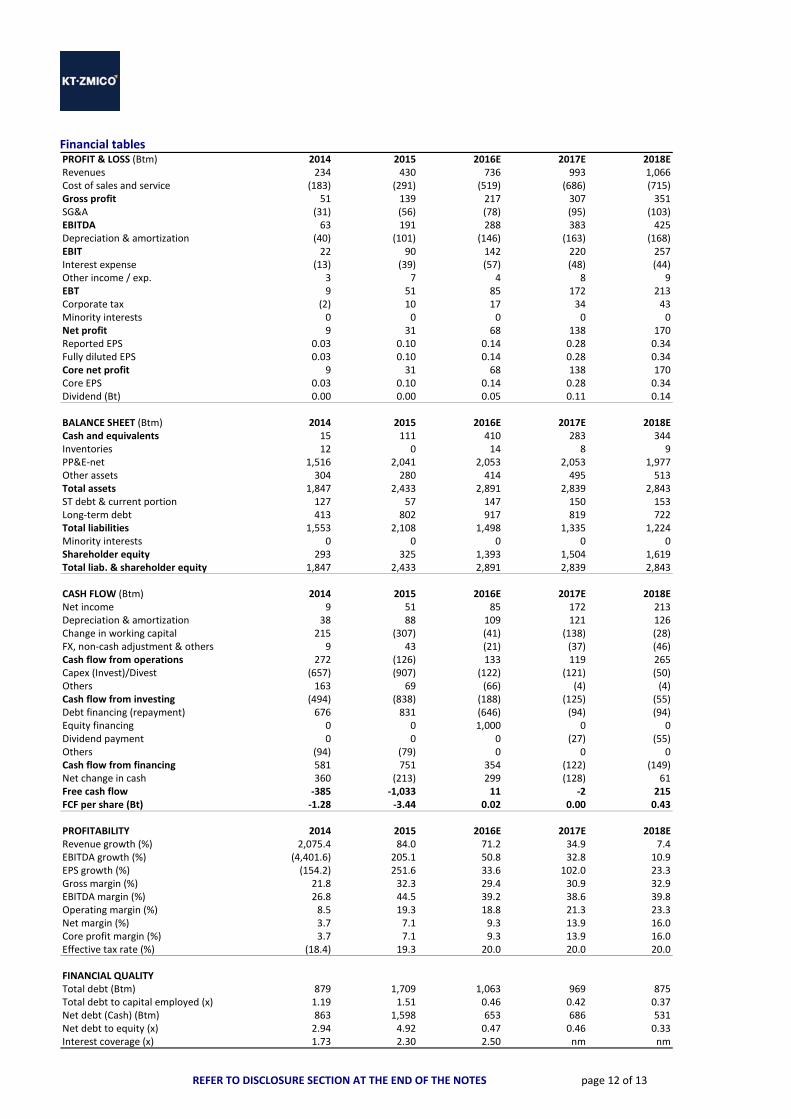
Financial tables PROFIT & LOSS (Btm) 2014 2015 2016E 2017E 2018ERevenues 234 430 736 993 1,066Cost of sales and service (183) (291) (519) (686) (715)Gross profit 51 139 217 307 351SG&A (31) (56) (78) (95) (103)EBITDA 63 191 288 383 425Depreciation & amortization (40) (101) (146) (163) (168)EBIT 22 90 142 220 257Interest expense (13) (39) (57) (48) (44)Other income / exp. 3 7 4 8 9EBT 9 51 85 172 213Corporate tax (2) 10 17 34 43Minority interests 0 0 0 0 0Net profit 9 31 68 138 170Reported EPS 0.03 0.10 0.14 0.28 0.34Fully diluted EPS 0.03 0.10 0.14 0.28 0.34Core net profit 9 31 68 138 170Core EPS 0.03 0.10 0.14 0.28 0.34Dividend (Bt) 0.00 0.00 0.05 0.11 0.14
BALANCE SHEET (Btm) 2014 2015 2016E 2017E 2018ECash and equivalents 15 111 410 283 344Inventories 12 0 14 8 9PP&E‐net 1,516 2,041 2,053 2,053 1,977Other assets 304 280 414 495 513Total assets 1,847 2,433 2,891 2,839 2,843ST debt & current portion 127 57 147 150 153Long‐term debt 413 802 917 819 722Total liabilities 1,553 2,108 1,498 1,335 1,224Minority interests 0 0 0 0 0Shareholder equity 293 325 1,393 1,504 1,619Total liab. & shareholder equity 1,847 2,433 2,891 2,839 2,843
CASH FLOW (Btm) 2014 2015 2016E 2017E 2018ENet income 9 51 85 172 213Depreciation & amortization 38 88 109 121 126Change in working capital 215 (307) (41) (138) (28)FX, non‐cash adjustment & others 9 43 (21) (37) (46)Cash flow from operations 272 (126) 133 119 265Capex (Invest)/Divest (657) (907) (122) (121) (50)Others 163 69 (66) (4) (4)Cash flow from investing (494) (838) (188) (125) (55)Debt financing (repayment) 676 831 (646) (94) (94)Equity financing 0 0 1,000 0 0Dividend payment 0 0 0 (27) (55)Others (94) (79) 0 0 0Cash flow from financing 581 751 354 (122) (149)Net change in cash 360 (213) 299 (128) 61Free cash flow ‐385 ‐1,033 11 ‐2 215FCF per share (Bt) ‐1.28 ‐3.44 0.02 0.00 0.43
PROFITABILITY 2014 2015 2016E 2017E 2018ERevenue growth (%) 2,075.4 84.0 71.2 34.9 7.4EBITDA growth (%) (4,401.6) 205.1 50.8 32.8 10.9EPS growth (%) (154.2) 251.6 33.6 102.0 23.3Gross margin (%) 21.8 32.3 29.4 30.9 32.9EBITDA margin (%) 26.8 44.5 39.2 38.6 39.8Operating margin (%) 8.5 19.3 18.8 21.3 23.3Net margin (%) 3.7 7.1 9.3 13.9 16.0Core profit margin (%) 3.7 7.1 9.3 13.9 16.0Effective tax rate (%) (18.4) 19.3 20.0 20.0 20.0
FINANCIAL QUALITYTotal debt (Btm) 879 1,709 1,063 969 875Total debt to capital employed (x) 1.19 1.51 0.46 0.42 0.37Net debt (Cash) (Btm) 863 1,598 653 686 531Net debt to equity (x) 2.94 4.92 0.47 0.46 0.33Interest coverage (x) 1.73 2.30 2.50 nm nm

REFER TO DISCLOSURE SECTION AT THE END OF THE NOTES page 13 of 13
Note: KT ZMICO has two major shareholders, Krungthai Bank PLC (KTB) and Seamico Securities PLC (ZMICO). Therefore,
prior to making investments in the securities of KTB and ZMICO, investors should consider the risk factors carefully.
An executive of KT ZMICO Securities is also a board member of BCP, BTC, CI, CPI, KBS, MAJOR, MK, PACE, PSL, SVH, VNG, ZMICO, SAWAD, TFG.
A management member of KT ZMICO Securities is also a board member of BTC and NFC. KT ZMICO is a financial advisor for U, LOXLEY, ZMICO, MAKRO, CPALL, SAFARI, PACE, TPOLY, M‐CHAI, EARTH, RML,
PF. KT ZMICO is a co‐underwriter of RJH, BCPG, ITEL.
Corporate Governance Report (CGR) Source: Sec, Thai Institute of Directors Association (IOD)
Excellent (scores: 90 ‐ 100) Satisfactory (scores: 60 – 69)
Very Good (scores: 80 – 89) Pass (scores: 50 – 59)
Good (scores: 70 – 79) No Logo N/A (scores: below 50) Anti‐corruption Progress Indicator
Source: Sec, Thailand's Private Sector Collective Action Coalition Against Corruption programme (Thai CAC) Level 1 (Committed) : Organization’s statement or board's resolution to work against corruption and to be in
compliance with all relevant laws.
Level 2 (Declared) : Public declaration statement to participate in Thailand's private sector Collective Action Coalition Against Corruption (CAC) or equivalent initiatives
Level 3 (Established) : Public out preventive measures, risk assessment, communication and training for all employees, including consistent monitoring and review processes
Level 4 (Certified) : Audit engagement by audit committee or auditors approved by the office of SEC, and receiving certification or assurance by independent external assurance providers (CAC etc.)
Level 5 (Extended) : Extension of the anti‐corruption policy to business partners in the supply chain, and disclosure of any current investigations, prosecutions or closed cases
Insufficient or not clearly defined policy
Data not available / no policy
DISCLAIMER
This document is produced using open sources believed to be reliable. However, their accuracy and completeness cannot be guaranteed. The statements and opinions herein were formed after due and careful consideration for use as information for the purposes of investment. The opinions contained herein are subject to change without notice. This document is not, and should not be construed as, an offer or the solicitation of an offer to buy or sell any securities. The use of any information contained in this document shall be at the sole discretion and risk of the user.
KT ZMICO RESEARCH – RECOMMENDATION DEFINITIONS
STOCK RECOMMENDATIONS SECTOR RECOMMENDATIONS BUY: Expecting positive total returns of 15% or more over the next 12 months OUTPERFORM: Expecting total returns between ‐10% to +15%; returns expected to exceed market returns over a six‐month period due to specific catalysts UNDERPERFORM: Expecting total returns between ‐10% to +15%; returns expected to be below market returns over a six‐month period due to specific catalysts SELL: Expecting negative total returns of 10% or more over the next 12 months
OVERWEIGHT: The industry, as defined by the analyst's coverage universe, is expected to outperform the relevant primary market index by at least 10% over the next 12 months.
NEUTRAL: The industry, as defined by the analyst's coverage universe, is expected to perform in line with the relevant primary market index over the next 12 months.
UNDERWEIGHT: The industry, as defined by the analyst's coverage universe, is expected to underperform the relevant primary market index by 10% over the next 12 months.

KT•ZMICO Securities Company Limited 8th, 15th-17th, 19th, 21st Floor, Liberty Square Bldg., 287 Silom Road, Bangrak, Bangkok 10500
Telephone: (66-2) 695-5000 Fax. (66-2) 631-1709
Phaholyothin Branch 3rd Floor, Shinnawatra Tower II,
1291/1 Phaholyothin Road, Phayathai, Bangkok 10400 Telephone: (66-2) 686-1500
Fax. (66-2) 686-1666
Ploenchit Branch 8th Floor, Ton Son Tower,
900 Ploenchit Road, Lumpini, Pathumwan, Bangkok 10330 Telephone: (66-2) 626-6000
Fax. (66-2) 626-6111
Sindhorn Branch 2nd Floor, Sindhorn Tower 1, 130-132
Wireless Road, Lumpini, Pathumwan, Bangkok 10330 Telephone: (66-2) 627-3550
Fax. (66-2) 627-3582, 627-3600
Viphavadee Branch G Floor, Lao Peng Nguan 1 Bldg.,
333 Soi Cheypuand, Viphavadee-Rangsit Road, Ladyao, Jatujak, Bangkok 10900
Telephone: (66-2) 618-8500 Fax. (66-2) 618-8569
Chachoengsao Branch 108/34-36 Mahajakkrapad Road,
T.Namuang, A.Muang, Chachoengsao 24000
Telephone: (038) 813-088 Fax. (038) 813-099
Chonburi Branch 4th Floor, Forum Plaza Bldg.,
870/52 Sukhumvit Road, T. Bangplasoy, A. Muang, Cholburi 20000 Telephone: (038) 287-635
Fax. (038) 287-637
Pattaya Branch 382/6-8 Moo 9, T. NongPrue,
A. Banglamung, Cholburi 20260 Telephone: (038) 362-420-9
Fax. (038) 362-430
Khon Kaen Branch 5th Floor, Charoen Thani Princess Hotel,
260 Srichan Road, T. Naimuang, A. Muang, Khon Kaen 40000
Telephone: (043) 389-171-193 Fax. (043) 389-209
Sriworajak Building Branch1st – 2nd Floor, Sriworajak Building, 222
Luang Road, Pomprab, Bankgok 10100
Telephone: (02) 689-3100 Fax. (02) 689-3199
Central World Branch 999/9 The Offices at Central World, 16th Fl., Rama 1 Rd, Pathumwan,
Bangkok 10330 Telephone: (66-2) 673-5000,
(66-2) 264-5888 Fax. (66-2) 264-5899
Chiang Mai Branch 422/49 Changklan Road, Changklan
Subdistrict, Amphoe Meuang, Chiang Mai 50100
Telephone: (053) 270-072 Fax: (053) 272-618
Phuket Branch 22/61-63, Luang Por Wat Chalong Road,
Talat Yai, Mueang Phuket, Phuket 83000
Tel. (076) 222-811,(076) 222-683 Fax. (076) 222-861
Pak Chong Branch 173 175, Mittapap Road, Nong Sarai, Pak Chong,
Nakhon Ratchasima 30130 Tel. (044) 279-511 Fax. (044) 279-574
Hat Yai Branch 200/301 Juldis Hatyai Plaza Floor 3,
Niphat-Uthit 3 Rd, Hatyai Songkhla 90110
Telephone: (074) 355-530-3 Fax: (074) 355-534
Phitsanulok Branch Krung Thai Bank, Singhawat Branch
114 Singhawat Road, Muang, Phitsanulok 65000 Telephone: 083-490-2873
Information herein was obtained from sources believed to be reliable, but its completeness and accuracy are not guaranteed. All opinions expressed constitute our
views on that date and are not intended as an offer or solicitation to sell or buy any securities. Investors should exercise care when making a decision to invest in
securities. No one may modify or distribute any part of this report unless written permission is first received from Seamico Securities Plc. If any modifications are
made, quotes or references taken from the report and the report date must be clearly mentioned and must not cause misunderstanding or damage to the company.
Bangkhae Branch 6th Floor The Mall Group Building Bangkhae
275 Moo 1 Petchkasem Road, North Bangkhae, Bangkhae, Bangkok 10160
Tel. (66-2) 454-9979 Fax. (66-2) 454-9970
Nakhon Ratchasima Branch 624/9 Changphuek Road, .
Naimaung, A.Maung, Nakhon Ratchasima 30000 Telephone: (044) 247222
Fax: (044) 247171
Cyber Branch @ North Nana Krung Thai Bank PCL, 2 Floor,
North Nana Branch 35 Sukhumvit Rd.,Klong Toey Nua
Subdistrict , Wattana District, Bangkok 10110
Telephone: 083-490-2871
Nakhon Pathom Branch1156 Petchakasem Road, Sanamchan Subdistrict,
Amphoe Meuang , Nakhon Pathom Province 73000
Telephone: (034) 271300 Fax: (034) 271300 #100