Embed Size (px)
Citation preview

ISSN 1906 - 4063
International Journal ofApplied Biomedical Engineering
Vol. 2, No. 1, January-June 2009
Editorial Board …………………………………………………………………………… ii
Message from the Editor-in-chief ………………………………………… C. Pintavirooj iii
Message from the Guest Editor ………………………………………… S. Choomchuay iv _______________________________________________________________________
INVITED PAPERS Biohybrid Visual Prosthesis for Restoring Blindness ………………………………………………………………………………………………… T. Yagi 1 2D Affine Invariant Fiducial Points and Affine Absolute Invariants for Shape Matching under Affine and Weak Perspective Transformations ……………………………………………… Fernand S. Cohen and C. Pintavirooj 6 _______________________________________________________________________________
REGULAR PAPERS Photoacoustic Generation Mechanisms and Measurement Systems for Biomedical Applications (Reviewed Paper) …………………………………………….……..……………………………………… S. Boonsang 17
Lipoprotein Sensor: A Piezoelectric Quartz Crystal Device (Reviewed Paper) ……………………………………………………… S. Chunta, C. Cherdchu, and C. Promptmas 24
Finite Element Analyses for a Study of Hepatic Cancer Tissue Destruction using Monopolar and Bipolar Radio-Frequency Ablation …………………………..……………………………………………………… S. Tangjitkusolmun 33
Directivity Pattern Measurement of Ultrasound Transducers ……………………………………………………………………………………………… S. Umchid 39
A Wavelet-based Factor for Classification of Heart Sounds with Mitral Regurgitation …………………………………………….……. C. Bunluechokchai and W. Ussawawongaraya 44
Reliability of the Universal and Invented Gravity Goniometers in Measuring Active Cervical Range of Motion in Normal Healthy Subject ………………………………………………………………………..… A. Yankai and P. Manosan 49
Medical Knowledge-Based System for Diagnosis from Symptoms and Signs …………………………..…………………………….. W. Wiriyasuttiwong and W. Narkbuakaew 54
Coordination Model for Medical Diagnosis ………………………………………………………………………..….. A. Aguilera and A. Subero 60
Computer-Aided System for Microscopic Images: Application to Breast Cancer Nuclei Counting ……………………………..….. P. Phukpattaranont, S. Limsiroratana, and P. Boonyaphiphat 69 _______________________________________________________________________________
Manuscript Submission Guideline _______________________________________________________________________________
http://www.ijabme.org

COPYRIGHT Thai Biomedical Engineering Society (ThaiBME) International Journal of Applied Biomedical Engineering (IJABME)

ii International Journal of Applied Biomedical Engineering, Vol.2, No. 1 2009
International Journal of Applied Biomedical Engineering (IJABME) Vol. 2, No. 1 (January - June 2009) Editor in Chief:
Chuchart Pintavirooj, King Mongkut’sInstitute of Technology Ladkrabang (KMITL)
Associate Editors: Somsak Choomchuay King Mongkut’sInstitute of Technology Ladkrabang (KMITL) Supaporn Kiattisin University of the Thai Chamber of Commerce (UTCC) Supareak Janjarasjitt Ubonratchathani University (UBU) Supan Tungjitkusolmun King Mongkut’s Institute of Technology Ladkrabang (KMITL)
Editorial Board: 1. Somkiat Wattanasirichaigoon SWU, Thailand 2. Tohru Yagi TIT, Japan 3. John G. Webster Univ. of Wisconcin, USA 4. Ratko Magjarevic IFMBE, Croatia 5. Tsuyoshi Shiina Univ. of Tsukuba, Japan 6. Fernand S. Cohen Drexel U., USA 7. Manus Sanworasil KMITL, Thailand 8. Chusak Limsakul PSU, Thailand
Board of Reviewers: 1. Kazuhiko Hamamoto Tokai Univ., Japan 2. Kosin Chamnongthai KMUTT, Thailand 3. James Goh NUS, Singapore 4. Ian Thomas KKU, Thailand 5. Takafumi Suzuki U. of Tokyo, Japan 6. Kochi Ito Chiba Univ., Japan 8. Shozo Kondo Tokai Univ., Japan 9. Vitoon Leelamanit PSU, Thailand 10.Suradej Tritriluxana KMITL, Thailand 11. Willis J. Tompkins Univ. of Wisconcin, USA 12. Olivier Adam France 13. Adisorn Leelasanthitum UTCC, Thailand 14. Arthorn Sanpanich MU, Thailand 15. Chissanuthat Bunluechokchai KMUTNB, Thailand 16. Mana Sriyudthasak CU, Thailand 17. Sinchai Kamolpivong PSU, Thailand 18. Siridech Boonsang KMITL, Thailand 19. Nuttaporn Pimpha NanoTEC, Thailand 20. Pasin Israsena NECTEC, Thailand 21. Patamaporn Sripadungtham Thailand 22. Phensri thongnopnua CU, Thailand 23. Pornchai Phukpattaranont PSU, Thailand 24. Thurdsak Leuwhathong KMITL, Thailand 25. Saowapak Sotthivirat NECTEC, Thailand 26. Supot Sookpotharom Bangkok Univ., Thailand 27. Warakorn Charoensuk MU, Thailand 28. Watcharachai Wiriyasuttiwong SWU, Thailand 29. Surapan Airphaiboon KMITL, Thailand 30. Wongwit Senawong SWU, Thailand

International Journal of Applied Biomedical Engineering, Vol.2, No. 1 2009 iii
Message from the Editor-in-Chief
Following the successful inauguration of the International Journal of Applied Biomedical Engineering (IJABME), I am pleased to present the subsequent issue of the journal that integrate the engineering sciences with the biomedical sciences and clinical practice. This integration provides unique opportunities for the application of science and technology to the problems of healthcare and biology. The International Journal of Applied Biomedical Engineering (IJABME) is an international published as an official journal of the Thai Biomedical Engineering Research Association providing an opportunity for researchers, academics or practitioners interested in biomedical engineering to present their problems, exchange their ideas and discuss open issues and future directions. The focus of this track is signal processing, image processing, biomedical computing, and health care technology. I extend our grateful thanks to Assoc. Prof. Dr.Somsak Choomchuay, King Mongkut Institute of Technology Ladkrabang, for organizing this special issue of the IJABME. I also express my appreciation to the staff for their effort. We will keep improving the IJABME to a high-quality and well-recognized international journal.
Chuchart Pintavirooj, Ph.D. Department of Electronics Faculty of Engineering King Mongkut's Institute of Technology Ladkrabang, Thailand. E-mail: [email protected]
Chuchart Pintavirooj was born in Bangkok, Thailand in 1962. He received the B. Sc. (Radiation Techniques) and M.Sc. (Biomedical Instrumentation) from Mahidol University, Bangkok, Thailand in 1985 and 1989 respectively. In 1995, he received another master degree in Biomedical Engineering from Worcester Polytechnic Institute, MA, USA. In 2000, he earned a Ph. D. in Biomedical Engineering from Drexel University, Philadelphia, PA. After working as a research scientist at Biomedical Instrumentation Department, Mahidol University, he joined Electronic Department, Faculty of Engineering, King Mongkut’s Institute of Technology at Ladkrabang, Bangkok where he is currently an associate professor. His current research is in Biomedical Image/ Signal Processing majoring in Image reconstruction, Image Classification and Image restoration.
Dr. Pintavirooj is the acting chairman of Biomedical Engineering Society of Thailand affiliated with IFBME.
iv International Journal of Applied Biomedical Engineering, Vol.2, No. 1 2009
Message from the Guest Editor
he International Journal on Applied Biomedical Engineering (IJABME) is published bi-annually by Thai Biomedical Engineering Research Association (ThaiBME); January-June issue and July-December issue. In your hands is the second issue of its kind. This is Number 1 of Volume 2. In this issue, a number of papers were extended from the selected works present in BMEiCON/ISBME2008 held in August 2008, Bangkok.
The issue also still keeps a balance with invited papers and regular submitted papers.
As always highlighted, the major objective of the journal is to provide an effective communication channel for researchers concerned with all aspects of biomedical engineering. It is focused on bridging the gap between clinical medicine and applied medical science and technology. With such regards, the IJABME, therefore, intends to provide an international forum where researchers, practitioners, and professionals interested in the advances in, and applications of, biomedical engineering can exchange the latest research, results, and ideas in such areas. Obviously, the put forward argument is sensible since biomedical engineering is a multi-disciplinary field that is helping to advance fundamental concepts, create new knowledge, provide a more comprehensive understanding of complex living systems, and develop innovative devices, tools and techniques for the prevention, diagnosis and treatment of disease, for rehabilitation, and for improving health and quality of life.
It is my honor to serve IJABME as a guest editor of this issue. I do appreciate the contributions of all authors who have tried their best in expressing their works through the written languages. I also would like to thank the referees who have not only carefully reviewed the manuscript but also did provide many constructive feedback. These are of importance and helpful in leveling up the journal standard.
(Somsak Choomchuay)
Somsak Choomchuay, (Ph.D., DIC.): born in Phattalung, Thailand, July 1959. He receieved both B.Eng. and M.Eng. in Electrical Engineering from King Mongkut’s Institute of Technology Ladkrabang (KMITL), Bangkok in 1982 and 1986 respectively. He obtained Ph.D. and DIC. in Electrical Engineering (Signal Processing) form Imperial College, University of London, U.K., in 1994. Since then, he joined the Faculty of Engineering, KMITL where he is currently an associate professor.
Dr.Somsak Choomchuay also has intensively involved both administrative work and research work since 1994. He had serviced KMITL by taking the post of vice dean (academic affairs) of School of Graduate Studies during 1995 to 1999. He had been the associate director of ReCCIT (Research Center for Communication and Information Technology) during 1999 to 2002. He also has involved in JICA’s project in Lao PDR as a Third Country Expert (as a project coordinator and research advisor) for more than ten times during 1999 to 2007.
Since 1995, Dr.Somsak has published 2 textbooks (Electronic engineering, and Signal processing) and more than 50 research works in international forums (transactions and proceedings). He was the editor-in-chief of Ladkrabang Engineering Journal and was an associate editor of ECTI-EEC journal. He also has been a committee member, steering member, organizer and an initiator of many international conferences, such as ISCIT, ECTI-CON, ISBME, BMEiCON and JICT.
TT
INTERNATIONAL JOURNAL OF APPLIED BIOMEDICAL ENGINEERING VOL.2, NO.1 2009 1
Biohybrid Visual Prosthesis for RestoringBlindness
Tohru Yagi,
ABSTRACT
A visual prosthesis is an artificial organ to re-store vision in blind patients by applying electri-cal stimulation to the visual nervous system. Foryears, our research group has been studying “bio-hybrid” visual prosthesis, which combine the char-acteristics of regenerative medicine and visual pros-theses. Since the mid-90’s, our group has conductedbasic research and system design and integration on abiohybrid visual prosthesis, that combines microelec-tromechanical system (MEMS) technology and regen-erative medicine. In this implant, the axons of neu-rons cultured on the MEMS are guided toward thecentral nervous system (CNS) by a peripheral nervegraft. Because cultured neurons form functional con-nections between the MEMS and the CNS, electri-cal stimulation causes the cultured neurons in thebiohybrid visual prosthesis to send visual informa-tion to the CNS. Our recent research has includedthe development of various micro/nanoelectrode ar-rays using MEMS technology including a conductivepolymer micro/nanoelectrode array, in vitro nervecell culture and axon guidance experiments on thefabricated micro/nanoelectrode array, in vivo electri-cal stimulation experiments, and various computersimulations including the psychophysical evaluationof reading ability with a visual prosthesis simulator.Our first prototype consists of an external and an in-ternal device. In operation, visual information is cap-tured by a video camera in the external device. Afterencoding, this information is then sent to the internaldevice through an infrared (IR) communication unit.After the internal device receives the IR data, it gen-erates appropriate electric pulses for stimulating thecultured neurons.
Keywords: Visual Prosthesis; Biohybrid; Regenera-tive Medicine; MEMS; Blindness
1. INTRODUCTION
The sense of sight is important not only to see ob-jects but also for perceiving light and darkness so thatour internal biological clock works normally. There-fore, loss of sight can lead to autonomic imbalance.The development of effective treatments for blindness
Manuscript received on July 9, 2009.,T. Yagi, Tokyo Institute of Technology, 152-8552 Tokyo,
Japan Telephone & Fax: +81-3-5734-3628E-mail addresses: [email protected]
is urgently needed; however, the prospects for suchtreatments have not yet been established.
This situation leads to the research and devel-opment of visual prostheses. For more than thirtyyears, it has been known that electrical stimulationevokes light perception, called phosphene [1]. A vi-sual prosthesis is developed based on this principle.While there are slight differences between researchgroups, a visual prosthesis should essentially restorethe lost sense of sight by applying electrical stimula-tion to the visual nervous system [2][3]. It stimulatesthe primary visual cortex or nerves in the pathwayfrom the retina to the primary visual cortex, throughan electrode array of the MEMS implanted in thebody. Groups in the US, Germany and Belgium havealready successfully undertaken clinical experimentson volunteer blind patients to temporarily restorephosphene perception and simple-shape recognitionfunction. Hence, the electrical stimulation of visualnervous systems is effective in restoring visual sensa-tion.
2. BIOHYBRID VISUAL PROSTHESIS
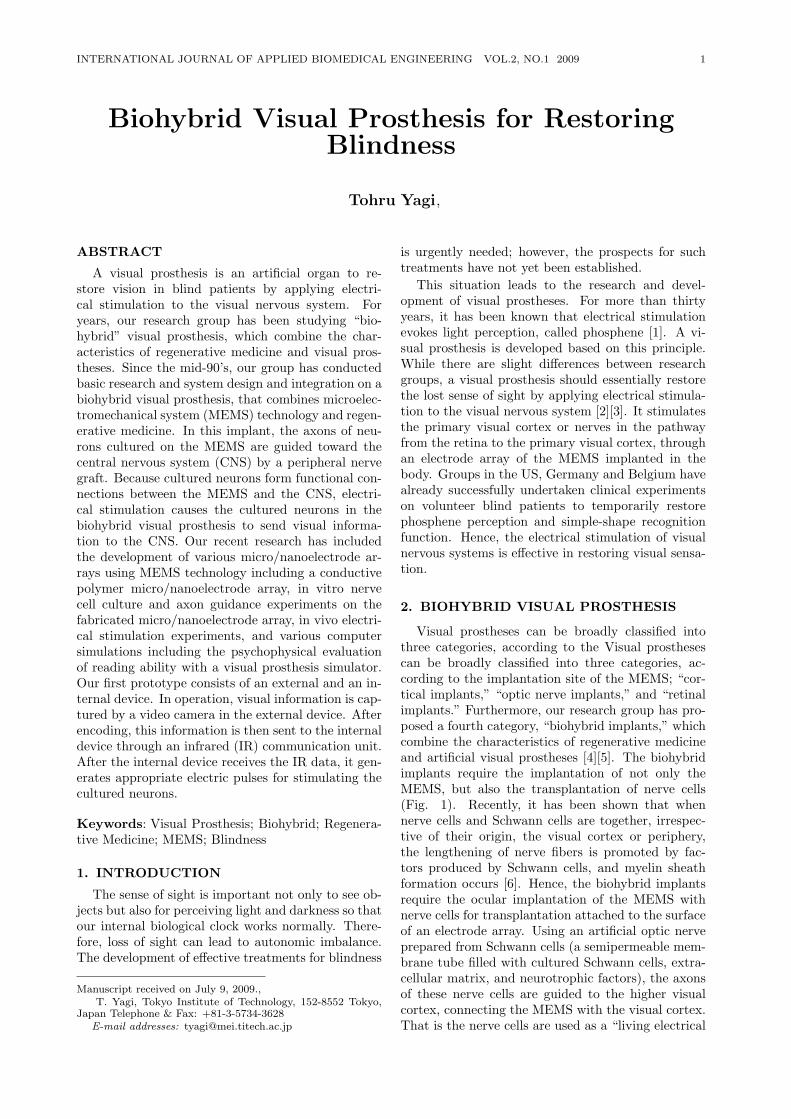
Visual prostheses can be broadly classified intothree categories, according to the Visual prosthesescan be broadly classified into three categories, ac-cording to the implantation site of the MEMS; “cor-tical implants,” “optic nerve implants,” and “retinalimplants.” Furthermore, our research group has pro-posed a fourth category, “biohybrid implants,” whichcombine the characteristics of regenerative medicineand artificial visual prostheses [4][5]. The biohybridimplants require the implantation of not only theMEMS, but also the transplantation of nerve cells(Fig. 1). Recently, it has been shown that whennerve cells and Schwann cells are together, irrespec-tive of their origin, the visual cortex or periphery,the lengthening of nerve fibers is promoted by fac-tors produced by Schwann cells, and myelin sheathformation occurs [6]. Hence, the biohybrid implantsrequire the ocular implantation of the MEMS withnerve cells for transplantation attached to the surfaceof an electrode array. Using an artificial optic nerveprepared from Schwann cells (a semipermeable mem-brane tube filled with cultured Schwann cells, extra-cellular matrix, and neurotrophic factors), the axonsof these nerve cells are guided to the higher visualcortex, connecting the MEMS with the visual cortex.That is the nerve cells are used as a “living electrical
2 T. Yagi: Biohybrid Visual Prosthesis for Restoring Blindness (1-5)
cable.” Once the connection is complete, it is con-sidered that nerve cells transmit signals to the visualcortex in response to electrical pulses provided by theelectrode array. Because nerve cells are transplantedas part of the process of fitting this visual prosthesis,a biohybrid implant is appropriate for blind patientswhose optic nerves and/or retinal ganglion cells areNOT intact such as glaucoma and diabetic retinopa-thy patients.
Fig.1: Biohybrid visual prosthesis.
Although biohybrid implants have advantages,there are many challenges related to nerve cell trans-plantation. Even if the axons of nerve cells canbe guided to the visual cortex, unless a connectionis formed between the neurons of the visual cortexand synapses, and a functional connection achievedvia neurotransmitters, the signals cannot be com-municated. That is the fundamental challenge forthis prosthesis is the reliable reconstruction of signaltransmission function between an artificial device andtransplanted nerve cells, and between transplantednerve cells and the visual cortex. For years, our re-search group has conducted basic research and systemdesign/integration. The following are a brief sum-mary of our recent achievements.
3. DEVELOPMENT OF EXTERNAL ANDINTERNAL DEVICE
We have developed various types of stimulationelectrode array so far. They are i) platinum elec-trodes on a polyimide base film, ii) platinum wireelectrodes coated with epoxy, and iii) gold electrodeson a silicon wafer. It is easy to fabricate this type ofelectrode array by conventional batch-fabricated pro-cesses [7]. Fabrication begins using a silicon wafer ofstandard thickness. The wafer is first oxidized to athickness of 1 micrometer. Over the oxidized silicon,aluminum conductors are next deposited to a thick-ness of 0.3 micrometers by physical vapor deposition(PVD), and then patterned by etching. Next, theentire wafer surface is covered with 1.0-micrometer-thick layer of silicon nitride for insulation, by plasmachemical vapor deposition (plasma-CVD). To openstimulating sites and bonding areas, reactive ion etch-ing (RIE) is carried out to remove silicon nitride from
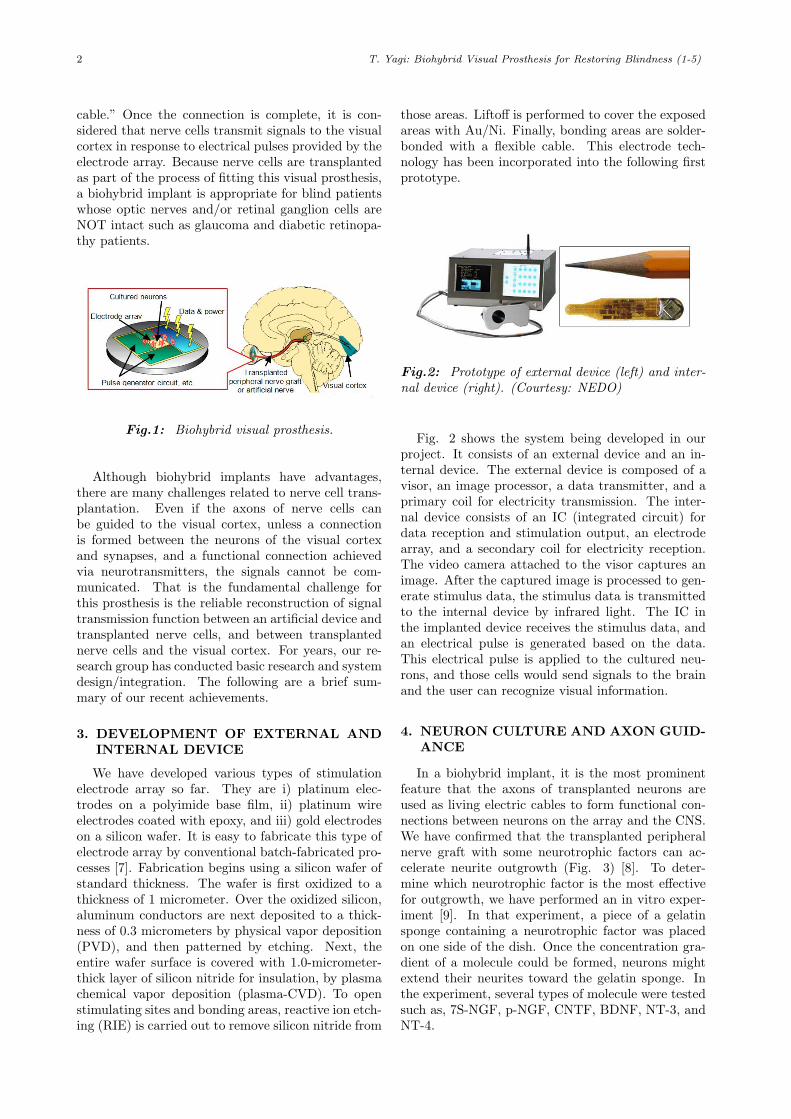
those areas. Liftoff is performed to cover the exposedareas with Au/Ni. Finally, bonding areas are solder-bonded with a flexible cable. This electrode tech-nology has been incorporated into the following firstprototype.
Fig.2: Prototype of external device (left) and inter-nal device (right). (Courtesy: NEDO)
Fig. 2 shows the system being developed in ourproject. It consists of an external device and an in-ternal device. The external device is composed of avisor, an image processor, a data transmitter, and aprimary coil for electricity transmission. The inter-nal device consists of an IC (integrated circuit) fordata reception and stimulation output, an electrodearray, and a secondary coil for electricity reception.The video camera attached to the visor captures animage. After the captured image is processed to gen-erate stimulus data, the stimulus data is transmittedto the internal device by infrared light. The IC inthe implanted device receives the stimulus data, andan electrical pulse is generated based on the data.This electrical pulse is applied to the cultured neu-rons, and those cells would send signals to the brainand the user can recognize visual information.
4. NEURON CULTURE AND AXON GUID-ANCE
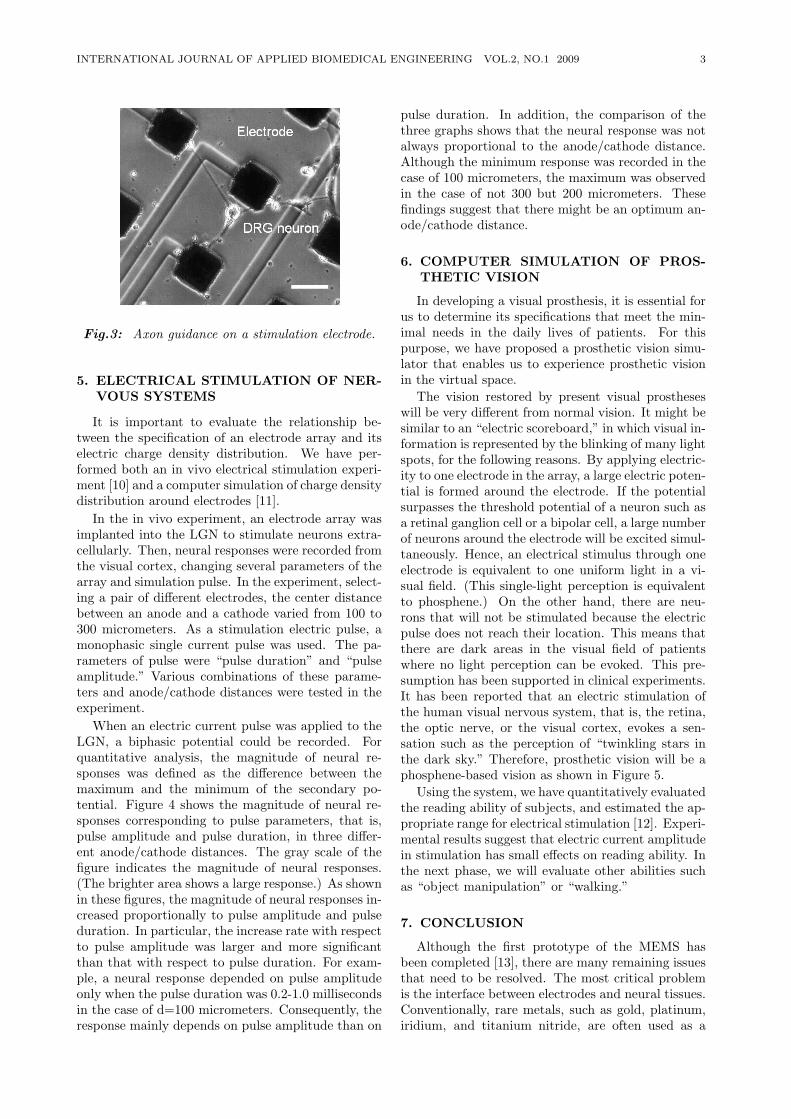
In a biohybrid implant, it is the most prominentfeature that the axons of transplanted neurons areused as living electric cables to form functional con-nections between neurons on the array and the CNS.We have confirmed that the transplanted peripheralnerve graft with some neurotrophic factors can ac-celerate neurite outgrowth (Fig. 3) [8]. To deter-mine which neurotrophic factor is the most effectivefor outgrowth, we have performed an in vitro exper-iment [9]. In that experiment, a piece of a gelatinsponge containing a neurotrophic factor was placedon one side of the dish. Once the concentration gra-dient of a molecule could be formed, neurons mightextend their neurites toward the gelatin sponge. Inthe experiment, several types of molecule were testedsuch as, 7S-NGF, p-NGF, CNTF, BDNF, NT-3, andNT-4.
INTERNATIONAL JOURNAL OF APPLIED BIOMEDICAL ENGINEERING VOL.2, NO.1 2009 3
Fig.3: Axon guidance on a stimulation electrode.
5. ELECTRICAL STIMULATION OF NER-VOUS SYSTEMS
It is important to evaluate the relationship be-tween the specification of an electrode array and itselectric charge density distribution. We have per-formed both an in vivo electrical stimulation experi-ment [10] and a computer simulation of charge densitydistribution around electrodes [11].
In the in vivo experiment, an electrode array wasimplanted into the LGN to stimulate neurons extra-cellularly. Then, neural responses were recorded fromthe visual cortex, changing several parameters of thearray and simulation pulse. In the experiment, select-ing a pair of different electrodes, the center distancebetween an anode and a cathode varied from 100 to300 micrometers. As a stimulation electric pulse, amonophasic single current pulse was used. The pa-rameters of pulse were “pulse duration” and “pulseamplitude.” Various combinations of these parame-ters and anode/cathode distances were tested in theexperiment.
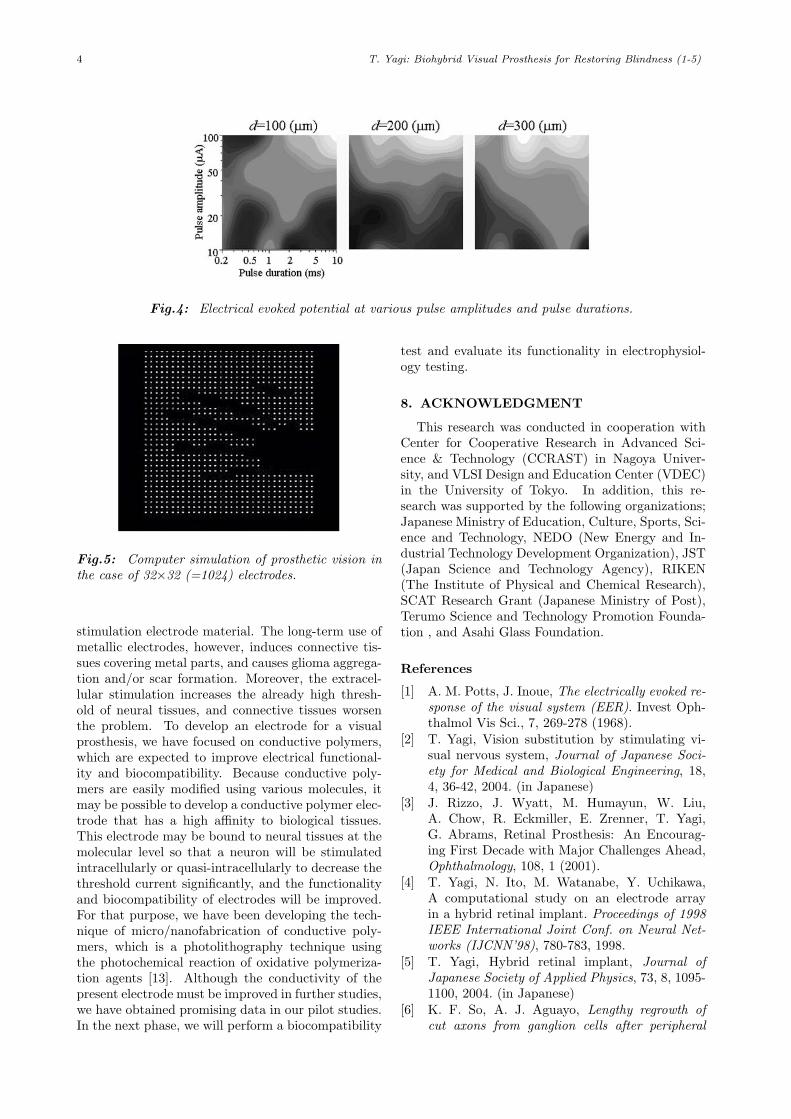
When an electric current pulse was applied to theLGN, a biphasic potential could be recorded. Forquantitative analysis, the magnitude of neural re-sponses was defined as the difference between themaximum and the minimum of the secondary po-tential. Figure 4 shows the magnitude of neural re-sponses corresponding to pulse parameters, that is,pulse amplitude and pulse duration, in three differ-ent anode/cathode distances. The gray scale of thefigure indicates the magnitude of neural responses.(The brighter area shows a large response.) As shownin these figures, the magnitude of neural responses in-creased proportionally to pulse amplitude and pulseduration. In particular, the increase rate with respectto pulse amplitude was larger and more significantthan that with respect to pulse duration. For exam-ple, a neural response depended on pulse amplitudeonly when the pulse duration was 0.2-1.0 millisecondsin the case of d=100 micrometers. Consequently, theresponse mainly depends on pulse amplitude than on
pulse duration. In addition, the comparison of thethree graphs shows that the neural response was notalways proportional to the anode/cathode distance.Although the minimum response was recorded in thecase of 100 micrometers, the maximum was observedin the case of not 300 but 200 micrometers. Thesefindings suggest that there might be an optimum an-ode/cathode distance.
6. COMPUTER SIMULATION OF PROS-THETIC VISION
In developing a visual prosthesis, it is essential forus to determine its specifications that meet the min-imal needs in the daily lives of patients. For thispurpose, we have proposed a prosthetic vision simu-lator that enables us to experience prosthetic visionin the virtual space.
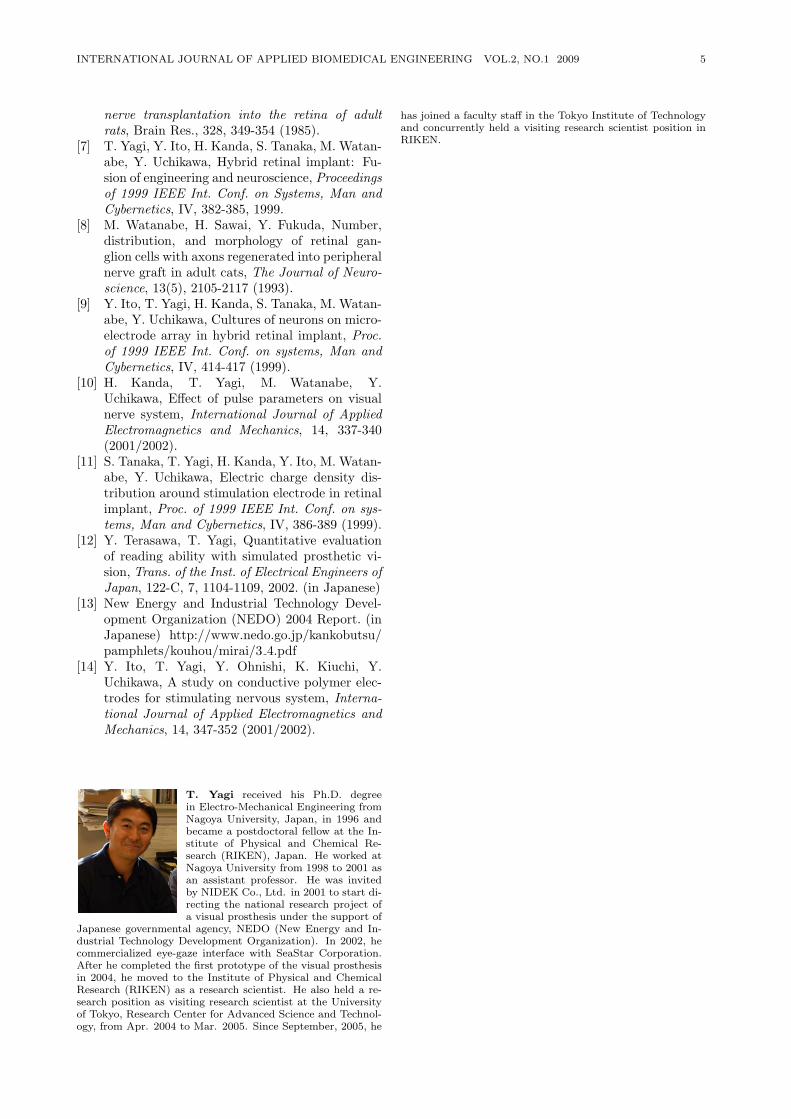
The vision restored by present visual prostheseswill be very different from normal vision. It might besimilar to an “electric scoreboard,” in which visual in-formation is represented by the blinking of many lightspots, for the following reasons. By applying electric-ity to one electrode in the array, a large electric poten-tial is formed around the electrode. If the potentialsurpasses the threshold potential of a neuron such asa retinal ganglion cell or a bipolar cell, a large numberof neurons around the electrode will be excited simul-taneously. Hence, an electrical stimulus through oneelectrode is equivalent to one uniform light in a vi-sual field. (This single-light perception is equivalentto phosphene.) On the other hand, there are neu-rons that will not be stimulated because the electricpulse does not reach their location. This means thatthere are dark areas in the visual field of patientswhere no light perception can be evoked. This pre-sumption has been supported in clinical experiments.It has been reported that an electric stimulation ofthe human visual nervous system, that is, the retina,the optic nerve, or the visual cortex, evokes a sen-sation such as the perception of “twinkling stars inthe dark sky.” Therefore, prosthetic vision will be aphosphene-based vision as shown in Figure 5.
Using the system, we have quantitatively evaluatedthe reading ability of subjects, and estimated the ap-propriate range for electrical stimulation [12]. Experi-mental results suggest that electric current amplitudein stimulation has small effects on reading ability. Inthe next phase, we will evaluate other abilities suchas “object manipulation” or “walking.”
7. CONCLUSION
Although the first prototype of the MEMS hasbeen completed [13], there are many remaining issuesthat need to be resolved. The most critical problemis the interface between electrodes and neural tissues.Conventionally, rare metals, such as gold, platinum,iridium, and titanium nitride, are often used as a
4 T. Yagi: Biohybrid Visual Prosthesis for Restoring Blindness (1-5)
Fig.4: Electrical evoked potential at various pulse amplitudes and pulse durations.
Fig.5: Computer simulation of prosthetic vision inthe case of 32×32 (=1024) electrodes.
stimulation electrode material. The long-term use ofmetallic electrodes, however, induces connective tis-sues covering metal parts, and causes glioma aggrega-tion and/or scar formation. Moreover, the extracel-lular stimulation increases the already high thresh-old of neural tissues, and connective tissues worsenthe problem. To develop an electrode for a visualprosthesis, we have focused on conductive polymers,which are expected to improve electrical functional-ity and biocompatibility. Because conductive poly-mers are easily modified using various molecules, itmay be possible to develop a conductive polymer elec-trode that has a high affinity to biological tissues.This electrode may be bound to neural tissues at themolecular level so that a neuron will be stimulatedintracellularly or quasi-intracellularly to decrease thethreshold current significantly, and the functionalityand biocompatibility of electrodes will be improved.For that purpose, we have been developing the tech-nique of micro/nanofabrication of conductive poly-mers, which is a photolithography technique usingthe photochemical reaction of oxidative polymeriza-tion agents [13]. Although the conductivity of thepresent electrode must be improved in further studies,we have obtained promising data in our pilot studies.In the next phase, we will perform a biocompatibility
test and evaluate its functionality in electrophysiol-ogy testing.
8. ACKNOWLEDGMENT
This research was conducted in cooperation withCenter for Cooperative Research in Advanced Sci-ence & Technology (CCRAST) in Nagoya Univer-sity, and VLSI Design and Education Center (VDEC)in the University of Tokyo. In addition, this re-search was supported by the following organizations;Japanese Ministry of Education, Culture, Sports, Sci-ence and Technology, NEDO (New Energy and In-dustrial Technology Development Organization), JST(Japan Science and Technology Agency), RIKEN(The Institute of Physical and Chemical Research),SCAT Research Grant (Japanese Ministry of Post),Terumo Science and Technology Promotion Founda-tion , and Asahi Glass Foundation.
References
[1] A. M. Potts, J. Inoue, The electrically evoked re-sponse of the visual system (EER). Invest Oph-thalmol Vis Sci., 7, 269-278 (1968).
[2] T. Yagi, Vision substitution by stimulating vi-sual nervous system, Journal of Japanese Soci-ety for Medical and Biological Engineering, 18,4, 36-42, 2004. (in Japanese)
[3] J. Rizzo, J. Wyatt, M. Humayun, W. Liu,A. Chow, R. Eckmiller, E. Zrenner, T. Yagi,G. Abrams, Retinal Prosthesis: An Encourag-ing First Decade with Major Challenges Ahead,Ophthalmology, 108, 1 (2001).
[4] T. Yagi, N. Ito, M. Watanabe, Y. Uchikawa,A computational study on an electrode arrayin a hybrid retinal implant. Proceedings of 1998IEEE International Joint Conf. on Neural Net-works (IJCNN’98), 780-783, 1998.
[5] T. Yagi, Hybrid retinal implant, Journal ofJapanese Society of Applied Physics, 73, 8, 1095-1100, 2004. (in Japanese)
[6] K. F. So, A. J. Aguayo, Lengthy regrowth ofcut axons from ganglion cells after peripheral
INTERNATIONAL JOURNAL OF APPLIED BIOMEDICAL ENGINEERING VOL.2, NO.1 2009 5
nerve transplantation into the retina of adultrats, Brain Res., 328, 349-354 (1985).
[7] T. Yagi, Y. Ito, H. Kanda, S. Tanaka, M. Watan-abe, Y. Uchikawa, Hybrid retinal implant: Fu-sion of engineering and neuroscience, Proceedingsof 1999 IEEE Int. Conf. on Systems, Man andCybernetics, IV, 382-385, 1999.
[8] M. Watanabe, H. Sawai, Y. Fukuda, Number,distribution, and morphology of retinal gan-glion cells with axons regenerated into peripheralnerve graft in adult cats, The Journal of Neuro-science, 13(5), 2105-2117 (1993).
[9] Y. Ito, T. Yagi, H. Kanda, S. Tanaka, M. Watan-abe, Y. Uchikawa, Cultures of neurons on micro-electrode array in hybrid retinal implant, Proc.of 1999 IEEE Int. Conf. on systems, Man andCybernetics, IV, 414-417 (1999).
[10] H. Kanda, T. Yagi, M. Watanabe, Y.Uchikawa, Effect of pulse parameters on visualnerve system, International Journal of AppliedElectromagnetics and Mechanics, 14, 337-340(2001/2002).
[11] S. Tanaka, T. Yagi, H. Kanda, Y. Ito, M. Watan-abe, Y. Uchikawa, Electric charge density dis-tribution around stimulation electrode in retinalimplant, Proc. of 1999 IEEE Int. Conf. on sys-tems, Man and Cybernetics, IV, 386-389 (1999).
[12] Y. Terasawa, T. Yagi, Quantitative evaluationof reading ability with simulated prosthetic vi-sion, Trans. of the Inst. of Electrical Engineers ofJapan, 122-C, 7, 1104-1109, 2002. (in Japanese)
[13] New Energy and Industrial Technology Devel-opment Organization (NEDO) 2004 Report. (inJapanese) http://www.nedo.go.jp/kankobutsu/pamphlets/kouhou/mirai/3 4.pdf
[14] Y. Ito, T. Yagi, Y. Ohnishi, K. Kiuchi, Y.Uchikawa, A study on conductive polymer elec-trodes for stimulating nervous system, Interna-tional Journal of Applied Electromagnetics andMechanics, 14, 347-352 (2001/2002).
T. Yagi received his Ph.D. degreein Electro-Mechanical Engineering fromNagoya University, Japan, in 1996 andbecame a postdoctoral fellow at the In-stitute of Physical and Chemical Re-search (RIKEN), Japan. He worked atNagoya University from 1998 to 2001 asan assistant professor. He was invitedby NIDEK Co., Ltd. in 2001 to start di-recting the national research project ofa visual prosthesis under the support of
Japanese governmental agency, NEDO (New Energy and In-dustrial Technology Development Organization). In 2002, hecommercialized eye-gaze interface with SeaStar Corporation.After he completed the first prototype of the visual prosthesisin 2004, he moved to the Institute of Physical and ChemicalResearch (RIKEN) as a research scientist. He also held a re-search position as visiting research scientist at the Universityof Tokyo, Research Center for Advanced Science and Technol-ogy, from Apr. 2004 to Mar. 2005. Since September, 2005, he
has joined a faculty staff in the Tokyo Institute of Technologyand concurrently held a visiting research scientist position inRIKEN.
6 S. Cohen and C. Pintavirooj: 2D Affine Invariant Fiducial Points and Affine Absolute Invariants for ... 6-16
2D Affine Invariant Fiducial Points and AffineAbsolute Invariants for Shape Matching underAffine and Weak Perspective Transformations
Fernand S. Cohen, and C. Pintavirooj*, Member
ABSTRACT
In this paper we derive novel fiducial points oncurves that are preserved under affine and weak per-spective transformations, are local, intrinsic and com-puted from the differential geometry of the curve.These are used in a non-iterative geometric-basedmethod for shape matching and 2D registration in thepresence of affine or nonlinear transformations thatcan be approximated by piece wise affine transforma-tions. To reduce the sensitivity of the computation ofthe fiducial points to noise, we use a B-Spline curverepresentation that smooths out the curve prior to thecomputation of these invariant points. The matchingis achieved by establishing correspondences betweenfiducial points after a sorting based on derived set ab-solute local affine invariants. The performance of thematching based on these fiducial points is shown fora variety of object matching problems, and is shownto be robust and promising even in the presence ofnoise.
Keywords: Fiducial points; Affine absolute invari-ants; Affine transform; Perspective transform
1. INTRODUCTION
Shape matching is a central problem in visual in-formation system, computer vision, pattern recogni-tion image registration, and robotics. Application ofshape matching includes image retrieval, industrialinspection, stereo vision, and fingerprint matching.The term shape is referred to the invariant geometri-cal properties of the relative distance among a set ofstatic spatial features of an object. These static spa-tial features are known as shape features of the object.After extracting the shape features for a model and ascene, a similarity may be used to compare the shapefeatures. The similarity measure is referred to as ashape measure. The shape measure should be invari-ant under certain class of geometric transformationof the object. In the simple scenario, shape measuresare invariant to translation rotation and scale. In this
Manuscript received on July 1, 2009.* Corresponding author.
Fernand S. Cohen is with Department of Electrical and Com-puter Engineering Drexel University Philadelphia, PA 19104
C. Pintavirooj is with Faculty of Engineering, KingMongkut’s Institute of Technology Ladkrabang Bangkok10520, Thailand. E-mail addresses: [email protected]
case, the shape measures are invariant under similar-ity transformation. When included the invariance ofshape measures to shear effect, the shape measuresare said to be invariant under affine transformation.Finally in the complicated case, shape measures areinvariant under perspective transformation when in-cluded the effect caused by perspective projection.
There are many techniques available to shapematching which can be classified mainly into twomain categories; a global method and a local method.The global method works on an object as a whole;while the local method on a partially visible objector occlusion. Wavelet transform [1][2] is the well-known global method that transforms the image fromcolor information in spatial domain to color variationinformation in frequency domain. A set of waveletcoefficients can be used as shape features for shapematching. As wavelet-transform method is based onglobal image transform, it is hence not robust againstocclusion. Moment-based approach is other globalmethods that work on the whole area of an object.Based on the moment, a number of functions, mo-ment invariant, can be defined that are invariant un-der similarity transformation [3][4] and affine trans-formation [5]. Moment-based approach also suffersfrom problem of noise and occlusion. Rather thanworking on the area of the object, the boundary canbe used instead as a mean to present the pertinent in-formation about an object is contained in the shapeof its boundary. Fourier descriptors [6][7][8] and Me-dian Axis Transformation [9][10][11] are well-knownboundary representations that provide global simi-larity measures applied to shape matching.
Global method provides global features that arerelatively stable to external noise, however, they arenot robust to occlusion and, more importantly, globalfeatures of two similar shapes differ slightly. On thecontrary, while local features are insensitive to occlu-sion, they are sensitive to noise and the amount of lo-cal information available is usually insufficient for ro-bust matching. Most of the local features exploit ge-ometric properties of contour that remain unchangedunder certain class of geometric transformation - theso-called geometric invariant [12][13][14]. Curvatureis local geometric invariant that has been used ex-tensively in shape matching for its ability to carryinformation at varying resolution. Although curva-ture is invariant under similarity transformation, it
INTERNATIONAL JOURNAL OF APPLIED BIOMEDICAL ENGINEERING VOL.2, NO.1 2009 7
is not preserved under affine transformation. To by-pass this problem, many literatures concentrated onusing only curvature extremal point [15]-[20] that isinsensitive to affine transformation. The curvatureextremal points include the high-curvature points orthe corner points and zero-curvature point or inflec-tion points. The high-curvature points are not affineinvariant; yet they are robust to affine transformationand have been used extensively for shape matching.The zero-curvature points have been proved that theyare affine invariant [21] and applied for numerous ap-plications not only in shape matching but in variouscontexts as well. The zero-curvature points have amajor drawback in that they are sensitive to noise.To provide the similarity measures, the curvature ex-tremal point usually must combine with other geo-metric invariant such as the area bounded by threeselective curvature extremal points [21][22]. The areais a well-known relatively affine invariant. To obtainan absolute invariant, a ratio of two areas is computedand used as a good candidate for similarity measures.Other typical geometric features include line inter-sections [23], and [24], centroids of closed-boundaryregion [25], knot points [26], etc.
There are different approaches for curve modelingsuch as Fourier descriptor [27][28], chain code [29],polygon approximation [20], curvature primal sketch[31], medial axis transformation [32], autoregressivemodel [33][34], moment [35][36][37], parametric al-gebraic curve [38], curvature invariant [39], stochas-tic transformation [40], implicit polynomial func-tion [41], bounded polynomial [42], B-Spline [43][44],and reaction diffusion [45]. Among others, B-Splinestands as of one the most efficient curve representa-tion and processes very attractive properties such asspatial uniqueness, boundedness and continuity, localshape controllability and invariance to affine transfor-mation.
In this paper we introduce a novel shape measurewhich is not only preserved under affine transforma-tion but also robust under weak perspective trans-formation. There are three main contributions tothis paper. Firstly, we introduce a novel set of localintrinsic fiducial points which are derived from thederivative of the object curve and their derivativesand are preserved under affine and weak perspective.Secondly, we construct absolute invariants for pla-nar curves that are preserved under affine transfor-mations and an invariant for perspective transforma-tions. Our similarity measure is based on using a fiveselective fiducial points to compute the well-knownfive-point coplanar invariant. Five-point coplanar in-variant is based on using ratio of ratio of volume. Itis hence an absolute perspective invariant and hencevery suitable to be used to match planar curves. Fi-nally, to bypass the problem of noise for both thedata presentation as well as the computation of theseinvariants, we model the external contour of the ob-
ject with the approximating B-Spline curve represen-tation that are themselves preserved under affine andweak perspective transformations and are robust tonoise both local and global [21][50]. Hence the selec-tion of the B-Spline curve allows for the reduction ofthe sensitivity of the fiducial points to noise as wellas it provides an analytic solution to curvature com-putation.
This paper is organized as follows. Section 2 in-troduces the local geometric curve features used asfiducial points or fiducial points on the curve. Sec-tion 3 shows how to construct absolute invariant fromset of geometric curve features. Section 4 describeshow to establish the correspondence between two setsof feature points. B-Splines curves are given in sec-tion 5. Experimental results are shown in section 6.Discussion and conclusion are presented in section 7.
2. INTRINSIC GEOMETRIC FEATURESOF CURVE
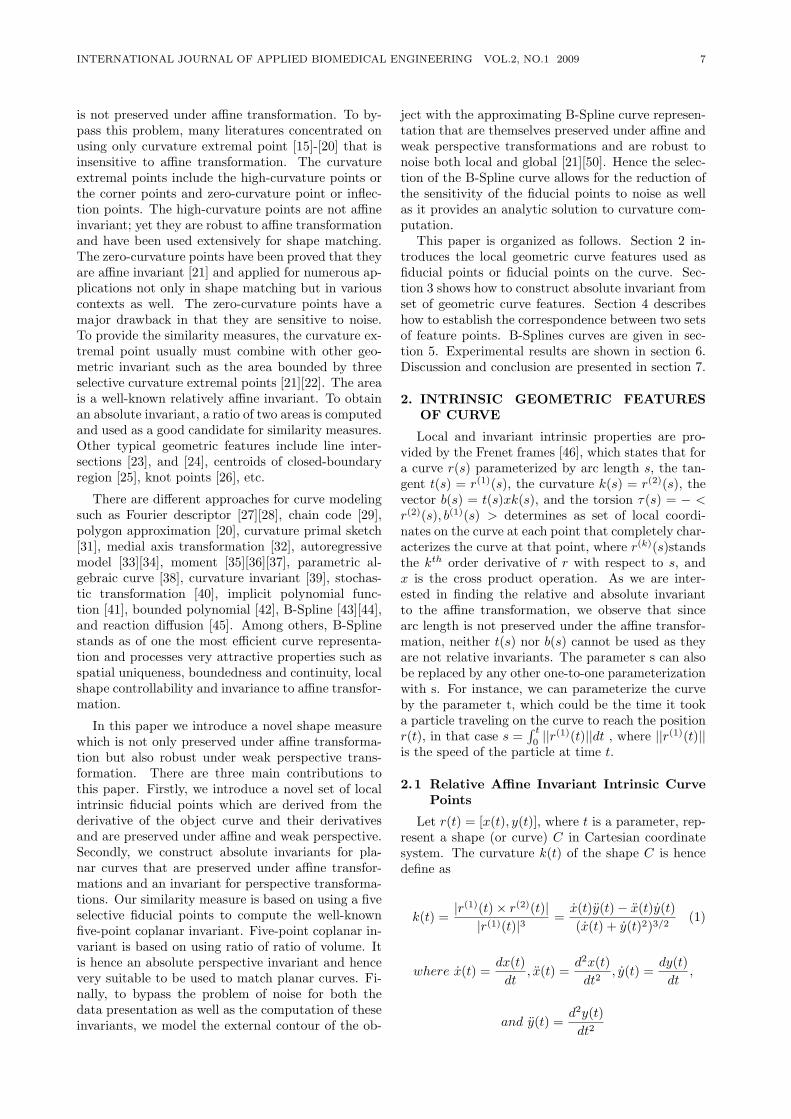
Local and invariant intrinsic properties are pro-vided by the Frenet frames [46], which states that fora curve r(s) parameterized by arc length s, the tan-gent t(s) = r(1)(s), the curvature k(s) = r(2)(s), thevector b(s) = t(s)xk(s), and the torsion τ(s) = − <r(2)(s), b(1)(s) > determines as set of local coordi-nates on the curve at each point that completely char-acterizes the curve at that point, where r(k)(s)standsthe kth order derivative of r with respect to s, andx is the cross product operation. As we are inter-ested in finding the relative and absolute invariantto the affine transformation, we observe that sincearc length is not preserved under the affine transfor-mation, neither t(s) nor b(s) cannot be used as theyare not relative invariants. The parameter s can alsobe replaced by any other one-to-one parameterizationwith s. For instance, we can parameterize the curveby the parameter t, which could be the time it tooka particle traveling on the curve to reach the positionr(t), in that case s =
∫ t
0||r(1)(t)||dt , where ||r(1)(t)||
is the speed of the particle at time t.
2.1 Relative Affine Invariant Intrinsic CurvePoints
Let r(t) = [x(t), y(t)], where t is a parameter, rep-resent a shape (or curve) C in Cartesian coordinatesystem. The curvature k(t) of the shape C is hencedefine as
k(t) =|r(1)(t)× r(2)(t)||r(1)(t)|3
=x(t)y(t)− x(t)y(t)(x(t) + y(t)2)3/2
(1)
where x(t) =dx(t)dt
, x(t) =d2x(t)dt2
, y(t) =dy(t)dt
,
and y(t) =d2y(t)dt2
8 S. Cohen and C. Pintavirooj: 2D Affine Invariant Fiducial Points and Affine Absolute Invariants for ... 6-16
Let Ca = ra(τ) = [u(τ), v(τ)] , where τ is a param-eter, be an affine-transformed version of the shape C.Mathematically, the relation between two shapes Cand C
′under affine transformation can be expressed
as follow
u(τ)v(τ)
1
=
a11 a12 b1a21 a22 b20 0 1
x(t)y(t)
1
(2)
where aij , i = 1 : 2, j = 1 : 2 are affine trans-formed parameter associated with rotation, scale andshear and bi, i = 1 : 2 is affine transformed parame-ter associated with translation. The curvature of theaffine-transformed shape is
ka(t) =|r(1)a (t)× r(2)a (t)||r(1)a (t)|3
=u(t)v(t)− u(t)v(t)(u(t) + v(t)2)3/2
(3)
where u(t) =du(t)dt
, u(t) =d2u(t)dt2
, v(t) =dv(t)dt
,
and v(t) =d2v(t)dt2
The nominator term of equation (1) is equivalentto one half of the area bounded by the vectors r(1)(t)and r(2)(t) ; while that of equation (3) is equivalentto one half of the area bounded by vector r(1)a (t) andr(2)a (t) . The denominator of equation (1) is the length
of vector r(1)(t) ; while that of equation (3) is thelength of vector r(1)a (t) . Under an affine transforma-tion, it can be shown that the nominators of equation(1) and (3) which are the area are related by deter-minant of transformation matrix and hence relativeinvariant, i.e.
∣∣∣∣ u(t) u(t)v(t) v(t)
∣∣∣∣ =∣∣∣∣ a11 a12
a21 a22
∣∣∣∣ ∣∣∣∣ x(t) x(t)y(t) y(t)
∣∣∣∣ (4)
where |a| denote determinant of a. By contrast,we can show that denominator of equation (1) and(3) is not affine invariant, i.e.(
u(t)2 + v(t)2)3/2 =(
(a11x(t) + a12y(t))2 + (a21x(t) + a22y(t))2)3/2
(5)This expression indicated that the length of first
derivative vector is not a relative invariant underthe affine transformation. As a consequence, onlythe nominator term of the definition of curvature isthe promising candidate for constructing affine invari-ants. In this paper we call the nominator term as theaffine curvature.
Inflection points are points on the curve at whichthe curvature is zero, i.e., points at which
k(t) =|r(1)(t)× r(2)(t)||r(1)(t)|3
=x(t)y(t)− x(t)y(t)(x(t) + y(t)2)3/2
= 0
or the points at which
|r(1)(t)× r(2)(t)| = x(t)y(t)− x(t)y(t) = 0 (6)
As a results, r(1)(t) and r(2)(t) are parallel at theinflection point.
Inflection points on the affine transformed curveare the points at which
ka(t) =|r(1)a (t)× r(2)a (t)||r(1)a (t)|3
=u(t)v(t)− u(t)v(t)(u(t) + v(t)2)3/2
= 0
or the points at which
u(t)v(t)−u(t)v(t) =∣∣∣∣ a11 a12
a21 a22
∣∣∣∣ x(t)y(t)−x(t)y(t) = 0
x(t)y(t)− x(t)y(t) = 0 (7)
which is the same as (6). As a consequence, atthe inflection points, the curvature or affine curva-ture is zero and r(1)(t) and r(2)(t) are parallel. Sincethe affine map preserve parallelism, we have shownthat r(1)a (t) and r
(2)a (t) are also parallel. Therefore
the inflection points of the affine transformed curveare the transformed inflection points of the originalcurve and hence are relative affine invariant. Inflec-tion points were suggested by us [21] as a candidatefor curve matching [21]. In this paper we augmentthese invariants by considering cross product termsof the curve and its various possible nonzero higherorder derivatives, which are all area invariants, andhence relative affine invariants. So for instance if wetake derivative of (6), we have
.x(t)
...y (t) +
..x(t)
..y(t)− ..
x(t)..y(t)− ..
x(t).y(t)
=.x(t)
...y (t)− ...
x(t).y(t) = |r(1)(t)× r(3)(t)| = 0 (8)
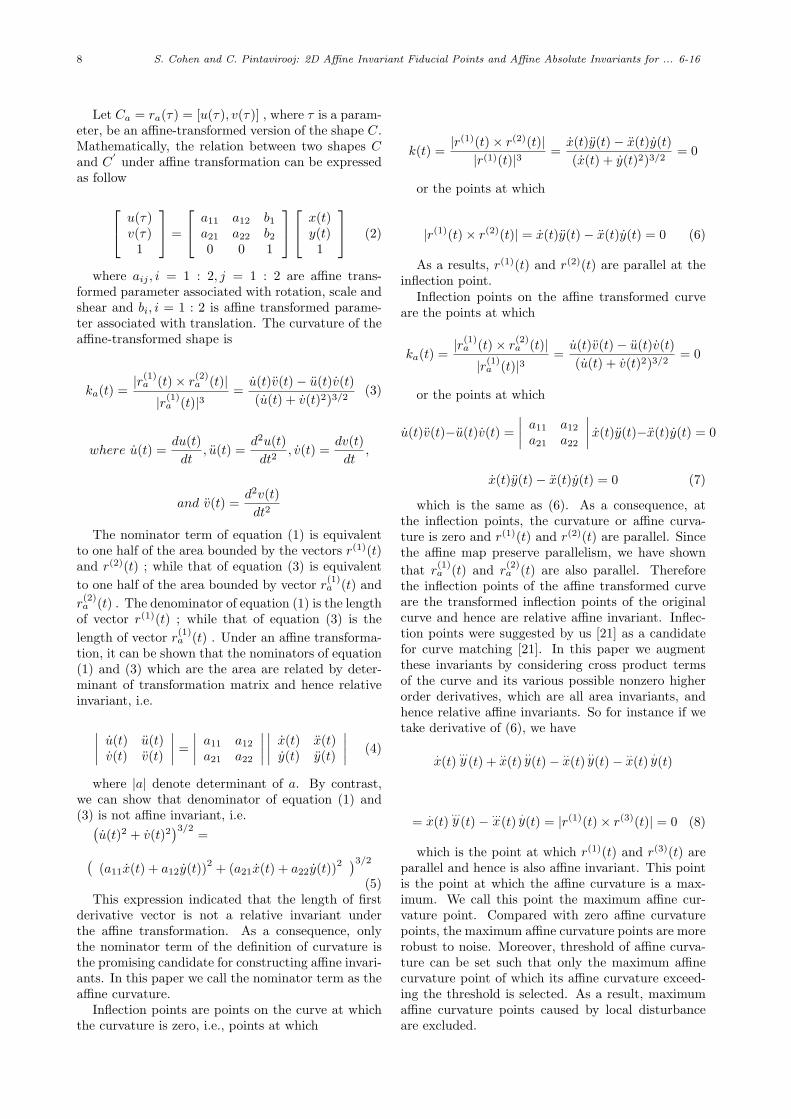
which is the point at which r(1)(t) and r(3)(t) areparallel and hence is also affine invariant. This pointis the point at which the affine curvature is a max-imum. We call this point the maximum affine cur-vature point. Compared with zero affine curvaturepoints, the maximum affine curvature points are morerobust to noise. Moreover, threshold of affine curva-ture can be set such that only the maximum affinecurvature point of which its affine curvature exceed-ing the threshold is selected. As a result, maximumaffine curvature points caused by local disturbanceare excluded.
INTERNATIONAL JOURNAL OF APPLIED BIOMEDICAL ENGINEERING VOL.2, NO.1 2009 9
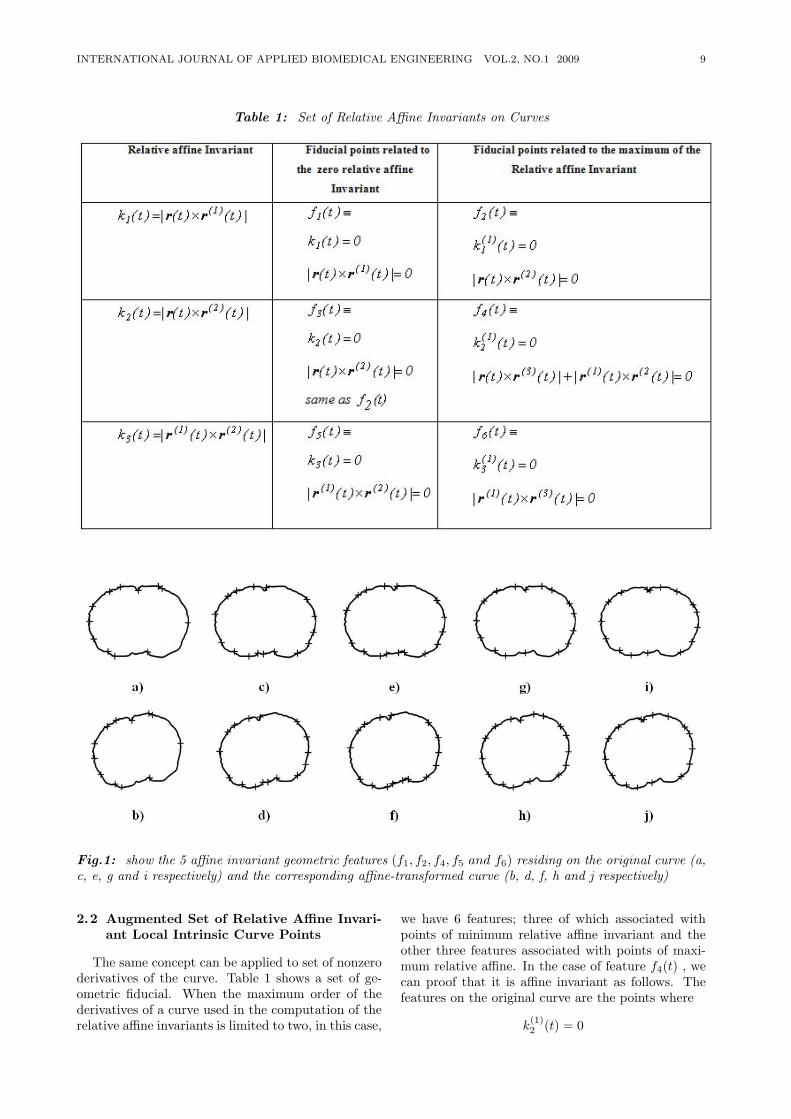
Table 1: Set of Relative Affine Invariants on Curves
Fig.1: show the 5 affine invariant geometric features (f1, f2, f4, f5 and f6) residing on the original curve (a,c, e, g and i respectively) and the corresponding affine-transformed curve (b, d, f, h and j respectively)
2.2 Augmented Set of Relative Affine Invari-ant Local Intrinsic Curve Points
The same concept can be applied to set of nonzeroderivatives of the curve. Table 1 shows a set of ge-ometric fiducial. When the maximum order of thederivatives of a curve used in the computation of therelative affine invariants is limited to two, in this case,
we have 6 features; three of which associated withpoints of minimum relative affine invariant and theother three features associated with points of maxi-mum relative affine. In the case of feature f4(t) , wecan proof that it is affine invariant as follows. Thefeatures on the original curve are the points where
k(1)2 (t) = 0
10 S. Cohen and C. Pintavirooj: 2D Affine Invariant Fiducial Points and Affine Absolute Invariants for ... 6-16
or
x(t)...y (t) + x(t)
..y(t)− ..
x(t).y(t)− ...
x(t)y(t) = 0
|r(t)× r(3)(t)|+ |r(1)(t)× r(2)(t)| = 0 (9)
These fiducial points on the affine transformedcurve are the points at which
u(t)...v (t) +
.u(t)
..v(t)− ..
u(t).v(t)− ...
u(t)v(t) =∣∣∣∣ a11 a12
a21 a22
∣∣∣∣x(t)...y (t)− ...
x(t)y(t)+
∣∣∣∣ a11 a12
a21 a22
∣∣∣∣ [ .x(t)
..y(t)− ..
x(t)y(t)] = 0
∣∣∣∣ a11 a12
a21 a22
∣∣∣∣ |r(t)× r(3)(t)|+∣∣∣∣ a11 a12
a21 a22
∣∣∣∣ |r(1)(t)× r(2)(t)| = 0
|r(t)× r(3)(t)|+ |r(1)(t)× r(2(t)| = 0 (10)
which is the same as (9). Hence points wherek
(1)2 (t) = 0 are preserved under an affine transfor-
mation. Note that the fiducial points derived fromf1(t), f2(t), f3(t), f4(t) (i.e., the ones that contain r(t)in their computation) are only linear invariant andnot affine in the case of occlusion between the objectand its transformation. This is due to the fact thetranslation parameter b in the case would not corre-spond to the difference between the centroids of thecurve before and after its transformation because ofthe occlusion. This is however, not the case for fidu-cial points that are derived from the curve derivatives.
3. CONSTRUCTING ABSOLUTE INVARI-ANT FROM FIDUCIAL POINTS ONCURVES
Geometric invariants are shape descriptors thatremain unchanged under geometric transformationssuch as perspective and affine transformation. In thissection we derive an affine absolute invariant from thefiducial points derived on curves, and show how to usethese invariants to put into correspondences fiducialpoints before and after the transformation withoutever needing to know what the values of the trans-formation parameters are. Once correspondences areestablished, the transformation parameters can thenbe computed using LS fitting and the objects can bealigned. These invariants can also be used as invari-ant object shape descriptors. We also test the five-point coplanar perspective invariant computed on theintrinsic fiducial points as a close approximation to aperspective absolute invariant, an approximation heresince the fiducial points are not fully preserved undera strong perspective transformation.
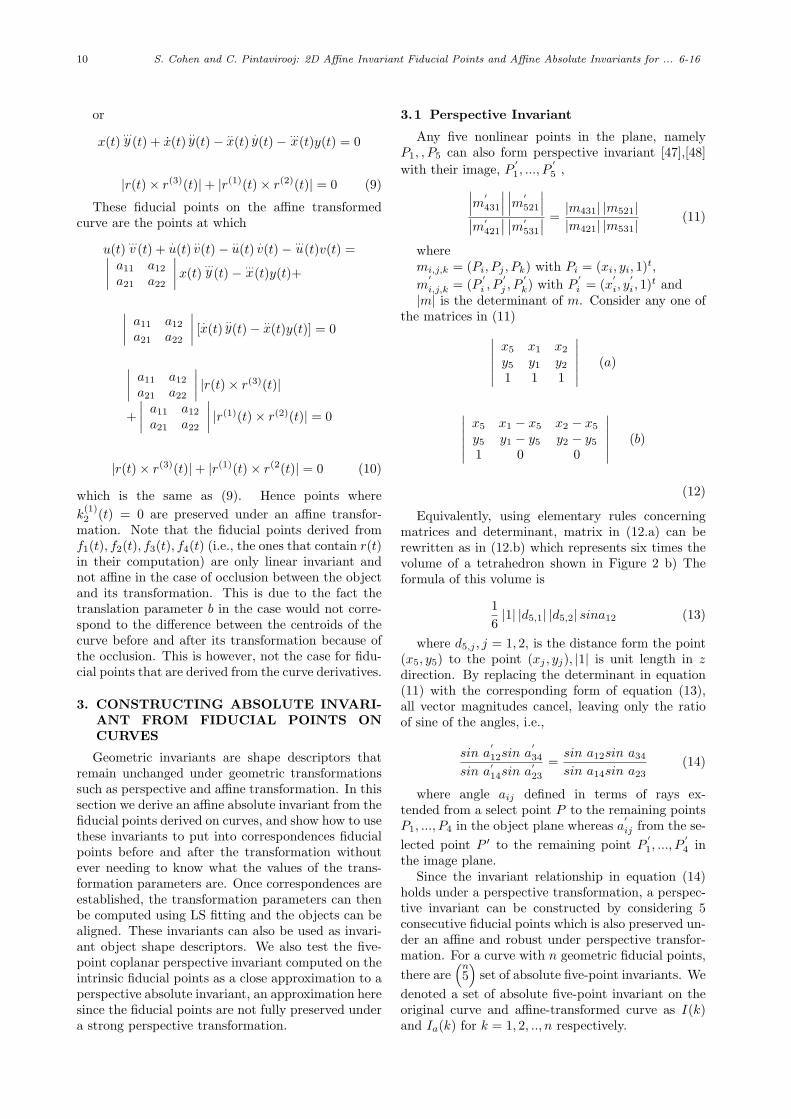
3.1 Perspective Invariant
Any five nonlinear points in the plane, namelyP1, , P5 can also form perspective invariant [47],[48]with their image, P
′
1, ..., P′
5 ,∣∣∣m′
431
∣∣∣ ∣∣∣m′
521
∣∣∣∣∣m′421
∣∣ ∣∣m′531
∣∣ =|m431| |m521||m421| |m531|
(11)
wheremi,j,k = (Pi, Pj , Pk) with Pi = (xi, yi, 1)t,m
′
i,j,k = (P′
i , P′
j , P′
k) with P′
i = (x′
i, y′
i, 1)t and|m| is the determinant of m. Consider any one of
the matrices in (11)∣∣∣∣∣∣x5 x1 x2
y5 y1 y21 1 1
∣∣∣∣∣∣ (a)
∣∣∣∣∣∣x5 x1 − x5 x2 − x5
y5 y1 − y5 y2 − y51 0 0
∣∣∣∣∣∣ (b)
(12)
Equivalently, using elementary rules concerningmatrices and determinant, matrix in (12.a) can berewritten as in (12.b) which represents six times thevolume of a tetrahedron shown in Figure 2 b) Theformula of this volume is
16|1| |d5,1| |d5,2| sina12 (13)
where d5,j , j = 1, 2, is the distance form the point(x5, y5) to the point (xj , yj), |1| is unit length in zdirection. By replacing the determinant in equation(11) with the corresponding form of equation (13),all vector magnitudes cancel, leaving only the ratioof sine of the angles, i.e.,
sin a′
12sin a′
34
sin a′14sin a
′23
=sin a12sin a34
sin a14sin a23(14)
where angle aij defined in terms of rays ex-tended from a select point P to the remaining pointsP1, ..., P4 in the object plane whereas a
′
ij from the se-lected point P ′ to the remaining point P
′
1, ..., P′
4 inthe image plane.
Since the invariant relationship in equation (14)holds under a perspective transformation, a perspec-tive invariant can be constructed by considering 5consecutive fiducial points which is also preserved un-der an affine and robust under perspective transfor-mation. For a curve with n geometric fiducial points,there are
(n5)
set of absolute five-point invariants. Wedenoted a set of absolute five-point invariant on theoriginal curve and affine-transformed curve as I(k)and Ia(k) for k = 1, 2, .., n respectively.
INTERNATIONAL JOURNAL OF APPLIED BIOMEDICAL ENGINEERING VOL.2, NO.1 2009 11
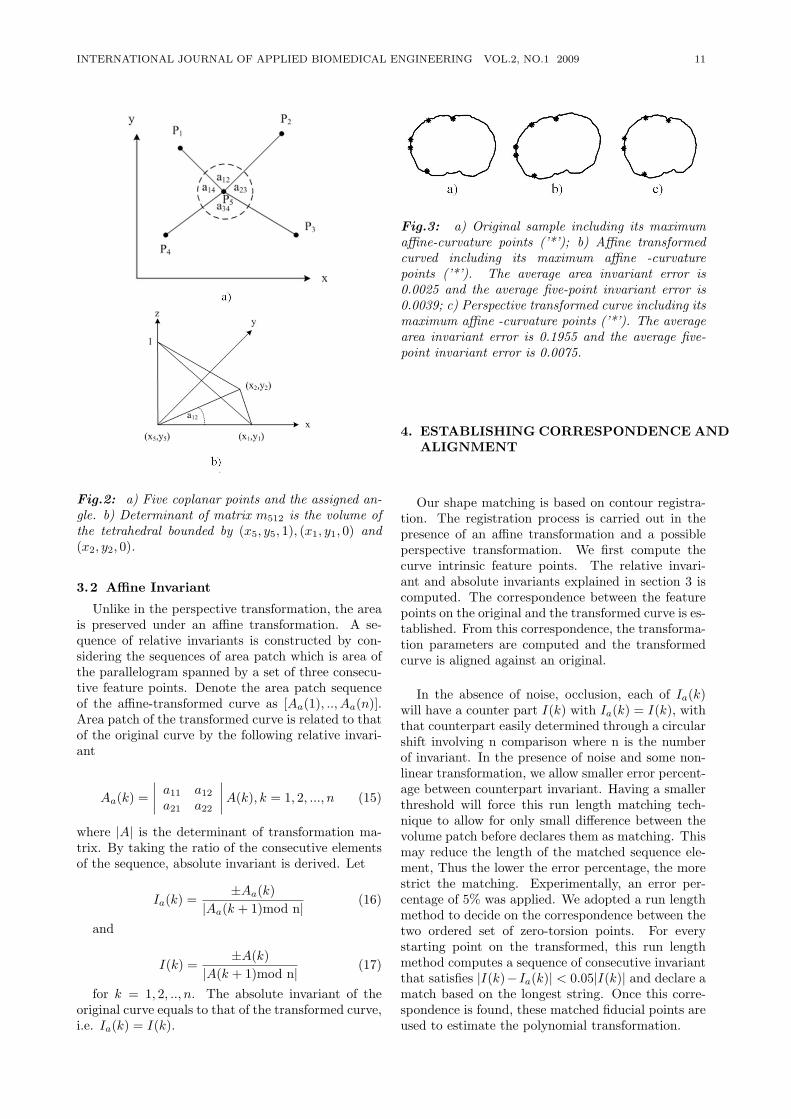
Fig.2: a) Five coplanar points and the assigned an-gle. b) Determinant of matrix m512 is the volume ofthe tetrahedral bounded by (x5, y5, 1), (x1, y1, 0) and(x2, y2, 0).
3.2 Affine Invariant
Unlike in the perspective transformation, the areais preserved under an affine transformation. A se-quence of relative invariants is constructed by con-sidering the sequences of area patch which is area ofthe parallelogram spanned by a set of three consecu-tive feature points. Denote the area patch sequenceof the affine-transformed curve as [Aa(1), .., Aa(n)].Area patch of the transformed curve is related to thatof the original curve by the following relative invari-ant
Aa(k) =∣∣∣∣ a11 a12
a21 a22
∣∣∣∣A(k), k = 1, 2, ..., n (15)
where |A| is the determinant of transformation ma-trix. By taking the ratio of the consecutive elementsof the sequence, absolute invariant is derived. Let
Ia(k) =±Aa(k)
|Aa(k + 1)mod n|(16)
and
I(k) =±A(k)
|A(k + 1)mod n|(17)
for k = 1, 2, .., n. The absolute invariant of theoriginal curve equals to that of the transformed curve,i.e. Ia(k) = I(k).
Fig.3: a) Original sample including its maximumaffine-curvature points (’*’); b) Affine transformedcurved including its maximum affine -curvaturepoints (’*’). The average area invariant error is0.0025 and the average five-point invariant error is0.0039; c) Perspective transformed curve including itsmaximum affine -curvature points (’*’). The averagearea invariant error is 0.1955 and the average five-point invariant error is 0.0075.
4. ESTABLISHING CORRESPONDENCE ANDALIGNMENT
Our shape matching is based on contour registra-tion. The registration process is carried out in thepresence of an affine transformation and a possibleperspective transformation. We first compute thecurve intrinsic feature points. The relative invari-ant and absolute invariants explained in section 3 iscomputed. The correspondence between the featurepoints on the original and the transformed curve is es-tablished. From this correspondence, the transforma-tion parameters are computed and the transformedcurve is aligned against an original.
In the absence of noise, occlusion, each of Ia(k)will have a counter part I(k) with Ia(k) = I(k), withthat counterpart easily determined through a circularshift involving n comparison where n is the numberof invariant. In the presence of noise and some non-linear transformation, we allow smaller error percent-age between counterpart invariant. Having a smallerthreshold will force this run length matching tech-nique to allow for only small difference between thevolume patch before declares them as matching. Thismay reduce the length of the matched sequence ele-ment, Thus the lower the error percentage, the morestrict the matching. Experimentally, an error per-centage of 5% was applied. We adopted a run lengthmethod to decide on the correspondence between thetwo ordered set of zero-torsion points. For everystarting point on the transformed, this run lengthmethod computes a sequence of consecutive invariantthat satisfies |I(k)− Ia(k)| < 0.05|I(k)| and declare amatch based on the longest string. Once this corre-spondence is found, these matched fiducial points areused to estimate the polynomial transformation.
12 S. Cohen and C. Pintavirooj: 2D Affine Invariant Fiducial Points and Affine Absolute Invariants for ... 6-16
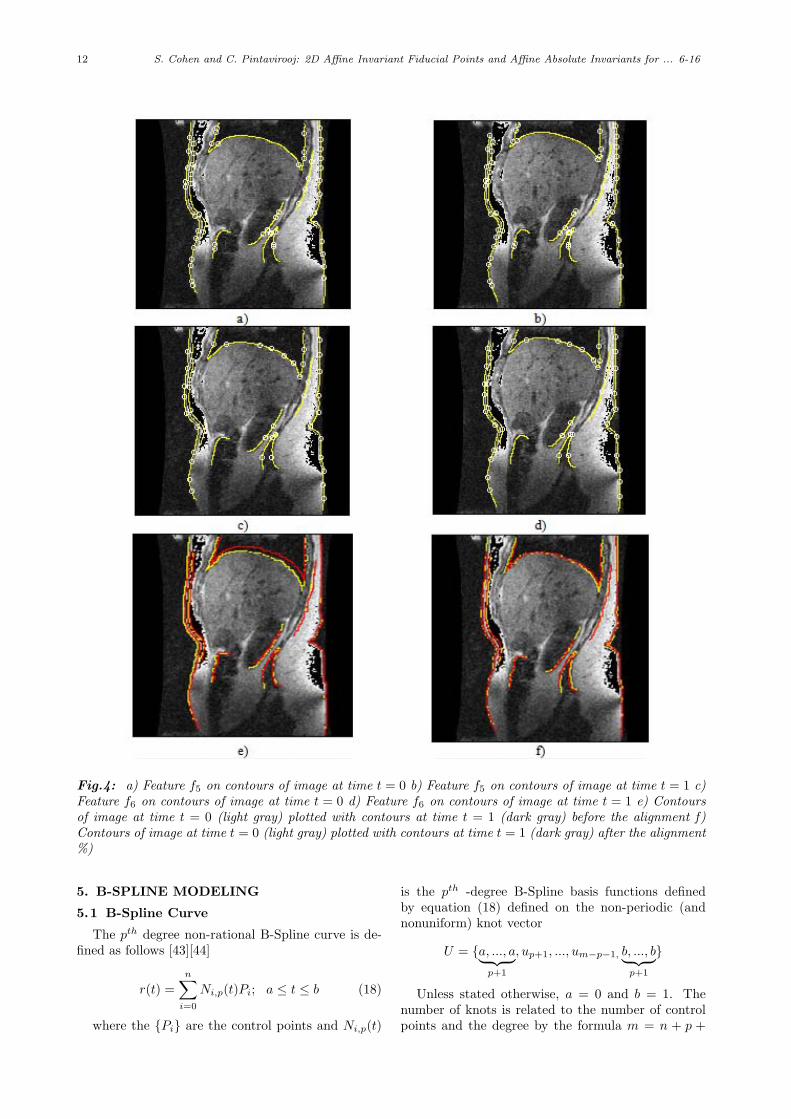
Fig.4: a) Feature f5 on contours of image at time t = 0 b) Feature f5 on contours of image at time t = 1 c)Feature f6 on contours of image at time t = 0 d) Feature f6 on contours of image at time t = 1 e) Contoursof image at time t = 0 (light gray) plotted with contours at time t = 1 (dark gray) before the alignment f)Contours of image at time t = 0 (light gray) plotted with contours at time t = 1 (dark gray) after the alignment%)
5. B-SPLINE MODELING
5.1 B-Spline Curve
The pth degree non-rational B-Spline curve is de-fined as follows [43][44]
r(t) =n∑
i=0
Ni,p(t)Pi; a ≤ t ≤ b (18)
where the Pi are the control points and Ni,p(t)
is the pth -degree B-Spline basis functions definedby equation (18) defined on the non-periodic (andnonuniform) knot vector
U = a, ..., a︸ ︷︷ ︸p+1
, up+1, ..., um−p−1, b, ..., b︸ ︷︷ ︸p+1
Unless stated otherwise, a = 0 and b = 1. Thenumber of knots is related to the number of controlpoints and the degree by the formula m = n + p +
INTERNATIONAL JOURNAL OF APPLIED BIOMEDICAL ENGINEERING VOL.2, NO.1 2009 13
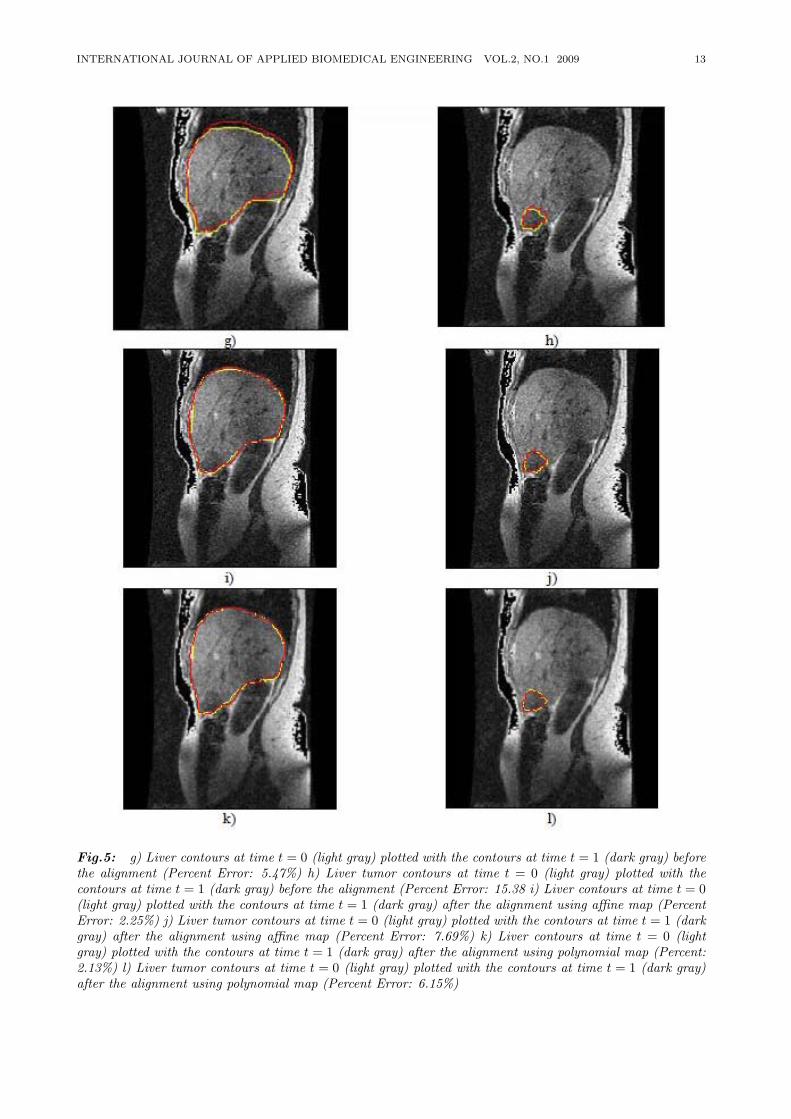
Fig.5: g) Liver contours at time t = 0 (light gray) plotted with the contours at time t = 1 (dark gray) beforethe alignment (Percent Error: 5.47%) h) Liver tumor contours at time t = 0 (light gray) plotted with thecontours at time t = 1 (dark gray) before the alignment (Percent Error: 15.38 i) Liver contours at time t = 0(light gray) plotted with the contours at time t = 1 (dark gray) after the alignment using affine map (PercentError: 2.25%) j) Liver tumor contours at time t = 0 (light gray) plotted with the contours at time t = 1 (darkgray) after the alignment using affine map (Percent Error: 7.69%) k) Liver contours at time t = 0 (lightgray) plotted with the contours at time t = 1 (dark gray) after the alignment using polynomial map (Percent:2.13%) l) Liver tumor contours at time t = 0 (light gray) plotted with the contours at time t = 1 (dark gray)after the alignment using polynomial map (Percent Error: 6.15%)
14 S. Cohen and C. Pintavirooj: 2D Affine Invariant Fiducial Points and Affine Absolute Invariants for ... 6-16
1. The polygon formed by Pi is called the controlpolygon. In light of the derived fiducial points inTable 1, p is at least 3, i.e., we have a cubic B-spline.
5.2 Why B-Splines
The B-Spline curve has superior properties thatmake them suitable for shape representation andanalysis. Some of the important properties are:
(i) A B-Spline possesses a high degree of continuityimportant for computing the curve intrinsic proper-ties, e.g., curvature.
(ii) Affine invariance: a B-Spline subjected to anaffine transformation is still a B-Spline whose con-trol points are obtained by subjecting the originalB-Spline control points to that affine transformation.
(iii) Local shape controllability: Due to the lo-cal support of the basis B-Spline function, any localdeformation is locally confined. This is very impor-tant when trying to register objects in the presenceof missing parts.
(iv) Boundedness: B-Spline is bounded by the con-trol point polygon.
6. EXPERIMENT
In this section, we apply our algorithm describedpreviously in section 4 for intra-subject registration.We are given MRI image of liver at 24 time instances.We want to align the liver contours at different timeinstance, with t=0 serving as the reference. The livercontours are extracted manually by an expert. Theexpert also provides us the internal fiducial points ofthe liver. These fiducial points will be used in theverification process of the alignment, i.e., not onlythe external contours are aligned the internal fiducialshould align as well. Figure 5.g and 5.h shows theliver contours and liver-tumor contour respectivelybefore the alignment between time t=0 and t=1. Theliver contours after the alignment using affine map aredepicted in figure 5.i The liver-tumor contours afterthe alignment using affine map are depicted in figure5.j The results associated with the alignment usingpolynomial map are shown in figure 5.k and 5.l
7. DISCUSSIONS AND CONCLUSIONS
In this paper, we introduced geometric-basedmethods to perform shape matching by aligning 2Dsectional contours. In both cases, no iteration proce-dure that toggles between estimating the transforma-tion followed by alignment was required, as we optedfor geometric invariants. In 2D-to-2D alignment, weintroduced a novel set of curve fiducial points whichare the points on the curve where the area of paral-lelogram spanned by two derivative vectors vanished.To stabilize the fiducial points vis-&-vis their sensi-tivity to noise, we used B-Spline curve representationthat smoothed out the curve prior to the computationof the fiducial points. The fiducial points were local
and hence are well suited to deal with the partialalignment problem (occlusion). This is sharp con-trast to other geometric invariant methods like mo-ments and Fourier descriptors that are global in na-ture. In addition, the fiducial points are preservedunder affine transformations (unlike other geometricfeatures, e.g., crest lines and crest points which areonly preserved under rigid transformations). To es-tablish correspondences between the fiducial pointson the two shapes, a set of absolute invariants werederived based on the areas confined between parallel-ograms spanned by sets of the fiducial point tripletsand/or the five-point coplanar invariants. Once thecorrespondences were established, the parameters ofa relevant transformation were estimated and the twocurves were aligned. The performance of our methodhas been demonstrated by the ability to register forintra subject.
8. ACKNOWLEDGMENTS
This work is supported through the National Sci-ence Foundation in the US under grant number0803670, and by King Mongkut’s Institute of Tech-nology ladkrabang (KMITL) Research Fund in Thai-land.
References
[1] C. Jacobs, A. Finkelstein and D. Salesin,“Fast Multiresolution Image Query,” ComputerGraphic Proceeding, SIGGARPH, pp. 277-286,1995.
[2] J. Z. Wang, G. Wiederhold, O. Firschein and S.X. Wei, “Wavelet-based Image Indexing Tech-niques with Partial Sketch Retrieval Capability,”Proceeding of the Fourth Forum on Research andTechnology Advances in Digital Libraries, IEEE,1997.
[3] M. K. Hu, “Visual Pattern Recognition by Mo-ment Invariants,” IRE Trans. Information The-ory, IT-8, pp. 179-187, 1962.
[4] R. J. Prokop and A. P. Reeves, “A Survey ofMoment-based Techniques for Unoccluded Ob-ject Representation and Recognition,” CVGIP:Graphics Models and Image Processing, Vol. 54,no. 5, pp. 438-460, 1992.
[5] J. Flusser and T. Suk, “Affine Moment Invari-ants: A New Tool for Character Recognition,” Pattern Recognition Letters, Vol. 15, pp. 433-436, Apr. 1994.
[6] E. L. Brill, “Character Recognition via FourierDescriptors.” WESCON Convention Record, Pa-per 25/3 Los Angeles, 1968.
[7] C. T. Zahn and R. Z. Zoskies, “Fourier-Descriptors for Plane Closed Curves,” IEEETrans. Computers, C-21, pp. 269-281, 1972
[8] P.J. Otterloo, A contour-Oriented Approachto Shape Analysis, Helmel Hamstead, PrenticeHall, 1992.
INTERNATIONAL JOURNAL OF APPLIED BIOMEDICAL ENGINEERING VOL.2, NO.1 2009 15
[9] H. Blum, “A Transformation for Extracting NewDescriptors of Shape,” In Whaten-Dunn, editor,Models for the Perception of Speech and VisualForms, pp. 362-380, MIT Press, 1967.
[10] H. Blum and R. Nagel, “Shape Descriptor us-ing Weighted Symmetric Axis Features,” PatternRecognition, vol. 10, pp. 167-180, 1978.
[11] S. Peleg and A. Resenfeld, “A min-max MedialAxis Transformation,” IEEE Trans. Patt. Anal.Machine Intell., vol. 3, pp. 208-210, 1981.
[12] P. J. Besl, “ Geometric Modeling and ComputerVision,” Proc. IEEE, vol. 76, pp. 936-958, Aug.1988.
[13] V. Govindu and C. Shekhar, “Alignment usingDistributions of Local Geometric Properties,”IEEE Trans. Patt. Anal. Machine Intell., vol.21, no. 3, pp.1031-1043, 1999.
[14] J. Mundy and A. Zisserman. Appendix — pro-jective geometry for machine vision. In J. Mundyand A. Zisserman, editors, Geometric invari-ances in computer vision. MIT Press, Cam-bridge, 1992.
[15] R. Bolles and R. Cain, “Recognizing and Locat-ing Partially Visible Objects, The Local-FeatureFocus Method,” Int’l J. Robotics. Res., Vol. 1,No. 3, pp. 57-82, 1982.
[16] E. E. Milios, “Shape Matching using Curva-ture Processes,” Comput. Vision, Graphics Im-age Process., vol. 47, pp. 203-226, 1989.
[17] C. H. Chien and J. K. Aggarwal, “Model con-struction and shape recognition from occludingcontours,” IEEE Trans. Patt. Anal. Machine In-tell., vol. 11, no. 4, pp. 372-389, 1989.
[18] K. K. Rao and R. Krishnan, “Shape feature ex-traction from object corners,” Proceedings of theIEEE Southwest Symposium on Image Analysisand Interpretation, pp. 160-165, 1994.
[19] F. Cheikh, A. Quddus and M. Gabbouj, “Shaperecognition based on wavelet-transform modu-lus maxima,” The 7th IEEE International Con-ference on Electronics, Circuits and Systems,ICECS 2000, pp. 461-464, 2000.
[20] N. Ansari and E. J. Delp, “Partial shape recogni-tion: a landmark-based approach,” IEEE Inter-national Conference on Systems, Man and Cy-bernetics, pp. 831-836, 1989.
[21] W. S. I. Ali and F. S. Cohen, “Registering coro-nal histological 2-D sections of a rat brain withcoronal sections of a 3-D brain atlas using geo-metric curve invariants and B-spline representa-tion,” IEEE Trans. on Medical Imaging,vol. 17,no. 6, pp. 957-966, 1998
[22] D. Shen, W. Wong and H. S. Horace, “Affine-Invaraint Image Retrieval by CorrespondenceMatching of Shapes,” Image and Vision Com-puting, vol. 17, pp. 489-499, 1999.
[23] G. C. Stockman, S. Kopstein, and S. Benett,“Matching Images to Models for Registration
and Object Detection via Clustering,” IEEETrans. Patt. Anal. Machine Intell., 4, pp.229-241, 1982
[24] L. N. Kanal, B. A. Lambird, D. Lavine and G. C.Stockman, “Digital Registration of Images fromSimilar and Dissimilar Sensors,” Proceedings ofthe International Conference on Cyberbetics andSociety, pp. 347-351,1981.
[25] A. Goshtasby, “Piecewise Linear Mapping Func-tions for Image Registration,” Patt. recog., 19, 6,pp. 459-466,1986
[26] F. S. Cohen, Z. Yang, Z. Huang and J. Nissanov,“Computer Matching of Histological Rat BrainSections,” IEEE Trans. on Biomedical Engineer-ing 45, 5, pp. 642-649,1998.
[27] E. Persoon and K. S. Fu, “Shape Discriminationusing Fourier Descriptors,” IEEE Trans. Pat-tern Analysis and Mach. Intell., vol. PAMI-8,pp. 388-397, 1986.
[28] C. T. Zahn and R. Z. Roskies, “Fourier De-scriptors for Plane Closed Curves,” IEEE Trans.Comput., vol. C-21, pp269-281, 1972.
[29] J. A. Saghri and H. Freeman, “Analysis of thePrecision of Generalized Chain Codes for theRepresentation of Planar Curves,” IEEE Trans.Pattern Analysis and Mach. Intell., vol. PAMI-3,pp. 533-539, 1981.
[30] T. Pavlidis and F. Ali, “Computer Recognitionof Handwritten Numerals by Polygonal Approx-imation,” IEEE Trans Sys. Man. Cybern., VolSMC-6, pp 610-614, 1975.
[31] H. Asada and M. Brady, “The Curvature Pri-mal Sketch,” IEEE Trans. Pattern Analysis andMach. Intell., vol. PAMI-18, pp. 2-14, 1986.
[32] O. Philbrick, “ Shape Description with the Me-dial Axis transformation,” on Pictorial PatternRecognition (G. C. Cheng. Ed.) Washington,DC., Thompson, 1968, pp 396-407.
[33] R. L. Kashyap and R. Chellappa, “StochasticModels for Closed Boundary Analysis,” IEEETrans. Inform. Theory, vol. IT-27. pp 627-637,1981.
[34] M. J. Paulik, M. Das and N. K. Loh, “Nonsta-tionary Autoregressive Modeling of Object Con-tours, ” IEEE Trans. Signal Processing, vol. 40,no. 3, pp. 660-675, 1992.
[35] M. K. Hu, “ Vissual Pattern Recognition by Mo-ment Invariant,” IEEE Trans. Inform. Theory,vol.8, pp. 179-187, 1962.
[36] G. Taubin, “ Estimation of Planar Curves, Sur-faces, Nonplanar Surface Curve Defined by Im-plicit Equations with Application to Edge andRange Image Segmentation,” IEEE Trans. Pat-tern Analysis and Mach. Intell., vol. 13, no. 11,pp. 1115-1138, 1991.
[37] G. Taubin and D. Copper, “2D and 3D ObjectRecognition and Positioning System based on
16 S. Cohen and C. Pintavirooj: 2D Affine Invariant Fiducial Points and Affine Absolute Invariants for ... 6-16
Moment Invariant” (Reykjavik, Iceland), May1992.
[38] J. Pones and D. J. Kriegman, “On Recognizingand Positioning Curved 3D objects from ImageContours,” Proc. IEEE Workshop Interpretation3D Scenes, Nov. 1989.
[39] P. J. Besl and R. C. Jain, “3D Object RejectRecognition,” Comput. Serveys, vol. 17, no. 1,Mar. 1985.
[40] U. Grenander and D. M. Keenan, “To-wards Automated Image Understanding,” Ap-plied Statist., vol. 16, pp. 207-221, 1989.
[41] D. Forsyth, J. Mundy, A. Zizzerman, and C.Brown, “Projective Invariant Representation us-ing Implicit Algrebic Curves,” Proc. Euro. Conf.Comput. Vision. 1990.
[42] D. Keren, D. Copper and Subrahmonia, “De-scribing Complicated Objects by Implicit Poly-nomials,” Reprint. LEMS Tech. Rep., BrownUniv., Oct., 1991.
[43] C. De Boor, “On Calculation with B-splines,” J.Approx. Theory, vol. 6, pp. 50-62, 1972.
[44] C. De Boor, A Practical Guide to Splines, NewYork, Springer-Verlag, 1978.
[45] B. Kimia, Conservation Laws and Theory ofShape, Ph. D. Thesis, McGill Univ., 1989.
[46] M. P. Do Carmo, 1976. Differential geometry ofcurves and surfaces, Prentice hall, EnglewoodCliffs, NJ.
[47] J. L. Mundy and A. Zisserman, Geometric In-variance in Computer Vision, MIT press, 1992.
[48] E. B. Barrett and P. Payton, “General Meth-ods for Determining Projective Invariants in Im-agery”, CVGIP: Image Understanding, Vol. 53,No. 1, pp. 46-65, Jan. 1991.
[49] R. S. Millman and G. D. Parker, 1977. Elementsof differential geometry. Prentice Hall, Engle-wood Cliffs, NJ.
[50] F. S. Cohen, W. Ibrahim and C. Pintavi-rooj, “Surface Modeling Using B-Splines,” IEEETrans. on Pattern Analysis and Machine Intel-ligence, Vol. 22, No. 6, pp. 642-648, June 2000.
C. Pintavirooj was born in Bangkok,Thailand in 1962. He received theB. Sc. (Radiation Techniques) andM.Sc. (Biomedical Instrumentation)from Mahidol University, Bangkok,Thailand in 1985 and 1989 respec-tively. In 1995, he received anothermaster degree in Biomedical Engineer-ing from Worcester Polytechnic Insti-tute, MA, USA. In 2000, he earned aPh. D.in Biomedical Engineering from
Drexel University, Philadelphia, PA. After working as a re-search scientist at Biomedical Instrumentation Department,Mahidol University, he joined Electronic Department, Facultyof Engineering, King Mongkut’s Institute of Technology atLadkrabang, Bangkok where he is currently an associate pro-fessor. His current research is in Biomedical Image/ Signal
Processing majoring in Image reconstruction, Image Classifi-cation and Image restoration. Dr. Pintavirooj is the actingchairman of Biomedical Engineering Society of Thailand affil-iated with IFBME.
Fernand S. Cohen received his B.Sc.degree in physics from the AmericanUniversity in Cairo in 1978, and M.Sc.and Ph.D. degrees in electrical engineer-ing from Brown University, Providence,RI, in 1980 and 1983 respectively. Hejoined the department of electrical en-gineering at the University of Rhode Is-land in 1983 as an assistant professor. In1987 he joined the department of electri-cal and computer engineering at Drexel
University, Philadelphia, PA, as a named Chair Associate Pro-fessor. He is currently a professor of Electrical and ComputerEngineering and is affiliated with the School of BiomedicalEngineering, Science and Health Systems, and serves as Di-rector of Imaging and Computer Vision Center (ICVC). Hisresearch interests include medical imaging; computer vision;pattern recognition; signal processing; and applied stochasticprocesses.
INTERNATIONAL JOURNAL OF APPLIED BIOMEDICAL ENGINEERING VOL.2, NO.1 2009 17
Photoacoustic Generation Mechanisms andMeasurement Systems for Biomedical
Applications
Siridech Boonsang, Member
ABSTRACT
Pulsed photoacoustic techniques for measurementsin non-destructive evaluation (NDE) and for non-invasive characterization of tissues have been an in-creasingly attractive research area for over a decade.The physical principle underlying these techniques isbased on the opto-thermal response of an absorbingmedia from pulsed laser sources. Resulting acous-tic waves are generated by the thermal expansionof absorbing volume within the irradiated material.Such waveforms contain valuable information aboutthe optical properties of media, which can be uti-lized for diagnostic information such as the level ofoxygenation in tissue or structure information withintissue. Several research groups have proposed medi-cal diagnostic systems based on pulsed photoacousticmethods. These include intra-arterial imaging andtherapy, the monitoring of glucose level, the monitor-ing of cerebral blood oxygenation, the functional andstructural imaging of brain, the monitoring the inter-face tissue layer within eye, and a diagnostic systemfor breast cancer. This review paper presents the ex-tensive review of the pulsed photoacoustic techniquesfor biomedical applications.
Keywords: photoacoustic; photoacoustic genera-tion; photoacoustic wave
1. INTRODUCTION
Photoacoustic techniques have become more at-tractive for many applications in non-destructive test-ing and evaluation (NDT&E) and there is now agrowing trend to be investigated for several poten-tial biomedical applications. The first quantitativeanalysis of laser ultrasonic measurements was takenabout twenty year ago (Scruby et al. 1980; Dewhurstet al. 1982). Theoretical treatment of laser-generatedultrasound has been published sometime afterwards[1]. Up until now, there are several commercial laserultrasonic systems developed and applied for indus-trial NDE applications. In terms of biomedical ap-plications, the first demonstration of photoacoustic
Manuscript received on June 15, 2009 ; revised on July 15,2009.
S. Boonsang is with the Faculty of Engineering, KingMongkut’s Institute of Technology LadkrabangLad, krabang,Bangkok, 10520
E-mail address: [email protected]
techniques was an integral photoacoustic probe for apotential application of laser angioplasty proposed byChen et al. in 1993 [2][3][4]. Since then, several re-searchers have been extensively investigated this phe-nomenon and have already proposed photoacousticsystems that may be valuable for many medical treat-ments and diagnostics. This paper provides the shortreviews of the photoacoustic generation mechanisms.The applications of photoacoustic wave generation formedical treatments such as photoacoustic ablation ortransdermal drug transfer are also discussed. Towardthe end of the paper, the review details the recentdevelopment in biomedical photoacoustic systems.
2. BACKGROUND THEORY
Acoustic generation in liquids or gases by the in-teraction of laser irradiation can be based on vari-ous mechanisms. These include dielectric breakdown,vaporization or material ablation, thermoelastic pro-cess, electrostriction and the irradiation pressure [5].Dielectric breakdown is the most efficient mechanismsamong those five processes in term of the energy con-version from laser energy to acoustic energy. Thereis the report that the conversion efficiency could beup to 30% in liquid [6]. This mechanism requiresextremely high laser intensities above 1010 W.cm−2.For the absorption of laser intensities below break-down, vaporization process can be responsible for thegeneration of acoustic wave. If the absorbed energy(from laser irradiation) exceeds the boiling thresh-old (2,600 J.cm−3 for the case of water), vapour isejected from the surface. This vaporization processalso produces so-called recoil stresses that pass ona momentum to the absorbing medium. Measure-ments of recoil stresses produced from the irradiationof a nanosecond pulsed laser on to the sample sur-face have been made by direct pressure measurementusing piezoelectric transducers [7][8][9][10]. For ex-ample, the average peak pressure for skin vaporiza-tion at the radiant exposure of 20 J.cm−2 was about0.3 MPa [11]. The energy conversion efficiency forvaporization process can be up to 1% in liquid [6].
Thermoelastic process is caused by the transientheating (by the absorption of laser irradiation) ofa constrained volume within an absorbing medium[1]. The resulting temperature gradient producesthe thermal expansion, which consecutively radiateacoustic wave propagating away from the heated
18 S. Boonsang: Photoacoustic Generation Mechanisms and Measurement Systems for Bomedical Applications (17-23)
zone. The energy conversion efficiency of this pro-cess is relatively low: for example, the conversion ef-ficiency of laser to stress wave is only 1.3×10⁻⁶ forthermoelastic pressure amplitude of one bar gener-ated in water [12]. However, this process is moreattractive for non-destructive evaluation of tissuesbecause it has relatively less thermal effect on themedium (no phase change within the medium).
The non-destructive and reversible features of pho-toacoustic generation in thermoelastic regime havemade it attractive for many applications in medicaldiagnostic. Several medical applications i.e. breastcancer detection [13] based on this regime have beenreported.
3. BIOLOGICAL EFFECTS OF PHOTOA-COUSTIC WAVES
Biological effects of laser irradiation have been ex-tensively studied since the commencement of the ap-plication of laser in medical researches [14]. Thestress wave or pressure wave as a result from laserirradiation can be generated from either ablation orrapid heating in thermoelastic regime. Characteris-tics and effects of the pressure wave in ablation regimeis thoroughly discussed in the paper [15]. In thermoe-lastic regime, however, the characteristic of pressurewave is more complex than that in ablation regime[15]. The interaction of biological tissue and pho-toacoustic wave in this regime involves complicatedprocesses [15][12]. The exact nature of interactionof thermoelastic photoacoustic wave with biologicaltissues is comprehensively under investigated. Thestudies of biological effects of photoacoustic wave canbe categorised in two main themes. Firstly, com-bined effects of laser irradiation, heating effects, cavi-tation and pressure waves have been considered withthe laser pulse energies below the complete vapor-ized ablation threshold [12][16][17][18]. In this theme,their research emphasised on the pressure wave me-chanic and its physical effects in tissue level. Theterm so-called “photomechanical ablation” is usuallyemployed to describe this effect. In the other hand,the second theme involved the investigation of solelypressure wave effect on biological tissues [15]. Theirapproaches were to generate the pressure wave out-side cell cultures by using a highly absorbing material(polyimide or polystyrene) as a laser target. The re-sulting high-amplitude (several hundred bar) pressurewave propagates into the medium containing cells un-der investigation [19][20]. By this arrangement setup,the effects of laser irradiation, heat and cavitationwere minimized.
Ablation techniques based on laser irradiation aremainly based on three processes namely: photother-mal, phochemical and photomechanical decomposi-tions [21]. Photothermal decomposition refers totissue ablation by vaporization of irradiated tissuesto relatively high temperatures (normally more than
boiling threshold). Photochemical decomposition isprincipally caused by the chemically interaction oftissue molecules with photon energies, resulting inthe fracture of chemical bonds [21]. These two pro-cesses require relatively high laser intensity in or-der to achieve the effective ablation. In contrast,photomechanical ablation process in thermoelasticregime firstly reported by Dingus and Scammon re-quires the laser energy density 10 times less thanthat for the complete vaporization [22]. This processhas the implication of providing a controlled abla-tion method with the minimum damage to remainingtissues. The mechanism of photomechanical processhas been extensively studied [12][18][22][23]. Gooddescription of the mechanism of photomechanical ab-lation presented by Paltauf et al.[12] is shown in Fig-ure 1.
A short laser pulse (short enough to create pres-sure waves under thermal and stress confinements) isused to generate thermoelastic stress in a tissue (Fig-ure 1(a)). The initial pressure distribution within thetissue is determined by the optical absorption coeffi-cient, which is assumed constant. This initial pres-sure distribution is entirely positive or compressivestress acting in the perpendicular direction to thesurface. Thermoelastic pressure wave propagates inthe right hand side direction with the speed of soundin tissue. Due to acoustic mismatch at the tissue-air interface, the negative pressure (tensile stress) iscreated (Figure 1(b)). Since most of tissue materi-als are weaker in tension rather than compression,the material will fail whenever the imposed tensilestress exceeds its threshold σ∗. If the negative pres-sure (tensile stress) is about the threshold (Figure1(c)), it may cause the tissue fracture or cavitationat a certain depth[18] (Figure 1(d)) and followed bythe ejection of the tissue fragment at the front sur-face (Figure 1e)). The term “photospallation” hasbeen used to describe this effect [24][12]. It is worthnoting here that not only the tensile stress but alsothe heating contributes to the material ablation [12].
The photomechanical ablation threshold (normallydescribed in term of energy density as the product ofI0 ) for biological tissue is similar to that of water.Oraevsky et al. [25] reported the ablation thresholdsfor the aqueous solution, collagen gel, and liver were20, 38, and 55 J.cm−3, respectively, which correspondto temperature increment of 5, 10, and 15 C. Pal-tauf et al. [18] reported that the thresholds of bothwater and gelatine are linearly proportional to theabsorption coefficient of a sample. The value of thethreshold is in the range of several hundred J.cm−3,which is greatly lower than the vaporization thresh-old of water (2,600 J.cm−3 for the case of water). Thedifference between these two reports may be causedby the different methods of measurements.
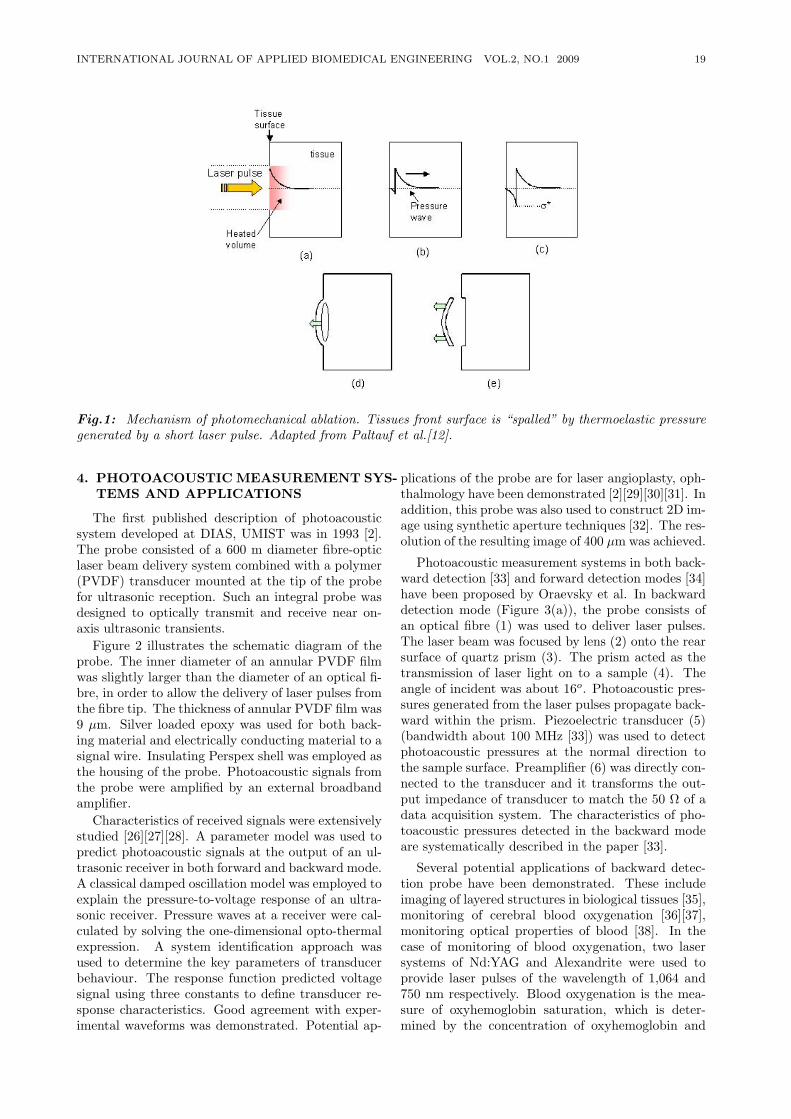
INTERNATIONAL JOURNAL OF APPLIED BIOMEDICAL ENGINEERING VOL.2, NO.1 2009 19
Fig.1: Mechanism of photomechanical ablation. Tissues front surface is “spalled” by thermoelastic pressuregenerated by a short laser pulse. Adapted from Paltauf et al.[12].
4. PHOTOACOUSTIC MEASUREMENT SYS-TEMS AND APPLICATIONS
The first published description of photoacousticsystem developed at DIAS, UMIST was in 1993 [2].The probe consisted of a 600 m diameter fibre-opticlaser beam delivery system combined with a polymer(PVDF) transducer mounted at the tip of the probefor ultrasonic reception. Such an integral probe wasdesigned to optically transmit and receive near on-axis ultrasonic transients.
Figure 2 illustrates the schematic diagram of theprobe. The inner diameter of an annular PVDF filmwas slightly larger than the diameter of an optical fi-bre, in order to allow the delivery of laser pulses fromthe fibre tip. The thickness of annular PVDF film was9 µm. Silver loaded epoxy was used for both back-ing material and electrically conducting material to asignal wire. Insulating Perspex shell was employed asthe housing of the probe. Photoacoustic signals fromthe probe were amplified by an external broadbandamplifier.
Characteristics of received signals were extensivelystudied [26][27][28]. A parameter model was used topredict photoacoustic signals at the output of an ul-trasonic receiver in both forward and backward mode.A classical damped oscillation model was employed toexplain the pressure-to-voltage response of an ultra-sonic receiver. Pressure waves at a receiver were cal-culated by solving the one-dimensional opto-thermalexpression. A system identification approach wasused to determine the key parameters of transducerbehaviour. The response function predicted voltagesignal using three constants to define transducer re-sponse characteristics. Good agreement with exper-imental waveforms was demonstrated. Potential ap-
plications of the probe are for laser angioplasty, oph-thalmology have been demonstrated [2][29][30][31]. Inaddition, this probe was also used to construct 2D im-age using synthetic aperture techniques [32]. The res-olution of the resulting image of 400 µm was achieved.
Photoacoustic measurement systems in both back-ward detection [33] and forward detection modes [34]have been proposed by Oraevsky et al. In backwarddetection mode (Figure 3(a)), the probe consists ofan optical fibre (1) was used to deliver laser pulses.The laser beam was focused by lens (2) onto the rearsurface of quartz prism (3). The prism acted as thetransmission of laser light on to a sample (4). Theangle of incident was about 16o. Photoacoustic pres-sures generated from the laser pulses propagate back-ward within the prism. Piezoelectric transducer (5)(bandwidth about 100 MHz [33]) was used to detectphotoacoustic pressures at the normal direction tothe sample surface. Preamplifier (6) was directly con-nected to the transducer and it transforms the out-put impedance of transducer to match the 50 Ω of adata acquisition system. The characteristics of pho-toacoustic pressures detected in the backward modeare systematically described in the paper [33].
Several potential applications of backward detec-tion probe have been demonstrated. These includeimaging of layered structures in biological tissues [35],monitoring of cerebral blood oxygenation [36][37],monitoring optical properties of blood [38]. In thecase of monitoring of blood oxygenation, two lasersystems of Nd:YAG and Alexandrite were used toprovide laser pulses of the wavelength of 1,064 and750 nm respectively. Blood oxygenation is the mea-sure of oxyhemoglobin saturation, which is deter-mined by the concentration of oxyhemoglobin and
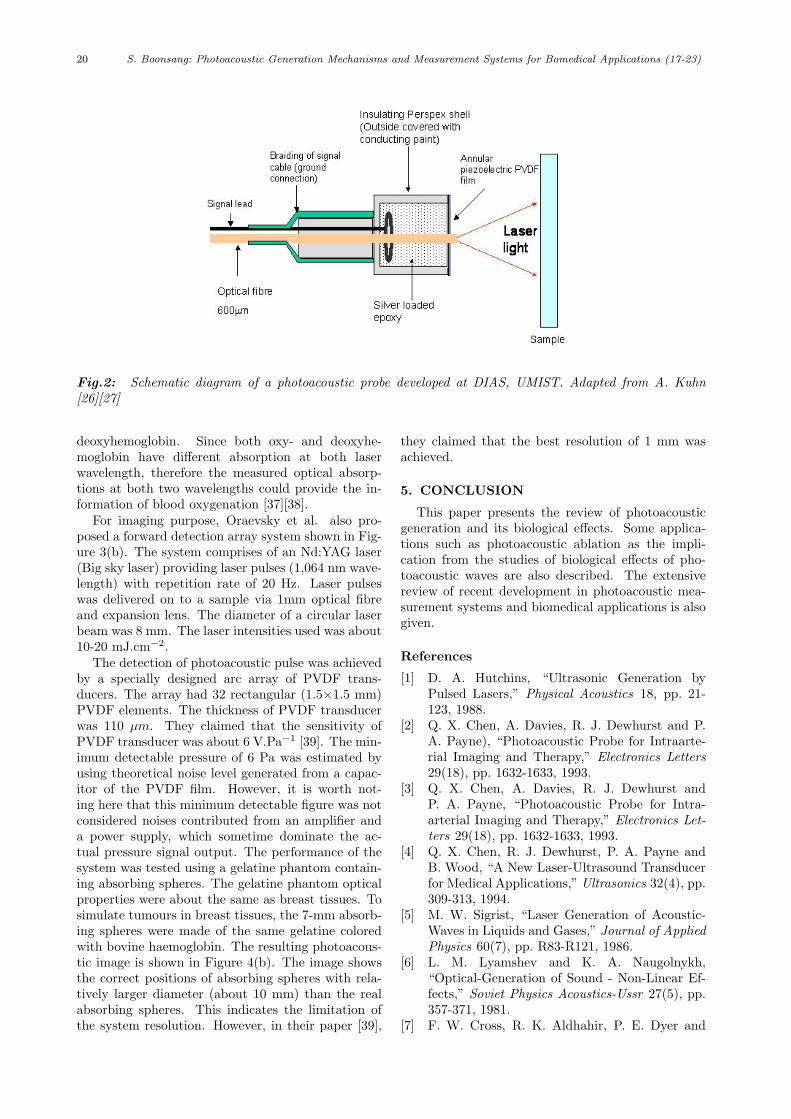
20 S. Boonsang: Photoacoustic Generation Mechanisms and Measurement Systems for Bomedical Applications (17-23)
Fig.2: Schematic diagram of a photoacoustic probe developed at DIAS, UMIST. Adapted from A. Kuhn[26][27]
deoxyhemoglobin. Since both oxy- and deoxyhe-moglobin have different absorption at both laserwavelength, therefore the measured optical absorp-tions at both two wavelengths could provide the in-formation of blood oxygenation [37][38].
For imaging purpose, Oraevsky et al. also pro-posed a forward detection array system shown in Fig-ure 3(b). The system comprises of an Nd:YAG laser(Big sky laser) providing laser pulses (1,064 nm wave-length) with repetition rate of 20 Hz. Laser pulseswas delivered on to a sample via 1mm optical fibreand expansion lens. The diameter of a circular laserbeam was 8 mm. The laser intensities used was about10-20 mJ.cm−2.
The detection of photoacoustic pulse was achievedby a specially designed arc array of PVDF trans-ducers. The array had 32 rectangular (1.5×1.5 mm)PVDF elements. The thickness of PVDF transducerwas 110 µm. They claimed that the sensitivity ofPVDF transducer was about 6 V.Pa−1 [39]. The min-imum detectable pressure of 6 Pa was estimated byusing theoretical noise level generated from a capac-itor of the PVDF film. However, it is worth not-ing here that this minimum detectable figure was notconsidered noises contributed from an amplifier anda power supply, which sometime dominate the ac-tual pressure signal output. The performance of thesystem was tested using a gelatine phantom contain-ing absorbing spheres. The gelatine phantom opticalproperties were about the same as breast tissues. Tosimulate tumours in breast tissues, the 7-mm absorb-ing spheres were made of the same gelatine coloredwith bovine haemoglobin. The resulting photoacous-tic image is shown in Figure 4(b). The image showsthe correct positions of absorbing spheres with rela-tively larger diameter (about 10 mm) than the realabsorbing spheres. This indicates the limitation ofthe system resolution. However, in their paper [39],
they claimed that the best resolution of 1 mm wasachieved.
5. CONCLUSION
This paper presents the review of photoacousticgeneration and its biological effects. Some applica-tions such as photoacoustic ablation as the impli-cation from the studies of biological effects of pho-toacoustic waves are also described. The extensivereview of recent development in photoacoustic mea-surement systems and biomedical applications is alsogiven.
References
[1] D. A. Hutchins, “Ultrasonic Generation byPulsed Lasers,” Physical Acoustics 18, pp. 21-123, 1988.
[2] Q. X. Chen, A. Davies, R. J. Dewhurst and P.A. Payne), “Photoacoustic Probe for Intraarte-rial Imaging and Therapy,” Electronics Letters29(18), pp. 1632-1633, 1993.
[3] Q. X. Chen, A. Davies, R. J. Dewhurst andP. A. Payne, “Photoacoustic Probe for Intra-arterial Imaging and Therapy,” Electronics Let-ters 29(18), pp. 1632-1633, 1993.
[4] Q. X. Chen, R. J. Dewhurst, P. A. Payne andB. Wood, “A New Laser-Ultrasound Transducerfor Medical Applications,” Ultrasonics 32(4), pp.309-313, 1994.
[5] M. W. Sigrist, “Laser Generation of Acoustic-Waves in Liquids and Gases,” Journal of AppliedPhysics 60(7), pp. R83-R121, 1986.
[6] L. M. Lyamshev and K. A. Naugolnykh,“Optical-Generation of Sound - Non-Linear Ef-fects,” Soviet Physics Acoustics-Ussr 27(5), pp.357-371, 1981.
[7] F. W. Cross, R. K. Aldhahir, P. E. Dyer and
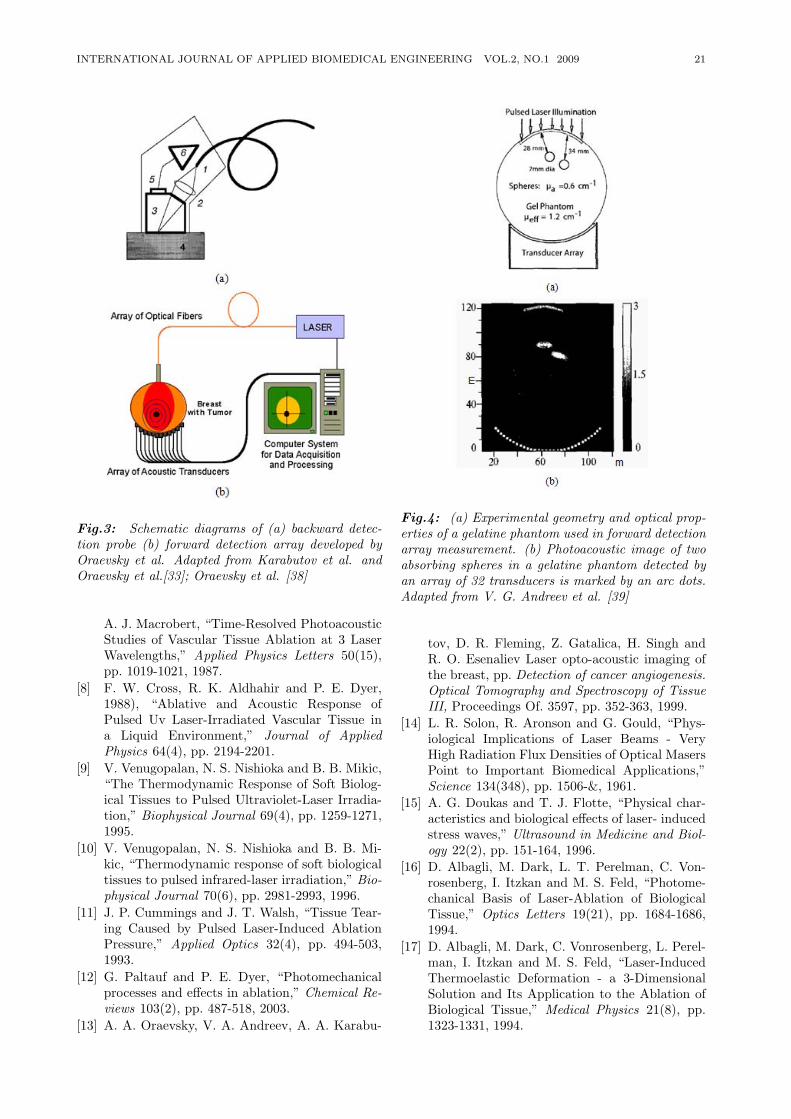
INTERNATIONAL JOURNAL OF APPLIED BIOMEDICAL ENGINEERING VOL.2, NO.1 2009 21
Fig.3: Schematic diagrams of (a) backward detec-tion probe (b) forward detection array developed byOraevsky et al. Adapted from Karabutov et al. andOraevsky et al.[33]; Oraevsky et al. [38]
A. J. Macrobert, “Time-Resolved PhotoacousticStudies of Vascular Tissue Ablation at 3 LaserWavelengths,” Applied Physics Letters 50(15),pp. 1019-1021, 1987.
[8] F. W. Cross, R. K. Aldhahir and P. E. Dyer,1988), “Ablative and Acoustic Response ofPulsed Uv Laser-Irradiated Vascular Tissue ina Liquid Environment,” Journal of AppliedPhysics 64(4), pp. 2194-2201.
[9] V. Venugopalan, N. S. Nishioka and B. B. Mikic,“The Thermodynamic Response of Soft Biolog-ical Tissues to Pulsed Ultraviolet-Laser Irradia-tion,” Biophysical Journal 69(4), pp. 1259-1271,1995.
[10] V. Venugopalan, N. S. Nishioka and B. B. Mi-kic, “Thermodynamic response of soft biologicaltissues to pulsed infrared-laser irradiation,” Bio-physical Journal 70(6), pp. 2981-2993, 1996.
[11] J. P. Cummings and J. T. Walsh, “Tissue Tear-ing Caused by Pulsed Laser-Induced AblationPressure,” Applied Optics 32(4), pp. 494-503,1993.
[12] G. Paltauf and P. E. Dyer, “Photomechanicalprocesses and effects in ablation,” Chemical Re-views 103(2), pp. 487-518, 2003.
[13] A. A. Oraevsky, V. A. Andreev, A. A. Karabu-
Fig.4: (a) Experimental geometry and optical prop-erties of a gelatine phantom used in forward detectionarray measurement. (b) Photoacoustic image of twoabsorbing spheres in a gelatine phantom detected byan array of 32 transducers is marked by an arc dots.Adapted from V. G. Andreev et al. [39]
tov, D. R. Fleming, Z. Gatalica, H. Singh andR. O. Esenaliev Laser opto-acoustic imaging ofthe breast, pp. Detection of cancer angiogenesis.Optical Tomography and Spectroscopy of TissueIII, Proceedings Of. 3597, pp. 352-363, 1999.
[14] L. R. Solon, R. Aronson and G. Gould, “Phys-iological Implications of Laser Beams - VeryHigh Radiation Flux Densities of Optical MasersPoint to Important Biomedical Applications,”Science 134(348), pp. 1506-&, 1961.
[15] A. G. Doukas and T. J. Flotte, “Physical char-acteristics and biological effects of laser- inducedstress waves,” Ultrasound in Medicine and Biol-ogy 22(2), pp. 151-164, 1996.
[16] D. Albagli, M. Dark, L. T. Perelman, C. Von-rosenberg, I. Itzkan and M. S. Feld, “Photome-chanical Basis of Laser-Ablation of BiologicalTissue,” Optics Letters 19(21), pp. 1684-1686,1994.
[17] D. Albagli, M. Dark, C. Vonrosenberg, L. Perel-man, I. Itzkan and M. S. Feld, “Laser-InducedThermoelastic Deformation - a 3-DimensionalSolution and Its Application to the Ablation ofBiological Tissue,” Medical Physics 21(8), pp.1323-1331, 1994.
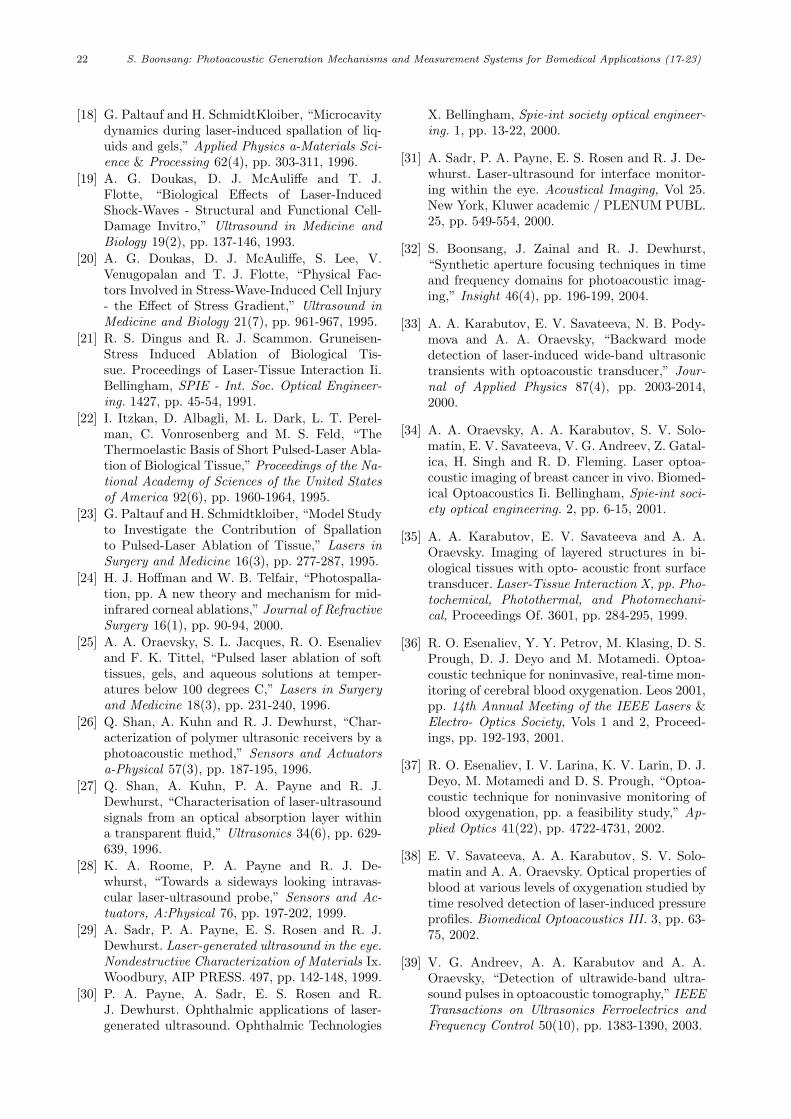
22 S. Boonsang: Photoacoustic Generation Mechanisms and Measurement Systems for Bomedical Applications (17-23)
[18] G. Paltauf and H. SchmidtKloiber, “Microcavitydynamics during laser-induced spallation of liq-uids and gels,” Applied Physics a-Materials Sci-ence & Processing 62(4), pp. 303-311, 1996.
[19] A. G. Doukas, D. J. McAuliffe and T. J.Flotte, “Biological Effects of Laser-InducedShock-Waves - Structural and Functional Cell-Damage Invitro,” Ultrasound in Medicine andBiology 19(2), pp. 137-146, 1993.
[20] A. G. Doukas, D. J. McAuliffe, S. Lee, V.Venugopalan and T. J. Flotte, “Physical Fac-tors Involved in Stress-Wave-Induced Cell Injury- the Effect of Stress Gradient,” Ultrasound inMedicine and Biology 21(7), pp. 961-967, 1995.
[21] R. S. Dingus and R. J. Scammon. Gruneisen-Stress Induced Ablation of Biological Tis-sue. Proceedings of Laser-Tissue Interaction Ii.Bellingham, SPIE - Int. Soc. Optical Engineer-ing. 1427, pp. 45-54, 1991.
[22] I. Itzkan, D. Albagli, M. L. Dark, L. T. Perel-man, C. Vonrosenberg and M. S. Feld, “TheThermoelastic Basis of Short Pulsed-Laser Abla-tion of Biological Tissue,” Proceedings of the Na-tional Academy of Sciences of the United Statesof America 92(6), pp. 1960-1964, 1995.
[23] G. Paltauf and H. Schmidtkloiber, “Model Studyto Investigate the Contribution of Spallationto Pulsed-Laser Ablation of Tissue,” Lasers inSurgery and Medicine 16(3), pp. 277-287, 1995.
[24] H. J. Hoffman and W. B. Telfair, “Photospalla-tion, pp. A new theory and mechanism for mid-infrared corneal ablations,” Journal of RefractiveSurgery 16(1), pp. 90-94, 2000.
[25] A. A. Oraevsky, S. L. Jacques, R. O. Esenalievand F. K. Tittel, “Pulsed laser ablation of softtissues, gels, and aqueous solutions at temper-atures below 100 degrees C,” Lasers in Surgeryand Medicine 18(3), pp. 231-240, 1996.
[26] Q. Shan, A. Kuhn and R. J. Dewhurst, “Char-acterization of polymer ultrasonic receivers by aphotoacoustic method,” Sensors and Actuatorsa-Physical 57(3), pp. 187-195, 1996.
[27] Q. Shan, A. Kuhn, P. A. Payne and R. J.Dewhurst, “Characterisation of laser-ultrasoundsignals from an optical absorption layer withina transparent fluid,” Ultrasonics 34(6), pp. 629-639, 1996.
[28] K. A. Roome, P. A. Payne and R. J. De-whurst, “Towards a sideways looking intravas-cular laser-ultrasound probe,” Sensors and Ac-tuators, A:Physical 76, pp. 197-202, 1999.
[29] A. Sadr, P. A. Payne, E. S. Rosen and R. J.Dewhurst. Laser-generated ultrasound in the eye.Nondestructive Characterization of Materials Ix.Woodbury, AIP PRESS. 497, pp. 142-148, 1999.
[30] P. A. Payne, A. Sadr, E. S. Rosen and R.J. Dewhurst. Ophthalmic applications of laser-generated ultrasound. Ophthalmic Technologies
X. Bellingham, Spie-int society optical engineer-ing. 1, pp. 13-22, 2000.
[31] A. Sadr, P. A. Payne, E. S. Rosen and R. J. De-whurst. Laser-ultrasound for interface monitor-ing within the eye. Acoustical Imaging, Vol 25.New York, Kluwer academic / PLENUM PUBL.25, pp. 549-554, 2000.
[32] S. Boonsang, J. Zainal and R. J. Dewhurst,“Synthetic aperture focusing techniques in timeand frequency domains for photoacoustic imag-ing,” Insight 46(4), pp. 196-199, 2004.
[33] A. A. Karabutov, E. V. Savateeva, N. B. Pody-mova and A. A. Oraevsky, “Backward modedetection of laser-induced wide-band ultrasonictransients with optoacoustic transducer,” Jour-nal of Applied Physics 87(4), pp. 2003-2014,2000.
[34] A. A. Oraevsky, A. A. Karabutov, S. V. Solo-matin, E. V. Savateeva, V. G. Andreev, Z. Gatal-ica, H. Singh and R. D. Fleming. Laser optoa-coustic imaging of breast cancer in vivo. Biomed-ical Optoacoustics Ii. Bellingham, Spie-int soci-ety optical engineering. 2, pp. 6-15, 2001.
[35] A. A. Karabutov, E. V. Savateeva and A. A.Oraevsky. Imaging of layered structures in bi-ological tissues with opto- acoustic front surfacetransducer. Laser-Tissue Interaction X, pp. Pho-tochemical, Photothermal, and Photomechani-cal, Proceedings Of. 3601, pp. 284-295, 1999.
[36] R. O. Esenaliev, Y. Y. Petrov, M. Klasing, D. S.Prough, D. J. Deyo and M. Motamedi. Optoa-coustic technique for noninvasive, real-time mon-itoring of cerebral blood oxygenation. Leos 2001,pp. 14th Annual Meeting of the IEEE Lasers &Electro- Optics Society, Vols 1 and 2, Proceed-ings, pp. 192-193, 2001.
[37] R. O. Esenaliev, I. V. Larina, K. V. Larin, D. J.Deyo, M. Motamedi and D. S. Prough, “Optoa-coustic technique for noninvasive monitoring ofblood oxygenation, pp. a feasibility study,” Ap-plied Optics 41(22), pp. 4722-4731, 2002.
[38] E. V. Savateeva, A. A. Karabutov, S. V. Solo-matin and A. A. Oraevsky. Optical properties ofblood at various levels of oxygenation studied bytime resolved detection of laser-induced pressureprofiles. Biomedical Optoacoustics III. 3, pp. 63-75, 2002.
[39] V. G. Andreev, A. A. Karabutov and A. A.Oraevsky, “Detection of ultrawide-band ultra-sound pulses in optoacoustic tomography,” IEEETransactions on Ultrasonics Ferroelectrics andFrequency Control 50(10), pp. 1383-1390, 2003.

INTERNATIONAL JOURNAL OF APPLIED BIOMEDICAL ENGINEERING VOL.2, NO.1 2009 23
S. Boonsang received his bachelor de-gree (Honours) in electrical engineeringfrom King Mongkut’s Institute of Tech-nology Ladkrabang (KMITL), Bangkok,Thailand, in 1995, MSc in electri-cal engineering (electronic instrumenta-tion system) from University of Manch-ester Institute Science and Technology(UMIST), UK, in 2000 and PhD in in-strumentation from the same universityin 2004. He had been working in Engi-
neering Department, Siam Cement Public Company for 5 yearsbefore he became a lecturer in the Electronics Department,Faculty of Engineering, KMITL, in 2005. His research area isin photonic and ultrasonic instrumentations for biomedical andNDE applications. Now he is also the associate director of Col-lege of Data Storage Technology and Applications at KMITL.
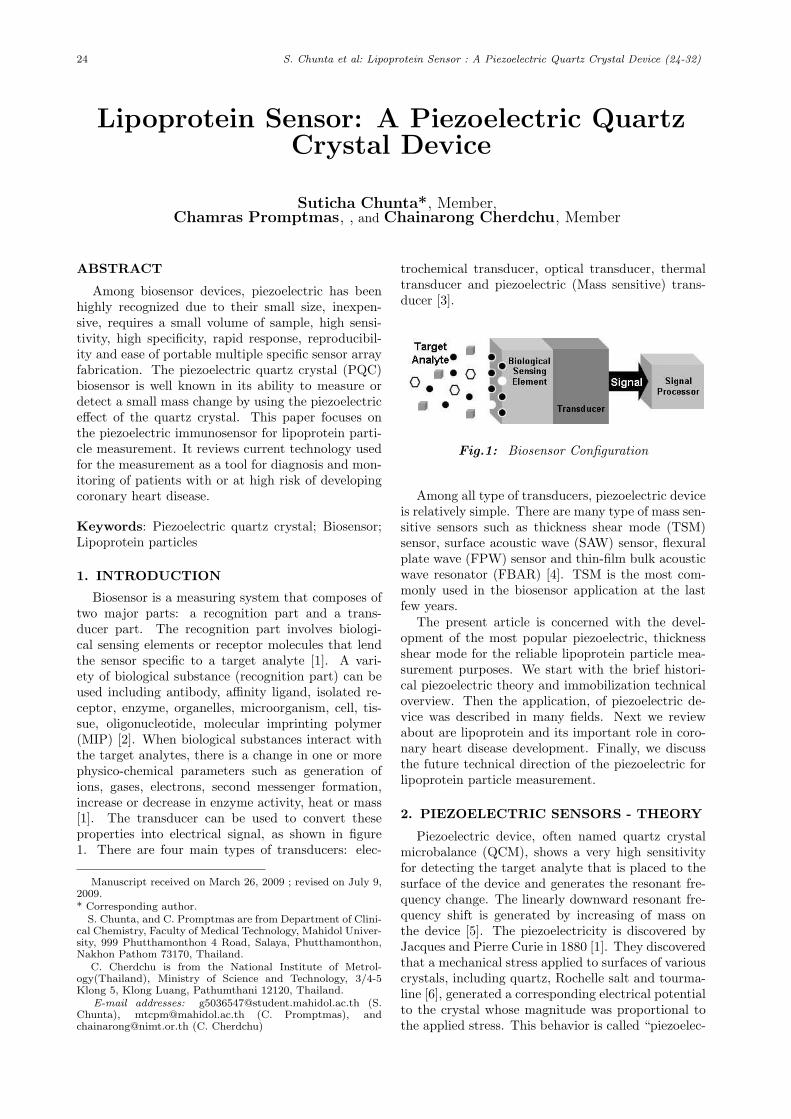
24 S. Chunta et al: Lipoprotein Sensor : A Piezoelectric Quartz Crystal Device (24-32)
Lipoprotein Sensor: A Piezoelectric QuartzCrystal Device
Suticha Chunta*, Member,Chamras Promptmas, , and Chainarong Cherdchu, Member
ABSTRACT
Among biosensor devices, piezoelectric has beenhighly recognized due to their small size, inexpen-sive, requires a small volume of sample, high sensi-tivity, high specificity, rapid response, reproducibil-ity and ease of portable multiple specific sensor arrayfabrication. The piezoelectric quartz crystal (PQC)biosensor is well known in its ability to measure ordetect a small mass change by using the piezoelectriceffect of the quartz crystal. This paper focuses onthe piezoelectric immunosensor for lipoprotein parti-cle measurement. It reviews current technology usedfor the measurement as a tool for diagnosis and mon-itoring of patients with or at high risk of developingcoronary heart disease.
Keywords: Piezoelectric quartz crystal; Biosensor;Lipoprotein particles
1. INTRODUCTION
Biosensor is a measuring system that composes oftwo major parts: a recognition part and a trans-ducer part. The recognition part involves biologi-cal sensing elements or receptor molecules that lendthe sensor specific to a target analyte [1]. A vari-ety of biological substance (recognition part) can beused including antibody, affinity ligand, isolated re-ceptor, enzyme, organelles, microorganism, cell, tis-sue, oligonucleotide, molecular imprinting polymer(MIP) [2]. When biological substances interact withthe target analytes, there is a change in one or morephysico-chemical parameters such as generation ofions, gases, electrons, second messenger formation,increase or decrease in enzyme activity, heat or mass[1]. The transducer can be used to convert theseproperties into electrical signal, as shown in figure1. There are four main types of transducers: elec-
Manuscript received on March 26, 2009 ; revised on July 9,2009.* Corresponding author.
S. Chunta, and C. Promptmas are from Department of Clini-cal Chemistry, Faculty of Medical Technology, Mahidol Univer-sity, 999 Phutthamonthon 4 Road, Salaya, Phutthamonthon,Nakhon Pathom 73170, Thailand.
C. Cherdchu is from the National Institute of Metrol-ogy(Thailand), Ministry of Science and Technology, 3/4-5Klong 5, Klong Luang, Pathumthani 12120, Thailand.
E-mail addresses: [email protected] (S.Chunta), [email protected] (C. Promptmas), [email protected] (C. Cherdchu)
trochemical transducer, optical transducer, thermaltransducer and piezoelectric (Mass sensitive) trans-ducer [3].
Fig.1: Biosensor Configuration
Among all type of transducers, piezoelectric deviceis relatively simple. There are many type of mass sen-sitive sensors such as thickness shear mode (TSM)sensor, surface acoustic wave (SAW) sensor, flexuralplate wave (FPW) sensor and thin-film bulk acousticwave resonator (FBAR) [4]. TSM is the most com-monly used in the biosensor application at the lastfew years.
The present article is concerned with the devel-opment of the most popular piezoelectric, thicknessshear mode for the reliable lipoprotein particle mea-surement purposes. We start with the brief histori-cal piezoelectric theory and immobilization technicaloverview. Then the application, of piezoelectric de-vice was described in many fields. Next we reviewabout are lipoprotein and its important role in coro-nary heart disease development. Finally, we discussthe future technical direction of the piezoelectric forlipoprotein particle measurement.
2. PIEZOELECTRIC SENSORS - THEORY
Piezoelectric device, often named quartz crystalmicrobalance (QCM), shows a very high sensitivityfor detecting the target analyte that is placed to thesurface of the device and generates the resonant fre-quency change. The linearly downward resonant fre-quency shift is generated by increasing of mass onthe device [5]. The piezoelectricity is discovered byJacques and Pierre Curie in 1880 [1]. They discoveredthat a mechanical stress applied to surfaces of variouscrystals, including quartz, Rochelle salt and tourma-line [6], generated a corresponding electrical potentialto the crystal whose magnitude was proportional tothe applied stress. This behavior is called “piezoelec-
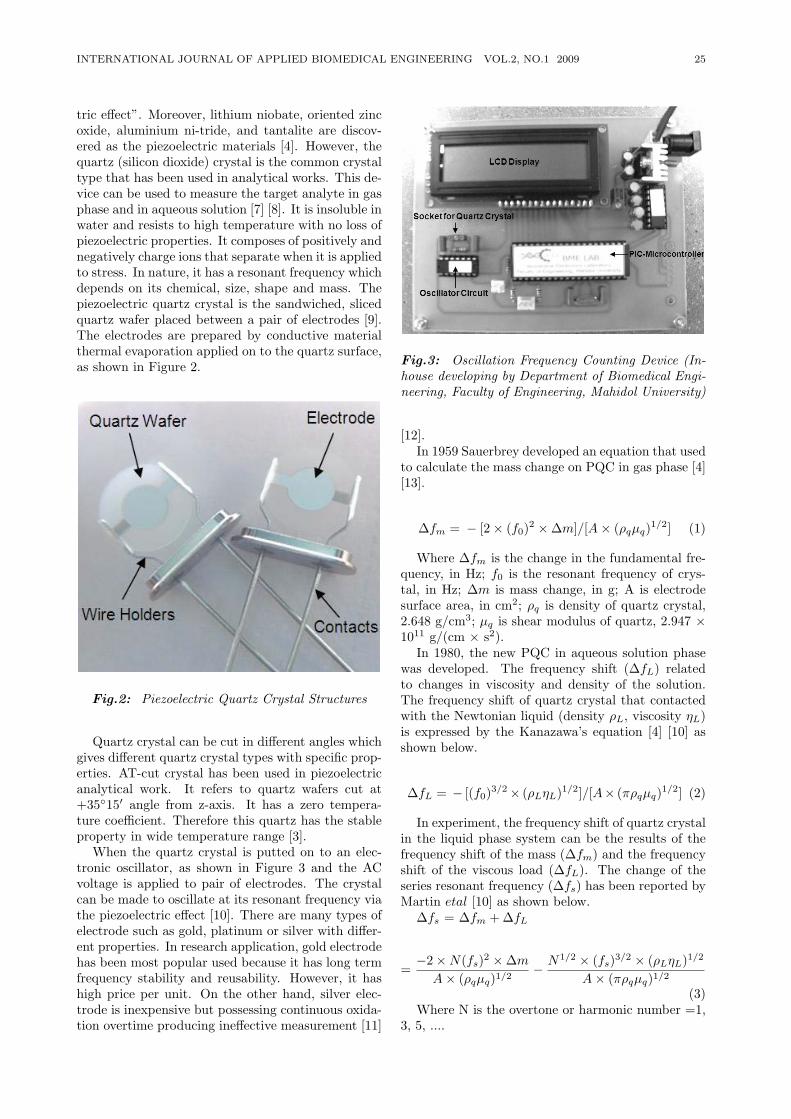
INTERNATIONAL JOURNAL OF APPLIED BIOMEDICAL ENGINEERING VOL.2, NO.1 2009 25
tric effect”. Moreover, lithium niobate, oriented zincoxide, aluminium ni-tride, and tantalite are discov-ered as the piezoelectric materials [4]. However, thequartz (silicon dioxide) crystal is the common crystaltype that has been used in analytical works. This de-vice can be used to measure the target analyte in gasphase and in aqueous solution [7] [8]. It is insoluble inwater and resists to high temperature with no loss ofpiezoelectric properties. It composes of positively andnegatively charge ions that separate when it is appliedto stress. In nature, it has a resonant frequency whichdepends on its chemical, size, shape and mass. Thepiezoelectric quartz crystal is the sandwiched, slicedquartz wafer placed between a pair of electrodes [9].The electrodes are prepared by conductive materialthermal evaporation applied on to the quartz surface,as shown in Figure 2.
Fig.2: Piezoelectric Quartz Crystal Structures
Quartz crystal can be cut in different angles whichgives different quartz crystal types with specific prop-erties. AT-cut crystal has been used in piezoelectricanalytical work. It refers to quartz wafers cut at+3515′ angle from z-axis. It has a zero tempera-ture coefficient. Therefore this quartz has the stableproperty in wide temperature range [3].
When the quartz crystal is putted on to an elec-tronic oscillator, as shown in Figure 3 and the ACvoltage is applied to pair of electrodes. The crystalcan be made to oscillate at its resonant frequency viathe piezoelectric effect [10]. There are many types ofelectrode such as gold, platinum or silver with differ-ent properties. In research application, gold electrodehas been most popular used because it has long termfrequency stability and reusability. However, it hashigh price per unit. On the other hand, silver elec-trode is inexpensive but possessing continuous oxida-tion overtime producing ineffective measurement [11]
Fig.3: Oscillation Frequency Counting Device (In-house developing by Department of Biomedical Engi-neering, Faculty of Engineering, Mahidol University)
[12].In 1959 Sauerbrey developed an equation that used
to calculate the mass change on PQC in gas phase [4][13].
∆fm = − [2 × (f0)2 × ∆m]/[A× (ρqµq)1/2] (1)
Where ∆fm is the change in the fundamental fre-quency, in Hz; f0 is the resonant frequency of crys-tal, in Hz; ∆m is mass change, in g; A is electrodesurface area, in cm2; ρq is density of quartz crystal,2.648 g/cm3; µq is shear modulus of quartz, 2.947 ×10¹¹ g/(cm × s2).
In 1980, the new PQC in aqueous solution phasewas developed. The frequency shift (∆fL) relatedto changes in viscosity and density of the solution.The frequency shift of quartz crystal that contactedwith the Newtonian liquid (density ρL, viscosity ηL)is expressed by the Kanazawa’s equation [4] [10] asshown below.
∆fL = − [(f0)3/2× (ρLηL)1/2]/[A× (πρqµq)1/2] (2)
In experiment, the frequency shift of quartz crystalin the liquid phase system can be the results of thefrequency shift of the mass (∆fm) and the frequencyshift of the viscous load (∆fL). The change of theseries resonant frequency (∆fs) has been reported byMartin etal [10] as shown below.
∆fs = ∆fm + ∆fL
=−2 ×N(fs)2 × ∆mA× (ρqµq)1/2
− N1/2 × (fs)3/2 × (ρLηL)1/2
A× (πρqµq)1/2
(3)Where N is the overtone or harmonic number =1,
3, 5, ....
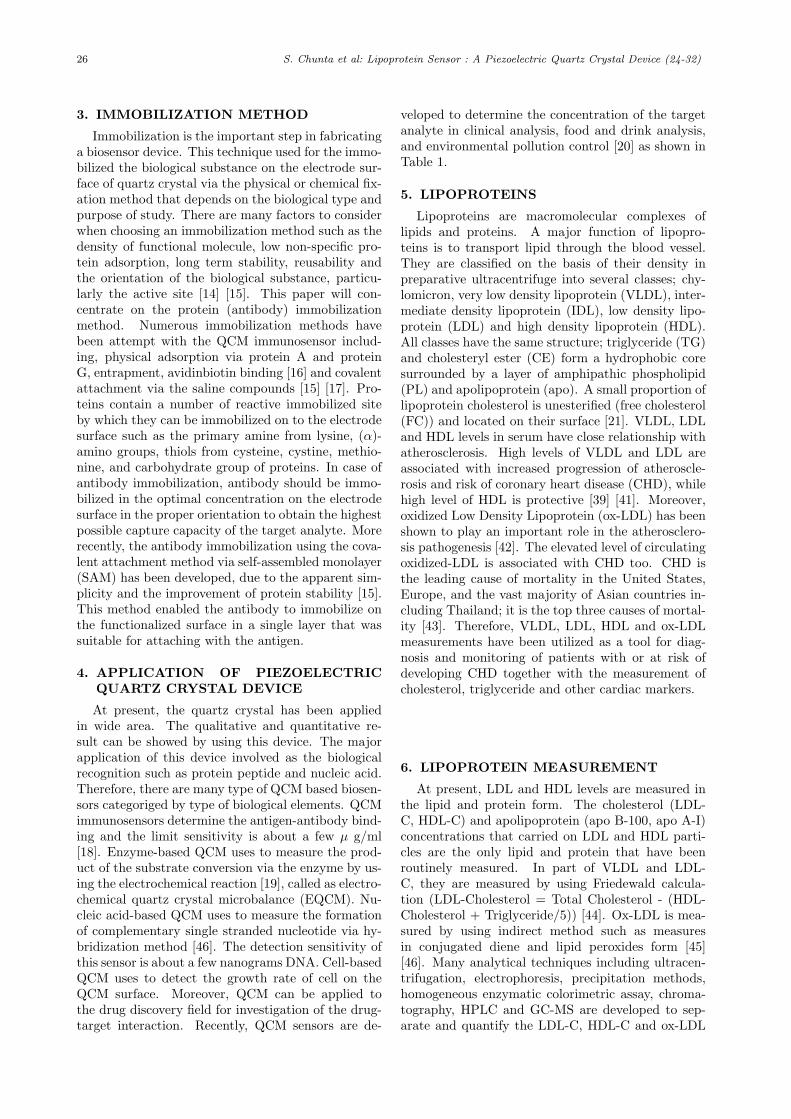
26 S. Chunta et al: Lipoprotein Sensor : A Piezoelectric Quartz Crystal Device (24-32)
3. IMMOBILIZATION METHOD
Immobilization is the important step in fabricatinga biosensor device. This technique used for the immo-bilized the biological substance on the electrode sur-face of quartz crystal via the physical or chemical fix-ation method that depends on the biological type andpurpose of study. There are many factors to considerwhen choosing an immobilization method such as thedensity of functional molecule, low non-specific pro-tein adsorption, long term stability, reusability andthe orientation of the biological substance, particu-larly the active site [14] [15]. This paper will con-centrate on the protein (antibody) immobilizationmethod. Numerous immobilization methods havebeen attempt with the QCM immunosensor includ-ing, physical adsorption via protein A and proteinG, entrapment, avidinbiotin binding [16] and covalentattachment via the saline compounds [15] [17]. Pro-teins contain a number of reactive immobilized siteby which they can be immobilized on to the electrodesurface such as the primary amine from lysine, (α)-amino groups, thiols from cysteine, cystine, methio-nine, and carbohydrate group of proteins. In case ofantibody immobilization, antibody should be immo-bilized in the optimal concentration on the electrodesurface in the proper orientation to obtain the highestpossible capture capacity of the target analyte. Morerecently, the antibody immobilization using the cova-lent attachment method via self-assembled monolayer(SAM) has been developed, due to the apparent sim-plicity and the improvement of protein stability [15].This method enabled the antibody to immobilize onthe functionalized surface in a single layer that wassuitable for attaching with the antigen.
4. APPLICATION OF PIEZOELECTRICQUARTZ CRYSTAL DEVICE
At present, the quartz crystal has been appliedin wide area. The qualitative and quantitative re-sult can be showed by using this device. The majorapplication of this device involved as the biologicalrecognition such as protein peptide and nucleic acid.Therefore, there are many type of QCM based biosen-sors categoriged by type of biological elements. QCMimmunosensors determine the antigen-antibody bind-ing and the limit sensitivity is about a few µ g/ml[18]. Enzyme-based QCM uses to measure the prod-uct of the substrate conversion via the enzyme by us-ing the electrochemical reaction [19], called as electro-chemical quartz crystal microbalance (EQCM). Nu-cleic acid-based QCM uses to measure the formationof complementary single stranded nucleotide via hy-bridization method [46]. The detection sensitivity ofthis sensor is about a few nanograms DNA. Cell-basedQCM uses to detect the growth rate of cell on theQCM surface. Moreover, QCM can be applied tothe drug discovery field for investigation of the drug-target interaction. Recently, QCM sensors are de-
veloped to determine the concentration of the targetanalyte in clinical analysis, food and drink analysis,and environmental pollution control [20] as shown inTable 1.
5. LIPOPROTEINS
Lipoproteins are macromolecular complexes oflipids and proteins. A major function of lipopro-teins is to transport lipid through the blood vessel.They are classified on the basis of their density inpreparative ultracentrifuge into several classes; chy-lomicron, very low density lipoprotein (VLDL), inter-mediate density lipoprotein (IDL), low density lipo-protein (LDL) and high density lipoprotein (HDL).All classes have the same structure; triglyceride (TG)and cholesteryl ester (CE) form a hydrophobic coresurrounded by a layer of amphipathic phospholipid(PL) and apolipoprotein (apo). A small proportion oflipoprotein cholesterol is unesterified (free cholesterol(FC)) and located on their surface [21]. VLDL, LDLand HDL levels in serum have close relationship withatherosclerosis. High levels of VLDL and LDL areassociated with increased progression of atheroscle-rosis and risk of coronary heart disease (CHD), whilehigh level of HDL is protective [39] [41]. Moreover,oxidized Low Density Lipoprotein (ox-LDL) has beenshown to play an important role in the atherosclero-sis pathogenesis [42]. The elevated level of circulatingoxidized-LDL is associated with CHD too. CHD isthe leading cause of mortality in the United States,Europe, and the vast majority of Asian countries in-cluding Thailand; it is the top three causes of mortal-ity [43]. Therefore, VLDL, LDL, HDL and ox-LDLmeasurements have been utilized as a tool for diag-nosis and monitoring of patients with or at risk ofdeveloping CHD together with the measurement ofcholesterol, triglyceride and other cardiac markers.
6. LIPOPROTEIN MEASUREMENT
At present, LDL and HDL levels are measured inthe lipid and protein form. The cholesterol (LDL-C, HDL-C) and apolipoprotein (apo B-100, apo A-I)concentrations that carried on LDL and HDL parti-cles are the only lipid and protein that have beenroutinely measured. In part of VLDL and LDL-C, they are measured by using Friedewald calcula-tion (LDL-Cholesterol = Total Cholesterol - (HDL-Cholesterol + Triglyceride/5)) [44]. Ox-LDL is mea-sured by using indirect method such as measuresin conjugated diene and lipid peroxides form [45][46]. Many analytical techniques including ultracen-trifugation, electrophoresis, precipitation methods,homogeneous enzymatic colorimetric assay, chroma-tography, HPLC and GC-MS are developed to sep-arate and quantify the LDL-C, HDL-C and ox-LDL
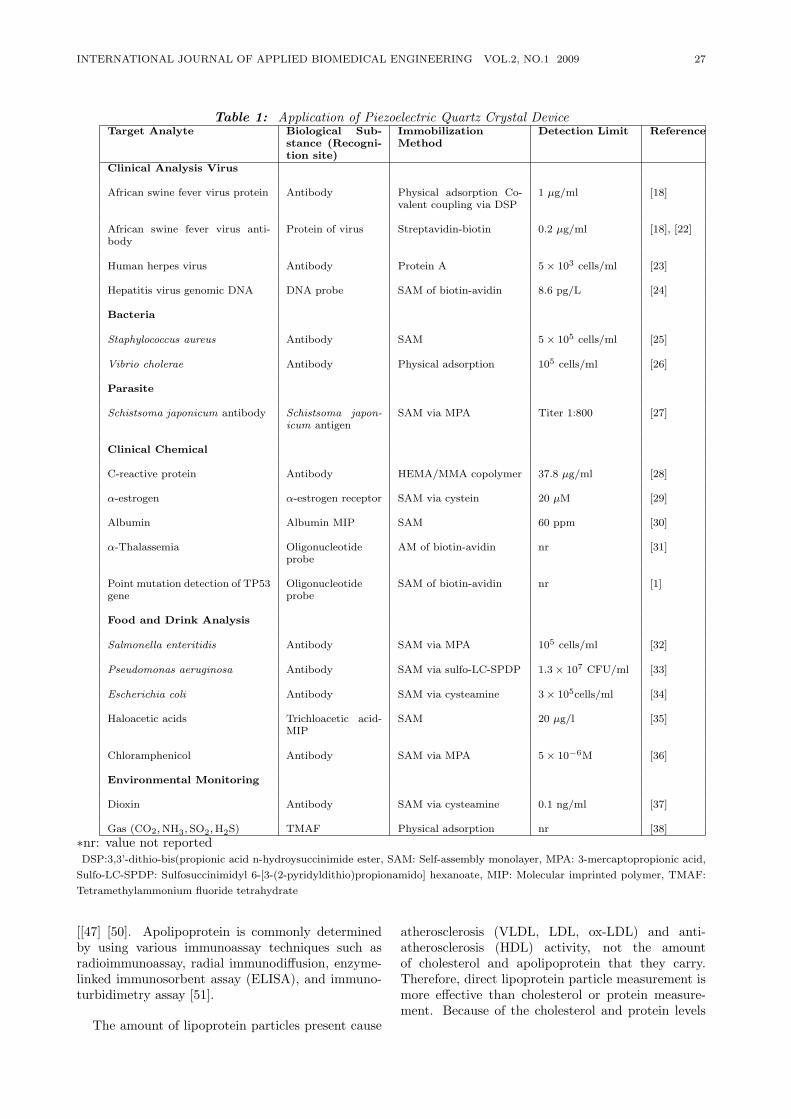
INTERNATIONAL JOURNAL OF APPLIED BIOMEDICAL ENGINEERING VOL.2, NO.1 2009 27
Table 1: Application of Piezoelectric Quartz Crystal DeviceTarget Analyte Biological Sub-
stance (Recogni-tion site)
ImmobilizationMethod
Detection Limit Reference
Clinical Analysis Virus
African swine fever virus protein Antibody Physical adsorption Co-valent coupling via DSP
1 µg/ml [18]
African swine fever virus anti-body
Protein of virus Streptavidin-biotin 0.2 µg/ml [18], [22]
Human herpes virus Antibody Protein A 5× 10³ cells/ml [23]
Hepatitis virus genomic DNA DNA probe SAM of biotin-avidin 8.6 pg/L [24]
Bacteria
Staphylococcus aureus Antibody SAM 5× 10⁵ cells/ml [25]
Vibrio cholerae Antibody Physical adsorption 105 cells/ml [26]
Parasite
Schistsoma japonicum antibody Schistsoma japon-icum antigen
SAM via MPA Titer 1:800 [27]
Clinical Chemical
C-reactive protein Antibody HEMA/MMA copolymer 37.8 µg/ml [28]
α-estrogen α-estrogen receptor SAM via cystein 20 µM [29]
Albumin Albumin MIP SAM 60 ppm [30]
α-Thalassemia Oligonucleotideprobe
AM of biotin-avidin nr [31]
Point mutation detection of TP53gene
Oligonucleotideprobe
SAM of biotin-avidin nr [1]
Food and Drink Analysis
Salmonella enteritidis Antibody SAM via MPA 105 cells/ml [32]
Pseudomonas aeruginosa Antibody SAM via sulfo-LC-SPDP 1.3× 10⁷ CFU/ml [33]
Escherichia coli Antibody SAM via cysteamine 3× 10⁵cells/ml [34]
Haloacetic acids Trichloacetic acid-MIP
SAM 20 µg/l [35]
Chloramphenicol Antibody SAM via MPA 5× 10⁻⁶M [36]
Environmental Monitoring
Dioxin Antibody SAM via cysteamine 0.1 ng/ml [37]
Gas (CO2,NH3,SO2,H2S) TMAF Physical adsorption nr [38]
∗nr: value not reportedDSP:3,3’-dithio-bis(propionic acid n-hydroysuccinimide ester, SAM: Self-assembly monolayer, MPA: 3-mercaptopropionic acid,
Sulfo-LC-SPDP: Sulfosuccinimidyl 6-[3-(2-pyridyldithio)propionamido] hexanoate, MIP: Molecular imprinted polymer, TMAF:
Tetramethylammonium fluoride tetrahydrate
[[47] [50]. Apolipoprotein is commonly determinedby using various immunoassay techniques such asradioimmunoassay, radial immunodiffusion, enzyme-linked immunosorbent assay (ELISA), and immuno-turbidimetry assay [51].
The amount of lipoprotein particles present cause
atherosclerosis (VLDL, LDL, ox-LDL) and anti-atherosclerosis (HDL) activity, not the amountof cholesterol and apolipoprotein that they carry.Therefore, direct lipoprotein particle measurement ismore effective than cholesterol or protein measure-ment. Because of the cholesterol and protein levels
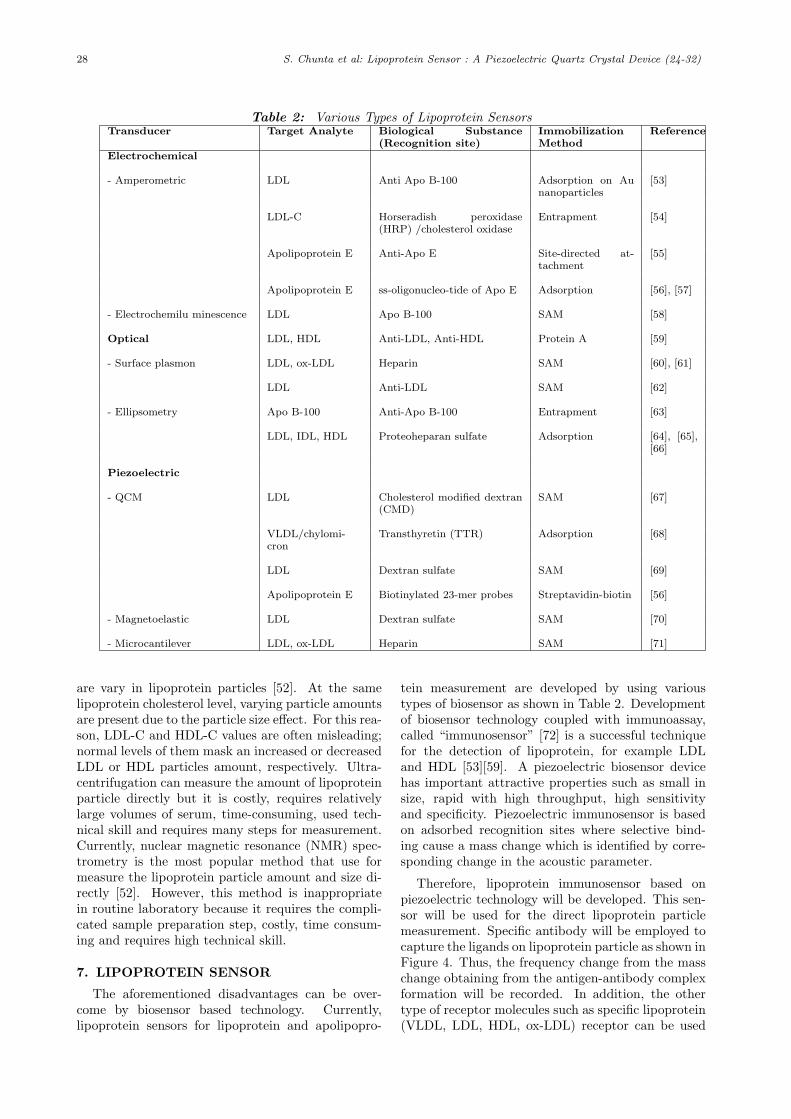
28 S. Chunta et al: Lipoprotein Sensor : A Piezoelectric Quartz Crystal Device (24-32)
Table 2: Various Types of Lipoprotein SensorsTransducer Target Analyte Biological Substance
(Recognition site)ImmobilizationMethod
Reference
Electrochemical
- Amperometric LDL Anti Apo B-100 Adsorption on Aunanoparticles
[53]
LDL-C Horseradish peroxidase(HRP) /cholesterol oxidase
Entrapment [54]
Apolipoprotein E Anti-Apo E Site-directed at-tachment
[55]
Apolipoprotein E ss-oligonucleo-tide of Apo E Adsorption [56], [57]
- Electrochemilu minescence LDL Apo B-100 SAM [58]
Optical LDL, HDL Anti-LDL, Anti-HDL Protein A [59]
- Surface plasmon LDL, ox-LDL Heparin SAM [60], [61]
LDL Anti-LDL SAM [62]
- Ellipsometry Apo B-100 Anti-Apo B-100 Entrapment [63]
LDL, IDL, HDL Proteoheparan sulfate Adsorption [64], [65],[66]
Piezoelectric
- QCM LDL Cholesterol modified dextran(CMD)
SAM [67]
VLDL/chylomi-cron
Transthyretin (TTR) Adsorption [68]
LDL Dextran sulfate SAM [69]
Apolipoprotein E Biotinylated 23-mer probes Streptavidin-biotin [56]
- Magnetoelastic LDL Dextran sulfate SAM [70]
- Microcantilever LDL, ox-LDL Heparin SAM [71]
are vary in lipoprotein particles [52]. At the samelipoprotein cholesterol level, varying particle amountsare present due to the particle size effect. For this rea-son, LDL-C and HDL-C values are often misleading;normal levels of them mask an increased or decreasedLDL or HDL particles amount, respectively. Ultra-centrifugation can measure the amount of lipoproteinparticle directly but it is costly, requires relativelylarge volumes of serum, time-consuming, used tech-nical skill and requires many steps for measurement.Currently, nuclear magnetic resonance (NMR) spec-trometry is the most popular method that use formeasure the lipoprotein particle amount and size di-rectly [52]. However, this method is inappropriatein routine laboratory because it requires the compli-cated sample preparation step, costly, time consum-ing and requires high technical skill.
7. LIPOPROTEIN SENSOR
The aforementioned disadvantages can be over-come by biosensor based technology. Currently,lipoprotein sensors for lipoprotein and apolipopro-
tein measurement are developed by using varioustypes of biosensor as shown in Table 2. Developmentof biosensor technology coupled with immunoassay,called “immunosensor” [72] is a successful techniquefor the detection of lipoprotein, for example LDLand HDL [53][59]. A piezoelectric biosensor devicehas important attractive properties such as small insize, rapid with high throughput, high sensitivityand specificity. Piezoelectric immunosensor is basedon adsorbed recognition sites where selective bind-ing cause a mass change which is identified by corre-sponding change in the acoustic parameter.
Therefore, lipoprotein immunosensor based onpiezoelectric technology will be developed. This sen-sor will be used for the direct lipoprotein particlemeasurement. Specific antibody will be employed tocapture the ligands on lipoprotein particle as shown inFigure 4. Thus, the frequency change from the masschange obtaining from the antigen-antibody complexformation will be recorded. In addition, the othertype of receptor molecules such as specific lipoprotein(VLDL, LDL, HDL, ox-LDL) receptor can be used
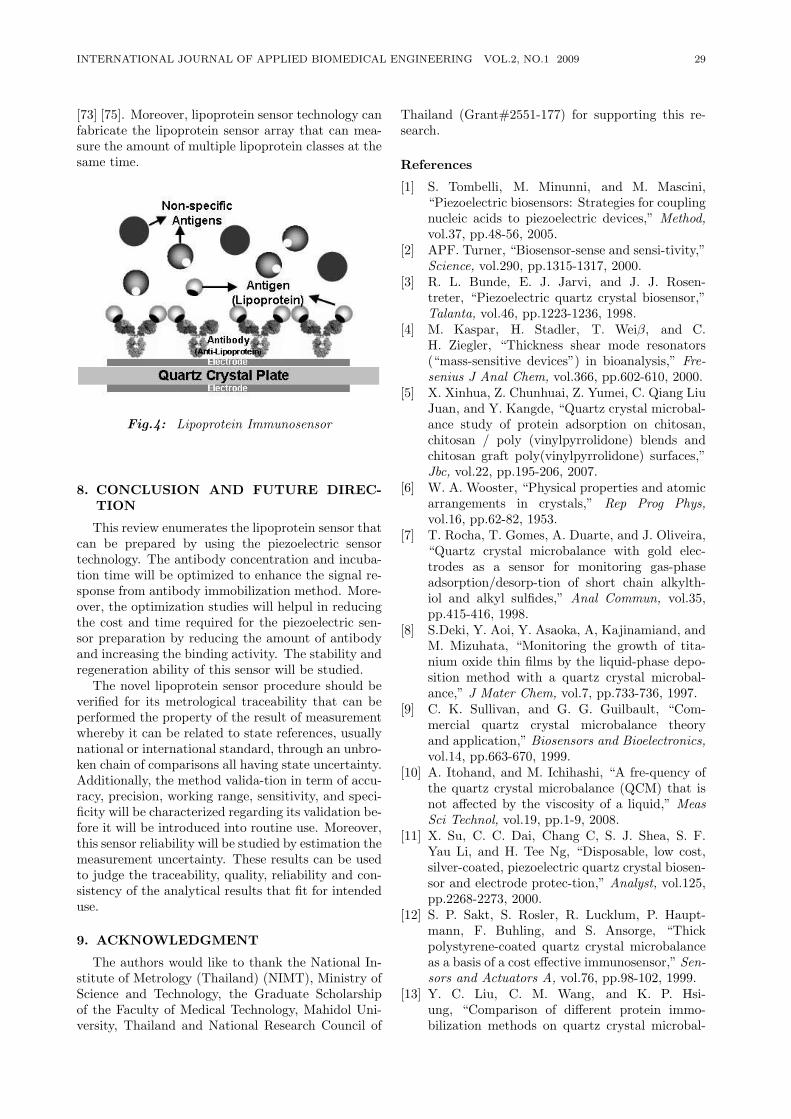
INTERNATIONAL JOURNAL OF APPLIED BIOMEDICAL ENGINEERING VOL.2, NO.1 2009 29
[73] [75]. Moreover, lipoprotein sensor technology canfabricate the lipoprotein sensor array that can mea-sure the amount of multiple lipoprotein classes at thesame time.
Fig.4: Lipoprotein Immunosensor
8. CONCLUSION AND FUTURE DIREC-TION
This review enumerates the lipoprotein sensor thatcan be prepared by using the piezoelectric sensortechnology. The antibody concentration and incuba-tion time will be optimized to enhance the signal re-sponse from antibody immobilization method. More-over, the optimization studies will helpul in reducingthe cost and time required for the piezoelectric sen-sor preparation by reducing the amount of antibodyand increasing the binding activity. The stability andregeneration ability of this sensor will be studied.
The novel lipoprotein sensor procedure should beverified for its metrological traceability that can beperformed the property of the result of measurementwhereby it can be related to state references, usuallynational or international standard, through an unbro-ken chain of comparisons all having state uncertainty.Additionally, the method valida-tion in term of accu-racy, precision, working range, sensitivity, and speci-ficity will be characterized regarding its validation be-fore it will be introduced into routine use. Moreover,this sensor reliability will be studied by estimation themeasurement uncertainty. These results can be usedto judge the traceability, quality, reliability and con-sistency of the analytical results that fit for intendeduse.
9. ACKNOWLEDGMENT
The authors would like to thank the National In-stitute of Metrology (Thailand) (NIMT), Ministry ofScience and Technology, the Graduate Scholarshipof the Faculty of Medical Technology, Mahidol Uni-versity, Thailand and National Research Council of
Thailand (Grant#2551-177) for supporting this re-search.
References
[1] S. Tombelli, M. Minunni, and M. Mascini,“Piezoelectric biosensors: Strategies for couplingnucleic acids to piezoelectric devices,” Method,vol.37, pp.48-56, 2005.
[2] APF. Turner, “Biosensor-sense and sensi-tivity,”Science, vol.290, pp.1315-1317, 2000.
[3] R. L. Bunde, E. J. Jarvi, and J. J. Rosen-treter, “Piezoelectric quartz crystal biosensor,”Talanta, vol.46, pp.1223-1236, 1998.
[4] M. Kaspar, H. Stadler, T. Weiβ, and C.H. Ziegler, “Thickness shear mode resonators(“mass-sensitive devices”) in bioanalysis,” Fre-senius J Anal Chem, vol.366, pp.602-610, 2000.
[5] X. Xinhua, Z. Chunhuai, Z. Yumei, C. Qiang LiuJuan, and Y. Kangde, “Quartz crystal microbal-ance study of protein adsorption on chitosan,chitosan / poly (vinylpyrrolidone) blends andchitosan graft poly(vinylpyrrolidone) surfaces,”Jbc, vol.22, pp.195-206, 2007.
[6] W. A. Wooster, “Physical properties and atomicarrangements in crystals,” Rep Prog Phys,vol.16, pp.62-82, 1953.
[7] T. Rocha, T. Gomes, A. Duarte, and J. Oliveira,“Quartz crystal microbalance with gold elec-trodes as a sensor for monitoring gas-phaseadsorption/desorp-tion of short chain alkylth-iol and alkyl sulfides,” Anal Commun, vol.35,pp.415-416, 1998.
[8] S.Deki, Y. Aoi, Y. Asaoka, A, Kajinamiand, andM. Mizuhata, “Monitoring the growth of tita-nium oxide thin films by the liquid-phase depo-sition method with a quartz crystal microbal-ance,” J Mater Chem, vol.7, pp.733-736, 1997.
[9] C. K. Sullivan, and G. G. Guilbault, “Com-mercial quartz crystal microbalance theoryand application,” Biosensors and Bioelectronics,vol.14, pp.663-670, 1999.
[10] A. Itohand, and M. Ichihashi, “A fre-quency ofthe quartz crystal microbalance (QCM) that isnot affected by the viscosity of a liquid,” MeasSci Technol, vol.19, pp.1-9, 2008.
[11] X. Su, C. C. Dai, Chang C, S. J. Shea, S. F.Yau Li, and H. Tee Ng, “Disposable, low cost,silver-coated, piezoelectric quartz crystal biosen-sor and electrode protec-tion,” Analyst, vol.125,pp.2268-2273, 2000.
[12] S. P. Sakt, S. Rosler, R. Lucklum, P. Haupt-mann, F. Buhling, and S. Ansorge, “Thickpolystyrene-coated quartz crystal microbalanceas a basis of a cost effective immunosensor,” Sen-sors and Actuators A, vol.76, pp.98-102, 1999.
[13] Y. C. Liu, C. M. Wang, and K. P. Hsi-ung, “Comparison of different protein immo-bilization methods on quartz crystal microbal-
30 S. Chunta et al: Lipoprotein Sensor : A Piezoelectric Quartz Crystal Device (24-32)
ance surface in flow injection immunoassay,” An-alytical Biochemistry, vol.299, pp.130-135, 2001.
[14] A. Ahluwalia, D. D. Rossi, C. Ristori, A. Schi-rone, and G. Serra, “A comparative study of pro-tein immobilization tech-niques for optical im-munosensors,” Bio-sensors and Bioelectronics,vol.7, pp.207-214, 1992.
[15] X. Jiang, D. Li, X. Xu, Y. Ying, Y. Li, Z. Ye, andJ. Wang, “Immunosensors for detection of pes-ticide residues,” Biosensors and Bioelectronics,vol.23, pp.1577-1587, 2008.
[16] S. Storri, T. Santoni, M. Minunni, and M.Mascini, “Surface modifications for the devel-opment of piezoimmunosensors,” Biosensors andBioelectronics, vol.13, pp.347-357, 1998.
[17] H. Aizawa, Y. Gokita, J. W. Park, Y. Yoshimi,and S. Kurosawa, “Antibody immobilizationon functional monolayers using a quartz crys-tal microbalance,” IEEE Sensors Journal, vol.6,pp.1052-1056.
[18] E. Uttenthaler, C. Koblinger, and S. Drost,“Characterization of immobilization me-thodsfor African swine fever virus protein andantibodies with piezoelectric immuno-sensor,”Biosensors and Bioelectronics, vol.13, pp.1279-1286, 1998.
[19] S. P. Martin, J. M. Lynch and S. M. Reddy,“Optimization of the enzyme-based determina-tion of hydrogen peroxide using the quartz crys-tal microbalance,” Biosensors and Bioelectron-ics, vol.17, pp.735-739, 2002.
[20] A. Mierzwinski, and Z. Witkiewicz, “The ap-plication of piezoelectric detectors for investiga-tions of environmental pollu-tion,” Environmen-tal Pollution, vol.57, pp.181-198, 1989.
[21] J. Robert, and S. Bryant, “Lipid metabolism andhealth,” CRC Press Taylor and Francis Group,2006.
[22] E. Uttenthaler, C. Koblinger, and S. Drost,“Quartz crystal biosensor for detection of theAfrican swine fever disease,” Analy-tica ChimicaActa, vol.326, pp.91-100, 1998.
[23] B. Konig, and M. Gratzel, “A Novel immu-nosensor for Herpes Viruses,” Analytical Chem-istry, vol.68, pp.341-344, 1994.
[24] C. Yao, T. Zhu, J. Tang, R. Wu, Q. Chen, M.Chen, B. Zhang, J. Huang, and W. Fu, “Hy-bridization assay of hepatitis B virus by QCMpeptide nucleic acid biosensor,” Biosensors andBioelectronics, vol.23, pp.879-885, 2008.
[25] D. Le, H. Feng, J. Tai, N. Lihua, and S. Yao, “Agoat anti-human modified piezo-immunosensorfor Staphylococcus aureus detection,” Journalof Microbiological Methods, vol.23, pp.229-234,1996.
[26] R. M. Carter, J. J. Mekalanos, M. B. Jacobs,G. J. Lubrano, and G. G. Guil-bault, “Quartzcrystal microbalance detec-tion of Vibrio cholera
O139 serotype,” Journal of Immunological Meth-ods, vol.187, pp.121-125, 1995.
[27] Z. Y. Wu, G. L. Shen, S. P. Wang, and R. Q. Yu,“Quartz-crystal microbalance im-munosensor forSchistsoma japonicum-infected rabbit serum,”Analytical science, vol.19, pp.437-40, 2003.
[28] X. Chiu, J. Jiang, G. Shen, and R. Yu, “Simul-taneous immunoassay using piezo-electric im-munosensor array and robust method,” Analyti-cal Chemistry, vol.336, pp.185-193, 1996.
[29] R. E. Baltus, K. S. Carmon, and L. A. Luck,“Quartz crystal microbalance (QCM) with im-mobilized protein recep-tors: comparison of re-sponse to ligand binding for direct protein immo-bilization and protein attachment via disulfidelinker,” Langmuir, vol.23, pp.3380-3385, 2007.
[30] T. Y. Lin, C. H. Hu and T. C. Chou, “Determi-nation of albumin concentration by MIP-QCMsensor,” Biosensors and Bioelectronics, vol.20,pp.75-81, 2003.
[31] P. Vattanaviboon, K. Sangseekhiow, P. Winicha-goon, and C. Promptmas, “Detec-tion and hap-lotype differentiation of South-east Asian α-thalassemia using polymerase chain reaction anda piezo-electric biosensor immobilized with asingle oligonucleotide probe,” Traslational Re-search, vol.151, pp.246-254, 2008.
[32] S. H. Si, X Li, Y. S. Fung, and D. R. Zhu, “Rapiddetection of Salmonella enteritidis by piezo-electric immunosensor,” Micro-chemical Jour-nal, vol.68, pp.21-27, 2001.
[33] N. Kim, I. S. Park, and D. K. Kim, “Charac-teristics of a label-free piezo-electric immunosen-sor detecting Pseudo-monas aeruginosa,” Sen-sors and Actuators B, vol.100, pp.432-438, 2004.
[34] C. Poitras, and N. Tufenkji, “A QCM-D-basedbiosensor for E. coli O157:H7 highlighting therelevance of the dissi-pation slope as a trans-duction signal,” Biosensors and Bioelectronics,vol.24, pp.2137-2142, 2009.
[35] R. Suedee, W. Intakong, and F. L. Dickert, “Theuse of trichloroacetic acid imprinted polymercoated quartz crystal micro-balance as a screen-ing method for deter-mination of haloacetic acidsin drinking water,” Talanta, vol.70, pp.194-201,2006.
[36] N. Adanyi, M. Varadi, N. Kim, and I. Szendro,“Development of new immuno-sensor for deter-mination of contaminants in food,” Current Ap-plied Physics, vol.6, pp.279-286, 2006.
[37] S. Kurosawa, J. W. Park, H. Aizawa, S. I.Wakida, H. Tao, and K. Ishihara, “Quartz crys-tal microbalance immunosensors for environmen-tal monitoring,” Biosensors and Bioelectronics,vol.22, pp.473-481, 2006.
[38] M. T. S. R. Gomes, P. S. T. Nogueira, and J.A. B. P. Oliveira, “Quantification of CO2, SO2,NH3, and H2S with a single coated piezoelectric
INTERNATIONAL JOURNAL OF APPLIED BIOMEDICAL ENGINEERING VOL.2, NO.1 2009 31
quartz crystal,” Sensors and Actuators B, vol.68,pp.218-222, 2000.
[39] K. Bohnet, T. Pillot, S. Visvikis, N. Sabolovic,and G. Siest, “Apolipoprotein (apo) E geno-type and apoE concentration determine bind-ing of normal very low density lipoproteins toHepG2 cell surface receptors,” J Lipid Res,vol.37, pp.1316-1324, 1996.
[40] P. J. Barter, and K. A. Rye, “High den-sity lipoproteins and coronary heart disease,”Atherosclerosis, vol.121, pp.1-12, 1996.
[41] W. B. Kannel, W. P. Castelli, and J. Gordon,“Cholesterol in the prediction of atheroscleroticdisease. New perspectives based on the Fram-ingham study,” Ann Int Med, vol.90, pp.85-91,1979.
[42] I. Jialal, “Evolving lipoprotein risk factors:lipoprotein (a) and oxidized low-density lipopro-tein,” Clin Chem, vol.48, pp.1827-1832, 1998.
[43] S. Wibulpolprasert, “Thailand health pro-file1997-1998,” Ministry of Public Health, 2000.
[44] M. Nauck, A. Kramer-Guth , W. Bartens, W.Marz, H. Wieland, and C. Wanner, “Is the deter-mination of LDL cholesterol according to Friede-wald accurate in CAPD and HD patients?,” ClinNephrol, vol.46, pp.319-325, 1996.
[45] I. Jialal, and S. Devarai, “Low density lipopro-tein oxidation, antioxidants, and atherosclerosis:a clinical biochemistry perpective,” Clin Chem,vol.42, pp.498-506, 1996.
[46] M. El-Saidani, H. Esterbauer, M. El-Sayed,M. Goher, A. Y. Nassar, and G. Jurgens, “Aspectrophotometric assay for lipid peroxides inserum lipoproteins using a commericially avail-able reagent,” J lipid Res, vol.30, pp.627-630,1989.
[47] B. Pascale, C. Christophe, H. Genevieve, K.Oumayma, D. Francoise, C. Fabrice, C. Remi,C. Olivier, B. Jean, B. Philippe, P. Raoul, M.Joelle, and B. Gilbert, “Comparison of newmethod for the direct and simultaneous assess-ment of LDL- and HDL-cholesterol with ultra-centrifugation and established methods,” ClinChem, vol.46, pp.493-505, 2000.
[48] H. Yi-Chang, K. Jau-Tsuen, and T. Keh-Sung,“Evaluation of two homogeneous methods formeasuring high density lipoprotein cholesterol,”Clin Chem, vol.-43, pp.1048-1055, 1997.
[49] G. R. Warnick, M. Nauck, and N. Rifai, “Evo-lution of methods for measurement of HDL-cholesterol: from ultracentrifugation to homoge-neous assays,” Clin Chem, vol.47, pp.1579-1596,2001.
[50] G. Lepage, and C. C. Roy, “Specific methylationof plasma non-esterified fatty acids in a one-stepreaction,” J Lipid Res, vol.27, pp.114-120, 1986.
[51] M. Porsch-Ozcurumez, S. Westphal, and C. Lu-ley, “Measurement of low apo-lipoprotein con-
centrations by optimized immunoturbidimetricapplications,” Clin Chem, vol.47, pp.594-597,2001.
[52] J. Otvos, E. Jeyarajar, and W. Cromwell, “Mea-surement issues related to lipopro-tein hetero-geneity,” Am J Cardiol, vol.90, pp.22-29, 2002.
[53] W. Yan, X. Chen, Xinghua, X. Feng, and J. J.Zhu, “Fabrication of a label-free electrochemi-cal immunosensor of low-density lipoprotein,” JPhys Chem, vol.112, pp.1275-1281, 2008.
[54] A. L. Crumbliss, J. G. Stonehuerner, R. W.Henkens, J. Zhao, and J. P. O’Daly, “A car-rageenan hydrogel stabilized colloidal gold multi-enzyme biosensor electrode utilizing immobi-lized horseradish peroxi-dase and cholesterol ox-idase/cholesterol esterase to detect cholesterolin serum and whole blood,” Biosensors andBioelectro-nics, vol.8, pp.331-337, 1993.
[55] M. Meusel, R. Renneberg, and F. Spener, “De-velopment of a heterogeneous amperometric im-munosensor for the determination of apolipopro-tein E in serum,” Biosensors and Bioelectronics,vol.10, pp.577-586, 1995.
[56] G. Marrazza, S. Tombelli, M. Mascini, and A.Manzoni, “Detection of human apolipo-proteinE genotypes by DNA biosensors coupled withPCR,” Clinica Chemica Acta, vol.307, pp.241-248, 2001.
[57] G. Marrazza, G. Chiti, M. Mascini, and M.Anichini, “Detection of human apolipo-proteinE genotypes by DNA electro-chemical biosensorcoupled with PCR,” Clinical Chemistry, vol.46,pp.31-37, 2000.
[58] G. Jie, B. Liu, H. Pan, J. J. Zhu, andH. Y. Chen, “CdS nanocrystal-based electro-chemiluminescence biosensor for the detectionof low-density lipoprotein by increasing sensitiv-ity with gold nano-particle amplification,” AnalChem, vol.79, pp.5574-5581, 2007.
[59] C. Jeong-woo, P. Jun Hyo, L. Woochang, O.Byung-keun, M. Junhong, and L. Won-hong,“Fluorescence immunoassay of HDL and LDLusing protein A LB film,” J Microbiol biotech-nol, vol.11, pp.979-985, 2001.
[60] K. Gaus, and E. A. H. Hall, “Detection of oxi-dized low-density lipoproteins using surface Plas-mon resonance,” Anal Chem, vol.71, pp.2459-2467, 1999.
[61] A. M. Doke, S. K. Mathur, and A. Sadana,“Fractal binding and dissociation kinetics ofheart-related compounds on biosensor surfaces,”J Recept Signal Transduct, vol.26, pp.337-357,2006.
[62] J. W. Choi, K. S. Park, W. Lee, B. K. Oh, B.S. Chun, and S. H. Paek, “Regulation of anti-LDL immobilization on self-assem-bled proteinG layer using CHAPS and its application to im-munosensor,” Mater Sci Eng C, vol.24, pp.241-
32 S. Chunta et al: Lipoprotein Sensor : A Piezoelectric Quartz Crystal Device (24-32)
245, 2004.[63] L. L. Robbio, P. Uboldi, S. Marcovina, R. P. Re-
voltella, and A. L. Catapano, “Epitope mappinganalysis of apolipo-protein B-100 using a surfacePlasmon resonance-based biosensor,” Biosensorsand Bioelectronics, vol.16, pp.963-969, 2001.
[64] M. Malmsten, U. Kassner, K. Winkler, A.Schmidt, E. Buddecke, R. Saunders, etal, “An ellipsometry-based Alzheimer plaquemimic: Effect of β-amyloid, lipoprotein identityand apolipoprotein E isoform,” JCIS, vol.276,pp.503-506, 2004.
[65] G. Siegel, M. Malmsten, D. Klubendorf, and F.Michel, “A receptor-based biosensor for lipopro-tein docking at the endothelial surface and vas-cular matrix,” Biosensors and Bioelectronics,vol.16, pp.895-904, 2001.
[66] C. Abletshauser, D. Klubendorf, A. Scmidt, K.Winkler, W. Marz, E. Buddecke, et al, “Biosens-ing of arterio-sclerotic nanoplaque formation andinter-action with an HMG-CoA reductase in-hibitor,” Acta Physiol Scand, vol.176, pp.131-145, 2002.
[67] D. Liu, B. He, S. Han, S. Wang, Q. Liu, A.Jun-ichi, T. Osa, and Q. Chen, “An adsorp-tion behavior of low-density lipo-protein ontocholesterol-modified dextran studied by a quartzcrystal microbalance,” Mater Sci Eng C, vol.27,pp.665-669, 2007.
[68] X. Sun, Y. Ando, K. Haraoka, S. Katsuragi,T. Yamashita, S. Yamashita, et al, “Role ofVLDL/chylomicron in amyloid formation infamilial amyloidotic poly-neuropathy,” BBRC,vol.311, pp.344-350, 2003.
[69] S. Snellings, J. Fuller, M. Pitner, and D. W.Paul, “An acoustic wave biosensor for humanlow-density lipoprotein particles: construction ofselective coatings,” Biosensors and Bioelectron-ics, vol.19, pp.353-363, 2003.
[70] F. Xinjian, R. Somnath C, M. Gopal K, and G.Craig A, “A wireless magnetoelastic biosensorfor the selective detection of low density lipopro-tein (LDL) particles,” Sensor Letters, vol.6,pp.359-362, 2008.
[71] A. M. Moulin, S. J. O’Shea, and M. E.Welland, “Microcantilever-based biosen-sors,”Ultramicroscopy, vol.82, pp.23-31, 2000.
[72] C. L. Morgan, D. J. Newman, and C. P. Price,“Immunosensor: technology and opportunitiesin laboratory medicine,” Clin Chem, vol.20,pp.201-207, 1996.
[73] U. Francke, M. S. Brown, and J. L. Goldstein,“Assignment of human gene for the low densitylipoprotein receptor to chromosome 19: syntenyof a receptor, a ligand and a genetic disease,”Proc Natl Acad Sci USA, vol.81, pp.2826-2830,1984.
[74] . Ji, B. Jian, N. Wang, Y. Sun, M. De la Llera
Moya, M. C. Phillips, G. H.Rothblat, J. B.Swaney, and A. R. Tall, “Scavenger receptor B1promotes high density lipo-protein-mediated cel-lular cholesterol eff-lux,” J Biol Chem, vol.272,pp.20982-20985, 1997.
[75] T. Suwamura, N. Kume, and T. Aoyama, “Anendothelial receptor for oxidized low densitylipoprotein,” Nature, vol.386, pp. 73-77, 1997.
S. Chunta received the B. Sc. degree inMedical Technology from Mahidol Uni-versity, Bangkok, Thailand in 2007. Sheis currently pursuing her M. S. degreein Medical Technology, Mahidol Univer-sity. She is also working as a student re-search assistant for Biosensor ResearchUnit in the Faculty of Medical Technol-ogy, Mahidol University.
C. Promptmas received the B. Sc.degree (Honor) in Medical Technol-ogy from Mahidol University, Bangkok,Thailand in 1976, the M. Sc. Degree inBiochemistry from Chulalongkorn Uni-versity, Bangkok, Thailand in 1980 andthe Graduate Diploma in Biotechnologyfrom University of Kent at Canterbury,England in 1988. In 1994, he receivedthe Ph. D. degree in Biochemistry fromMahidol University, Bangkok, Thailand.
His recent position is assistant professor and chairman of Clin-ical Chemistry Department, Faculty of Medical Technology,Mahidol University, Bangkok. Biosensor and nanobiotechnol-ogy are his current research field.
C. Cherdchu received the B. S. de-gree in Chemistry and M. S. degree inPharmacology from Mahidol University,Bangkok, Thailand in 1973 and 1975,respectively. In 1988, he received thePh. D. degree in Pharmacology fromUniversity of Nebraska Medical Cen-ter, Omaha, Nebraska, U.S.A. He iscurrently the Deputy Director and theHead of Chemical Metrology and Biom-etry Department of National Institute of
Metrology (Thailand), Ministry of Science and Technology. Heis also currently a lecturer in pharmacology for the schoolsof nursing at the ABAC University and Eastern Asian Uni-versity. He was appointed as an associated professor at thePramongkutklao College of Medicine, Bangkok where he wasat the Department of Pharmacology. His research area is inorganic and inorganic chemical metrology, pharmacology andtoxicology.
INTERNATIONAL JOURNAL OF APPLIED BIOMEDICAL ENGINEERING VOL.2, NO.1 2009 33
Finite Element Analyses for a Study ofHepatic Cancer Tissue Destruction usingMonopolar and Bipolar Radio-Frequency
Ablation
Supan Tungjitkusolmun, Member
ABSTRACT
This paper presents three-dimensional finite ele-ment analyses of radio-frequency hepatic tumor abla-tion. The analyses performed in this paper are com-posed of two systems. In the first system, the simu-lation was of monopolar ablation (one needle), whilethe second system was the simulation of bipolar ab-lation (two needles). We performed a preliminarystudy of thermal and electrical distributions of bothsystems. Additional simulations of bipolar ablationwere performed to investigate the effect of spacingdistance between two needle electrodes (2 cm, 3 cm,4 cm, and 5 cm). The ablation duration used inall cases was 10 min, and the controlled maximumtemperature was set to 90 C. From the results, theelectric field in monopolar ablation appeared to bedistributed uniformly between the electrode and theground surface, but the electric field in bipolar ab-lation was focused in the regions between the twoelectrodes. For bipolar ablation, when the distancesbetween the electrodes were 2 cm and 3 cm, the le-sion created was contiguous and covered the areassurrounding both electrodes. However, when the dis-tances between the electrodes were 4 cm and 5 cm,the lesions created were not contiguous and shapedsimilar to performing two monopolar ablation opera-tions.
Keywords: three-dimensional, finite element, bipo-lar, radio-frequency, cancer tissue, hepatic
1. INTRODUCTION
Every year, more than one million people aroundthe world die with hepatocellular carcinoma (HCC).Thus, it is one of the challenging problems for themedical community [1]. Possible treatments for pri-mary hepatic cancers are surgical operation, chem-ical treatment, cryoablation, radiation therapy, andradio-frequency (RF) ablation [2]. Currently, sur-gical resection is the treatment of choice for both
Manuscript received on June 15, 2009 ; revised on July 15,2009.
S. Tungjitkusolmun is with Department of Electronics, Fac-ulty of Engineering, King Monkut’s Institute of TechnologyLadkrabang, Bangkok, Thailand
E-mail address: [email protected]
well-localized primary and metastatic hepatic malig-nancies. However, the majority of the patients arenot candidates for surgical resection due to restric-tions, such as multifocal disease, tumor size, locationof tumor to key vessels, or coagulopathies. Chemicaltreatment, where adequate chemical injection is ad-ministered into artery supplying cancer tissues, andradiation therapy are mostly used to temporarily re-lieve the symptoms. A combination of the abovemethods has also been used for treatment of hepaticcancer to improve the degree of success.
RF ablation has been recently introduced and hasproved to be an effective cure for primary hepatic can-cer where the tumors found are still small (< 3 cm indiameter) [2]. In RF ablation, electric current at fre-quencies between 350-500 kHz is passed into cancercells via an electrode placed inside the tumor. Theelectric energy generates Joule heat which then con-ducts into surrounding tissues. Elevating tempera-ture of unwanted tissues to a level above 50 C caneffectively kill cancer cells. RF ablation is much lessinvasive compared to surgical resection as only a smallincision is required for insertion of ultrasound-guidedRF probe. Thus RF ablation reduces risks of sideeffects and requires less recovery period for patients[9-23].
Commonly reported disadvantages in RF ablationtechnique include difficulty in treating large tumors-that is, those exceeding 3 cm in diameter; the po-tential for incomplete RF tumor ablation near bloodvessels because of the heat sink effect of local bloodflow, difficulty in obtaining sonographic images of RFlesions; and evidence of surviving tumor cells, evenwithin RF lesions. Treatment of large tumors byperforming sequential RF ablations can be time con-suming to adequately ensure total overlapping cov-erage of the ablation zones. Proposed modificationsof the conventional RF ablation technique to increaselesion dimensions include injecting cool saline at thedistal end of the probes to reduce overheating at re-gions in close proximity to avoid a sudden increase inimpedance, using multiple tines which can increaseeffective heating area, and the use of multiple RFprobes to achieve larger coagulation volumes thanthose possible with a single probe.
Commonly reported disadvantages in RF ablation
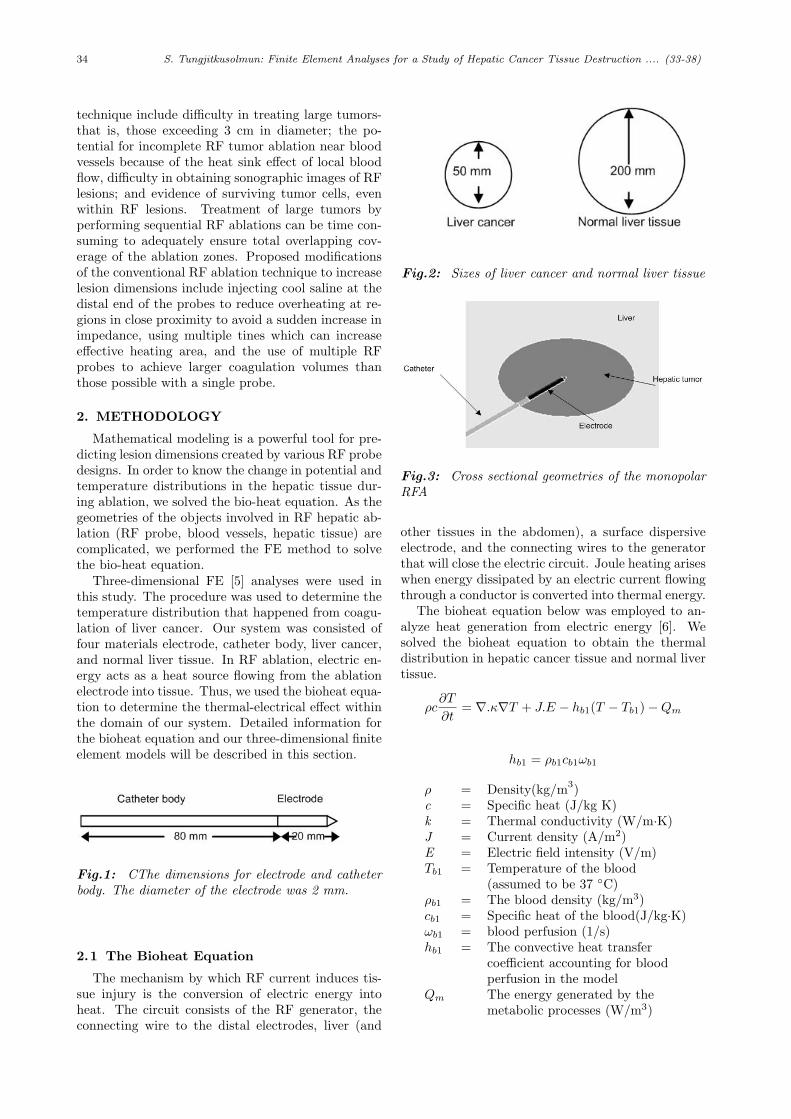
34 S. Tungjitkusolmun: Finite Element Analyses for a Study of Hepatic Cancer Tissue Destruction .... (33-38)
technique include difficulty in treating large tumors-that is, those exceeding 3 cm in diameter; the po-tential for incomplete RF tumor ablation near bloodvessels because of the heat sink effect of local bloodflow, difficulty in obtaining sonographic images of RFlesions; and evidence of surviving tumor cells, evenwithin RF lesions. Treatment of large tumors byperforming sequential RF ablations can be time con-suming to adequately ensure total overlapping cov-erage of the ablation zones. Proposed modificationsof the conventional RF ablation technique to increaselesion dimensions include injecting cool saline at thedistal end of the probes to reduce overheating at re-gions in close proximity to avoid a sudden increase inimpedance, using multiple tines which can increaseeffective heating area, and the use of multiple RFprobes to achieve larger coagulation volumes thanthose possible with a single probe.
2. METHODOLOGY
Mathematical modeling is a powerful tool for pre-dicting lesion dimensions created by various RF probedesigns. In order to know the change in potential andtemperature distributions in the hepatic tissue dur-ing ablation, we solved the bio-heat equation. As thegeometries of the objects involved in RF hepatic ab-lation (RF probe, blood vessels, hepatic tissue) arecomplicated, we performed the FE method to solvethe bio-heat equation.
Three-dimensional FE [5] analyses were used inthis study. The procedure was used to determine thetemperature distribution that happened from coagu-lation of liver cancer. Our system was consisted offour materials electrode, catheter body, liver cancer,and normal liver tissue. In RF ablation, electric en-ergy acts as a heat source flowing from the ablationelectrode into tissue. Thus, we used the bioheat equa-tion to determine the thermal-electrical effect withinthe domain of our system. Detailed information forthe bioheat equation and our three-dimensional finiteelement models will be described in this section.
Fig.1: CThe dimensions for electrode and catheterbody. The diameter of the electrode was 2 mm.
2.1 The Bioheat Equation
The mechanism by which RF current induces tis-sue injury is the conversion of electric energy intoheat. The circuit consists of the RF generator, theconnecting wire to the distal electrodes, liver (and
Fig.2: Sizes of liver cancer and normal liver tissue
Fig.3: Cross sectional geometries of the monopolarRFA
other tissues in the abdomen), a surface dispersiveelectrode, and the connecting wires to the generatorthat will close the electric circuit. Joule heating ariseswhen energy dissipated by an electric current flowingthrough a conductor is converted into thermal energy.
The bioheat equation below was employed to an-alyze heat generation from electric energy [6]. Wesolved the bioheat equation to obtain the thermaldistribution in hepatic cancer tissue and normal livertissue.
ρc∂T
∂t= ∇.κ∇T + J.E − hb1(T − Tb1)−Qm
hb1 = ρb1cb1ωb1
ρ = Density(kg/m3)c = Specific heat (J/kg K)k = Thermal conductivity (W/m·K)J = Current density (A/m2)E = Electric field intensity (V/m)Tb1 = Temperature of the blood
(assumed to be 37 C)ρb1 = The blood density (kg/m3)cb1 = Specific heat of the blood(J/kg·K)ωb1 = blood perfusion (1/s)hb1 = The convective heat transfer
coefficient accounting for bloodperfusion in the model
Qm The energy generated by themetabolic processes (W/m3)
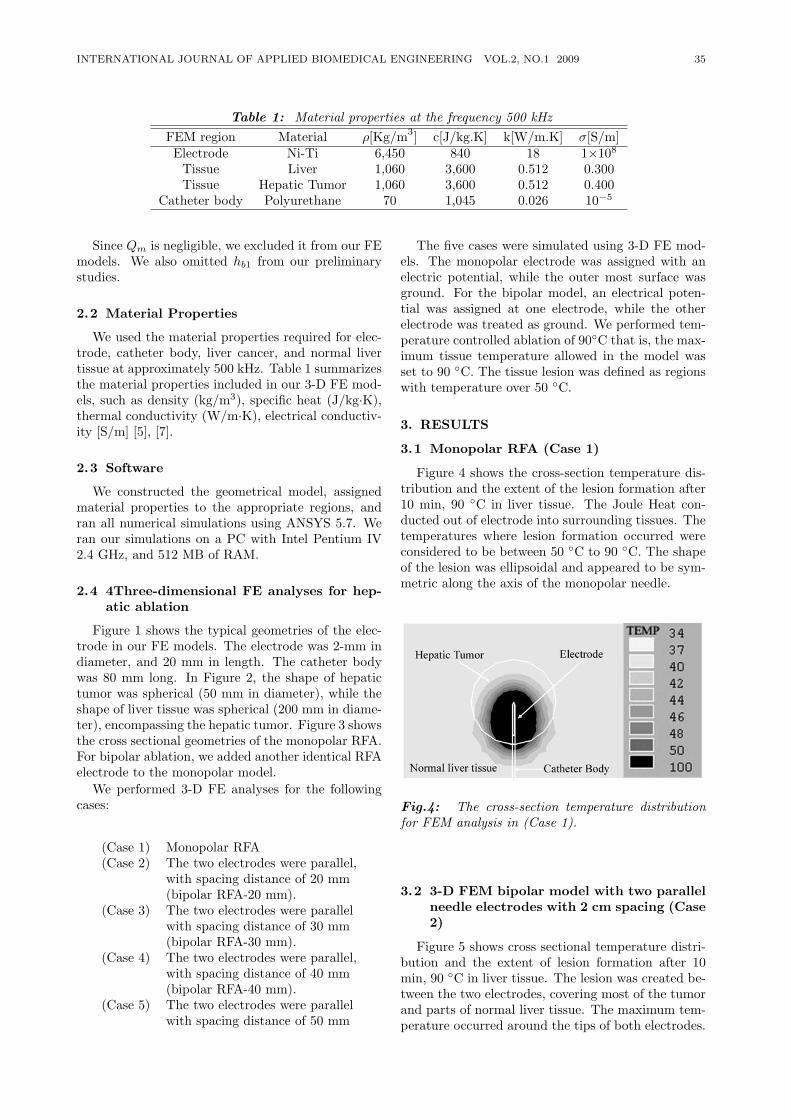
INTERNATIONAL JOURNAL OF APPLIED BIOMEDICAL ENGINEERING VOL.2, NO.1 2009 35
Table 1: Material properties at the frequency 500 kHzFEM region Material ρ[Kg/m3] c[J/kg.K] k[W/m.K] σ[S/m]Electrode Ni-Ti 6,450 840 18 1×10⁸
Tissue Liver 1,060 3,600 0.512 0.300Tissue Hepatic Tumor 1,060 3,600 0.512 0.400
Catheter body Polyurethane 70 1,045 0.026 10−5
Since Qm is negligible, we excluded it from our FEmodels. We also omitted hb1 from our preliminarystudies.
2.2 Material Properties
We used the material properties required for elec-trode, catheter body, liver cancer, and normal livertissue at approximately 500 kHz. Table 1 summarizesthe material properties included in our 3-D FE mod-els, such as density (kg/m3), specific heat (J/kg·K),thermal conductivity (W/m·K), electrical conductiv-ity [S/m] [5], [7].
2.3 Software
We constructed the geometrical model, assignedmaterial properties to the appropriate regions, andran all numerical simulations using ANSYS 5.7. Weran our simulations on a PC with Intel Pentium IV2.4 GHz, and 512 MB of RAM.
2.4 4Three-dimensional FE analyses for hep-atic ablation
Figure 1 shows the typical geometries of the elec-trode in our FE models. The electrode was 2-mm indiameter, and 20 mm in length. The catheter bodywas 80 mm long. In Figure 2, the shape of hepatictumor was spherical (50 mm in diameter), while theshape of liver tissue was spherical (200 mm in diame-ter), encompassing the hepatic tumor. Figure 3 showsthe cross sectional geometries of the monopolar RFA.For bipolar ablation, we added another identical RFAelectrode to the monopolar model.
We performed 3-D FE analyses for the followingcases:
(Case 1) Monopolar RFA(Case 2) The two electrodes were parallel,
with spacing distance of 20 mm(bipolar RFA-20 mm).
(Case 3) The two electrodes were parallelwith spacing distance of 30 mm(bipolar RFA-30 mm).
(Case 4) The two electrodes were parallel,with spacing distance of 40 mm(bipolar RFA-40 mm).
(Case 5) The two electrodes were parallelwith spacing distance of 50 mm
The five cases were simulated using 3-D FE mod-els. The monopolar electrode was assigned with anelectric potential, while the outer most surface wasground. For the bipolar model, an electrical poten-tial was assigned at one electrode, while the otherelectrode was treated as ground. We performed tem-perature controlled ablation of 90C that is, the max-imum tissue temperature allowed in the model wasset to 90 C. The tissue lesion was defined as regionswith temperature over 50 C.
3. RESULTS
3.1 Monopolar RFA (Case 1)
Figure 4 shows the cross-section temperature dis-tribution and the extent of the lesion formation after10 min, 90 C in liver tissue. The Joule Heat con-ducted out of electrode into surrounding tissues. Thetemperatures where lesion formation occurred wereconsidered to be between 50 C to 90 C. The shapeof the lesion was ellipsoidal and appeared to be sym-metric along the axis of the monopolar needle.
Fig.4: The cross-section temperature distributionfor FEM analysis in (Case 1).
3.2 3-D FEM bipolar model with two parallelneedle electrodes with 2 cm spacing (Case2)
Figure 5 shows cross sectional temperature distri-bution and the extent of lesion formation after 10min, 90 C in liver tissue. The lesion was created be-tween the two electrodes, covering most of the tumorand parts of normal liver tissue. The maximum tem-perature occurred around the tips of both electrodes.
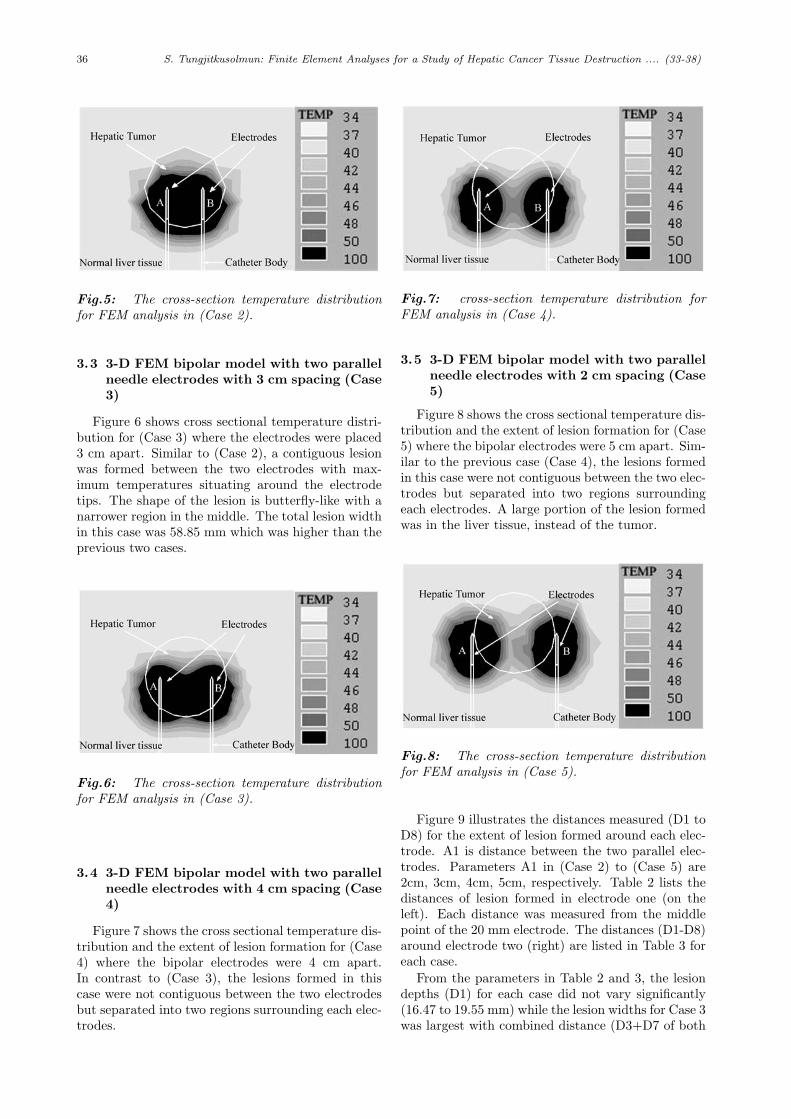
36 S. Tungjitkusolmun: Finite Element Analyses for a Study of Hepatic Cancer Tissue Destruction .... (33-38)
Fig.5: The cross-section temperature distributionfor FEM analysis in (Case 2).
3.3 3-D FEM bipolar model with two parallelneedle electrodes with 3 cm spacing (Case3)
Figure 6 shows cross sectional temperature distri-bution for (Case 3) where the electrodes were placed3 cm apart. Similar to (Case 2), a contiguous lesionwas formed between the two electrodes with max-imum temperatures situating around the electrodetips. The shape of the lesion is butterfly-like with anarrower region in the middle. The total lesion widthin this case was 58.85 mm which was higher than theprevious two cases.
Fig.6: The cross-section temperature distributionfor FEM analysis in (Case 3).
3.4 3-D FEM bipolar model with two parallelneedle electrodes with 4 cm spacing (Case4)
Figure 7 shows the cross sectional temperature dis-tribution and the extent of lesion formation for (Case4) where the bipolar electrodes were 4 cm apart.In contrast to (Case 3), the lesions formed in thiscase were not contiguous between the two electrodesbut separated into two regions surrounding each elec-trodes.
Fig.7: cross-section temperature distribution forFEM analysis in (Case 4).
3.5 3-D FEM bipolar model with two parallelneedle electrodes with 2 cm spacing (Case5)
Figure 8 shows the cross sectional temperature dis-tribution and the extent of lesion formation for (Case5) where the bipolar electrodes were 5 cm apart. Sim-ilar to the previous case (Case 4), the lesions formedin this case were not contiguous between the two elec-trodes but separated into two regions surroundingeach electrodes. A large portion of the lesion formedwas in the liver tissue, instead of the tumor.
Fig.8: The cross-section temperature distributionfor FEM analysis in (Case 5).
Figure 9 illustrates the distances measured (D1 toD8) for the extent of lesion formed around each elec-trode. A1 is distance between the two parallel elec-trodes. Parameters A1 in (Case 2) to (Case 5) are2cm, 3cm, 4cm, 5cm, respectively. Table 2 lists thedistances of lesion formed in electrode one (on theleft). Each distance was measured from the middlepoint of the 20 mm electrode. The distances (D1-D8)around electrode two (right) are listed in Table 3 foreach case.
From the parameters in Table 2 and 3, the lesiondepths (D1) for each case did not vary significantly(16.47 to 19.55 mm) while the lesion widths for Case 3was largest with combined distance (D3+D7 of both
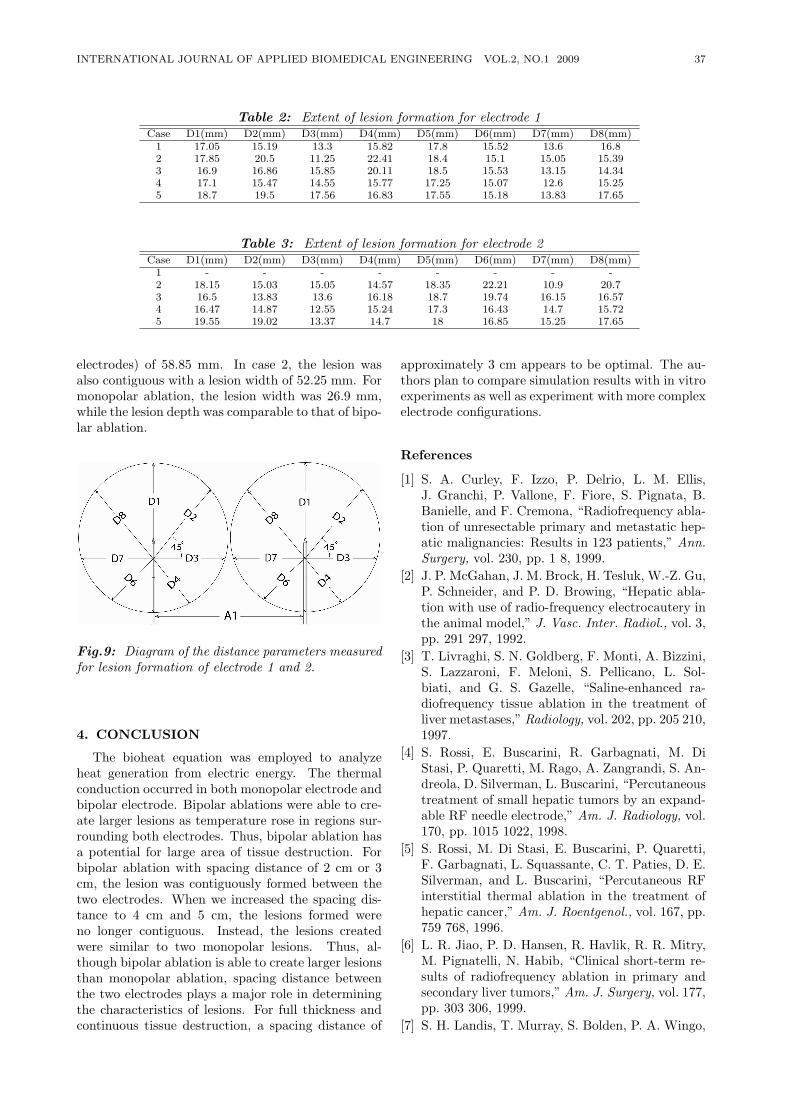
INTERNATIONAL JOURNAL OF APPLIED BIOMEDICAL ENGINEERING VOL.2, NO.1 2009 37
Table 2: Extent of lesion formation for electrode 1Case D1(mm) D2(mm) D3(mm) D4(mm) D5(mm) D6(mm) D7(mm) D8(mm)
1 17.05 15.19 13.3 15.82 17.8 15.52 13.6 16.82 17.85 20.5 11.25 22.41 18.4 15.1 15.05 15.393 16.9 16.86 15.85 20.11 18.5 15.53 13.15 14.344 17.1 15.47 14.55 15.77 17.25 15.07 12.6 15.255 18.7 19.5 17.56 16.83 17.55 15.18 13.83 17.65
Table 3: Extent of lesion formation for electrode 2Case D1(mm) D2(mm) D3(mm) D4(mm) D5(mm) D6(mm) D7(mm) D8(mm)
1 - - - - - - - -2 18.15 15.03 15.05 14.57 18.35 22.21 10.9 20.73 16.5 13.83 13.6 16.18 18.7 19.74 16.15 16.574 16.47 14.87 12.55 15.24 17.3 16.43 14.7 15.725 19.55 19.02 13.37 14.7 18 16.85 15.25 17.65
electrodes) of 58.85 mm. In case 2, the lesion wasalso contiguous with a lesion width of 52.25 mm. Formonopolar ablation, the lesion width was 26.9 mm,while the lesion depth was comparable to that of bipo-lar ablation.
Fig.9: Diagram of the distance parameters measuredfor lesion formation of electrode 1 and 2.
4. CONCLUSION
The bioheat equation was employed to analyzeheat generation from electric energy. The thermalconduction occurred in both monopolar electrode andbipolar electrode. Bipolar ablations were able to cre-ate larger lesions as temperature rose in regions sur-rounding both electrodes. Thus, bipolar ablation hasa potential for large area of tissue destruction. Forbipolar ablation with spacing distance of 2 cm or 3cm, the lesion was contiguously formed between thetwo electrodes. When we increased the spacing dis-tance to 4 cm and 5 cm, the lesions formed wereno longer contiguous. Instead, the lesions createdwere similar to two monopolar lesions. Thus, al-though bipolar ablation is able to create larger lesionsthan monopolar ablation, spacing distance betweenthe two electrodes plays a major role in determiningthe characteristics of lesions. For full thickness andcontinuous tissue destruction, a spacing distance of
approximately 3 cm appears to be optimal. The au-thors plan to compare simulation results with in vitroexperiments as well as experiment with more complexelectrode configurations.
References
[1] S. A. Curley, F. Izzo, P. Delrio, L. M. Ellis,J. Granchi, P. Vallone, F. Fiore, S. Pignata, B.Banielle, and F. Cremona, “Radiofrequency abla-tion of unresectable primary and metastatic hep-atic malignancies: Results in 123 patients,” Ann.Surgery, vol. 230, pp. 1 8, 1999.
[2] J. P. McGahan, J. M. Brock, H. Tesluk, W.-Z. Gu,P. Schneider, and P. D. Browing, “Hepatic abla-tion with use of radio-frequency electrocautery inthe animal model,” J. Vasc. Inter. Radiol., vol. 3,pp. 291 297, 1992.
[3] T. Livraghi, S. N. Goldberg, F. Monti, A. Bizzini,S. Lazzaroni, F. Meloni, S. Pellicano, L. Sol-biati, and G. S. Gazelle, “Saline-enhanced ra-diofrequency tissue ablation in the treatment ofliver metastases,” Radiology, vol. 202, pp. 205 210,1997.
[4] S. Rossi, E. Buscarini, R. Garbagnati, M. DiStasi, P. Quaretti, M. Rago, A. Zangrandi, S. An-dreola, D. Silverman, L. Buscarini, “Percutaneoustreatment of small hepatic tumors by an expand-able RF needle electrode,” Am. J. Radiology, vol.170, pp. 1015 1022, 1998.
[5] S. Rossi, M. Di Stasi, E. Buscarini, P. Quaretti,F. Garbagnati, L. Squassante, C. T. Paties, D. E.Silverman, and L. Buscarini, “Percutaneous RFinterstitial thermal ablation in the treatment ofhepatic cancer,” Am. J. Roentgenol., vol. 167, pp.759 768, 1996.
[6] L. R. Jiao, P. D. Hansen, R. Havlik, R. R. Mitry,M. Pignatelli, N. Habib, “Clinical short-term re-sults of radiofrequency ablation in primary andsecondary liver tumors,” Am. J. Surgery, vol. 177,pp. 303 306, 1999.
[7] S. H. Landis, T. Murray, S. Bolden, P. A. Wingo,
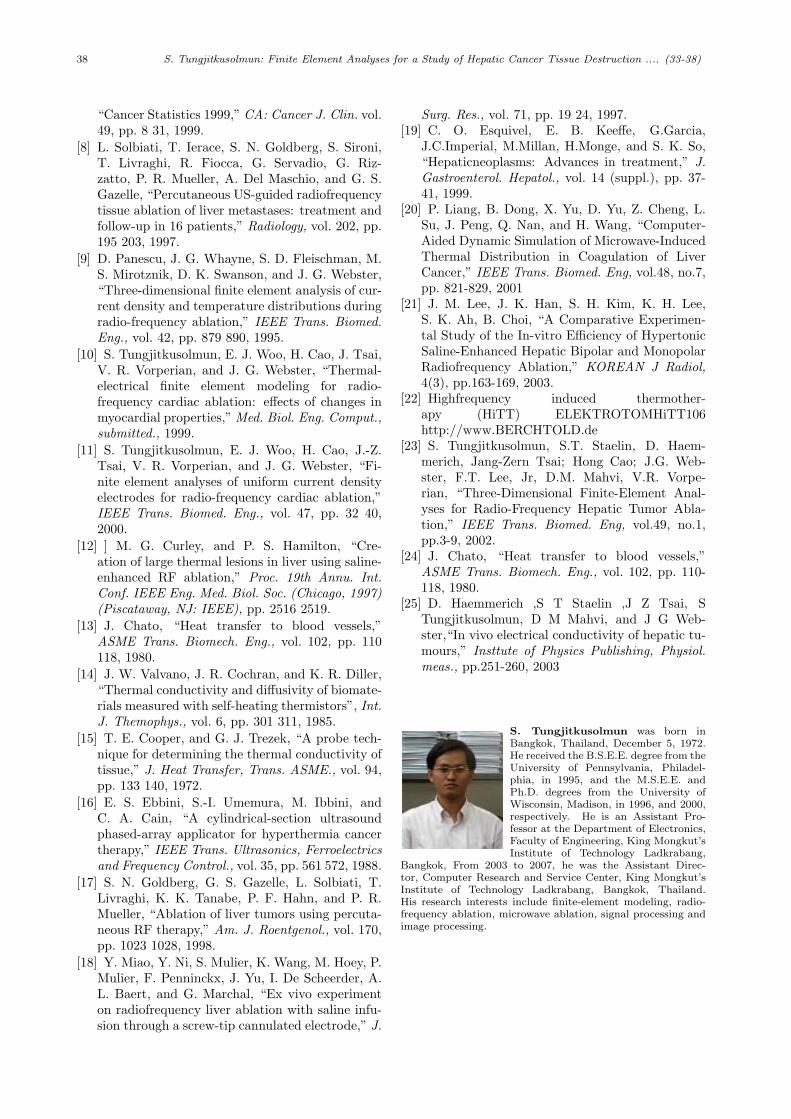
38 S. Tungjitkusolmun: Finite Element Analyses for a Study of Hepatic Cancer Tissue Destruction .... (33-38)
“Cancer Statistics 1999,” CA: Cancer J. Clin. vol.49, pp. 8 31, 1999.
[8] L. Solbiati, T. Ierace, S. N. Goldberg, S. Sironi,T. Livraghi, R. Fiocca, G. Servadio, G. Riz-zatto, P. R. Mueller, A. Del Maschio, and G. S.Gazelle, “Percutaneous US-guided radiofrequencytissue ablation of liver metastases: treatment andfollow-up in 16 patients,” Radiology, vol. 202, pp.195 203, 1997.
[9] D. Panescu, J. G. Whayne, S. D. Fleischman, M.S. Mirotznik, D. K. Swanson, and J. G. Webster,“Three-dimensional finite element analysis of cur-rent density and temperature distributions duringradio-frequency ablation,” IEEE Trans. Biomed.Eng., vol. 42, pp. 879 890, 1995.
[10] S. Tungjitkusolmun, E. J. Woo, H. Cao, J. Tsai,V. R. Vorperian, and J. G. Webster, “Thermal-electrical finite element modeling for radio-frequency cardiac ablation: effects of changes inmyocardial properties,” Med. Biol. Eng. Comput.,submitted., 1999.
[11] S. Tungjitkusolmun, E. J. Woo, H. Cao, J.-Z.Tsai, V. R. Vorperian, and J. G. Webster, “Fi-nite element analyses of uniform current densityelectrodes for radio-frequency cardiac ablation,”IEEE Trans. Biomed. Eng., vol. 47, pp. 32 40,2000.
[12] ] M. G. Curley, and P. S. Hamilton, “Cre-ation of large thermal lesions in liver using saline-enhanced RF ablation,” Proc. 19th Annu. Int.Conf. IEEE Eng. Med. Biol. Soc. (Chicago, 1997)(Piscataway, NJ: IEEE), pp. 2516 2519.
[13] J. Chato, “Heat transfer to blood vessels,”ASME Trans. Biomech. Eng., vol. 102, pp. 110118, 1980.
[14] J. W. Valvano, J. R. Cochran, and K. R. Diller,“Thermal conductivity and diffusivity of biomate-rials measured with self-heating thermistors”, Int.J. Themophys., vol. 6, pp. 301 311, 1985.
[15] T. E. Cooper, and G. J. Trezek, “A probe tech-nique for determining the thermal conductivity oftissue,” J. Heat Transfer, Trans. ASME., vol. 94,pp. 133 140, 1972.
[16] E. S. Ebbini, S.-I. Umemura, M. Ibbini, andC. A. Cain, “A cylindrical-section ultrasoundphased-array applicator for hyperthermia cancertherapy,” IEEE Trans. Ultrasonics, Ferroelectricsand Frequency Control., vol. 35, pp. 561 572, 1988.
[17] S. N. Goldberg, G. S. Gazelle, L. Solbiati, T.Livraghi, K. K. Tanabe, P. F. Hahn, and P. R.Mueller, “Ablation of liver tumors using percuta-neous RF therapy,” Am. J. Roentgenol., vol. 170,pp. 1023 1028, 1998.
[18] Y. Miao, Y. Ni, S. Mulier, K. Wang, M. Hoey, P.Mulier, F. Penninckx, J. Yu, I. De Scheerder, A.L. Baert, and G. Marchal, “Ex vivo experimenton radiofrequency liver ablation with saline infu-sion through a screw-tip cannulated electrode,” J.
Surg. Res., vol. 71, pp. 19 24, 1997.[19] C. O. Esquivel, E. B. Keeffe, G.Garcia,
J.C.Imperial, M.Millan, H.Monge, and S. K. So,“Hepaticneoplasms: Advances in treatment,” J.Gastroenterol. Hepatol., vol. 14 (suppl.), pp. 37-41, 1999.
[20] P. Liang, B. Dong, X. Yu, D. Yu, Z. Cheng, L.Su, J. Peng, Q. Nan, and H. Wang, “Computer-Aided Dynamic Simulation of Microwave-InducedThermal Distribution in Coagulation of LiverCancer,” IEEE Trans. Biomed. Eng, vol.48, no.7,pp. 821-829, 2001
[21] J. M. Lee, J. K. Han, S. H. Kim, K. H. Lee,S. K. Ah, B. Choi, “A Comparative Experimen-tal Study of the In-vitro Efficiency of HypertonicSaline-Enhanced Hepatic Bipolar and MonopolarRadiofrequency Ablation,” KOREAN J Radiol,4(3), pp.163-169, 2003.
[22] Highfrequency induced thermother-apy (HiTT) ELEKTROTOMHiTT106http://www.BERCHTOLD.de
[23] S. Tungjitkusolmun, S.T. Staelin, D. Haem-merich, Jang-Zern Tsai; Hong Cao; J.G. Web-ster, F.T. Lee, Jr, D.M. Mahvi, V.R. Vorpe-rian, “Three-Dimensional Finite-Element Anal-yses for Radio-Frequency Hepatic Tumor Abla-tion,” IEEE Trans. Biomed. Eng, vol.49, no.1,pp.3-9, 2002.
[24] J. Chato, “Heat transfer to blood vessels,”ASME Trans. Biomech. Eng., vol. 102, pp. 110-118, 1980.
[25] D. Haemmerich ,S T Staelin ,J Z Tsai, STungjitkusolmun, D M Mahvi, and J G Web-ster,“In vivo electrical conductivity of hepatic tu-mours,” Insttute of Physics Publishing, Physiol.meas., pp.251-260, 2003
S. Tungjitkusolmun was born inBangkok, Thailand, December 5, 1972.He received the B.S.E.E. degree from theUniversity of Pennsylvania, Philadel-phia, in 1995, and the M.S.E.E. andPh.D. degrees from the University ofWisconsin, Madison, in 1996, and 2000,respectively. He is an Assistant Pro-fessor at the Department of Electronics,Faculty of Engineering, King Mongkut’sInstitute of Technology Ladkrabang,
Bangkok, From 2003 to 2007, he was the Assistant Direc-tor, Computer Research and Service Center, King Mongkut’sInstitute of Technology Ladkrabang, Bangkok, Thailand.His research interests include finite-element modeling, radio-frequency ablation, microwave ablation, signal processing andimage processing.
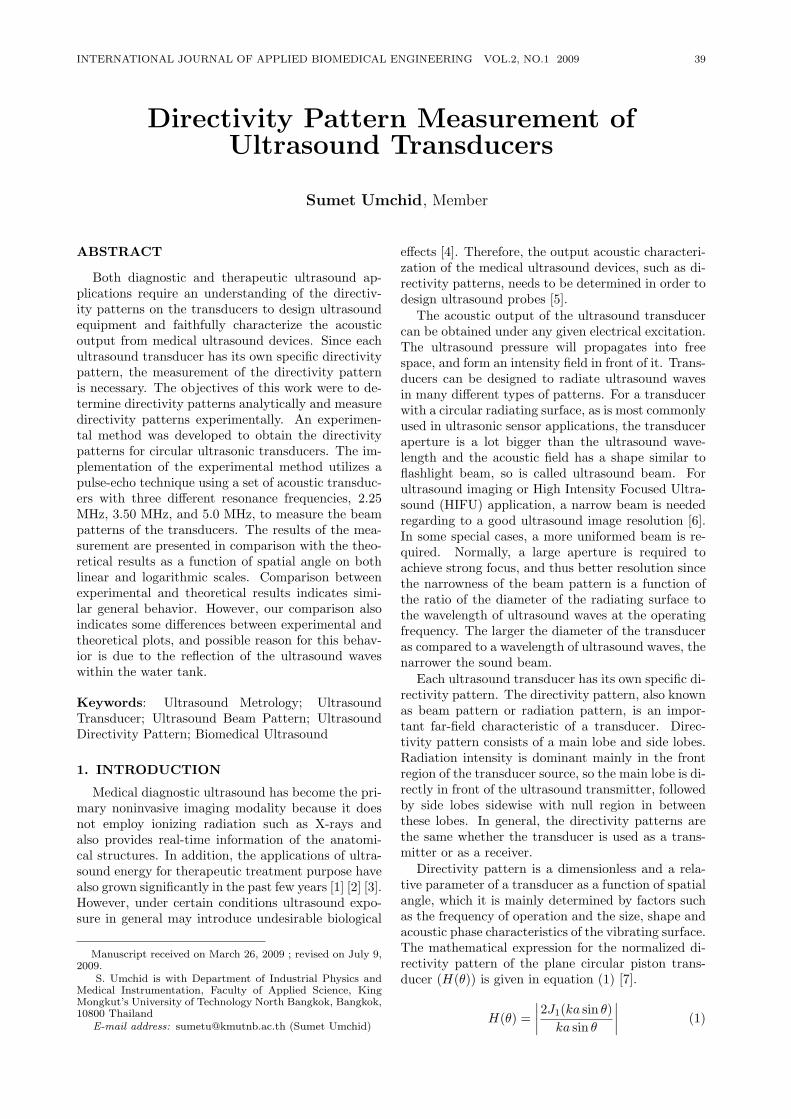
INTERNATIONAL JOURNAL OF APPLIED BIOMEDICAL ENGINEERING VOL.2, NO.1 2009 39
Directivity Pattern Measurement ofUltrasound Transducers
Sumet Umchid, Member
ABSTRACT
Both diagnostic and therapeutic ultrasound ap-plications require an understanding of the directiv-ity patterns on the transducers to design ultrasoundequipment and faithfully characterize the acousticoutput from medical ultrasound devices. Since eachultrasound transducer has its own specific directivitypattern, the measurement of the directivity patternis necessary. The objectives of this work were to de-termine directivity patterns analytically and measuredirectivity patterns experimentally. An experimen-tal method was developed to obtain the directivitypatterns for circular ultrasonic transducers. The im-plementation of the experimental method utilizes apulse-echo technique using a set of acoustic transduc-ers with three different resonance frequencies, 2.25MHz, 3.50 MHz, and 5.0 MHz, to measure the beampatterns of the transducers. The results of the mea-surement are presented in comparison with the theo-retical results as a function of spatial angle on bothlinear and logarithmic scales. Comparison betweenexperimental and theoretical results indicates simi-lar general behavior. However, our comparison alsoindicates some differences between experimental andtheoretical plots, and possible reason for this behav-ior is due to the reflection of the ultrasound waveswithin the water tank.
Keywords: Ultrasound Metrology; UltrasoundTransducer; Ultrasound Beam Pattern; UltrasoundDirectivity Pattern; Biomedical Ultrasound
1. INTRODUCTION
Medical diagnostic ultrasound has become the pri-mary noninvasive imaging modality because it doesnot employ ionizing radiation such as X-rays andalso provides real-time information of the anatomi-cal structures. In addition, the applications of ultra-sound energy for therapeutic treatment purpose havealso grown significantly in the past few years [1] [2] [3].However, under certain conditions ultrasound expo-sure in general may introduce undesirable biological
Manuscript received on March 26, 2009 ; revised on July 9,2009.
S. Umchid is with Department of Industrial Physics andMedical Instrumentation, Faculty of Applied Science, KingMongkut’s University of Technology North Bangkok, Bangkok,10800 Thailand
E-mail address: [email protected] (Sumet Umchid)
effects [4]. Therefore, the output acoustic characteri-zation of the medical ultrasound devices, such as di-rectivity patterns, needs to be determined in order todesign ultrasound probes [5].
The acoustic output of the ultrasound transducercan be obtained under any given electrical excitation.The ultrasound pressure will propagates into freespace, and form an intensity field in front of it. Trans-ducers can be designed to radiate ultrasound wavesin many different types of patterns. For a transducerwith a circular radiating surface, as is most commonlyused in ultrasonic sensor applications, the transduceraperture is a lot bigger than the ultrasound wave-length and the acoustic field has a shape similar toflashlight beam, so is called ultrasound beam. Forultrasound imaging or High Intensity Focused Ultra-sound (HIFU) application, a narrow beam is neededregarding to a good ultrasound image resolution [6].In some special cases, a more uniformed beam is re-quired. Normally, a large aperture is required toachieve strong focus, and thus better resolution sincethe narrowness of the beam pattern is a function ofthe ratio of the diameter of the radiating surface tothe wavelength of ultrasound waves at the operatingfrequency. The larger the diameter of the transduceras compared to a wavelength of ultrasound waves, thenarrower the sound beam.
Each ultrasound transducer has its own specific di-rectivity pattern. The directivity pattern, also knownas beam pattern or radiation pattern, is an impor-tant far-field characteristic of a transducer. Direc-tivity pattern consists of a main lobe and side lobes.Radiation intensity is dominant mainly in the frontregion of the transducer source, so the main lobe is di-rectly in front of the ultrasound transmitter, followedby side lobes sidewise with null region in betweenthese lobes. In general, the directivity patterns arethe same whether the transducer is used as a trans-mitter or as a receiver.
Directivity pattern is a dimensionless and a rela-tive parameter of a transducer as a function of spatialangle, which it is mainly determined by factors suchas the frequency of operation and the size, shape andacoustic phase characteristics of the vibrating surface.The mathematical expression for the normalized di-rectivity pattern of the plane circular piston trans-ducer (H(θ)) is given in equation (1) [7].
H(θ) =∣∣∣∣2J1(ka sin θ)
ka sin θ
∣∣∣∣ (1)
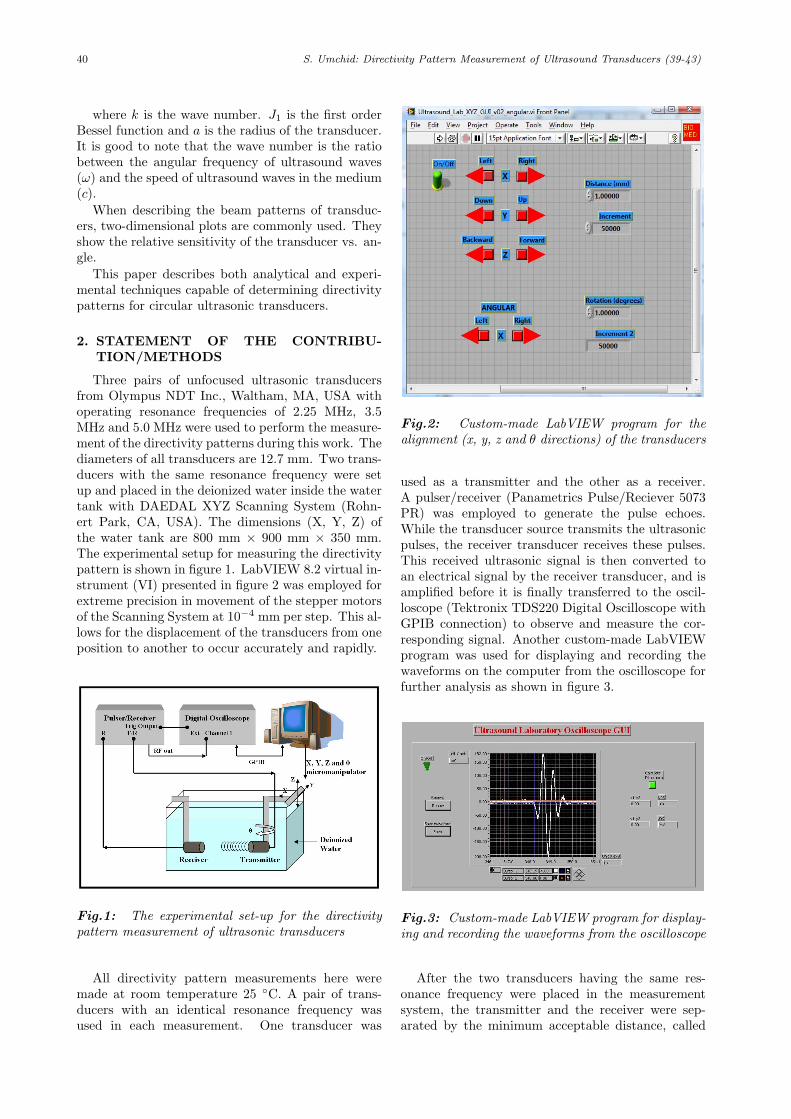
40 S. Umchid: Directivity Pattern Measurement of Ultrasound Transducers (39-43)
where k is the wave number. J1 is the first orderBessel function and a is the radius of the transducer.It is good to note that the wave number is the ratiobetween the angular frequency of ultrasound waves(ω) and the speed of ultrasound waves in the medium(c).
When describing the beam patterns of transduc-ers, two-dimensional plots are commonly used. Theyshow the relative sensitivity of the transducer vs. an-gle.
This paper describes both analytical and experi-mental techniques capable of determining directivitypatterns for circular ultrasonic transducers.
2. STATEMENT OF THE CONTRIBU-TION/METHODS
Three pairs of unfocused ultrasonic transducersfrom Olympus NDT Inc., Waltham, MA, USA withoperating resonance frequencies of 2.25 MHz, 3.5MHz and 5.0 MHz were used to perform the measure-ment of the directivity patterns during this work. Thediameters of all transducers are 12.7 mm. Two trans-ducers with the same resonance frequency were setup and placed in the deionized water inside the watertank with DAEDAL XYZ Scanning System (Rohn-ert Park, CA, USA). The dimensions (X, Y, Z) ofthe water tank are 800 mm × 900 mm × 350 mm.The experimental setup for measuring the directivitypattern is shown in figure 1. LabVIEW 8.2 virtual in-strument (VI) presented in figure 2 was employed forextreme precision in movement of the stepper motorsof the Scanning System at 10−4 mm per step. This al-lows for the displacement of the transducers from oneposition to another to occur accurately and rapidly.
Fig.1: The experimental set-up for the directivitypattern measurement of ultrasonic transducers
All directivity pattern measurements here weremade at room temperature 25 C. A pair of trans-ducers with an identical resonance frequency wasused in each measurement. One transducer was
Fig.2: Custom-made LabVIEW program for thealignment (x, y, z and θ directions) of the transducers
used as a transmitter and the other as a receiver.A pulser/receiver (Panametrics Pulse/Reciever 5073PR) was employed to generate the pulse echoes.While the transducer source transmits the ultrasonicpulses, the receiver transducer receives these pulses.This received ultrasonic signal is then converted toan electrical signal by the receiver transducer, and isamplified before it is finally transferred to the oscil-loscope (Tektronix TDS220 Digital Oscilloscope withGPIB connection) to observe and measure the cor-responding signal. Another custom-made LabVIEWprogram was used for displaying and recording thewaveforms on the computer from the oscilloscope forfurther analysis as shown in figure 3.
Fig.3: Custom-made LabVIEW program for display-ing and recording the waveforms from the oscilloscope
After the two transducers having the same res-onance frequency were placed in the measurementsystem, the transmitter and the receiver were sep-arated by the minimum acceptable distance, called
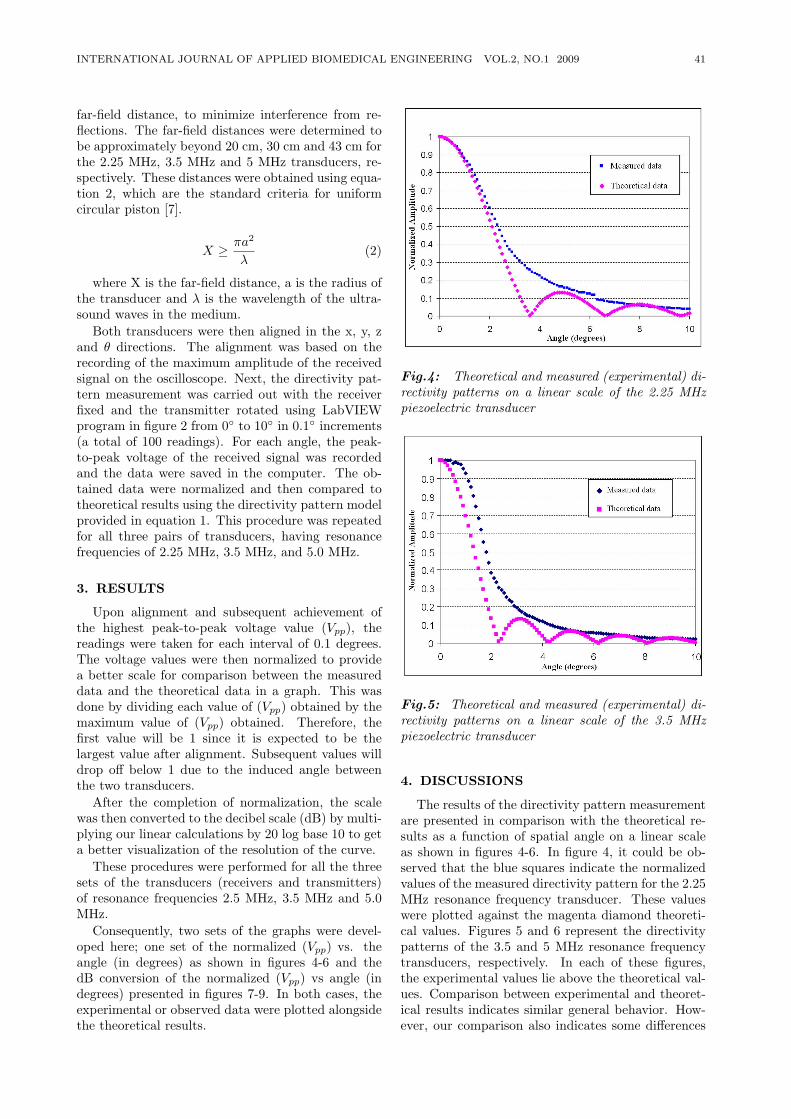
INTERNATIONAL JOURNAL OF APPLIED BIOMEDICAL ENGINEERING VOL.2, NO.1 2009 41
far-field distance, to minimize interference from re-flections. The far-field distances were determined tobe approximately beyond 20 cm, 30 cm and 43 cm forthe 2.25 MHz, 3.5 MHz and 5 MHz transducers, re-spectively. These distances were obtained using equa-tion 2, which are the standard criteria for uniformcircular piston [7].
X ≥ πa2
λ(2)
where X is the far-field distance, a is the radius ofthe transducer and λ is the wavelength of the ultra-sound waves in the medium.
Both transducers were then aligned in the x, y, zand θ directions. The alignment was based on therecording of the maximum amplitude of the receivedsignal on the oscilloscope. Next, the directivity pat-tern measurement was carried out with the receiverfixed and the transmitter rotated using LabVIEWprogram in figure 2 from 0 to 10 in 0.1 increments(a total of 100 readings). For each angle, the peak-to-peak voltage of the received signal was recordedand the data were saved in the computer. The ob-tained data were normalized and then compared totheoretical results using the directivity pattern modelprovided in equation 1. This procedure was repeatedfor all three pairs of transducers, having resonancefrequencies of 2.25 MHz, 3.5 MHz, and 5.0 MHz.
3. RESULTS
Upon alignment and subsequent achievement ofthe highest peak-to-peak voltage value (Vpp), thereadings were taken for each interval of 0.1 degrees.The voltage values were then normalized to providea better scale for comparison between the measureddata and the theoretical data in a graph. This wasdone by dividing each value of (Vpp) obtained by themaximum value of (Vpp) obtained. Therefore, thefirst value will be 1 since it is expected to be thelargest value after alignment. Subsequent values willdrop off below 1 due to the induced angle betweenthe two transducers.
After the completion of normalization, the scalewas then converted to the decibel scale (dB) by multi-plying our linear calculations by 20 log base 10 to geta better visualization of the resolution of the curve.
These procedures were performed for all the threesets of the transducers (receivers and transmitters)of resonance frequencies 2.5 MHz, 3.5 MHz and 5.0MHz.
Consequently, two sets of the graphs were devel-oped here; one set of the normalized (Vpp) vs. theangle (in degrees) as shown in figures 4-6 and thedB conversion of the normalized (Vpp) vs angle (indegrees) presented in figures 7-9. In both cases, theexperimental or observed data were plotted alongsidethe theoretical results.
Fig.4: Theoretical and measured (experimental) di-rectivity patterns on a linear scale of the 2.25 MHzpiezoelectric transducer
Fig.5: Theoretical and measured (experimental) di-rectivity patterns on a linear scale of the 3.5 MHzpiezoelectric transducer
4. DISCUSSIONS
The results of the directivity pattern measurementare presented in comparison with the theoretical re-sults as a function of spatial angle on a linear scaleas shown in figures 4-6. In figure 4, it could be ob-served that the blue squares indicate the normalizedvalues of the measured directivity pattern for the 2.25MHz resonance frequency transducer. These valueswere plotted against the magenta diamond theoreti-cal values. Figures 5 and 6 represent the directivitypatterns of the 3.5 and 5 MHz resonance frequencytransducers, respectively. In each of these figures,the experimental values lie above the theoretical val-ues. Comparison between experimental and theoret-ical results indicates similar general behavior. How-ever, our comparison also indicates some differences
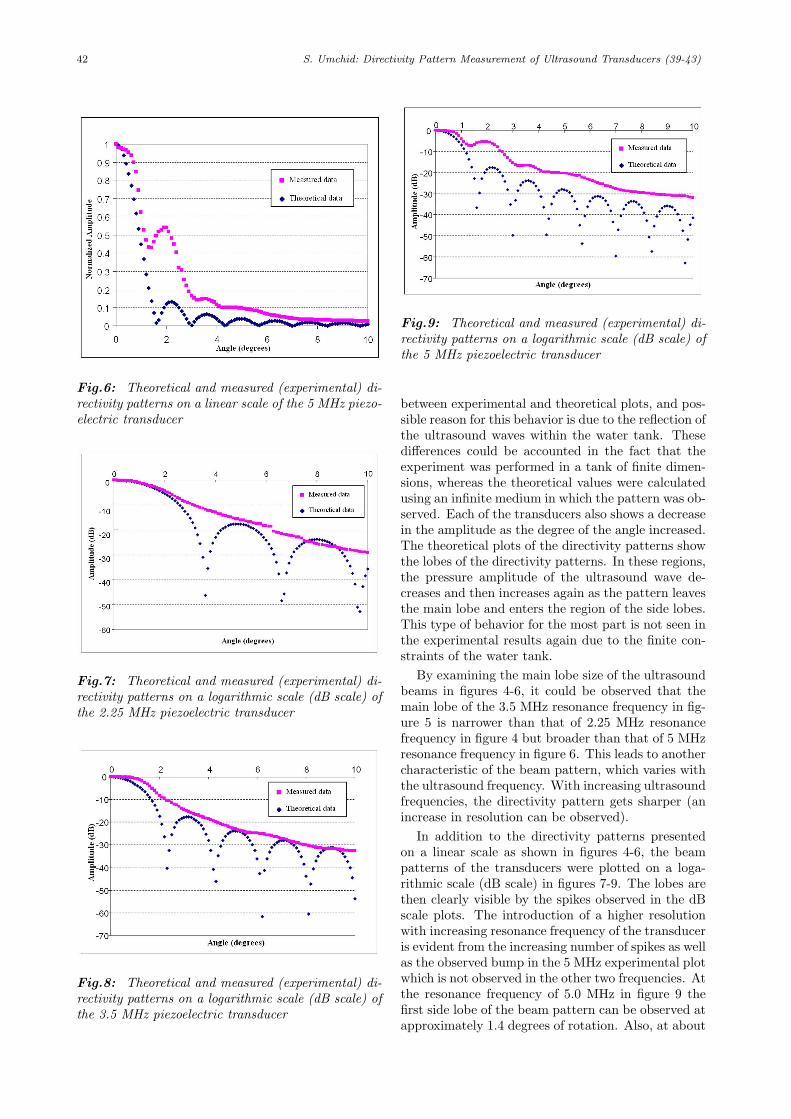
42 S. Umchid: Directivity Pattern Measurement of Ultrasound Transducers (39-43)
Fig.6: Theoretical and measured (experimental) di-rectivity patterns on a linear scale of the 5 MHz piezo-electric transducer
Fig.7: Theoretical and measured (experimental) di-rectivity patterns on a logarithmic scale (dB scale) ofthe 2.25 MHz piezoelectric transducer
Fig.8: Theoretical and measured (experimental) di-rectivity patterns on a logarithmic scale (dB scale) ofthe 3.5 MHz piezoelectric transducer
Fig.9: Theoretical and measured (experimental) di-rectivity patterns on a logarithmic scale (dB scale) ofthe 5 MHz piezoelectric transducer
between experimental and theoretical plots, and pos-sible reason for this behavior is due to the reflection ofthe ultrasound waves within the water tank. Thesedifferences could be accounted in the fact that theexperiment was performed in a tank of finite dimen-sions, whereas the theoretical values were calculatedusing an infinite medium in which the pattern was ob-served. Each of the transducers also shows a decreasein the amplitude as the degree of the angle increased.The theoretical plots of the directivity patterns showthe lobes of the directivity patterns. In these regions,the pressure amplitude of the ultrasound wave de-creases and then increases again as the pattern leavesthe main lobe and enters the region of the side lobes.This type of behavior for the most part is not seen inthe experimental results again due to the finite con-straints of the water tank.
By examining the main lobe size of the ultrasoundbeams in figures 4-6, it could be observed that themain lobe of the 3.5 MHz resonance frequency in fig-ure 5 is narrower than that of 2.25 MHz resonancefrequency in figure 4 but broader than that of 5 MHzresonance frequency in figure 6. This leads to anothercharacteristic of the beam pattern, which varies withthe ultrasound frequency. With increasing ultrasoundfrequencies, the directivity pattern gets sharper (anincrease in resolution can be observed).
In addition to the directivity patterns presentedon a linear scale as shown in figures 4-6, the beampatterns of the transducers were plotted on a loga-rithmic scale (dB scale) in figures 7-9. The lobes arethen clearly visible by the spikes observed in the dBscale plots. The introduction of a higher resolutionwith increasing resonance frequency of the transduceris evident from the increasing number of spikes as wellas the observed bump in the 5 MHz experimental plotwhich is not observed in the other two frequencies. Atthe resonance frequency of 5.0 MHz in figure 9 thefirst side lobe of the beam pattern can be observed atapproximately 1.4 degrees of rotation. Also, at about
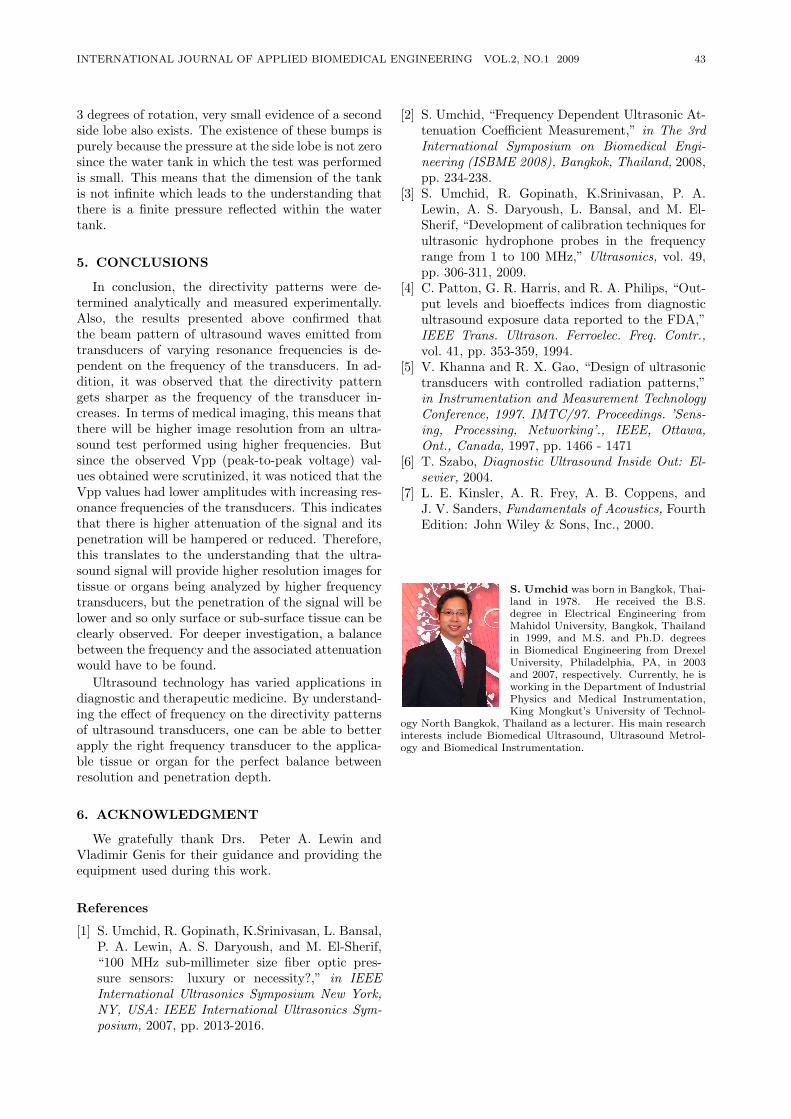
INTERNATIONAL JOURNAL OF APPLIED BIOMEDICAL ENGINEERING VOL.2, NO.1 2009 43
3 degrees of rotation, very small evidence of a secondside lobe also exists. The existence of these bumps ispurely because the pressure at the side lobe is not zerosince the water tank in which the test was performedis small. This means that the dimension of the tankis not infinite which leads to the understanding thatthere is a finite pressure reflected within the watertank.
5. CONCLUSIONS
In conclusion, the directivity patterns were de-termined analytically and measured experimentally.Also, the results presented above confirmed thatthe beam pattern of ultrasound waves emitted fromtransducers of varying resonance frequencies is de-pendent on the frequency of the transducers. In ad-dition, it was observed that the directivity patterngets sharper as the frequency of the transducer in-creases. In terms of medical imaging, this means thatthere will be higher image resolution from an ultra-sound test performed using higher frequencies. Butsince the observed Vpp (peak-to-peak voltage) val-ues obtained were scrutinized, it was noticed that theVpp values had lower amplitudes with increasing res-onance frequencies of the transducers. This indicatesthat there is higher attenuation of the signal and itspenetration will be hampered or reduced. Therefore,this translates to the understanding that the ultra-sound signal will provide higher resolution images fortissue or organs being analyzed by higher frequencytransducers, but the penetration of the signal will belower and so only surface or sub-surface tissue can beclearly observed. For deeper investigation, a balancebetween the frequency and the associated attenuationwould have to be found.
Ultrasound technology has varied applications indiagnostic and therapeutic medicine. By understand-ing the effect of frequency on the directivity patternsof ultrasound transducers, one can be able to betterapply the right frequency transducer to the applica-ble tissue or organ for the perfect balance betweenresolution and penetration depth.
6. ACKNOWLEDGMENT
We gratefully thank Drs. Peter A. Lewin andVladimir Genis for their guidance and providing theequipment used during this work.
References
[1] S. Umchid, R. Gopinath, K.Srinivasan, L. Bansal,P. A. Lewin, A. S. Daryoush, and M. El-Sherif,“100 MHz sub-millimeter size fiber optic pres-sure sensors: luxury or necessity?,” in IEEEInternational Ultrasonics Symposium New York,NY, USA: IEEE International Ultrasonics Sym-posium, 2007, pp. 2013-2016.
[2] S. Umchid, “Frequency Dependent Ultrasonic At-tenuation Coefficient Measurement,” in The 3rdInternational Symposium on Biomedical Engi-neering (ISBME 2008), Bangkok, Thailand, 2008,pp. 234-238.
[3] S. Umchid, R. Gopinath, K.Srinivasan, P. A.Lewin, A. S. Daryoush, L. Bansal, and M. El-Sherif, “Development of calibration techniques forultrasonic hydrophone probes in the frequencyrange from 1 to 100 MHz,” Ultrasonics, vol. 49,pp. 306-311, 2009.
[4] C. Patton, G. R. Harris, and R. A. Philips, “Out-put levels and bioeffects indices from diagnosticultrasound exposure data reported to the FDA,”IEEE Trans. Ultrason. Ferroelec. Freq. Contr.,vol. 41, pp. 353-359, 1994.
[5] V. Khanna and R. X. Gao, “Design of ultrasonictransducers with controlled radiation patterns,”in Instrumentation and Measurement TechnologyConference, 1997. IMTC/97. Proceedings. ’Sens-ing, Processing, Networking’., IEEE, Ottawa,Ont., Canada, 1997, pp. 1466 - 1471
[6] T. Szabo, Diagnostic Ultrasound Inside Out: El-sevier, 2004.
[7] L. E. Kinsler, A. R. Frey, A. B. Coppens, andJ. V. Sanders, Fundamentals of Acoustics, FourthEdition: John Wiley & Sons, Inc., 2000.
S. Umchid was born in Bangkok, Thai-land in 1978. He received the B.S.degree in Electrical Engineering fromMahidol University, Bangkok, Thailandin 1999, and M.S. and Ph.D. degreesin Biomedical Engineering from DrexelUniversity, Philadelphia, PA, in 2003and 2007, respectively. Currently, he isworking in the Department of IndustrialPhysics and Medical Instrumentation,King Mongkut’s University of Technol-
ogy North Bangkok, Thailand as a lecturer. His main researchinterests include Biomedical Ultrasound, Ultrasound Metrol-ogy and Biomedical Instrumentation.
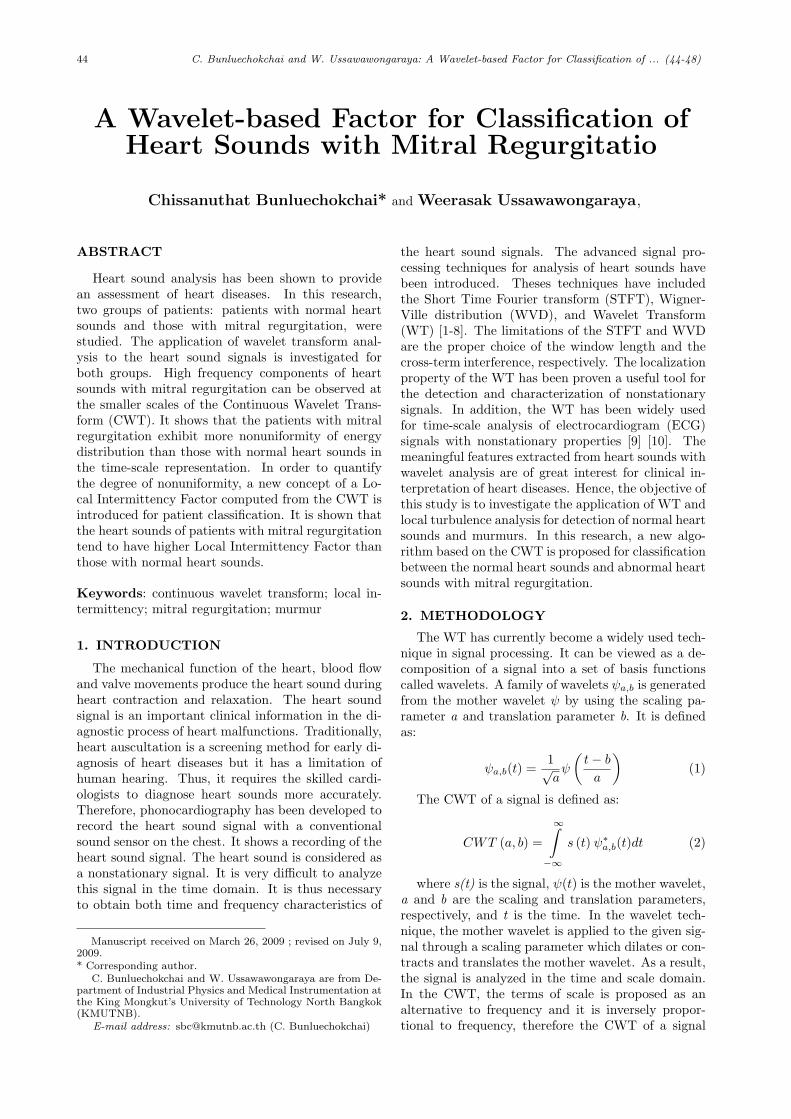
44 C. Bunluechokchai and W. Ussawawongaraya: A Wavelet-based Factor for Classification of ... (44-48)
A Wavelet-based Factor for Classification ofHeart Sounds with Mitral Regurgitatio
Chissanuthat Bunluechokchai* and Weerasak Ussawawongaraya,
ABSTRACT
Heart sound analysis has been shown to providean assessment of heart diseases. In this research,two groups of patients: patients with normal heartsounds and those with mitral regurgitation, werestudied. The application of wavelet transform anal-ysis to the heart sound signals is investigated forboth groups. High frequency components of heartsounds with mitral regurgitation can be observed atthe smaller scales of the Continuous Wavelet Trans-form (CWT). It shows that the patients with mitralregurgitation exhibit more nonuniformity of energydistribution than those with normal heart sounds inthe time-scale representation. In order to quantifythe degree of nonuniformity, a new concept of a Lo-cal Intermittency Factor computed from the CWT isintroduced for patient classification. It is shown thatthe heart sounds of patients with mitral regurgitationtend to have higher Local Intermittency Factor thanthose with normal heart sounds.
Keywords: continuous wavelet transform; local in-termittency; mitral regurgitation; murmur
1. INTRODUCTION
The mechanical function of the heart, blood flowand valve movements produce the heart sound duringheart contraction and relaxation. The heart soundsignal is an important clinical information in the di-agnostic process of heart malfunctions. Traditionally,heart auscultation is a screening method for early di-agnosis of heart diseases but it has a limitation ofhuman hearing. Thus, it requires the skilled cardi-ologists to diagnose heart sounds more accurately.Therefore, phonocardiography has been developed torecord the heart sound signal with a conventionalsound sensor on the chest. It shows a recording of theheart sound signal. The heart sound is considered asa nonstationary signal. It is very difficult to analyzethis signal in the time domain. It is thus necessaryto obtain both time and frequency characteristics of
Manuscript received on March 26, 2009 ; revised on July 9,2009.* Corresponding author.
C. Bunluechokchai and W. Ussawawongaraya are from De-partment of Industrial Physics and Medical Instrumentation atthe King Mongkut’s University of Technology North Bangkok(KMUTNB).
E-mail address: [email protected] (C. Bunluechokchai)
the heart sound signals. The advanced signal pro-cessing techniques for analysis of heart sounds havebeen introduced. Theses techniques have includedthe Short Time Fourier transform (STFT), Wigner-Ville distribution (WVD), and Wavelet Transform(WT) [1-8]. The limitations of the STFT and WVDare the proper choice of the window length and thecross-term interference, respectively. The localizationproperty of the WT has been proven a useful tool forthe detection and characterization of nonstationarysignals. In addition, the WT has been widely usedfor time-scale analysis of electrocardiogram (ECG)signals with nonstationary properties [9] [10]. Themeaningful features extracted from heart sounds withwavelet analysis are of great interest for clinical in-terpretation of heart diseases. Hence, the objective ofthis study is to investigate the application of WT andlocal turbulence analysis for detection of normal heartsounds and murmurs. In this research, a new algo-rithm based on the CWT is proposed for classificationbetween the normal heart sounds and abnormal heartsounds with mitral regurgitation.
2. METHODOLOGY
The WT has currently become a widely used tech-nique in signal processing. It can be viewed as a de-composition of a signal into a set of basis functionscalled wavelets. A family of wavelets ψa,b is generatedfrom the mother wavelet ψ by using the scaling pa-rameter a and translation parameter b. It is definedas:
ψa,b(t) =1√aψ
(t− ba
)(1)
The CWT of a signal is defined as:
CWT (a, b) =
∞∫−∞
s (t) ψ∗a,b(t)dt (2)
where s(t) is the signal, ψ(t) is the mother wavelet,a and b are the scaling and translation parameters,respectively, and t is the time. In the wavelet tech-nique, the mother wavelet is applied to the given sig-nal through a scaling parameter which dilates or con-tracts and translates the mother wavelet. As a result,the signal is analyzed in the time and scale domain.In the CWT, the terms of scale is proposed as analternative to frequency and it is inversely propor-tional to frequency, therefore the CWT of a signal
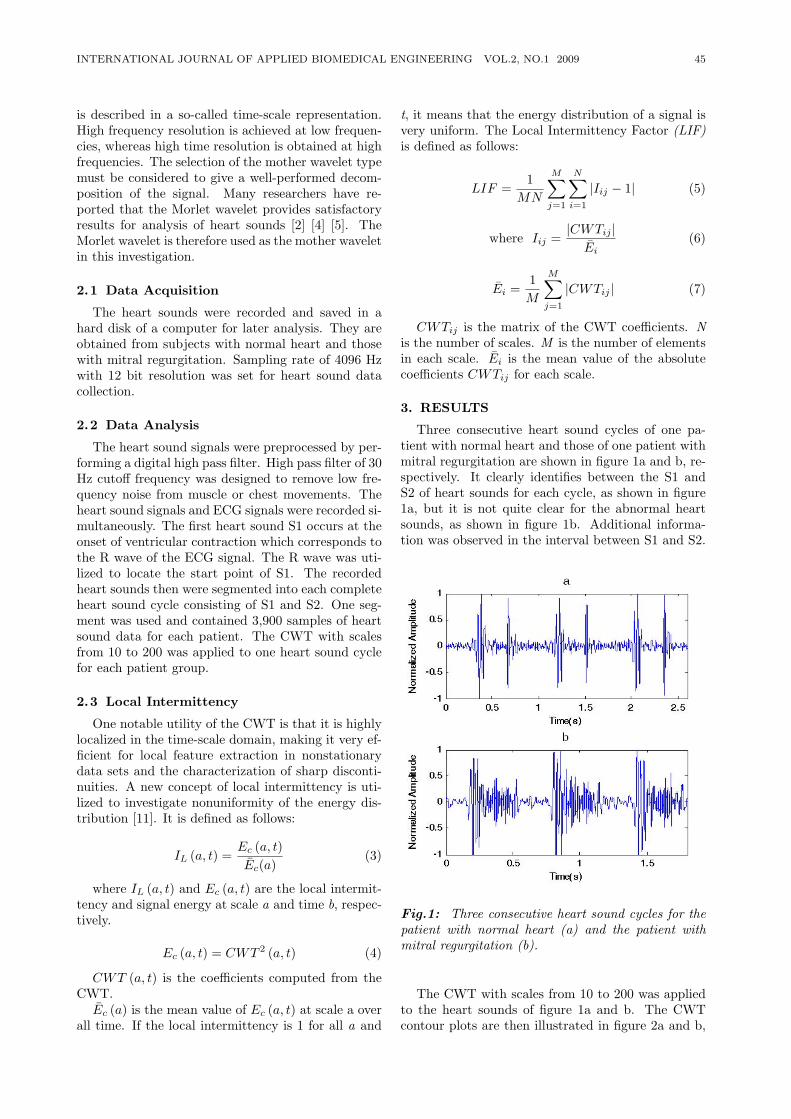
INTERNATIONAL JOURNAL OF APPLIED BIOMEDICAL ENGINEERING VOL.2, NO.1 2009 45
is described in a so-called time-scale representation.High frequency resolution is achieved at low frequen-cies, whereas high time resolution is obtained at highfrequencies. The selection of the mother wavelet typemust be considered to give a well-performed decom-position of the signal. Many researchers have re-ported that the Morlet wavelet provides satisfactoryresults for analysis of heart sounds [2] [4] [5]. TheMorlet wavelet is therefore used as the mother waveletin this investigation.
2.1 Data Acquisition
The heart sounds were recorded and saved in ahard disk of a computer for later analysis. They areobtained from subjects with normal heart and thosewith mitral regurgitation. Sampling rate of 4096 Hzwith 12 bit resolution was set for heart sound datacollection.
2.2 Data Analysis
The heart sound signals were preprocessed by per-forming a digital high pass filter. High pass filter of 30Hz cutoff frequency was designed to remove low fre-quency noise from muscle or chest movements. Theheart sound signals and ECG signals were recorded si-multaneously. The first heart sound S1 occurs at theonset of ventricular contraction which corresponds tothe R wave of the ECG signal. The R wave was uti-lized to locate the start point of S1. The recordedheart sounds then were segmented into each completeheart sound cycle consisting of S1 and S2. One seg-ment was used and contained 3,900 samples of heartsound data for each patient. The CWT with scalesfrom 10 to 200 was applied to one heart sound cyclefor each patient group.
2.3 Local Intermittency
One notable utility of the CWT is that it is highlylocalized in the time-scale domain, making it very ef-ficient for local feature extraction in nonstationarydata sets and the characterization of sharp disconti-nuities. A new concept of local intermittency is uti-lized to investigate nonuniformity of the energy dis-tribution [11]. It is defined as follows:
IL (a, t) =Ec (a, t)Ec(a)
(3)
where IL (a, t) and Ec (a, t) are the local intermit-tency and signal energy at scale a and time b, respec-tively.
Ec (a, t) = CWT 2 (a, t) (4)
CWT (a, t) is the coefficients computed from theCWT.Ec (a) is the mean value of Ec (a, t) at scale a over
all time. If the local intermittency is 1 for all a and
t, it means that the energy distribution of a signal isvery uniform. The Local Intermittency Factor (LIF)is defined as follows:
LIF =1
MN
M∑j=1
N∑i=1
|Iij − 1| (5)
where Iij =|CWTij |
Ei(6)
Ei =1M
M∑j=1
|CWTij | (7)
CWTij is the matrix of the CWT coefficients. Nis the number of scales. M is the number of elementsin each scale. Ei is the mean value of the absolutecoefficients CWTij for each scale.
3. RESULTS
Three consecutive heart sound cycles of one pa-tient with normal heart and those of one patient withmitral regurgitation are shown in figure 1a and b, re-spectively. It clearly identifies between the S1 andS2 of heart sounds for each cycle, as shown in figure1a, but it is not quite clear for the abnormal heartsounds, as shown in figure 1b. Additional informa-tion was observed in the interval between S1 and S2.
Fig.1: Three consecutive heart sound cycles for thepatient with normal heart (a) and the patient withmitral regurgitation (b).
The CWT with scales from 10 to 200 was appliedto the heart sounds of figure 1a and b. The CWTcontour plots are then illustrated in figure 2a and b,
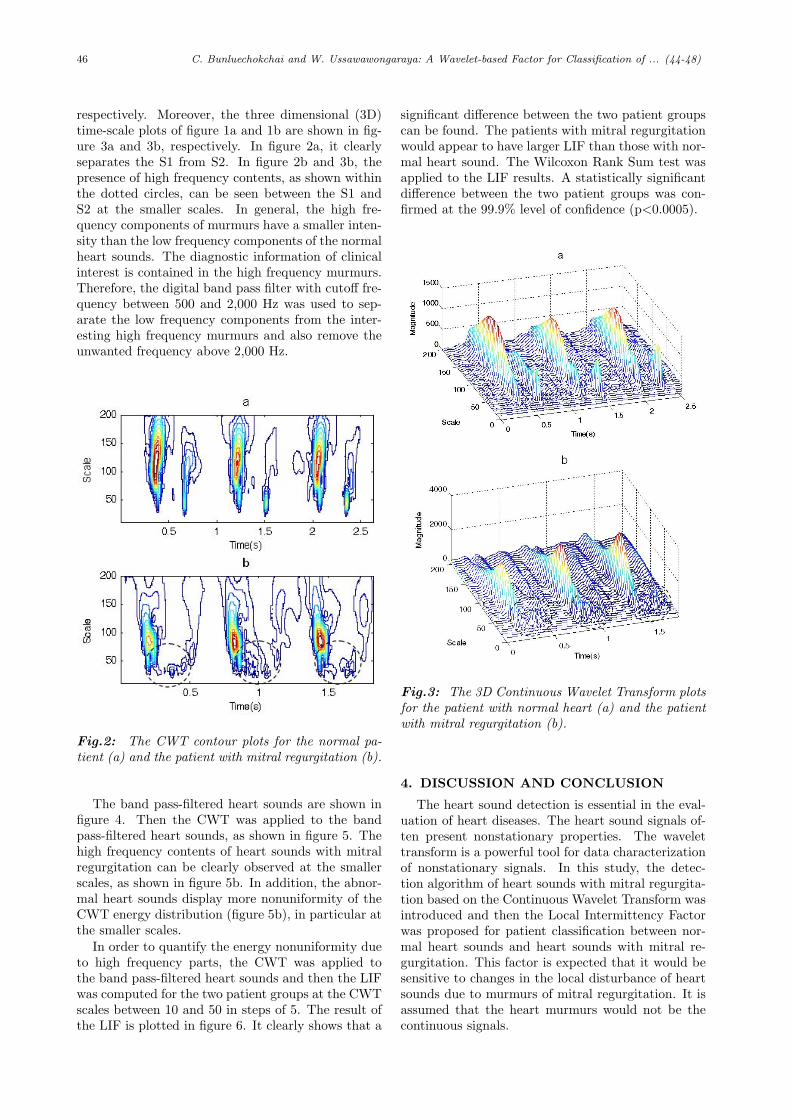
46 C. Bunluechokchai and W. Ussawawongaraya: A Wavelet-based Factor for Classification of ... (44-48)
respectively. Moreover, the three dimensional (3D)time-scale plots of figure 1a and 1b are shown in fig-ure 3a and 3b, respectively. In figure 2a, it clearlyseparates the S1 from S2. In figure 2b and 3b, thepresence of high frequency contents, as shown withinthe dotted circles, can be seen between the S1 andS2 at the smaller scales. In general, the high fre-quency components of murmurs have a smaller inten-sity than the low frequency components of the normalheart sounds. The diagnostic information of clinicalinterest is contained in the high frequency murmurs.Therefore, the digital band pass filter with cutoff fre-quency between 500 and 2,000 Hz was used to sep-arate the low frequency components from the inter-esting high frequency murmurs and also remove theunwanted frequency above 2,000 Hz.
Fig.2: The CWT contour plots for the normal pa-tient (a) and the patient with mitral regurgitation (b).
The band pass-filtered heart sounds are shown infigure 4. Then the CWT was applied to the bandpass-filtered heart sounds, as shown in figure 5. Thehigh frequency contents of heart sounds with mitralregurgitation can be clearly observed at the smallerscales, as shown in figure 5b. In addition, the abnor-mal heart sounds display more nonuniformity of theCWT energy distribution (figure 5b), in particular atthe smaller scales.
In order to quantify the energy nonuniformity dueto high frequency parts, the CWT was applied tothe band pass-filtered heart sounds and then the LIFwas computed for the two patient groups at the CWTscales between 10 and 50 in steps of 5. The result ofthe LIF is plotted in figure 6. It clearly shows that a
significant difference between the two patient groupscan be found. The patients with mitral regurgitationwould appear to have larger LIF than those with nor-mal heart sound. The Wilcoxon Rank Sum test wasapplied to the LIF results. A statistically significantdifference between the two patient groups was con-firmed at the 99.9% level of confidence (p<0.0005).
Fig.3: The 3D Continuous Wavelet Transform plotsfor the patient with normal heart (a) and the patientwith mitral regurgitation (b).
4. DISCUSSION AND CONCLUSION
The heart sound detection is essential in the eval-uation of heart diseases. The heart sound signals of-ten present nonstationary properties. The wavelettransform is a powerful tool for data characterizationof nonstationary signals. In this study, the detec-tion algorithm of heart sounds with mitral regurgita-tion based on the Continuous Wavelet Transform wasintroduced and then the Local Intermittency Factorwas proposed for patient classification between nor-mal heart sounds and heart sounds with mitral re-gurgitation. This factor is expected that it would besensitive to changes in the local disturbance of heartsounds due to murmurs of mitral regurgitation. It isassumed that the heart murmurs would not be thecontinuous signals.
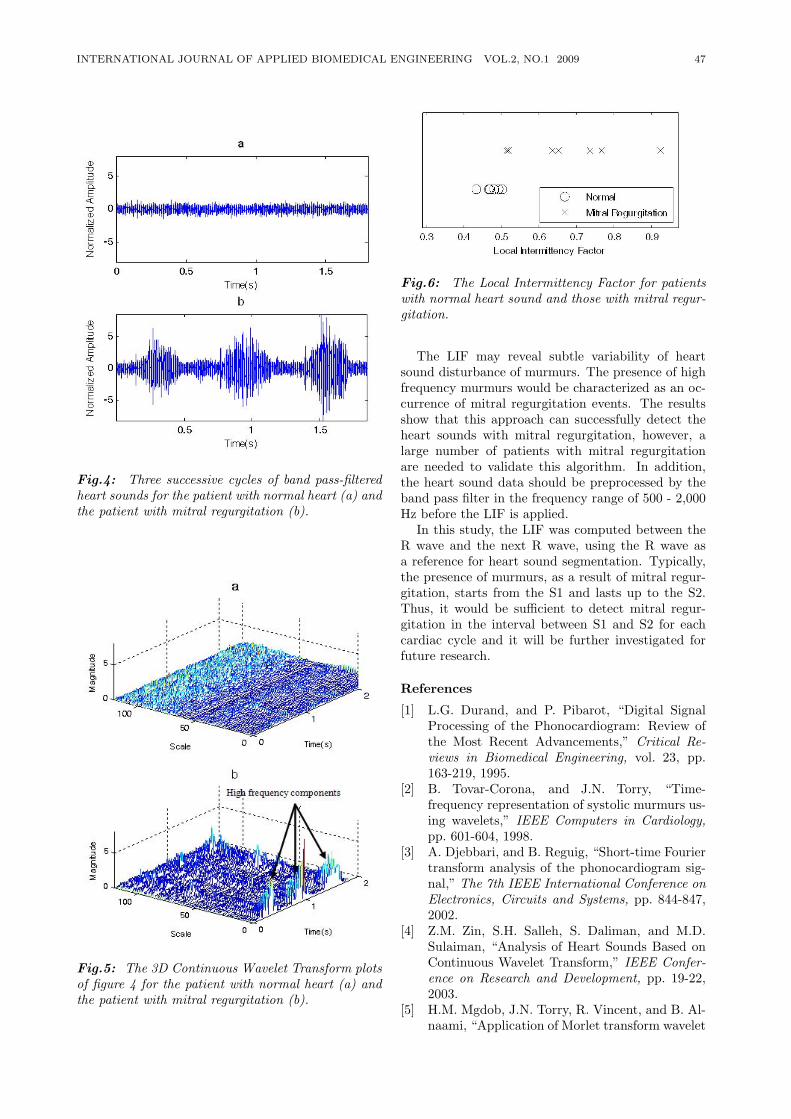
INTERNATIONAL JOURNAL OF APPLIED BIOMEDICAL ENGINEERING VOL.2, NO.1 2009 47
Fig.4: Three successive cycles of band pass-filteredheart sounds for the patient with normal heart (a) andthe patient with mitral regurgitation (b).
Fig.5: The 3D Continuous Wavelet Transform plotsof figure 4 for the patient with normal heart (a) andthe patient with mitral regurgitation (b).
Fig.6: The Local Intermittency Factor for patientswith normal heart sound and those with mitral regur-gitation.
The LIF may reveal subtle variability of heartsound disturbance of murmurs. The presence of highfrequency murmurs would be characterized as an oc-currence of mitral regurgitation events. The resultsshow that this approach can successfully detect theheart sounds with mitral regurgitation, however, alarge number of patients with mitral regurgitationare needed to validate this algorithm. In addition,the heart sound data should be preprocessed by theband pass filter in the frequency range of 500 - 2,000Hz before the LIF is applied.
In this study, the LIF was computed between theR wave and the next R wave, using the R wave asa reference for heart sound segmentation. Typically,the presence of murmurs, as a result of mitral regur-gitation, starts from the S1 and lasts up to the S2.Thus, it would be sufficient to detect mitral regur-gitation in the interval between S1 and S2 for eachcardiac cycle and it will be further investigated forfuture research.
References
[1] L.G. Durand, and P. Pibarot, “Digital SignalProcessing of the Phonocardiogram: Review ofthe Most Recent Advancements,” Critical Re-views in Biomedical Engineering, vol. 23, pp.163-219, 1995.
[2] B. Tovar-Corona, and J.N. Torry, “Time-frequency representation of systolic murmurs us-ing wavelets,” IEEE Computers in Cardiology,pp. 601-604, 1998.
[3] A. Djebbari, and B. Reguig, “Short-time Fouriertransform analysis of the phonocardiogram sig-nal,” The 7th IEEE International Conference onElectronics, Circuits and Systems, pp. 844-847,2002.
[4] Z.M. Zin, S.H. Salleh, S. Daliman, and M.D.Sulaiman, “Analysis of Heart Sounds Based onContinuous Wavelet Transform,” IEEE Confer-ence on Research and Development, pp. 19-22,2003.
[5] H.M. Mgdob, J.N. Torry, R. Vincent, and B. Al-naami, “Application of Morlet transform wavelet
48 C. Bunluechokchai and W. Ussawawongaraya: A Wavelet-based Factor for Classification of ... (44-48)
in the detection of paradoxical splitting of thesecond heart sound,” IEEE Computers in Car-diology, pp. 323-326, 2003.
[6] S. Omran, and M. Tayel, “A Heart Sound Seg-mentation and Feature Extraction AlgorithmUsing Wavelets,” First International Symposiumon Control, Communications and Signal Pro-cessing, pp. 235-238, 2004.
[7] Z. Zhidong, Z. Zhijin, and C. Yuquan, “Time-Frequency Analysis of Heart Sound Based onHHT,” IEEE International Conference on Com-munications, Circuits and Systems, vol. 2, pp.926-929, 2005.
[8] P. Wang, Y. Kim, and C.B. Soh, “Feature Ex-traction Based on Mel-scaled Wavelet TransformFor Heart Sound Analysis,” Proceedings of the2005 IEEE Engineering in Medicine and Biology27th Annual Conference, pp. 7572-7575, 2005.
[9] S. Bunluechokchai, and M.J. English, “Detec-tion of wavelet transform-processed ventricularlate potentials and approximate entropy,” IEEEComputers in Cardiology, pp. 549-552, 2003.
[10] S. Bunluechokchai, and M.J. English, “Analysisof the high resolution ECG with the continuouswavelet transform,” IEEE Computers in Cardi-ology, pp. 553-556, 2003.
[11] N.M. Astafyeva, “Wavelet analysis: basic theoryand some applications,” Physics Uspekhi, vol.39(11), pp. 1085-1108, 1996.
C. Bunluechokchai received the B.Sc. degree (Honor) in Medical Technol-ogy from Mahidol University, Bangkok,Thailand in 1976, the M. Sc. Degree inBiochemistry from Chulalongkorn Uni-versity, Bangkok, Thailand in 1980 andthe Graduate Diploma in Biotechnologyfrom University of Kent at Canterbury,England in 1988. In 1994, he receivedthe Ph. D. degree in Biochemistry fromMahidol University, Bangkok, Thailand.
His recent position is assistant professor and chairman of Clin-ical Chemistry Department, Faculty of Medical Technology,Mahidol University, Bangkok. Biosensor and nanobiotechnol-ogy are his current research field.
W. Ussawawongaraya received theB.S. (nursing and midwifery) and M.S.(physiology of excercise) from Mahi-dol University, Bangkok, Thailand. Heis currently an assistant professor inthe Department of Industrial Physicsand Medical Instrumentation at KingMongkut’s University of TechnologyNorth Bangkok (KMUTNB), Thailand.His research interests include biome-chanic and biomedical science.
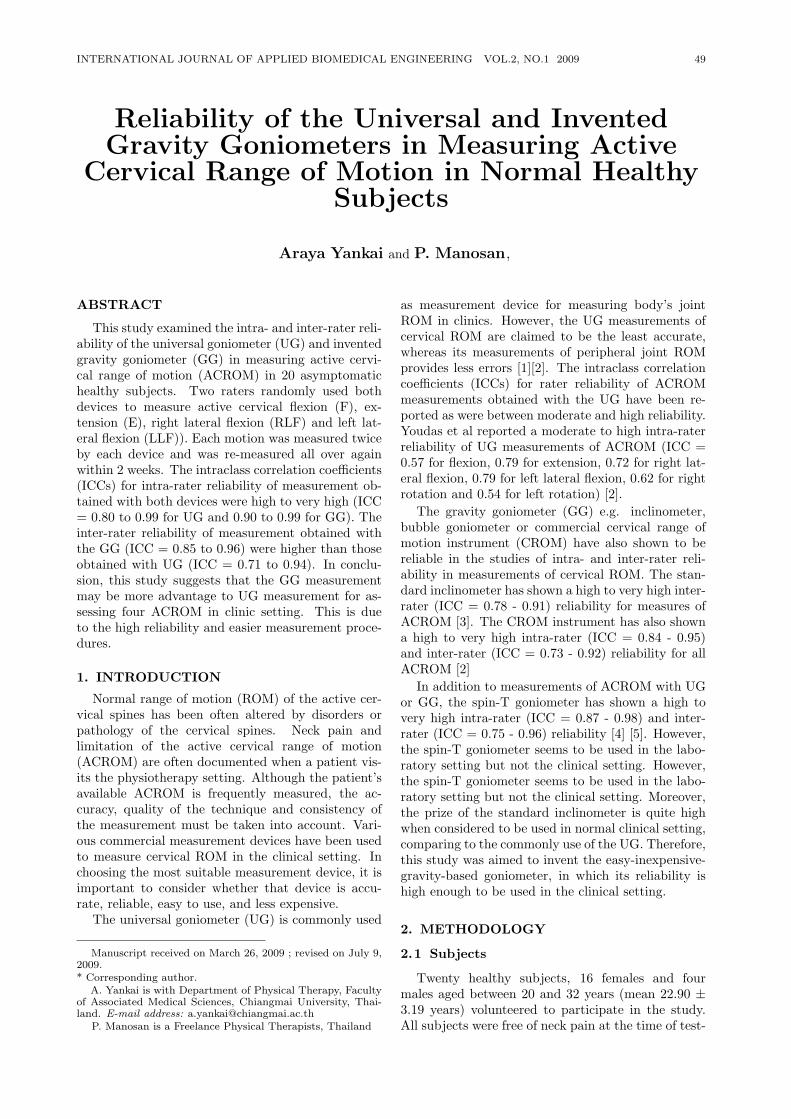
INTERNATIONAL JOURNAL OF APPLIED BIOMEDICAL ENGINEERING VOL.2, NO.1 2009 49
Reliability of the Universal and InventedGravity Goniometers in Measuring Active
Cervical Range of Motion in Normal HealthySubjects
Araya Yankai and P. Manosan,
ABSTRACT
This study examined the intra- and inter-rater reli-ability of the universal goniometer (UG) and inventedgravity goniometer (GG) in measuring active cervi-cal range of motion (ACROM) in 20 asymptomatichealthy subjects. Two raters randomly used bothdevices to measure active cervical flexion (F), ex-tension (E), right lateral flexion (RLF) and left lat-eral flexion (LLF)). Each motion was measured twiceby each device and was re-measured all over againwithin 2 weeks. The intraclass correlation coefficients(ICCs) for intra-rater reliability of measurement ob-tained with both devices were high to very high (ICC= 0.80 to 0.99 for UG and 0.90 to 0.99 for GG). Theinter-rater reliability of measurement obtained withthe GG (ICC = 0.85 to 0.96) were higher than thoseobtained with UG (ICC = 0.71 to 0.94). In conclu-sion, this study suggests that the GG measurementmay be more advantage to UG measurement for as-sessing four ACROM in clinic setting. This is dueto the high reliability and easier measurement proce-dures.
1. INTRODUCTION
Normal range of motion (ROM) of the active cer-vical spines has been often altered by disorders orpathology of the cervical spines. Neck pain andlimitation of the active cervical range of motion(ACROM) are often documented when a patient vis-its the physiotherapy setting. Although the patient’savailable ACROM is frequently measured, the ac-curacy, quality of the technique and consistency ofthe measurement must be taken into account. Vari-ous commercial measurement devices have been usedto measure cervical ROM in the clinical setting. Inchoosing the most suitable measurement device, it isimportant to consider whether that device is accu-rate, reliable, easy to use, and less expensive.
The universal goniometer (UG) is commonly used
Manuscript received on March 26, 2009 ; revised on July 9,2009.* Corresponding author.
A. Yankai is with Department of Physical Therapy, Facultyof Associated Medical Sciences, Chiangmai University, Thai-land. E-mail address: [email protected]
P. Manosan is a Freelance Physical Therapists, Thailand
as measurement device for measuring body’s jointROM in clinics. However, the UG measurements ofcervical ROM are claimed to be the least accurate,whereas its measurements of peripheral joint ROMprovides less errors [1][2]. The intraclass correlationcoefficients (ICCs) for rater reliability of ACROMmeasurements obtained with the UG have been re-ported as were between moderate and high reliability.Youdas et al reported a moderate to high intra-raterreliability of UG measurements of ACROM (ICC =0.57 for flexion, 0.79 for extension, 0.72 for right lat-eral flexion, 0.79 for left lateral flexion, 0.62 for rightrotation and 0.54 for left rotation) [2].
The gravity goniometer (GG) e.g. inclinometer,bubble goniometer or commercial cervical range ofmotion instrument (CROM) have also shown to bereliable in the studies of intra- and inter-rater reli-ability in measurements of cervical ROM. The stan-dard inclinometer has shown a high to very high inter-rater (ICC = 0.78 - 0.91) reliability for measures ofACROM [3]. The CROM instrument has also showna high to very high intra-rater (ICC = 0.84 - 0.95)and inter-rater (ICC = 0.73 - 0.92) reliability for allACROM [2]
In addition to measurements of ACROM with UGor GG, the spin-T goniometer has shown a high tovery high intra-rater (ICC = 0.87 - 0.98) and inter-rater (ICC = 0.75 - 0.96) reliability [4] [5]. However,the spin-T goniometer seems to be used in the labo-ratory setting but not the clinical setting. However,the spin-T goniometer seems to be used in the labo-ratory setting but not the clinical setting. Moreover,the prize of the standard inclinometer is quite highwhen considered to be used in normal clinical setting,comparing to the commonly use of the UG. Therefore,this study was aimed to invent the easy-inexpensive-gravity-based goniometer, in which its reliability ishigh enough to be used in the clinical setting.
2. METHODOLOGY
2.1 Subjects
Twenty healthy subjects, 16 females and fourmales aged between 20 and 32 years (mean 22.90 ±3.19 years) volunteered to participate in the study.All subjects were free of neck pain at the time of test-
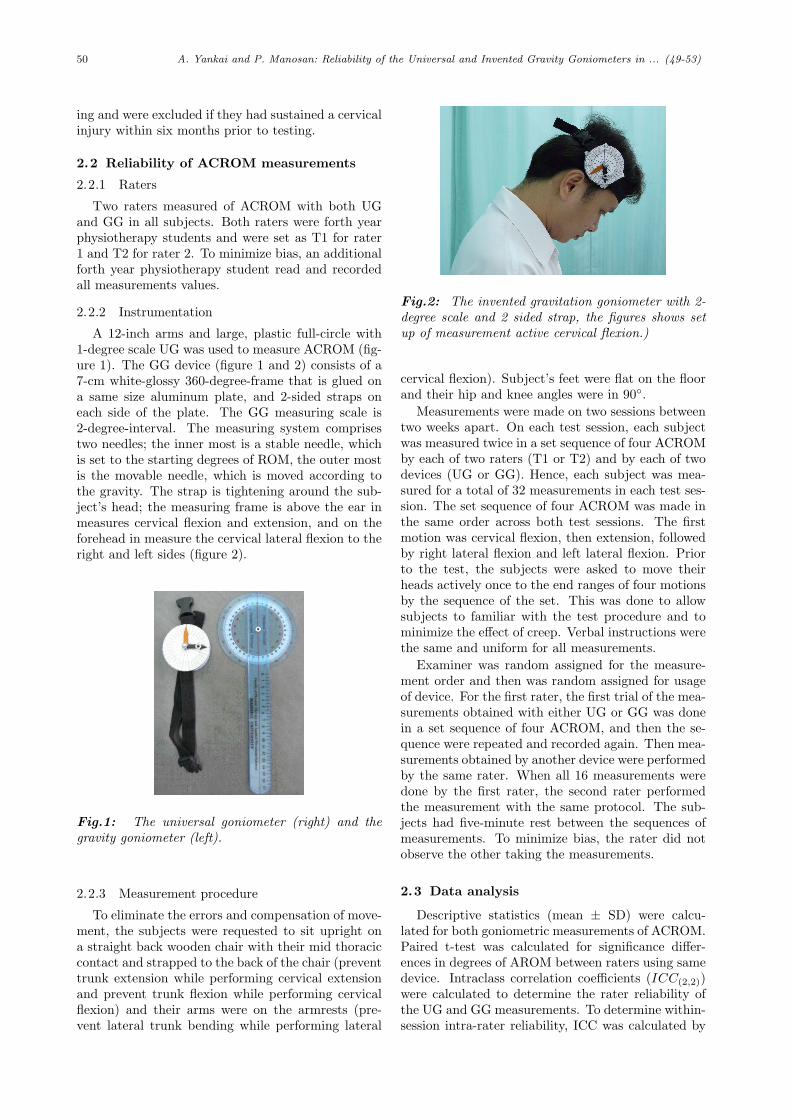
50 A. Yankai and P. Manosan: Reliability of the Universal and Invented Gravity Goniometers in ... (49-53)
ing and were excluded if they had sustained a cervicalinjury within six months prior to testing.
2.2 Reliability of ACROM measurements
2.2.1 Raters
Two raters measured of ACROM with both UGand GG in all subjects. Both raters were forth yearphysiotherapy students and were set as T1 for rater1 and T2 for rater 2. To minimize bias, an additionalforth year physiotherapy student read and recordedall measurements values.
2.2.2 Instrumentation
A 12-inch arms and large, plastic full-circle with1-degree scale UG was used to measure ACROM (fig-ure 1). The GG device (figure 1 and 2) consists of a7-cm white-glossy 360-degree-frame that is glued ona same size aluminum plate, and 2-sided straps oneach side of the plate. The GG measuring scale is2-degree-interval. The measuring system comprisestwo needles; the inner most is a stable needle, whichis set to the starting degrees of ROM, the outer mostis the movable needle, which is moved according tothe gravity. The strap is tightening around the sub-ject’s head; the measuring frame is above the ear inmeasures cervical flexion and extension, and on theforehead in measure the cervical lateral flexion to theright and left sides (figure 2).
Fig.1: The universal goniometer (right) and thegravity goniometer (left).
2.2.3 Measurement procedure
To eliminate the errors and compensation of move-ment, the subjects were requested to sit upright ona straight back wooden chair with their mid thoraciccontact and strapped to the back of the chair (preventtrunk extension while performing cervical extensionand prevent trunk flexion while performing cervicalflexion) and their arms were on the armrests (pre-vent lateral trunk bending while performing lateral
Fig.2: The invented gravitation goniometer with 2-degree scale and 2 sided strap, the figures shows setup of measurement active cervical flexion.)
cervical flexion). Subject’s feet were flat on the floorand their hip and knee angles were in 90.
Measurements were made on two sessions betweentwo weeks apart. On each test session, each subjectwas measured twice in a set sequence of four ACROMby each of two raters (T1 or T2) and by each of twodevices (UG or GG). Hence, each subject was mea-sured for a total of 32 measurements in each test ses-sion. The set sequence of four ACROM was made inthe same order across both test sessions. The firstmotion was cervical flexion, then extension, followedby right lateral flexion and left lateral flexion. Priorto the test, the subjects were asked to move theirheads actively once to the end ranges of four motionsby the sequence of the set. This was done to allowsubjects to familiar with the test procedure and tominimize the effect of creep. Verbal instructions werethe same and uniform for all measurements.
Examiner was random assigned for the measure-ment order and then was random assigned for usageof device. For the first rater, the first trial of the mea-surements obtained with either UG or GG was donein a set sequence of four ACROM, and then the se-quence were repeated and recorded again. Then mea-surements obtained by another device were performedby the same rater. When all 16 measurements weredone by the first rater, the second rater performedthe measurement with the same protocol. The sub-jects had five-minute rest between the sequences ofmeasurements. To minimize bias, the rater did notobserve the other taking the measurements.
2.3 Data analysis
Descriptive statistics (mean ± SD) were calcu-lated for both goniometric measurements of ACROM.Paired t-test was calculated for significance differ-ences in degrees of AROM between raters using samedevice. Intraclass correlation coefficients (ICC(2,2))were calculated to determine the rater reliability ofthe UG and GG measurements. To determine within-session intra-rater reliability, ICC was calculated by
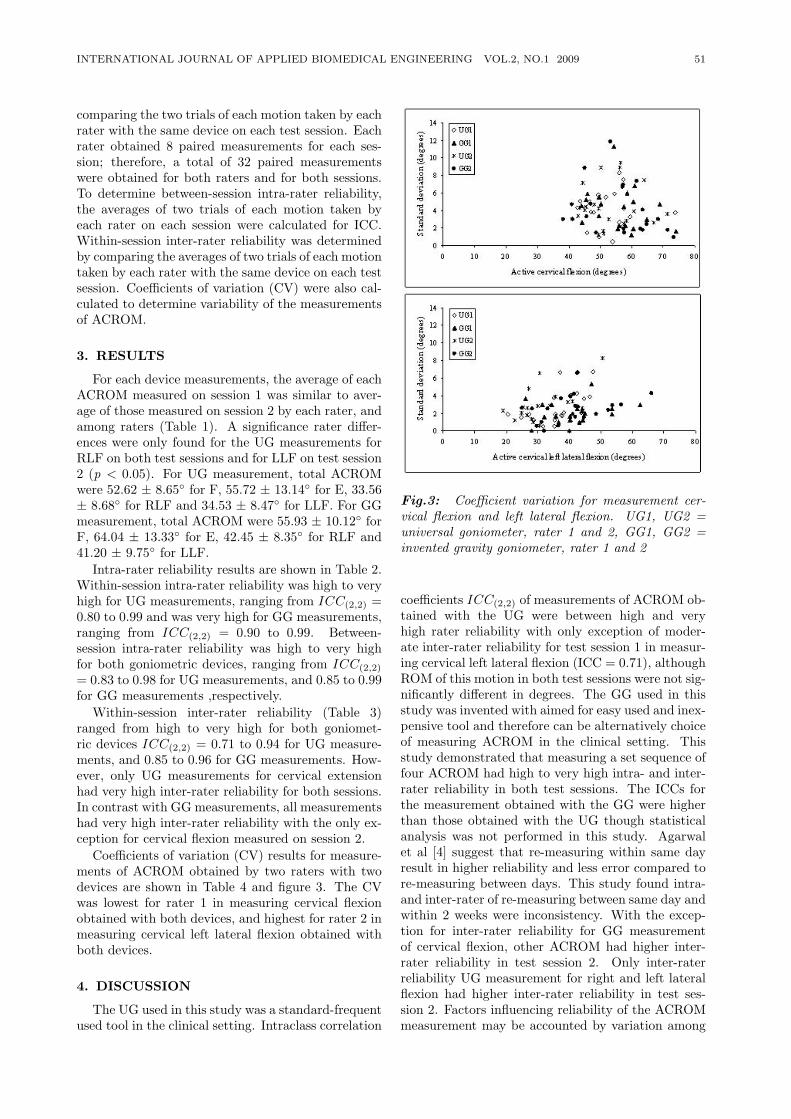
INTERNATIONAL JOURNAL OF APPLIED BIOMEDICAL ENGINEERING VOL.2, NO.1 2009 51
comparing the two trials of each motion taken by eachrater with the same device on each test session. Eachrater obtained 8 paired measurements for each ses-sion; therefore, a total of 32 paired measurementswere obtained for both raters and for both sessions.To determine between-session intra-rater reliability,the averages of two trials of each motion taken byeach rater on each session were calculated for ICC.Within-session inter-rater reliability was determinedby comparing the averages of two trials of each motiontaken by each rater with the same device on each testsession. Coefficients of variation (CV) were also cal-culated to determine variability of the measurementsof ACROM.
3. RESULTS
For each device measurements, the average of eachACROM measured on session 1 was similar to aver-age of those measured on session 2 by each rater, andamong raters (Table 1). A significance rater differ-ences were only found for the UG measurements forRLF on both test sessions and for LLF on test session2 (p < 0.05). For UG measurement, total ACROMwere 52.62 ± 8.65 for F, 55.72 ± 13.14 for E, 33.56± 8.68 for RLF and 34.53 ± 8.47 for LLF. For GGmeasurement, total ACROM were 55.93 ± 10.12 forF, 64.04 ± 13.33 for E, 42.45 ± 8.35 for RLF and41.20 ± 9.75 for LLF.
Intra-rater reliability results are shown in Table 2.Within-session intra-rater reliability was high to veryhigh for UG measurements, ranging from ICC(2,2) =0.80 to 0.99 and was very high for GG measurements,ranging from ICC(2,2) = 0.90 to 0.99. Between-session intra-rater reliability was high to very highfor both goniometric devices, ranging from ICC(2,2)
= 0.83 to 0.98 for UG measurements, and 0.85 to 0.99for GG measurements ,respectively.
Within-session inter-rater reliability (Table 3)ranged from high to very high for both goniomet-ric devices ICC(2,2) = 0.71 to 0.94 for UG measure-ments, and 0.85 to 0.96 for GG measurements. How-ever, only UG measurements for cervical extensionhad very high inter-rater reliability for both sessions.In contrast with GG measurements, all measurementshad very high inter-rater reliability with the only ex-ception for cervical flexion measured on session 2.
Coefficients of variation (CV) results for measure-ments of ACROM obtained by two raters with twodevices are shown in Table 4 and figure 3. The CVwas lowest for rater 1 in measuring cervical flexionobtained with both devices, and highest for rater 2 inmeasuring cervical left lateral flexion obtained withboth devices.
4. DISCUSSION
The UG used in this study was a standard-frequentused tool in the clinical setting. Intraclass correlation
Fig.3: Coefficient variation for measurement cer-vical flexion and left lateral flexion. UG1, UG2 =universal goniometer, rater 1 and 2, GG1, GG2 =invented gravity goniometer, rater 1 and 2
coefficients ICC(2,2) of measurements of ACROM ob-tained with the UG were between high and veryhigh rater reliability with only exception of moder-ate inter-rater reliability for test session 1 in measur-ing cervical left lateral flexion (ICC = 0.71), althoughROM of this motion in both test sessions were not sig-nificantly different in degrees. The GG used in thisstudy was invented with aimed for easy used and inex-pensive tool and therefore can be alternatively choiceof measuring ACROM in the clinical setting. Thisstudy demonstrated that measuring a set sequence offour ACROM had high to very high intra- and inter-rater reliability in both test sessions. The ICCs forthe measurement obtained with the GG were higherthan those obtained with the UG though statisticalanalysis was not performed in this study. Agarwalet al [4] suggest that re-measuring within same dayresult in higher reliability and less error compared tore-measuring between days. This study found intra-and inter-rater of re-measuring between same day andwithin 2 weeks were inconsistency. With the excep-tion for inter-rater reliability for GG measurementof cervical flexion, other ACROM had higher inter-rater reliability in test session 2. Only inter-raterreliability UG measurement for right and left lateralflexion had higher inter-rater reliability in test ses-sion 2. Factors influencing reliability of the ACROMmeasurement may be accounted by variation among
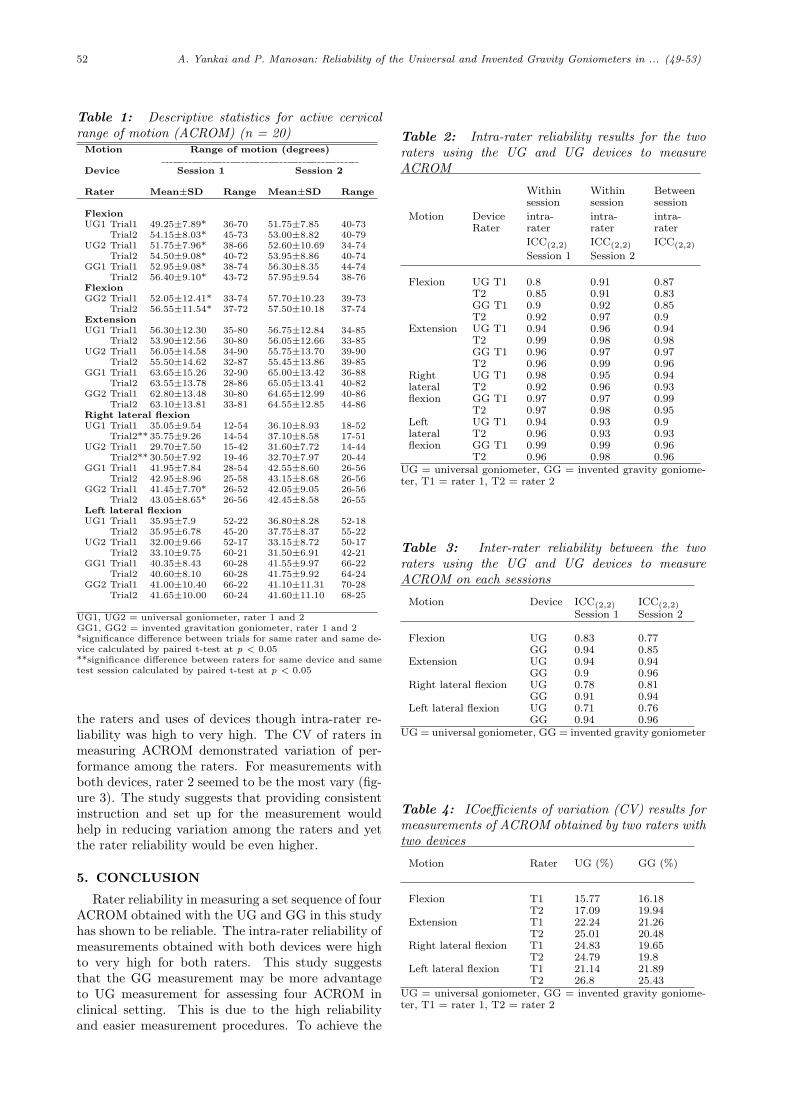
52 A. Yankai and P. Manosan: Reliability of the Universal and Invented Gravity Goniometers in ... (49-53)
Table 1: Descriptive statistics for active cervicalrange of motion (ACROM) (n = 20)
Motion Range of motion (degrees)
Device Session 1 Session 2
Rater Mean±SD Range Mean±SD Range
FlexionUG1 Trial1 49.25±7.89* 36-70 51.75±7.85 40-73
Trial2 54.15±8.03* 45-73 53.00±8.82 40-79UG2 Trial1 51.75±7.96* 38-66 52.60±10.69 34-74
Trial2 54.50±9.08* 40-72 53.95±8.86 40-74GG1 Trial1 52.95±9.08* 38-74 56.30±8.35 44-74
Trial2 56.40±9.10* 43-72 57.95±9.54 38-76FlexionGG2 Trial1 52.05±12.41* 33-74 57.70±10.23 39-73
Trial2 56.55±11.54* 37-72 57.50±10.18 37-74ExtensionUG1 Trial1 56.30±12.30 35-80 56.75±12.84 34-85
Trial2 53.90±12.56 30-80 56.05±12.66 33-85UG2 Trial1 56.05±14.58 34-90 55.75±13.70 39-90
Trial2 55.50±14.62 32-87 55.45±13.86 39-85GG1 Trial1 63.65±15.26 32-90 65.00±13.42 36-88
Trial2 63.55±13.78 28-86 65.05±13.41 40-82GG2 Trial1 62.80±13.48 30-80 64.65±12.99 40-86
Trial2 63.10±13.81 33-81 64.55±12.85 44-86Right lateral flexionUG1 Trial1 35.05±9.54 12-54 36.10±8.93 18-52
Trial2** 35.75±9.26 14-54 37.10±8.58 17-51UG2 Trial1 29.70±7.50 15-42 31.60±7.72 14-44
Trial2** 30.50±7.92 19-46 32.70±7.97 20-44GG1 Trial1 41.95±7.84 28-54 42.55±8.60 26-56
Trial2 42.95±8.96 25-58 43.15±8.68 26-56GG2 Trial1 41.45±7.70* 26-52 42.05±9.05 26-56
Trial2 43.05±8.65* 26-56 42.45±8.58 26-55Left lateral flexionUG1 Trial1 35.95±7.9 52-22 36.80±8.28 52-18
Trial2 35.95±6.78 45-20 37.75±8.37 55-22UG2 Trial1 32.00±9.66 52-17 33.15±8.72 50-17
Trial2 33.10±9.75 60-21 31.50±6.91 42-21GG1 Trial1 40.35±8.43 60-28 41.55±9.97 66-22
Trial2 40.60±8.10 60-28 41.75±9.92 64-24GG2 Trial1 41.00±10.40 66-22 41.10±11.31 70-28
Trial2 41.65±10.00 60-24 41.60±11.10 68-25
UG1, UG2 = universal goniometer, rater 1 and 2GG1, GG2 = invented gravitation goniometer, rater 1 and 2*significance difference between trials for same rater and same de-vice calculated by paired t-test at p < 0.05**significance difference between raters for same device and sametest session calculated by paired t-test at p < 0.05
the raters and uses of devices though intra-rater re-liability was high to very high. The CV of raters inmeasuring ACROM demonstrated variation of per-formance among the raters. For measurements withboth devices, rater 2 seemed to be the most vary (fig-ure 3). The study suggests that providing consistentinstruction and set up for the measurement wouldhelp in reducing variation among the raters and yetthe rater reliability would be even higher.
5. CONCLUSION
Rater reliability in measuring a set sequence of fourACROM obtained with the UG and GG in this studyhas shown to be reliable. The intra-rater reliability ofmeasurements obtained with both devices were highto very high for both raters. This study suggeststhat the GG measurement may be more advantageto UG measurement for assessing four ACROM inclinical setting. This is due to the high reliabilityand easier measurement procedures. To achieve the
Table 2: Intra-rater reliability results for the tworaters using the UG and UG devices to measureACROM
Withinsession
Withinsession
Betweensession
Motion DeviceRater
intra-rater
intra-rater
intra-rater
ICC(2,2) ICC(2,2) ICC(2,2)
Session 1 Session 2
Flexion UG T1 0.8 0.91 0.87T2 0.85 0.91 0.83GG T1 0.9 0.92 0.85T2 0.92 0.97 0.9
Extension UG T1 0.94 0.96 0.94T2 0.99 0.98 0.98GG T1 0.96 0.97 0.97T2 0.96 0.99 0.96
Right UG T1 0.98 0.95 0.94lateral T2 0.92 0.96 0.93flexion GG T1 0.97 0.97 0.99
T2 0.97 0.98 0.95Left UG T1 0.94 0.93 0.9lateral T2 0.96 0.93 0.93flexion GG T1 0.99 0.99 0.96
T2 0.96 0.98 0.96UG = universal goniometer, GG = invented gravity goniome-ter, T1 = rater 1, T2 = rater 2
Table 3: Inter-rater reliability between the tworaters using the UG and UG devices to measureACROM on each sessions
Motion Device ICC(2,2) ICC(2,2)
Session 1 Session 2
Flexion UG 0.83 0.77GG 0.94 0.85
Extension UG 0.94 0.94GG 0.9 0.96
Right lateral flexion UG 0.78 0.81GG 0.91 0.94
Left lateral flexion UG 0.71 0.76GG 0.94 0.96
UG = universal goniometer, GG = invented gravity goniometer
Table 4: ICoefficients of variation (CV) results formeasurements of ACROM obtained by two raters withtwo devices
Motion Rater UG (%) GG (%)
Flexion T1 15.77 16.18T2 17.09 19.94
Extension T1 22.24 21.26T2 25.01 20.48
Right lateral flexion T1 24.83 19.65T2 24.79 19.8
Left lateral flexion T1 21.14 21.89T2 26.8 25.43
UG = universal goniometer, GG = invented gravity goniome-ter, T1 = rater 1, T2 = rater 2
INTERNATIONAL JOURNAL OF APPLIED BIOMEDICAL ENGINEERING VOL.2, NO.1 2009 53
best rater reliability of using the GG in measuringthe ACROM, the instruction and location of placingthe measurement scale on the subject’s head mustbe consistent and proceed with care. Therefore, nextstudy would be focused on the registration of manualinstruction and yet study in the larger population isalso necessary.
References
[1] T.M. Cole, Measurement of musculoskeletal func-tion: goniometry. In: F.J. Kottke, G.K. Still-well, J.F. Lehmann, eds. Krusen’s Handbook ofPhysical Medicine and Rehabilitation. 3rd ed. WBSaunders Co, Philadelphia, 1982.
[2] J.W. Youdas, J.R. Carey, and T.R. Garrett, “Re-liability of measurements of cervical spine rangeof motion - comparison of three methods,” Phys-ical Therapy, vol. 71, no. 2, pp. 98-106, February.1991.
[3] S. R. Piva, R. E. Erhard, J. D. Childs, D. A.Browder. “Inter-tester reliability of passive inter-vertebral and active movements of the cervicalspine,” Manual Therapy, vol. 11, no. 4, pp. 321-30, November 2006.
[4] S. Agarwal, G.T. Allison, K.P. Singer, “Reliabil-ity of the Spin-T cervical goniometer in measur-ing cervical range of motion in an asymptomaticIndian population,” Journal of Manipulative andPhysiological Therapeutics, vol. 28, no. 7, pp. 487-92, September 2005.
[5] M. J. Haynes, S. Edmondston, “Accuracy andreliability of a new, protractor-based neck go-niometer,” Journal of Manipulative and PhysicalTherapeutics, vol. 25, no. 9, pp. 579-586, Novem-ber/December 2002.
Araya Yankai University of SouthAustralia , Commonwealth of Australia,is a lecturer in Department of PhysicalTherapy, Faculty of Associated MedicalSciences, Chiangmai University, Thai-land. She has been experienced in teach-ing physical therapy students both ingraduate and graduate diploma levels,as well as postgraduate students in M.Sin Movement and Exercise Sciences pro-gram. Her 14 years of experience spe-
cializing in neurological rehabilitation has include a range ofteaching, clinical, research, and administrative practice.
P. Manosan photograrp and biographynot available at time of publication.
54 W. Wiriyasuttiwong and W. Narkbuakaew: Medical Knowledge-Based System for ... (54-59)
Medical Knowledge-Based System forDiagnosis from Symptoms and Signs
Watcharachai Wiriyasuttiwong* and Walita Narkbuakaew, Members
ABSTRACT
This research proposes design and development ofa medical knowledge-based system (MKBS) for di-agnosis from symptoms and signs. This system wasdeveloped to support a knowledge construction andan inference engine. The knowledge construction wasbased on a concept of production rules, which wasperformed in tree structure. The inference engineused interactive forward chaining technique to infer adiagnostic result. The proposed system was designedto interact with user by using question forms of symp-toms, and it was able to support text and picture in-formation. The architecture of this system consistedof inference engine, knowledge base, user interfaceunit, knowledge acquisition unit, explanation mod-ule and blackboard. This medical knowledge-basedsystem was developed by Borland c++ language onWindows XP system. Finally this system was appliedto check accuracy by comparing with general physi-cian’s diagnoses. The experimental result showed thediagnosis of the system more than 97% accurately atthe 0.01 level of significance, when it is compared withdiagnosis of a physician.
1. INTRODUCTION
The medical information technology for emulationof human reasoning process and human expert prob-lem solving is knowledge-based system. In literaturesurvey, MYCIN [1] is an expert system for diagnoseor remedy bacterial infections, PUFF [2] is developedto diagnose lung disease, ANGY helps physicians todiagnose the narrowing of coronary vessels by identi-fying and isolating coronary vessels in angiograms,BABY aids clinicians by monitoring patients in anewborn intensive care unit (NICU), MECS-AI helpsphysicians to make diagnoses and to suggest treat-ments for cardiovascular and thyroid diseases, PIPassists physicians by taking the history of the presentillness of a patient with edema, WHEEZE diagnoses
Manuscript received on April 27, 2009 ; revised on July 20,2009.
*Corresponding author.W. Wiriyasuttiwong is with Knowledge Engineering Re-
search Centre, Department of Electrical Engineering, Fac-ulty of Engineering, Srinakharinwirot University, Ongkharak,Nakhonnayok 26120, Thailand.
W. Narkbuakaew is with Image Technology Laboratory ,NECTEC. Science Park Thailand, Klong Luang, Patumthani12120, Thailand.
E-mail addresses: [email protected] (W. Wiriyasuttiwong)and [email protected] (W. Narkbuakaew)
the presence and severity of lung disease by inter-preting measurements of pulmonary function tests,NEOMYCIN helps physicians diagnose and treat pa-tients with meningitis and similar diseases, MED1helps physicians diagnose diseases associated withchest pain. GUIDON for instruct in bacterial infec-tions, and HEME helps physicians diagnose hemato-logic diseases.
From these researches, we found that they bene-fit to public health. However the medical and publichealth in Thailand is based on the assumption thatfundamental of public health is the heart of publichealth development. The important goal is popula-tion which can take care themselves, and they canlearn and understand self-care, disease protection,and healing. However, there are not enough staffsof health for giving advice to population so this is animportant problem for country development. Fromstudy we found almost diagnosis that is performed inhistory taking to chief complaint and symptoms. Sothis research presents design and development of themedical knowledge-based system. It is an alterna-tive way to support public health of country, and thissystem help to create the medical knowledge-basedsystem
2. DESIGN OF THE KNOWLEDGE-BASEDSYSTEM
A process which is applied to design and developa knowledge-based system in this research is calledknowledge engineering as shown in figure 1. Knowl-edge engineer is a person who searches knowledgesource, designs and selects development tools, devel-ops, tests and adjusts the system before using in prac-tical. The process of design system can describe infollowing:-
2.1 Knowledge Acquisition
Knowledge acquisition is a process of acquiring,organizing and studying knowledge. In this research,the knowledge is acquired from a physician and med-ical books for testing system. This knowledge canbe divided by important fact into 20 facts, which areshown on table 1.
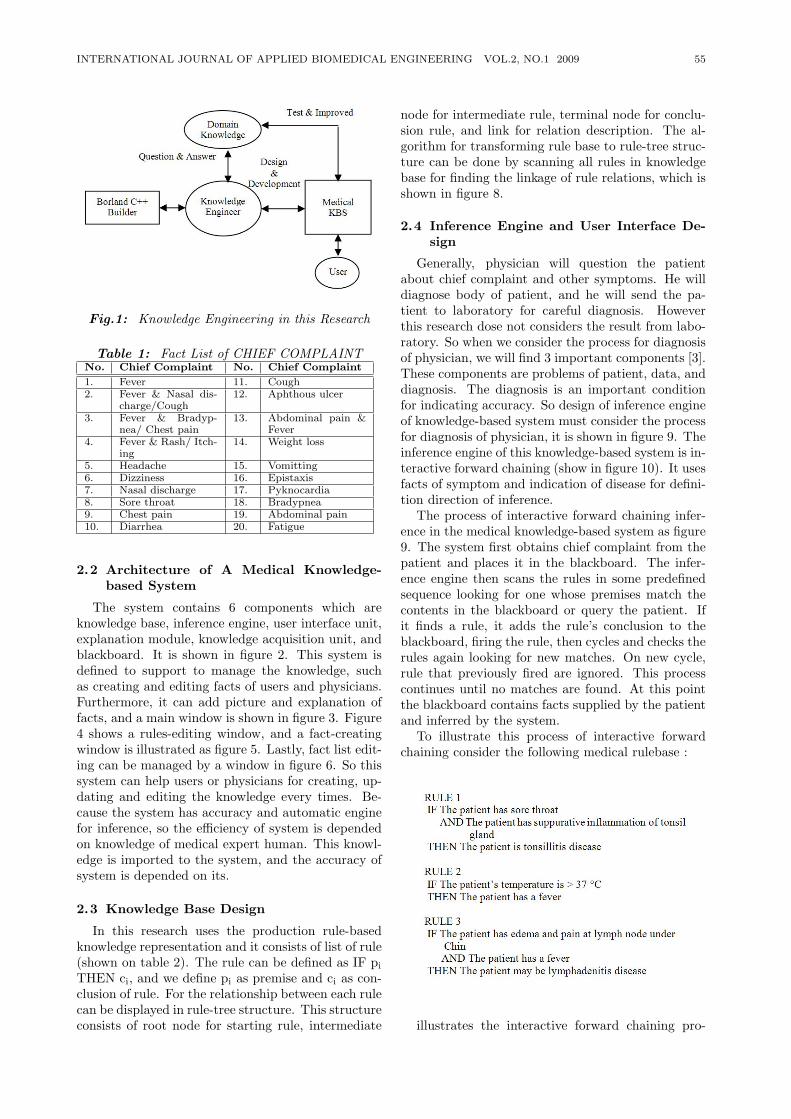
INTERNATIONAL JOURNAL OF APPLIED BIOMEDICAL ENGINEERING VOL.2, NO.1 2009 55
Fig.1: Knowledge Engineering in this Research
Table 1: Fact List of CHIEF COMPLAINTNo. Chief Complaint No. Chief Complaint
1. Fever 11. Cough2. Fever & Nasal dis-
charge/Cough12. Aphthous ulcer
3. Fever & Bradyp-nea/ Chest pain
13. Abdominal pain &Fever
4. Fever & Rash/ Itch-ing
14. Weight loss
5. Headache 15. Vomitting6. Dizziness 16. Epistaxis7. Nasal discharge 17. Pyknocardia8. Sore throat 18. Bradypnea9. Chest pain 19. Abdominal pain10. Diarrhea 20. Fatigue
2.2 Architecture of A Medical Knowledge-based System
The system contains 6 components which areknowledge base, inference engine, user interface unit,explanation module, knowledge acquisition unit, andblackboard. It is shown in figure 2. This system isdefined to support to manage the knowledge, suchas creating and editing facts of users and physicians.Furthermore, it can add picture and explanation offacts, and a main window is shown in figure 3. Figure4 shows a rules-editing window, and a fact-creatingwindow is illustrated as figure 5. Lastly, fact list edit-ing can be managed by a window in figure 6. So thissystem can help users or physicians for creating, up-dating and editing the knowledge every times. Be-cause the system has accuracy and automatic enginefor inference, so the efficiency of system is dependedon knowledge of medical expert human. This knowl-edge is imported to the system, and the accuracy ofsystem is depended on its.
2.3 Knowledge Base Design
In this research uses the production rule-basedknowledge representation and it consists of list of rule(shown on table 2). The rule can be defined as IF pi
THEN ci, and we define pi as premise and ci as con-clusion of rule. For the relationship between each rulecan be displayed in rule-tree structure. This structureconsists of root node for starting rule, intermediate
node for intermediate rule, terminal node for conclu-sion rule, and link for relation description. The al-gorithm for transforming rule base to rule-tree struc-ture can be done by scanning all rules in knowledgebase for finding the linkage of rule relations, which isshown in figure 8.
2.4 Inference Engine and User Interface De-sign
Generally, physician will question the patientabout chief complaint and other symptoms. He willdiagnose body of patient, and he will send the pa-tient to laboratory for careful diagnosis. Howeverthis research dose not considers the result from labo-ratory. So when we consider the process for diagnosisof physician, we will find 3 important components [3].These components are problems of patient, data, anddiagnosis. The diagnosis is an important conditionfor indicating accuracy. So design of inference engineof knowledge-based system must consider the processfor diagnosis of physician, it is shown in figure 9. Theinference engine of this knowledge-based system is in-teractive forward chaining (show in figure 10). It usesfacts of symptom and indication of disease for defini-tion direction of inference.
The process of interactive forward chaining infer-ence in the medical knowledge-based system as figure9. The system first obtains chief complaint from thepatient and places it in the blackboard. The infer-ence engine then scans the rules in some predefinedsequence looking for one whose premises match thecontents in the blackboard or query the patient. Ifit finds a rule, it adds the rule’s conclusion to theblackboard, firing the rule, then cycles and checks therules again looking for new matches. On new cycle,rule that previously fired are ignored. This processcontinues until no matches are found. At this pointthe blackboard contains facts supplied by the patientand inferred by the system.
To illustrate this process of interactive forwardchaining consider the following medical rulebase :
illustrates the interactive forward chaining pro-
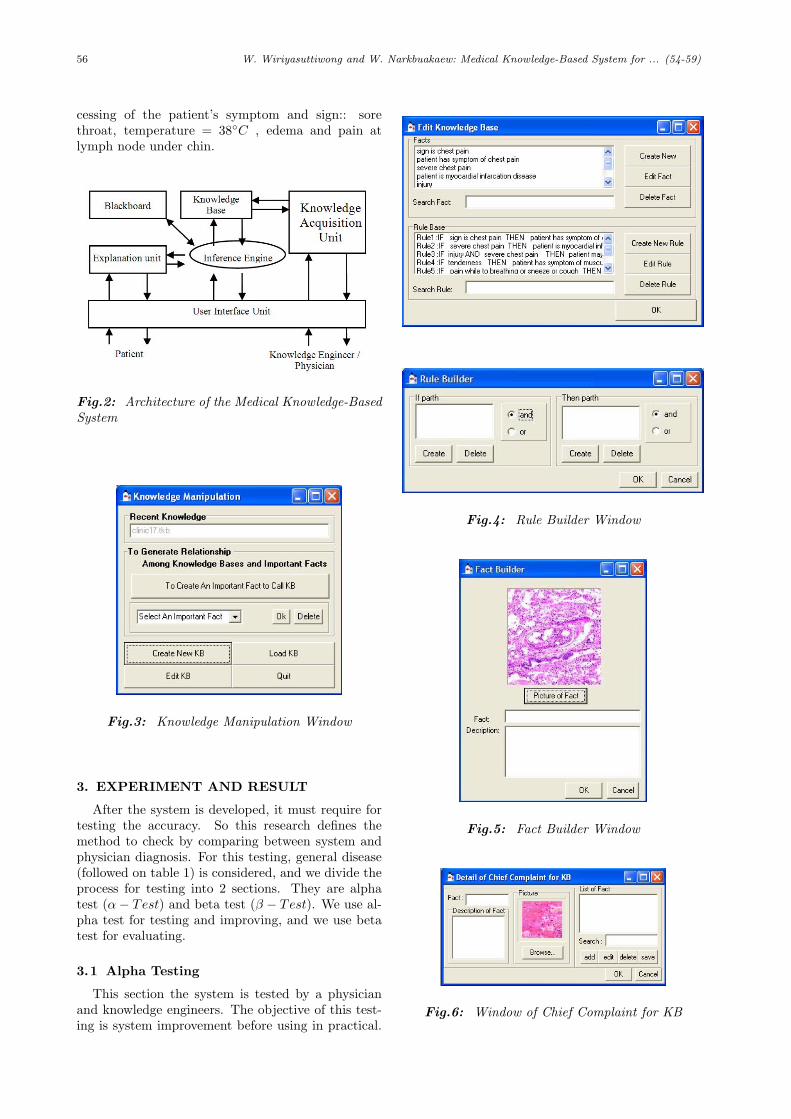
56 W. Wiriyasuttiwong and W. Narkbuakaew: Medical Knowledge-Based System for ... (54-59)
cessing of the patient’s symptom and sign:: sorethroat, temperature = 38C , edema and pain atlymph node under chin.
Fig.2: Architecture of the Medical Knowledge-BasedSystem
Fig.3: Knowledge Manipulation Window
3. EXPERIMENT AND RESULT
After the system is developed, it must require fortesting the accuracy. So this research defines themethod to check by comparing between system andphysician diagnosis. For this testing, general disease(followed on table 1) is considered, and we divide theprocess for testing into 2 sections. They are alphatest (α− Test) and beta test (β − Test). We use al-pha test for testing and improving, and we use betatest for evaluating.
3.1 Alpha Testing
This section the system is tested by a physicianand knowledge engineers. The objective of this test-ing is system improvement before using in practical.
Fig.4: Rule Builder Window
Fig.5: Fact Builder Window
Fig.6: Window of Chief Complaint for KB
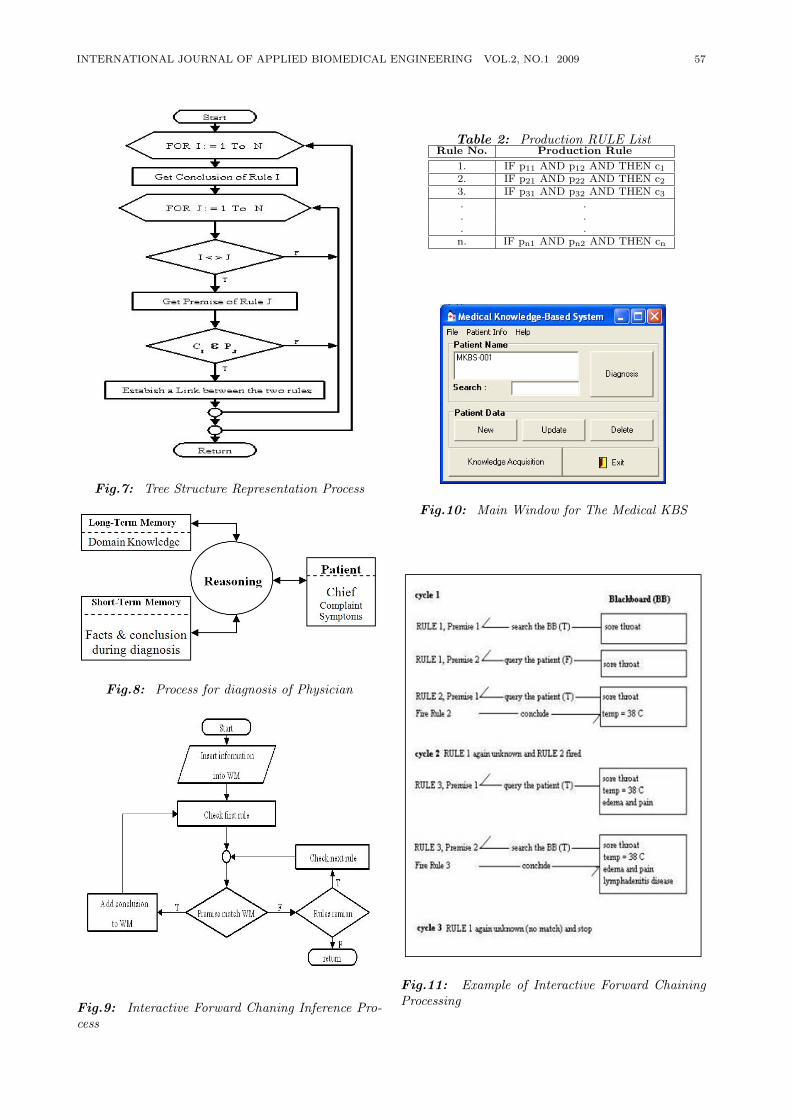
INTERNATIONAL JOURNAL OF APPLIED BIOMEDICAL ENGINEERING VOL.2, NO.1 2009 57
Fig.7: Tree Structure Representation Process
Fig.8: Process for diagnosis of Physician
Fig.9: Interactive Forward Chaning Inference Pro-cess
Table 2: Production RULE ListRule No. Production Rule
1. IF p11 AND p12 AND THEN c12. IF p21 AND p22 AND THEN c23. IF p31 AND p32 AND THEN c3. .. .. .n. IF pn1 AND pn2 AND THEN cn
Fig.10: Main Window for The Medical KBS
Fig.11: Example of Interactive Forward ChainingProcessing
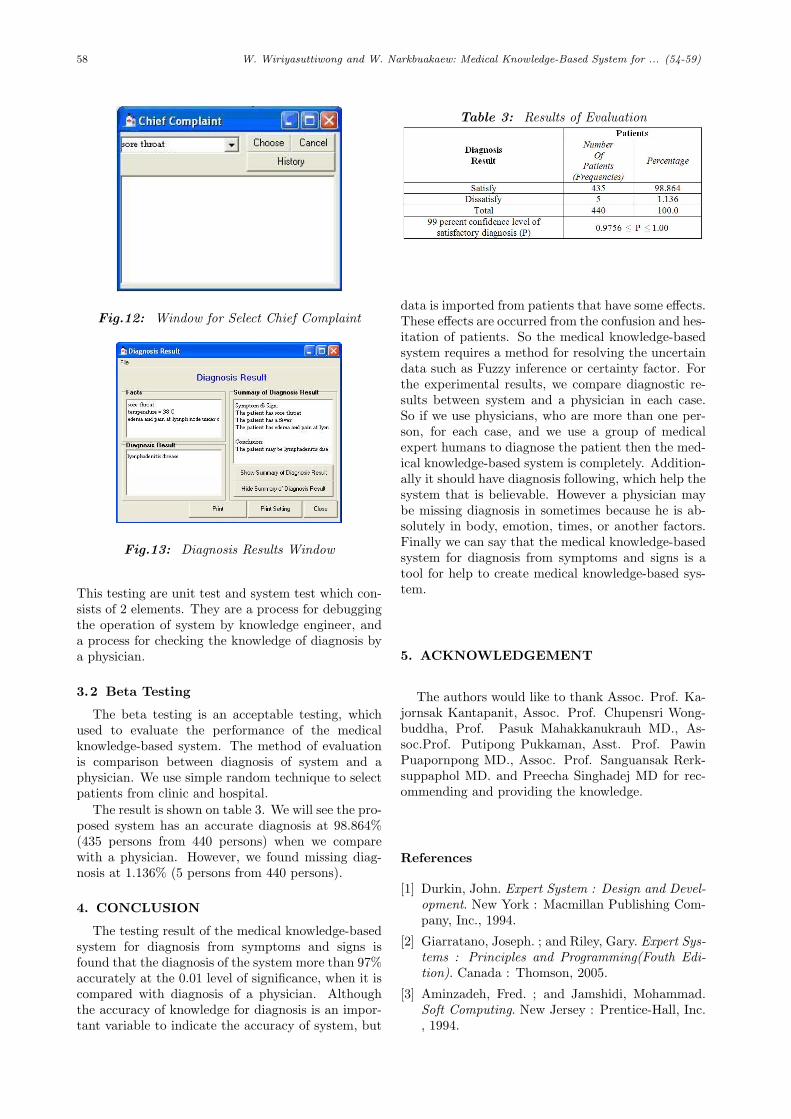
58 W. Wiriyasuttiwong and W. Narkbuakaew: Medical Knowledge-Based System for ... (54-59)
Fig.12: Window for Select Chief Complaint
Fig.13: Diagnosis Results Window
This testing are unit test and system test which con-sists of 2 elements. They are a process for debuggingthe operation of system by knowledge engineer, anda process for checking the knowledge of diagnosis bya physician.
3.2 Beta Testing
The beta testing is an acceptable testing, whichused to evaluate the performance of the medicalknowledge-based system. The method of evaluationis comparison between diagnosis of system and aphysician. We use simple random technique to selectpatients from clinic and hospital.
The result is shown on table 3. We will see the pro-posed system has an accurate diagnosis at 98.864%(435 persons from 440 persons) when we comparewith a physician. However, we found missing diag-nosis at 1.136% (5 persons from 440 persons).
4. CONCLUSION
The testing result of the medical knowledge-basedsystem for diagnosis from symptoms and signs isfound that the diagnosis of the system more than 97%accurately at the 0.01 level of significance, when it iscompared with diagnosis of a physician. Althoughthe accuracy of knowledge for diagnosis is an impor-tant variable to indicate the accuracy of system, but
Table 3: Results of Evaluation
data is imported from patients that have some effects.These effects are occurred from the confusion and hes-itation of patients. So the medical knowledge-basedsystem requires a method for resolving the uncertaindata such as Fuzzy inference or certainty factor. Forthe experimental results, we compare diagnostic re-sults between system and a physician in each case.So if we use physicians, who are more than one per-son, for each case, and we use a group of medicalexpert humans to diagnose the patient then the med-ical knowledge-based system is completely. Addition-ally it should have diagnosis following, which help thesystem that is believable. However a physician maybe missing diagnosis in sometimes because he is ab-solutely in body, emotion, times, or another factors.Finally we can say that the medical knowledge-basedsystem for diagnosis from symptoms and signs is atool for help to create medical knowledge-based sys-tem.
5. ACKNOWLEDGEMENT
The authors would like to thank Assoc. Prof. Ka-jornsak Kantapanit, Assoc. Prof. Chupensri Wong-buddha, Prof. Pasuk Mahakkanukrauh MD., As-soc.Prof. Putipong Pukkaman, Asst. Prof. PawinPuapornpong MD., Assoc. Prof. Sanguansak Rerk-suppaphol MD. and Preecha Singhadej MD for rec-ommending and providing the knowledge.
References
[1] Durkin, John. Expert System : Design and Devel-opment. New York : Macmillan Publishing Com-pany, Inc., 1994.
[2] Giarratano, Joseph. ; and Riley, Gary. Expert Sys-tems : Principles and Programming(Fouth Edi-tion). Canada : Thomson, 2005.
[3] Aminzadeh, Fred. ; and Jamshidi, Mohammad.Soft Computing. New Jersey : Prentice-Hall, Inc., 1994.
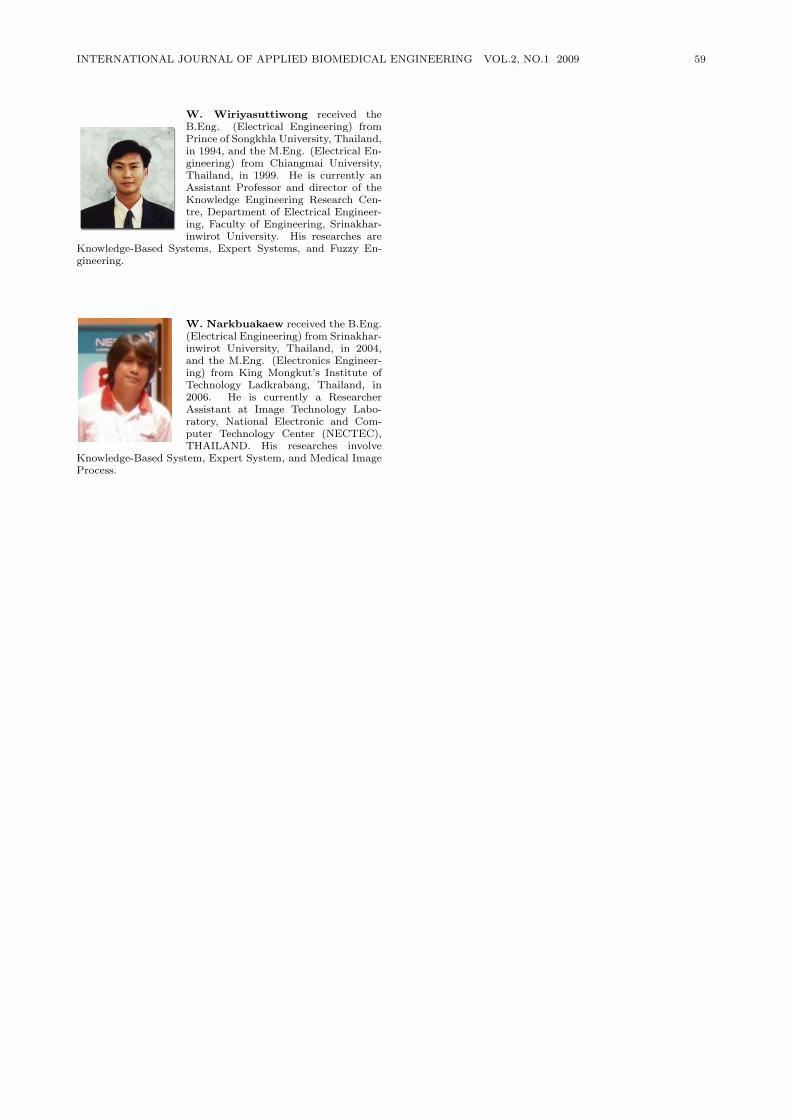
INTERNATIONAL JOURNAL OF APPLIED BIOMEDICAL ENGINEERING VOL.2, NO.1 2009 59
W. Wiriyasuttiwong received theB.Eng. (Electrical Engineering) fromPrince of Songkhla University, Thailand,in 1994, and the M.Eng. (Electrical En-gineering) from Chiangmai University,Thailand, in 1999. He is currently anAssistant Professor and director of theKnowledge Engineering Research Cen-tre, Department of Electrical Engineer-ing, Faculty of Engineering, Srinakhar-inwirot University. His researches are
Knowledge-Based Systems, Expert Systems, and Fuzzy En-gineering.
W. Narkbuakaew received the B.Eng.(Electrical Engineering) from Srinakhar-inwirot University, Thailand, in 2004,and the M.Eng. (Electronics Engineer-ing) from King Mongkut’s Institute ofTechnology Ladkrabang, Thailand, in2006. He is currently a ResearcherAssistant at Image Technology Labo-ratory, National Electronic and Com-puter Technology Center (NECTEC),THAILAND. His researches involve
Knowledge-Based System, Expert System, and Medical ImageProcess.
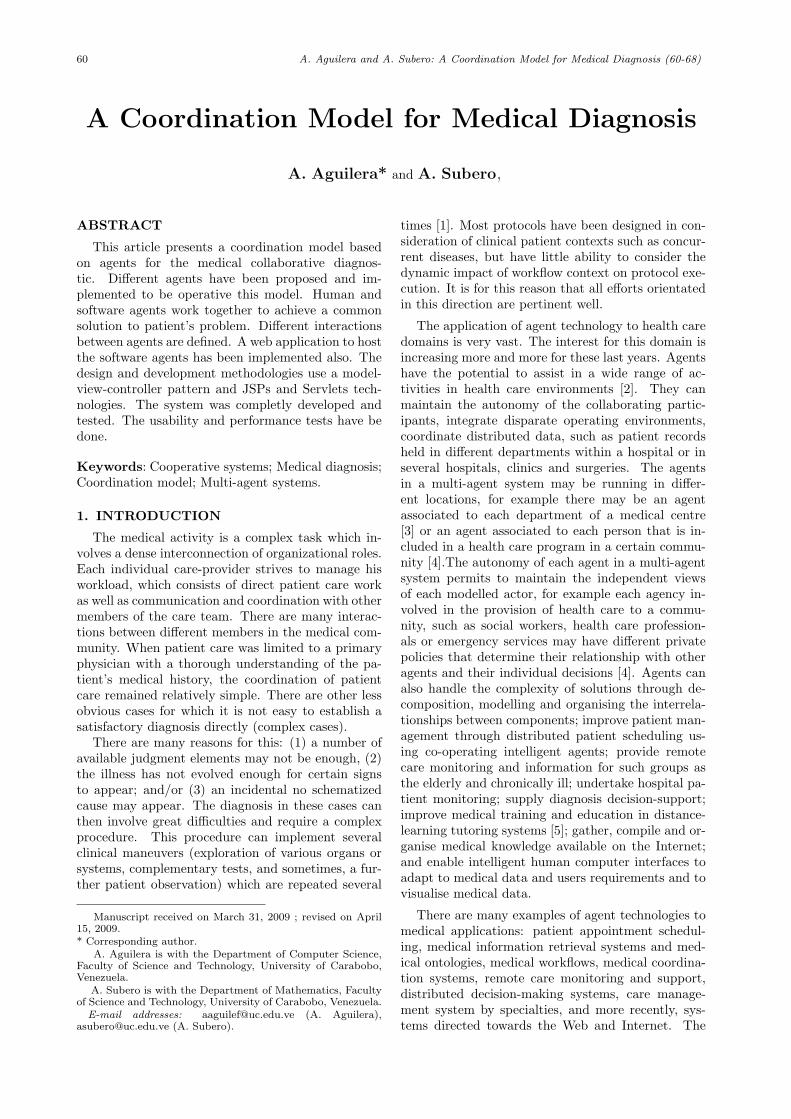
60 A. Aguilera and A. Subero: A Coordination Model for Medical Diagnosis (60-68)
A Coordination Model for Medical Diagnosis
A. Aguilera* and A. Subero,
ABSTRACT
This article presents a coordination model basedon agents for the medical collaborative diagnos-tic. Different agents have been proposed and im-plemented to be operative this model. Human andsoftware agents work together to achieve a commonsolution to patient’s problem. Different interactionsbetween agents are defined. A web application to hostthe software agents has been implemented also. Thedesign and development methodologies use a model-view-controller pattern and JSPs and Servlets tech-nologies. The system was completly developed andtested. The usability and performance tests have bedone.
Keywords: Cooperative systems; Medical diagnosis;Coordination model; Multi-agent systems.
1. INTRODUCTION
The medical activity is a complex task which in-volves a dense interconnection of organizational roles.Each individual care-provider strives to manage hisworkload, which consists of direct patient care workas well as communication and coordination with othermembers of the care team. There are many interac-tions between different members in the medical com-munity. When patient care was limited to a primaryphysician with a thorough understanding of the pa-tient’s medical history, the coordination of patientcare remained relatively simple. There are other lessobvious cases for which it is not easy to establish asatisfactory diagnosis directly (complex cases).
There are many reasons for this: (1) a number ofavailable judgment elements may not be enough, (2)the illness has not evolved enough for certain signsto appear; and/or (3) an incidental no schematizedcause may appear. The diagnosis in these cases canthen involve great difficulties and require a complexprocedure. This procedure can implement severalclinical maneuvers (exploration of various organs orsystems, complementary tests, and sometimes, a fur-ther patient observation) which are repeated several
Manuscript received on March 31, 2009 ; revised on April15, 2009.* Corresponding author.
A. Aguilera is with the Department of Computer Science,Faculty of Science and Technology, University of Carabobo,Venezuela.
A. Subero is with the Department of Mathematics, Facultyof Science and Technology, University of Carabobo, Venezuela.
E-mail addresses: [email protected] (A. Aguilera),[email protected] (A. Subero).
times [1]. Most protocols have been designed in con-sideration of clinical patient contexts such as concur-rent diseases, but have little ability to consider thedynamic impact of workflow context on protocol exe-cution. It is for this reason that all efforts orientatedin this direction are pertinent well.
The application of agent technology to health caredomains is very vast. The interest for this domain isincreasing more and more for these last years. Agentshave the potential to assist in a wide range of ac-tivities in health care environments [2]. They canmaintain the autonomy of the collaborating partic-ipants, integrate disparate operating environments,coordinate distributed data, such as patient recordsheld in different departments within a hospital or inseveral hospitals, clinics and surgeries. The agentsin a multi-agent system may be running in differ-ent locations, for example there may be an agentassociated to each department of a medical centre[3] or an agent associated to each person that is in-cluded in a health care program in a certain commu-nity [4].The autonomy of each agent in a multi-agentsystem permits to maintain the independent viewsof each modelled actor, for example each agency in-volved in the provision of health care to a commu-nity, such as social workers, health care profession-als or emergency services may have different privatepolicies that determine their relationship with otheragents and their individual decisions [4]. Agents canalso handle the complexity of solutions through de-composition, modelling and organising the interrela-tionships between components; improve patient man-agement through distributed patient scheduling us-ing co-operating intelligent agents; provide remotecare monitoring and information for such groups asthe elderly and chronically ill; undertake hospital pa-tient monitoring; supply diagnosis decision-support;improve medical training and education in distance-learning tutoring systems [5]; gather, compile and or-ganise medical knowledge available on the Internet;and enable intelligent human computer interfaces toadapt to medical data and users requirements and tovisualise medical data.
There are many examples of agent technologies tomedical applications: patient appointment schedul-ing, medical information retrieval systems and med-ical ontologies, medical workflows, medical coordina-tion systems, remote care monitoring and support,distributed decision-making systems, care manage-ment system by specialties, and more recently, sys-tems directed towards the Web and Internet. The
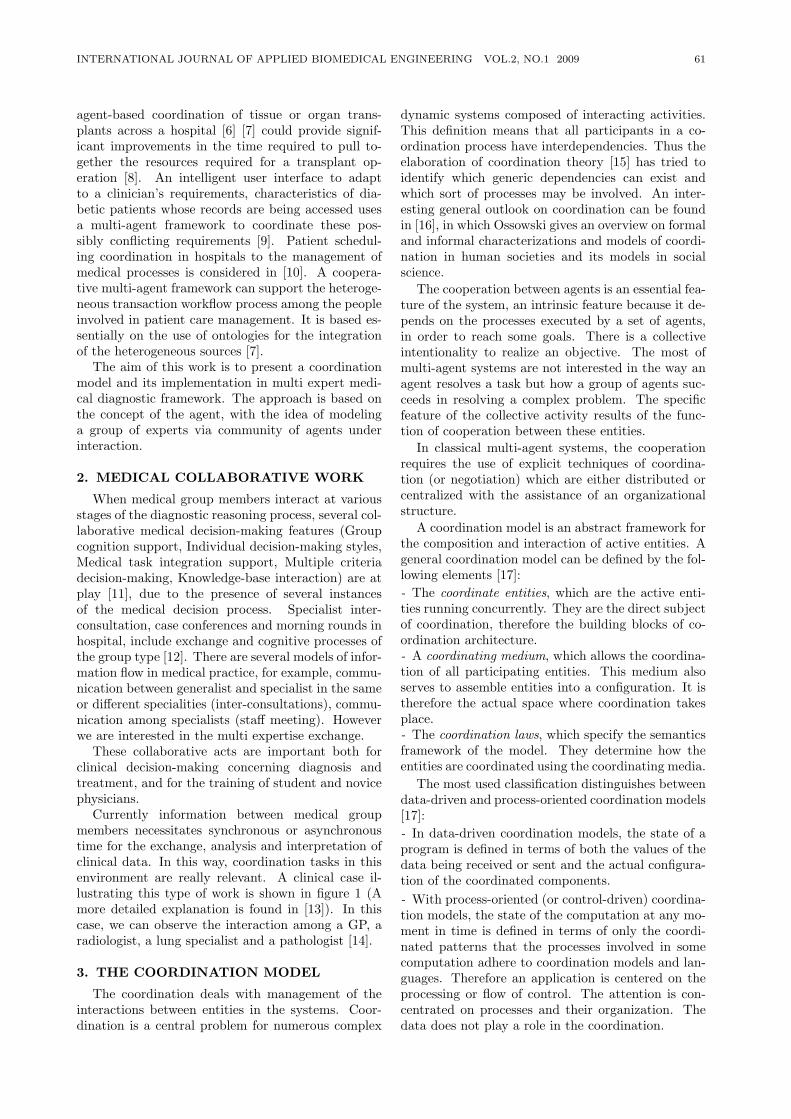
INTERNATIONAL JOURNAL OF APPLIED BIOMEDICAL ENGINEERING VOL.2, NO.1 2009 61
agent-based coordination of tissue or organ trans-plants across a hospital [6] [7] could provide signif-icant improvements in the time required to pull to-gether the resources required for a transplant op-eration [8]. An intelligent user interface to adaptto a clinician’s requirements, characteristics of dia-betic patients whose records are being accessed usesa multi-agent framework to coordinate these pos-sibly conflicting requirements [9]. Patient schedul-ing coordination in hospitals to the management ofmedical processes is considered in [10]. A coopera-tive multi-agent framework can support the heteroge-neous transaction workflow process among the peopleinvolved in patient care management. It is based es-sentially on the use of ontologies for the integrationof the heterogeneous sources [7].
The aim of this work is to present a coordinationmodel and its implementation in multi expert medi-cal diagnostic framework. The approach is based onthe concept of the agent, with the idea of modelinga group of experts via community of agents underinteraction.
2. MEDICAL COLLABORATIVE WORK
When medical group members interact at variousstages of the diagnostic reasoning process, several col-laborative medical decision-making features (Groupcognition support, Individual decision-making styles,Medical task integration support, Multiple criteriadecision-making, Knowledge-base interaction) are atplay [11], due to the presence of several instancesof the medical decision process. Specialist inter-consultation, case conferences and morning rounds inhospital, include exchange and cognitive processes ofthe group type [12]. There are several models of infor-mation flow in medical practice, for example, commu-nication between generalist and specialist in the sameor different specialities (inter-consultations), commu-nication among specialists (staff meeting). Howeverwe are interested in the multi expertise exchange.
These collaborative acts are important both forclinical decision-making concerning diagnosis andtreatment, and for the training of student and novicephysicians.
Currently information between medical groupmembers necessitates synchronous or asynchronoustime for the exchange, analysis and interpretation ofclinical data. In this way, coordination tasks in thisenvironment are really relevant. A clinical case il-lustrating this type of work is shown in figure 1 (Amore detailed explanation is found in [13]). In thiscase, we can observe the interaction among a GP, aradiologist, a lung specialist and a pathologist [14].
3. THE COORDINATION MODEL
The coordination deals with management of theinteractions between entities in the systems. Coor-dination is a central problem for numerous complex
dynamic systems composed of interacting activities.This definition means that all participants in a co-ordination process have interdependencies. Thus theelaboration of coordination theory [15] has tried toidentify which generic dependencies can exist andwhich sort of processes may be involved. An inter-esting general outlook on coordination can be foundin [16], in which Ossowski gives an overview on formaland informal characterizations and models of coordi-nation in human societies and its models in socialscience.
The cooperation between agents is an essential fea-ture of the system, an intrinsic feature because it de-pends on the processes executed by a set of agents,in order to reach some goals. There is a collectiveintentionality to realize an objective. The most ofmulti-agent systems are not interested in the way anagent resolves a task but how a group of agents suc-ceeds in resolving a complex problem. The specificfeature of the collective activity results of the func-tion of cooperation between these entities.
In classical multi-agent systems, the cooperationrequires the use of explicit techniques of coordina-tion (or negotiation) which are either distributed orcentralized with the assistance of an organizationalstructure.
A coordination model is an abstract framework forthe composition and interaction of active entities. Ageneral coordination model can be defined by the fol-lowing elements [17]:- The coordinate entities, which are the active enti-ties running concurrently. They are the direct subjectof coordination, therefore the building blocks of co-ordination architecture.- A coordinating medium, which allows the coordina-tion of all participating entities. This medium alsoserves to assemble entities into a configuration. It istherefore the actual space where coordination takesplace.- The coordination laws, which specify the semanticsframework of the model. They determine how theentities are coordinated using the coordinating media.
The most used classification distinguishes betweendata-driven and process-oriented coordination models[17]:- In data-driven coordination models, the state of aprogram is defined in terms of both the values of thedata being received or sent and the actual configura-tion of the coordinated components.- With process-oriented (or control-driven) coordina-tion models, the state of the computation at any mo-ment in time is defined in terms of only the coordi-nated patterns that the processes involved in somecomputation adhere to coordination models and lan-guages. Therefore an application is centered on theprocessing or flow of control. The attention is con-centrated on processes and their organization. Thedata does not play a role in the coordination.
62 A. Aguilera and A. Subero: A Coordination Model for Medical Diagnosis (60-68)
Fig.1: A clinical case
- Hybrid models. These integrate shared data spacefunctionalities in a process- oriented view.
Following the component definition above men-tioned, we define our agent coordination model figure2.
The general structure that we used for the repre-sentation of the model is a version simplified of Com-monKADS [18] and it follows the philosophy devel-oped in [19]. Finally, we it is defined grammar for themodel figure 3. The components of this model are:• The coordinate entities. These entities are all theentities that take part in the medical resolution prob-lem. They are constituted by the human agents(physicians) and the computer tools used, representedby the software agents.• A coordinating medium. Our model is conceivedas a hybrid coordination system, i.e. data-drivenand process-oriented aspects are been considered [14].This coordination is guided by agents with specificfunctions and tasks to be achieved; and the basicmechanism of communication is the medical history.• The coordination laws. It is a set of rules for whichthe agents are directed. There are a social environ-ment and the medical protocols to be respected. Theevents presented deal with different states to the pa-tient’s evolution and these are reflected in the medicalhistory.
Fig.2: Coordination agent model
Fig.3: Grammar of formalization language to thecoordination model
4. IMPLEMENTATION OF THE COORDI-NATION
The operation of our coordination model includesthe definition of all coordinators and coordinates en-tities, means to execute cooperation and the coordi-nation laws that are governed by clinical protocols.The latter includes a detailed study of all restrictionsconsidered in the medical work. These restrictionsinclude: economic, cultural, ethnic, religious, moral,legal, geographical restrictions. The first two will bedetailed in the following sections. The last, due toits extension, will be not treated in this article (forreference about this topic see [20] [21]).
INTERNATIONAL JOURNAL OF APPLIED BIOMEDICAL ENGINEERING VOL.2, NO.1 2009 63
4.1 Agent description
The development architecture follows a three-levelstructure (figure 4): the collaborator level or users(human agents), computer systems agents (softwareagents) and the data level (databases and knowledgebases). This architecture permits us to clarify the se-mantic definition of the problem under study. Theagents enable us to identify and define all human andartificial individuals interacting and taking part in co-operative problem solving. Human agents representphysicians of different specialties and patients. Themedical decision (diagnostic) can be reached only byextensive consultation with domain experts by humanagents. Artificial (software) agents have been pro-posed to the coordination and communication tasksof medical work. Databases and knowledge bases rep-resent the medical histories of patient and the fac-tual knowledge in medicine (relationships betweenpathologies and signs and symptoms, pathologies andtreatment, etc.).- The medical meeting agent: This is considered asa high level hierarchical agent. It is a set of agentsdefined to identify the group of physicians. The com-munication protocol between agents follows humancommunication procedures based on personal conver-sations; that is, somebody intervenes and the othersremain silent and attentive. Once the person has fin-ished, another one intervenes, and so on. The leader-ship position can be assumed by the medical doctorwho sits down face-to-face to the patient (Physicianin charge of the case).- Medical speciality agents. They define a classi-fication based on the different medical specialities,i.e., human agents such as radiologists, neurologists,pathologists and others. Agent knowledge is hetero-geneous. The agents divide the tasks among them-selves and share data about the patient. Each oneof these specialists can observe only one part of the“outside” (i.e., the patient).- The patient: A human agent who as an active rolein his/her treatment. He/she requests medical ap-pointments, takes part in his/her cure, and asks forinformation. He/she permits the clinical context tobe established.- The coordinator agent: This is considered as a highlevel hierarchical agent. It is a set of agents definedto identify the group of software agents.- The planning agent: An artificial agent that man-ages everything related to time in the system: it as-signs the tasks within a time context, checks the timeof their activation, execution and ending. It returnsthe requests of task assignments if it has not receiveda timely response. It centralizes information abouttask executions and their different states of develop-ment.- The distributor agent: An artificial agent that findsout those agents that will execute the tasks, accord-ing to their specialities and availability for executing
them. To do so, it takes into account the urgencyof tasks required. It centralizes information aboutgroup members.- The manager agent: An artificial agent that con-trols the requests for tasks. It sends and receivesresults.- Interface agent: An artificial agent that controlsthe security accesses to systems and data. It pro-vides access to the expert systems agents. It ade-quately adapts the appropriate interface according toeach user with his/her different levels. It centralizesgeneral access information.- The data agent: An artificial agent that managesdata in the databases and knowledge bases. It man-ages metadata, user view definitions, and authoriza-tions to data access. It also controls anything relatedto data integrity and recovery mechanisms.
4.2 Agents interactions
There are many types of agent interactions (figure4), these ones depend on the evolution of medical casetreated. We can mention :
Human Agents- Human Agents: Interactions es-tablished between physicians and patients.
Human Agents - Software Agents: The physiciansmake their functions and their tasks through systeminterfaces and software agents.
Human Agents - Applications: Physicians use ap-plication oriented by specialty to make their works.Patients use applications to querying, and others.
Software Agents - Software Agents: Softwareagents communication themselves to make coopera-tive tasks.
Software Agents - Applications: Software agentscommunicate with computer programs and interfaces.
Software Agents - Data: Software agents use datato make their functions.
4.3 Operation coordination practices
Normally, the medical diagnosis work imposes theexecution circuits that are not fixed a priori and de-pend on the medical case tried. In the medical case(figure 1), only 4 physicians interact. The clinicalprotocol followed leads to a generalist to require theintervention of a lung specialist, a radiologist andpathologist. But this situation can change in othercases. Thus, the coordination means are based on:a) communications between different actors (accord-ing to different interventions described in the preced-ing section) and b) the medical history, in which lieall the actions taken by and on patients.
5. DESIGN AND IMPLEMENTATION OFSYSTEM
We defined two stages for the development of ourproject: in a first stage, implementation of a medical
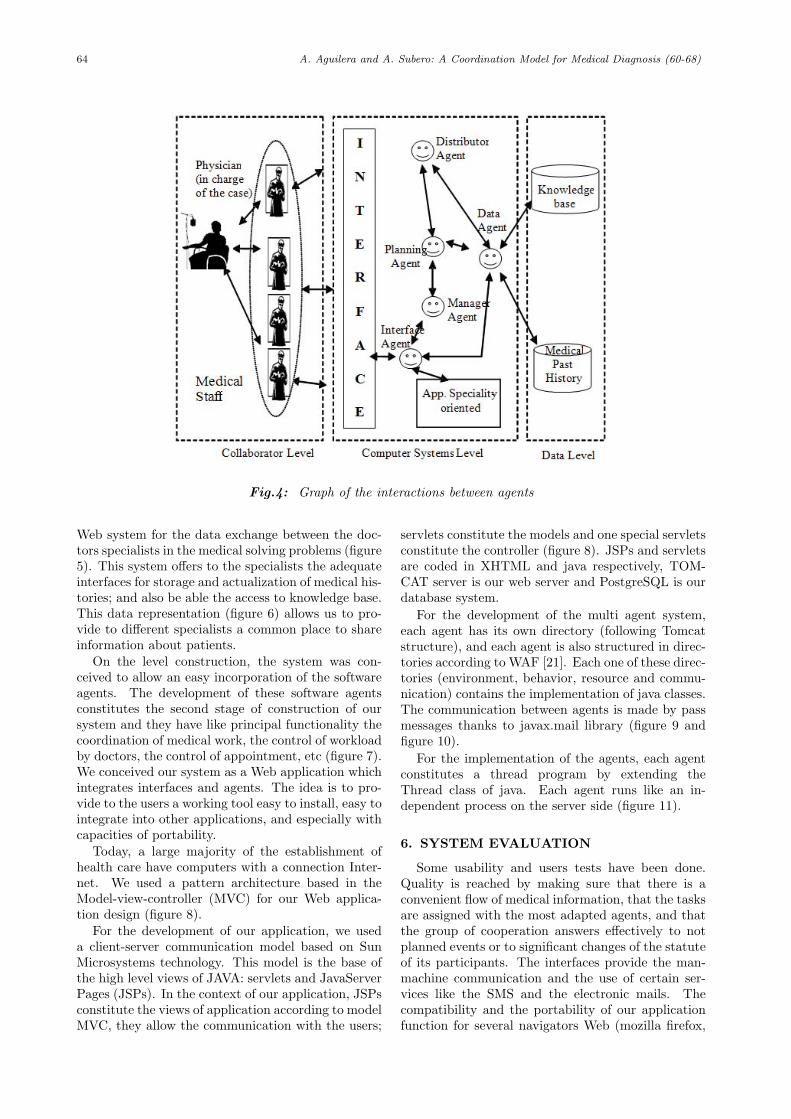
64 A. Aguilera and A. Subero: A Coordination Model for Medical Diagnosis (60-68)
Fig.4: Graph of the interactions between agents
Web system for the data exchange between the doc-tors specialists in the medical solving problems (figure5). This system offers to the specialists the adequateinterfaces for storage and actualization of medical his-tories; and also be able the access to knowledge base.This data representation (figure 6) allows us to pro-vide to different specialists a common place to shareinformation about patients.
On the level construction, the system was con-ceived to allow an easy incorporation of the softwareagents. The development of these software agentsconstitutes the second stage of construction of oursystem and they have like principal functionality thecoordination of medical work, the control of workloadby doctors, the control of appointment, etc (figure 7).We conceived our system as a Web application whichintegrates interfaces and agents. The idea is to pro-vide to the users a working tool easy to install, easy tointegrate into other applications, and especially withcapacities of portability.
Today, a large majority of the establishment ofhealth care have computers with a connection Inter-net. We used a pattern architecture based in theModel-view-controller (MVC) for our Web applica-tion design (figure 8).
For the development of our application, we useda client-server communication model based on SunMicrosystems technology. This model is the base ofthe high level views of JAVA: servlets and JavaServerPages (JSPs). In the context of our application, JSPsconstitute the views of application according to modelMVC, they allow the communication with the users;
servlets constitute the models and one special servletsconstitute the controller (figure 8). JSPs and servletsare coded in XHTML and java respectively, TOM-CAT server is our web server and PostgreSQL is ourdatabase system.
For the development of the multi agent system,each agent has its own directory (following Tomcatstructure), and each agent is also structured in direc-tories according to WAF [21]. Each one of these direc-tories (environment, behavior, resource and commu-nication) contains the implementation of java classes.The communication between agents is made by passmessages thanks to javax.mail library (figure 9 andfigure 10).
For the implementation of the agents, each agentconstitutes a thread program by extending theThread class of java. Each agent runs like an in-dependent process on the server side (figure 11).
6. SYSTEM EVALUATION
Some usability and users tests have been done.Quality is reached by making sure that there is aconvenient flow of medical information, that the tasksare assigned with the most adapted agents, and thatthe group of cooperation answers effectively to notplanned events or to significant changes of the statuteof its participants. The interfaces provide the man-machine communication and the use of certain ser-vices like the SMS and the electronic mails. Thecompatibility and the portability of our applicationfunction for several navigators Web (mozilla firefox,
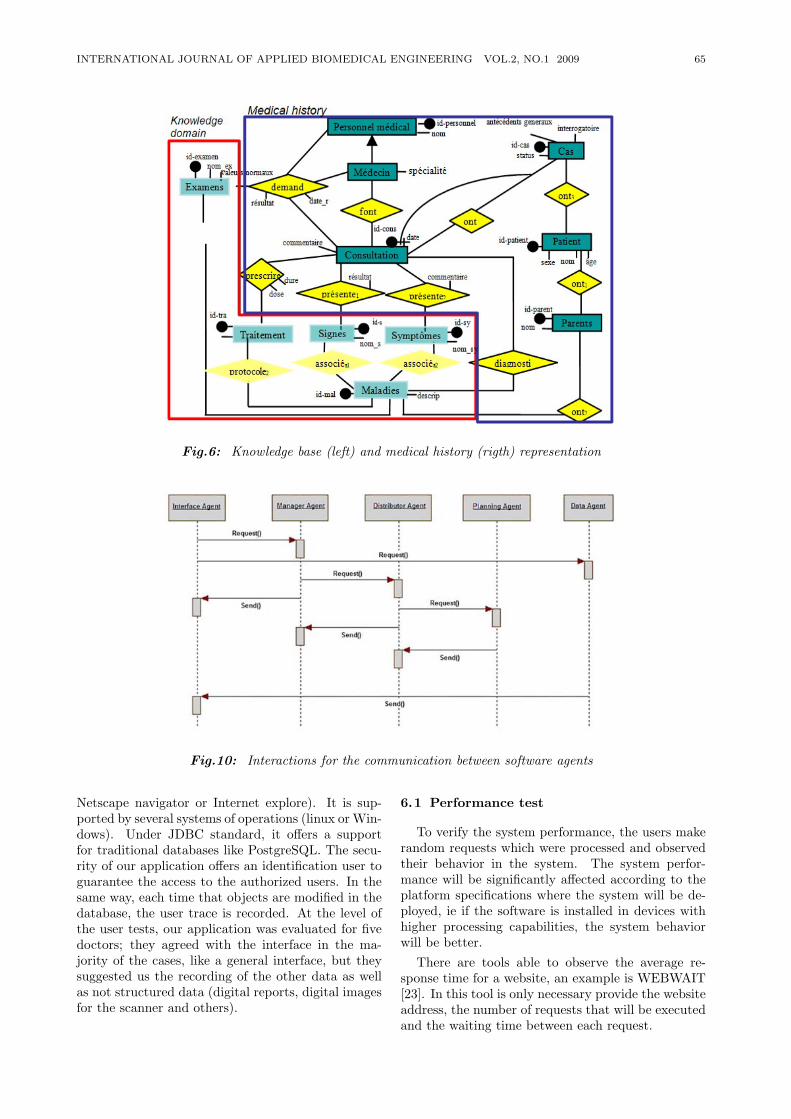
INTERNATIONAL JOURNAL OF APPLIED BIOMEDICAL ENGINEERING VOL.2, NO.1 2009 65
Fig.6: Knowledge base (left) and medical history (rigth) representation
Fig.10: Interactions for the communication between software agents
Netscape navigator or Internet explore). It is sup-ported by several systems of operations (linux or Win-dows). Under JDBC standard, it offers a supportfor traditional databases like PostgreSQL. The secu-rity of our application offers an identification user toguarantee the access to the authorized users. In thesame way, each time that objects are modified in thedatabase, the user trace is recorded. At the level ofthe user tests, our application was evaluated for fivedoctors; they agreed with the interface in the ma-jority of the cases, like a general interface, but theysuggested us the recording of the other data as wellas not structured data (digital reports, digital imagesfor the scanner and others).
6.1 Performance test
To verify the system performance, the users makerandom requests which were processed and observedtheir behavior in the system. The system perfor-mance will be significantly affected according to theplatform specifications where the system will be de-ployed, ie if the software is installed in devices withhigher processing capabilities, the system behaviorwill be better.
There are tools able to observe the average re-sponse time for a website, an example is WEBWAIT[23]. In this tool is only necessary provide the websiteaddress, the number of requests that will be executedand the waiting time between each request.
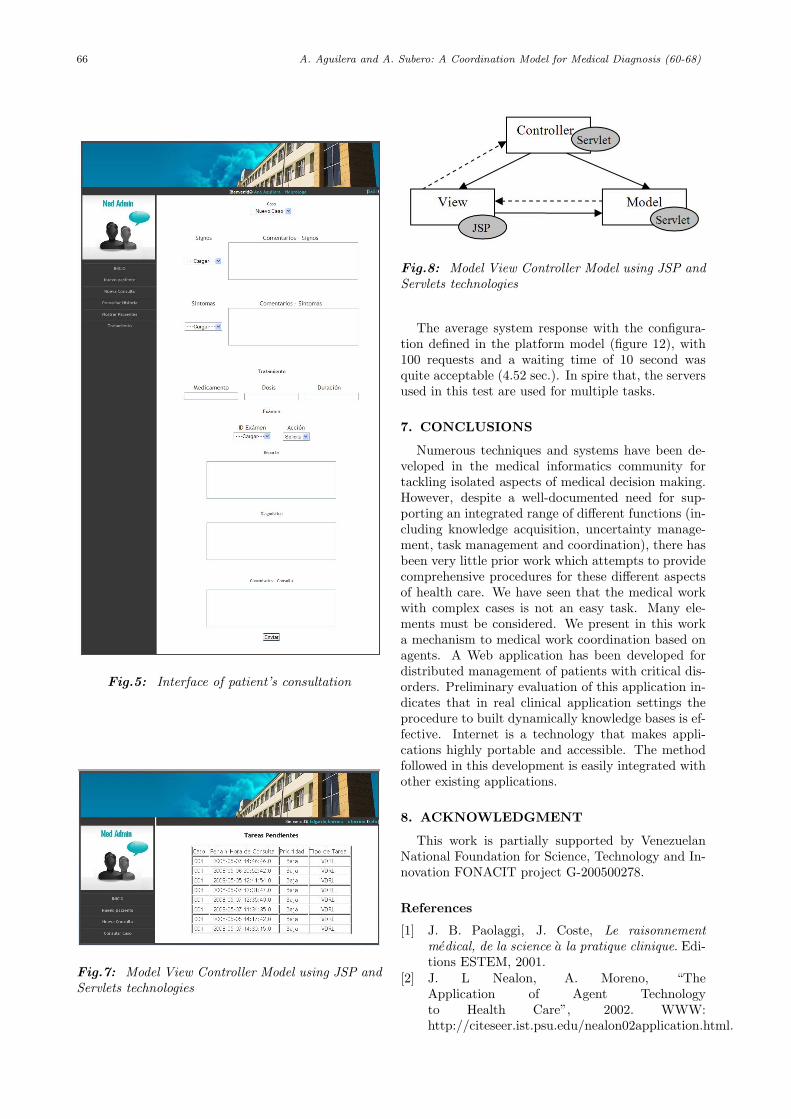
66 A. Aguilera and A. Subero: A Coordination Model for Medical Diagnosis (60-68)
Fig.5: Interface of patient’s consultation
Fig.7: Model View Controller Model using JSP andServlets technologies
Fig.8: Model View Controller Model using JSP andServlets technologies
The average system response with the configura-tion defined in the platform model (figure 12), with100 requests and a waiting time of 10 second wasquite acceptable (4.52 sec.). In spire that, the serversused in this test are used for multiple tasks.
7. CONCLUSIONS
Numerous techniques and systems have been de-veloped in the medical informatics community fortackling isolated aspects of medical decision making.However, despite a well-documented need for sup-porting an integrated range of different functions (in-cluding knowledge acquisition, uncertainty manage-ment, task management and coordination), there hasbeen very little prior work which attempts to providecomprehensive procedures for these different aspectsof health care. We have seen that the medical workwith complex cases is not an easy task. Many ele-ments must be considered. We present in this worka mechanism to medical work coordination based onagents. A Web application has been developed fordistributed management of patients with critical dis-orders. Preliminary evaluation of this application in-dicates that in real clinical application settings theprocedure to built dynamically knowledge bases is ef-fective. Internet is a technology that makes appli-cations highly portable and accessible. The methodfollowed in this development is easily integrated withother existing applications.
8. ACKNOWLEDGMENT
This work is partially supported by VenezuelanNational Foundation for Science, Technology and In-novation FONACIT project G-200500278.
References
[1] J. B. Paolaggi, J. Coste, Le raisonnementmedical, de la science a la pratique clinique. Edi-tions ESTEM, 2001.
[2] J. L Nealon, A. Moreno, “TheApplication of Agent Technologyto Health Care”, 2002. WWW:http://citeseer.ist.psu.edu/nealon02application.html.
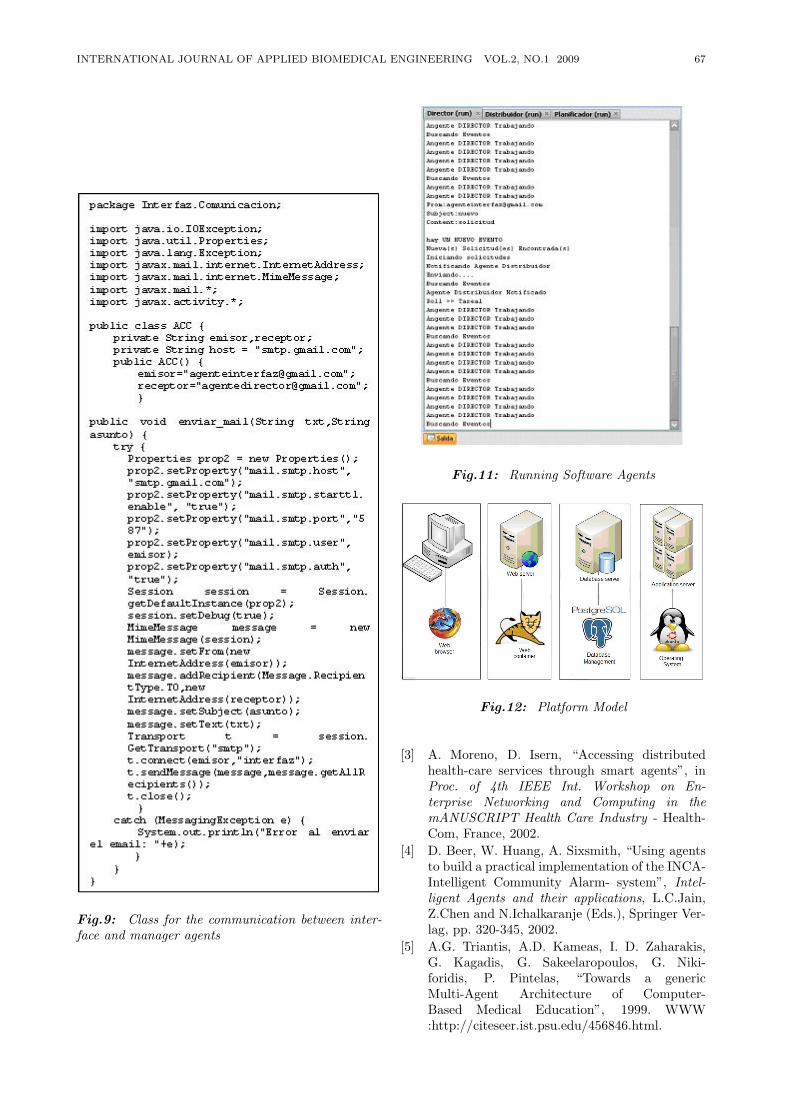
INTERNATIONAL JOURNAL OF APPLIED BIOMEDICAL ENGINEERING VOL.2, NO.1 2009 67
Fig.9: Class for the communication between inter-face and manager agents
Fig.11: Running Software Agents
Fig.12: Platform Model
[3] A. Moreno, D. Isern, “Accessing distributedhealth-care services through smart agents”, inProc. of 4th IEEE Int. Workshop on En-terprise Networking and Computing in themANUSCRIPT Health Care Industry - Health-Com, France, 2002.
[4] D. Beer, W. Huang, A. Sixsmith, “Using agentsto build a practical implementation of the INCA-Intelligent Community Alarm- system”, Intel-ligent Agents and their applications, L.C.Jain,Z.Chen and N.Ichalkaranje (Eds.), Springer Ver-lag, pp. 320-345, 2002.
[5] A.G. Triantis, A.D. Kameas, I. D. Zaharakis,G. Kagadis, G. Sakeelaropoulos, G. Niki-foridis, P. Pintelas, “Towards a genericMulti-Agent Architecture of Computer-Based Medical Education”, 1999. WWW:http://citeseer.ist.psu.edu/456846.html.
68 A. Aguilera and A. Subero: A Coordination Model for Medical Diagnosis (60-68)
[6] A. Moreno, A. Valls, J. Bocio “Managementof Hospital Teams for Organ Transplants UsingMulti-Agent Systems”, Artificial Intelligence inMedicine, eds. Quaglini, S., Barahona, P. andAndreassen, S. Lecture Notes in Computer Sci-ence, Springer Verlag, pp. 413- 416, 2001.
[7] J. Vazquez-Salceda, U. Cortes, “Using Agent-Mediated Institutions for the distribution ofHuman Tissues among Hospitals”, AdvancedCourse on Artificial Intelligence - ACAI-01,Praga, 2001, pp. 205-209.
[8] A. Aldea, B. Lopez, A. Moreno, D. Riano,A. Valls, “A Multi-Agent Systems for Or-gan Transplant Coordination”, Artificial Intelli-gence in Medicine, Eds: S.Quaglini, P.Barahona,S.Andreassen. Lecture Notes in Computer Sci-ence, Springer Verlag, pp. 413-416, 2001.
[9] P. Marshall, S. Greenwood, “The Use of Emer-gent Behaviour in a Multi-Agent System to DriveSelf- Adaptation at the Interface”, Joint Web In-telligence / Intelligent Agent Technology - 2001WI/IAT, Japan, 2001.
[10] C. Heine, R. Herrler, M. Petsch, C. Anhalt,“ADAPT - Adaptive Multi Agent Process Plan-ning & Coordination of Clinical Trials”, in Proc.of AmCIS2003, Tampa, Florida, USA, 2003.
[11] G. R. Rao, M. Turoff, “A hypermedia-basedgroup decision support system to support collab-orative medical decision-making”, Decision Sup-port Systems, 30: 187-216, 2000.
[12] J. Quintero, A. Aguilera, et al., Medical decision-making and collaborative reasoning. In Pro-ceedings of the IEEE 2nd International Sym-posium on Bioinformatics and BioengineeringConference, 2001. Volume, Issue, 4-6 Nov 2001Page(s):161 - 165.
[13] J. Quintero, Collaborative decision in medicine.Analysis of a case diagnosis, In Proceedings of theSciences of Electronic, Technology of Informa-tion and Telecommunications, SETIT, Sousse,Tunisia, 2003, paper R228137.
[14] A. Aguilera, Construction Dynamique d’uneBase de Connaissance dans le Cadre du Diagnos-tic Medical Multi-Experts, PhD thesis in Medi-cal Information, University of Rennes I, France,2008.
[15] T. W. Malone and K. Crowston, “The Interdisci-plinary Study of Coordination”, ACM Comput-ing Surveys, Vol. 26, no.1, pp. 87 -119, March1994.
[16] S. Ossowski, “Coordination in Artificial AgentSocieties. Social Structure and Its Implicationsfor Autonomous Problem-Solving Agents”, no.1202 in LNAI. Springer Verlag, 1999.
[17] M. Schumacher, “Objective Coordination inMulti-Agent Systems Engineering. Design andImplementation”, Vol. 2039, Lecture Notes inArtificial Intelligence, Springer Verlag, Heidel-
berg, Germany, April 2001.[18] G. SchreiberAkkermans, H., Anjewierden, A.,
Hoog, R., Shadbolt, N., Van de Velde, W.,Wielinga, B. Knowledge Engineering and Man-agement. The CommonKADS Methodology. TheMIT Press, 2000.
[19] S. Ladibi, Ingenierie de la Connaissance dans lecadre de Projets Multi-Experts : Methode, Tech-niques et Outil, These Doctorale 1995. Universitede Nice - Sophia Antipolis, 1995.
[20] L. Alpay, Modelling Medical Diagnosis Pro-cesses, PhD thesis in Cognitive Science, TheOpen University, Milton Keynes, 1990.
[21] J. Quintero, Raisonnement collaboratif dans lediagnostic medical en radiologie, PhD thesis inMedical Information, University of Rennes I,France, 2008.
[22] R. Cattafi, C. Metzner,: “A Software Agent Ar-chitecture Pattern”, in Proc. of the 2004 In-ternational Business Information managementConference, 2004.
[23] Numondo Ltd. and Michael Mahemoff, “AWebsite Timer”, Copyright (c) 2007, WWW:http://webwait.com/
A. Aguilera was born in Lara,Venezuela, in 1970. She obtained theBSc. honors degree in Computer En-gineering, Magna Cum Laude Award,from the Faculty of Sciences, Univer-sity of Centro Occidental Lisandro Al-varado, UCLA, Lara, Venezuela in 1994and the MSc in Computer Science in1998, Simon Bolivar University, USB,Caracas, Venezuela. She obtained PhDin medical informatics at the Univer-
sity of Rennes and working in the Department of Imageand Treatment of Information at the Ecole Superieure desTelecommunications de Bretagne (Telecom Bretagne), Brest,France, in 2008. Since 1997, she has been with the Depart-ment of Computer Science, Faculty of Science and Technology,University of Carabobo, Venezuela. Actually, she is an as-sociate professor of this department. Her research interestsinclude Fuzzy Logic, where she has several publications, Com-puter Support Collaborative Work, Multiagent Systems andMedical Diagnosis. She is member of the Venezuelan Societyof Bioengineering.
A. Subero photograrp and biographynot available at time of publication.
INTERNATIONAL JOURNAL OF APPLIED BIOMEDICAL ENGINEERING VOL.2, NO.1 2009 69
Computer-Aided System for MicroscopicImages: Application to Breast Cancer Nuclei
Counting
Pornchai Phukpattaranont*, Member,Somchai Limsiroratana, and Pleumjit Boonyaphiphat,
ABSTRACTWe developed a computer-aided system for an-
alyzing microscopic images called Cell Image Ana-lyzer (CIA) and demonstrate its application to nu-clear stained breast cancer cell counting. The algo-rithm for image analysis is composed of three steps.First, the cancer cells in the microscopic image aresegmented based on neural network and mathemati-cal morphology. Next, the features of each cell con-sisting of average values of L*; a*, b* in CIELabcolor space, circularity ratio, and area are extractedby the system. Finally, in order to demonstrate thepotential application of the system, the classificationof breast cancer cell nuclei is performed using the Eu-clidean distance of selected features, i.e. the averagevalues of L*; a*, b*. Results from our computer-aided analysis system on a microscopic image frombreast cancer show that the cancer cells are appro-priately segmented. The classifications of segmentedcell type based on the Euclidean distance in CIELabcolor space agree with visual inspection very well.Quantitative evaluations of our computer-aided anal-ysis with the expert also provide similar agreement toimage visualization. In other words, sensitivity andpositive predictive value of cell segmentation are 88%and 82%, respectively. Moreover, sensitivity, positivepredictive value, specificity, and negative predictivevalue of color classification are 94%, 99%, 91%, and78%, respectively.
Keywords: Quantitative immunohistopathology,Image segmentation, Cancer cell images
1. INTRODUCTION
Microscopic images from a variety of techniquessuch as immunohistochemistry are of a great value formedical diagnosis. Immunohistochemistry is a tech-nique used for detecting in situ a tissue antigen by a
Manuscript received on March 26, 2009 ; revised on July 9,2009.
* Corresponding author.P. Phukpattaranont is with Department of Electrical Engi-
neering, Prince of Songkla University, ThailandE-mail address: pornchai.pepsu.ac.thS. Limsiroratana is with Department of Computer Engi-
neering, Prince of Songkla University, ThailandP. Boonyaphiphat is with Department of Pathology, Prince
of Songkla University, Thailand
specific antibody. An antigen-antibody reaction is vi-sualized by the color development of specific dye andcan be seen by light microscope. The tissue antigen ispresented at any part of the cell, i.e., cell membrane,cytoplasm or nucleus. Therefore, it is a useful tech-nique to demonstrate the protein markers includingcancer cell. Estrogen receptor (ER) and progesteronereceptor (PR) are prognostic markers for breast can-cer detected by this method. Evaluation of ER andPR positive cells are useful for hormonal therapy.Brown nuclear stains are recognized as positive cellsand blue ones are negative cells. Traditionally, thepercentage of positive cells of those markers is semi-quantitatively counted. It is time consuming, costly,subjective and tedious. In order to overcome theseproblems, a computer-aided system of image analy-sis that previously requires manual operations is per-formed on the basis of the developments in computercapabilities and image processing algorithms [1] [2][3].
There are a number of benefits that result from acomputer-aided analysis. These include an accelera-tion of the process, a reduction in cost for image anal-ysis, as well as a decrement in a false inspection dueto fatigue. Additionally, the automated analysis pro-vides a quantitative description. Based on this quan-titative measurement, the analysis result is objective.Furthermore, the correlation of the quantitative cat-egorization with patient symptoms may allow for anautomated diagnostic system [4]. However, it is notexpected that computer-aided image analysis will re-place pathologist’s experience. It is only an aid to thepathologist for the repeated routine work and yieldsquantitative results that complement and enhance in-terpretations by pathologists. Visual examination bythe pathologist is still required where unusual or ab-normal cells that the method is not trained to dealwith are encountered.
We have recently proposed a new strategy for seg-menting cancer cells in a microscopic image of im-munohistological nuclear staining of breast cancer tis-sue based on the color of pixel [5]. This is motivatedfrom the way that a pathologist determines the pos-itive and negative of tumor cells by using their colorcontents manually. In [6] we develop a computer-aided system, which is capable of analyzing micro-scopic images. Our goal is that pathologists can use
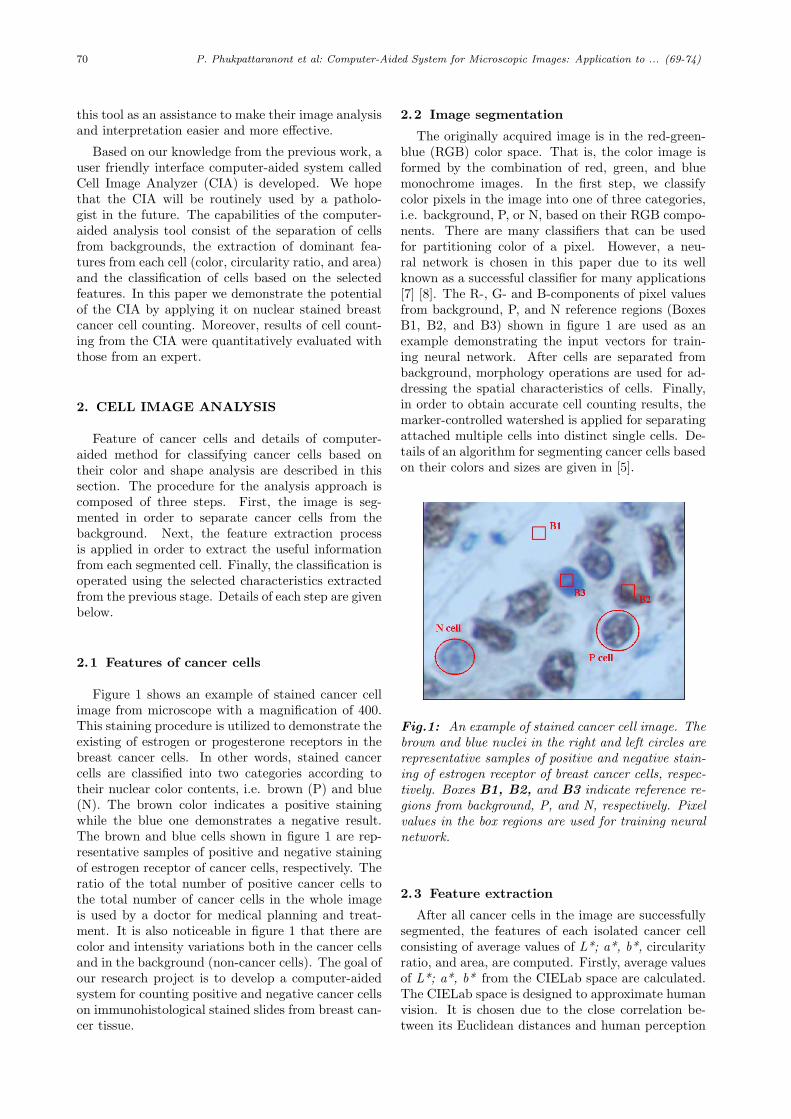
70 P. Phukpattaranont et al: Computer-Aided System for Microscopic Images: Application to ... (69-74)
this tool as an assistance to make their image analysisand interpretation easier and more effective.
Based on our knowledge from the previous work, auser friendly interface computer-aided system calledCell Image Analyzer (CIA) is developed. We hopethat the CIA will be routinely used by a patholo-gist in the future. The capabilities of the computer-aided analysis tool consist of the separation of cellsfrom backgrounds, the extraction of dominant fea-tures from each cell (color, circularity ratio, and area)and the classification of cells based on the selectedfeatures. In this paper we demonstrate the potentialof the CIA by applying it on nuclear stained breastcancer cell counting. Moreover, results of cell count-ing from the CIA were quantitatively evaluated withthose from an expert.
2. CELL IMAGE ANALYSIS
Feature of cancer cells and details of computer-aided method for classifying cancer cells based ontheir color and shape analysis are described in thissection. The procedure for the analysis approach iscomposed of three steps. First, the image is seg-mented in order to separate cancer cells from thebackground. Next, the feature extraction processis applied in order to extract the useful informationfrom each segmented cell. Finally, the classification isoperated using the selected characteristics extractedfrom the previous stage. Details of each step are givenbelow.
2.1 Features of cancer cells
Figure 1 shows an example of stained cancer cellimage from microscope with a magnification of 400.This staining procedure is utilized to demonstrate theexisting of estrogen or progesterone receptors in thebreast cancer cells. In other words, stained cancercells are classified into two categories according totheir nuclear color contents, i.e. brown (P) and blue(N). The brown color indicates a positive stainingwhile the blue one demonstrates a negative result.The brown and blue cells shown in figure 1 are rep-resentative samples of positive and negative stainingof estrogen receptor of cancer cells, respectively. Theratio of the total number of positive cancer cells tothe total number of cancer cells in the whole imageis used by a doctor for medical planning and treat-ment. It is also noticeable in figure 1 that there arecolor and intensity variations both in the cancer cellsand in the background (non-cancer cells). The goal ofour research project is to develop a computer-aidedsystem for counting positive and negative cancer cellson immunohistological stained slides from breast can-cer tissue.
2.2 Image segmentation
The originally acquired image is in the red-green-blue (RGB) color space. That is, the color image isformed by the combination of red, green, and bluemonochrome images. In the first step, we classifycolor pixels in the image into one of three categories,i.e. background, P, or N, based on their RGB compo-nents. There are many classifiers that can be usedfor partitioning color of a pixel. However, a neu-ral network is chosen in this paper due to its wellknown as a successful classifier for many applications[7] [8]. The R-, G- and B-components of pixel valuesfrom background, P, and N reference regions (BoxesB1, B2, and B3) shown in figure 1 are used as anexample demonstrating the input vectors for train-ing neural network. After cells are separated frombackground, morphology operations are used for ad-dressing the spatial characteristics of cells. Finally,in order to obtain accurate cell counting results, themarker-controlled watershed is applied for separatingattached multiple cells into distinct single cells. De-tails of an algorithm for segmenting cancer cells basedon their colors and sizes are given in [5].
Fig.1: An example of stained cancer cell image. Thebrown and blue nuclei in the right and left circles arerepresentative samples of positive and negative stain-ing of estrogen receptor of breast cancer cells, respec-tively. Boxes B1, B2, and B3 indicate reference re-gions from background, P, and N, respectively. Pixelvalues in the box regions are used for training neuralnetwork.
2.3 Feature extraction
After all cancer cells in the image are successfullysegmented, the features of each isolated cancer cellconsisting of average values of L*; a*, b*, circularityratio, and area, are computed. Firstly, average valuesof L*; a*, b* from the CIELab space are calculated.The CIELab space is designed to approximate humanvision. It is chosen due to the close correlation be-tween its Euclidean distances and human perception
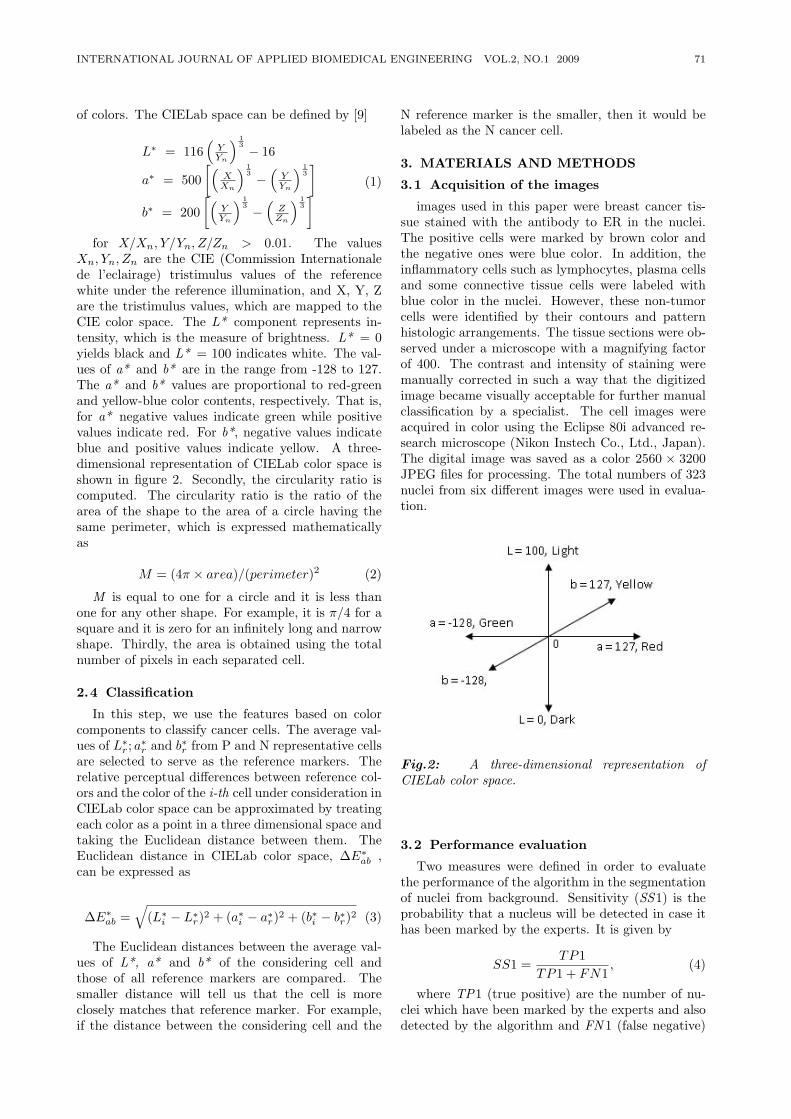
INTERNATIONAL JOURNAL OF APPLIED BIOMEDICAL ENGINEERING VOL.2, NO.1 2009 71
of colors. The CIELab space can be defined by [9]
L∗ = 116(
YYn
) 13 − 16
a∗ = 500[(
XXn
) 13 −
(YYn
) 13]
b∗ = 200[(
YYn
) 13 −
(ZZn
) 13] (1)
for X/Xn, Y/Yn, Z/Zn > 0.01. The valuesXn, Yn, Zn are the CIE (Commission Internationalede l’eclairage) tristimulus values of the referencewhite under the reference illumination, and X, Y, Zare the tristimulus values, which are mapped to theCIE color space. The L* component represents in-tensity, which is the measure of brightness. L* = 0yields black and L* = 100 indicates white. The val-ues of a* and b* are in the range from -128 to 127.The a* and b* values are proportional to red-greenand yellow-blue color contents, respectively. That is,for a* negative values indicate green while positivevalues indicate red. For b*, negative values indicateblue and positive values indicate yellow. A three-dimensional representation of CIELab color space isshown in figure 2. Secondly, the circularity ratio iscomputed. The circularity ratio is the ratio of thearea of the shape to the area of a circle having thesame perimeter, which is expressed mathematicallyas
M = (4π × area)/(perimeter)2 (2)
M is equal to one for a circle and it is less thanone for any other shape. For example, it is π/4 for asquare and it is zero for an infinitely long and narrowshape. Thirdly, the area is obtained using the totalnumber of pixels in each separated cell.
2.4 Classification
In this step, we use the features based on colorcomponents to classify cancer cells. The average val-ues of L∗
r ; a∗r and b∗r from P and N representative cellsare selected to serve as the reference markers. Therelative perceptual differences between reference col-ors and the color of the i-th cell under consideration inCIELab color space can be approximated by treatingeach color as a point in a three dimensional space andtaking the Euclidean distance between them. TheEuclidean distance in CIELab color space, ∆E∗
ab ,can be expressed as
∆E∗ab =
√(L∗
i − L∗r)2 + (a∗i − a∗r)2 + (b∗i − b∗r)2 (3)
The Euclidean distances between the average val-ues of L*, a* and b* of the considering cell andthose of all reference markers are compared. Thesmaller distance will tell us that the cell is moreclosely matches that reference marker. For example,if the distance between the considering cell and the
N reference marker is the smaller, then it would belabeled as the N cancer cell.
3. MATERIALS AND METHODS
3.1 Acquisition of the images
images used in this paper were breast cancer tis-sue stained with the antibody to ER in the nuclei.The positive cells were marked by brown color andthe negative ones were blue color. In addition, theinflammatory cells such as lymphocytes, plasma cellsand some connective tissue cells were labeled withblue color in the nuclei. However, these non-tumorcells were identified by their contours and patternhistologic arrangements. The tissue sections were ob-served under a microscope with a magnifying factorof 400. The contrast and intensity of staining weremanually corrected in such a way that the digitizedimage became visually acceptable for further manualclassification by a specialist. The cell images wereacquired in color using the Eclipse 80i advanced re-search microscope (Nikon Instech Co., Ltd., Japan).The digital image was saved as a color 2560 × 3200JPEG files for processing. The total numbers of 323nuclei from six different images were used in evalua-tion.
Fig.2: A three-dimensional representation ofCIELab color space.
3.2 Performance evaluation
Two measures were defined in order to evaluatethe performance of the algorithm in the segmentationof nuclei from background. Sensitivity (SS1) is theprobability that a nucleus will be detected in case ithas been marked by the experts. It is given by
SS1 =TP1
TP1 + FN1, (4)
where TP1 (true positive) are the number of nu-clei which have been marked by the experts and alsodetected by the algorithm and FN 1 (false negative)
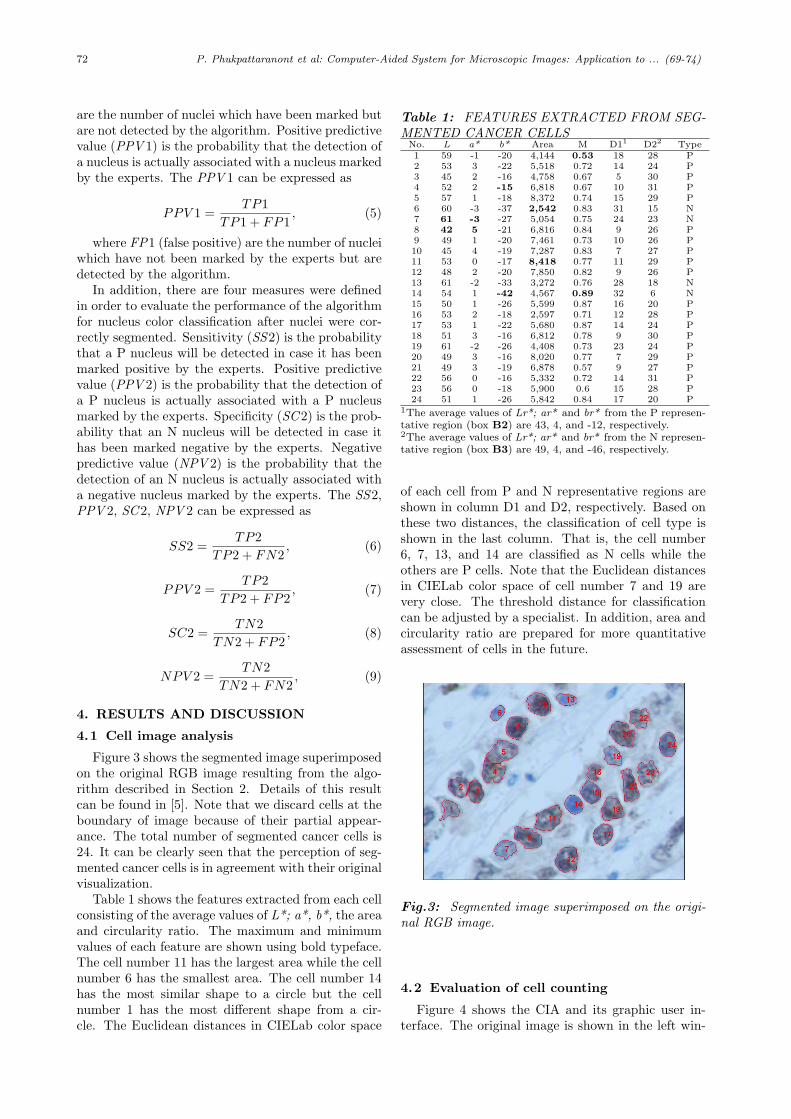
72 P. Phukpattaranont et al: Computer-Aided System for Microscopic Images: Application to ... (69-74)
are the number of nuclei which have been marked butare not detected by the algorithm. Positive predictivevalue (PPV 1) is the probability that the detection ofa nucleus is actually associated with a nucleus markedby the experts. The PPV 1 can be expressed as
PPV 1 =TP1
TP1 + FP1, (5)
where FP1 (false positive) are the number of nucleiwhich have not been marked by the experts but aredetected by the algorithm.
In addition, there are four measures were definedin order to evaluate the performance of the algorithmfor nucleus color classification after nuclei were cor-rectly segmented. Sensitivity (SS2) is the probabilitythat a P nucleus will be detected in case it has beenmarked positive by the experts. Positive predictivevalue (PPV 2) is the probability that the detection ofa P nucleus is actually associated with a P nucleusmarked by the experts. Specificity (SC2) is the prob-ability that an N nucleus will be detected in case ithas been marked negative by the experts. Negativepredictive value (NPV 2) is the probability that thedetection of an N nucleus is actually associated witha negative nucleus marked by the experts. The SS2,PPV 2, SC2, NPV 2 can be expressed as
SS2 =TP2
TP2 + FN2, (6)
PPV 2 =TP2
TP2 + FP2, (7)
SC2 =TN2
TN2 + FP2, (8)
NPV 2 =TN2
TN2 + FN2, (9)
4. RESULTS AND DISCUSSION
4.1 Cell image analysis
Figure 3 shows the segmented image superimposedon the original RGB image resulting from the algo-rithm described in Section 2. Details of this resultcan be found in [5]. Note that we discard cells at theboundary of image because of their partial appear-ance. The total number of segmented cancer cells is24. It can be clearly seen that the perception of seg-mented cancer cells is in agreement with their originalvisualization.
Table 1 shows the features extracted from each cellconsisting of the average values of L*; a*, b*, the areaand circularity ratio. The maximum and minimumvalues of each feature are shown using bold typeface.The cell number 11 has the largest area while the cellnumber 6 has the smallest area. The cell number 14has the most similar shape to a circle but the cellnumber 1 has the most different shape from a cir-cle. The Euclidean distances in CIELab color space
Table 1: FEATURES EXTRACTED FROM SEG-MENTED CANCER CELLS
No. L a* b* Area M D11 D22 Type1 59 -1 -20 4,144 0.53 18 28 P2 53 3 -22 5,518 0.72 14 24 P3 45 2 -16 4,758 0.67 5 30 P4 52 2 -15 6,818 0.67 10 31 P5 57 1 -18 8,372 0.74 15 29 P6 60 -3 -37 2,542 0.83 31 15 N7 61 -3 -27 5,054 0.75 24 23 N8 42 5 -21 6,816 0.84 9 26 P9 49 1 -20 7,461 0.73 10 26 P10 45 4 -19 7,287 0.83 7 27 P11 53 0 -17 8,418 0.77 11 29 P12 48 2 -20 7,850 0.82 9 26 P13 61 -2 -33 3,272 0.76 28 18 N14 54 1 -42 4,567 0.89 32 6 N15 50 1 -26 5,599 0.87 16 20 P16 53 2 -18 2,597 0.71 12 28 P17 53 1 -22 5,680 0.87 14 24 P18 51 3 -16 6,812 0.78 9 30 P19 61 -2 -26 4,408 0.73 23 24 P20 49 3 -16 8,020 0.77 7 29 P21 49 3 -19 6,878 0.57 9 27 P22 56 0 -16 5,332 0.72 14 31 P23 56 0 -18 5,900 0.6 15 28 P24 51 1 -26 5,842 0.84 17 20 P
1The average values of Lr*; ar* and br* from the P represen-tative region (box B2) are 43, 4, and -12, respectively.2The average values of Lr*; ar* and br* from the N represen-tative region (box B3) are 49, 4, and -46, respectively.
of each cell from P and N representative regions areshown in column D1 and D2, respectively. Based onthese two distances, the classification of cell type isshown in the last column. That is, the cell number6, 7, 13, and 14 are classified as N cells while theothers are P cells. Note that the Euclidean distancesin CIELab color space of cell number 7 and 19 arevery close. The threshold distance for classificationcan be adjusted by a specialist. In addition, area andcircularity ratio are prepared for more quantitativeassessment of cells in the future.
Fig.3: Segmented image superimposed on the origi-nal RGB image.
4.2 Evaluation of cell counting
Figure 4 shows the CIA and its graphic user in-terface. The original image is shown in the left win-
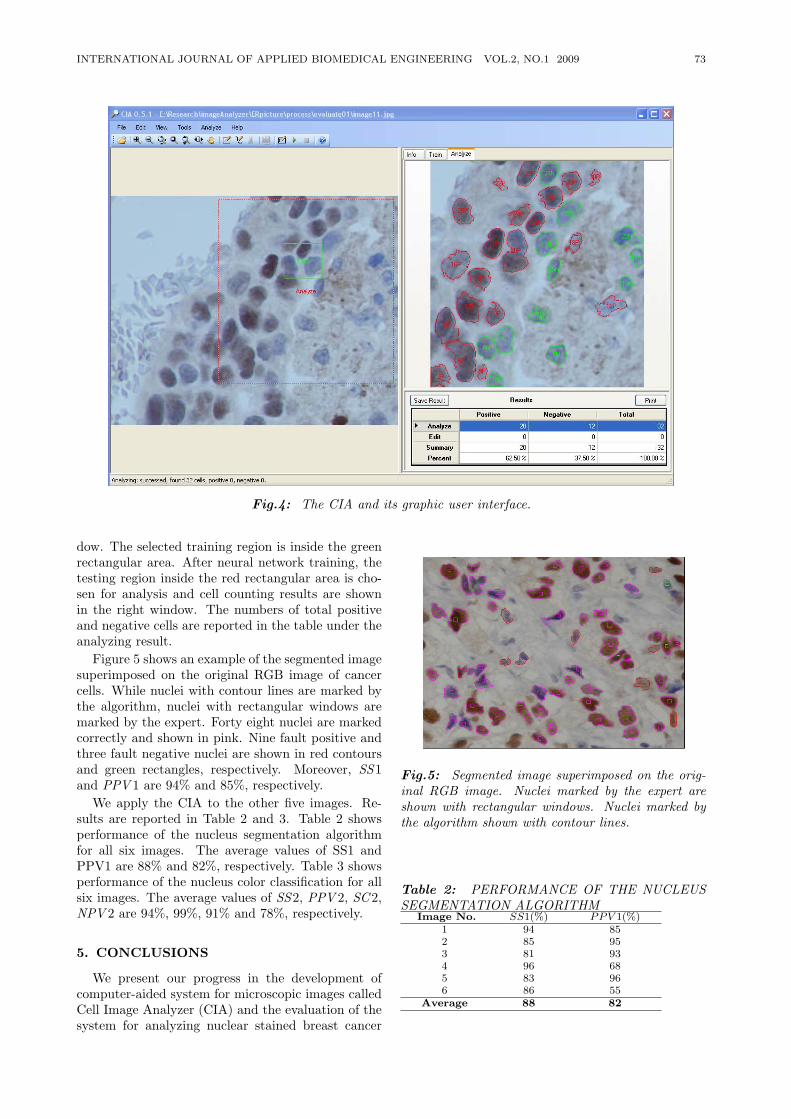
INTERNATIONAL JOURNAL OF APPLIED BIOMEDICAL ENGINEERING VOL.2, NO.1 2009 73
Fig.4: The CIA and its graphic user interface.
dow. The selected training region is inside the greenrectangular area. After neural network training, thetesting region inside the red rectangular area is cho-sen for analysis and cell counting results are shownin the right window. The numbers of total positiveand negative cells are reported in the table under theanalyzing result.
Figure 5 shows an example of the segmented imagesuperimposed on the original RGB image of cancercells. While nuclei with contour lines are marked bythe algorithm, nuclei with rectangular windows aremarked by the expert. Forty eight nuclei are markedcorrectly and shown in pink. Nine fault positive andthree fault negative nuclei are shown in red contoursand green rectangles, respectively. Moreover, SS1and PPV 1 are 94% and 85%, respectively.
We apply the CIA to the other five images. Re-sults are reported in Table 2 and 3. Table 2 showsperformance of the nucleus segmentation algorithmfor all six images. The average values of SS1 andPPV1 are 88% and 82%, respectively. Table 3 showsperformance of the nucleus color classification for allsix images. The average values of SS2, PPV 2, SC2,NPV 2 are 94%, 99%, 91% and 78%, respectively.
5. CONCLUSIONS
We present our progress in the development ofcomputer-aided system for microscopic images calledCell Image Analyzer (CIA) and the evaluation of thesystem for analyzing nuclear stained breast cancer
Fig.5: Segmented image superimposed on the orig-inal RGB image. Nuclei marked by the expert areshown with rectangular windows. Nuclei marked bythe algorithm shown with contour lines.
Table 2: PERFORMANCE OF THE NUCLEUSSEGMENTATION ALGORITHM
Image No. SS1(%) PPV 1(%)1 94 852 85 953 81 934 96 685 83 966 86 55
Average 88 82
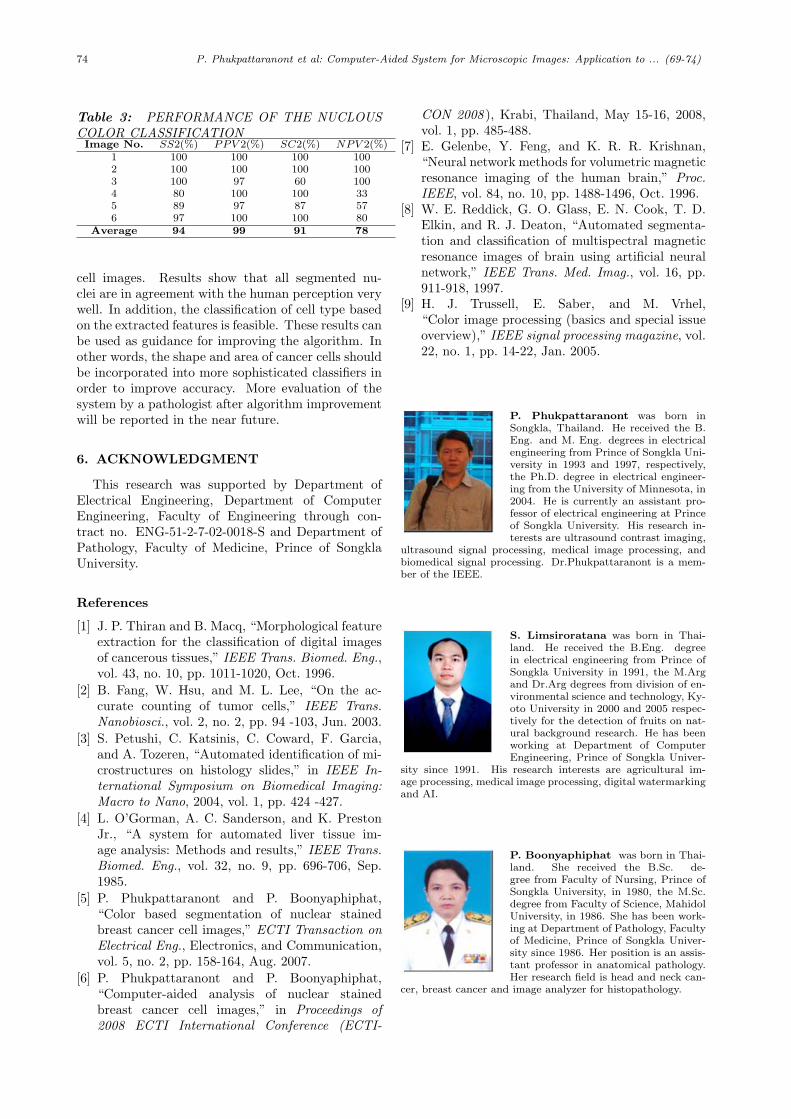
74 P. Phukpattaranont et al: Computer-Aided System for Microscopic Images: Application to ... (69-74)
Table 3: PERFORMANCE OF THE NUCLOUSCOLOR CLASSIFICATIONImage No. SS2(%) PPV 2(%) SC2(%) NPV 2(%)
1 100 100 100 1002 100 100 100 1003 100 97 60 1004 80 100 100 335 89 97 87 576 97 100 100 80
Average 94 99 91 78
cell images. Results show that all segmented nu-clei are in agreement with the human perception verywell. In addition, the classification of cell type basedon the extracted features is feasible. These results canbe used as guidance for improving the algorithm. Inother words, the shape and area of cancer cells shouldbe incorporated into more sophisticated classifiers inorder to improve accuracy. More evaluation of thesystem by a pathologist after algorithm improvementwill be reported in the near future.
6. ACKNOWLEDGMENT
This research was supported by Department ofElectrical Engineering, Department of ComputerEngineering, Faculty of Engineering through con-tract no. ENG-51-2-7-02-0018-S and Department ofPathology, Faculty of Medicine, Prince of SongklaUniversity.
References
[1] J. P. Thiran and B. Macq, “Morphological featureextraction for the classification of digital imagesof cancerous tissues,” IEEE Trans. Biomed. Eng.,vol. 43, no. 10, pp. 1011-1020, Oct. 1996.
[2] B. Fang, W. Hsu, and M. L. Lee, “On the ac-curate counting of tumor cells,” IEEE Trans.Nanobiosci., vol. 2, no. 2, pp. 94 -103, Jun. 2003.
[3] S. Petushi, C. Katsinis, C. Coward, F. Garcia,and A. Tozeren, “Automated identification of mi-crostructures on histology slides,” in IEEE In-ternational Symposium on Biomedical Imaging:Macro to Nano, 2004, vol. 1, pp. 424 -427.
[4] L. O’Gorman, A. C. Sanderson, and K. PrestonJr., “A system for automated liver tissue im-age analysis: Methods and results,” IEEE Trans.Biomed. Eng., vol. 32, no. 9, pp. 696-706, Sep.1985.
[5] P. Phukpattaranont and P. Boonyaphiphat,“Color based segmentation of nuclear stainedbreast cancer cell images,” ECTI Transaction onElectrical Eng., Electronics, and Communication,vol. 5, no. 2, pp. 158-164, Aug. 2007.
[6] P. Phukpattaranont and P. Boonyaphiphat,“Computer-aided analysis of nuclear stainedbreast cancer cell images,” in Proceedings of2008 ECTI International Conference (ECTI-
CON 2008 ), Krabi, Thailand, May 15-16, 2008,vol. 1, pp. 485-488.
[7] E. Gelenbe, Y. Feng, and K. R. R. Krishnan,“Neural network methods for volumetric magneticresonance imaging of the human brain,” Proc.IEEE, vol. 84, no. 10, pp. 1488-1496, Oct. 1996.
[8] W. E. Reddick, G. O. Glass, E. N. Cook, T. D.Elkin, and R. J. Deaton, “Automated segmenta-tion and classification of multispectral magneticresonance images of brain using artificial neuralnetwork,” IEEE Trans. Med. Imag., vol. 16, pp.911-918, 1997.
[9] H. J. Trussell, E. Saber, and M. Vrhel,“Color image processing (basics and special issueoverview),” IEEE signal processing magazine, vol.22, no. 1, pp. 14-22, Jan. 2005.
P. Phukpattaranont was born inSongkla, Thailand. He received the B.Eng. and M. Eng. degrees in electricalengineering from Prince of Songkla Uni-versity in 1993 and 1997, respectively,the Ph.D. degree in electrical engineer-ing from the University of Minnesota, in2004. He is currently an assistant pro-fessor of electrical engineering at Princeof Songkla University. His research in-terests are ultrasound contrast imaging,
ultrasound signal processing, medical image processing, andbiomedical signal processing. Dr.Phukpattaranont is a mem-ber of the IEEE.
S. Limsiroratana was born in Thai-land. He received the B.Eng. degreein electrical engineering from Prince ofSongkla University in 1991, the M.Argand Dr.Arg degrees from division of en-vironmental science and technology, Ky-oto University in 2000 and 2005 respec-tively for the detection of fruits on nat-ural background research. He has beenworking at Department of ComputerEngineering, Prince of Songkla Univer-
sity since 1991. His research interests are agricultural im-age processing, medical image processing, digital watermarkingand AI.
P. Boonyaphiphat was born in Thai-land. She received the B.Sc. de-gree from Faculty of Nursing, Prince ofSongkla University, in 1980, the M.Sc.degree from Faculty of Science, MahidolUniversity, in 1986. She has been work-ing at Department of Pathology, Facultyof Medicine, Prince of Songkla Univer-sity since 1986. Her position is an assis-tant professor in anatomical pathology.Her research field is head and neck can-
cer, breast cancer and image analyzer for histopathology.

IJABME Manuscript Submission Guide
General The International Journal on Applied Biomedical Engineering (IJABME) is published bi-annually by ThaiBME Society. Contributed papers must be original that advance the state-of-the art and applications of Biomedical Engineering. Both theoretical contributions (including new techniques, concepts, and analyses) and practical contributions (including system experiments and prototypes, and new applications) are encouraged. The submitted manuscript must have been copyrighted, published, or submitted or accepted for publication elsewhere, except in a conference proceedings. The manuscript text should not contain any commercial references, such as company names, university names, trademarks, commercial acronyms, or part numbers. Not accepted material will not be returned.
Submission Due Authors should document their work in relation to the open literature. The following limits on length (A4 size) should be observed. - End of March, for January-June issue. - End of September, for July-December issue.
Length Authors should document their work in relation to the open literature. The following limits on length (A4 size) should be observed. 1) Regular papers, should be at least 6 pages and up to 12 pages in length, including figures and illustrations. 2) Correspondences, less than 3 pages in length, including figures and illustrations.
Styles for Manuscript 1) The manuscript must be in English. 2) Provide a carefully worded abstract of 150 to 300 words for regular papers and less than 150 words for
correspondences. If the manuscript is not submitted via the website, Name, address, and telephone number of author(s) should be organised on a separate cover page.
3) The style for organization of a paper can be found in the manuscript template file.
Form and Submissions 1) The manuscripts itself 2) Cover Page: should include - Paper title - Paper category (regular paper or correspondence) - Full name of all authors - Name and address of the key author whom proofs and other correspondence can be sent - Keywords (duplicate from the paper) - Abstract (duplicate from the paper) - Date of submission
Notes: 1. Authors are encouraged to submit their paper in electronic form via the IJABME website. The first sent
manuscripts must be in the form of pdf files. In any case of difficulty, the manuscript could be also attached to standard emails and sent directly to the editor.
2. Authors who are not convenient to submit paper in electronic form, hard copy formatted is also appreciated. Authors are to send four copies of the manuscript.
3. The accepted and/or revised manuscript must be resubmitted for IJABME publishing. Text files are appreciated. The manuscript will be reformatted upon IJABME style.
4. Original illustrations (could be also good resolution image files) must be ready for immediately submission upon acceptance of the manuscript. In the case of regular papers, also be prepared to provide a brief technical biography and photograph of each author.
Where to Submit Electronic version of the manuscript must be submitted online via IJABME website; http://www.ijabme.org.
Review Process The review process usually takes 3 weeks to 3 months. The author is then notified the decision of the editor based on the reviewers' recommendations. Authors may be asked to revise the manuscript if it is not accepted or rejected in its original form. The un-accepted manuscript will not be returned to authors.
Page Charges After the manuscript has been reviewed and accepted for its publication, the author's company or institution will be asked to pay a charge of 1,000 THB (or 33 USD) per printed page to cover part of the cost of publication. ThaiBME members will receive full reduction on page charge. Printing of colour pages are specially requested and fully paid by the authors. Page charges can be exempted upon request.
Copyright It is the policy of the ThaiBME to own the copyright to the published contributions on behalf of the interests of ThaiBME, its authors, and their employers, and to facilitate the appropriate reuse of this material by others. To comply with the Copyright Law, authors are required to sign a copyright transfer form before publication. This form, a copy of which appears in this journal, returns to authors and their employers full rights to reuse their material for their own purposes.

International Steering Committee Chusak Limsakul (Chair), Thailand Adhi Susanto, Indonesia Chuchart Pintavirooj, Thailand Ferdinand F.S. Cohen, USA Ian Thomas, Thailand James Koh, Singapore Kazuhiko Hamamoto, Japan Kosin Chamnognthai, Thailand Ratko Magijarevic, Croatia Eung Je Woo, Korea Supaporn Kiattisin, Thailand Tru Cao, Vietnam Tsuyoshi Shiina, Japan Somsak Choomchuay, (Sec.) Thailand
Organizing Committee General Chair Tsuyoshi Shiina Kyoto University, Japan
General CoChairs Tohru Yagi Tokyo Institute of Technology, Japan Keiji Iramina Kyushu University, Japan
Technical Program Chairs Yasuhiko Jimbo University of Tokyo, Japan Kohji Maduda Tokyo Univ. of Agri. and Tech., Japan
Publicity Chairs Supariek Janjarasjitt Ubonrathathani Univ., Thailand Adisorn Leelasantithum UTCC, Thailand
Special Session Chair Supan Tungjitkusolmun KMITL, Thailand
Information Chair Surapan Airphaiboon KMITL, Thailand
Local Arrangement Chair Makoto Yamakawa Kyoto University, Japan
General Secretary Kazuhiko Hamamoto Tokai University, Japan
Supported by • International Federation for Medical and Biological Engineering (IFMBE)
• Technical Committee of Medical and Biological Engineering, Society of Electronics, Information and Systems, The Institute of Electrical Engineers of Japan (IEEJ)
• Thai Biomedical Engineering Society (ThaiBME)
• International Journal of Applied Biomedical Engineering (IJABME)
First call for Paper The 3rd BMEiCON is still intended to provide an international forum where researchers, practitioners, and professionals interested in the advances in, and applications of, biomedical engineering can exchange the latest research, results, and ideas in these areas through presentation and discussion.
The BMEiCON2010 will be held in Kyoto, Japan, during August 27‐28, 2010. The organizing committee is pleased to invite all engineers, physicians, scientists, technicians, and technologists to attend and help to shape the future of biomedical technology. The topics for regular sessions include, but are not limited to, the followings:
Submission: • Authors are invited to submit a full paper according to the posted guidelines. • Authors are expected to present their papers at the conference upon acceptance and presenting authors are required to register for the conference.
• Papers should neither have been published elsewhere nor currently under review by another conference or journal.
• All papers for BMEiCON2010 must be submitted electronically via the conference website only.
http://www.bmeicon.org/bmeicon2010
Author’s Schedule: Special session proposal due: April 15, 2010 Submission of Full Paper: April 30, 2010 Notification of Acceptance: June 15, 2010 Submission of Camera Ready Paper: July 16, 2010
Special session proposal; Submit to the special session chair at [email protected] General Secretary could be contacted by:
FAX: +81‐463‐50‐2412 or Email: [email protected]‐tokai.ac.jp Check the conference website for up‐to‐date information:
http://www.bmeicon.org/bmeicon2010
• Bioinformatics, Medical Informatics• Biomechanics and Biomaterials • Computer‐Integrated and Assisted Surgery • Medical Imaging, Image and Signal Processing • Medical Simulation, Systems and Control • Medical Expert Systems • Molecular Bioengineering • Rehabilitation and Clinical Engineering • Tele‐Health • Biomedical Engineering Education • Cell and Tissue Engineering • Health Care Technology • Medical Measurement and Instrumentation • Medical Robotics and Automation • Medical Navigations • Physiological System Modeling • Virtual and Augmented Reality in Medicine • Other Related Topics