Embed Size (px)
Citation preview
5180 Parkstone Drive Suite 260 Chantilly, VA 20151 (703) 378-8672 www.integrity-apps.com
Fault Management for System Safety:Introduction to Fault Tree Analysis
Guest Lecture SYST 460/560:Michael Scher
7 December 2009
5180 Parkstone Drive Suite 260 Chantilly, VA 20151 (703) 378-8672 www.integrity-apps.com
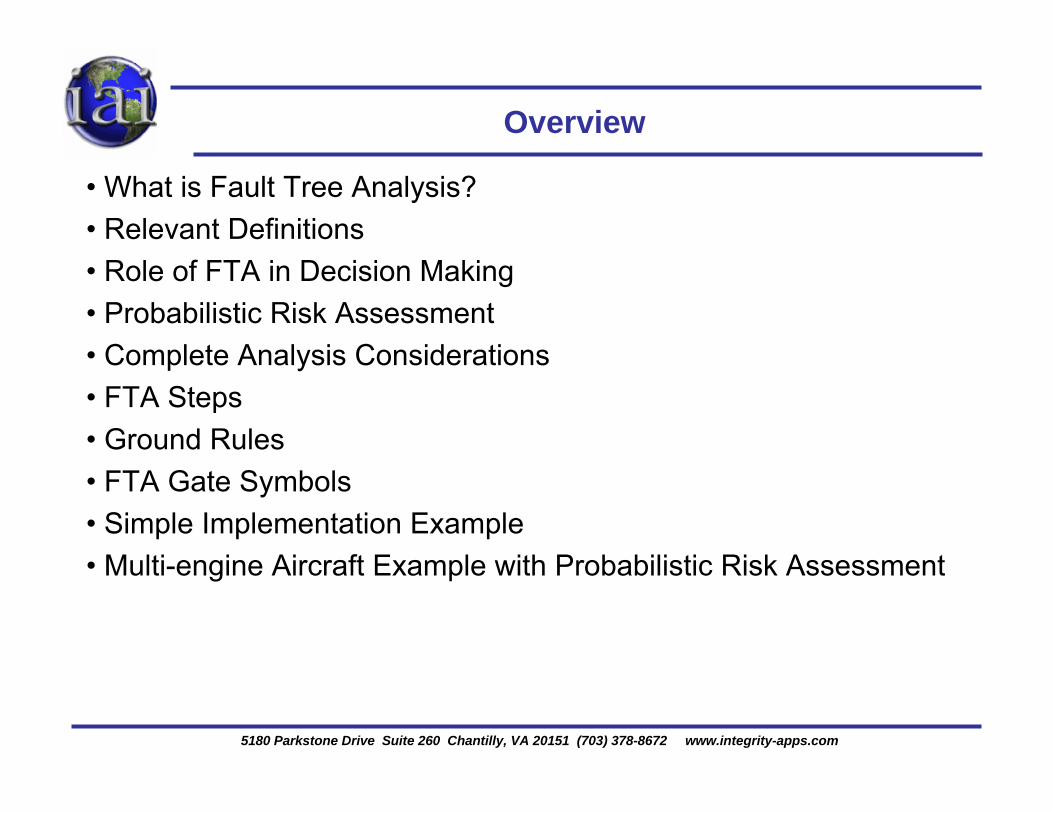
Overview
• What is Fault Tree Analysis?• Relevant Definitions• Role of FTA in Decision Making• Probabilistic Risk Assessment• Complete Analysis Considerations• FTA Steps• Ground Rules• FTA Gate Symbols• Simple Implementation Example• Multi-engine Aircraft Example with Probabilistic Risk Assessment
5180 Parkstone Drive Suite 260 Chantilly, VA 20151 (703) 378-8672 www.integrity-apps.com
What is Fault Tree Analysis (FTA)?
• FTA is a powerful tool for understanding component and subsystem interactions that can cause a hazardous event
• Top-down, qualitative failure analysis methodology that systematically deduces the root causes of an undesired, hazardous event
• Logical illustration of events and relationships that are necessary and sufficient to result in event
• NOT a model of all possible system failures or causes of system failure
• NOT a quantitative model, but can be used to support quantitative analysis (e.g., Probabilistic Risk Assessment)
5180 Parkstone Drive Suite 260 Chantilly, VA 20151 (703) 378-8672 www.integrity-apps.com
Important Definitions
• Fault – unexpected response in which functionality is recoverable by fixing it, managing around it, or redundancy
• Failure – unexpected response in which functionality is NOT recoverable• Primary Failure – component failure that cannot be further defined in a
Fault Tree–Example: component on computer circuit board fails
• Secondary Failure – component failure that could be defined further but is not due to ground rules–Example: computer failure (not interested in details)
• Command Fault – inadvertent or untimely normal operation of a component–Example: draw bridge opens at wrong time due to operator entering
command at improper time• Common Cause Failure – failures that are common to multiple parts
due to poor material choice, manufacturing defects, etc.
5180 Parkstone Drive Suite 260 Chantilly, VA 20151 (703) 378-8672 www.integrity-apps.com
Role of FTA for Decision Making
•Understand logic that leads to top event•Prioritization of contributors that lead to top event•Proactive tool to prevent top event•Monitor system performance•Optimize resources•Assist in system design• Identify and correct causes of top event
5180 Parkstone Drive Suite 260 Chantilly, VA 20151 (703) 378-8672 www.integrity-apps.com
Probabilistic Risk Assessment
•Probabilistic Risk Assessment (PRA) assigns probabilities of each event, or combination of events, in the Fault Tree to determine the likelihood of the top event
•Probability of failure (success) calculated through PRA of a particular event is only as good as the estimates of component reliability
•PRA is only effective if the fault tree and associated probabilities is regularly updated to reflect system changes
5180 Parkstone Drive Suite 260 Chantilly, VA 20151 (703) 378-8672 www.integrity-apps.com
Complete Considerations: Top-down and Bottom-up
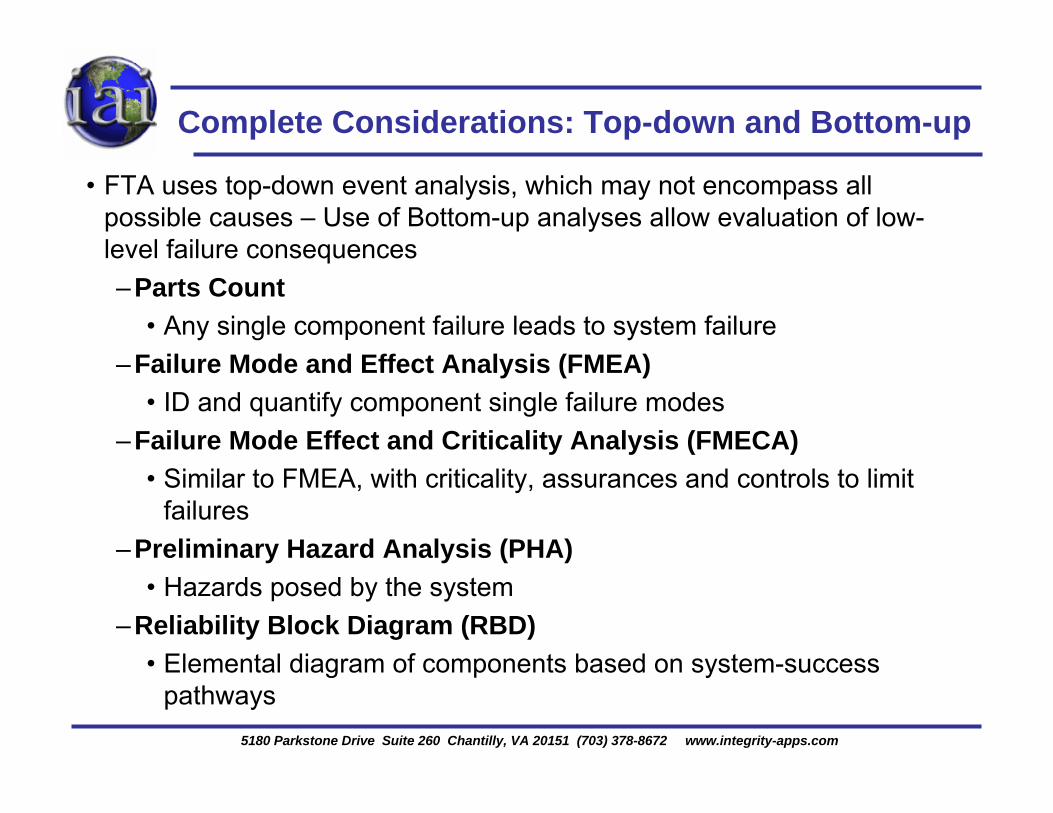
• FTA uses top-down event analysis, which may not encompass all possible causes – Use of Bottom-up analyses allow evaluation of low-level failure consequences–Parts Count
• Any single component failure leads to system failure–Failure Mode and Effect Analysis (FMEA)
• ID and quantify component single failure modes–Failure Mode Effect and Criticality Analysis (FMECA)
• Similar to FMEA, with criticality, assurances and controls to limit failures
–Preliminary Hazard Analysis (PHA)• Hazards posed by the system
–Reliability Block Diagram (RBD)• Elemental diagram of components based on system-success
pathways
5180 Parkstone Drive Suite 260 Chantilly, VA 20151 (703) 378-8672 www.integrity-apps.com
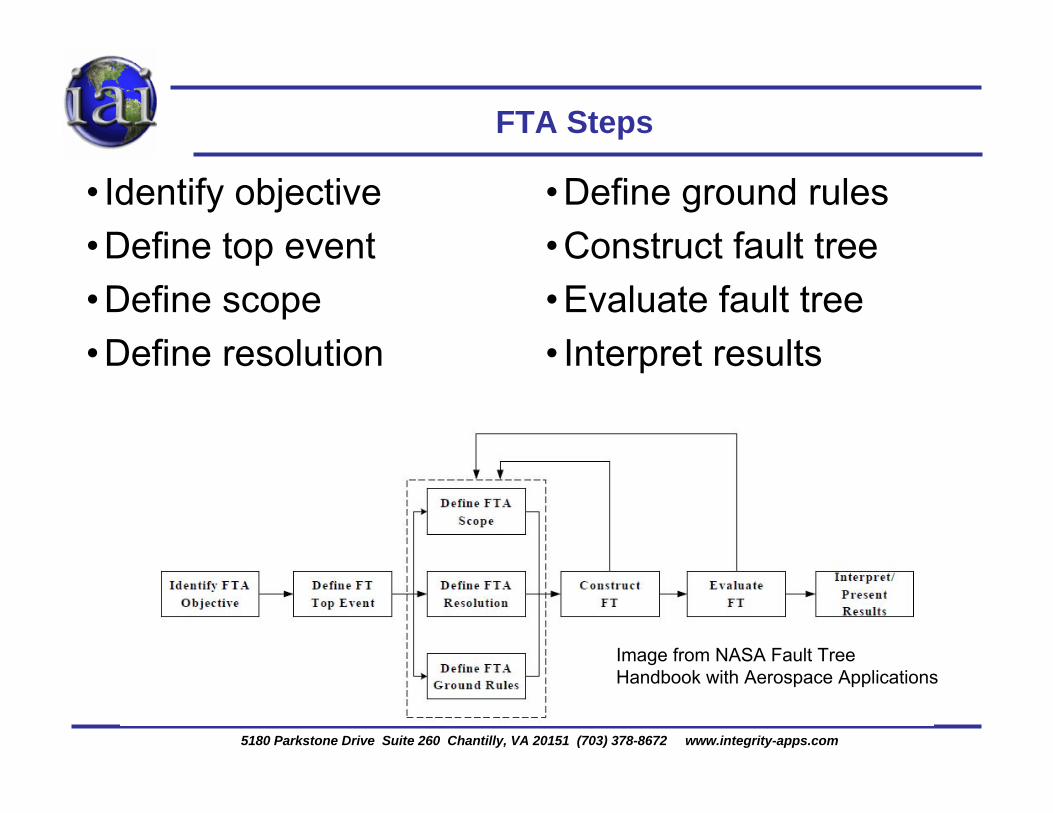
FTA Steps
• Identify objective•Define top event•Define scope•Define resolution
•Define ground rules•Construct fault tree•Evaluate fault tree• Interpret results
Image from NASA Fault Tree Handbook with Aerospace Applications
5180 Parkstone Drive Suite 260 Chantilly, VA 20151 (703) 378-8672 www.integrity-apps.com
Basic Paradigm and Basic Rules
• Think small – Immediate causes of the event – small steps• Clearly write the events as faults; state precisely what the
fault is and the conditions under which it occurs. Do not mix successes with faults
• Event is classified as “state of component fault” if fault is a component failure, otherwise event is a “state of system fault”
• If the normal functioning of a component propagates a fault sequence, the component is assumed to function normally
• Each level of fault tree should be completed before moving to lower level
• Fault tree should be constructed to major component level – Individual circuit board, but not transistors
5180 Parkstone Drive Suite 260 Chantilly, VA 20151 (703) 378-8672 www.integrity-apps.com
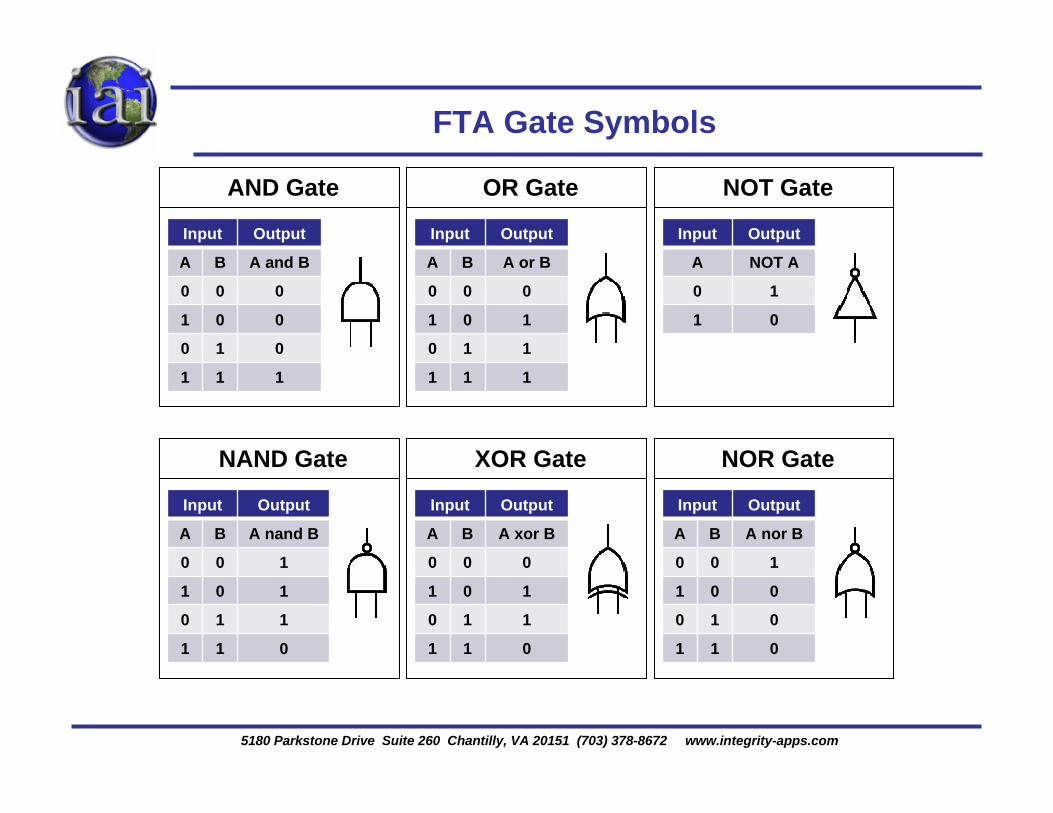
FTA Gate Symbols
Input Output
A B A and B
0 0 0
1 0 0
0 1 0
1 1 1
AND Gate
Input Output
A B A or B
0 0 0
1 0 1
0 1 1
1 1 1
OR Gate
Input Output
A NOT A
0 1
1 0
NOT Gate
Input Output
A B A nand B
0 0 1
1 0 1
0 1 1
1 1 0
NAND Gate
Input Output
A B A xor B
0 0 0
1 0 1
0 1 1
1 1 0
XOR Gate
Input Output
A B A nor B
0 0 1
1 0 0
0 1 0
1 1 0
NOR Gate
5180 Parkstone Drive Suite 260 Chantilly, VA 20151 (703) 378-8672 www.integrity-apps.com
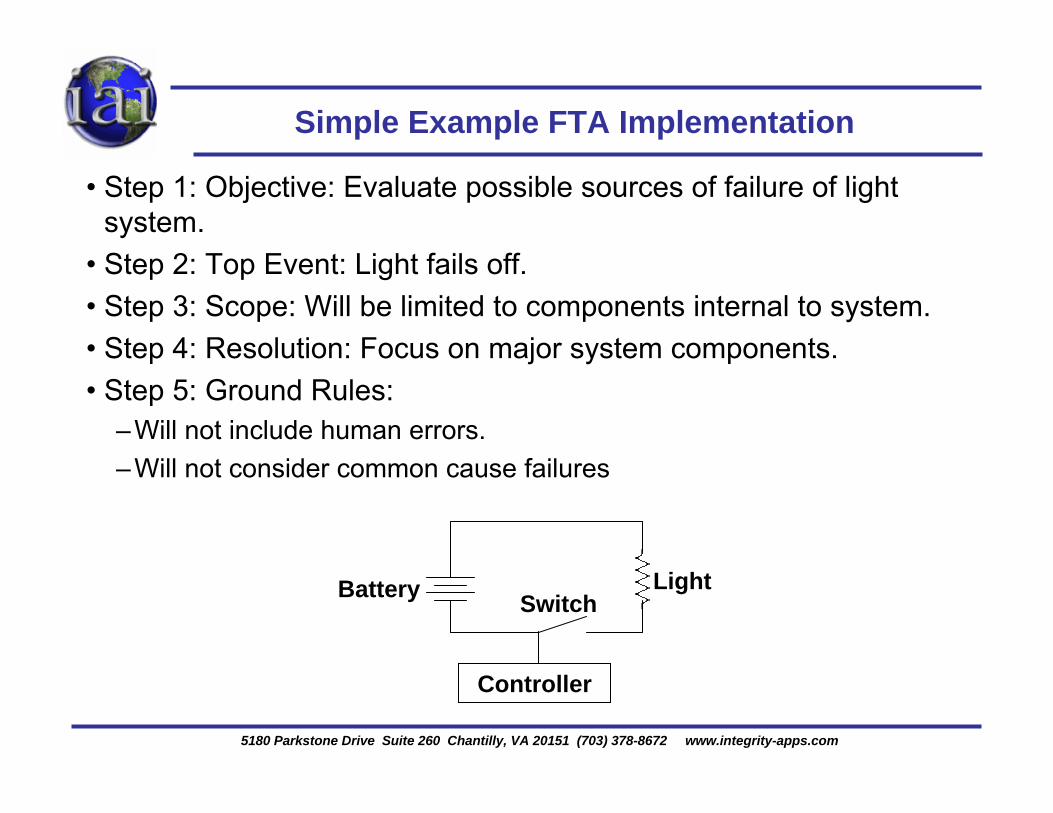
Simple Example FTA Implementation
• Step 1: Objective: Evaluate possible sources of failure of lightsystem.
• Step 2: Top Event: Light fails off.• Step 3: Scope: Will be limited to components internal to system.• Step 4: Resolution: Focus on major system components.• Step 5: Ground Rules:
–Will not include human errors.–Will not consider common cause failures
LightSwitchBattery
Controller
5180 Parkstone Drive Suite 260 Chantilly, VA 20151 (703) 378-8672 www.integrity-apps.com
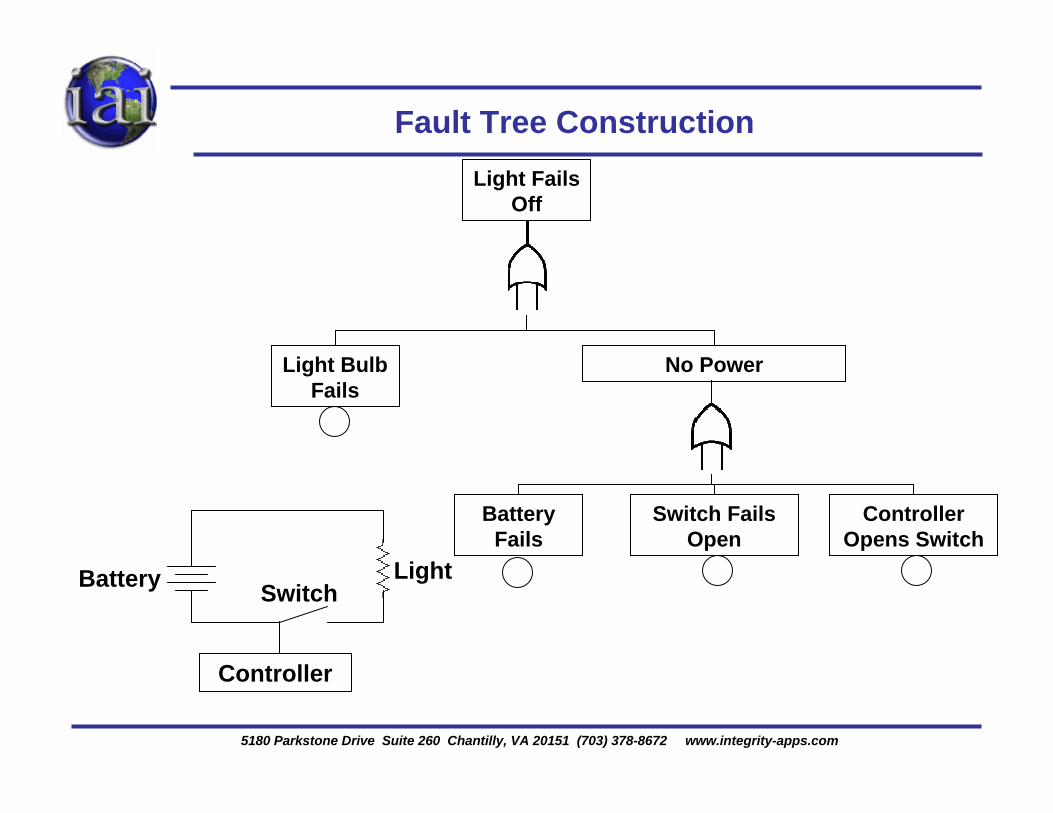
Fault Tree Construction
LightSwitchBattery
Controller
Light Fails Off
Light Bulb Fails
No Power
Battery Fails
Controller Opens Switch
Switch Fails Open
5180 Parkstone Drive Suite 260 Chantilly, VA 20151 (703) 378-8672 www.integrity-apps.com
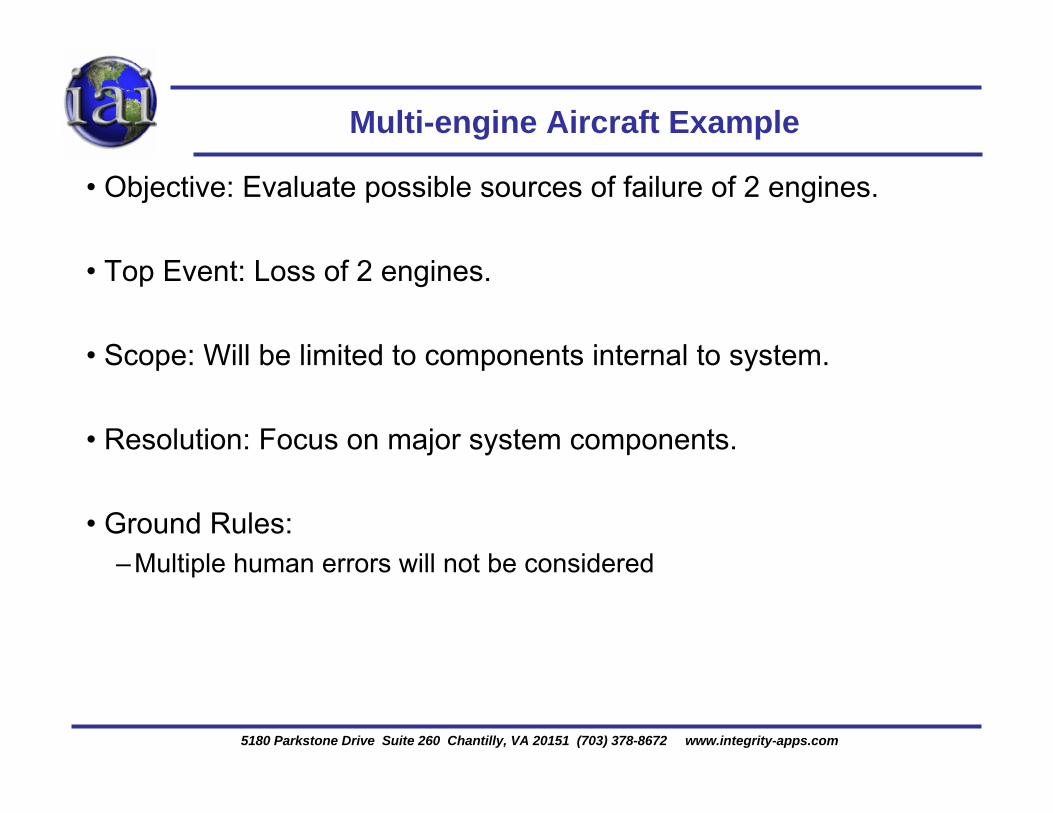
Multi-engine Aircraft Example
• Objective: Evaluate possible sources of failure of 2 engines.
• Top Event: Loss of 2 engines.
• Scope: Will be limited to components internal to system.
• Resolution: Focus on major system components.
• Ground Rules: –Multiple human errors will not be considered
5180 Parkstone Drive Suite 260 Chantilly, VA 20151 (703) 378-8672 www.integrity-apps.com
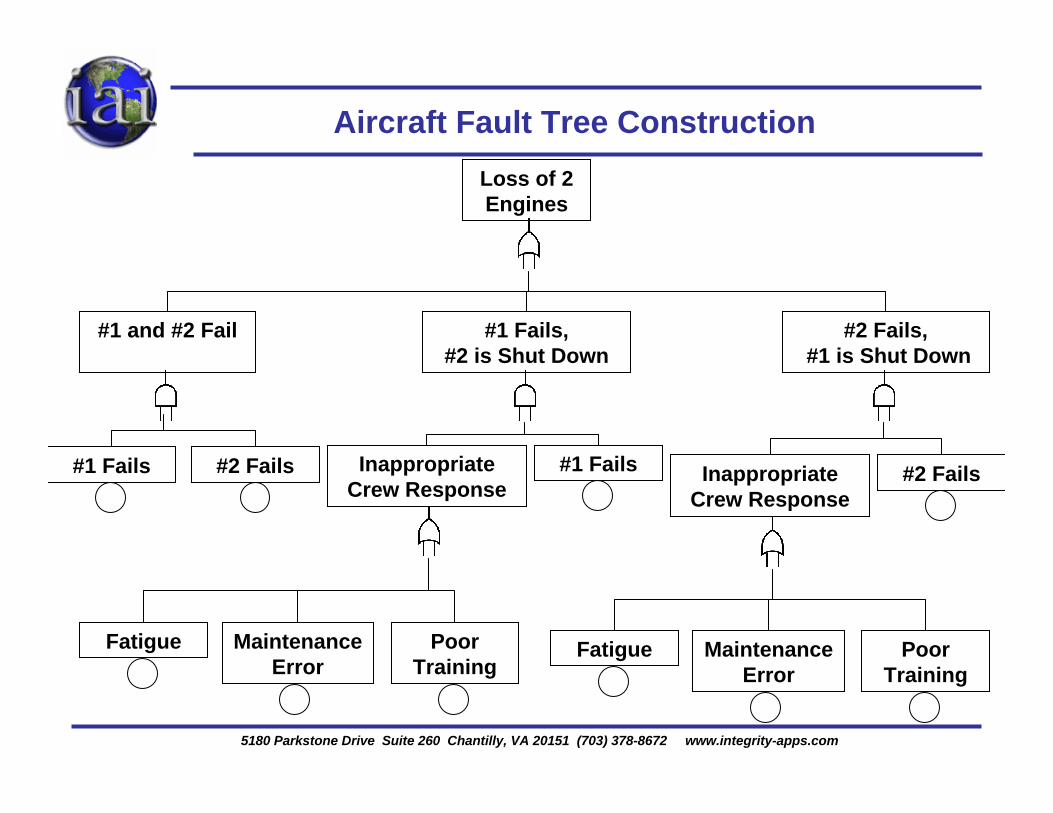
Aircraft Fault Tree ConstructionLoss of 2 Engines
#1 and #2 Fail #1 Fails, #2 is Shut Down
#2 Fails,#1 is Shut Down
#1 Fails #2 Fails Inappropriate Crew Response
Fatigue Maintenance Error
Poor Training
#1 Fails Inappropriate Crew Response
#2 Fails
Fatigue Maintenance Error
Poor Training
5180 Parkstone Drive Suite 260 Chantilly, VA 20151 (703) 378-8672 www.integrity-apps.com
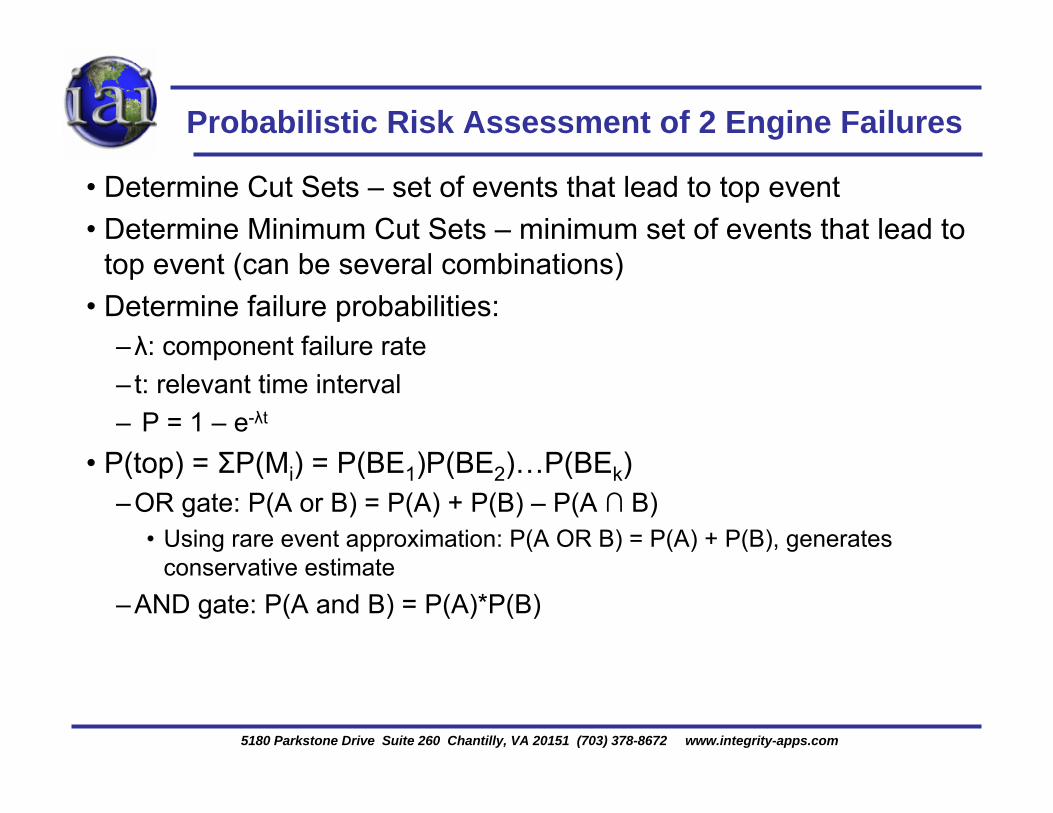
Probabilistic Risk Assessment of 2 Engine Failures
• Determine Cut Sets – set of events that lead to top event• Determine Minimum Cut Sets – minimum set of events that lead to
top event (can be several combinations)• Determine failure probabilities:
–λ: component failure rate– t: relevant time interval– P = 1 – e-λt
• P(top) = ΣP(Mi) = P(BE1)P(BE2)…P(BEk)–OR gate: P(A or B) = P(A) + P(B) – P(A ∩ B)
• Using rare event approximation: P(A OR B) = P(A) + P(B), generates conservative estimate
–AND gate: P(A and B) = P(A)*P(B)
5180 Parkstone Drive Suite 260 Chantilly, VA 20151 (703) 378-8672 www.integrity-apps.com
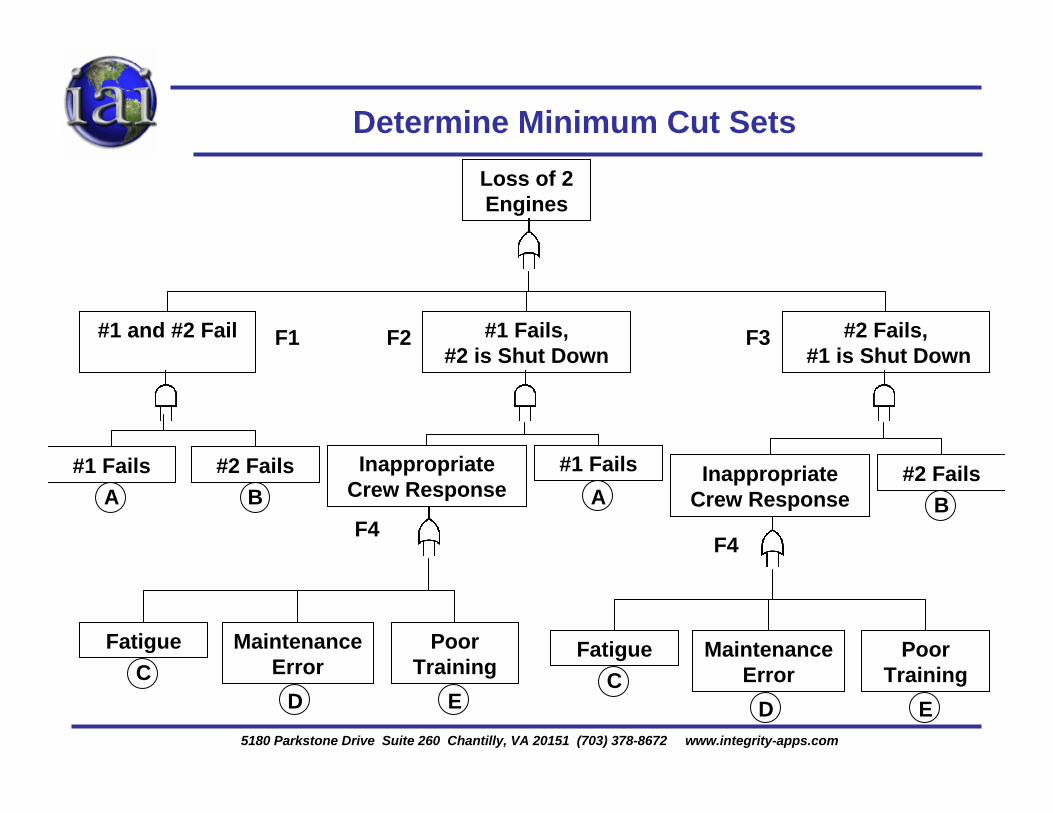
Determine Minimum Cut SetsLoss of 2 Engines
#1 and #2 Fail #1 Fails, #2 is Shut Down
#2 Fails,#1 is Shut Down
#1 Fails #2 Fails Inappropriate Crew Response
Fatigue Maintenance Error
Poor Training
#1 Fails Inappropriate Crew Response
#2 Fails
Fatigue Maintenance Error
Poor Training
A B A B
CD E
CD E
F1 F2 F3
F4F4
5180 Parkstone Drive Suite 260 Chantilly, VA 20151 (703) 378-8672 www.integrity-apps.com
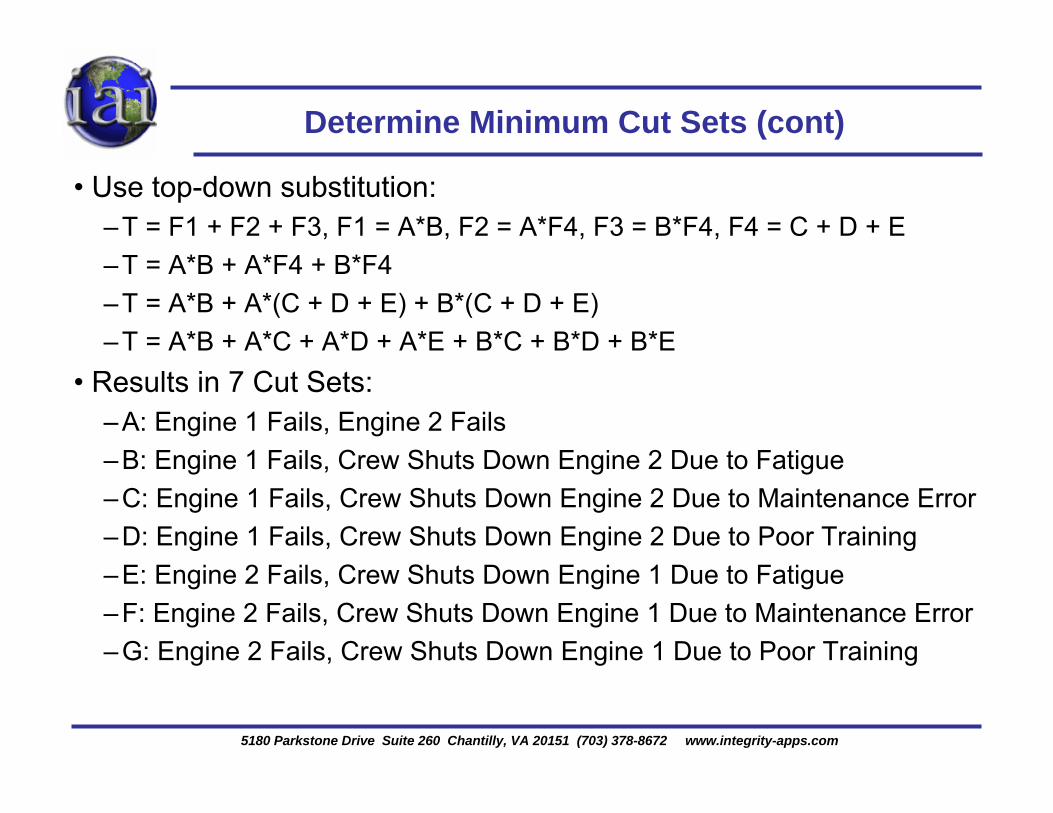
Determine Minimum Cut Sets (cont)
• Use top-down substitution:–T = F1 + F2 + F3, F1 = A*B, F2 = A*F4, F3 = B*F4, F4 = C + D + E–T = A*B + A*F4 + B*F4–T = A*B + A*(C + D + E) + B*(C + D + E)–T = A*B + A*C + A*D + A*E + B*C + B*D + B*E
• Results in 7 Cut Sets:–A: Engine 1 Fails, Engine 2 Fails–B: Engine 1 Fails, Crew Shuts Down Engine 2 Due to Fatigue–C: Engine 1 Fails, Crew Shuts Down Engine 2 Due to Maintenance Error–D: Engine 1 Fails, Crew Shuts Down Engine 2 Due to Poor Training–E: Engine 2 Fails, Crew Shuts Down Engine 1 Due to Fatigue–F: Engine 2 Fails, Crew Shuts Down Engine 1 Due to Maintenance Error–G: Engine 2 Fails, Crew Shuts Down Engine 1 Due to Poor Training
5180 Parkstone Drive Suite 260 Chantilly, VA 20151 (703) 378-8672 www.integrity-apps.com
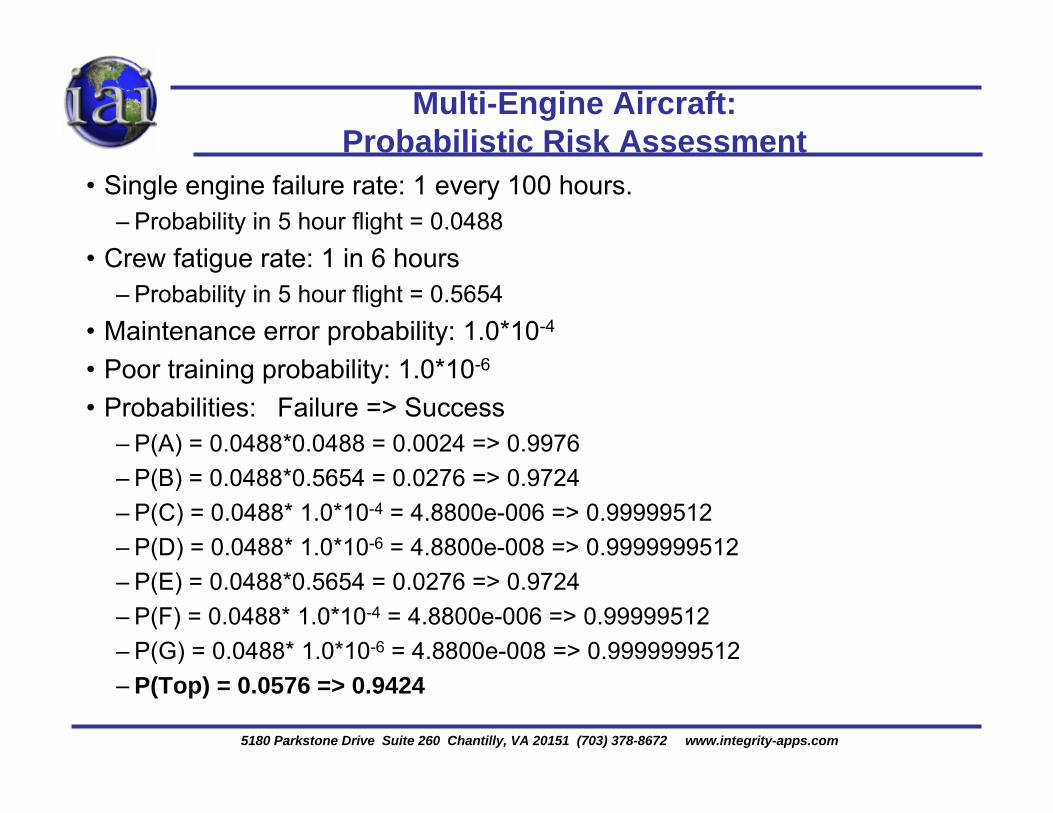
Multi-Engine Aircraft: Probabilistic Risk Assessment
• Single engine failure rate: 1 every 100 hours.– Probability in 5 hour flight = 0.0488
• Crew fatigue rate: 1 in 6 hours– Probability in 5 hour flight = 0.5654
• Maintenance error probability: 1.0*10-4
• Poor training probability: 1.0*10-6
• Probabilities: Failure => Success– P(A) = 0.0488*0.0488 = 0.0024 => 0.9976– P(B) = 0.0488*0.5654 = 0.0276 => 0.9724– P(C) = 0.0488* 1.0*10-4 = 4.8800e-006 => 0.99999512– P(D) = 0.0488* 1.0*10-6 = 4.8800e-008 => 0.9999999512– P(E) = 0.0488*0.5654 = 0.0276 => 0.9724– P(F) = 0.0488* 1.0*10-4 = 4.8800e-006 => 0.99999512– P(G) = 0.0488* 1.0*10-6 = 4.8800e-008 => 0.9999999512– P(Top) = 0.0576 => 0.9424
5180 Parkstone Drive Suite 260 Chantilly, VA 20151 (703) 378-8672 www.integrity-apps.com
FTA for Design Improvement
• Nearly 6% probability of top event• Worst case scenario:–A failure of either engine and a pilot error due to fatigue• How to improve design?–Pilot fatigue:
• Decrease flight time• Decrease fatigue rate
– Inappropriate Crew Response:• Automated systems (may introduce additional failures into fault tree)• Detailed procedures – possibly with audible alerts
– Improve engine reliability:• Requires FMEA/FMECA analysis to understand most common failures
– Introduce redundancy:• Additional engines• Reserve crew
5180 Parkstone Drive Suite 260 Chantilly, VA 20151 (703) 378-8672 www.integrity-apps.com
Summary
•FTA is useful in evaluating the safety and reliability of complex systems
•Helpful to focus limited resources• Identify critical components and combinations of critical events
•Methodical approach to evaluate system safety•Supports Probabilistic Risk Assessment to understand event likelihood
•Must be updated with system changes, component modifications, and refined statistical analysis
5180 Parkstone Drive Suite 260 Chantilly, VA 20151 (703) 378-8672 www.integrity-apps.com
References
• “Fault Tree Handbook with Aerospace Applications”, NASA: Office of Safety and Mission Assurance; August, 2002.
• “Improving the Continued Airworthiness of Civil Aircraft: A Strategy for the FAA’s Aircraft Certification Service”, National Research Council; National Academy Press, Washington, DC, 1998.