Embed Size (px)
Citation preview
Investigation 20A
Half-Life Experiment:
Coin Toss
2 Investigation 20A:Half-Life Experiment: Coin Toss
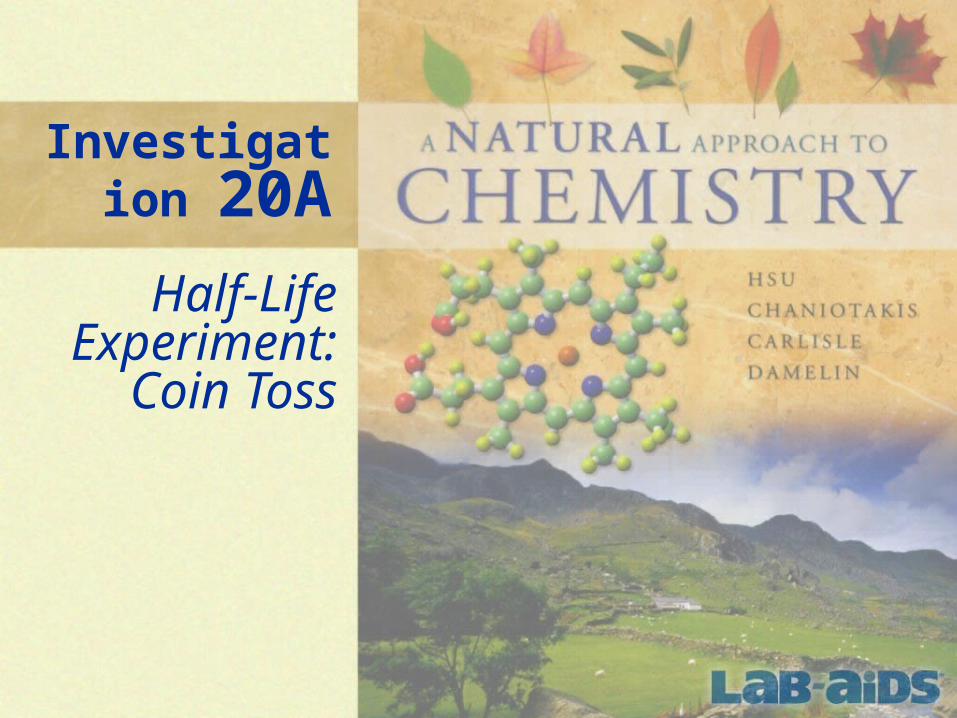
What is a half-life? What does it measure?
How can we determine the age of fossils?
3 Investigation 20A:Half-Life Experiment: Coin Toss
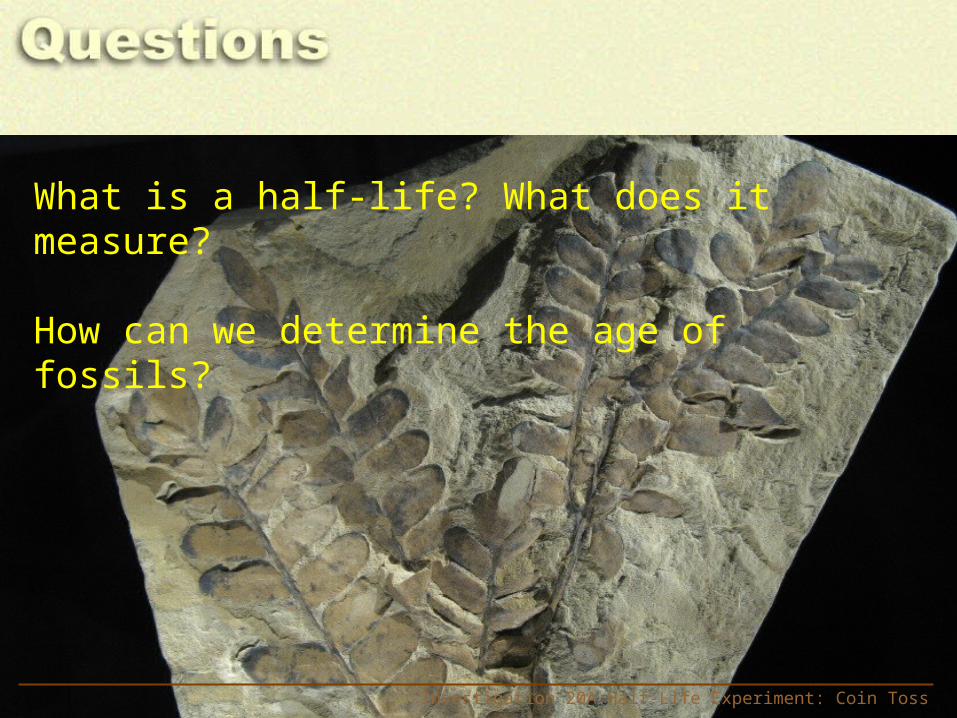
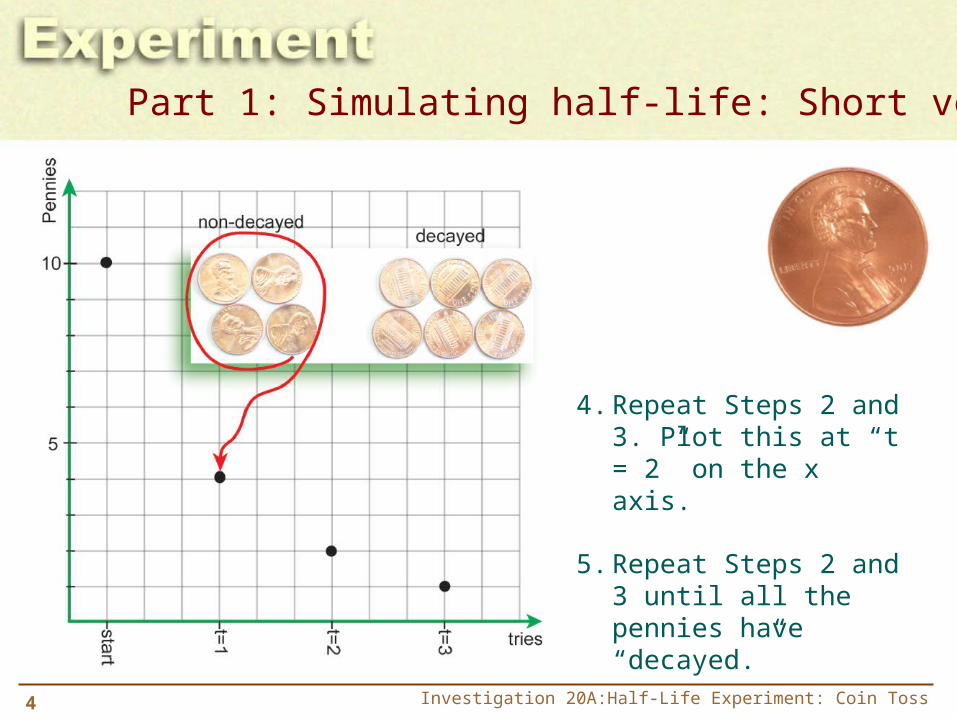
Part 1: Simulating half-life: Short version
1. Start with 10 pennies. Call this “t = 0” on your graph, and plot a “10” on the y axis.
2. Toss all 10 pennies on the ground or on the table. Remove all pennies that turn up tails. These will be the decayed atoms.
3. Count the remaining pennies and plot the number. This point will be at “t = 1” on the x axis.
This experiment is quite simple. It only involves flipping coins and graphing the results.
4 Investigation 20A:Half-Life Experiment: Coin Toss
Part 1: Simulating half-life: Short version
4. Repeat Steps 2 and 3. Plot this at “t = 2” on the x axis.
5. Repeat Steps 2 and 3 until all the pennies have “decayed.”
5 Investigation 20A:Half-Life Experiment: Coin Toss
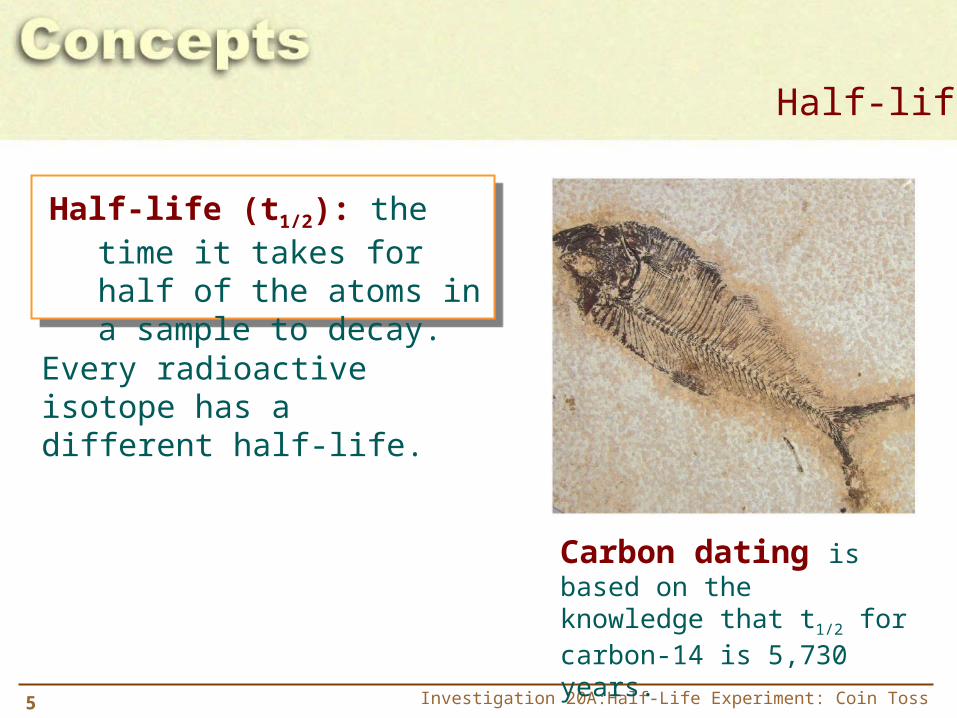
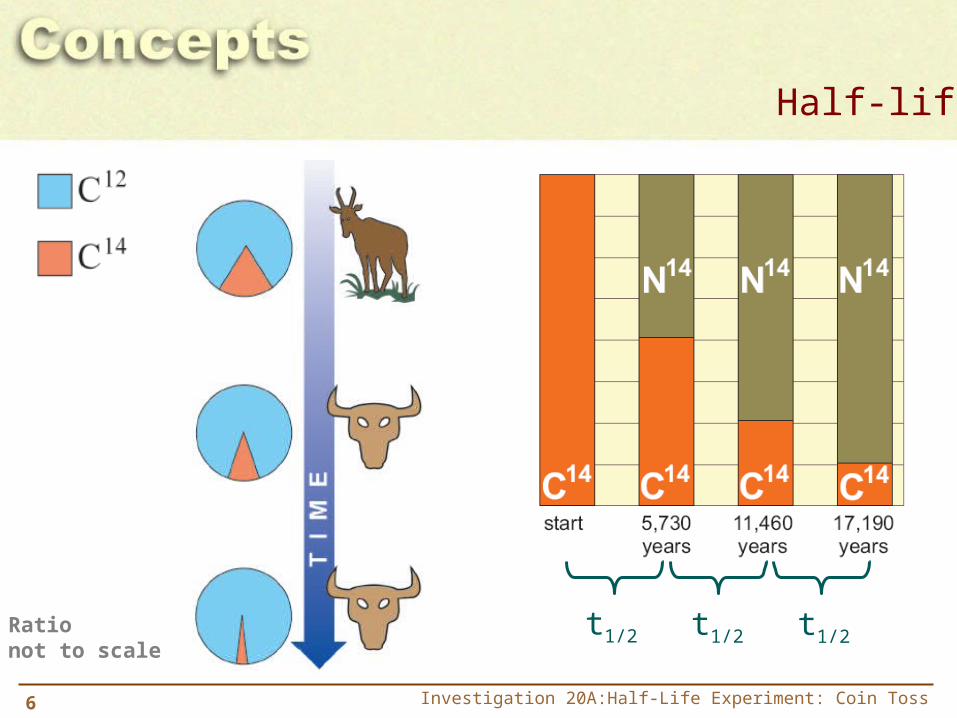
Half-life
Every radioactive isotope has a different half-life.
Carbon dating is based on the knowledge that t1/2 for carbon-14 is 5,730 years.
Half-life (t1/2): the time it takes for half of the atoms in a sample to decay.
6 Investigation 20A:Half-Life Experiment: Coin Toss
Half-life
Ratio not to scale
t1/2 t1/2 t1/2
7 Investigation 20A:Half-Life Experiment: Coin Toss
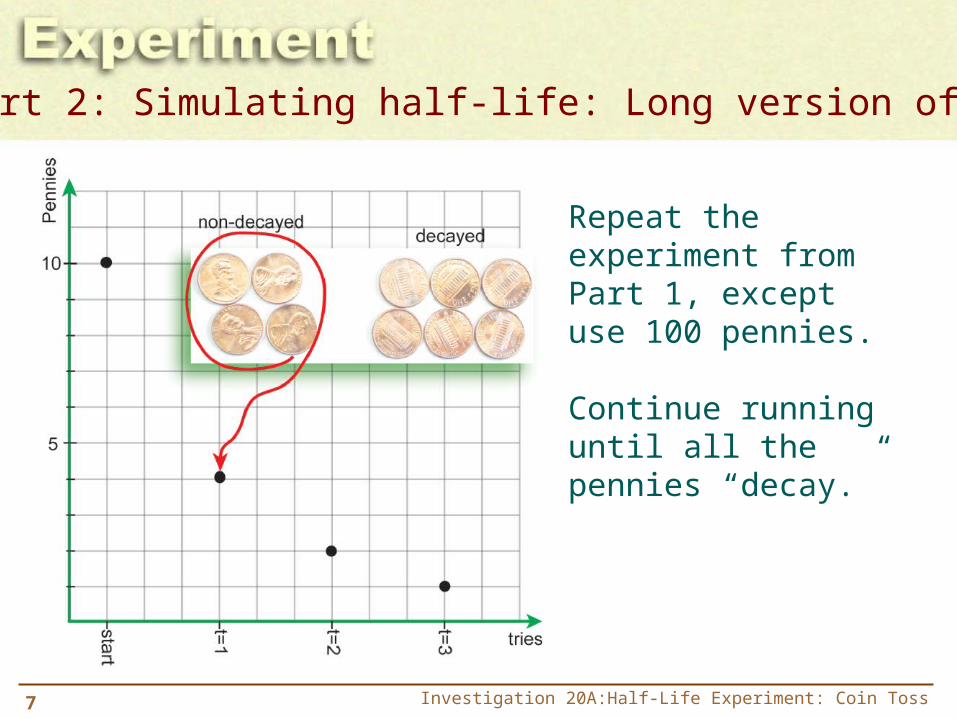
Part 2: Simulating half-life: Long version of Part 1
Repeat the experiment from Part 1, except use 100 pennies.
Continue running until all the pennies “decay.”
8 Investigation 20A:Half-Life Experiment: Coin Toss
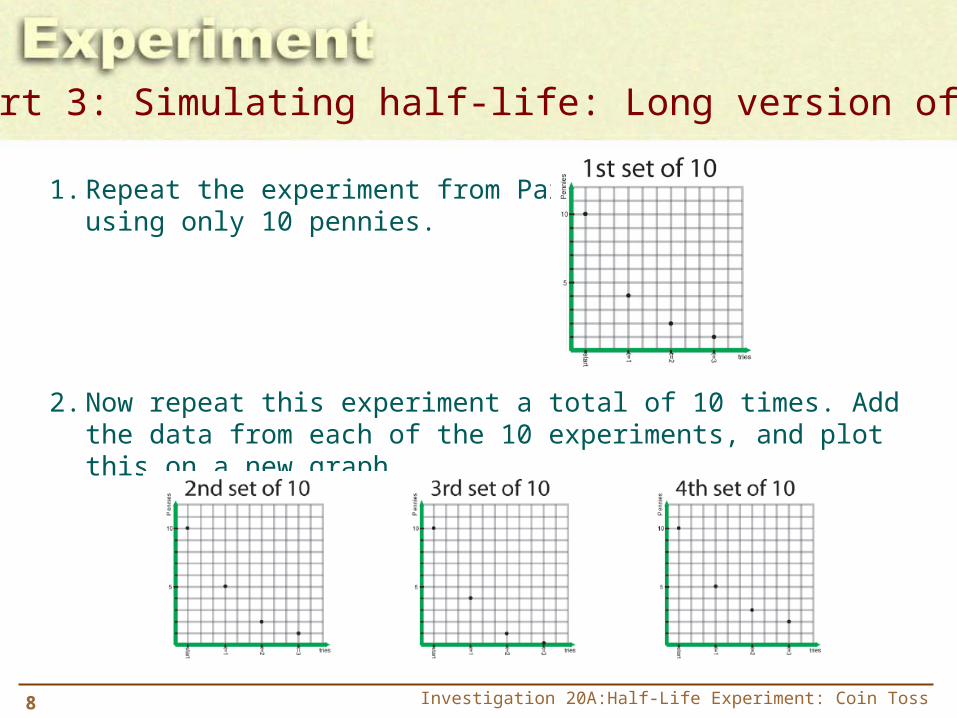
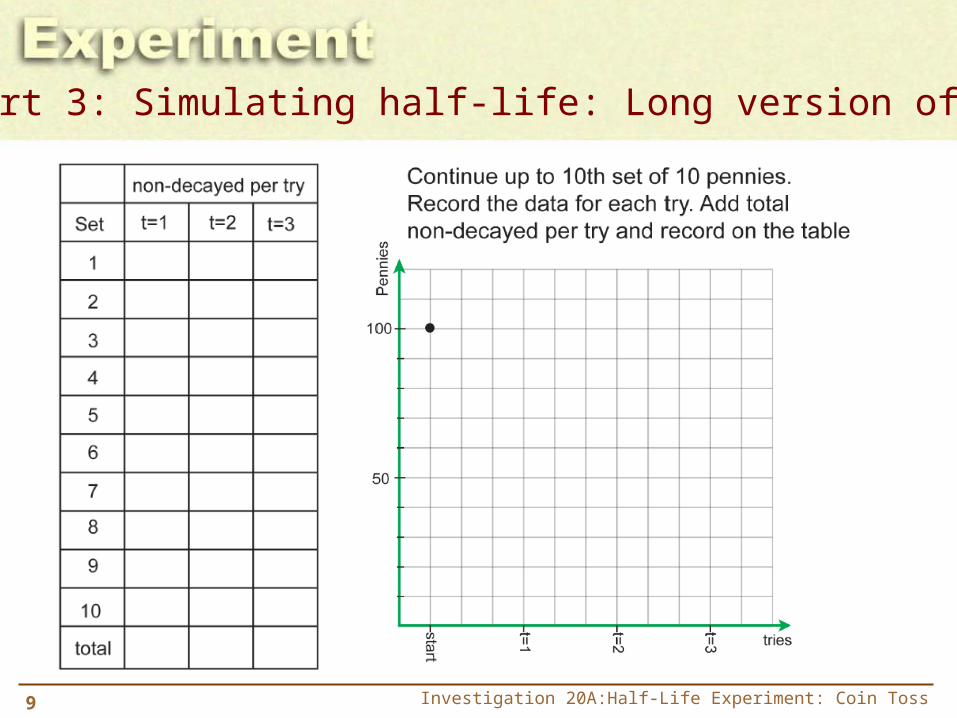
Part 3: Simulating half-life: Long version of Part 2
1. Repeat the experiment from Part 1, using only 10 pennies.
2. Now repeat this experiment a total of 10 times. Add the data from each of the 10 experiments, and plot this on a new graph.
9 Investigation 20A:Half-Life Experiment: Coin Toss
Part 3: Simulating half-life: Long version of Part 2
10 Investigation 20A:Half-Life Experiment: Coin Toss
Part 4: Thinking about what you have learned
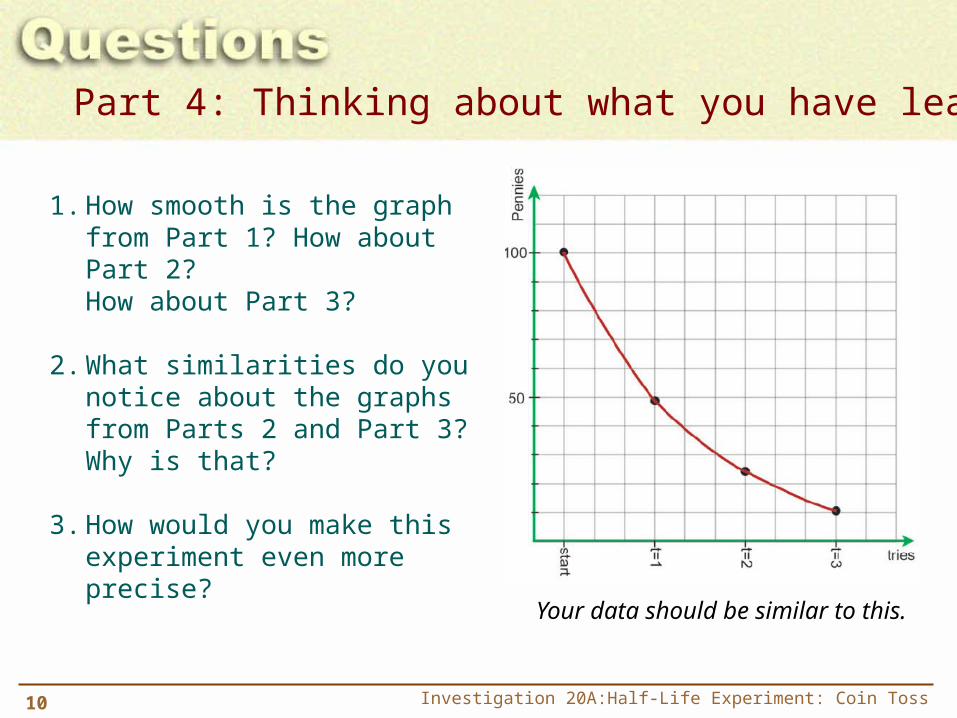
1. How smooth is the graph from Part 1? How about Part 2? How about Part 3?
2. What similarities do you notice about the graphs from Parts 2 and Part 3? Why is that?
3. How would you make this experiment even more precise?
Your data should be similar to this.
11 Investigation 20A:Half-Life Experiment: Coin Toss
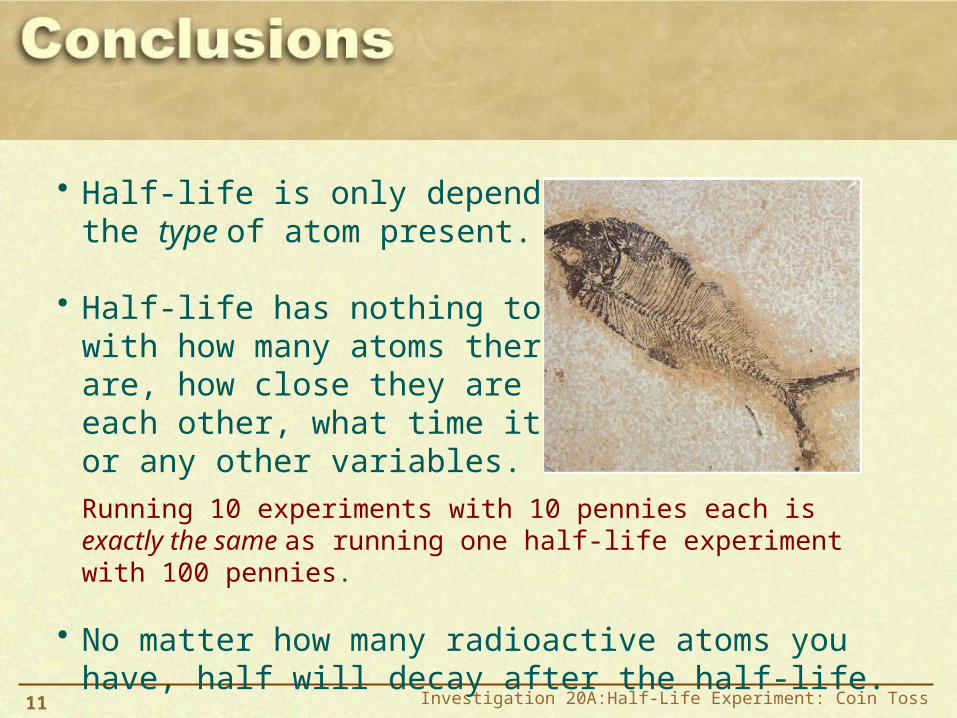
• Half-life is only dependent on the type of atom present.
• Half-life has nothing to do with how many atoms there are, how close they are to each other, what time it is, or any other variables.
Running 10 experiments with 10 pennies each is exactly the same as running one half-life experiment with 100 pennies.
• No matter how many radioactive atoms you have, half will decay after the half-life.
![arXiv:0811.0208v3 [math.AP] 13 Aug 2009 · BIASED TUG-OF-WAR AND THE BIASED INFINITY LAPLACIAN 3 Note that if the probability for player I to win a coin toss is 1+θ(ǫ) 2, then we](https://img.pdfslide.tips/doc/110x75/5f1dbd6792b54b5a00731ab8/arxiv08110208v3-mathap-13-aug-2009-biased-tug-of-war-and-the-biased-infinity.jpg)