Embed Size (px)
Citation preview

1
Investigation of internal structure of fine granules by microtomography using synchrotron
X-ray radiation
Shuji Noguchi a, Ryusuke Kajihara a, Yasunori Iwao a, Yukari Fujinami a, Yoshio Suzuki b,
Yasuko Terada b, Kentaro Uesugi b, Keiko Miura b and Shigeru Itai a *5
a School of Pharmaceutical Sciences, University of Shizuoka, 52-1 Yada, Suruga-ku, Shizuoka
422-8526, Japan
b Japan Synchrotron Radiation Research Institute, 1-1-1 Kouto, Sayo-gun, Hyogo 679-5198,
Japan10
* Corresponding author. E-mail: [email protected]; Tel: +81-54-246-5614; Fax:
+81-54-264-5615.
Abbreviations: APAP, acetaminophen; AMCE, aminoalkyl methacrylate copolymer E; BHX,
bromhexine hydrochloride; CT, computed tomography; DCPD, dibasic calcium phosphate 15
dihydrate; GM, glyceryl monostearate; HPC, hydroxypropyl cellulose; LAC, linear attenuation
coefficient; MC-wax, microcrystalline wax; SEM, scanning electron microscopy

2
Abstract20
Computed tomography (CT) using synchrotron X-ray radiation was evaluated as a
non-destructive structural analysis method for fine granules. Two kinds of granules have been
investigated: a bromhexine hydrochloride (BHX)-layered Celphere® CP-102 granule coated
with pH-sensitive polymer Kollicoat® Smartseal 30-D, and a wax-matrix granule constructed
from acetaminophen (APAP), dibasic calcium phosphate dehydrate, and aminoalkyl 25
methacrylate copolymer E (AMCE) manufactured by melt granulation. The diameters of both
granules were 200–300 μm. CT analysis of CP-102 granule could visualize the laminar
structures of BHX and Kollicoat layers, and also visualize the high talc-content regions in the
Kollicoat layer that could not be detected by scanning electron microscopy. Moreover, CT
analysis using X-ray energies above the absorption edge of Br specifically enhanced the contrast 30
in the BHX layer. As for granules manufactured by melt granulation, CT analysis revealed that
they had a small inner void space due to a uniform distribution of APAP and other excipients.
The distribution of AMCE revealed by CT analysis was also found to involve in the differences
of drug dissolution from the granules as described previously. These observations demonstrate
that CT analysis using synchrotron X-ray radiation is a powerful method for the detailed internal 35
structure analysis of fine granules.
Keywords: Computed tomography, synchrotron X-ray radiation, polymer-coated granule, melt
granulation.
40

3
1. Introduction
As the characteristics of a drug release from the granular formulation, for example
pH-dependent release of drugs, are closely related to the structure, structural information on
granules containing drugs is indispensable to elucidate the drug release mechanism and to
design new or more potent formulations. The structural information of granules containing 45
drugs includes the distribution of the drug or excipient particles, presence of void spaces,
thickness of the drug or polymer layers, and shape or even the roughness of the surface, and
various analytical methods have been applied to obtain these structures in detail. Scanning
electron microscopy (SEM) is the most widely used method to observe the surface structures of
granules. Raman spectroscopy has also been successfully used to reveal the distribution of drugs 50
and excipients (Gordon and McGoverin, 2010). However, these methods reveal only the
structural information about the surface or inner region just below the surface of the granules,
and in order to observe internal structures, samples must be cut or destroyed. In an investigation
by SEM, samples are placed under vacuum and deposited with a heavy metal such as platinum,
which can affect the surface structure of the sample. Although magnetic resonance imaging can55
reveal the internal structure of a drug formulation without destruction, it has been limited to
apply for tablets (Broadbent et al., 2010) owing to its low spatial resolution.
X-ray computed tomography (CT) can elucidate the three-dimensional structure of a
formulation non-destructively owing to the high penetration of X-ray, and has been applied to
the structural analysis of tablets (Li et al., 2012) and granules (Crean et al., 2010) with sizes60
ranging from centimeters to millimeters using an in-house X-ray generator. Recently,
high-quality X-ray micro CT analysis on sub-mm specimens has become possible with
submicrometer spatial resolution. This has been used on mineral samples from asteroids
(Tsuchiyama et al., 2011) using synchrotron X-ray radiation, which is extremely bright and

4
highly parallel and has a tunable energy. Although the synchrotron X-ray CT analysis of tablets65
(Laity and Cameron, 2010) and granules for tableting (Morita and Yamahara, 2006) has been
performed, it has not been applied to a structural analysis of fine granules such as
polymer-coated granules manufactured by agitation fluidized bed coating processes and
wax-matrix granules manufactured by melt granulation. These fine granules are thought to have
a layer structure of micro-meter order thickness under the surface or contain particles of70
micro-meter order diameters in their inside. Non-destructive and three-dimensional visualization
of these structural features would be best performed by synchrotron X-ray CT of
sub-micrometer spatial resolution. Fine granular formulations give a good mouth feel upon oral
administration when their diameters are 200 μm or less. Since fine granules are used in
orally-disintegrating tablets, the demands on the production of such drug-containing fine 75
granules are growing. We report here on the use of micro CT using synchrotron X-ray radiation
as a method for the non-destructive analysis of the internal structure of pharmaceutical granules
with 200–300 μm diameters.
2. Material and Methods80
2.1 Materials
Celphere® CP-102 was kindly provided by Asahi Kasei (Tokyo, Japan), acetaminophen
(APAP) by Iwaki Pharmaceutical Co., Ltd. (Shizuoka, Japan), Kollicoat® Smartseal 30D by
BASF Japan Ltd. (Tokyo, Japan), dibasic calcium phosphate dihydrate (DCPD) by Kimura
Sangyo Co., Ltd. (Tokyo, Japan), and microcrystalline wax (MC-wax) by Nippon Seiro Co., Ltd. 85
(Tokyo, Japan). Bromhexine hydrochloride (BHX) was purchased from Shiratori
Pharmaceuticals Inc. (Chiba, Japan), aminoalkyl methacrylate copolymer E (AMCE) from
Röhm Degussa (Darmstadt, Germany), and glyceryl monostearate (GM) from Taiyo chemical

5
Industry Co., Ltd. (Saitama, Japan). All reagents used were of the highest grade available from
the commercial source.90
2.2 Preparation of the fine granules
2.2.1 Polymer-coated fine granules
Eighty grams of BHX, 16 g of hydroxypropyl cellulose (HPC), and 4 g of polyethylene
glycol 6000 were mixed with 420 g of water and 280 g of ethanol. The mixture was 95
homogenized three times with a microfluidizer (M110-E/H, Powrex, Hyogo, Japan) at 175 MPa.
The homogenized solution was then layered onto 700 g of Celphere® CP-102 by side-spraying
in a fluidized-bed granulator MP-101 (Powrex, Hyogo, Japan). Layering conditions were as
follows: inlet air temperature, 50–55°C; air flow, 0.55 m3/min; product temperature, 28–29°C;
atomizing air pressure, 0.5 MPa; spray rate, 6 g/min. After spraying, the drug-layered granules 100
were dried under a flow of air at 28°C for 10 min. The granules were sieved through a 210-μm
mesh.
For a polymer coating, the solution containing 200 g of Kollicoat® Smartseal 30D, 9 g of
triethyl citrate, 48 g of talc and 343 g of water was mixed with vigorous stirring for 10 min. Five
hundred grams of this Kollicoat® solution was sprayed onto the 500 g of the BHX-layered 105
granules by fluidized-bed granulator side-spraying under the same conditions as above except
that the spray rate was decreased to 4 g/min. After Kollicoat coating, a solution containing 12 g
of D-mannitol, 0.08 g of HPC-L, and 88 g of water was then sprayed under the same conditions
to prevent the aggregation of the polymer-coated granules, and they were dried in a flow of air
at 28°C for 10 min. The granules thus obtained were sieved through a 250-μm mesh.110
2.2.2 Granules with pH-dependent release by melt granulation

6
Granules for pH-dependent release were prepared by the method of Shiino et al. (2012). In
short, a mixture of APAP and DCPD was processed in a sample mill (Tl-300, Cosmic
Mechanical Technology Co., Ltd., Fukushima, Japan) and sieved through a 149-μm mesh. One 115
hundred eleven grams of an APAP/DCPD mixture, 15 g of AMCE, 12 g of GM, and 12 g of
MC-wax were put into a high-shear mixer (MECHANOMiLL, Okada Seiko Co., Ltd., Tokyo,
Japan), and the melt granulation was performed with an impeller speed of 1200 rpm and a
temperature of a jacket rubber heater set to 85°C. When the temperature of the mixture reached
to 75°C, heating was stopped, and mixing was continued for 2 min at a reduced impeller speed 120
of 400 rpm. After the product granules were cooled by spreading in a metal tray for 4 min,
additional granulation was performed for 1 min at an impeller speed of 400 rpm at room
temperature.
2.3 Synchrotron X-ray CT measurement125
The granules were placed in Lindemann glass capillaries 0.2–0.3 mm in diameter. X-ray CT
measurements were performed using a micro-CT instrument (Uesugi et al., 2012; Suzuki et al.,
2011) installed at the undulator beam line BL37XU of SPring-8 (Hyogo, Japan). The X-ray
energy was set to 8 keV, and flux density was approximately 6×10¹² photons/s/mm2. In the case
of the polymer-coated granules, CT measurements were also made at 15 keV X-ray. The flux 130
density at 15 keV was estimated to be approximately 60% of that at 8 keV, based on the
sensitivity and the scintillator thickness of the area detector. Nine hundred transmission X-ray
images, in a parallel projection geometry, were recorded in 0.2° steps with continuous rotation
of the sample (on-the-fly scan mode). During the measurement, the sample was irradiated with
X-ray continuously, and the exposure time for each projection was 150 ms. Sample to area 135
detector distance was 2 mm. CT measurement of one sample was accomplished within 5 min.

7
All the CT measurements were performed at room temperature. Tomographic reconstruction
was performed by the convolution back projection method using the CBP package (Uesugi et al.,
2004), and 1920 × 1920 pixel cross-sectional images were obtained. One pixel is equivalent to
0.444 μm × 0.444 μm. 3-D analyses of the cross-sectional images were performed using SLICE140
package (Nakano et al., 2006) and ImageJ (Schneider et al., 2012). X-ray linear attenuation
coefficients (LAC) values between 0 and 70 are shown in 8 bit grayscale in the images of
polymer-coated granules, with LAC value 70 and higher as white. In the case of wax-matrix
granules by melt granulation, LAC values between 0 and 130 are shown in 8 bit grayscale.
LACs of drugs and excipients were calculated using the software MU_3 (Kato, 2011; Hubbell 145
and Seltzer, 1996). The LAC values as a function of X-ray energy are shown in Fig. 1.
2.4 Scanning electron microscopy
The surface structure of the polymer-coated fine granules were morphologically assessed by
SEM (Model: JSM-5310LV; JEOL Ltd., Tokyo, Japan). The samples were placed on150
double-sided adhesive tape and were sputter-coated with platinum under vacuum prior to
imaging.
3. Results and Discussion
3.1. Structure of polymer-coated granules155
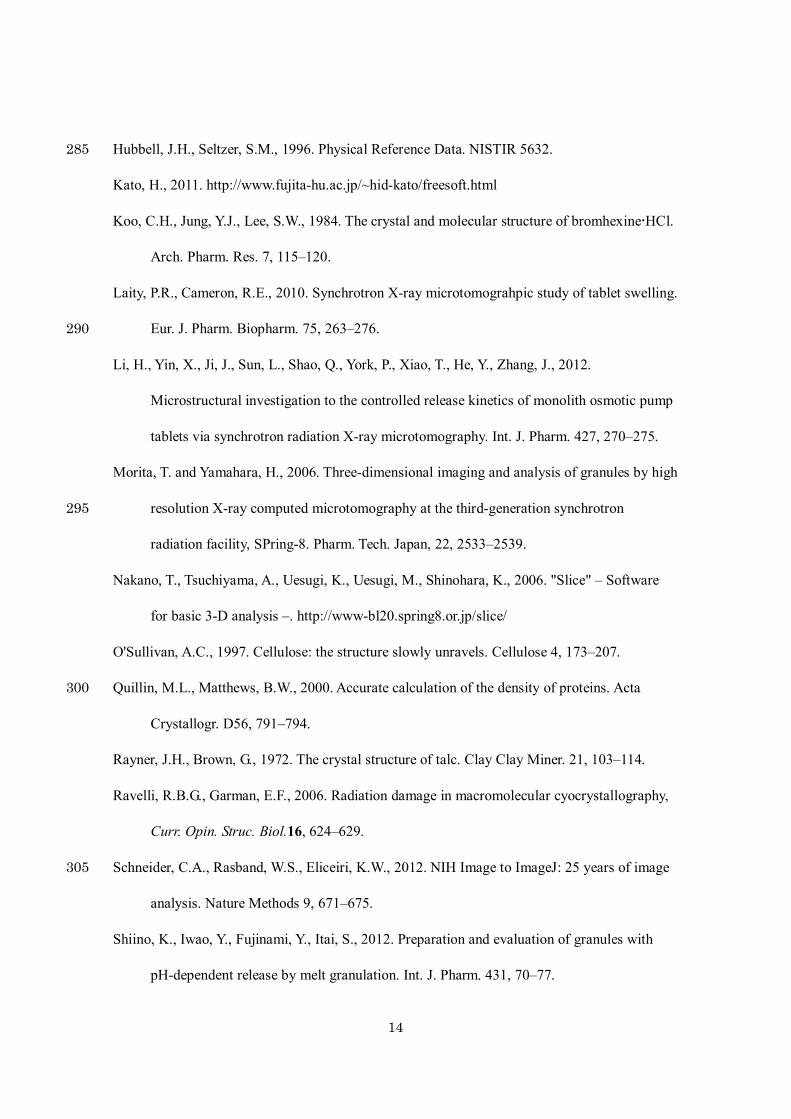
In the cross-sectional image of the polymer coated granule, laminar structures of BHX with
higher LAC values and outer Kollicoat layers are clearly observed at the surface of the cellulose
core particle CP-102, as shown in Fig. 2a. The thicknesses of the BHX layer and Kollicoat
coatings were approximately 2–5 μm and 5–10 μm, respectively. Although the mannitol was
sprayed onto the granules over the Kollicoat layer, the mannitol layer cannot be recognized, 160

8
possibly because the amount of mannitol was only one tenth the amount of the Kollicoat. The
boundary between the cellulose core particle and BHX layer is somewhat smeared. This is
probably because the BHX-dispersed solution containing ethanol might soak into the cellulose
core when the solution was sprayed. The Kollicoat layer contains regions with high LAC values,
which indicates they consist of talc (Fig. 1). They are 1–2 μm in thickness and 5–10 μm in 165
diameter. The presence of these high talc-containing regions in the Kollicoat layer indicate that
the talc was not completely dispersed in the Kollicoat mixture solution in spite of the vigorous
stirring and sprayed at high pressure. Such regions with high talc content are exposed to the
surface of the granules, as shown in Fig. 2b. Since talc is highly wettable, the regions might
disintegrate rapidly when the granules are in contact with outer solution, resulting in the 170
formation of regions with a thin polymer-coating or even pores, especially where the polymer
layer is thin. These would impede the function of the polymer layers. The presence of the high
talc regions cannot be detected in SEM image (Fig. 2c), because there is little difference in the
surface asperity of a talc-exposed region and a Kollicoat-layered region. This demonstrates
X-ray CT analysis might predominate over SEM even in the analysis of the surface structure of 175
fine granule.
Talc in Kollicoat layer and BHX can be distinguished based on contrast: their X-ray LAC
values at 8 keV are 75.5 cm-1 for BHX and 85.6 cm-1 for talc. The difference in the contrast can
be enhanced by doing the X-ray CT measurement at 15 keV, above the K absorption edge of
bromine (13.473 keV). At 15 keV, the LAC of BHX was 73.5 cm-1, whereas that of talc has a 180
much smaller value of 13.7 cm-1. In the cross-sectional image obtained using 15 keV X-ray, the
BHX layer is recognized as a high LAC values region as in 8-keV cross-sectional images,
whereas talc in Kollicoat layer is dark, in accordance with its lower LAC values (Fig. 2d). This
demonstrates that by setting the X-ray energies above and below the absorption edge of the

9
element of interest, X-ray CT using synchrotron radiation can visualize the internal distribution 185
of drugs or excipients containing a specific element in fine granules.
The color of sample became a pale-brown after two-successive CT measurement (Fig. 3a).
This might imply that some part of the material in the granule had decomposed by the intense
synchrotron X-ray radiation (Borek et al., 2007; Ennifar et al., 2002; Ravelli and Garman, 2006).
During the CT measurement at 8 keV, the sample and the glass capillary are exposed to 190
approximately 5 × 10¹³ photons, across a diameter of 250 μm. Figs. 3b and c show the
cross-sectional and surface images of the same formulation for two successive CT
measurements. X-ray would be absorbed more in materials with high LAC values, that is, the
layers containing BHX or talc. However, little structural differences are found in these layers or
other part of the granule. No discernible alternation of the surface structure was also observed195
between SEM images of granules that had or had not been subjected to CT measurement (Figs.
2c and e). These images indicate that any structural changes caused by radiation damage are
negligible, although the color change does indicate some changes. If the structural changes were
caused by intense synchrotron X-ray during the CT measurements, the cross-sectional images
would be distorted (Barett & Keat, 2004). No distortion was observed in the cross-sectional 200
images of the granules shown in Fig. 3. This also indicates that the structural change during CT
measurement is negligible. Since the X-ray flux density and LAC values of any excipient other
than BHX at 15 keV is lower than that at 8 keV, any radiation damage during CT measurement
using 15 keV X-ray can also be assumed to be negligible.
205
3.2. Structure of granule with pH-dependent release by melt granulation
Images of a granule prepared by melt granulation are shown in Fig. 4. In the cross-sectional
image (Fig. 4a), the granule can be divided into three groups based on the LAC values.

10
Sharp-edged regions with the highest LAC values are DCPD particles. DCPD has a highest
calculated LAC value, 140 cm-1, among the ingredients of this formulation. The maximum 210
diameter of the DCPD particles is approximately 70 μm, and fine particles with sub-micrometer
diameter can be also recognized. Between the DCPD particles, regions that have either
intermediate or low LAC values are present. The former may be GM and MC-wax, and the
latter, indicated by arrows A and B in Fig. 4a, may be APAP and AMCE. Void spaces are rare
inside the formulation, indicating that highly dense granules could be manufactured by this melt 215
granulation method. GM and MC-wax are indistinguishable, because the difference in their
LAC values is small owing to their similar elemental composition and would be thoroughly
mixed together while melted during the melt granulation process. Fine particles of DCPD with
diameters less than the pixel size in the cross-sectional image (0.444 μm) may be well-dispersed
in the melted waxes during the melt granulation process, giving a LAC value higher than the 220
pure wax. APAP or AMCE particles does not melt throughout the granulation process and have
small pores or cracks where fine particles of DCPD can penetrate, which leaves the LAC values
unchanged. This could explain why particles of AMCE and APAP are observed in the lower
LAC value regions more than other excipients in the cross-sectional images of this granule.
Although there is little contrast difference between AMCE and APAP, they can be distinguished225
based on their morphology. Particles with sharp edges, as indicated by arrow A in Fig. 4a,
should be a hard APAP crystal, and the particle deformed plastically by DCPD, as indicated by
arrow B in Fig. 4a, should be the softer AMCE. Particles of DCPD, APAP, and AMCE are
exposed on the surface of the granule (Fig. 4b–d). Indentations are found sporadically in the
wax regions as indicated by arrow C in Fig. 4a, and are thought to be formed when the hard 230
particles of DCPD or APAP slipped off the surface owing to collision or friction with the other
granules during the mixing in the high-shear mixer.

11
Previously, when these granules were used in the dissolution test (paddle method listed in the
Japanese Pharmacopoeia XVI) at pH 4.0 (0.1 M acetate buffer) and 37.0±0.5°C for 120
minutes, large cracks form on the surface of the granules as observed by SEM, which are 20–50235
μm in width (Shiino et al., 2012). These cracks formed on the dissolution of AMCE, as no crack
formation is observed in a granule without AMCE. This is consistent with the structure of the
granule as revealed by CT analysis, because cracks of that size would form when the AMCE
and APAP dissolves and DCPD particles come unstuck from the granule. The structure revealed
by CT analysis also suggests that the particle size of AMCE determines the morphology of the 240
granules upon dissolution. When the granules are prepared using AMCE with the diameter
smaller than those of APAP and DCPD, not large cracks but smaller pores might form on the
surface upon dissolution at pH 4.0, which would increase the surface area and result in an
enhanced pH dependence of the granules.
245
4. Conclusion
We have applied CT using synchrotron X-ray radiation for the structural analysis of two kinds
of fine granules containing drugs. The structural information obtained by CT analyses revealed
the layer structures and the drug and excipients distribution inside the granules as well as on the
surface. Drugs, containing bromine, could be clearly visualized in the cross-sectional image by 250
CT measurement using an X-ray energy above its absorption edge. This is possible only using
wavelength-tunable synchrotron X-ray radiation. This study demonstrates the high potency of
CT using synchrotron radiation to obtain structural information on fine granules, which will
improve their functionality and, moreover, aid the design of new fine granular formulations.
255
Acknowledgment

12
The synchrotron radiation experiments at BL37XU were performed with the approval of the
Japan Synchrotron Radiation Research Institute (JASRI; Proposal No. 2012A1670).
260

13
References
Barrett, J.F., Keat, N., 2004. Artifacts in CT: recognition and avoidance. Radiographics, 24,
1679–1691.
Beevers, C.A., 1958. The crystal structure of dicalcium phosphate dihydrate, CaHPO42H2O.
Acta Crystallogr. 11, 273–277.265
Borek, D., Ginell, S.L., Cymborowski, M., Minor, W. Otwinowski, Z., 2006. The many faces of
radiation-induced changes. J. Synchrotron Rad. 14, 24–33.
Botez, C.E., Stephens, P.W., 2003. Crystal structure of anhydrous δ-D-mannitol. Powder Diffr.
18, 214–218.
Broadbent, A. L., Fell, R. J., Codd, S. L., Kim, A. L., Konagurthu, S., Koehler-King, D. G., 270
Seymour, J. D., 2010. Magnetic resonance imaging and relaxometry to study water
transport mechanisms in a commercially available gastrointestinal therapeutic system
(GITS) tablet. Int. J. Pharm. 397, 27–35.
Crean, B., Parker, A., Le Roux, D., Perkins, M., Luk, S., Banks, S., Melia, C., Roberts, C., 2010.
Elucidation of the internal physical and chemical microstructure of pharmaceutical 275
granules using X-ray micro-computed tomography, Raman microscopy and infrared
spectroscopy. Eur. J. Pharm. Biopharm. 76, 498–506.
Ennifar, E., Carpentier, P., Ferrer, J.-L, Walter, P., Dumas, P., 2002. X-ray-induced
debromination of nucleic acids at the Br K absorption edge and implications for MAD
phasing. Acta Crystallogr. D58, 1262–1268.280
Gordon, K.C., McGoverin, C.M., 2010. Raman mapping of pharmaceuticals. Int. J. Pharm. 417,
151–162.
Haisa, M., Kashino, S., Kawai, R., Maeda, H., 1976. The monoclinic form of
p-hydroxyacetamide. Acta Crystallogr. B32, 1283.
14
Hubbell, J.H., Seltzer, S.M., 1996. Physical Reference Data. NISTIR 5632.285
Kato, H., 2011. http://www.fujita-hu.ac.jp/~hid-kato/freesoft.html
Koo, C.H., Jung, Y.J., Lee, S.W., 1984. The crystal and molecular structure of bromhexineHCl.
Arch. Pharm. Res. 7, 115–120.
Laity, P.R., Cameron, R.E., 2010. Synchrotron X-ray microtomograhpic study of tablet swelling.
Eur. J. Pharm. Biopharm. 75, 263–276.290
Li, H., Yin, X., Ji, J., Sun, L., Shao, Q., York, P., Xiao, T., He, Y., Zhang, J., 2012.
Microstructural investigation to the controlled release kinetics of monolith osmotic pump
tablets via synchrotron radiation X-ray microtomography. Int. J. Pharm. 427, 270–275.
Morita, T. and Yamahara, H., 2006. Three-dimensional imaging and analysis of granules by high
resolution X-ray computed microtomography at the third-generation synchrotron 295
radiation facility, SPring-8. Pharm. Tech. Japan, 22, 2533–2539.
Nakano, T., Tsuchiyama, A., Uesugi, K., Uesugi, M., Shinohara, K., 2006. "Slice" – Software
for basic 3-D analysis –. http://www-bl20.spring8.or.jp/slice/
O'Sullivan, A.C., 1997. Cellulose: the structure slowly unravels. Cellulose 4, 173–207.
Quillin, M.L., Matthews, B.W., 2000. Accurate calculation of the density of proteins. Acta 300
Crystallogr. D56, 791–794.
Rayner, J.H., Brown, G., 1972. The crystal structure of talc. Clay Clay Miner. 21, 103–114.
Ravelli, R.B.G., Garman, E.F., 2006. Radiation damage in macromolecular cyocrystallography,
Curr. Opin. Struc. Biol.16, 624–629.
Schneider, C.A., Rasband, W.S., Eliceiri, K.W., 2012. NIH Image to ImageJ: 25 years of image305
analysis. Nature Methods 9, 671–675.
Shiino, K., Iwao, Y., Fujinami, Y., Itai, S., 2012. Preparation and evaluation of granules with
pH-dependent release by melt granulation. Int. J. Pharm. 431, 70–77.

15
Suzuki, Y., Takeuchi, A., Uesugi, K., 2011. Current status of microtomography with synchrotron
radiation X-ray source. J. Vac. Soc. Jpn. 54, 47–55.310
Tsuchiyama, A., Uesugi, M., Matsushima, T., Michikami, T., et al., 2011. Three-dimensional
structure of Hayabusa samples: Origin and evolution of Itokawa regolith. Science, 333,
1125–1128.
Uesugi, K., 2004. http://www-bl20.spring8.or.jp/xct/index.html
Uesugi, K., Hoshino, M., Takeuchi, A., Suzuki, Y., Yagi, N., 2012. Development of fast and high 315
throughput tomography using CMOS image detector at SPring-8. SPIE Proceedings, in
press.

16
Figure captions
Figure 1. Calculated LAC values of the drugs and excipients as a function of X-ray energy. In 320
the calculation of LAC, the following densities were used: APAP 1.30 g/cm3 (Haisa et al, 1976),
BHX 1.62 g/cm3 (Koo et al., 1984), crystalline cellulose 1.59 g/cm3 (O'Sullivan, A.C., 1997),
talc 2.76 g/cm3 (Rayner and Brown, 1972), D-mannitol (β-form) 1.39 g/cm3 (Botez and
Stephens, 2003), GM 0.97 g/cm3 and DCPD 2.32 g/cm3 (Beevers, 1958). As the density of
AMCE is not reported, the average calculated density of biopolymer protein, 1.47 g/cm3325
(Quillin and Matthews, 2000), was tentatively used. X-ray energies used in the CT
measurements are indicated by vertical dotted lines.
Figure 2. Images of polymer-coated granules. (a) Cross-sectional and (b) surface images by CT
measurement at 8 keV. BHX layer, Kollicoat layer and some of the high talc-content regions are 330
indicated by arrows. Images of capillary were removed for clarity. (c) Surface image by SEM.
(d) Cross-sectional images by CT measurement at 15 keV. (a)–(d) are the same granule. (e)
SEM image of a granule not subjected to CT measurement.
Figure 3. (a) Microspcopic images of polymer-coated granules before CT measurement (left) 335
and after two-successive CT measurements (right). (b) Cross-sectional surface image by 1st CT
measurement at 8 keV. (c) is repeats of the same CT measurements. The edge of the trimmed
regions are shown with white lines for clarity. (a)–(c) are the same granules. The small rods
observed at the surface of the granule are the fragments of glass that were already present in the
capillary.340
Figure 4. Images of a granule manufactured by melt granulation. (a) Cross-sectional and (b)–(d)

17
surface images by CT measurement at 8 keV. The position of cross-sectional image (a) is shown
by dotted arrows in (c) and (d).

Figure 1
50 μm
50 μm
Figure 2
Kollicoatlayer
BHX layer
Talc
(b)
(a)
Talc

(c)
(d)
Figure 2
50 μmBHX layer

Figure 2
(e)
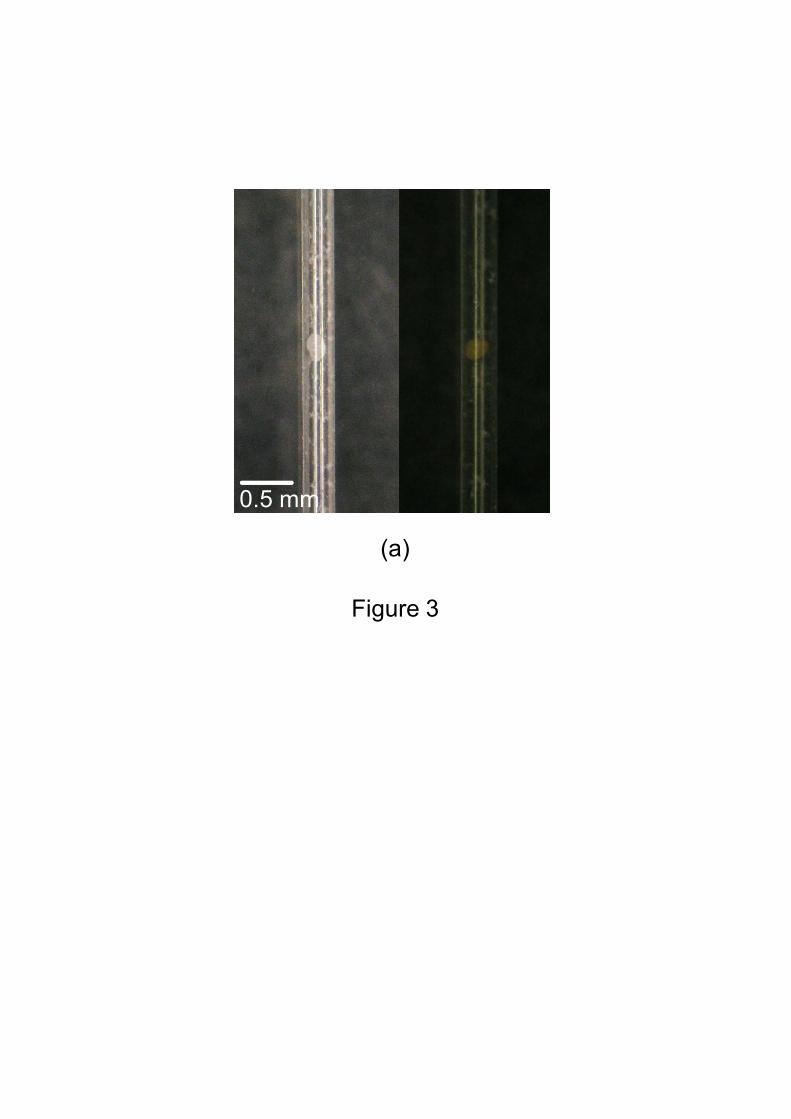
Figure 3
(a)
0.5 mm

50 μm
Figure 3
(c)
(b)
50 μm
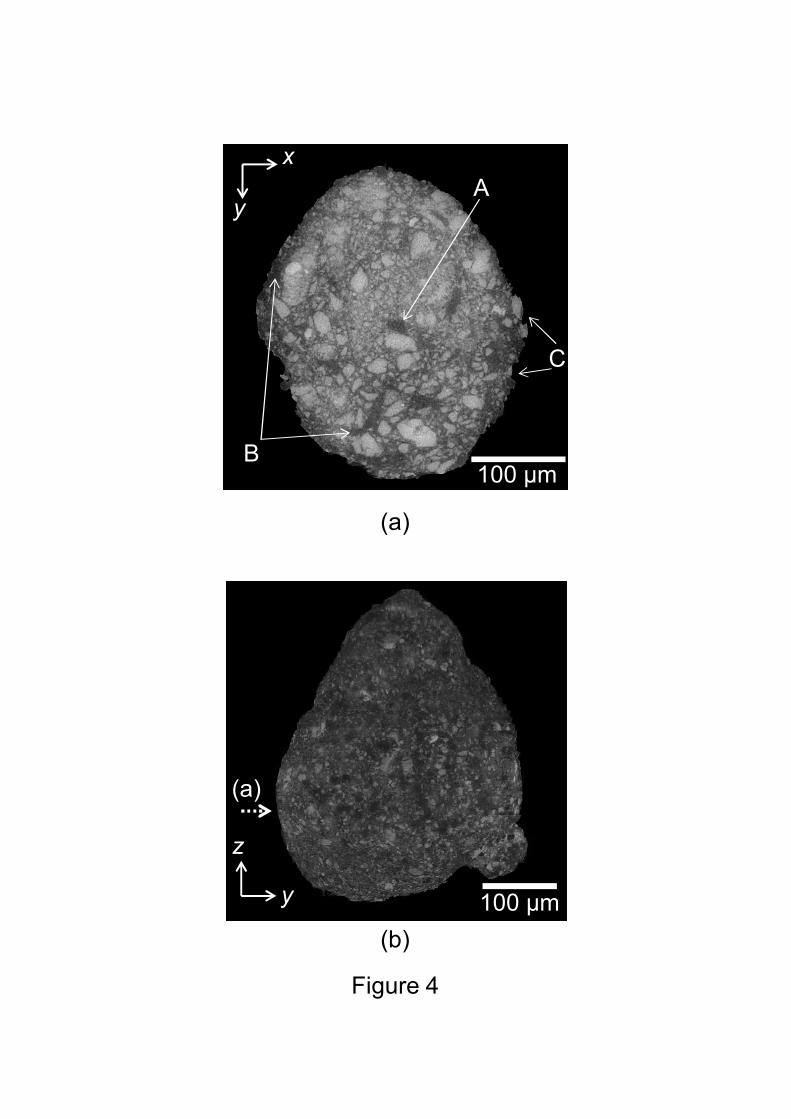
Figure 4
(b)
100 μm
A
B
C
100 μm
(a)
y
z
x
y
(a)

100 μmx
z
(c)
100 μm
x
y
Figure 4
(d)
(a)