Embed Size (px)
Citation preview

EasyChair Preprint№ 2696
Investigation of Plastic Hinge Length forReinforced Concrete Wall
Doaa Talib Hashim, Alyaa A. Al-Attar and Nabeel A. H. Kzar
EasyChair preprints are intended for rapiddissemination of research results and areintegrated with the rest of EasyChair.
February 18, 2020

Investigation of Plastic Hinge Length for Reinforced
Concrete Wall
Doaa Talib Hashim 1, Alyaa A. Al-Attar2, Nabeel A. H. Kzar3
{[email protected], [email protected],
Mustansiriyah University, Baghdad, Iraq1, Northen Technical University, Mosul, Iraq2, Holy Karbala
Municipalities, Hindiya Municipality, Karbala, Iraq3
Abstract. This study investigates the effect of certain parameters on the magnitude of
plastic hinge length of RC shear walls and to propose an analytical expression for
estimating the plastic hinge length. A finite element model was analyzed and validated
with experimental test results for an existing study and a parametric study was performed
for it. The established results were according to several parameters such as axial load ratio,
slenderness ratio and wall length. The numerical results showed a different impact of these
parameters on the formation of the plastic hinge length. In this study, a new simple
expression was derived based on those parameters using statistical package software.
Proposed plastic hinge expression was compared with the results of plastic hinge length
obtained from FE analysis. Finally, the accuracy of the proposed equation was validated
by using the shear wall results from literature researches.
Keywords: Plastic hinge length, Finite Element Analysis, Reinforced shear wall,
Parametric study.

1 Introduction
Reinforced concrete (RC) shear walls are structural elements often used in buildings to provide
lateral resistance and stiffness against earthquake and wind loads. These shear walls necessitate
sufficient flexural displacement capacity and strength to have an acceptable seismic behavior.
The determination of amount and location of plastic deformations in RC shear wall considered
a significant step for describing the performance of the shear wall building system in seismic
loading. Although it was possible to consider that some ductility will be provided by beam
hinges in structural systems, some rotational capacity of the reinforced concrete shear wall
exists.
Many researchers have developed empirical models to investigate the parameters that affect the
magnitude of plastic hinge region and to derive equations to calculate the length of plastic hinge
in reinforced concrete elements depending on test results. These models are calibrated to obtain
the total displacement at failure. Different parameters were considered in these models and each
provides considerably different predictions. The influence of the member dimensions, the span
length of the member and the longitudinal reinforcement properties were more considered by
most of the previous researches. In addition, the influence of the axial load ratio and strain
hardening were also studied. It is still unclear as to the most pertinent parameters that affect the
plastic hinge length.
The plastic hinge length that is proportioned to the member’s dimensions and axial load ratio
was considered in many of these models. The shear wall dimensions have a large influence on
deformations of slender shear walls that may be local or entire out of plane buckling especially
for those that have low wall thickness. Moreover, out of plane buckling occurred at the base of
the shear wall when high axial load applied to the shear walls.
The plastic hinge method and the derived analysis are still used widely in displacement-based
seismic design and performance evaluation procedures for estimating the inelastic displacement
demand and capacity [1].(Moehle, 1992) .
Although it was supposed that the inelastic curvature in the plastic region has a little variation,
it is invariant along the plastic hinge length, Lp. The plastic curvature can be can calculated by
the total curvature as shown in equation (1). Where ∅y is yield curvature. By integrating the
inelastic curvature, the inelastic rotation will be as shown in equation (2). Besides, by integrating
the inelastic rotation, the inelastic displacement after considering the net height is shown in
equation (3).

∅p=∅- ∅y (1)
θp=∅p Lp (2)
Ln= L-Lp
2 (3)
∆p=θp Ln (4)
∆p=(∅-∅y ) Lp [L-Lp
2] (5)
After combine equations 1 and 5 the total displacement is shown in equation (6). By integrating
the elastic curvature, the yield displacement can be established. It was assumed that the elastic
curvature linear (equation 7). As a result, the total displacement is as shown in euation (8)
∆f=∆y+∆p=∆y+(∅-∅y ) Lp [L-Lp
2] (6)
∆y=∅𝑦𝐿2
3 (7)
∆=(∅𝑦𝐿2
3+(∅-∅y) Lp [L-
Lp
2] (8)
By neglecting the shear deformation
∆=∆f+∆sp (9)
∆sp=2
3 ∅e Lsp hw (10)

Lsp= 0.15 fy dbl (11)
The shear deformation in slender concrete walls was estimated using the experiential equation
was developed [2]. This experiential equation was formulate based on a series of experimental
and analytical studies of slender RC walls under seismic loading as shown in the following
equtions (12) and (13).
∆sh=1.5 ∆f [εm
∅tanβ]
1
ℎ𝑤 (12)
∆u=∆f+∆sp+∆sh=(1
3 ∅e ℎ𝑤
2 +2
3 ∅e Lsp hw+∅p Lp hw )(1+1.5(
εm
∅tan β))
1
ℎ𝑤) (13)
Traditional plastic hinge analysis is depended on the theory of an elasto-plastic behavior and an
equivalent length of plastic hinge. The yield curvature used in equation (5) can be determined
considering that the moment-curvature relationship in the plastic hinge zone is elasto-plastic
[3]. This approximation depended on the actual shape of the moment-curvature relationship.
Figure 1 shows the equivalent yield curvature for a shear wall.
Fig. 1. Schematic moment-curvature curve for the cross section of an elasto-plastic material according to
the approximation [3].

Many of studied investigated the effect of the member depth on the plastic hinge length. They
found that it has a significant impact on the length of plastic hinge. Besides, [4] investigated the
plastic distortions of hinges in concrete frames. He showed that a safe estimation of the plastic
hinge length in columns was between 0.5h and h. Where, h: is the depth of column. Through
the progress report on code clauses for "Limit Design" [5], suggested lower and upper bounds
for the plastic hinge length in beams and frames.
In addition, it was suggested an expression to calculate the plastic hinge length for RC
components [6]. Equivalent length of plastic-hinge can be assumed to be as one-half the element
depth. Where Lw is the wall length. Moreover, it has been proposed equivalent plastic hinge that
can set to be at 0.2 times the wall length, Lw, plus 0.07 times the moment-to-shear ratio ( M/V)
(equation 14) [7].
Lp=0.2 Lw+0.07(M⁄V) (14)
Besides, it has been proposed an expression to calculate the plastic hinge length in Eurocode 8
as shown in equation (15). Where: Lv = shear span (moment-shear ratio, M/V), dbl = (mean)
diameter of the tension reinforcement, fy and f'c are yield stress of the longitudinal
reinforcement and compressive strength of the concrete, respectively [8].
𝐿𝑃 =𝐿𝑣
30+ 0.2𝐿𝑤 +
𝑑𝑏𝑙 𝑓𝑦(𝑀𝑃𝑎)
√𝑓′𝑐(𝑀𝑃𝑎) (15)
In addition, [9] conducted tests on reinforced concrete members subjected to uniaxial bending,
with and without axial loads, to derive expressions for plastic hinge length and deformations at
yielding and failure, in terms of the member geometric and mechanical properties. They
developed equations (15) and (16) to calculate the length of plastic hinge:
For cyclic loading:
Lp,cy= 0.12LS+ 0.014 αsl fy db (16)
For monotonic loading:
Lp,mon=1.5Lp,cy=0.18LS+ 0.021 αsl fy db (17)
Lp,cy: Plastic hinge length for cyclic loading, Lp,mon: Plastic hinge length for monotonic loading,
αsl:Zero-one variable (it is equal to one if slippage of the longitudinal reinforcement is possible,
and zero if it is not possible), fy: Yield stress of the tension reinforcement, in MPa units.
Moreover, models have been developed for beams, rectangular columns or walls and members
of T-, H-, U- or hollow rectangular section, with or without detailing for earthquake resistance
and with continuous longitudinal bars [10]. They employed a databank of cyclic or monotonic
tests to flexure-controlled failure to develop/calibrate models for the curvature and the chord
rotation of reinforced concrete members at flexure-controlled ultimate conditions – at a 20%
post-ultimate strength drop in lateral force resistance – under monotonic or cyclic loading. They
proposed expressions to calculate the length of plastic hinge for both cyclic and monotonic
loading (equations 18 and 19):
𝐿𝑝𝑙,𝑐𝑦 = 0.2 ℎ [(1 +1
3𝑚𝑖𝑛 (9;
𝐿𝑠
ℎ)] For cycling loading (18)
𝐿𝑝𝑙,𝑚𝑜𝑛 = ℎ [(1.1 + 0.04 𝑚𝑖𝑛 (9;𝐿𝑠
ℎ)] For monotonic loading (19)
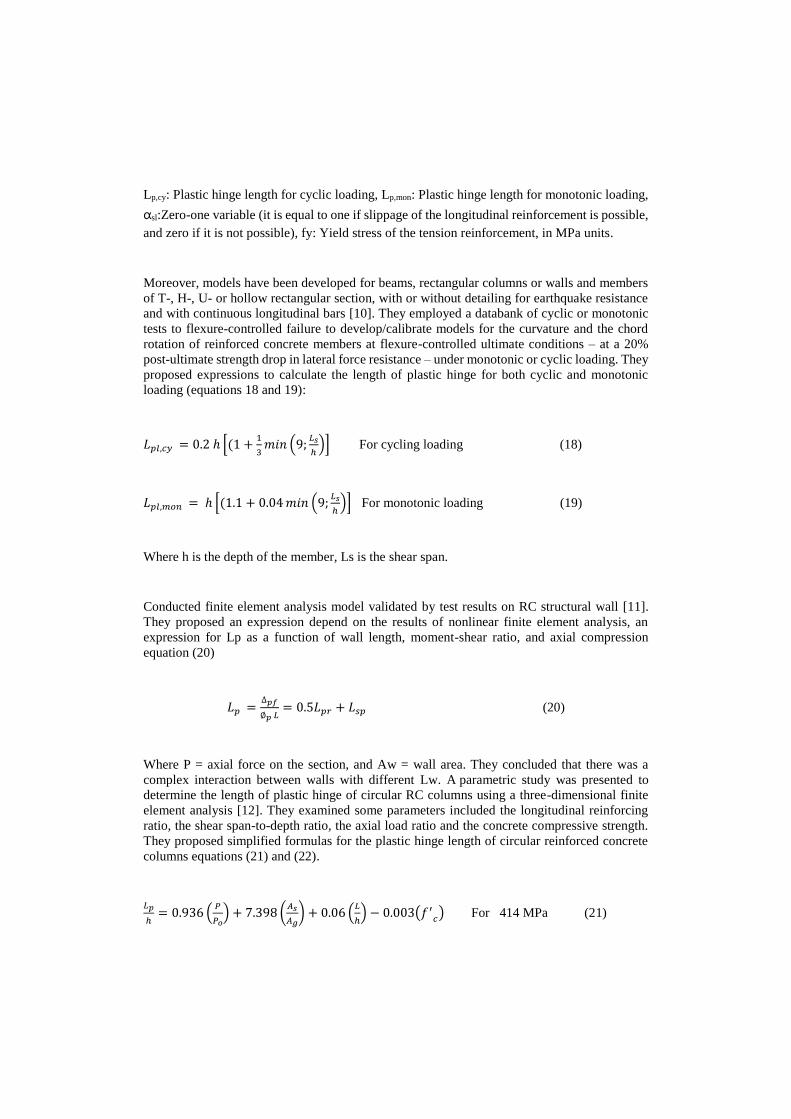
Where h is the depth of the member, Ls is the shear span.
Conducted finite element analysis model validated by test results on RC structural wall [11].
They proposed an expression depend on the results of nonlinear finite element analysis, an
expression for Lp as a function of wall length, moment-shear ratio, and axial compression
equation (20)
𝐿𝑝 =∆𝑝𝑓
∅𝑝 𝐿= 0.5𝐿𝑝𝑟 + 𝐿𝑠𝑝 (20)
Where P = axial force on the section, and Aw = wall area. They concluded that there was a
complex interaction between walls with different Lw. A parametric study was presented to
determine the length of plastic hinge of circular RC columns using a three-dimensional finite
element analysis [12]. They examined some parameters included the longitudinal reinforcing
ratio, the shear span-to-depth ratio, the axial load ratio and the concrete compressive strength.
They proposed simplified formulas for the plastic hinge length of circular reinforced concrete
columns equations (21) and (22).
𝐿𝑝
ℎ= 0.936 (
𝑃
𝑃𝑜) + 7.398 (
𝐴𝑠
𝐴𝑔) + 0.06 (
𝐿
ℎ) − 0.003(𝑓′
𝑐) For 414 MPa (21)

𝐿𝑝
ℎ= 0.503 (
𝑃
𝑃𝑜) + 3.218 (
𝐴𝑠
𝐴𝑔) + 0.053 (
𝐿
ℎ) − 0.0018(𝑓′
𝑐) For 685 MPa (22)
(As/Ag) Longitudinal reinforcing ratio, (L/h) Shear span-to-depth ratio, P/Po Axial load ratio.
They made a comparison between the three dimensional finite element model and experimental
results. Good agreement has been seen for the comparison that been made. Besides, A
parametric study was conducted to derive an analytical expression for estimating the length of
plastic hinge for cantilever RC structural walls by using the results of comprehensive nonlinear
finite-element analyses [13]. It was showed that variation of plastic zone length at the base of
the cantilever wall depends on several parameters, such as the wall length, wall height, axial
load ratio, and the ratio of wall boundary element and the web horizontal reinforcement. In this
parametric investigation, a plastic hinge length expression was proposed dependent on wall
length, axial load ratio, wall horizontal web reinforcement ratio, and shear-span-to-wall-length
ratio equation (23).
𝐿𝑝 = 0.27𝐿𝑤 (1 −P
𝐴𝑤 𝑓′𝑐) (1 −
fy𝜌𝑠ℎ
𝑓′𝑐) (
M/V
𝐿𝑤)
0.45
(23)
P = axial force on the section, and fy and fc=yield stress of the longitudinal reinforcement and
compressive strength of the concrete, respectively, M/V= shear span , Lw = wall length and
ρsh=horizontal reinforcement of web section. The accuracy and reliability of the proposed
plastic hinge length equation was verified using the available shear wall test results. Moreover,
it was conducted a parametric study on the curvature distribution over the member length of RC
shear wall using a non-linear, two-dimensional, finite-element analysis procedure to propose a
simple model that can determine the potential plastic hinge region for seismic design [14]. It
was done on the basis of Bernoulli’s principle, strain compatibility condition an equilibrium
condition of forces. They simply formulated the plastic hinge length of the shear wall as a
function of longitudinal tensile reinforcement index in the boundary element, vertical shear
reinforcement index in the web, and axial force index. The predicted length of plastic hinge is
shown in equation (24).
𝑙𝑝 = ℎ𝑤 (1 − 0.91ʎ0.1 + 휁𝑠ℎ𝑒𝑎𝑟) (24)
ʎ = 𝜔𝑠 + 𝜔𝑣1.3 + 𝜔𝑝
1.4 (25)
휁𝑠ℎ𝑒𝑎𝑟 = 0 𝑓𝑜𝑟 𝑉𝑛 ≤ 𝑉𝑐 (26)
휁𝑠ℎ𝑒𝑎𝑟 = 0.38 ʎ−0.15 (𝑙𝑤
ℎ𝑤) 𝑓𝑜𝑟 𝑉𝑛 > 𝑉𝑐 (27)

They concluded that the predicted plastic hinge length that was obtained from the present simple
model was in better agreement with test results than for the previous equations in that the mean,
standard deviation and coefficient of variation of the ratios between experiments and predictions
are 1.019, 0.102 and 0.100, respectively.
For these reasons, finite element analysis was conducted using ABAQUS software on several
models to investigate the parameters which have a significant effect on plastic deformation in
plastic zone. Also, this analysis is to obtain an equation for plastic hinge length of slender walls.
Several models will be created by including some parameters that decrease or prevent out of
plane buckling failure and to get an equation for plastic hinge length of slender walls using
ABAQUS finite element software. Before doing these models, a calibration model of a
cantilever shear wall [2] was considered to generate key parameters in the model and then
analyzed on experimental test results for a specified specimen that are taken from previous tests.
The geometrical, material, and loading values are adapted from experimental specimens
reported in the literature, and the experimental results are then used to validate the computational
models. This will be done to know how well the finite element results for model accurate match
the test results.
2 Finite Element Analysis
A concrete reinforced shear wall was modelled using finite element method. It is common
practice to use finite elements in simulating behavior of structural members. ABAQUS (v6.14)
was selected to carry out this study. Half-scale experiment results [2] that were available from
a previous research were used as the reference and compared with the ABAQUS analysis results.
Finite element analysis and model of cantilever shear wall was developed and set as the initial
control for the investigation purpose of this project work. The work by (Dazio et al., 2009) [2]
was used as the reference for comparison with result from the finite element analysis .Therefore,
all the parameters and conditions in the laboratory test were used in the modelling process. The
parameters are given in the following subsections.
2.1 Control Specimen
The control specimen was prepared as shown in Fig. 1 and Fig. 2 .The size and the dimensional
details of the cantilever RC shear wall have been used according to lab experiment conducted
by (Dazio et al., 2009) [2] of quasi-static cyclic tests and plastic hinge analysis of RC structural
walls. It consists of two main parts as following:
The first part which was a cantilever shear wall of 5.55m height, 2m width and 0.15 m thick. It
has a thicker portion located at the top of the shear wall than the thickness of other shear wall
part. The details of reinforcements are comprised of (34 longitudinal bars, 22 rebars with ∅ 8
diameter and 12 rebars ∅ 12 diameter ) and ( horizontal rebars with two straight bars ∅ 6 @
150 mm and U shape bars ∅ 6 @ 150 mm ) .Some properties are shown in Table 1, 2, and 3.
Table 1. Summary of the test unit properties [2].
Test
unit Sectional forces at the base Reinforcement ratios
Stabilizing
reinforcement

N (kN)
𝑁/𝐴𝑔 𝑓
′𝑐( _ )
𝑉/0.8𝑙𝑤 𝑏𝑤( 𝑀𝑃𝑎 )
𝛼𝑁
= 0.45𝑙𝑤
𝑁
𝑀( _ )
𝜌𝑏𝑜𝑢𝑛𝑑
(%)
𝜌𝑤𝑒𝑏
(%)
𝜌𝑡𝑜𝑡
(%)
𝜌ℎ
(%) s (m)
𝑠
𝐷𝑛𝑜𝑚
(−)
WSH4 695(+/-)6
0.057
1.85 0.31 1.54 0.54 0.82 0.25 No
ties
Table 2. The reinforcing steel properties for control specimen (WSH4) [2].
𝐷𝑛𝑜𝑚
(𝑚𝑚) 𝑅𝑝02(𝑀𝑃𝑎) 𝑅𝑚(𝑀𝑃𝑎)
𝑅𝑚
𝑅𝑝02
(−) 𝐴𝑔𝑡 classification
𝑅𝑚
𝑅𝑝02− 𝐴𝑔𝑡 Class(_)
12(6x) 576.0 ± 2.6 674.9
± 1:8 1.17 ± 0.01 7.29 ± 0.61 H _ M B (~C)
8(6x) 583.7 ± 5:5 714.4 ± 5.1 1.22 ±
0.01 7.85± 0.66 H _ H C
6 (6x) 518.9 ± 13:8 558.7 ± 6:7 1.08 ±
0.02 5.45 ± 0.41 M _ M B
Table 3. Mechanical properties [2].
Test unit 𝜌𝑐(kg/m³) 𝑓𝑐𝑤 (MPa) 𝑓′𝑐 (MPa) 𝐸𝑐 (GPa)
WSH4 2378 ± 15 58.8 ± 1.7 40.9 ± 1.8 38.5 ± 2.0
The second part is beam foundation that was supporting the upper shear wall. It consisted of a
beam fixed boundary condition with 2.8m height, 0.7m width and 0.6 m height. The details of
reinforcements are comprised of (8 rectangular shaped bars ∅ 18 diameter and U shaped 28
rebars with ∅ 12 diameter) (Figure 2).

Fig. 2. Experimental Framework and Specimen Dimensions (Dazio et al., 2009).
2.2 Structural Modelling in ABAQUS
2.2.1 Modelling Shear walls
Nine models were geometrical modelled as well as a model of control specimen to validate FEA
results with test results. Dimensional (3D) and deformable solid of type extrusion were used to
create parts as shown below in Figures 3 and 4.

Fig. 3. Shear wall module.
Fig. 4. Shear wall reinforcement.
2.2.2 Creation of Parametric Models
New finite element models of RC shear wall were created with different parameters that are as
following:
1 Three models with varying thickness to wall height ratio (tw⁄Hw ) 0.02 for (t = 10 cm
) , 0.024 for (t = 12cm) and 0.028 for ( t = 14 cm ) ), other dimensions and properties
will remain the same for the three models. These three models labeled as following:
Model (M1) with the thickness to wall height ratio of (tw⁄Hw ) (0.02) (t=10 cm)).
Model (M2) with the thickness to wall height ratio (tw⁄Hw ) (0.024) (t = 12 cm)).
Model (M3) with the thickness to wall height ratio (tw⁄Hw ) (0.028) (t = 14cm)).

2 Three models with varying wall length ((Lw = 1.75 m), (Lw = 1.5 m) , (Lw = 1.25
m) ), other dimensions and properties will remain the same. These three models
labeled as following:
Model 4 (M4) with wall length (Lw) (Lw = 1.75 m).
Model 5 (M5) with wall length (Lw) (Lw = 1.5 m).
Model 6 (M6) with wall length (Lw) (Lw = 1.25 m).
3 Three models with varying axial load ratio 0.075 for (P= 925 kN), 0.1 for (P = 1230
kN), and 0.2 for (P = 1840 kN), other dimensions and properties will remain the
same. These three models labeled as following:
Model 7 (M7) with axial load ratio 0.075 (P= 925 Kn).
Model 8 (M8) with axial load ratio 0.1 (P= 1230 Kn).
Model 9 (M9) with axial load ratio 0.15 (P = 1840 Kn).
The cantilever shear wall and beam foundation were modeled by eight-node solid elements with
a reduced-integration scheme (C3D8R) (Figure 5a). Two node truss elements were modeled
the steel reinforcement using (T3D2) (Figure 5b). The size of the mesh of the whole model was
chosen based on the required accuracy. The truss elements were embedded in and fully bonded
to the solid elements (Figure 5c).
Fig. 5. (a) 8-node element (C3D8R), (b) truss element (T3D2) and (c) embedded constraint.
All modelled parts were assembled together in such a way that they can mimic the experimental
study according to the mentioned details. Besides, the maximum element size of the mesh was
100 mm as shown in Figure 6.
Fig. 6. Mesh of the ABAQUS Model.

2.2.3 Material Models
The properties of the materials were used to be the same for the real model in the experimental
test for precise simulation through a computational effort. Therefore, the material models are
required in this study to characterize the inelastic behavior of concrete and steel. The Mander's
model was established by Mander et al., 1988 to simulate the behavior of concrete that was
chosen as the analytical model (Figure 7) and (Figure 8). Mander’s model has been verified
analytically and experimentally. This constitutive model was based on the Popovics equation
[15]. The tensile stress-strain behavior of concrete was assumed to behave like the compression
model with the peak stress and strains equal to 10% of the its values. The analytical model for
concrete in compression is described in equation (28)
𝑓𝑐 =𝑓′𝑐𝑐 𝑥𝑟
𝑟−1+𝑥′ (28)
𝑓𝑐 : confined compressive strength (MPa)
𝑓′𝑐𝑐 : Compressive strength of confined concrete
𝑥 =𝜀𝑐
𝜀𝑐𝑐 (29)
휀𝑐 : Longitudinal compressive concrete strain
휀𝑐𝑐 = 휀𝑐𝑜 [1 + 5 (𝑓′𝑐𝑐
𝑓′𝑐𝑜− 1)] (30)
𝑟 =𝐸𝑐
𝐸𝑐−𝐸𝑠𝑒𝑐 (31)
Fig. 7. Stress - strain behavior for confined and unconfined concrete for monotonic loading [16].

Fig. 8. Stress - strain behavior for confined and unconfined concrete for cyclic loading [17].
2.2.3.1 Concrete Damaged Plasticity Model
The assumption of scalar (isotropic) damage depended by the concrete damaged plasticity
model and the applications used concrete that is subjected to arbitrary loading conditions,
including cyclic loading. The degradation of the elastic stiffness induced by plastic straining
both in tension and compression is taken into consideration. It also accounts for stiffness
recovery effects under cyclic loading. The concrete damaged plasticity model is based on the
plasticity model supposed by Lubliner et al., 1989 [18] and Lee et al., 1998 [19].The salient
features of model are discussed here.
2.2.4 Loads and Boundary Conditions
2.2.4.1 Boundary Conditions for models
In ABAQUS software, the boundary conditions for all models have been created to derive an
equation to calculate the plastic hinge length with fixed support at base and roller support at the
base of shear wall. This is to make the base of the shear wall fixed and to prevent the vertical
movement at the top of shear walls that may lead mistakes in results.
2.2.4.2 Load Cases
An axial load which was chosen to be the same for six models of shear walls and variables
with respect to other three models. Axial load assigned to be constant throughout the analysis
process that will be applied on the top surface of the model with magnitude of 695000 N
according to the experimental test [2] as shown in Figure 9.

Fig. 9. Applied concentrated axial load.
Besides, a quasi-static monotonic load that was taken from the experimental test [2] has been
applied on the model. The horizontal cyclic displacement history consisted of two cycles at each
ductility level was applied to the wall’s head which (Figure 10). The first two cycles were force
controlled while the following ones were displacement-controlled. In the first two cycles the
wall was loaded until the force equaled 3/4 of the nominal yield force Fy. The nominal yield
displacement ∆y was then determined as 4/3 times the average peak displacement reached
during these first cycles. A small loading velocity was chosen to keep dynamic effects to a
minimum and to allow a continuous control of the instrumentation and the hydraulic system.
For larger amplitude cycles the loading velocity was gradually increased. Moreover, a
monotonic load was applied in order to establish many results relevant to curvatures and rotation
which can be obtained by applying cyclic loading as shown in Figure 11. A nonlinear analysis
was adopted to predict the components of yield and ultimate curvature under monotonic and
axial loads.

Fig. 10. Load History [2].
Fig. 11. Monotonic Loading.
3. Determination of Plastic Hinge Length (𝑳𝒑)
Plastic hinge length was determined according to equation (32) that was derived from plastic
hinge section analysis for the cantilever shear wall as stated in the introduction.
∆𝑓=∅yL2
3+ (∅ − ∅𝑦)𝐿𝑝 [𝐿 −
𝐿𝑝
2] (32)
When steel and concrete strains for each element at the same row are obtained, the ultimate
curvature was calculated according to Kazaz, 2013 [13] as following.
∅𝑏 = 𝜀𝑠 − 𝜀𝑐
𝐿 (33)
Then, the moment- curvature curve was plotted for whole models. The maximum lateral force
that was applied to the RC shear wall was corresponding to a maximum drift of (δ=1.36 %) as
stated in Dazio et al., 2009. This drift ratio considered as a damage limit state for other models.
The ultimate curvature was limited to the base section at the first element.

3.1 Derivation of Plastic Hinge Length Equation
The multiple regression technique was adopted in deriving the expression by SPSS statistics
software. Multiple regression allows the simultaneous testing and modeling of multiple
independent variables. There were 9 results of parametric models and 3 results of reference
mode that were equal 12 results as stated in Table 4. Plastic hinge length calculated as a function
of the following parameters: (a) slenderness ratio ( 𝑡𝑤 𝐻𝑤⁄ ) axial load ratio (𝑃
𝐴𝑤 𝑓𝑐, ) and wall
length (𝐿𝑊). Plastic hinge length results were input as a dependent variable while the identified
parameters were considered as independent variables which are as following:
Table 4. The parameters input as independent variables into SPSS software.
(𝑃
𝐴𝑤 𝑓𝑐, ) ( 𝑡𝑤 𝐻𝑤⁄ ) (𝐿𝑊)(𝑚𝑚)
0 .058 0.03 2000
0.075 0.03 2000
0.1 0.03 2000
0.15 0.03 2000
0.058 0.03 2000
0.058 0.02 2000
0.058 0.024 2000
0.058 0.028 2000
0.058 0.03 2000
0.058 0.03 1750
0.058 0.03 1500
0.058 0.03 1250
The nonlinear analysis was adopted because there are more than one parameter and this type of
analysis is realistic and comprehensive to get more accurate and reliable equations. The
correlation (square R) was calculated in SPSS software for each trial. At first, each parameter
will be individually checked whether which one of them acts linearly or not.
3.1.1 Validation of proposed plastic hinge length expression First, the proposed expression was verified with the previous plastic hinge length equations that
derived numerically by checking its correlation to others individually. In order to validate the
accuracy of the analytically derived plastic hinge length expression, a database composed of
shear wall test results was collected. The database is composed of 24 small-to-large-scale shear
wall tests; 15 specimens were tested under static cyclic loading of either increasing or variable
displacement amplitude. The significant properties and a summary of primary experimental
results are presented in Table 5. Standard deviation and convergence were calculated in the
correlation curve plotted.
Table 5. Differences between experimental and FE results.
Ave. of Finite
Element Results
Ave. of
Experimental
Work Results
Average
displacement
difference %
Average
force

Force
(Kn)
Disp.
(mm)
Force
(Kn)
Disp.
(mm)
difference
%
0 0 0 0 0 0
379.27 11.28 308.787 11.27 0.062 18.58
403.5 30.52 421.6 30.89 1.2 4.5
375.225 45.72
5
429.775 46.37 1.39 14.53
364.42 60.23 426.5 61.7 2.38 17.03
366.13 77 331.2 77.1 0.13 9.54
4. Results of the Parametric Study
4.1 Loads vs Displacements
As shown in the graphs plotted below that related load-displacement curves are for nine
parametric models that has been analyzed. It has been shown in Figure 12 for M1, M2 and M3
that when the axial load ratio ( 𝑃 𝑓𝑐,𝐴𝑤⁄ ) increased, the capacity of maximum load was also
significantly increased at the same horizontal displacements. Therefore, this increment has led
to increase the ultimate moments for FE models. However, maximum drift ratios reduced as
they were increased.
It could be seen in Figure 13 for M4, M5 and M6 when thickness to wall length ratios (𝑡𝑤 𝐻𝑤⁄ )
were slightly increased, the ultimate load capacities were also increased, thus these increment
led to increase the drift ratio for models. As obvious from Figure 13 the resistant load was not
highly dropped after it was reached yielding displacement as compared with (1),(2) and (3)
models. This indicates that this parameter has a good effect on optimizing the load capacity
which was not highly sensitive to very small changes of this parameter because out of plane
buckling failure was largely affected by changing thicknesses of RC shear walls subjected to
both of axial and lateral loads. It can be seen in Figure 14 that when the wall lengths were
decreased, the load and moment capacity have reduced. Moreover, it can be noted that the
deference between these curves was highly big because of the inherent correlation between
moment capacities and wall lengths therefore load capacities increase by increasing wall
lengths.

Fig. 12. Load vs Displacement for models (1), (2) and (3).
Fig. 13. Load vs Displacement for models (4), (5) and (6).

Fig. 14. Load vs Displacement for models (7), (8) and (9).
4.2 Moment - Curvature Curves for Parametric Models
Moment – Curvature curve shown in Figure 15 has stated that base section curvatures for
models (1), (2) and (3) were considerably affected by the parameter of axial load ratio when it
decreased they increased. This took place when drift ratios were less than that determined for
the reference model due to early failure damage of the unconfined concrete in the compression
zone. Drift ratios at which base section curvatures were calculated for these models were of
𝛿(1.16% , 1.04% 𝑎𝑛𝑑 0.865%) respectively. This also decreased the tensile strains of
reinforcing bars in tension zone of models and thus the total base section curvatures had been
reduced. As shown in Figure 16, base section curvatures for models (4), (5) and (6) have been
slightly changed when thickness to wall length ratios were small varied because of the little
effect of this parameter on base curvatures. Drift ratios at which base curvatures were
determined for these models were of 𝛿(1.18% , 1.24% 𝑎𝑛𝑑 1.33%) . Due to unconfined
concrete or no stabilizing reinforcement in compression, out of plane buckling could be highly
affected by reducing this parameter. In Figure 17 as noted, reducing wall lengths for models
(7), (8) and (9) led to increase the base section curvatures. Due to a big reduction of wall length
models, crushing compression zone regions were limited to a small area at the wall bases. Thus,
drift ratios at which base curvatures were determined for these models considerably increased
that were of 𝛿(1.88% , 2.4% 𝑎𝑛𝑑 2.66%). Therefore, this parameter had a significant effect in
increasing base curvatures and drift ratios.

Fig. 15. Moment – Curvature Curve for models (1), (2) and (3).
Fig. 16. Moment – Curvature Curve for models (4), (5) and (6).

Fig. 17. Moment – Curvature Curve for models (7), (8) and (9).
4.3 Plastic Hinge Lengths for Parametric Models
As explained in section 3, the plastic hinge lengths could be done by both two ways but the best
fit line as shown in Figures 18 and 19 considered more accurately than the direct way by
applying the equation 32.
Fig. 18. Calculation of plastic hinge zone for reference and model (6).
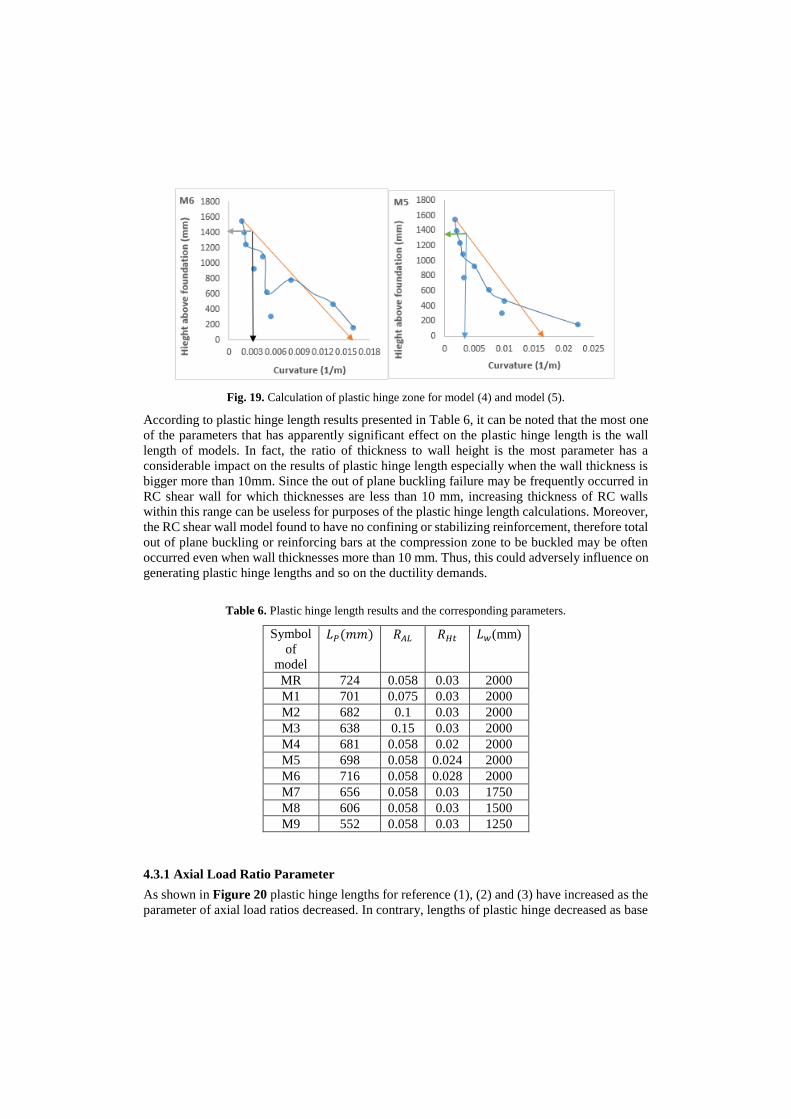
Fig. 19. Calculation of plastic hinge zone for model (4) and model (5).
According to plastic hinge length results presented in Table 6, it can be noted that the most one
of the parameters that has apparently significant effect on the plastic hinge length is the wall
length of models. In fact, the ratio of thickness to wall height is the most parameter has a
considerable impact on the results of plastic hinge length especially when the wall thickness is
bigger more than 10mm. Since the out of plane buckling failure may be frequently occurred in
RC shear wall for which thicknesses are less than 10 mm, increasing thickness of RC walls
within this range can be useless for purposes of the plastic hinge length calculations. Moreover,
the RC shear wall model found to have no confining or stabilizing reinforcement, therefore total
out of plane buckling or reinforcing bars at the compression zone to be buckled may be often
occurred even when wall thicknesses more than 10 mm. Thus, this could adversely influence on
generating plastic hinge lengths and so on the ductility demands.
Table 6. Plastic hinge length results and the corresponding parameters.
Symbol
of
model
𝐿𝑃(𝑚𝑚) 𝑅𝐴𝐿 𝑅𝐻𝑡 𝐿𝑤(mm)
MR 724 0.058 0.03 2000
M1 701 0.075 0.03 2000
M2 682 0.1 0.03 2000
M3 638 0.15 0.03 2000
M4 681 0.058 0.02 2000
M5 698 0.058 0.024 2000
M6 716 0.058 0.028 2000
M7 656 0.058 0.03 1750
M8 606 0.058 0.03 1500
M9 552 0.058 0.03 1250
4.3.1 Axial Load Ratio Parameter
As shown in Figure 20 plastic hinge lengths for reference (1), (2) and (3) have increased as the
parameter of axial load ratios decreased. In contrary, lengths of plastic hinge decreased as base

section curvature increased as stated in Figure 21. Consequently, this parameter has inverse
proportion with the plastic hinge length and direct proportion with the base curvature.
Fig. 20. Plastic Hinge Length Vs Axial Load Ratio parameter for reference, (1), (2) and (3) models.
Fig. 21. Plastic Hinge Length Vs Curvatures of axial load ratio parameter for reference, (1), (2) and (3)
models.
4.3.2 Thickness to Wall Height Ratio Parameter
As shown in Figure 22 plastic hinge lengths for reference (4), (5) and (6) had increased when
the parameter of thickness to wall height decreased. In contrary, lengths of plastic hinge
increased as base section curvature increased as stated in Figure 23. Consequently, this
parameter has inverse proportion with the plastic hinge length and direct proportion with the
base curvature.
Fig. 22. Plastic Hinge Length Vs Thickness to Wall Height Ratio parameter for reference, (4), (5) and (6)
models.

Fig. 23. Plastic Hinge Length Vs Curvatures of Thickness to Wall Height ratio parameter for reference,
(4), (5) and (6) models.
4.3.3 Wall Length Parameter
As shown in Figure 24 plastic hinge lengths for reference (4), (5) and (6) had increased when
the parameter of the wall length increased. Consequently, this parameter has direct proportion
with the plastic hinge length and the inverse proportion with base curvature.
Fig. 24. Plastic Hinge Length vs Wall Length parameter for reference, (7), (8) and (9) models.
6. Derived Plastic Hinge Length Equation
As seen in Figures 18, 20, and 22 all terms of the required equation checked to know how
sensitive its correlation on the value of the plastic hinge length. It is found that the relationship
between both axial load ratio and wall length parameters and the plastic zone length weas linear
whereas the relation between the thickness to wall height ratio was nonlinear. Based on these
findings, the analytical equation was derived as shown in equation (34).
𝐿𝑝= (0.293 𝐿𝑤) (1 - 1.38 𝑃
𝑓𝑐, 𝐴𝑤
) *( 1
0.033∗(𝑅ℎ𝑡 𝐿𝑤⁄ ) −0.28 ) (34)
As seen in Figure 25a, the proposed expression derived in this study has good agreement and
correlation when compared with the plastic hinge length obtained from FE analysis results. As
shown in the output file of SPSS software, the R squared related to the accuracy of the derived
equation was 92.6%. It can be concluded that the terms of the proposed equation were linear
except for the third term that was nonlinear. The plastic hinge length prediction using the derived
equation (34) and available from other studies also was compared with finite element analysis

results in Figures 25b, 26, and 27. It is seen in these figures that the best predictions and
correlations were obtained by equation (34) proposed in this work.
Fig. 25. Comparison of plastic hinge length calculate from FE analysis with predicted equation proposed
in (a) this study, Eq. (34); (b) Eurocode 8.
Fig. 26. Comparison of plastic hinge length calculate from FE analysis with (a) Priestley et al. (1996)
[20]; (b) According to [7].
Fig. 27. Comparison of plastic hinge lengths calculated from finite-element analysis with the Bohl and
Adebar (2011) [11].

6.1 Verification of proposed expression using experimental data
Validating the accuracy of the (𝐿𝑝) expression that derived analytically, a database comprised
of shear wall test results was compiled. The data composed of 23 small-to-large-scale shear wall
experiments was tested under static cyclic or monotonic loading of either increasing or variable
displacement amplitude. The significant properties and a summary of test results are presented
in Table 7. It was noted that although there are several experimental tests on RC shear walls, a
few of them only organized the plastic zone length 𝐿𝑝𝑧 data. The calculated plastic hinge lengths
for the predicted equation equation (34) are tabulated in the last column of Table 7 as the plastic
zone lengths via multiplying them by 2. A comparison between the experimental and calculated
𝐿𝑝𝑧 values is shown in Figure 28. Standard deviation, covariance and the correlation degree
were displayed as statistical information between the experimental and predicted values of 𝐿𝑝𝑧.
It was noted when compared between two last columns of from Table 7 and Figure 28, that there
was a clear difference between measured and predicted values. That happened because the
predicted results of the plastic zone length were calculated only based on three parameters as
explained previously. In addition, all data presented in the Table 7 in columns (3), (4), (5) and
(6) that concern parameters of the proposed equation did not provide a wide variety of data.
Experimental values of the plastic zone length determined on the basis of many variables
presented in the others columns contributed significantly to the calculation of 𝐿𝑝𝑧 . These were
the reasons that made high standard deviation, a little covariance and a weak correlation between
the experimental and predicted values.
Table 7. Test Parameters and Measured Deformations at Yield and Ultimate Displacement of Wall
Specimens [13].
No. of
specimen
specimen 𝐿𝑤 (cm
)
𝑡𝑤(
cm) 𝐻𝑤
(𝑐𝑚)
𝜌𝑏 %
𝜌𝑠𝑣 %
𝜌𝑠ℎ %
𝑅𝑎𝑙 %
𝑓𝑐,
Mpa
𝑉𝑚𝑎𝑥
𝐴𝑤√𝑓𝑐
DR
% 𝐿𝑝𝑧
(exp.)
𝐿𝑝𝑧
Pred.
1 PCA-R1 191 10.2 45
7
1.47 0.25 0.31 0.4 44.7 0.09 2.26 1.83 1.403
2 PCA-R2 191 10.2 45
7
4 0.25 0.31 0.4 46.4 0.16 2.92 2.06 1.403
3 PCA-B1 191 10.2 45
7
1.11 0.29 0.31 0.3 53 0.19 2.89 2.06 1.403
4 PCA-B2 191 10.2 45
7
3.67 0.29 0.63 0.3 53.6 0.49 2.27 1.83 1.403
5 PCA-B3 191 10.2 45
7
1.11 0.29 0.31 0.3 47.3 0.21 3.93 2.13 1.403
6 PCA-B4 191 10.2 45
7
1.11 0.29 0.31 0.3 45 0.25 5.94 2.74 1.403
7 PCA-B5 191 10.2 45
7
3.67 0.29 0.63 0.3 45.3 0.58 2.77 1.83 1.403
8 PCA-B6 191 10.2 45
7
3.67 0.29 0.63 14.1 21.8 0.9 1.71 1.52 1.136
9 PCA-B7 191 10.2 45
7
3.67 0.29 0.63 7.9 49.3 0.71 2.89 2.29 1.26
10 PCA-B8 191 10.2 45
7
3.67 0.29 1.38 9.3 42 0.77 2.86 2.29 1.23

11 PCA-B9 191 10.2 45
7
3.67 0.29 0.63 8.9 44.1 0.75 3.02 2.29 1.24
12 PCA-
B10
191 10.2 45
7
1.97 0.29 0.63 8.6 45.6 0.53 2.77 2.13 1.243
13 PCA-F1 191 10.2 45
7
3.89 0.3 0.71 0.4 38.5 0.69 1.11 1.83 1.402
14 UCB-
SW3
239 10.2 30
9
3.52 0.83 0.83 7.8 34.8 0.76 5.67 2 1.65
15 UCB-
SW4
239 10.2 30
9
3.52 0.83 0.83 7.5 35.9 0.69 2.25 2 1.66
16 UCB-
SW5
241 10.2 30
9
6.34 0.63 0.63 7.3 33.4 0.64 2.24 1.8 1.673
17 UCB-
SW6
241 10.2 30
9
6.34 0.63 0.63 7 34.5 0.6 2.33 1.4 1.68
18 UCB-
RW2
122 10.2 38
2
2.89 0.33 0.33 7 43.7 0.25 2.19 0.9 0.97
19 WS2 200 15 45
2
1.32 0.3 0.25 5.7 40.5 0.19 1.39 1.4 1.5
20 WS3 200 15 45
2
1.54 0.54 0.25 5.8 39.2 0.24 2.04 1.7 1.5
21 WS4 200 15 45
2
0.67 0.27 0.25 12.8 38.3 0.24 1.37 1.4 1.34
22 WS6 200 15 45
2
1.54 0.54 0.25 10.8 45.6 0.29 2.07 1.6 1.386
23 WI 163 12.7 11
33
0.66 0.45 0.45 10 35 0.11 2 1.9 0.9
Fig. 28. Comparison of plastic zone lengths between measured and predicted.
7. Conclusion
The findings of this numerical study are summarized in the following:

1. Comparison of the FE analysis results to the experimental results displayed good
agreement in the load–displacement envelope curve, maximum forces, except minor
difference due to insufficient modelling of the bond-slip of reinforcing bars and
focusing strains in cracked concrete.
2. Moment and load capacity of RC shear wall models have been significantly increased
as axial load ratios was increased. These large increases in the capacities of models
were taken place at the yielding phase, but load resistances have been dropped at the
damage failure to normal levels equal approximately to the resistance of the reference
model.
3. Bearing capacities have been improved when thickness to wall height ratios were
increased. In this case, the resistance of parametric models had a load – deformation
behavior similar to the reference model.
4. Lateral strength capacity of RC shear wall models have been dropped when wall
length parameter was reduced. Behavior of load – deformation cures were
considerably different from the reference model especially for models that had small
values of the wall length.
5. Base section curvatures were decreased as axial load ratios and the wall length
increased. Also they had decreased when the thickness to wall lengths ratios
increased. Also they had increased as wall lengths and the thickness to wall height
ratios increased.
6. New plastic hinge length expression has been proposed here and validated
numerically by comparing it with finite- element analysis results taken from other
studies. Good agreement and correlation obtained for this predicted equation when
compared with other numerically derived expressions.
Then, the proposed equation was verified with data available from experimental studies. It found
that there was a clear difference between measured and predicted results because of not
including many parameters in the new proposed equation and these parameters had significant
effect on calculating the plastic hinge length.

References
[1] Moehle, J. P.: Displacement-Based Design of RC Structures Subjected to Earthquakes. Earthquake
Spectra, 8((3)), 403 – 428 (1992)
[2] Dazio, A., Beyer, K., & Bachmann, H.: Quasi-static cyclic tests and plastic hinge analysis of RC
structural walls. Engineering Structures, 31(7), 1556-1571 (2009)
[3] Priestly, M.J.N., and Park, R.: Strength and Ductility of Concrete Bridge Columns Under
SeismicLoading. ACI Structural Journal, 84((1)), 61 – 76 (1987)
[4] Baker, A. L.: The Ultimate Load Theory Applied to the Design of Reinforced and Prestressed
Concrete Frames. (1965)
[5] 428, A.-A. C.: Progress Report on Code Clauses for “Limit Design,” 65(9), 713–720 (1986)
[6] Park, R., and Paulay, T. : Reinforced concrete structures, Wiley, New. York. Elwood, K. J., et al.
(2007). “Update to ASCE/SEI 41 concrete provisions.” Earthq. Spectra, 23(, (3)), 493–523 (1975)
[7] Paulay, T., and Priestley, M. J. N.: Seismic design of reinforced concrete and masonry buildings.
Isbn-10 (Vol. 471549150) (1992)
[8] (CEN)., E. C. for S.: Eurocode 8: Design of structures for earthquake resistance: Part 3: Assessment
and retrofitting of buildings. BS EN 1998-3, Brussels, Belgium (Vol. 1) (2005)
[9] Panagiotakos, T.B., and Fardis, M. N.: Deformations of Reinforced Concrete Members at Yielding
and Ultimate.” ACI Structural Journal, 98(2), 135 – 148 (2001)
[10] Biskinis, D., and Fardis, M.: Flexure-controlled ultimate deformations of members with continuous
or lap-spliced bars. Structural Concrete, 11(2), 93–108 (2010)
[11] Bohl, A., and Adebar, P.: Plastic hinge lengths in high-rise concrete shear walls. ACI Struct. J.,
108((2)), 148–157 (2011)
[12] Ou, Chen, Raditya Andy, N.: Plastic hinge length of reinforced concrete columns. ACI Structural
Journal, 105(3), 290–300 (2012)
[13] Kazaz, I.: Analytical Study on Plastic Hinge Length of Structural Walls, (November), 1938–1950
(2013)
[14] Mun, J.: Plastic hinge length of reinforced concrete slender shear walls, 67(8) (2014)
Oesterle, R.G., Aristizabal-Ochoa, J.D., Shiu K.N., and Corley, W. G. (1984). “Web Crushing of
Reinforced Concrete Structural Walls.” ACI Journal, 81(3), 231 – 241.
[15] Popovics.: A numerical approach to the complete stress-strain curve of concrete. Cement and
Concrete Research, 3(5) (1973)
[16] Mander, J., Priestley, M., and Park, R.: Observed Stress‐Strain Behavior of Confined Concrete.”
J. Struct. Eng., 1827, 1827–1849 (1988)
[17] Mander, J. B., Priestley, M. J. N., & R.Park.: Theoretical Stress Strain Model for Confined
Concrete. Journal of Structural Engineering (1988)
[18] LUBLINER, Oller, & Barcelona, C.: A plastic-damage model for concrete. International Journal
of Solids and Structures, 25(3), 299–326 (1989)
[19] Lee, J. and Fenves, G.: Plastic-Damage Model for Cyclic Loading of Concrete Structures.” Journal
of Engineering Mechanics, 124(8), 892–900 (1998)
[20] Priestley, M. J. N., Seible, F., and Calvi, G. M.: Seismic design and retrofit of bridges, Wiley, New
York (1996)