Embed Size (px)
Citation preview

Investigation of the Thermal Mixing in a T-Junction Flow With Different
SRS Approaches
© 2011 ANSYS, Inc. August 9, 20131
M. S. Gritskevich, A. V. GarbarukSt. Petersburg State Polytechnical University & NTS, Russia
Th. Frank, F. R. MenterPBU, ANSYS Germany, Otterfing

Outline
• The OECD/NEA Benchmark on thermal mixing in T-junctions
• The Vattenfall T-junction experiment
• CFD test case description
• Results
© 2011 ANSYS, Inc. August 9, 20132
• Results
• Summary

OECD/NEA Benchmark on Thermal Mixing in T-junctions
© 2011 ANSYS, Inc. August 9, 20133
• OECD/NEA Benchmark, 2009-2010; CSNI Report in 2011 • Odemark, Y. et al., 2009. High-Cycle Thermal Fatigue in Mixing Tees: New Large-
Eddy Simulations Validated Against New Data Obtained by PIV in the VattenfallExperiment. In Proceedings of the 17th International Conference on Nuclear Engineering.
• Mahaffy, J., 2010. Synthesis of Results for the T-Junction Benchmark. In CFD4NRS-3 Conference on Experimental Validation of CFD and CMFD Codes to Nuclear Reactor Safety Issues. Washington, DC, USA, p. 3.

Flow Schematic
T=36°°°°, 6 l/s
∅∅∅∅=0.1mT=19°°°°, 9 l/s
∅∅∅∅=0.14m
© 2011 ANSYS, Inc. August 9, 20134
• Adiabatic walls
• Water mixing at Re = 1.4⋅⋅⋅⋅105
• Mean and transient wall temperatures
in the fatigue zone: thermal striping
Available experimental data
© 2011 ANSYS, Inc. August 9, 20135
mean U,V,W & RMS: vertical & horizontal central linesat shown cross-sections
Tmean & RMS: x-lines at walls at 0°°°°, 90°°°°, 180°°°°, 270°°°°

Thermal Striping Phenomenon
• Intensive turbulent mixing downstream the T-junction
• Strong temperature fluctuations near the wall, top & side walls in particular
© 2011 ANSYS, Inc. August 9, 20136

Expected SRS Model Behavior?
Globally or locally unstable, or even stable?
Jet in cross-flow, SAS T-junction, SAS, bounded CD
© 2011 ANSYS, Inc. August 9, 20137
���� Experiment: very fast mixing, no large stable vortices

Domain and Grid
Main pipe: -3 ≤≤≤≤ x/D ≤≤≤≤ 20, D=0.14m
Branch pipe: z/d ≤≤≤≤ 3.1, d=0.10m
Z
X
Grid: 4.9M elements, hexahedral
Wall y+: ~4÷÷÷÷6, locally up to 12 in the mixing zone
© 2011 ANSYS, Inc. August 9, 20138
Wall y : ~4÷÷÷÷6, locally up to 12 in the mixing zone
Timestep: 1 ms ���� CFL: bulk ~0.5, mixing zone ~1 ÷÷÷÷ 1.5

SST-SAS without Zonal LES
• Central differences (CD)
• Standard bounded CD (BCD)
• Weakly bounded CD (WBCD)
SST-SAS with Zonal LES
Turbulence Models: CFX
© 2011 ANSYS, Inc. August 9, 20139
µµµµt/µµµµ
SST-SAS with Zonal LES
• Forcing planes ½∅∅∅∅upstream the junction
• WBCD
Instant vorticity
|∇×∇×∇×∇×u|
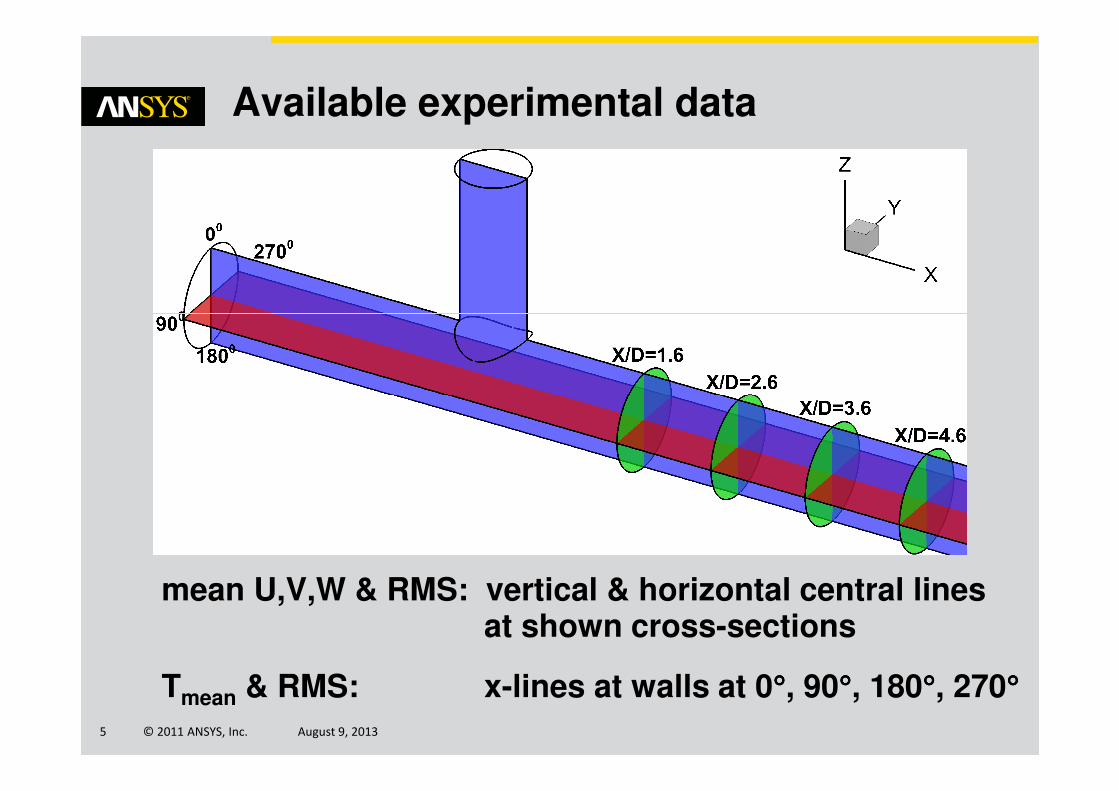
Turbulence Models: FLUENT
FLUENT: SAS, DDES and Embedded LES
ELES Setup:
• RANS/LES interface: Vortex method, 1000 vortices
• LES zone: Wall-Modeling LES (WMLES)
Advection
schemes:
CD & BCD
© 2011 ANSYS, Inc. August 9, 201310

CFD Model Setup
Inlet profiles
• Main pipe (T=19°°°°C, Ubulk=0.58 m/s)
o Velocity and turbulence profiles from calculation in periodic pipe
• Branch pipe (T=36°°°°C, Ubulk=0.76 m/s)
o Velocity and turbulence profiles obtained from calculation in pipe flow to match the measured boundary layer thickness (δδδδ~1cm)
© 2011 ANSYS, Inc. August 9, 201311
Solver setup
• CD - Central difference orBCD - bounded central difference scheme for advection terms
• Standard scheme for pressure interpolation
• Green-Gauss cell based (GGCB) scheme for gradients
• SIMPLEC with 10 iter. per time step for pressure-velocity coupling
• 2nd order Euler scheme for time discretization

ANSYS CFX Results
© 2011 ANSYS, Inc. August 9, 201312

Calculation of T-Junction in CFX- Influence of Advection Scheme -
The flow was calculated in ANSYS CFX with SAS and different advection schemes available in the code:
• Central differences (CD)
• Standard bounded CD (BCD)
• Weakly bounded CD (WBCD)
CD, Q=5000 BCD, Q=1000 WBCD, Q=5000
© 2011 ANSYS, Inc. August 9, 201313
Results are strongly affected by the advection scheme.
CD, Q=5000 BCD, Q=1000 WBCD, Q=5000

Calculation of T-Junction in CFX - Influence of Zonal LES, weak BCD -
Without zonal LES,
Q=1000
With zonal LES,
Q=8000
View from
the top
© 2011 ANSYS, Inc. August 9, 201314
Different mixing
pattern

Calculation of T-Junction in CFX - Influence of Zonal LES, weak BCD -
Wall temperature in the fatigue zoneTop wall line
© 2011 ANSYS, Inc. August 9, 201315

ANSYS Fluent Results
© 2011 ANSYS, Inc. August 9, 201316
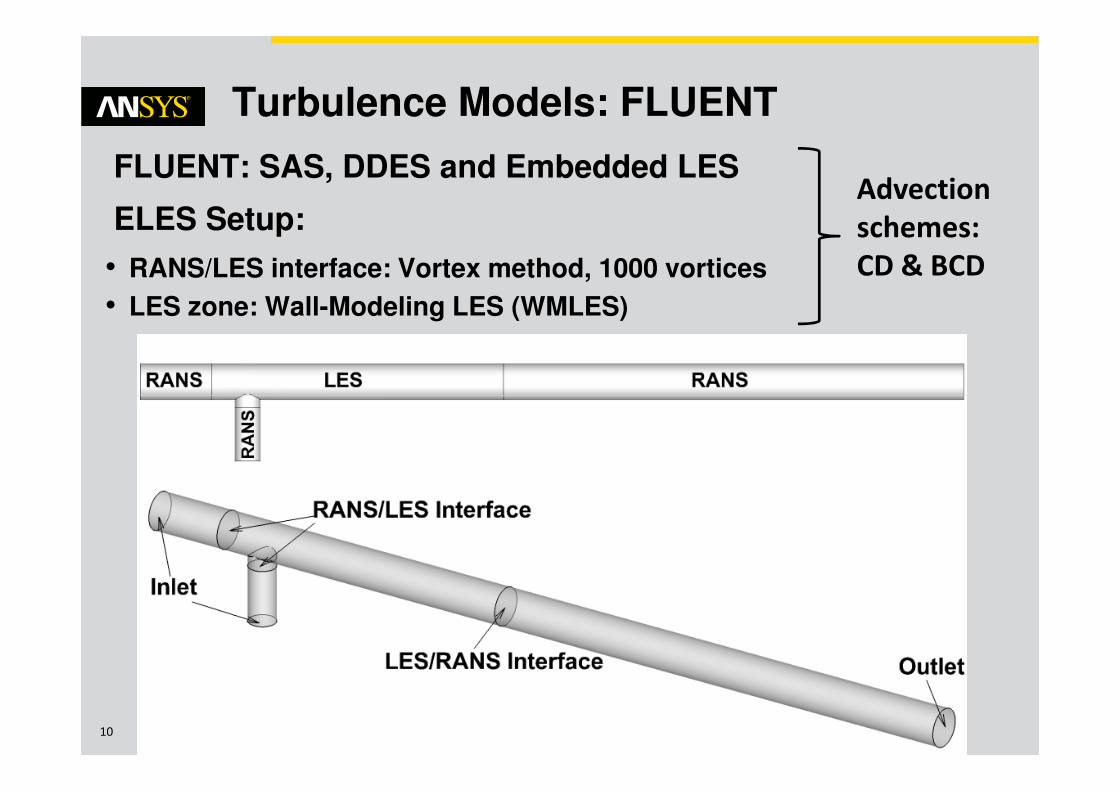
Isosurfaces of Q-criterion Colored with Temperature by Different SRS Models
Flow results are very sensitive to numerics
• SAS & BCD scheme ���� URANS solution
is obtainedSAS & CD ���� LES
© 2011 ANSYS, Inc. August 9, 201317
• For DDES the effect of numericsis smaller than for SAS but still visible on Q-criterion isosurfaces
• For ELES-WMLES there is virtually no effect of the advection scheme on the solution

Thermal Stripping and Thermal Mixing:Mean and RMS Temperature Contours
© 2011 ANSYS, Inc. August 9, 201318
• The hot water is strongly cooled downstream of the junction and at X/D=4.6 the flow in the pipe has nearly constant temperature
• The thermal striping phenomenon takes place mostly in the upper part of the mixing layer, where high values of temperature fluctuations (about 0.3·∆T) are observed
• Further downstream, the magnitude of these fluctuations decreases and at X/D=4.6 it is as low as 0.1·∆T with a nearly constant distribution across the section

Mean and RMS Velocity Profiles for Different Models with CD Scheme
© 2011 ANSYS, Inc. August 9, 201319
All models are able to predict the time averaged mean and RMS velocity profiles with good accuracy, when combined with the CD scheme for advection
• Very good agreement between the results and the experimental data

Mean and RMS Velocity Profiles for Different Models with BCD Scheme
© 2011 ANSYS, Inc. August 9, 201320
The change of the scheme from CD to BCD does not impair the solution for the DDES and ELES-WMLES approaches
SAS model reverts back to URANS mode when used with the BCD scheme
• The lack of the resolved coherent turbulent structures downstream of the junction results in a significant underestimation of resolved RMS velocities

Mean velocity, horiz. line at x/D=1.6
Fluent
© 2011 ANSYS, Inc. August 9, 201321
CFX
•••• •••• •••• Experiment
Zonal LES,
weak BCD
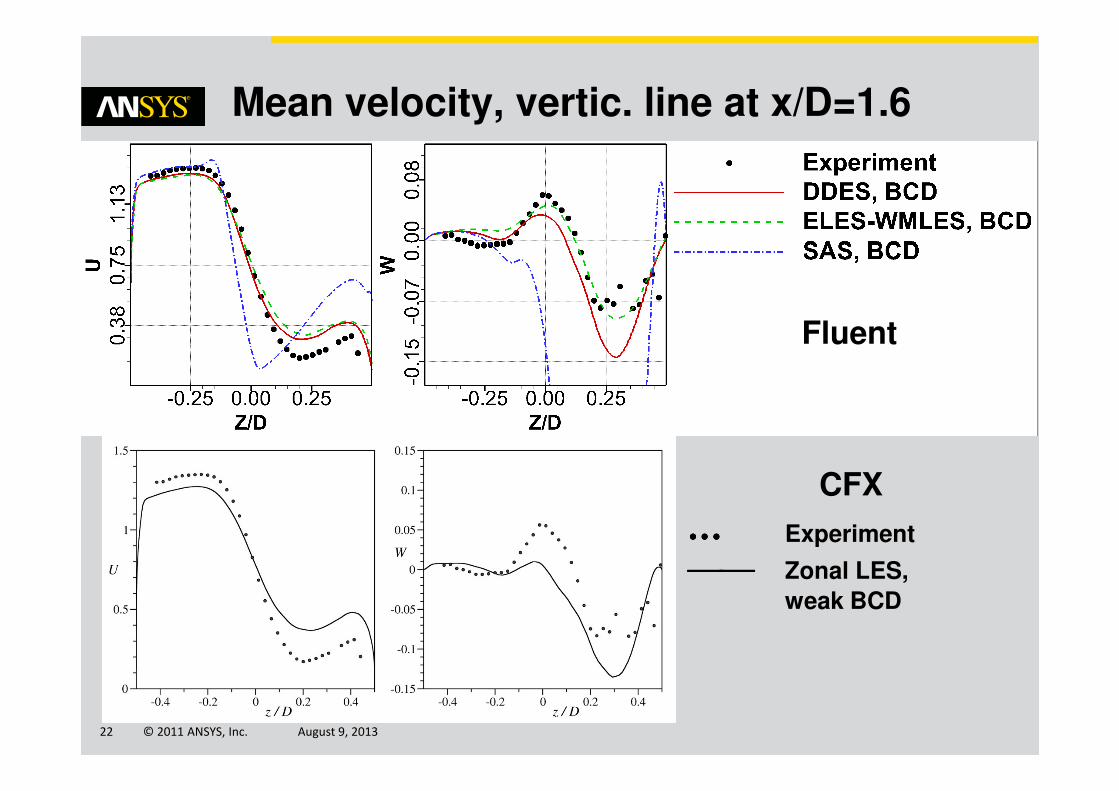
Mean velocity, vertic. line at x/D=1.6
Fluent
© 2011 ANSYS, Inc. August 9, 201322
CFX
•••• •••• •••• Experiment
Zonal LES,
weak BCD

RMS velocity, horiz. line at x/D=1.6
Fluent
© 2011 ANSYS, Inc. August 9, 201323
CFX
•••• •••• •••• Experiment
Zonal LES,
weak BCD
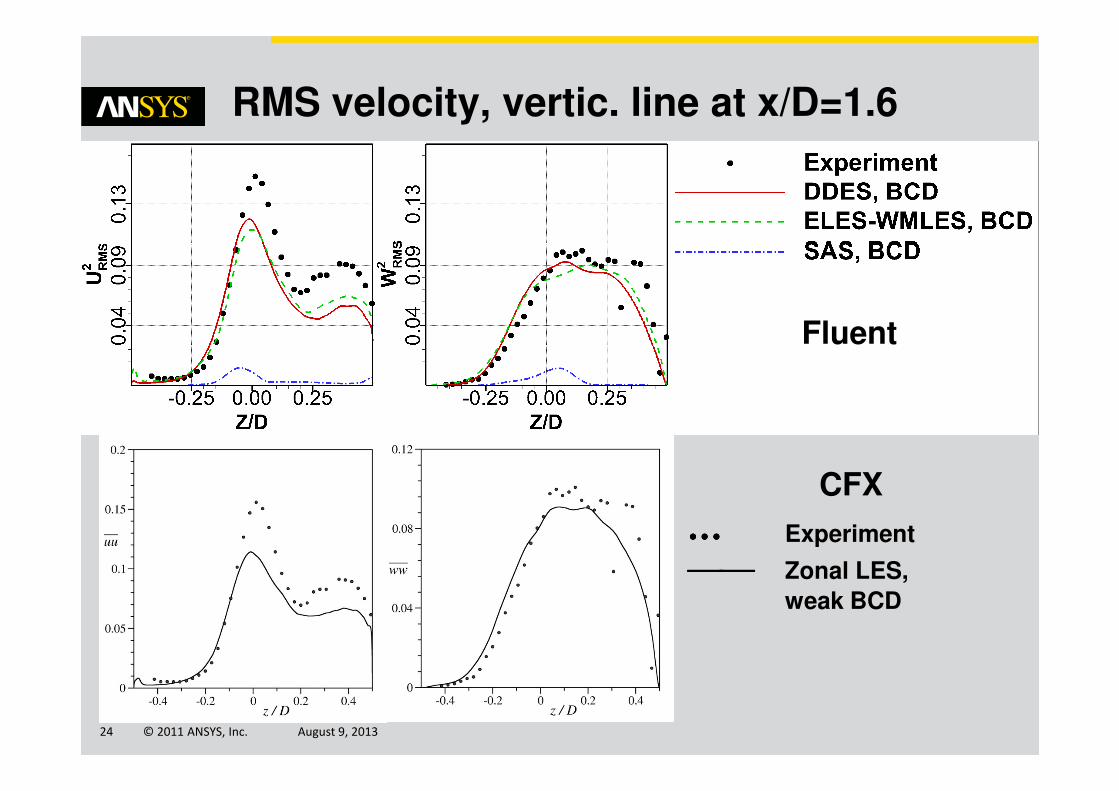
RMS velocity, vertic. line at x/D=1.6
Fluent
© 2011 ANSYS, Inc. August 9, 201324
CFX
•••• •••• •••• Experiment
Zonal LES,
weak BCD

Mean and RMS Temperature Profiles for Different Models with CD Scheme
© 2011 ANSYS, Inc. August 9, 201325
Best results are obtained with the use of ELES-WMLES approach, for which almost perfect distributions of the wall temperatures & TRMS are obtained
• For SAS and DDES models, the results of the wall temperature are noticeably less accurate than those obtained with the ELES-WMLES approach
• The results for the RMS temperature indicate that all models predict RMS temperature fluctuations in good agreement with the data

Mean and RMS Temperature Profiles for Different Models with BCD Scheme
© 2011 ANSYS, Inc. August 9, 201326
Influence of advection scheme is marginal for ELES-WMLES
For SAS with BCD, the thermal mixing is predicted incorrectly
• The wall temperature is significantly underestimated in all considered wall sections• Similar tendencies, but less severe, are observed for DDES with BCD as well

Mean T, top & front lines (0°°°° & 90°°°°)
Fluent
© 2011 ANSYS, Inc. August 9, 201327
Top FrontCFX
•••• •••• •••• Experiment
Zonal LES,
weak BCD
• Marginal influence of
advection scheme for ELES
• SAS with BCD returns to
URANS solution

Mean T, bottom & rear lines (180°°°°&270°°°°)
Fluent
© 2011 ANSYS, Inc. August 9, 201328
Bottom RearCFX
•••• •••• •••• Experiment
Zonal LES,
weak BCD
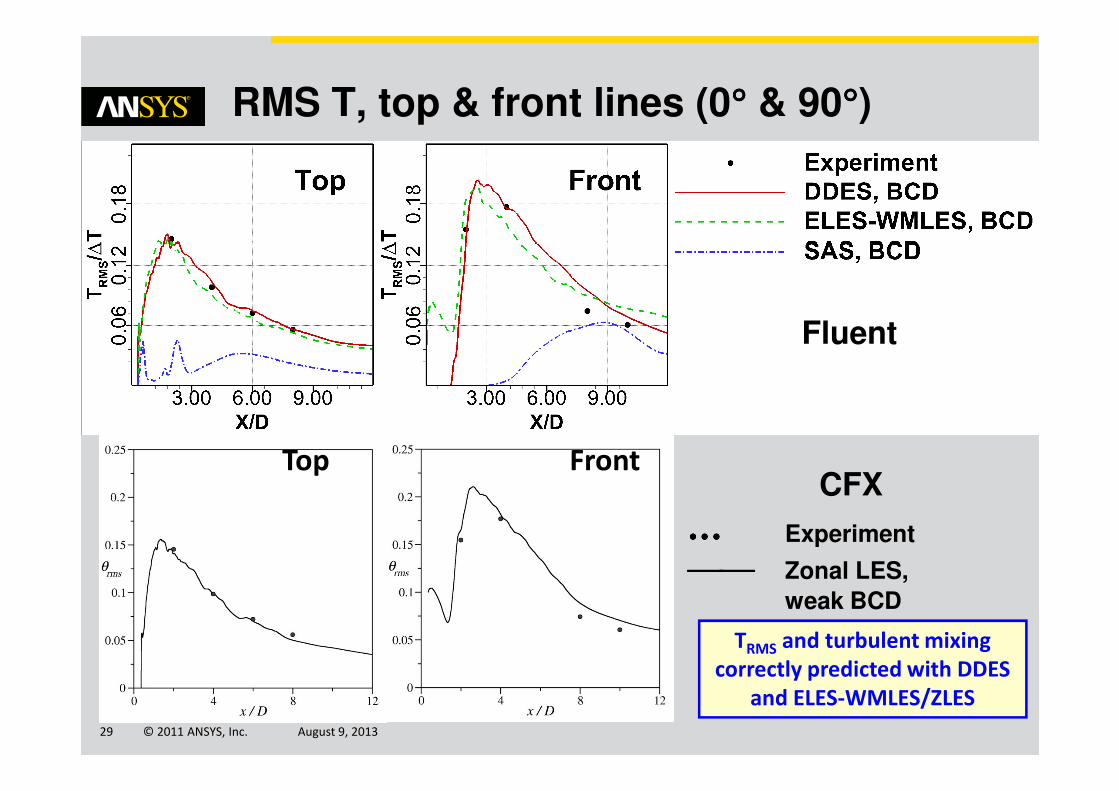
RMS T, top & front lines (0°°°° & 90°°°°)
Fluent
© 2011 ANSYS, Inc. August 9, 201329
Top FrontCFX
•••• •••• •••• Experiment
Zonal LES,
weak BCD
TRMS and turbulent mixing
correctly predicted with DDES
and ELES-WMLES/ZLES

RMS T, bottom & rear lines (180°°°°&270°°°°)
Fluent
© 2011 ANSYS, Inc. August 9, 201330
Bottom RearCFX
•••• •••• •••• Experiment
Zonal LES,
weak BCD

Summary
• OECD/NEA T-junction benchmark successfully investigated with ANSYS Fluent & ANSYS CFX
• All SRS models are able to accurately predict the mean and RMS velocity profiles, when used with low dissipation CD scheme
• Weak local instability can lead to URANS solution with SAS and slightly more dissipative advection schemes (BCD, HiRes)
© 2011 ANSYS, Inc. August 9, 201331
slightly more dissipative advection schemes (BCD, HiRes)• Can lead to delayed or not sufficient turbulent mixing• DDES model less sensitive to numerical settings
Best SRS approaches:
� Synthetic turbulence methods:Embedded LES in ANSYS FLUENT, Zonal LES in ANSYS CFX
� Less dependent on the applied advection scheme
• Very good agreement with the experimental data for sensitive Tmean and TRMS flow characteristics

© 2011 ANSYS, Inc. August 9, 201332
Questions ?