Embed Size (px)
Citation preview

Hindawi Publishing CorporationTexture, Stress, and MicrostructureVolume 2008, Article ID 294508, 7 pagesdoi:10.1155/2008/294508
Research ArticleInvestigation of the α-γ-α Phase Transformation in Steel:High-Temperature In Situ EBSD Measurements
I. Lischewski, D. M. Kirch, A. Ziemons, and G. Gottstein
Institut fur Metallkunde und Metallphysik, RWTH Aachen, Kopernikusstr 14, 52056 Aachen, Germany
Correspondence should be addressed to I. Lischewski, [email protected]
Received 29 June 2007; Accepted 8 January 2008
Recommended by Claude Esling
A newly developed laser powered heating stage for commercial SEMs in combination with automated established electronbackscatter diffraction (EBSD) data acquisition is presented. This novel experimental setup can be used to achieve more informa-tion about microstructure and orientation changes during grain growth, recrystallization, recovery, and phase transformations.First results on the α-γ-α phase transformation in steel within 886◦C–900◦C are presented.
Copyright © 2008 I. Lischewski et al. This is an open access article distributed under the Creative Commons Attribution License,which permits unrestricted use, distribution, and reproduction in any medium, provided the original work is properly cited.
1. INTRODUCTION
Most investigations into microstructure and texture evolu-tion are limited to postmortem analysis. Due to this limita-tion, there is a need for experimental setups permitting thein situ observation of microstructural changes of polycrys-talline materials. Besides in situ deformation, the main fo-cus lies on the in situ observation of temperature-influencedprocesses like grain growth, recrystallization, recovery, andphase transformations. An example is the α-γ-α phase trans-formation in low-carbon steels [1–3]. The observation of thisphase transformation by using the EBSD technique is limitedto the low-temperature regime, since it is a reversible processand cooling down instantaneously leads to a back transfor-mation to the low-temperature phase.
Due to this fact, a new laser powered heating stage wasdeveloped for commercial SEMs with the capacity to heatspecimens up to a temperature of 1000◦C. Data acquisitionutilizes a combination of the well-established electron back-scatter diffraction (EBSD) technique and orientation con-trast (OC) imaging. By using a combination of a heatingstage with the automated EBSD technique, we achieve a pow-erful tool for in situ observations of microstructural changesat elevated temperatures. Previous studies on annealing andrecrystallization experiments utilizing a combination of a hotstage and automated EBSD technique were limited to tem-peratures of about 400◦C [4]. Seward et al. performed in situSEM observations of the hcp-to-bcc-phase transformations
in titanium at 900◦C in a special SEM dedicated to high-temperature EBSD measurements [5].
In this study, a novel concept of a high vacuum heatingstage utilizing the energy of an infrared diode laser as heat-ing source is introduced. A great advantage of this approachis the very small size, because only the sample holder is situ-ated inside the SEM chamber and therefore no influence onthe electron beam occurs, which would lead to image drift ordistortion.
2. EXPERIMENTAL SETUP
2.1. SEM-EBSD system
In Figure 1, the whole SEM-EBSD system for the high-temperature investigations is presented. A Jeol JSM-6100SEM equipped with a standard eucentric goniometerstage and a scintillator-photomultiplier secondary electron-detector were used. The electron gun consists of a tungstenhairpin filament. The SEM possesses a standard EBSD detec-tor system Nordlys by HKL with a 70◦ tilted specimen stagefor EBSD analyses. The analog detector signal is then digi-tized by a NORDIF EBSP image processor supplied by theHamamatsu Photonics company and finally processed by thesoftware Channel 5 supplied by HKL technology. The EBSDdetector contains a four-quadrant forward scatter detectormounted around the phosphor-screen, which provides theOC images for enhancement of the microstructure investiga-tion by EBSD.

2 Texture, Stress, and Microstructure
Laser poweredheating unit
Temperature andlaser outputcontrol unit
RS232-interface
DiodeStar 810-100
Laser cooling unit
Electronbeam Beam/stage
control
Objective lense
Thermocouple
Heating stage
Optical fiberGoniometer
stage
SEM vacuum chamber
CCD camera
Phosphorscreen
AutomatedESBD system
Figure 1: Sketch of the experimental setup during in situ EBSD measurement.
Incomingcoolingconduit
Rear outer heatingshield
Front outer heating shield(copper, passive cooled)
Outgoing coolingconduit
1
3
4
4
5
(a)
1
1
234 4
56
7
(b)
Figure 2: Sketch of the heating stage. (a) Isometric front view depicting the basic outer parts. (b) Cross-section of the stage interior: (1)rear outer copper heating shield (active water cooled); (2) internal tantalum heating shield (not cooled); (3) SiC-sample holder—absorberplatelet; (4) specimen mount—tungsten clamp; (5) heating stage copper base (active water cooled); (6) optical fiber guidance; (7) goniometerstage adapter. Overall dimensions are approximately 8.2× 3.5× 3.6 cm3.
2.2. Laser-powered heating stage
The heating stage was developed at the Institute of PhysicalMetallurgy and Metal Physics of RWTH, Aachen University.The general construction is shown schematically in Figures2(a), 2(b) and contains three basic components. The mainbody consists of a small SiC sample holder functioning as theactual sample heater. The laser light source is a commercialdiode infrared laser. It is a continuous wave laser of 810 nmwavelength and maximum power output of 100 W with astability of ±2%. The incident infrared laser light which isemitted from an optical fiber (Figure 3) is heating the SiCsample holder only by absorption. The specimen is finallymounted onto the SiC sample holder by a tungsten clamp(Figures 2(a), 2(b)(4)).
The second component is the inner heating shield(Figure 2(b)(2)) which is not cooled and made of tantalumsheets, for high-temperature stability. The final componentconsists of the outer heating shield (Figures 2(a), 2(b)(3))which is made of copper. The rear part of the outer heat-ing shield and also the copper base of the heating stageare directly cooled by an integrated water cooling circuit(Figure 2(a)).
Thermocouple holderSiC sample holder
Incident laser beam
Optical fiber
Figure 3: Basic principle of the laser heating stage: SiC-sampleholder is heated up by absorbing the infrared laser light of wave-length 810 nm.
The temperatures of various attachments (EBSD-Detec-tor, secondary electron detector, and heating stage) in the

I. Lischewski et al. 3
= 100μm; copy of map1; step = 0.7μm; grid351× 262
(a)
= 100μm; copy of map1; step = 0.7μm; grid351× 262
(b)
= 100μm; copy of map1; step = 0.7μm; grid351× 262
(c)
= 100μm; copy of map1; step = 0.7μm; grid351× 262
(d)
Figure 4: α-γ phase transformation from 897◦C to 900◦C during heating up. Thick black lines mark grain boundaries of misorientationangles larger than 15◦; thin black lines larger than 5◦; red lines mark Σ3-twin boundaries; grey-shaded grains identify the bcc α-phase; coloredgrains are the fcc γ-phase. Disorientations from K-S between 0◦ and 5◦ are marked with white lines, larger than 5◦ yellow and larger than10◦ green lines.
SEM chamber are monitored by thermocouples for safetyreasons. Three thermocouples are used to monitor the heat-ing stage temperature (heating shield, sample holder) and tocontrol the desired temperature and the heating rate. Adjust-ment of the laser power output proceeds by an external com-puter connected via an RS232 interface using Labview 8.0(Figure 1). The heating stage can be operated at any tiltingangle and working distance WD down to 15 mm.
3. EXPERIMENTAL RESULTS
All experiments were conducted using the following EBSDparameters: tilting angle 70◦, WD = 15 mm, acceleratingvoltage 20 kV, aperture size 110 μm, 6–8 bands, 0.7 μm stepsize, and magnification x500. The measurement of an area of250 × 180 μm takes 45 minutes. A ferritic hot band was coldrolled down to 80% thickness reduction in reverse manner.After recrystallization, annealing the center part of the sam-ple was investigated subsequently to metallographic prepa-ration. The sample was heated up, respectively, cooled downin 1◦C steps in the temperature range between 880◦C and
920◦C. The temperature was directly measured by a thermo-couple placed inside the sample. The exact chemical com-position of the investigated material is given in Table 1. Alldata were collected using beam-controlled measurementsand the commercial Channel 5 software by HKL technol-ogy.
Figures 4(a)–4(d) shows acquired EBSD data maps ofidentical positions of the sample surface at four differenttemperatures between 897◦C and 900◦C for the α-γ phasetransformation. The thick black lines mark the grain bound-aries of misorientation angles larger than 15◦, the thin blacklines denote misorientations larger than 5◦, and the red linesindicate Σ3-twin boundaries. The grey-shaded area corre-sponds to the low-temperature bcc α-phase and the col-ored grains are the high-temperature fcc γ-phase. The phaseboundaries between the α- and γ-phases are colored in ref-erence to the Kurdjumov-Sachs (K-S) orientation relation-ship [6]. Disorientations from K-S between 0◦ and 5◦ aremarked with white lines, larger than 5◦ yellow and larger than10◦ green lines. In the following, mainly a phenomenologicalview on the achieved data is given to demonstrate what kind
4 Texture, Stress, and Microstructure
90756045
ϕ2 (◦)
0
2
4
6
8
f(g)
897898
899900
∼{112}〈111〉
∼{123}〈634〉
∼{011}〈211〉
(a) β-fibre (maximum density)
90756045
ϕ2 (◦)
20
55
90
φ/ϕ
1(◦
)
897898
899900
(b) β-fibre orientation
9060300
ϕ1 (◦)
0
2
4
6
8
f(g)
897898
899900
{011}〈100〉
{011}〈211〉
{011}〈111〉
{011}〈011〉
φ = 45◦
ϕ2 = 0◦
(c) α-fibre
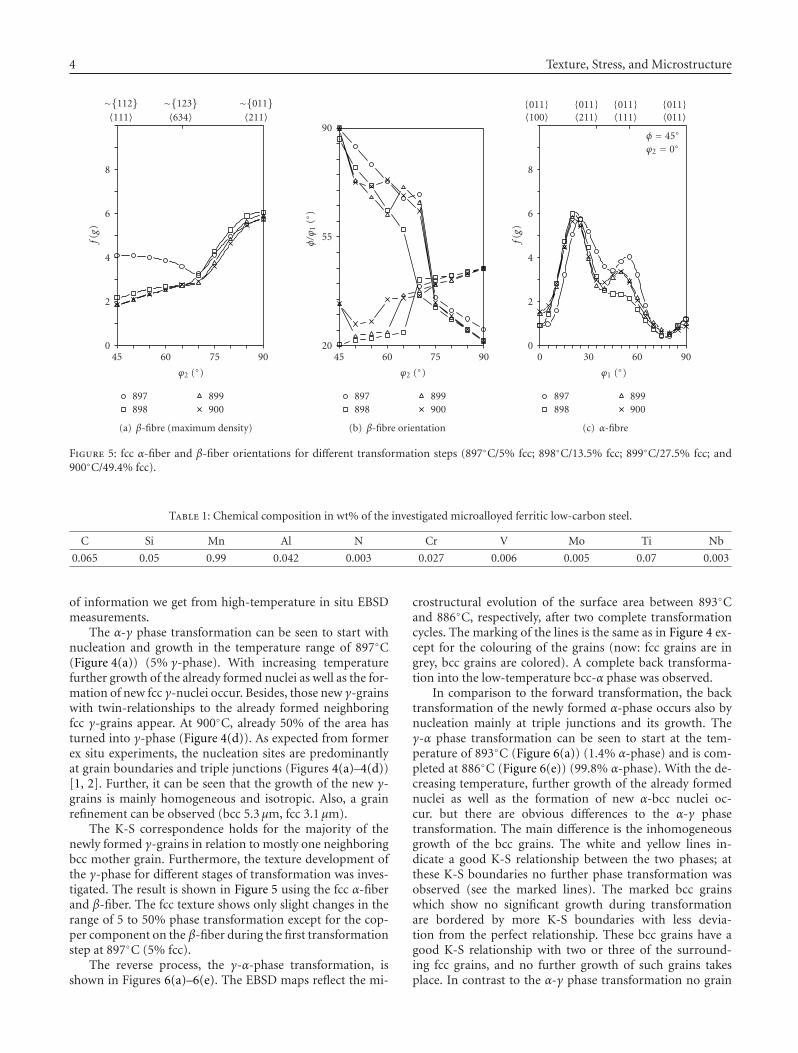
Figure 5: fcc α-fiber and β-fiber orientations for different transformation steps (897◦C/5% fcc; 898◦C/13.5% fcc; 899◦C/27.5% fcc; and900◦C/49.4% fcc).
Table 1: Chemical composition in wt% of the investigated microalloyed ferritic low-carbon steel.
C Si Mn Al N Cr V Mo Ti Nb
0.065 0.05 0.99 0.042 0.003 0.027 0.006 0.005 0.07 0.003
of information we get from high-temperature in situ EBSDmeasurements.
The α-γ phase transformation can be seen to start withnucleation and growth in the temperature range of 897◦C(Figure 4(a)) (5% γ-phase). With increasing temperaturefurther growth of the already formed nuclei as well as the for-mation of new fcc γ-nuclei occur. Besides, those new γ-grainswith twin-relationships to the already formed neighboringfcc γ-grains appear. At 900◦C, already 50% of the area hasturned into γ-phase (Figure 4(d)). As expected from formerex situ experiments, the nucleation sites are predominantlyat grain boundaries and triple junctions (Figures 4(a)–4(d))[1, 2]. Further, it can be seen that the growth of the new γ-grains is mainly homogeneous and isotropic. Also, a grainrefinement can be observed (bcc 5.3 μm, fcc 3.1 μm).
The K-S correspondence holds for the majority of thenewly formed γ-grains in relation to mostly one neighboringbcc mother grain. Furthermore, the texture development ofthe γ-phase for different stages of transformation was inves-tigated. The result is shown in Figure 5 using the fcc α-fiberand β-fiber. The fcc texture shows only slight changes in therange of 5 to 50% phase transformation except for the cop-per component on the β-fiber during the first transformationstep at 897◦C (5% fcc).
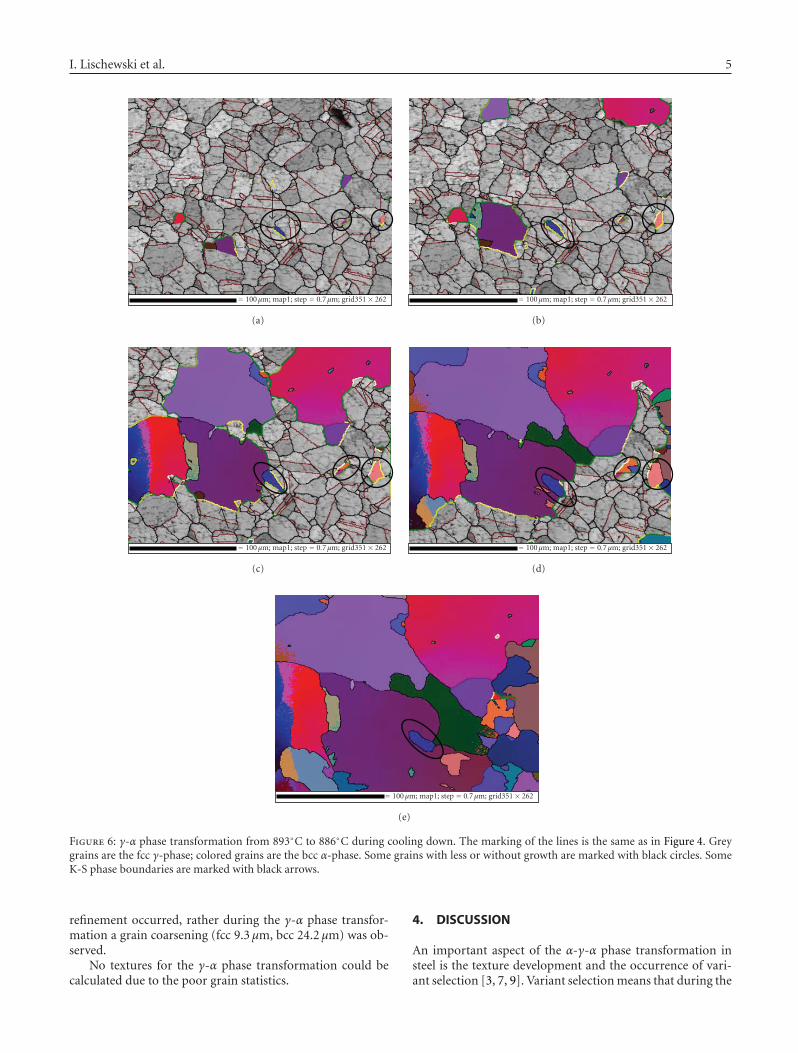
The reverse process, the γ-α-phase transformation, isshown in Figures 6(a)–6(e). The EBSD maps reflect the mi-
crostructural evolution of the surface area between 893◦Cand 886◦C, respectively, after two complete transformationcycles. The marking of the lines is the same as in Figure 4 ex-cept for the colouring of the grains (now: fcc grains are ingrey, bcc grains are colored). A complete back transforma-tion into the low-temperature bcc-α phase was observed.
In comparison to the forward transformation, the backtransformation of the newly formed α-phase occurs also bynucleation mainly at triple junctions and its growth. Theγ-α phase transformation can be seen to start at the tem-perature of 893◦C (Figure 6(a)) (1.4% α-phase) and is com-pleted at 886◦C (Figure 6(e)) (99.8% α-phase). With the de-creasing temperature, further growth of the already formednuclei as well as the formation of new α-bcc nuclei oc-cur. but there are obvious differences to the α-γ phasetransformation. The main difference is the inhomogeneousgrowth of the bcc grains. The white and yellow lines in-dicate a good K-S relationship between the two phases; atthese K-S boundaries no further phase transformation wasobserved (see the marked lines). The marked bcc grainswhich show no significant growth during transformationare bordered by more K-S boundaries with less devia-tion from the perfect relationship. These bcc grains have agood K-S relationship with two or three of the surround-ing fcc grains, and no further growth of such grains takesplace. In contrast to the α-γ phase transformation no grain
I. Lischewski et al. 5
= 100μm; map1; step = 0.7μm; grid351× 262
A
(a)
= 100μm; map1; step = 0.7μm; grid351× 262
(b)
= 100μm; map1; step = 0.7μm; grid351× 262
(c)
= 100μm; map1; step = 0.7μm; grid351× 262
(d)
= 100μm; map1; step = 0.7μm; grid351× 262
(e)
Figure 6: γ-α phase transformation from 893◦C to 886◦C during cooling down. The marking of the lines is the same as in Figure 4. Greygrains are the fcc γ-phase; colored grains are the bcc α-phase. Some grains with less or without growth are marked with black circles. SomeK-S phase boundaries are marked with black arrows.
refinement occurred, rather during the γ-α phase transfor-mation a grain coarsening (fcc 9.3 μm, bcc 24.2 μm) was ob-served.
No textures for the γ-α phase transformation could becalculated due to the poor grain statistics.
4. DISCUSSION
An important aspect of the α-γ-α phase transformation insteel is the texture development and the occurrence of vari-ant selection [3, 7, 9]. Variant selection means that during the

6 Texture, Stress, and Microstructure
phase transformation not all possible crystallographic vari-ants are equally selected, for example, among the 24 variantsof the K-S relationship. The α-γ-α phase transformation pro-ceeds by nucleation and growth. It is, therefore, of particularinterest which stage determines the final texture and whenand how variant selection occurs.
The results of the high-temperature in situ EBSD mea-surements for the α-γ phase transformation demonstratethat the nucleation of the newly formed phase occurs mainlyat triple junctions. Also, a good K-S correspondence inrelation to mostly one neighboring bcc mother grain wasfound for the majority of the newly formed γ-grains. The fcctexture changes only slightly with progressing phase transfor-mation for a transformation fraction of 5 to 50% except forthe copper component on the β-fiber during the first trans-formation step at 897◦C (5% fcc). The observed deviationof the fcc texture at low transformed volume fraction (5%fcc) is likely due to insufficient statistics because in this caseonly 123 grains could be investigated. Otherwise, the resultsshow that the fcc transformation texture does not signifi-cantly change with progressing transformation. From this re-sult we can conclude that the developed austenite texture isessentially determined by nucleation, that is, variant selec-tion takes place at the nucleation stage.
During the γ-α phase transformation, the nucleation oc-curs also mainly at triple junctions and large ferrite grainsdevelop. In contrast to the α-γ phase transformation, sev-eral ferrite grains exhibit a good K-S relationship not onlyto one but two or three of the surrounding austenite grains,and virtually no growth of such grains takes place. Therefore,the microstructure during the γ-α phase transformation con-sists of small bcc grains surrounded by K-S boundaries andlarge bcc grains with less K-S boundaries. Some of the smallbcc grains develop an elongated shape during the γ-α phasetransformation. This can be attributed to the fact that thephase transformation to ferrite is only feasible in a directionfree of K-S boundaries (see Grain A).
This effect of the K-S phase boundaries during the γ-α phase transformation was noticed also for the α-γ phasetransformation, but was not as obvious as during the backtransformation. This is associated with faster growth kineticsof the bcc grains during back transformation, by which thedifference between the K-S and non-K-S phase boundariesbecomes more pronounced and which also leads to a coars-ening of the ferrite grains. Because of the poor grain statisticsno bcc texture could be calculated for the γ-α phase transfor-mation.
The circumstance that an fcc grain has mostly onemother grain (good K-S matching) and a newly nucleatedbcc grain, very often more than one K-S neighbor, can be as-sociated with the so-called texture memory effect and the nu-cleation rate. From previous investigations it is known that atexture memory effect occurs during the α-γ-α phase trans-formation cycle [3, 7–9]. This means that the bcc texturesprior and subsequent to this transformation are compara-ble, apparently because a bcc grain transformed into an fccgrain by using one specific out of 24 K-S variants. Duringback transformation of the fcc grain, the same variant seemsto be preferred which leads to the same bcc orientation as
prior to transformation. If we assume that the nucleation rateduring the γ-α phase transformation is smaller than the α-γphase transformation, the following (extreme) case is possi-ble. A bcc grain possesses three fcc grains with a good K-S re-lationship during the α-γ phase transformation. During backtransformation at one of these three fcc grains which possi-bly share a triple junction, a new bcc grain nucleates with thesame variant as before. If this bcc grain nucleates inside thetriple junction, it will be surrounded only by K-S boundaries.In case of a small nucleation rate for the γ-α phase trans-formation, this bcc grain will be “isolated” in a subsequenttransformation cycle, and the new fcc grains which nucle-ate with a K-S relationship at this bcc grain will have a K-Sboundary only to this grain.
5. SUMMARY
A new laser-induced heating stage for commercial SEMs isintroduced with the capacity to heat specimens to a tempera-ture of 1000◦C whilst acquiring microstructural and crystal-lographic data by means of the EBSD technique. The in situinvestigations into the high-temperature α-γ-α phase trans-formation in a microalloyed low-carbon steel demonstratethe excellent performance of this laser powered heating stageand its potential for other high-temperature applications.The following first results are presented.
(i) Nucleation was observed mainly at triple junctions.(ii) The austenite texture is determined by nucleation.
(iii) The microstructure development during the γ-α phasetransformation is inhomogeneous.
(iv) The growth kinetics during the γ-α phase transforma-tion is faster than the α-γ transformation.
(v) The mobility of the transformation front depends onits proximity to a K-S relationship.
ACKNOWLEDGMENT
The authors would like to thank the Deutsche Forschungs-gemeinschaft for financial support for the research project“Investigation of variant selection during α-γ-α phase trans-formation in steel by using high temperature in situ EBSD ina high-resolution SEM” (Go 335/33-1).
REFERENCES
[1] I. Lischewski and G. Gottstein, “Orientation relationship dur-ing partial α-γ-phase transformation in microalloyed steels,”Materials Science Forum, vol. 495–497, part 1, pp. 447–452,2005.
[2] I. Lischewski and G. Gottstein, “In-situ investigation of trans-formation textures in microalloyed steels,” in Proceedings of theInternational Conference on Solid-Solid Phase Transformationsin Inorganic Materials (PTM ’05), p. 577, Phoenix, Ariz, USA,May-June 2005.
[3] G. Bruckner and G. Gottstein, “Transformation textures dur-ing diffusional α→γ→α phase transformations in ferritic steels,”ISIJ International, vol. 41, no. 5, pp. 468–477, 2001.
[4] F. J. Humphreys and M. Ferry, “Combined in-situ annealingand EBSD of deformed aluminium alloys,” Materials Science Fo-rum, vol. 217–222, part 1, pp. 529–534, 1996.

I. Lischewski et al. 7
[5] G. G. E. Seward, S. Celotto, D. J. Prior, J. Wheeler, and R. C.Pond, “In situ SEM-EBSD observations of the hcp to bcc phasetransformation in commercially pure titanium,” Acta Materi-alia, vol. 52, no. 4, pp. 821–832, 2004.
[6] G. Kurdjumov and G. Sachs, “Uber den Mechanismus derStahlhartung,” Zeitschrift fur Physik, vol. 64, p. 225, 1930.
[7] N. Yoshinaga, K. Kawasaki, H. Inoue, B. C. De Cooman, and J.Dilewijns, “Modern LC and ULC sheet steels for cold forming:processing and properties,” in Proceedings of the 15th AnnualACM, p. 569, Mainz, Aachen, Germany, 1998.
[8] I. Lonardelli, N. Gey, H.-R. Wenk, M. Humbert, S. C. Vogel, andL. Lutterotti, “In situ observation of texture evolution duringα→β and β→α phase transformations in titanium alloys inves-tigated by neutron diffraction,” Acta Materialia, vol. 55, no. 17,pp. 5718–5727, 2007.
[9] R. K. Ray and J. J. Jonas, “Transformation textures in steels,”International Materials Review, vol. 35, no. 1, pp. 1–36, 1990.