Embed Size (px)
Citation preview
Investigations of Slag Properties and Reactions
Mikael Persson
Doctoral Thesis
School of Industrial Engineering and Management Division of Materials Process Science
Royal Institute of Technology SE-100 44 Stockholm
Sweden
Akademisk avhandling som med tillstånd av Kungliga Tekniska Högskolan i Stockholm, framlägges för offentlig granskning för avläggande av Teknologie doktorsexamen, fredagen den 25 maj 2007, kl. 10.00 i salongen på biblioteket ,
Osquars backe 31, Kungliga Tekniska Högskolan, Stockholm
ISRN KTH/MSE--07/14--SE+THMETU/AVH ISBN 978-91-7178-650-0
Mikael Persson. Investigations of Slag Properties and Reactions KTH School of Industrial Engineering and Management Division of Materials Process Science Royal Institute of Technology SE-100 44 Stockholm Sweden ISRN KTH/MSE--07/14--SE+THMETU/AVH ISBN 978-91-7178-650-0 © The Author
ii
iii
ABSTRACT
The present dissertation describes the efforts directed towards the development of computational tools to support process modeling. This work is also a further development of the Thermoslag® software developed in the Division of Materials Process Science, KTH. The essential parts of the thesis are a) development of a semi-empirical model for the estimation of the molar volumes/densities of multicomponent slags with a view to incorporate the same in the model for viscosities and b) further development of the viscosity model for application towards fluoride- and manganese containing slags, as for example, mould flux slags and manganese slags used in ferromanganese production. c) estimating fluoride emissions from industrial slags and mould fluxes. d) study the reaction between carbon particles, hematite containing slags and in oxygen containing atmosphere. The model for the estimation of molar volume is based on a correlation between the relative integral molar volume of a slag system and the relative integral molar enthalpies of mixing of the same system. The integral molar enthalpies of the relevant systems could be evaluated from the Gibbs energy data available in the Thermoslag® software. The binary parameters were evaluated from experimental measurements of the molar volumes. Satisfactory correlations were obtained in the case of the binary silicate and aluminate systems. The model was extended to ternary and multi component systems by computing the molar volumes using the binary parameters. The model predictions showed agreements with the molar volume data available in literature. The model was used to estimate the molar volumes of industrial slags as well as to trace the trends in molar volume due to
compositional variations. The advantage of the present approach is that it would enable prediction of molar volumes of slags that are compatible with the thermodynamic data available. With a view to extend the existing model for viscosities to F--containing slags, the viscosities of mould flux slags for continuous casting in steel production have been investigated in the present work. The measurements were carried out utilizing the rotating cylinder method. Seven mould fluxes used in the Swedish steel industry and the impact of Al2O3 pick up by mould flux slags on viscosities were included in the study. The results showed that even relatively small additions of Al2O3 are related with a significant increase in viscosity. A similar experimental technique was employed to estimate the viscosity of twelve synthetic slags corresponding to composition of the raw materials used in ferromanganese production. The flow rate of the liquid slag, which is determined by the slag viscosity, is an important parameter affecting the reduction rate of manganese oxide. The results show a clear correlation between manganese oxide content and viscosity. An increase of MnO in the slag lowers the viscosity. The measured viscosities have also been connected to the structure of the silicates. The fluoride loss from the binary slag systems Al2O3-SiO2, CaO-SiO2 and MgO-SiO2 with additions of CaF2 was studied by thermogravimetric (TGA) studies. The Arrhenius activation energy for the evaporation reaction of fluorides was found to be dependent on temperature and slag chemistry for the slags studied. A correlation between the activation energy for fluoride evaporation and activity of SiO2 in the slag melt was established. This relationship obtained for the binary systems appears also to be suitable for the ternary systems Al2O3-CaO-SiO2 with CaF2 addition, which indicates a possibility to estimate the fluoride emissions from industrial slags and mould fluxes. A Confocal Scanning Laser Microscopy was used to investigate the reaction between carbon particles in hematite containing slags and in oxygen containing atmosphere. Experiments with varying temperature and slags with varying FeOx content were carried out. The general trends were that the particle size decrease was more rapid with increase of FeOx amount and/or temperature was increased. Keywords: slags, oxide melts, density, molar volume, thermodynamics, model,
viscosity, mould flux, continuous casting, fluorides, anthracite, ferromanganese, confocal scanning laser microscopy, coal-slag reaction
iv
v
ACKNOWLEDGMENTS
First, and most of all, I would like to express my sincere gratitude and appreciation to my supervisor Professor Seshadri Seetharaman for his guidance and constant support during the work of this doctoral thesis. I am grateful to Associate Professor Ragnhild E. Aune, for every day help with both technical and theoretical concerns during this project. I would also like to thank Professor Sridhar Seetharaman for giving me the opportunity to work with him at Carnegie Mellon University, Pittsburgh, USA. Dr. Mårten Görnerup is gratefully acknowledged, especially for bringing practical and industrial aspects to light. I am very thankful to Professor Jiayun Zhang for giving me the opportunity to come and complete some of the work at USTB, University of Science and Technology Beijing. Her guidance and interesting discussions have been most helpful in carrying out this work. Special thanks to M. Sc. Mikael Ersson for fruitful discussions and valuable comments and to Mr. Peter Kling for help and assistance with experimental equipment. The author would also like to thank all of the colleagues and friends at the Division of Metallurgy. Financial support from Jernkontoret and traveling grants from the Axel Hultgren Fund is also acknowledged. Finally, I would also like to thank my family for their support. I am especially grateful to my wife, Sara, for her never-ending support and encouragement.
Stockholm, April 2007
Mikael Persson

vi
vii
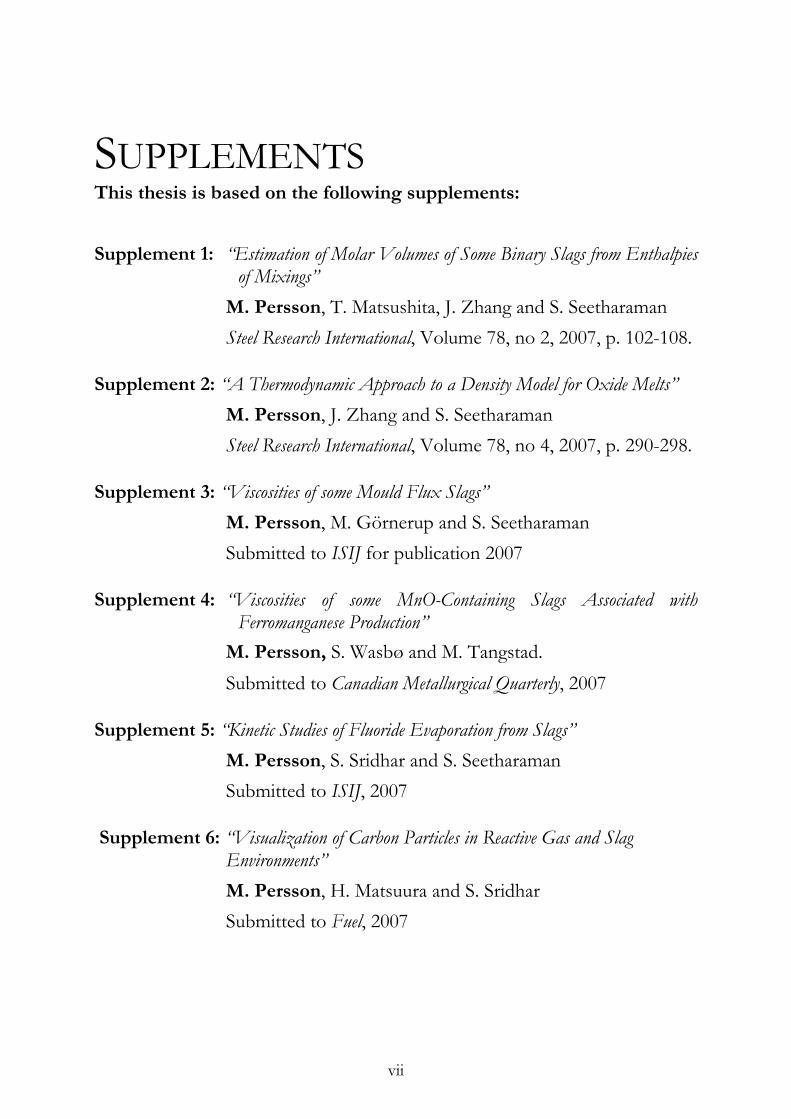
SUPPLEMENTS This thesis is based on the following supplements:
Supplement 1: “Estimation of Molar Volumes of Some Binary Slags from Enthalpies of Mixings”
M. Persson, T. Matsushita, J. Zhang and S. Seetharaman Steel Research International, Volume 78, no 2, 2007, p. 102-108.
Supplement 2: “A Thermodynamic Approach to a Density Model for Oxide Melts” M. Persson, J. Zhang and S. Seetharaman Steel Research International, Volume 78, no 4, 2007, p. 290-298.
Supplement 3: “Viscosities of some Mould Flux Slags” M. Persson, M. Görnerup and S. Seetharaman Submitted to ISIJ for publication 2007
Supplement 4: “Viscosities of some MnO-Containing Slags Associated with Ferromanganese Production”
M. Persson, S. Wasbø and M. Tangstad. Submitted to Canadian Metallurgical Quarterly, 2007
Supplement 5: “Kinetic Studies of Fluoride Evaporation from Slags” M. Persson, S. Sridhar and S. Seetharaman Submitted to ISIJ, 2007
Supplement 6: “Visualization of Carbon Particles in Reactive Gas and Slag Environments”
M. Persson, H. Matsuura and S. Sridhar Submitted to Fuel, 2007
viii
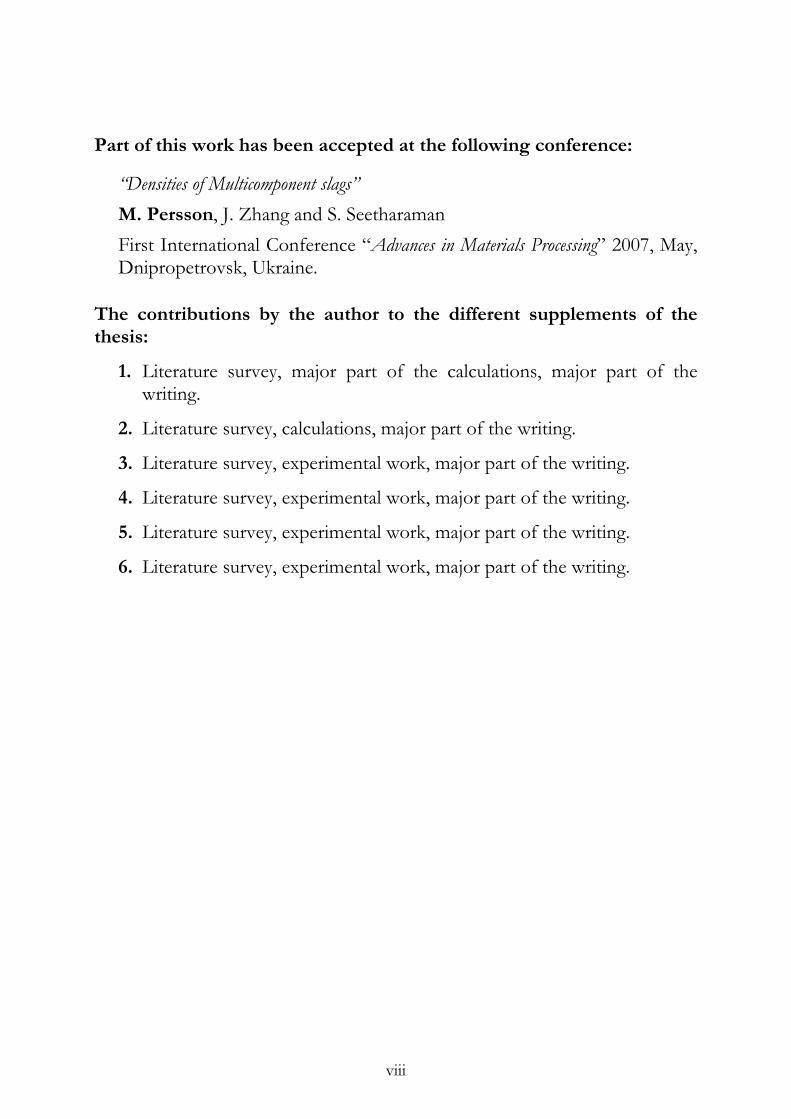
Part of this work has been accepted at the following conference:
“Densities of Multicomponent slags” M. Persson, J. Zhang and S. Seetharaman First International Conference “Advances in Materials Processing” 2007, May,
Dnipropetrovsk, Ukraine.
The contributions by the author to the different supplements of the thesis:
1. Literature survey, major part of the calculations, major part of the writing.
2. Literature survey, calculations, major part of the writing.
3. Literature survey, experimental work, major part of the writing.
4. Literature survey, experimental work, major part of the writing.
5. Literature survey, experimental work, major part of the writing.
6. Literature survey, experimental work, major part of the writing.
ix
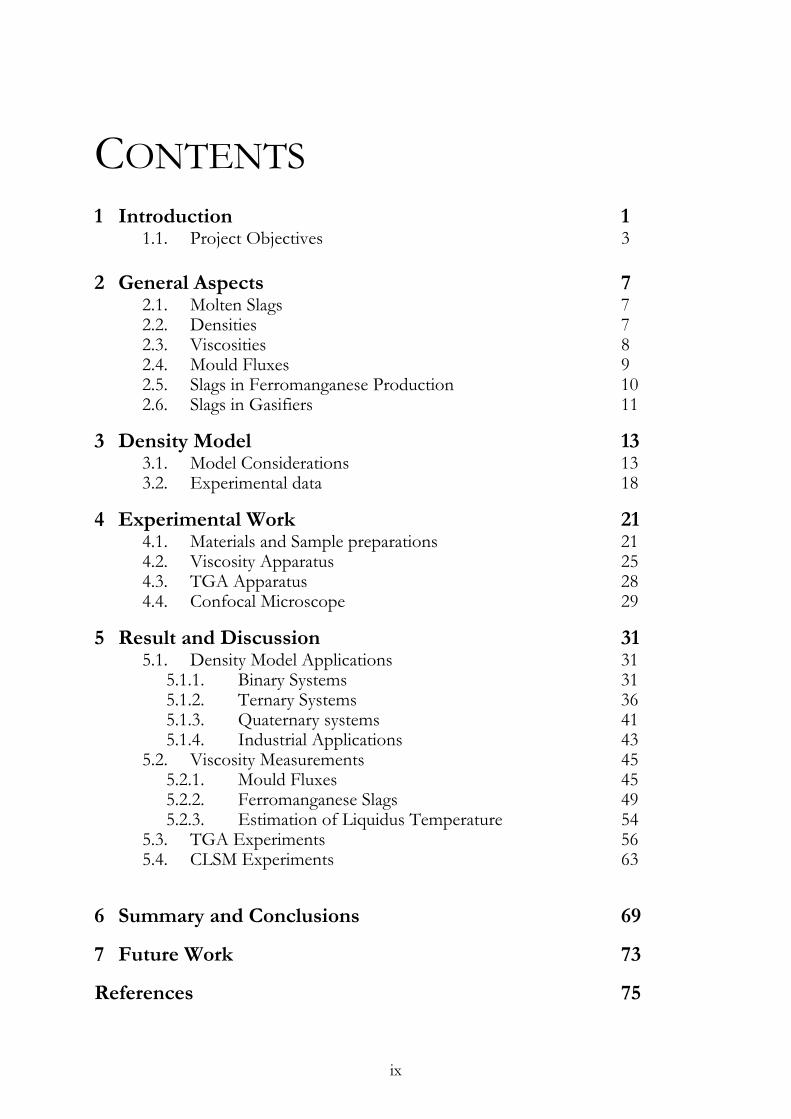
CONTENTS 1 Introduction 1
1.1. Project Objectives 3
2 General Aspects 7 2.1. Molten Slags 7 2.2. Densities 7 2.3. Viscosities 8 2.4. Mould Fluxes 9 2.5. Slags in Ferromanganese Production 10 2.6. Slags in Gasifiers 11
3 Density Model 13 3.1. Model Considerations 13 3.2. Experimental data 18
4 Experimental Work 21 4.1. Materials and Sample preparations 21 4.2. Viscosity Apparatus 25 4.3. TGA Apparatus 28 4.4. Confocal Microscope 29
5 Result and Discussion 31 5.1. Density Model Applications 31
5.1.1. Binary Systems 31 5.1.2. Ternary Systems 36 5.1.3. Quaternary systems 41 5.1.4. Industrial Applications 43
5.2. Viscosity Measurements 45 5.2.1. Mould Fluxes 45 5.2.2. Ferromanganese Slags 49 5.2.3. Estimation of Liquidus Temperature 54
5.3. TGA Experiments 56 5.4. CLSM Experiments 63
6 Summary and Conclusions 69
7 Future Work 73
References 75

Contents
x
1
Chapter 1
INTRODUCTION
High temperature processes today are extremely complex in view of the optimization of the various unit processes with respect to the chemistry of the process, the technological aspect, process economy as well as environmental considerations. In the modeling of materials and energy processes, it is very important to have the optimum process conditions, which, in turn, need a clear understanding of the properties of the systems involved under the process conditions. Slags form an important part in metallurgical processes. Instead of the age-old concept of slag being considered as a receptor of waste materials in the process, it is realized that slags have important functions such as being a protector of the metal from oxidation, receptor of unwanted elements as well as supplier of alloying elements. Slags are also found to have an important role in the case of energy processes such as coal-combustion. The ash in the coal forms a slag and the properties of this slag is very important in the gasification of coal. In this respect, material and energy processes have the common interest in understanding the properties and phenomena involving slags. The importance of understanding the properties of slags, especially in steelmaking processes are indicated by the world-wide efforts to measure and model the slag properties. The slag properties are commonly divided into two parts, viz. the thermochemical properties and the thermophysical properties. The former comprises of the integral molar properties like enthalpies and integral molar Gibbs energies as well as partial molar properties like the activities of the slag components. On the other hand, the physical properties include, among others, viscosities, thermal diffusivities and surface tensions. Molar volumes, which can be classified under thermochemical properties, come under the physical properties as densities. The specific heats are common to both the categories. Both these types of data are necessary for process optimization, for thermochemical modeling, heat
Introduction
2
and mass transfer calculations as well as Computerized Fluid Dynamics (CFD) computations. The classification of the properties into the above-mentioned two categories is some what ambiguous as both these are structure-related and consequently, must be related to each other. Thus, the properties should be mutually consistent. This is an essential condition in process modeling as mutually inconsistent data regarding the properties of the same slag necessitates the introduction of empirical coefficients in order to achieve convergence. The Division of Materials Process Science at KTH has been involved in the investigations of the thermochemical and thermophysical properties of metallurgical slags, with special emphasis on iron- and steelmaking. The aim has been to generate accurate data by careful experimentation and modeling of the properties in order to extrapolate the data reliably as functions of temperature and composition. These efforts are supported by the Swedish Steel Producers Association in a project aiming at development of a toolbox towards process optimization. Inter property correlation has been the focus point in this project. The division has earlier linked the viscosities of binary metallic systems to the Gibbs energies of mixing. The activation energies of binary silicate systems were combined with the Gibbs energies of Mixing in order to estimate the activation energies for viscous flow in ternary silicates. Liquidus temperatures were estimated from the activation energies of viscous flow. The present work is expected to widen this approach to other properties. The author of this thesis realized that it is also very important to understand the micro phenomena involving slags. As part of the research work, it was felt important to observe the kinetics of reactions between coal and slag by the new visualization technique involving confocal microscopy. It is believed that this component will add an extra dimension to the study of slags.
Chapter 1
3
1.1 Project Objectives The general aim of this Ph. D. work is to understand the properties of slags and micro phenomena underlying the same. With respect to the slag properties, it was aimed to develop computational tools for slag properties that could provide reliable and mutually consistent data for the benefit of the Swedish Steel Industry. More specifically, the project aims at the modeling of the densities/molar volmes of multicomponent slags and deploying this in the already existing viscosity model, referred to as the KTH-model. The model has been incorporated in a commercial software developed in the division, Thermoslag®. This software, in the present version consists of three different modules, viz. viscosity module, sulphide capacity module and the activity module. The basic description of the silicate slag is based on the Temkin-Lumsden approach, wherein the anions and cations are classified into separate subgroupings in order to calculate the entropies of mixing. Silicate ions which have complicated structure are “split” into Si4+ and O2- ions and these ions are placed in the respective subgroupings. The viscosity description is based on the Eyring equation which involves the estimation of the densities of slags. At the present stage, the model approximates the densities of slags by linearization. The molar volume (which is in fact the reciprocal of density multiplied by the mol mass) is also a thermodynamic property. Thus, it should be possible to establish a correlation between molar volume and thermodynamic properties, which, in turn, would enable the exploitation of the abundance of thermodynamic data towards the estimation of slag densities. This will also enable generation of mutually consistent thermodynamic and density data for complex slags. As a consequence of the present results, the molar volumes are described by a rigorous approach linking the same with the enthalpies of mixing and efforts are currently made to incorporate the same in the Thermoslag software. Another important process phenomena with respect to slags is the study of viscosities of slags relevant to specific processes. The mould fluxes added to the caster during the continuous casting of steel has important functions. The slag film protects the steel from oxidation, functions as a lubricant between the mould shell and the steel, receives the inclusions coming out thereby enabling the production of a cleaner steel etc. In the continuous casting of steel, different fluxes are used for different steel grades. It was felt necessary by the Swedish steel industry to have an understanding of the physical properties of mould flux slags in order to optimize the fluxes. A consorted effort was made in the Division of Materials Process Science to generate reliable data on different mould fluxes used in Swedish continuous casting processes and provide a data base for the steel industry. The properties studied were viscosities, thermal diffusivities, surface and interfacial
Introduction
4
tensions, tensile strengths of slag films and compressiblities. The present author had focused his efforts on the viscosities of mould flux slags. The Thermoslag software does not contain the viscosity data for CaF2 – containing slags. The present work is expected to enable an expansion of the software towards fluoride slags. One important aspect of fluoride slags is the evaporation of fluorides from mould flux slags. Fluoride loss results generally in increased viscosities of the slags, leading the altered lubrication and heat transfer properties. Fluoride evaporation rate can vary with mould flux slag composition and temperature. It was necessary to systematize the knowledge of fluoride evaporation and correlate with the thermodynamic properties of slags. Fluoride loss from silicate slags are generally known to occur due to the reaction:
( ) ( ) ( )slagCaOgSiFslagSiOslagCaF 2)(2 422 +→+ (1.1.1)
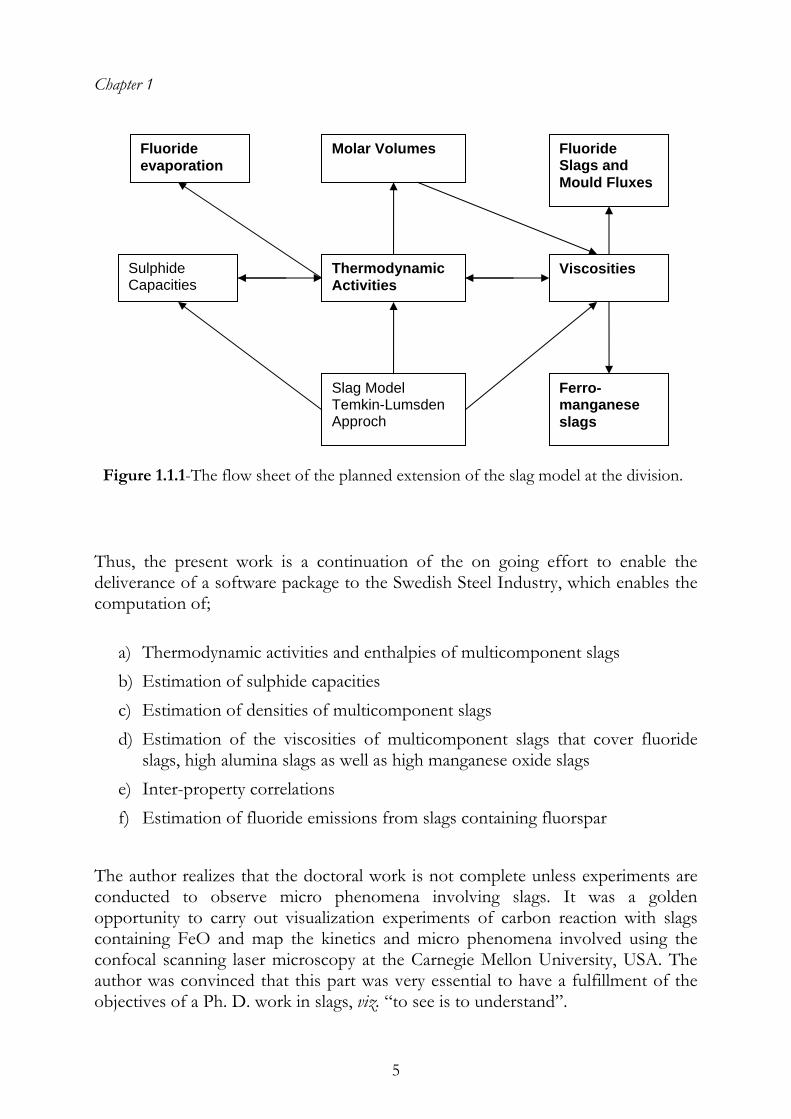
Thus, the fluoride evaporation rate should be dependent on the activity of silica in the slag. An effort was made in the present work to make a systematic study of fluoride evaporation rate in three different binary systems, CaO-SiO2, MgO-SiO2 as well as Al2O3-SiO2 with different calcium fluoride contents and correlate the same with the activity of silica in these melts. This effort would enable an extension of the Thermoslag software to predict the fluoride evaporation phenomena which is a kinetic property. With respect to viscosities, there is a lack of reliable viscosity data for slags involved in the production of ferroalloys, especially, ferromanganese. In the optimization of ferromanganese production is the viscosity of great importance since the reduction rate is highly dependent on the flow rate of the slag. Efforts were made as part of the present work to generate reliable viscosity data for high manganese slags. Slags associated with ferromanganese production consist also of fairly high quantities of alumina. The effect of alumina addition was also examined since the viscosity model in Thermoslag software has been found to have limitations with respect to high alumina slags. It is expected that this would enable the incorporation of these data in Thermoslag software and expand the application of the database for ferroalloys as well. Thus, the present thesis work is intended to trace the following flow diagram shown in figure 1.1.1.
Chapter 1
5
Sulphide Capacities
Molar Volumes
Thermodynamic Activities
Slag Model Temkin-Lumsden Approch
Viscosities
Fluoride Slags and Mould Fluxes
Fluoride evaporation
Ferro-manganese slags
Figure 1.1.1-The flow sheet of the planned extension of the slag model at the division.
Thus, the present work is a continuation of the on going effort to enable the deliverance of a software package to the Swedish Steel Industry, which enables the computation of;
a) Thermodynamic activities and enthalpies of multicomponent slags b) Estimation of sulphide capacities c) Estimation of densities of multicomponent slags d) Estimation of the viscosities of multicomponent slags that cover fluoride
slags, high alumina slags as well as high manganese oxide slags e) Inter-property correlations f) Estimation of fluoride emissions from slags containing fluorspar
The author realizes that the doctoral work is not complete unless experiments are conducted to observe micro phenomena involving slags. It was a golden opportunity to carry out visualization experiments of carbon reaction with slags containing FeO and map the kinetics and micro phenomena involved using the confocal scanning laser microscopy at the Carnegie Mellon University, USA. The author was convinced that this part was very essential to have a fulfillment of the objectives of a Ph. D. work in slags, viz. “to see is to understand”.

Introduction
6
7
Chapter 2
GENERAL ASPECTS
2.1 Molten Slags
Silicate melts are ionic in nature. The structures of these molten slags are complicated due to the polymerization of silicate anions. Si atoms are tetrahedrally bonded to four oxygen atoms. In silicate slags, the SiO4
4- tetrahedra may form more complicated structures as Si2O7
6-, Si3O108-, cyclic polymers and even three
dimensional network of bridged silica tetrahedra. Increasing content of basic oxides in silicate slags will break down these polymers into smaller units. On the other hand, amophoteric oxides like Al2O3 added to the silicate slags will contribute to the chain structure. The understanding of slag structures is of great importance, as the formation of structures will be widely reflected in the thermophysical and thermodynamic properties of these melts. The Division of Materials Process Science at KTH has developed a slag model1, 2
based on the Temkin’s3 description of the entropy of ionic melts and a Lumsden’s4 formulation of the silicate structures. Lumsden’s description simplified the silicate network as a completely dissociated ionic system with Si4+ and O2- ions.
2.2 Densities
Various models to estimate the density of molten slags are described in literature. An additive method5, which has been commonly used, obtains molar volume, ,mV
from the following two equations:
ρ...+++
= kkjjiim
xMxMxMV (2.2.1)

General Aspects
8
...+++= kkjjiim VxVxVxV (2.2.2)
where ρ is the density, and is the mole fraction respectively the molecular mass for component i. The partial molar volume,
ix iM
V , is usually assumed to be equivalent to molar volume of the pure substance, . This approximate method gives satisfactory results for ideal systems and systems that show small deviations from ideal behavior. In reality, however, slags for industrial applications, may not be treated as ideal solutions. As mentioned, silicate structures are complex, silica and alumina slags form polymerized units such as chains, rings and three dimensional network. The use of a constant value for
imV ,
2SiOV and 32OAlV may not be theoretical compatible as well, since the silicate and aluminate structures vary with composition.
A model developed by Bottinga and Weill6 used a constant value for 2SiOV and estimated values of V for several oxides. The model claimed to predict good density values within a limited silica range. Grau and Masson7 presented a model in which the partial molar volume of SiO2 varied with structure, but the method is complicated to apply on multi component system. Another model, Botting et al.8 considers composition dependency of partial molar volumes of alumina-silica melts. The model has been successful in estimating densities, but is only suitable for comparatively high contents of silica and considered complex. Mills et al.9 have developed a model where V for alumina-silica slags vary with composition. The model claims to be successfully applied to many different systems.
2.3 Viscosities Viscosity is another physical property closely related to silicate structures. The viscosity of molten slags at a given temperature is dependent of structures, hence the composition. Pure SiO2 consists of three dimensional network and has an extremely high viscosity. The entering of basic oxides into the melt leads to the breakdown of the silicate network and a lowering the viscosity of the melt. A majority of metallurgical slags contain relatively high amounts of metal oxides, which exhibit lower viscosity.
Chapter 2
9
The viscosity of slags may also be affected by the presence of solid particles in the slag. Viscosities of two phase mixtures have been reported in literature10-12. The results have shown that a formation of a two phase mixture may lead to non-Newtonian behavior and have a significant impact on the viscosity. Still, the presence of solid particles below a critical level may not affect the Newtonian behavior of the liquid.
2.4 Mould Fluxes
The major part of the steel produced around the world is continuously cast. Mould fluxes are added during the casting process to ensure a smooth functioning. The flux plays an important role in enabling better process performance and products with less defects. The main functions of the mould flux are13, 14;
• protect the steel from oxidation,
• lubrication at the mould/metal interface,
• provide the optimum level of horizontal heat transfer and
• absorb inclusions from the steel. The viscosity of the mould flux is a key parameter determining the optimum casting conditions. An empirical rule usually used to predict the cast conditions are based on casting speed and viscosity. A number of experimental investigations have earlier been carried out in order to determine viscosity data for mould flux slags, both industrial ones as well as synthetic slags with compositions close to industrial mould fluxes15-24. Almost all mould powders contains CaF2 as it lowers the viscosity and melting point of the fluxes. The fluorine content varies normally between 4 and 10 wt-%, but some powders can contain as high as 20 wt-% of fluoride. The CaF2 content is a problem in the view of both process as well as environmental considerations, due to the high volatility of the fluorine-containing species. The fluoride evaporation from mould flux slags could also be a problem in the case of viscosity measurements, since the flux composition varies with time during the measurements. The issue regarding fluoride vapor loss from mould fluxes has earlier been investigated in the Division of Material Process Science25. The fluorine volatilization is, however, not the only factor affecting the flux composition with time. It is well known that the mould flux slag is a receptor of oxide inclusions. This absorption of inclusions,
General Aspects
10
together with the evaporation of fluoride spices is likely to affect the chemical composition of the mould flux. A change in composition may have an influence on the physical properties of the mould flux, thereby affecting its performance in the casting process. These are important aspects to consider when modeling the casting process.
2.5 Slags in Ferromanganese Production
Ferromanganese is mainly produced in electric submerged arc furnaces by reduction of manganese ores with a carbon source, primarily coke. The slag properties, both thermochemical and physical properties, are of great significance in the optimization of the ferromanganese production. While the thermochemical properties are a key parameter when estimating the distribution of elements between slag and metal phases, physical properties are essential in modeling of the process. Among the physical properties, viscosity is considered often as most important and might affect the production of ferromanganese in several ways26:
• The slag and metal separation is enhanced by a lower viscosity, while a high viscous slag might lead to entrapment of metal droplets resulting in worse metal yield in the process.
• In modeling of the process is the flow pattern of liquid phase crucial, which in turn is widely dependent of the slag viscosity.
• The slag viscosity has a significant impact on the reduction rate and the efficiency of the extraction process.
• Increase or decrease of slag viscosity during the process may lead to changes in temperature at the coke bed boundary, which affects the heat distribution in the coke bed zone and the final MnO content of the slag.
• Viscous slags might lead to formation of a foaming slag, since a high slag viscosity retains gas bubbles emerging from reaction between carbon and slag.
The slag formed in the ferromanganese process consist to a major part of five oxides; MnO, Al2O3, CaO, MgO, SiO2. Several studies of viscosity data of slags with manganese oxide content higher than ten mass percent is available in literature27-31, but only one of these studies included experimental measurements in the above mentioned system consisting of five components31. In this study, the
Chapter 2
11
viscosity measurements were limited to few compositions and carried out in a limited temperature range.
2.6 Slags in Gasifiers The slags in slagging gasifiers are very complex and consist of several oxides. Its major components are aluminum, calcium, iron and silicon oxides, but small amounts of potassium, sodium, magnesium, phosphorus and titanium oxides are also present. The evolution of the slag in the gasifiers is of importance in the optimization of operating the process, as the slagging behavior can be accountable for a variety of concerns related to the gasifier operation32-34.
• Non-optimum control of the slag variations may lead to unwanted fouling of downstream gas-handling equipment
• excessive refractory erosion
• thermo-physical properties that are not optimum for process control Several studies have been carried out on the physico-chemical aspects of ash evolution35-37. As the fuel feedstock gets in contact with the slag, it is expected that only minerals remain, which are considered to dissolve into the molten oxide slag. An essential aspect is however, interaction between particles that are not completely combusted and the slag.

General Aspects
12
13
Chapter 3
DENSITY MODEL
As mentioned earlier, the models available in literature for estimations of slag densities are based on numerical fits of experimental data. An alternative model for density predictions have been developed, based on the logical relationship between molar volumes and thermodynamics properties of slags, which both are structure- dependent.
3.1 Model Considerations
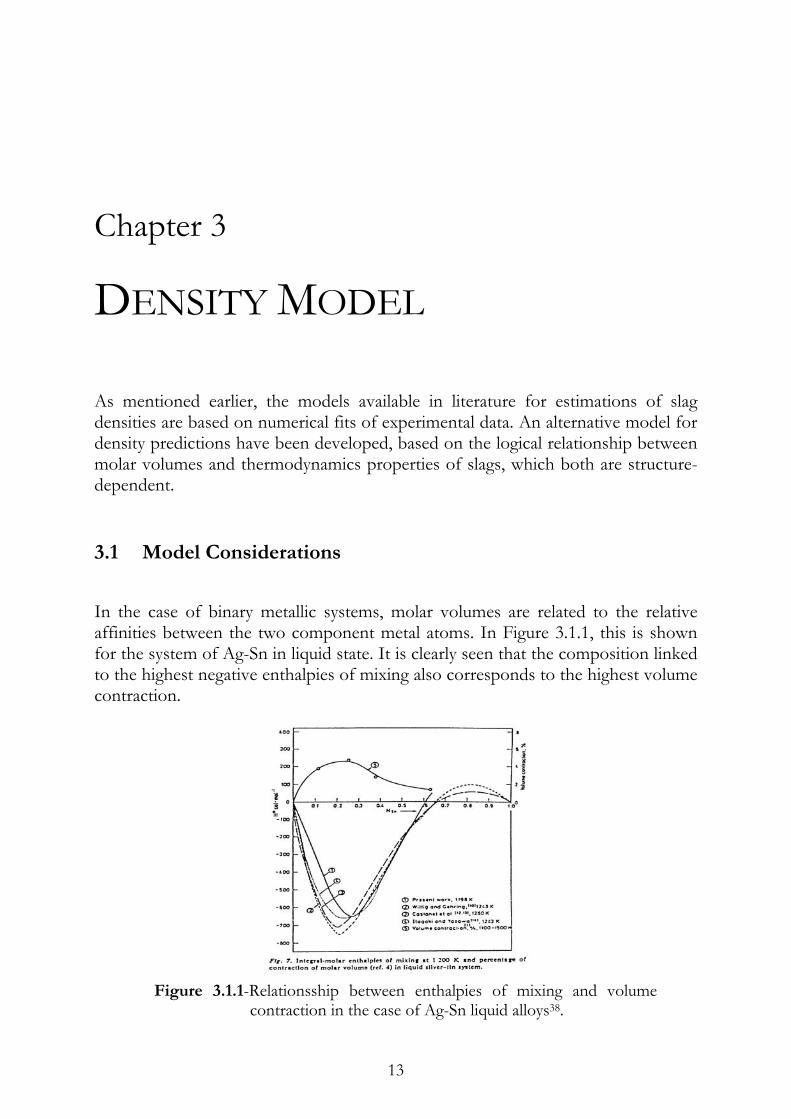
In the case of binary metallic systems, molar volumes are related to the relative affinities between the two component metal atoms. In Figure 3.1.1, this is shown for the system of Ag-Sn in liquid state. It is clearly seen that the composition linked to the highest negative enthalpies of mixing also corresponds to the highest volume contraction.
Figure 3.1.1-Relationsship between enthalpies of mixing and volume
contraction in the case of Ag-Sn liquid alloys38.
Density Model
14
Further addition of Sn atoms, beyond the stoichiometric composition Ag2Sn, leads to repulsive interactions leading to positive enthalpies of mixing. A tendency towards this is as well indicated in volume contraction even though experimental values are not available. In an analogous manner for silicate melts, the attractive forces between the cations and anions are expected to be reflected in both the relative integral molar enthalpies of mixing and in the molar volumes. Since both these properties directly can be correlated to the bondings between the nearest and next-nearest neighbor ions in the system, it can be expected to have a direct correlation. By examining a number of binary silicate systems, a relationship between the two properties was arrived39, presented in equation (3.1.1):
RTH
VxV M
iimi
M
λ=∑ ,
(3.1.1)
where is the relative integral molar volume and MV ∑ imiVx , represents the average molar volume. λ is a constant, MH the relative integral molar enthalpies for mixing, R the gas constant and T is the temperature. The enthalpies of mixing can be evaluated from ThermoSlag software® developed in the Division of Materials Process Science, KTH. The software is based on a thermodynamic model developed in the division by Björkvall et al.1, 2. The equations developed for the relative molar Gibbs energy of mixing, are presented below:
MG
( ) ( )∑ ∑ ∑
−=
Ω++= +
1,1
)(,),(ln 4
mi
OCCCjCiSiCiCi
M jiyyyTfyyRTpG (3.1.2)
where the interaction variables is defined as follows: )(, OCC jiΩ
( )( )( )( ) .....2)(,
6)(,
5
)(,4
)(,3
)(,2
)(,1
)(,
+−⋅Ω+Ω
+−⋅Ω+Ω+⋅Ω+Ω=Ω
CjCiOCCOCC
CjCiOCCOCCOCCOCCOCC
yyT
yyTTjiji
jijijijiji
(3.1.3)
Chapter 3
15
and the ionic fraction of cation i within the cation grouping, yCi, as:
∑=
= m
jCj
CiCi
N
Ny
1
(3.1.4)
It should be mentioned that the following expression is valid for in equation (3.1.2), when
),( 4+SiyTf314 ≤+Si
y :
0),( 4 =+Si
yTf (3.1.5)
and when 314 ≥+Si
y :
( )3*),( 4 SiSiSi yyAyTf −⋅=+ (3.1.6)
where 31* =Siy , ( )3* 1−Δ−= SiL yGA and LGΔ is the change of Gibbs energy for fusion of silica, [J/mol] 7.53T-35600=Δ LG .
From equation (3.1.2) and Gibbs-Helmholtz equation, the enthalpies of mixing, can be calculated by the following relationship:
( )[ ]( ) ( ) ⎥
⎥⎦
⎤
⎢⎢⎣
⎡⎟⎟⎠
⎞⎜⎜⎝
⎛Ω
∂
∂+
∂
∂= ∑ ∑
−= +=
+
1,1 ,1
)(, /11
/, 4
mi mij
OCjCiCjCi
SiM TyyTT
TyTfH (3.1.7)
The relative integral molar volume, , can be estimated when combining equation (3.1.1) and (3.1.7). The relationship between , and molar volume of pure component i can be expressed as:
MVMV
∑−==i
imimME VxVVV , (3.1.8)
where EV is the excess molar volume, is the mole fraction and is the molar volume of the pure component i.
ix imV ,
Density Model
16
Experimental density data can also be used to obtain for molten slags by the following equation:
mV
ρ
∑= i
ii
m
MxV (3.1.9)
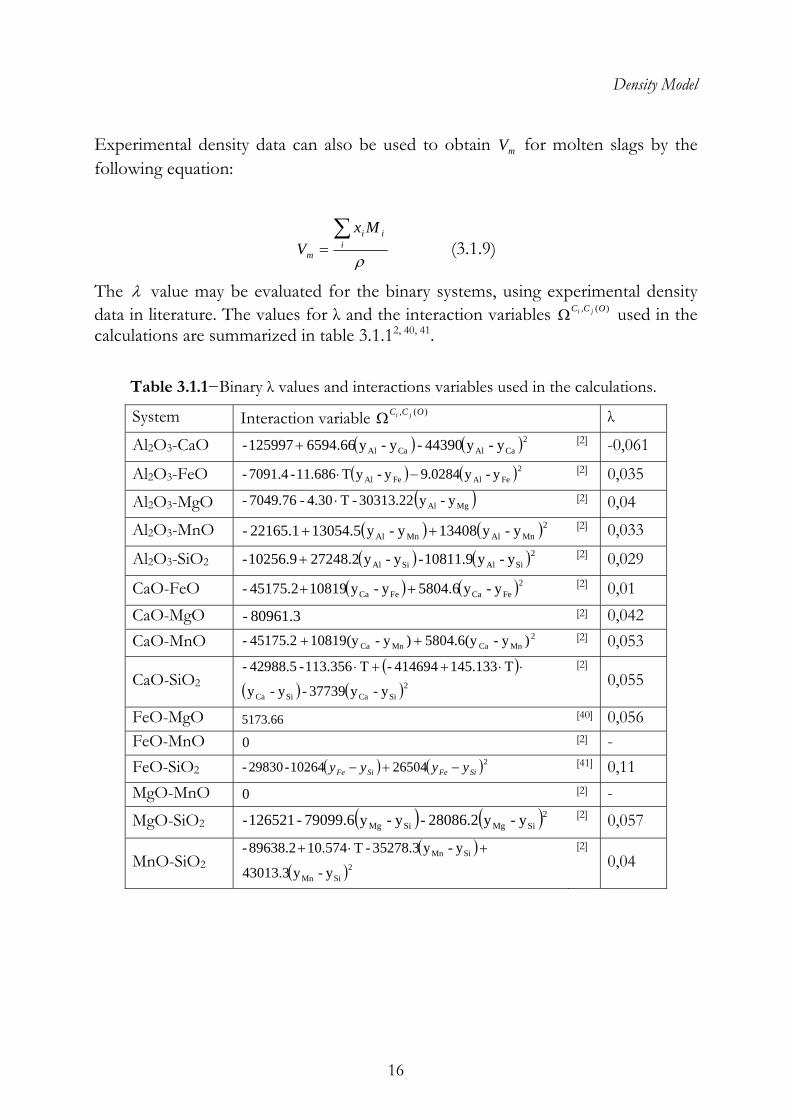
The λ value may be evaluated for the binary systems, using experimental density data in literature. The values for λ and the interaction variables )(, OCC jiΩ used in the calculations are summarized in table 3.1.12, 40, 41.
Table 3.1.1−Binary λ values and interactions variables used in the calculations.
System Interaction variable )(, OCC jiΩ λ
Al2O3-CaO ( ) ( )2CaAlCaAl y-y44390-y-y6594.66125997- + [2] -0,061
Al2O3-FeO ( ) ( )2FeAlFeAl y-y0284.9y-yT11.686 - 7091.4- − ⋅ [2] 0,035
Al2O3-MgO ( )MgAl y-y30313.22-T4.30-7049.76- ⋅ [2] 0,04 Al2O3-MnO ( ) ( )2
MnAlMnAl y-y13408y-y13054.522165.1- ++ [2] 0,033
Al2O3-SiO2 ( ) ( )2SiAlSiAl y-y10811.9-y-y27248.210256.9- + [2] 0,029
CaO-FeO ( ) ( )2FeCaFeCa y-y5804.6y-y1081945175.2- ++ [2] 0,01
CaO-MgO 80961.3- [2] 0,042 CaO-MnO 2
MnCaMnCa )y-5804.6(y)y-10819(y45175.2- ++ [2] 0,053
CaO-SiO2( )
( ) ( )2SiCaSiCa y-y37739-y-y
T145.133414694-T113.356-42988.5- ⋅⋅++⋅ [2]
0,055
FeO-MgO 5173.66 [40] 0,056 FeO-MnO 0 [2] - FeO-SiO2 ( ) ( )22650410264 - 29830- SiFeSiFe yyyy − + − [41] 0,11 MgO-MnO 0 [2] - MgO-SiO2 ( ) ( )2
SiMgSiMg y-y28086.2-y-y79099.6-126521- [2] 0,057
MnO-SiO2( )
( )2SiMn
SiMn
y-y43013.3
y-y35278.3-T10.57489638.2- +⋅+ [2]
0,04
Chapter 3
17
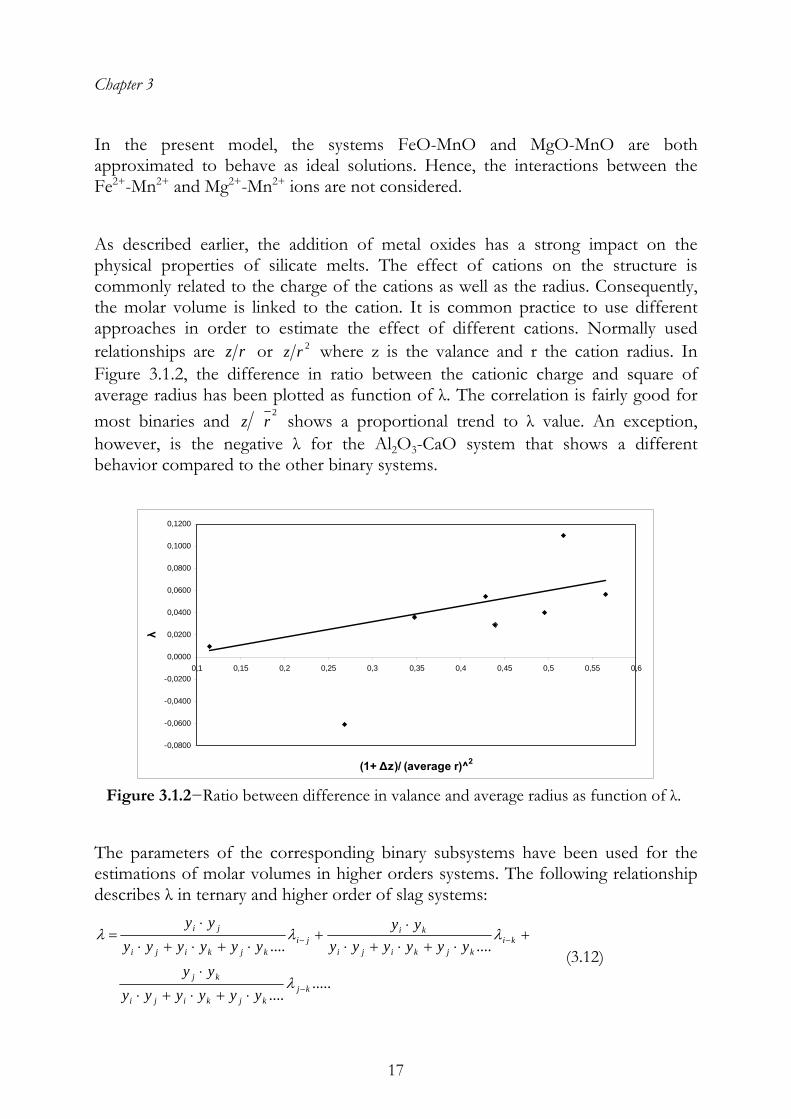
In the present model, the systems FeO-MnO and MgO-MnO are both approximated to behave as ideal solutions. Hence, the interactions between the Fe2+-Mn2+ and Mg2+-Mn2+ ions are not considered. As described earlier, the addition of metal oxides has a strong impact on the physical properties of silicate melts. The effect of cations on the structure is commonly related to the charge of the cations as well as the radius. Consequently, the molar volume is linked to the cation. It is common practice to use different approaches in order to estimate the effect of different cations. Normally used relationships are rz or 2rz where z is the valance and r the cation radius. In Figure 3.1.2, the difference in ratio between the cationic charge and square of average radius has been plotted as function of λ. The correlation is fairly good for most binaries and 2
rz shows a proportional trend to λ value. An exception, however, is the negative λ for the Al2O3-CaO system that shows a different behavior compared to the other binary systems.
-0,0800
-0,0600
-0,0400
-0,0200
0,0000
0,0200
0,0400
0,0600
0,0800
0,1000
0,1200
0,1 0,15 0,2 0,25 0,3 0,35 0,4 0,45 0,5 0,55 0,6
(1+ Δz)/ (average r)^2
λ
Figure 3.1.2−Ratio between difference in valance and average radius as function of λ.
The parameters of the corresponding binary subsystems have been used for the estimations of molar volumes in higher orders systems. The following relationship describes λ in ternary and higher order of slag systems:
.........
........
kjkjkiji
kj
kikjkiji
kiji
kjkiji
ji
yyyyyyyy
yyyyyyyy
yyyyyyyy
−
−−
⋅+⋅+⋅
⋅
+⋅+⋅+⋅
⋅+
⋅+⋅+⋅
⋅=
λ
λλλ (3.12)
Density Model
18
3.2 Experimental Data
The density measurements available in literature are generally related to discrepancies. This is usually attributed to the experimental difficulties associated with the experimental techniques adopted. Various methods have been used to carry out density measurements and the experimental uncertainties associated with these methods are usually in the range of 2 %5. It should be pointed out that the diversity among different density measurements is larger and most commonly encountered in the case of FeO-containing slags. In FeO-containing slag systems, Fe exists as Fe2+, Fe3+ as well as free iron. The Fe distribution between these spices is evidently dependent on the oxygen potential and the temperature. This makes density measurement of FeO slags complicated, due to the difficulty controlling the composition of the melt. Consequently, most liquid FeO slags contains of a significant amount of Fe3+ ions. The presences of Fe3+ will generally decrease the density in systems containing FeO 42. The best approach to evaluate λ and to verify the model would be to use density data obtained from the same research group or at least the same measuring technique. However, this is not possible. The lack of experimental data is obvious in most systems, and usually the system has only been investigated in one or couple of studies, if it has been studied at all. Basically, one has to use the data available without regarding the measuring technique or the research group. Still, as expected, it was clearly seen that, whenever it was possible to evaluate the binary and ternary system with data form the same investigation, the model predictions correlated very well to the experimental data. The density data used to evaluate λ and to verify the model predictions have mainly been determined using the Archimedes method, maximum bubble pressure method and the sessile drop method. In the case of some systems, there have been widely different sets of experimental values reported. The choice of the value of λ was based on the compatibility of the value with ternary systems. All λ values are positive with the exception for the Al2O3-CaO system where λ has been evaluated to a negative value. No data at all has been obtained for binary or higher order systems containing both Al2O3 and MnO. This difficulty could be overcome by means of a correlation between λ and the ratio of cationic charge difference to square of average radius presented in the Figure 3.2. This relationship can be used to estimate the λ constant in the Al2O3-MnO system, which is one of the approximations in the model.
Chapter 3
19
There have also been some difficulties in retrieving reliable density data of pure oxides from literature. Densities for pure molten Al2O3 and SiO2 have been investigated by Mitin and Nagibin43, and Bacon et al44, respectively. The data for the density of pure CaO, FeO, MgO, MnO at liquid state (supercooled) have not been found in literature. Molar volume for MgO and MnO had been estimated by Mills9. Molar volume for CaO and FeO has been estimated by extrapolation from binary system45.

Density Model
20
21
Chapter 4
EXPERIMENTAL WORK
The experimental work included in the thesis consists of several parts;
• Viscosity measurements of seven mould fluxes used in the Swedish steel industry and additional measurements to investigate the increase of alumina content in the same.
• Viscosity measurements of twelve synthetic slags associated with ferromanganese production.
• TG analyses of slags containing calcium fluoride to estimate the evaporation rate of fluoride species from the slags.
• CLSM observations of reactions between carbon and hematite containing slags or reactive atmosphere.
4.1 Materials and Sample Preparation
All slags used in the experimental work were subjected to premelting to ensure a homogenous composition of the slag. In the experiments where synthetic slags were used, all the slag components were dried in a muffle furnace for 24 hours prior to mixing. In the case of CaF2, there was the risk of hydrolysis. Hence, the dehydration procedure was carried out at lower temperatures under reduced pressure. The mould fluxes were decarburized by using a muffle furnace at 1073 K for 48 h. The weighed-in amounts of pure oxides were then thoroughly mixed. Graphite crucibles were employed to premelt all the various slags in an induction furnace, with the exception of the hematite containing slag studied in the CLSM. In this case, alumina crucibles were used instead, to avoid reduction of the hematite. The premelting was carried out in a resistance furnace. The temperature was kept just below the experimental temperatures later used in the CLSM to eliminate the
Experimental Work
22
risk of solid phase in the slag due to the saturation of alumina in the slag caused by the use of alumina crucibles. The slag was solidified in the crucibles and crushed using a ceramic mortar. The completely molten slags for viscosity experiments were poured directly in the crucibles used later in measurements, while the slag for TG analyses were quenched on a thick steel plate and crushed with a ceramic mortar. Samples of all the premelted slags were subjected to chemical analysis presented in Table 4.1.1-4.1.4. In view of the possibility of the fluorine volatilization during the viscosity experiments involving mould fluxes, samples were taken at two different stages of the experimental sequence, viz. after premelting as well as after the viscosity measurements. Special consideration was also taken in order to ascertain that the slags were homogenous and there were no concentration gradient along the height of the crucible. Three samples from the solidified slag mass after furnace cooling were chemically analyzed viz. one sample taken 1 cm below the surface, one in the middle, and one taken 1 cm above the bottom of the crucible. All the results presented in Table 4.1.2. Anthracite was used as carbon source in the CLSM experiments and its composition is presented in Table 4.1.5.
Table 4.1.1- Analysis result of CaF2-containing slags used in TGA experiments. Composition as premelted in wt-%.
CaF2 SiO2 CaO Al2O3 MgO 8.84 55.7 34.5 - - 4.93 60.1 34.9 - - Slag A 3.18 61.3 35.4 - - 9.04 59.4 - - 30.2 4.93 64.6 - - 29.7 Slag B 3.49 65.7 - - 29.9 8.49 83.4 - 7.1 - 4.44 87.5 - 7.2 - Slag C 3.49 88.0 - 7.5 - 10.2 38.6 41.4 9.5 - Slag D 5.24 46.8 38.7 9.0 -
Chapter 4
23
Table 4.1.2- Analysis result of the mould fluxes used in viscosity experiments. Composition as premelted and at three locations in the crucibles after the experiments in wt-%.
Slag Condition SiO2 CaO MgO Al2O3 TiO2 FeO MnO P2O5 N2O K2O Cr2O3 V2O5 C S F
As premelted 31.9 41.2 1.5 7.1 0.38 0.8 3.69 0.05 6.75 0.21 <0.02 <0.02 0.04 0.11 7.10 Top part 30.5 39.5 1.5 6.8 0.37 4.67 3.45 0.05 6.40 0.20 <0.02 <0.02 0.03 0.10 7.00 Middle part 30.6 39.8 1.5 6.8 0.36 4.57 3.48 0.05 6.36 0.20 <0.02 <0.02 0.02 0.11 6.90
Slag A
Bottom part 30.5 39.4 1.4 6.8 0.36 4.97 3.40 0.05 6.29 0.21 <0.02 <0.02 0.02 0.11 6.95
As premelted 31.0 40.4 1.5 9.3 0.37 0.8 3.51 0.05 6.63 0.20 <0.02 <0.02 0.05 0.11 7.05 Top part 30.8 39.8 1.5 9.3 0.37 1.57 3.42 0.06 6.54 0.21 <0.02 <0.02 0.04 0.10 7.00 Middle part 30.8 39.9 1.5 9.3 0.36 1.55 3.43 0.05 6.57 0.22 <0.02 <0.02 0.02 0.11 7.10
Slag A + wt-%
2.5 Al2O3
Bottom part 31.0 40.0 1.5 9.3 0.37 1.55 3.45 0.06 6.52 0.21 <0.02 <0.02 0.02 0.10 7.65
As premelted 32.0 38.0 1.4 11.4 0.36 0.76 3.29 0.05 6.23 0.23 <0.02 <0.02 0.04 0.12 6.80 Top part 29.9 37.7 1.4 11.0 0.35 1..4 3.25 0.05 6.13 0.22 <0.02 <0.02 0.02 0.10 6.85 Middle part 30.4 39.1 1.5 11.4 0.36 1.50 3.39 0.05 6.39 0.22 <0.02 <0.02 <0.01 0.11 6.75
Slag A + wt-%
5.0 Al2O3
Bottom part 31.8 38.1 1.4 11.5 0.35 1.47 3.30 0.05 6.18 0.23 <0.02 <0.02 <0.01 0.10 6.90
As premelted 37.5 31.3 0.2 2.4 0.04 12.9 0.13 0.13 6.52 0.16 <0.02 <0.02 0.01 0.03 9.30 Top part 36.8 30.6 0.2 2.4 0.03 15.5 0.14 0.14 6.30 0.15 <0.02 <0.02 0.02 0.03 9.20 Middle part 36.3 30.1 0.2 2.3 0.03 15.3 0.13 0.13 6.18 0.15 0.02 <0.02 0.02 0.03 9.25
Slag B
Bottom part 37.0 30.4 0.2 2.4 0.03 15.5 0.14 0.14 6.37 0.15 <0.02 <0.02 0.02 0.03 8.85
As premelted 35.8 44.7 2.9 4.2 0.05 0.76 <0.10 0.02 4.64 0.21 <0.02 <0.02 0.02 0.05 9.60 Top part 35.8 44.8 2.9 4.2 0.05 0.90 0.10 <0.01 4.58 0.21 <0.02 <0.02 0.01 0.04 9.80 Middle part 35.9 45.0 2.9 4.2 0.05 0.91 <0.10 <0.01 4.55 0.21 <0.02 <0.02 0.01 0.04 9.60
Slag C
Bottom part 35.7 44.7 2.9 4.2 0.05 0.90 0.10 <0.01 4.58 0.21 <0.02 <0.02 0.02 0.04 9.50
As premelted 40.0 35.0 0.8 4.3 0.8 1.09 0.04 0.08 11.65 0.51 0.01 <0.01 0.03 0.07 7.80 Top part 39.1 34.4 0.8 4.2 0.8 3.74 <0.10 0.05 10.73 0.41 <0.02 <0.02 0.01 0.06 7.70 Middle part 39.1 34.4 0.8 4.2 0.8 3.69 <0.10 0.05 10.65 0.42 0.02 <0.02 0.02 0.06 7.70
Slag D
Bottom part 39.3 34.3 0.8 4.2 0.8 3.74 <0.10 0.05 10.77 0.41 <0.02 <0.02 0.02 0.06 7.60
As premelted 38.8 33.9 0.7 6.4 0.12 1.01 0.10 0.08 11.23 0.50 <0.02 <0.02 0.03 0.07 8.30 Top part 38.5 34.3 0.8 6.4 0.12 1.35 0.11 0.06 11.14 0.47 <0.02 <0.02 0.01 0.07 8.15 Middle part 38.6 34.3 0.8 6.4 0.13 1.35 0.11 0.05 11.06 0.48 <0.02 <0.02 0.01 0.06 8.05
Slag D + wt-%
2.5 Al2O3
Bottom part 38.4 34.3 0.8 6.4 0.12 1.35 0.11 0.05 11.07 0.47 <0.02 <0.02 0.01 0.07 8.10
As premelted 38.1 33.6 0.7 8.5 0.12 1.01 <0.10 0.08 11.01 0.49 <0.02 <0.02 0.02 0.06 8.85 Top part 37.2 33.4 0.7 8.4 0.12 1.26 <0.10 0.06 10.70 0.48 <0.02 <0.02 0.03 0.07 8.85 Middle part 37.5 32.8 0.7 8.4 0.12 1.24 <0.10 0.06 10.58 0.48 <0.02 <0.02 0.01 0.07 8.70
Slag D + wt-%
5.0 Al2O3
Bottom part 37.1 33.3 0.8 8.4 0.12 1.24 <0.10 0.06 10.64 0.48 <0.02 <0.02 <0.01 0.07 8.70
As premelted 39.0 32.8 2.2 5.9 0.13 1.18 0.18 0.06 10.74 0.38 <0.02 <0.02 0.34 0.05 10.05 Top part 38.5 31.9 2.2 6.5 0.14 1.85 0.59 0.05 11.15 0.45 <0.02 <0.02 0.02 0.05 9.70 Middle part 37.9 31.8 2.1 6.4 0.13 1.84 0.60 0.05 11.17 0.44 <0.02 <0.02 0.01 0.05 9.50
Slag E
Bottom part 38.1 31.9 2.1 6.5 0.13 1.86 0.60 0.05 11.20 0.44 <0.02 <0.02 0.01 0.05 9.70
As premelted 27.7 39.6 0.6 8.7 0.44 1.20 7.99 0.08 7.34 0.25 <0.02 <0.02 0.04 0.08 7.70 Top part 27.7 39.3 0.6 8.7 0.43 1.81 8.09 0.09 6.91 0.24 0.01 <0.01 0.03 0.07 7.60 Middle part 27.5 39.5 0.6 8.7 0.43 1.77 7.98 0.08 6.93 0.23 <0.02 <0.02 0.04 0.07 7.35
Slag F
Bottom part 27.6 39.6 0.6 8.6 0.43 1.77 7.98 0.09 6.75 0.23 <0.02 <0.02 0.05 0.07 7.75
As premelted 35.9 32.1 1.2 16.0 0.79 3.66 0.10 0.31 2.91 1.73 0.02 0.02 0.03 0.19 6.30 Top part 34.7 30.8 1.1 15.4 0.76 7.18 <0.10 0.26 2.78 1.62 0.03 0.03 0.02 0.18 6.00 Middle part 34.7 30.7 1.2 15.4 0.76 7.36 <0.10 0.26 2.73 1.61 0.03 0.03 <0.01 0.20 6.00
Slag G
Bottom part 34.3 30.6 1.1 15.3 0.76 7.94 <0.10 0.28 2.80 1.67 0.03 0.02 0.02 0.21 6.25
Experimental Work
24
Table 4.1.3-Analysis result of MnO-containing slags used in viscosity
experiments. Composition as premelted in wt-%. Slag A Slag B A 50 A 40 A 30 B 50 B 40 B 30 MnO 51.08 40.80 30.61 50.69 40.49 31.47 Al2O3 9.49 11.34 13.14 24.65 29.84 33.15 SiO2 20.8 25.29 29.58 14.38 17.34 20.19 CaO 15.04 18.21 21.36 10.63 12.76 14.99 MgO 4.39 5.25 6.12 0.35 0.36 0.62 FeO 0.03 0.05 0.06 0.04 0.04 0.06 K2O <0.01 <0.01 <0.01 <0.01 <0.01 <0.01 TiO2 <0.01 <0.01 <0.01 <0.01 <0.01 <0.01 BaO 0.03 0.02 0.01 0.03 0.03 0.02 CaO/SiO2 0.723 0.720 0.722 0.739 0.736 0.742 (CaO+MgO)/(Al2O3+SiO2) 0.641 0.640 0.643 0.281 0.278 0.293 NBO/T 3.77 2.86 2.23 1.86 1.18 0.814 Slag C Slag D C 50 C 40 C 30 D 50 D 40 D 30 MnO 49.44 39.96 31.96 50.84 40.62 32.14 Al2O3 23.82 27.33 28.86 8.09 9.66 11.44 SiO2 22.02 27.2 32.65 15.62 19.44 22.07 CaO 3.69 4.49 4.87 21.13 25.43 28.69 MgO 1.51 1.83 2.15 4.94 6.00 6.65 FeO 0.06 0.05 0.06 0.04 0.04 0.04 K2O <0.01 <0.01 <0.01 <0.01 <0.01 <0.01 TiO2 <0.01 <0.01 <0.01 <0.01 <0.01 <0.01 BaO 0.04 0.03 0.02 0.03 0.03 0.02 CaO/SiO2 0.168 0.165 0.149 1.35 1.31 1.30 (CaO+MgO)/(Al2O3+SiO2) 0.113 0.116 0.114 1.10 1.08 1.05 NBO/T 1.36 0.85 0.555 5.43 4.21 3.44
Table 4.1.4- Analysis results hematite-containing slag used in CLSM experiments. Composition as premelted in wt-%.
Slag Type SiO2 Al2O3 CaO Fe2O3 A 62.36 15.25 22.39 - B 56.32 14.30 23.00 6.38 C 53.68 13.18 23.06 10.08 D 50.12 12.35 19.69 17.84
Table 4.1.5- Composition of the anthracite used in the CLSM experiments. A particle size in the range of 370-540 μm was used in the experiments (mass %).
Fixed carbon Ash Volatiles Sulfur Moisture 85 11 3.38 0.66 6-8
Chapter 4
25
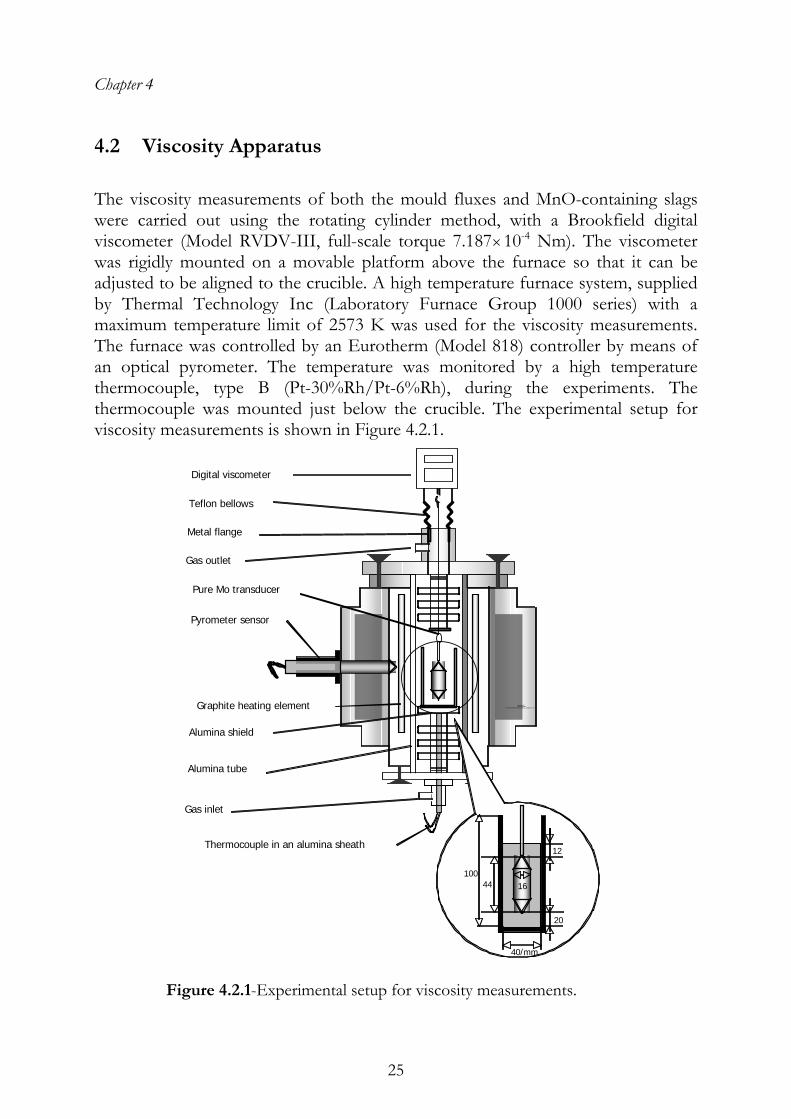
4.2 Viscosity Apparatus
The viscosity measurements of both the mould fluxes and MnO-containing slags were carried out using the rotating cylinder method, with a Brookfield digital viscometer (Model RVDV-III, full-scale torque 7.187×10⁻⁴ Nm). The viscometer was rigidly mounted on a movable platform above the furnace so that it can be adjusted to be aligned to the crucible. A high temperature furnace system, supplied by Thermal Technology Inc (Laboratory Furnace Group 1000 series) with a maximum temperature limit of 2573 K was used for the viscosity measurements. The furnace was controlled by an Eurotherm (Model 818) controller by means of an optical pyrometer. The temperature was monitored by a high temperature thermocouple, type B (Pt-30%Rh/Pt-6%Rh), during the experiments. The thermocouple was mounted just below the crucible. The experimental setup for viscosity measurements is shown in Figure 4.2.1.
Digital viscometer
Teflon bellows
Gas outlet
Pure Mo transducer
Pyrometer sensor
Graphite heating element
Alumina shield
Alumina tube
Gas inlet
Thermocouple in an alumina sheath
Metal flange
QuickTimeý Dz êLí£ÉvÉçÉOÉâÉÄ
ǙDZÇÃÉsÉNÉÉ̀ÉǾå©ÇÈǞǽDžÇÕïKóvÇ-Ç�ÅB
12
20
40/mm
16100
44
Figure 4.2.1-Experimental setup for viscosity measurements.
Experimental Work
26
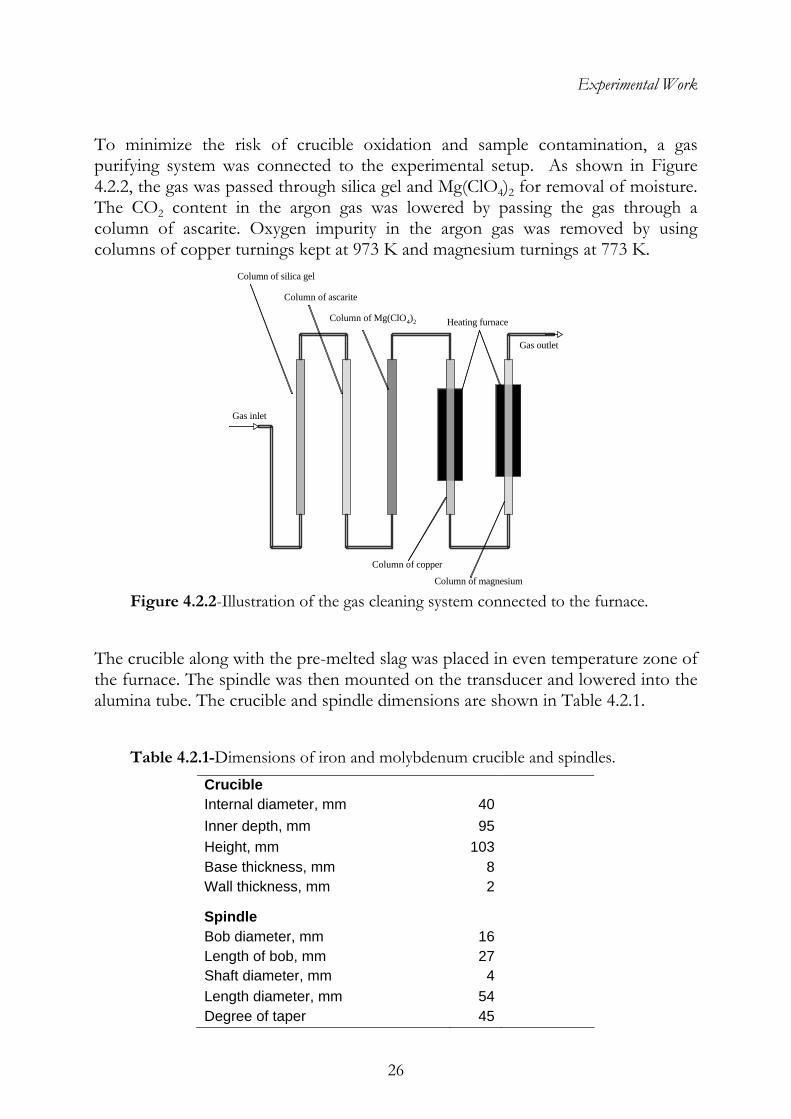
To minimize the risk of crucible oxidation and sample contamination, a gas purifying system was connected to the experimental setup. As shown in Figure 4.2.2, the gas was passed through silica gel and Mg(ClO4)2 for removal of moisture. The CO2 content in the argon gas was lowered by passing the gas through a column of ascarite. Oxygen impurity in the argon gas was removed by using columns of copper turnings kept at 973 K and magnesium turnings at 773 K.
Gas inlet
Column of silica gel
Column of ascarite
Column of Mg(ClO4)2
Column of copper
Column of magnesium
Heating furnace
Gas outlet
Figure 4.2.2-Illustration of the gas cleaning system connected to the furnace.
The crucible along with the pre-melted slag was placed in even temperature zone of the furnace. The spindle was then mounted on the transducer and lowered into the alumina tube. The crucible and spindle dimensions are shown in Table 4.2.1.
Table 4.2.1-Dimensions of iron and molybdenum crucible and spindles.
Crucible Internal diameter, mm 40 Inner depth, mm 95 Height, mm 103 Base thickness, mm 8 Wall thickness, mm 2
Spindle Bob diameter, mm 16 Length of bob, mm 27 Shaft diameter, mm 4 Length diameter, mm 54 Degree of taper 45
Chapter 4
27
To avoid oxidation of iron components and contamination of the sample, the system was purged with argon gas for approximately one hour before starting the heating procedure. A heating rate of 5 K/min was employed during all the experiments. The argon gas flow was kept at 0.2 Nl/min in the experiments involving mould fluxes and 0.3 Nl/min for the MnO slags. In the case of the mould fluxes, the furnace was heated up to highest temperature used in the experiments, 1673 K, and left for one hour to completely melt the slag and stabilize the temperature before the measurements started. Most of the measurements were then carried out during cooling cycles, but some measurements were also performed during heating sequences in order to verify the reproducibility of the measurements. On the other hand, the approach in the viscosity measurements of the MnO containing slags was somewhat different. From the industrial view point, it is very interesting to see if the size and shape of the solid particles could have an impact on the viscosity values as the slag descending the furnace could contain undissolved particles before it is completely molten and this could have an impact on the process efficiency. The measurements were carried out in the two-phase region in the heating mode. Great care was taken to carry out the measurements in the heating mode when the temperature was estimated to be below the liquidus temperature as the risks of the Mo spindle getting stuck were high. Still, several experiments failed in these attempts. The slags were held for 8 to 10 hours at the starting temperatures slightly below the estimated liquidus temperatures to ensure that the slag had attained equilibrium state. The measuring procedure was identical for both slags studied. The spindle was carefully lowered into the slag, the tip being kept about 2 cm above the crucible base and about 1 cm of the shaft immersed in the slag. Five rotation rates were used at each temperature for evaluation of the slag viscosity, in order to ensure that the molten slag showed a Newtonian behavior. The rotating speeds used in the measurements varied between 8 to 70 rpm. The equilibrium time for viscosity measurements at each speed was estimated to be 120 seconds. The temperature was kept constant for 30 minutes before each measurement. This was to assure that thermal equilibrium was established at each measuring point. Mineral oil standards with viscosities in range of 0.097 – 12.500 Pa s at 298 K were used to calibrate the viscometer. The system was earlier calibrated with respect to high temperature viscosity standard recommended by European Union46.
Experimental Work
28
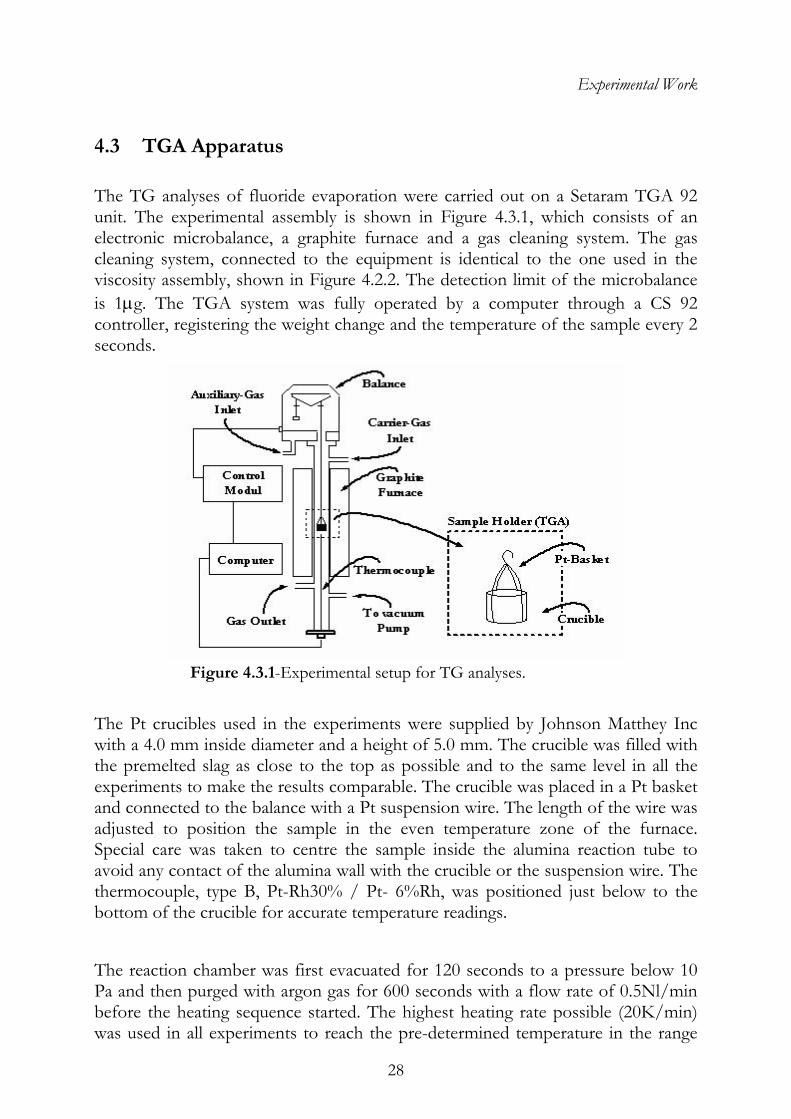
4.3 TGA Apparatus The TG analyses of fluoride evaporation were carried out on a Setaram TGA 92 unit. The experimental assembly is shown in Figure 4.3.1, which consists of an electronic microbalance, a graphite furnace and a gas cleaning system. The gas cleaning system, connected to the equipment is identical to the one used in the viscosity assembly, shown in Figure 4.2.2. The detection limit of the microbalance is 1μg. The TGA system was fully operated by a computer through a CS 92 controller, registering the weight change and the temperature of the sample every 2 seconds.
Figure 4.3.1-Experimental setup for TG analyses.
The Pt crucibles used in the experiments were supplied by Johnson Matthey Inc with a 4.0 mm inside diameter and a height of 5.0 mm. The crucible was filled with the premelted slag as close to the top as possible and to the same level in all the experiments to make the results comparable. The crucible was placed in a Pt basket and connected to the balance with a Pt suspension wire. The length of the wire was adjusted to position the sample in the even temperature zone of the furnace. Special care was taken to centre the sample inside the alumina reaction tube to avoid any contact of the alumina wall with the crucible or the suspension wire. The thermocouple, type B, Pt-Rh30% / Pt- 6%Rh, was positioned just below to the bottom of the crucible for accurate temperature readings. The reaction chamber was first evacuated for 120 seconds to a pressure below 10 Pa and then purged with argon gas for 600 seconds with a flow rate of 0.5Nl/min before the heating sequence started. The highest heating rate possible (20K/min) was used in all experiments to reach the pre-determined temperature in the range
Chapter 4
29
of 1673 to1873 K. The sample was maintained at the experimental temperature for 160 minutes.
4.4 Confocal Laser Scanning Microscope The experiments were carried out in a Confocal Scanning Laser Microscope (CSLM) at Carnegie Mellon University. The CSLM microscope is attached to a gold image furnace. The latter provided the heat by focusing the light from a halogen lamp with golden mirrors into the sample. Two types of experiments were carried out in the CLSM microscope, anthracite in contact with slag containing hematite and anthracite in oxygen containing atmosphere. Both types of reactions were studied at several temperatures. Pt and Al2O3 crucibles with the same dimensions, inner diameter of 4.5 mm and a height of 4.0 mm, were used in all experiments, supplied by Alfa Aesar. In the experiments involving slag, the crushed slag was first melted in the Pt crucible before the anthracite particle was placed on top of the slag. In the other experiments, with oxygen containing atmosphere, were the anthracite particle placed at the bottom of the Al2O3 crucibles. The crucible was placed in the sample holder equipped with a thermocouple of type B to monitor and control the temperature. The sample holder used to observe the reaction between anthracite and oxygen was different then the one used in the slag experiments. The two types of sample holders used are shown in Figure 4.4.1. The temperature accuracy of the sample holders was checked with melting experiments of nickel and copper. The sample holder used for the experiments in reactive atmosphere showed a difference of +/-10 oC between the temperature reading of the thermocouple and the melting temperature of pure copper. The differences in the temperatures between the measured thermocouple readings and expected melting temperatures of the metals were approximately 95 +/-10 oC in case of both nickel and copper for the other sample holder. This difference was estimated to be valid at all experimental temperatures. In figures presented later on, all the temperatures presented are the same as the thermocouple readings during the experiments. The reaction chamber was evacuated and filled with argon gas which purged through the system for five minutes before the heating started. The crucible and the sample were heated to a predetermined temperature as rapidly as possible. The particle was observed continuously through the CSLM during the whole experiment. The images was captured on a CCD camera and projected on a monitor and recorded on a video recorder. The reaction between slag and anthracite was found to be very slow and it was not possible to observe a complete
Experimental Work
30
reaction of the anthracite particle in all the cases. In a typical experiment, the reaction was studied for 25 minutes, but in some cases even longer. In contrary to the slag experiments, the reaction between anthracite and oxygen was found to be very fast. In this case, the same procedure was followed before the heating started as in the experiments involving slags. The heating sequence was carried out with pure argon and the atmosphere was not switched until the experimental temperature was reached, to avoid any reaction before reaching the desired temperature. The atmosphere used in the isothermal stage was argon with ten percent oxygen. Pure argon was used during the slag experiments.
4.5 mm
8mm
Anthracite particle
Pt crucible
Aal2O3 Crucible
Thermocouple
Heat
4.5 mm
8mm
Slag sample
Anthracite particle Pt crucible
Aal2O3 Crucible
Thermocouple
Heat
Figure 4.4.1-Schematic figures of sample holders and crucibles. To the right, the set up used in the slag experiments, and to the left, the set up used in oxygen containing experiments.
31
Chapter 5
RESULT AND DISCUSSION
5.1 Density Model Applications
Model calculations were carried out for the binary, ternary and higher order systems and the results were compared with experimental data. The model is applied successfully in the case of the most systems, with deviation within the experimental uncertainties related to density measurements
5.1.1 Binary Systems
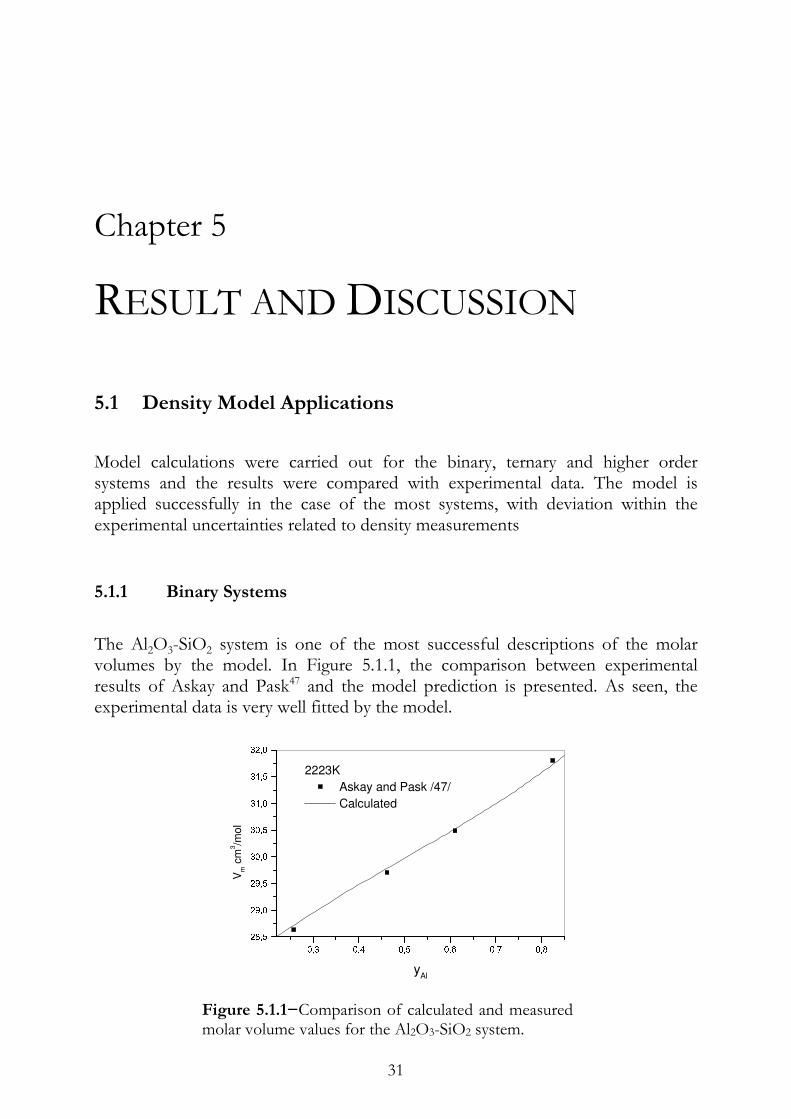
The Al2O3-SiO2 system is one of the most successful descriptions of the molar volumes by the model. In Figure 5.1.1, the comparison between experimental results of Askay and Pask47 and the model prediction is presented. As seen, the experimental data is very well fitted by the model.
0,3 0,4 0,5 0,6 0,7 0,828,529,029,530,030,531,031,532,02223K
Askay and Pask /47/
Calculated
Vm c
m3/m
ol
yAl
Figure 5.1.1−Comparison of calculated and measured molar volume values for the Al2O3-SiO2 system.
Result and Discussion
32
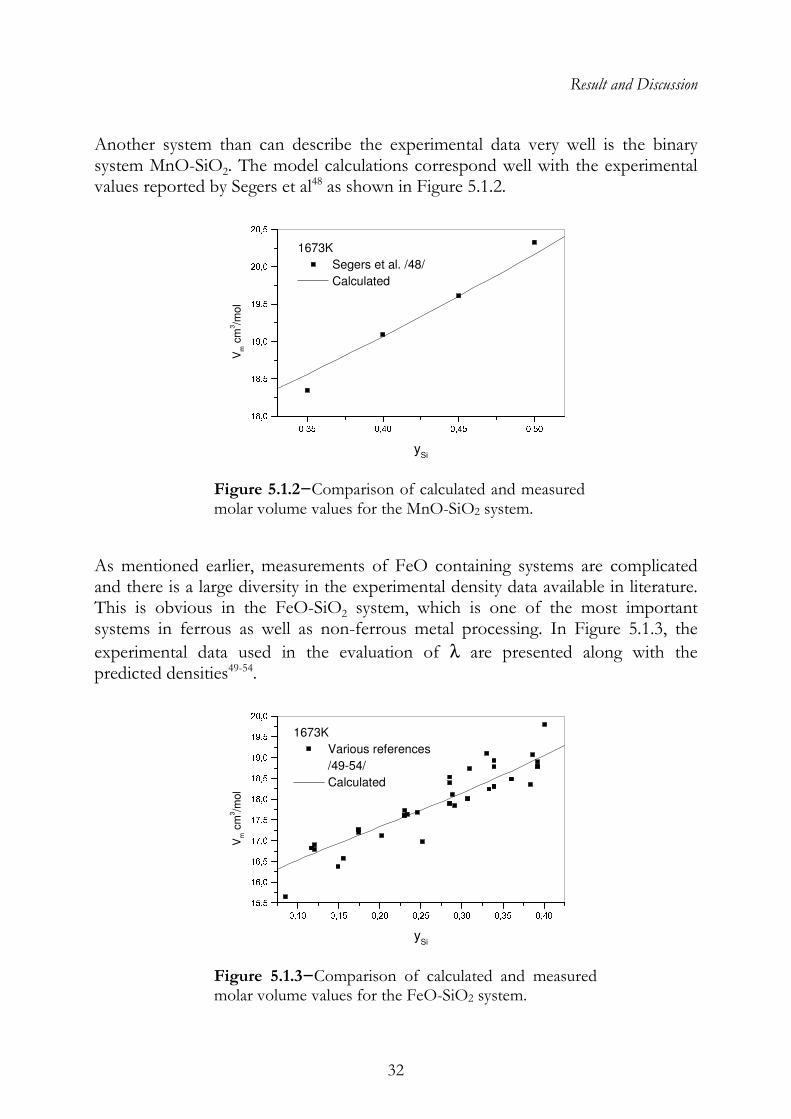
Another system than can describe the experimental data very well is the binary system MnO-SiO2. The model calculations correspond well with the experimental values reported by Segers et al48 as shown in Figure 5.1.2.
0,35 0,40 0,45 0,5018,018,519,019,520,020,51673K
Segers et al. /48/
Calculated
Vm c
m3/m
ol
ySi
Figure 5.1.2−Comparison of calculated and measured molar volume values for the MnO-SiO2 system.
As mentioned earlier, measurements of FeO containing systems are complicated and there is a large diversity in the experimental density data available in literature. This is obvious in the FeO-SiO2 system, which is one of the most important systems in ferrous as well as non-ferrous metal processing. In Figure 5.1.3, the
experimental data used in the evaluation of λ are presented along with the predicted densities49-54.
0,10 0,15 0,20 0,25 0,30 0,35 0,4015,516,016,517,017,518,018,519,019,520,01673K
Various references
/49-54/
Calculated
Vm c
m3/m
ol
ySi
Figure 5.1.3−Comparison of calculated and measured molar volume values for the FeO-SiO2 system.
Chapter 5
33
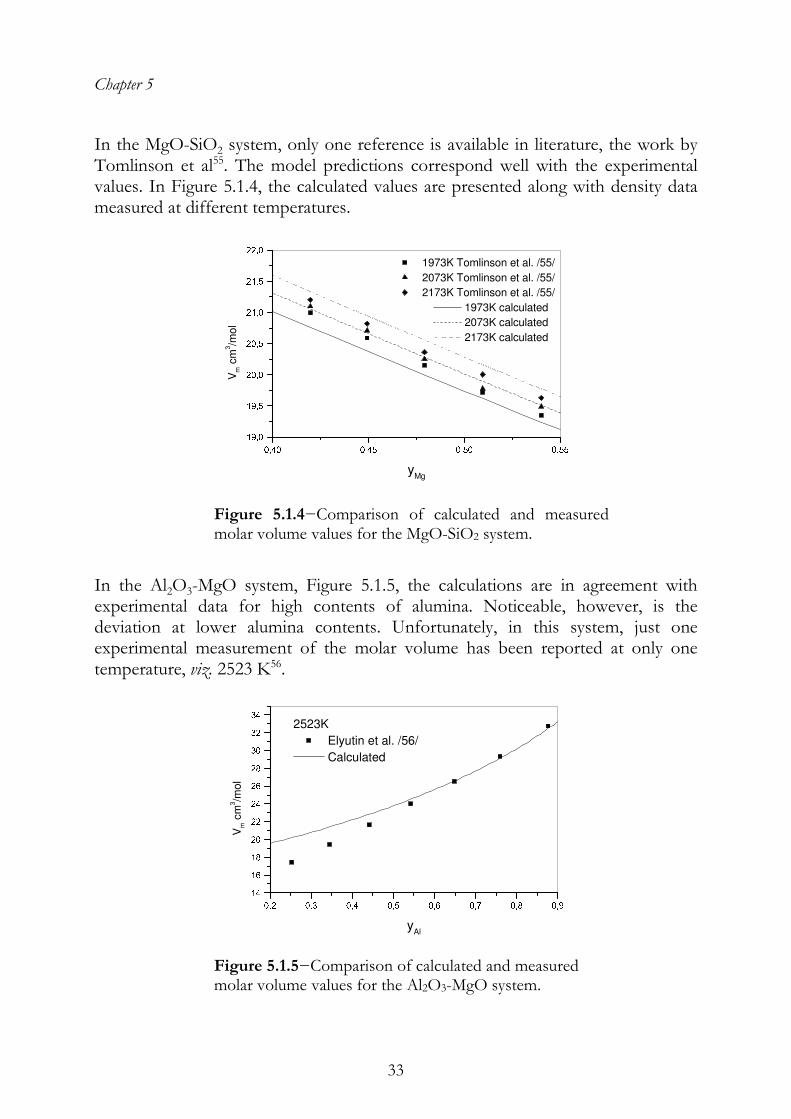
In the MgO-SiO2 system, only one reference is available in literature, the work by Tomlinson et al55. The model predictions correspond well with the experimental values. In Figure 5.1.4, the calculated values are presented along with density data measured at different temperatures.
0,40 0,45 0,50 0,5519,019,520,020,521,021,522,0 1973K Tomlinson et al. /55/
2073K Tomlinson et al. /55/
2173K Tomlinson et al. /55/
1973K calculated
2073K calculated
2173K calculated
Vm c
m3/m
ol
yMg
Figure 5.1.4−Comparison of calculated and measured molar volume values for the MgO-SiO2 system.
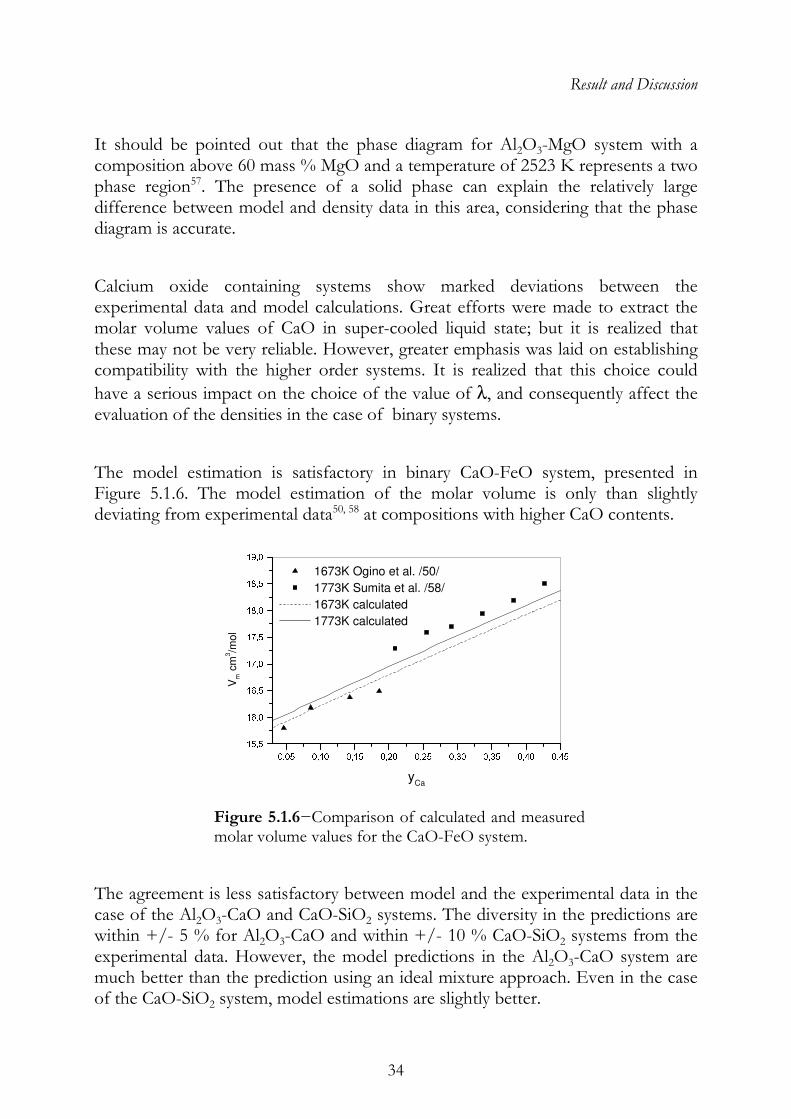
In the Al2O3-MgO system, Figure 5.1.5, the calculations are in agreement with experimental data for high contents of alumina. Noticeable, however, is the deviation at lower alumina contents. Unfortunately, in this system, just one experimental measurement of the molar volume has been reported at only one temperature, viz. 2523 K56.
0,2 0,3 0,4 0,5 0,6 0,7 0,8 0,91416182022242628303234
2523K
Elyutin et al. /56/
Calculated
Vm c
m3/m
ol
yAl
Figure 5.1.5−Comparison of calculated and measured molar volume values for the Al2O3-MgO system.
Result and Discussion
34
It should be pointed out that the phase diagram for Al2O3-MgO system with a composition above 60 mass % MgO and a temperature of 2523 K represents a two phase region57. The presence of a solid phase can explain the relatively large difference between model and density data in this area, considering that the phase diagram is accurate.
Calcium oxide containing systems show marked deviations between the experimental data and model calculations. Great efforts were made to extract the molar volume values of CaO in super-cooled liquid state; but it is realized that these may not be very reliable. However, greater emphasis was laid on establishing compatibility with the higher order systems. It is realized that this choice could
have a serious impact on the choice of the value of λ, and consequently affect the evaluation of the densities in the case of binary systems.
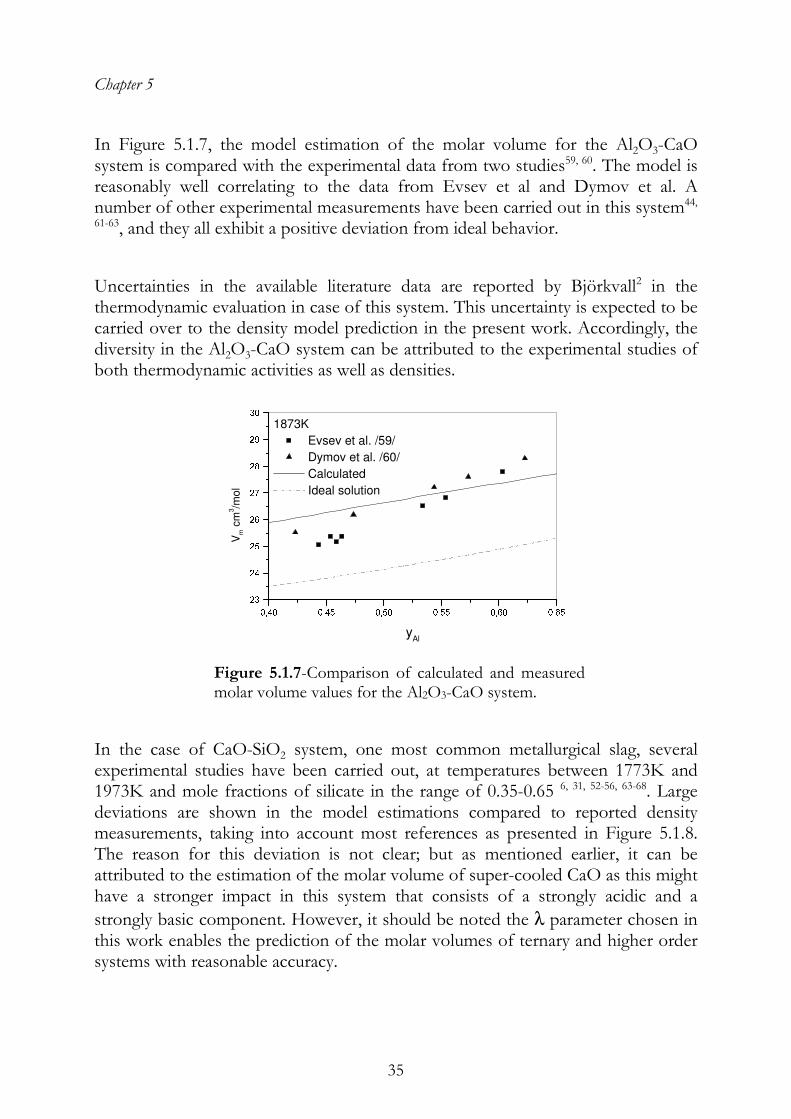
The model estimation is satisfactory in binary CaO-FeO system, presented in Figure 5.1.6. The model estimation of the molar volume is only than slightly deviating from experimental data50, 58 at compositions with higher CaO contents.
0,05 0,10 0,15 0,20 0,25 0,30 0,35 0,40 0,4515,516,016,517,017,518,018,519,0 1673K Ogino et al. /50/
1773K Sumita et al. /58/
1673K calculated
1773K calculated
Vm c
m3/m
ol
yCa
Figure 5.1.6−Comparison of calculated and measured molar volume values for the CaO-FeO system.
The agreement is less satisfactory between model and the experimental data in the case of the Al2O3-CaO and CaO-SiO2 systems. The diversity in the predictions are within +/- 5 % for Al2O3-CaO and within +/- 10 % CaO-SiO2 systems from the experimental data. However, the model predictions in the Al2O3-CaO system are much better than the prediction using an ideal mixture approach. Even in the case of the CaO-SiO2 system, model estimations are slightly better.
Chapter 5
35
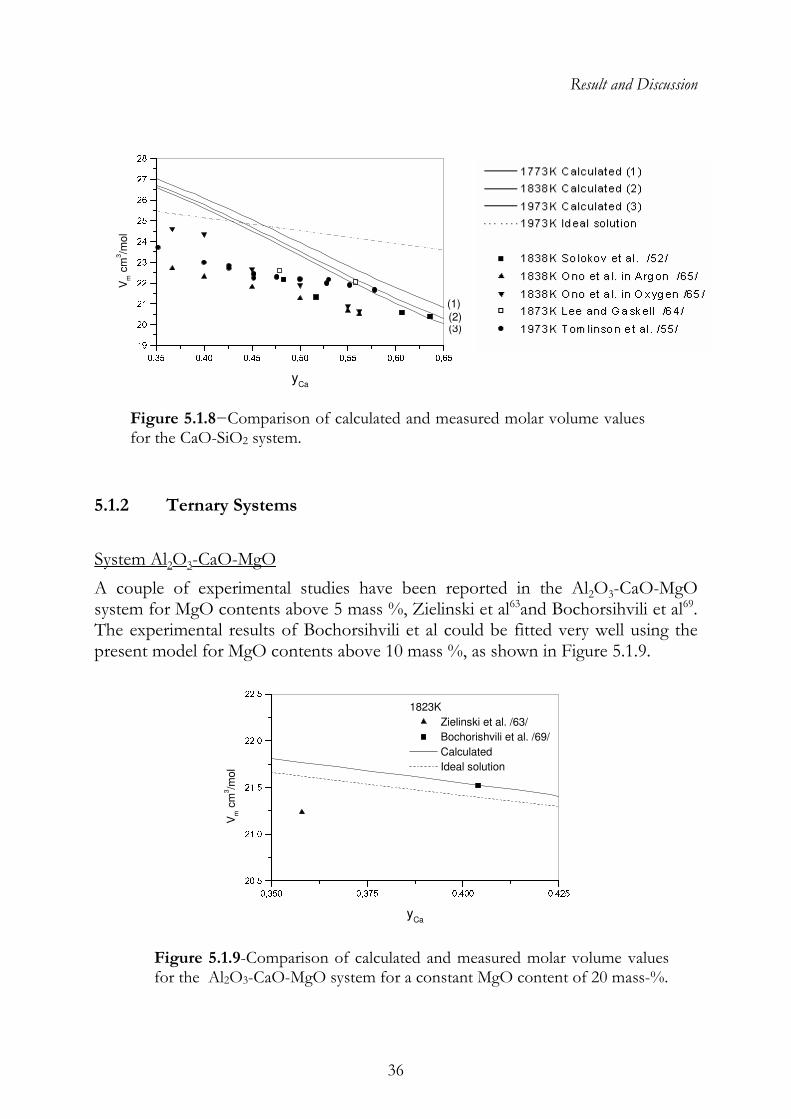
In Figure 5.1.7, the model estimation of the molar volume for the Al2O3-CaO system is compared with the experimental data from two studies59, 60. The model is reasonably well correlating to the data from Evsev et al and Dymov et al. A number of other experimental measurements have been carried out in this system44,
61-63, and they all exhibit a positive deviation from ideal behavior.
Uncertainties in the available literature data are reported by Björkvall2 in the thermodynamic evaluation in case of this system. This uncertainty is expected to be carried over to the density model prediction in the present work. Accordingly, the diversity in the Al2O3-CaO system can be attributed to the experimental studies of both thermodynamic activities as well as densities.
0,40 0,45 0,50 0,55 0,60 0,652324252627282930 1873K
Evsev et al. /59/
Dymov et al. /60/
Calculated
Ideal solution
Vm c
m3/m
ol
yAl
Figure 5.1.7-Comparison of calculated and measured molar volume values for the Al2O3-CaO system.
In the case of CaO-SiO2 system, one most common metallurgical slag, several experimental studies have been carried out, at temperatures between 1773K and 1973K and mole fractions of silicate in the range of 0.35-0.65 6, 31, 52-56, 63-68. Large deviations are shown in the model estimations compared to reported density measurements, taking into account most references as presented in Figure 5.1.8. The reason for this deviation is not clear; but as mentioned earlier, it can be attributed to the estimation of the molar volume of super-cooled CaO as this might have a stronger impact in this system that consists of a strongly acidic and a
strongly basic component. However, it should be noted the λ parameter chosen in this work enables the prediction of the molar volumes of ternary and higher order systems with reasonable accuracy.
Result and Discussion
36
0,35 0,40 0,45 0,50 0,55 0,60 0,6519202122232425262728
(3)(2)
(1)
Vm c
m3/m
ol
yCa
Figure 5.1.8−Comparison of calculated and measured molar volume values for the CaO-SiO2 system.
5.1.2 Ternary Systems
System Al2O3-CaO-MgO
A couple of experimental studies have been reported in the Al2O3-CaO-MgO system for MgO contents above 5 mass %, Zielinski et al63and Bochorsihvili et al69. The experimental results of Bochorsihvili et al could be fitted very well using the present model for MgO contents above 10 mass %, as shown in Figure 5.1.9.
0,350 0,375 0,400 0,42520,521,021,522,022,51823K
Zielinski et al. /63/
Bochorishvili et al. /69/
Calculated
Ideal solution
Vm c
m3/m
ol
yCa
Figure 5.1.9-Comparison of calculated and measured molar volume values for the Al2O3-CaO-MgO system for a constant MgO content of 20 mass-%.
Chapter 5
37
The deviation of the results of Zielinski et al is about 3 %. The deviation between experimental data and model predictions for slags containing 10 mass % MgO or less is for both references in the range of 2-3 %.
System Al2O3-CaO-SiO2
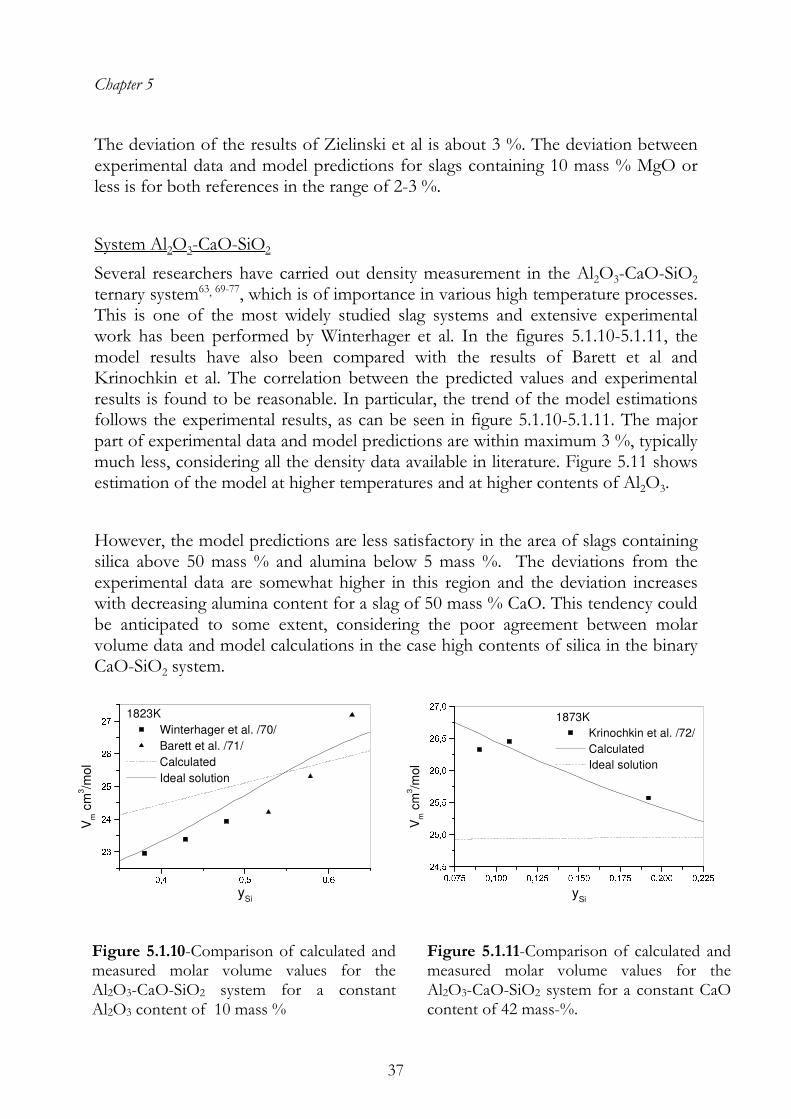
Several researchers have carried out density measurement in the Al2O3-CaO-SiO2 ternary system63, 69-77, which is of importance in various high temperature processes. This is one of the most widely studied slag systems and extensive experimental work has been performed by Winterhager et al. In the figures 5.1.10-5.1.11, the model results have also been compared with the results of Barett et al and Krinochkin et al. The correlation between the predicted values and experimental results is found to be reasonable. In particular, the trend of the model estimations follows the experimental results, as can be seen in figure 5.1.10-5.1.11. The major part of experimental data and model predictions are within maximum 3 %, typically much less, considering all the density data available in literature. Figure 5.11 shows estimation of the model at higher temperatures and at higher contents of Al2O3.
However, the model predictions are less satisfactory in the area of slags containing silica above 50 mass % and alumina below 5 mass %. The deviations from the experimental data are somewhat higher in this region and the deviation increases with decreasing alumina content for a slag of 50 mass % CaO. This tendency could be anticipated to some extent, considering the poor agreement between molar volume data and model calculations in the case high contents of silica in the binary CaO-SiO2 system.
0,4 0,5 0,62324252627 1823K
Winterhager et al. /70/
Barett et al. /71/
Calculated
Ideal solution
Vm c
m3/m
ol
ySi
0,075 0,100 0,125 0,150 0,175 0,200 0,22524,525,025,526,026,527,01873K
Krinochkin et al. /72/
Calculated
Ideal solution
Vm c
m3/m
ol
ySi
Figure 5.1.11-Comparison of calculated and measured molar volume values for the Al2O3-CaO-SiO2 system for a constant CaO content of 42 mass-%.
Figure 5.1.10-Comparison of calculated and measured molar volume values for the Al2O3-CaO-SiO2 system for a constant Al2O3 content of 10 mass %
Result and Discussion
38
System CaO-FeO-SiO2
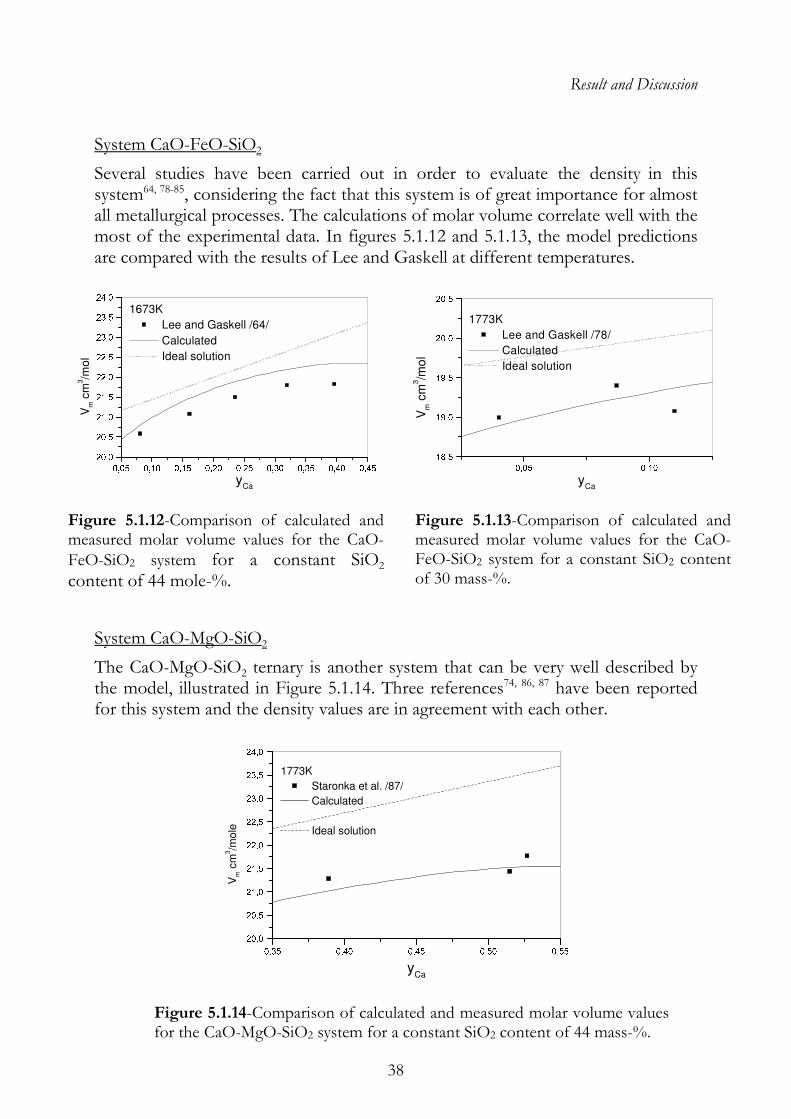
Several studies have been carried out in order to evaluate the density in this system64, 78-85, considering the fact that this system is of great importance for almost all metallurgical processes. The calculations of molar volume correlate well with the most of the experimental data. In figures 5.1.12 and 5.1.13, the model predictions are compared with the results of Lee and Gaskell at different temperatures.
0,05 0,10 0,15 0,20 0,25 0,30 0,35 0,40 0,4520,020,521,021,522,022,523,023,524,01673K
Lee and Gaskell /64/
Calculated
Ideal solution
Vm c
m3/m
ol
yCa
0,05 0,1018,519,019,520,020,51773K
Lee and Gaskell /78/
Calculated
Ideal solution
Vm c
m3/m
ol
yCa
System CaO-MgO-SiO2
The CaO-MgO-SiO2 ternary is another system that can be very well described by the model, illustrated in Figure 5.1.14. Three references74, 86, 87 have been reported for this system and the density values are in agreement with each other.
0,35 0,40 0,45 0,50 0,5520,020,521,021,522,022,523,023,524,01773K
Staronka et al. /87/
Calculated
Ideal solution
Vm c
m3/m
ole
yCa
Figure 5.1.14-Comparison of calculated and measured molar volume values for the CaO-MgO-SiO2 system for a constant SiO2 content of 44 mass-%.
Figure 5.1.13-Comparison of calculated and measured molar volume values for the CaO-FeO-SiO2 system for a constant SiO2 content of 30 mass-%.
Figure 5.1.12-Comparison of calculated and measured molar volume values for the CaO-FeO-SiO2 system for a constant SiO2 content of 44 mole-%.
Chapter 5
39
The model predictions are in line with the experimental data with the maximum deviation being about 3 % at the CaO end. The latter can be explained by the poor model correlation in the binary CaO-SiO2, in that composition area, as mentioned earlier.
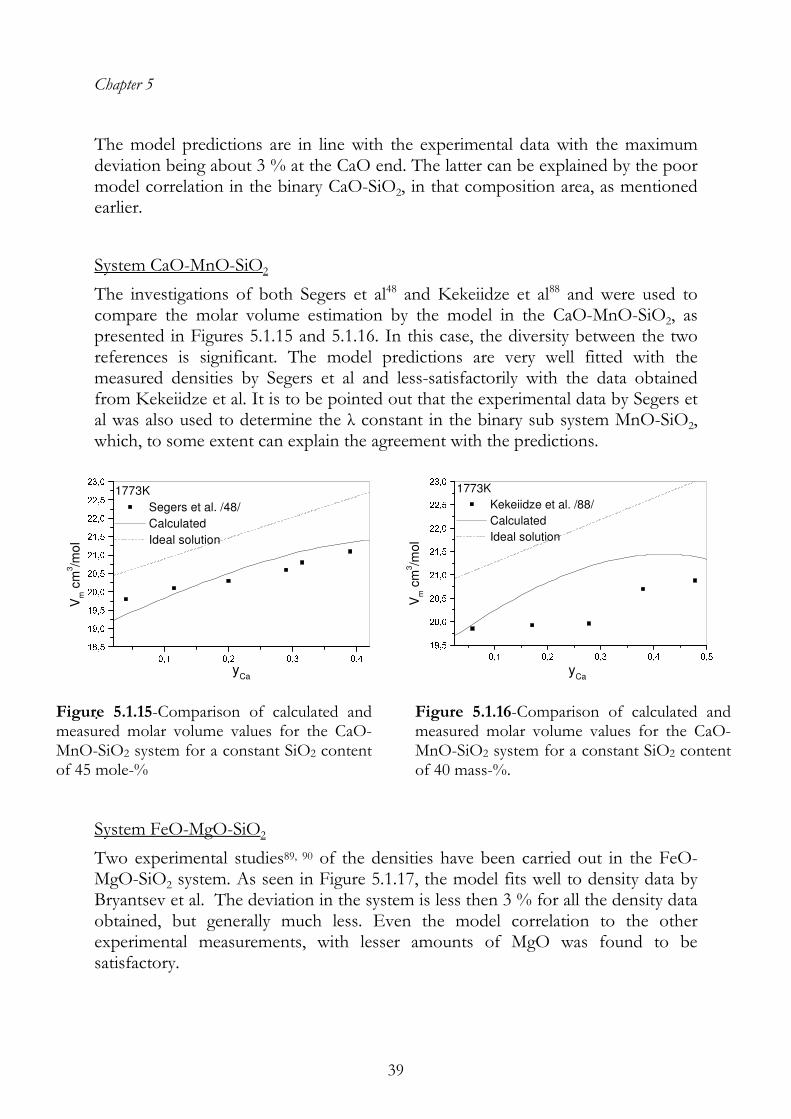
System CaO-MnO-SiO2
The investigations of both Segers et al48 and Kekeiidze et al88 and were used to compare the molar volume estimation by the model in the CaO-MnO-SiO2, as presented in Figures 5.1.15 and 5.1.16. In this case, the diversity between the two references is significant. The model predictions are very well fitted with the measured densities by Segers et al and less-satisfactorily with the data obtained from Kekeiidze et al. It is to be pointed out that the experimental data by Segers et al was also used to determine the λ constant in the binary sub system MnO-SiO2, which, to some extent can explain the agreement with the predictions.
0,1 0,2 0,3 0,418,519,019,520,020,521,021,522,022,523,01773K
Segers et al. /48/
Calculated
Ideal solution
Vm c
m3/m
ol
yCa
0,1 0,2 0,3 0,4 0,519,520,020,521,021,522,022,523,01773K
Kekeiidze et al. /88/
Calculated
Ideal solution
Vm c
m3/m
ol
yCa
.
System FeO-MgO-SiO2
Two experimental studies89, 90 of the densities have been carried out in the FeO-MgO-SiO2 system. As seen in Figure 5.1.17, the model fits well to density data by Bryantsev et al. The deviation in the system is less then 3 % for all the density data obtained, but generally much less. Even the model correlation to the other experimental measurements, with lesser amounts of MgO was found to be satisfactory.
Figure 5.1.16-Comparison of calculated and measured molar volume values for the CaO-MnO-SiO2 system for a constant SiO2 content of 40 mass-%.
Figure 5.1.15-Comparison of calculated and measured molar volume values for the CaO-MnO-SiO2 system for a constant SiO2 content of 45 mole-%
Result and Discussion
40
0,15 0,20 0,25 0,30 0,3518,519,019,520,020,521,021,522,022,51723K
Bryantsev et al. /89/
Calculated
Ideal solution
Vm c
m3/m
ol
yFe
Figure 5.1.17-Comparison of calculated and measured molar volume values for the FeO-MgO-SiO2 system for a constant SiO2 content of 55 mass-%.
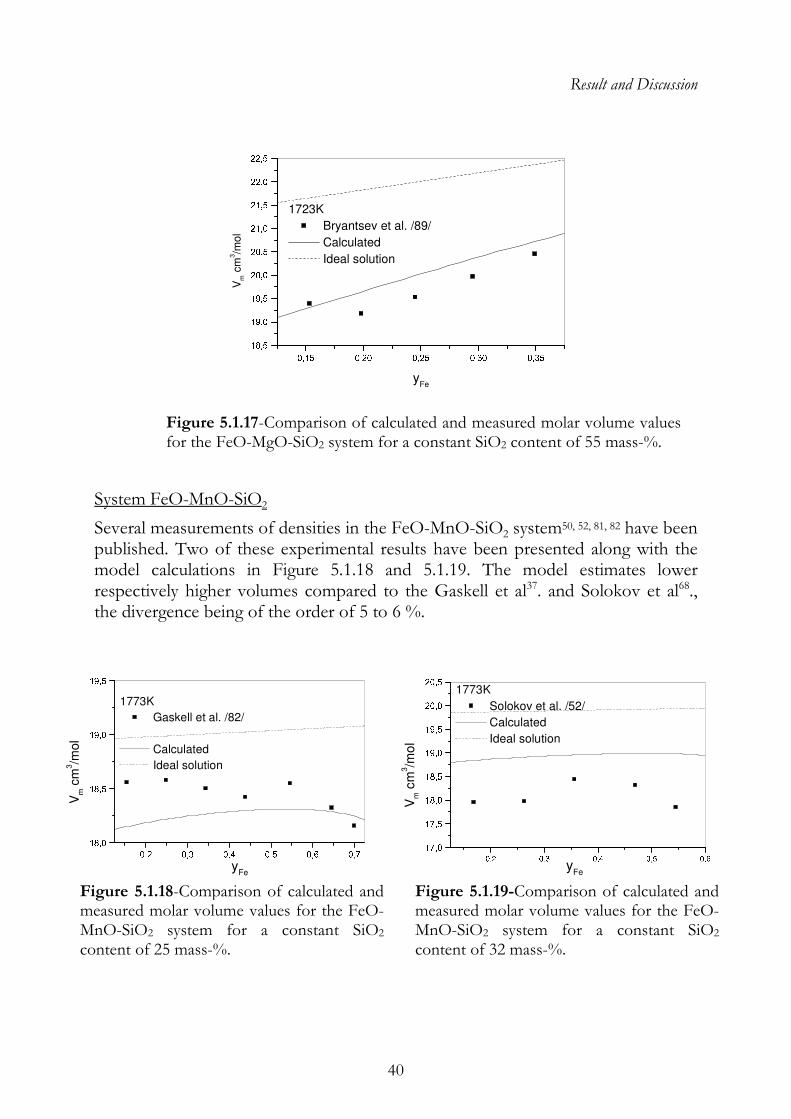
System FeO-MnO-SiO2
Several measurements of densities in the FeO-MnO-SiO2 system50, 52, 81, 82 have been published. Two of these experimental results have been presented along with the model calculations in Figure 5.1.18 and 5.1.19. The model estimates lower respectively higher volumes compared to the Gaskell et al37. and Solokov et al68., the divergence being of the order of 5 to 6 %.
0,2 0,3 0,4 0,5 0,6 0,718,018,519,019,51773K
Gaskell et al. /82/
Calculated
Ideal solution
Vm c
m3/m
ol
yFe
0,2 0,3 0,4 0,5 0,617,017,518,018,519,019,520,020,51773K
Solokov et al. /52/
Calculated
Ideal solution
Vm c
m3/m
ol
yFe
Figure 5.1.19-Comparison of calculated and measured molar volume values for the FeO-MnO-SiO2 system for a constant SiO2 content of 32 mass-%.
Figure 5.1.16-Comparison of calculated and
Figure 5.1.18-Comparison of calculated and measured molar volume values for the FeO-MnO-SiO2 system for a constant SiO2 content of 25 mass-%.
Figure 5.1.16-Comparison of calculated and
Chapter 5
41
System Al2O3-FeO-SiO2
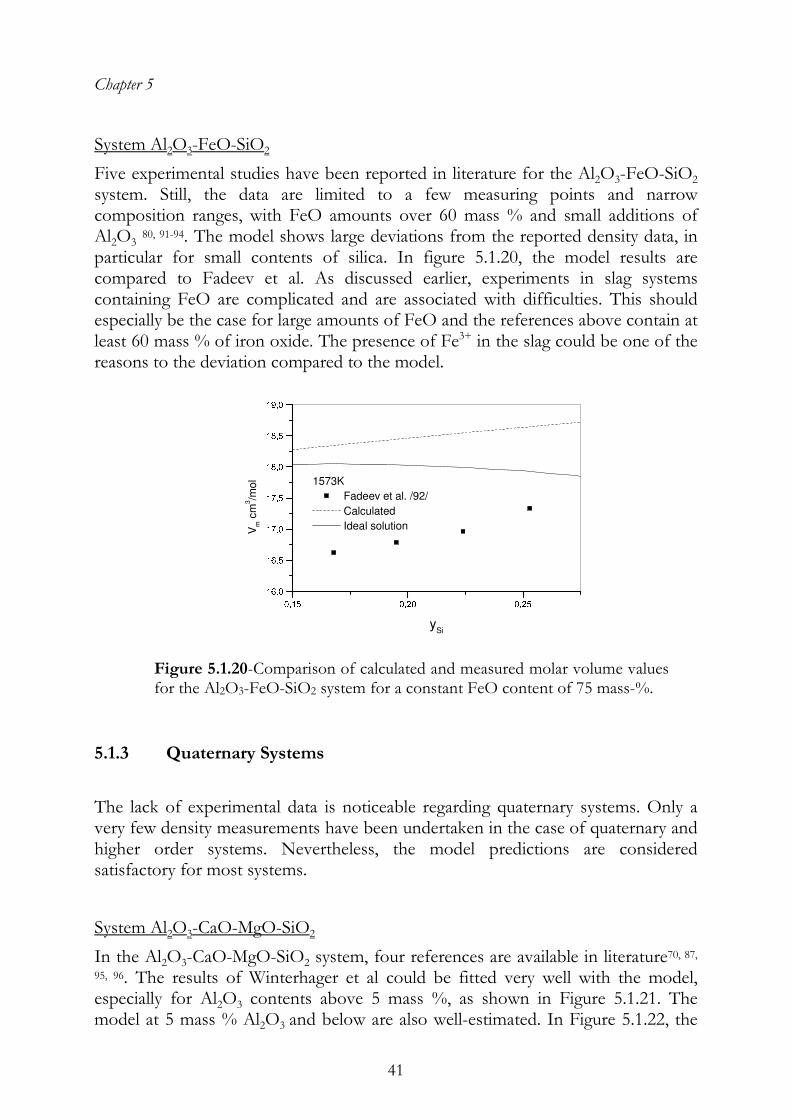
Five experimental studies have been reported in literature for the Al2O3-FeO-SiO2 system. Still, the data are limited to a few measuring points and narrow composition ranges, with FeO amounts over 60 mass % and small additions of Al2O3 80, 91-94. The model shows large deviations from the reported density data, in particular for small contents of silica. In figure 5.1.20, the model results are compared to Fadeev et al. As discussed earlier, experiments in slag systems containing FeO are complicated and are associated with difficulties. This should especially be the case for large amounts of FeO and the references above contain at least 60 mass % of iron oxide. The presence of Fe3+ in the slag could be one of the reasons to the deviation compared to the model.
0,15 0,20 0,2516,016,517,017,518,018,519,01573K
Fadeev et al. /92/
Calculated
Ideal solutionVm c
m3/m
ol
ySi
Figure 5.1.20-Comparison of calculated and measured molar volume values for the Al2O3-FeO-SiO2 system for a constant FeO content of 75 mass-%.
5.1.3 Quaternary Systems
The lack of experimental data is noticeable regarding quaternary systems. Only a very few density measurements have been undertaken in the case of quaternary and higher order systems. Nevertheless, the model predictions are considered satisfactory for most systems.
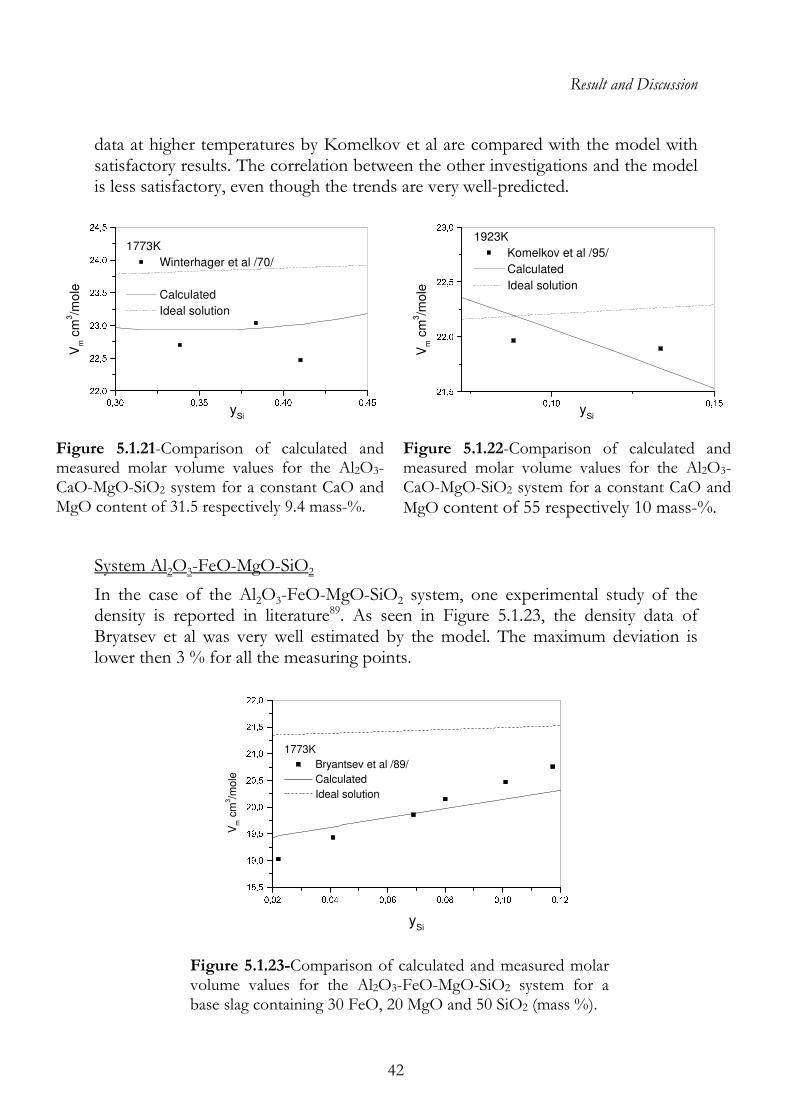
System Al2O3-CaO-MgO-SiO2
In the Al2O3-CaO-MgO-SiO2 system, four references are available in literature70, 87, 95, 96. The results of Winterhager et al could be fitted very well with the model, especially for Al2O3 contents above 5 mass %, as shown in Figure 5.1.21. The model at 5 mass % Al2O3 and below are also well-estimated. In Figure 5.1.22, the
Result and Discussion
42
data at higher temperatures by Komelkov et al are compared with the model with satisfactory results. The correlation between the other investigations and the model is less satisfactory, even though the trends are very well-predicted.
0,30 0,35 0,40 0,4522,022,523,023,524,024,51773K
Winterhager et al /70/
Calculated
Ideal solution
Vm c
m3/m
ole
ySi
0,10 0,1521,522,022,523,01923K
Komelkov et al /95/
Calculated
Ideal solution
Vm c
m3/m
ole
ySi
System Al2O3-FeO-MgO-SiO2
In the case of the Al2O3-FeO-MgO-SiO2 system, one experimental study of the density is reported in literature89. As seen in Figure 5.1.23, the density data of Bryatsev et al was very well estimated by the model. The maximum deviation is lower then 3 % for all the measuring points.
0,02 0,04 0,06 0,08 0,10 0,1218,519,019,520,020,521,021,522,01773K
Bryantsev et al /89/
Calculated
Ideal solution
Vm c
m3/m
ole
ySi
Figure 5.1.23-Comparison of calculated and measured molar volume values for the Al2O3-FeO-MgO-SiO2 system for a base slag containing 30 FeO, 20 MgO and 50 SiO2 (mass %).
Figure 5.1.21-Comparison of calculated and measured molar volume values for the Al2O3-CaO-MgO-SiO2 system for a constant CaO and MgO content of 31.5 respectively 9.4 mass-%.
Figure 5.1.16-Comparison of calculated and
Figure 5.1.22-Comparison of calculated and measured molar volume values for the Al2O3-CaO-MgO-SiO2 system for a constant CaO and MgO content of 55 respectively 10 mass-%.
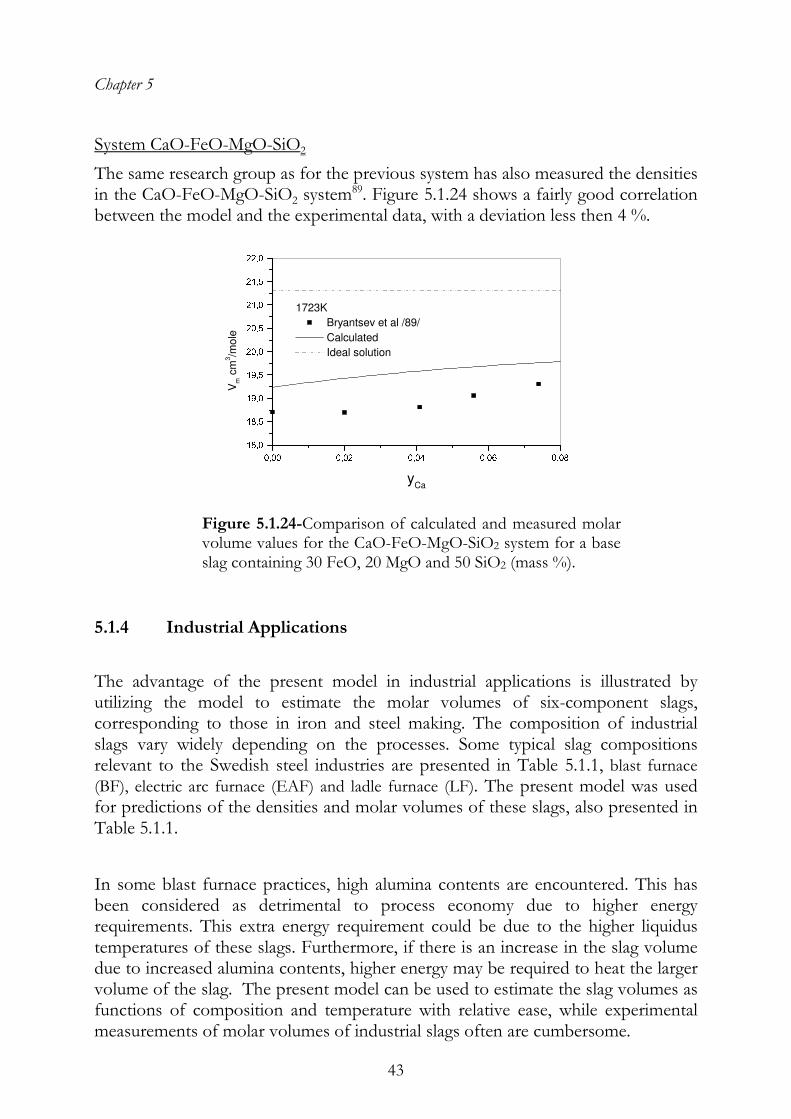
Chapter 5
43
System CaO-FeO-MgO-SiO2
The same research group as for the previous system has also measured the densities in the CaO-FeO-MgO-SiO2 system
89. Figure 5.1.24 shows a fairly good correlation between the model and the experimental data, with a deviation less then 4 %.
0,00 0,02 0,04 0,06 0,0818,018,519,019,520,020,521,021,522,01723K
Bryantsev et al /89/
Calculated
Ideal solution
Vm c
m3/m
ole
yCa
Figure 5.1.24-Comparison of calculated and measured molar volume values for the CaO-FeO-MgO-SiO2 system for a base slag containing 30 FeO, 20 MgO and 50 SiO2 (mass %).
5.1.4 Industrial Applications
The advantage of the present model in industrial applications is illustrated by utilizing the model to estimate the molar volumes of six-component slags, corresponding to those in iron and steel making. The composition of industrial slags vary widely depending on the processes. Some typical slag compositions relevant to the Swedish steel industries are presented in Table 5.1.1, blast furnace (BF), electric arc furnace (EAF) and ladle furnace (LF). The present model was used for predictions of the densities and molar volumes of these slags, also presented in Table 5.1.1.
In some blast furnace practices, high alumina contents are encountered. This has been considered as detrimental to process economy due to higher energy requirements. This extra energy requirement could be due to the higher liquidus temperatures of these slags. Furthermore, if there is an increase in the slag volume due to increased alumina contents, higher energy may be required to heat the larger volume of the slag. The present model can be used to estimate the slag volumes as functions of composition and temperature with relative ease, while experimental measurements of molar volumes of industrial slags often are cumbersome.
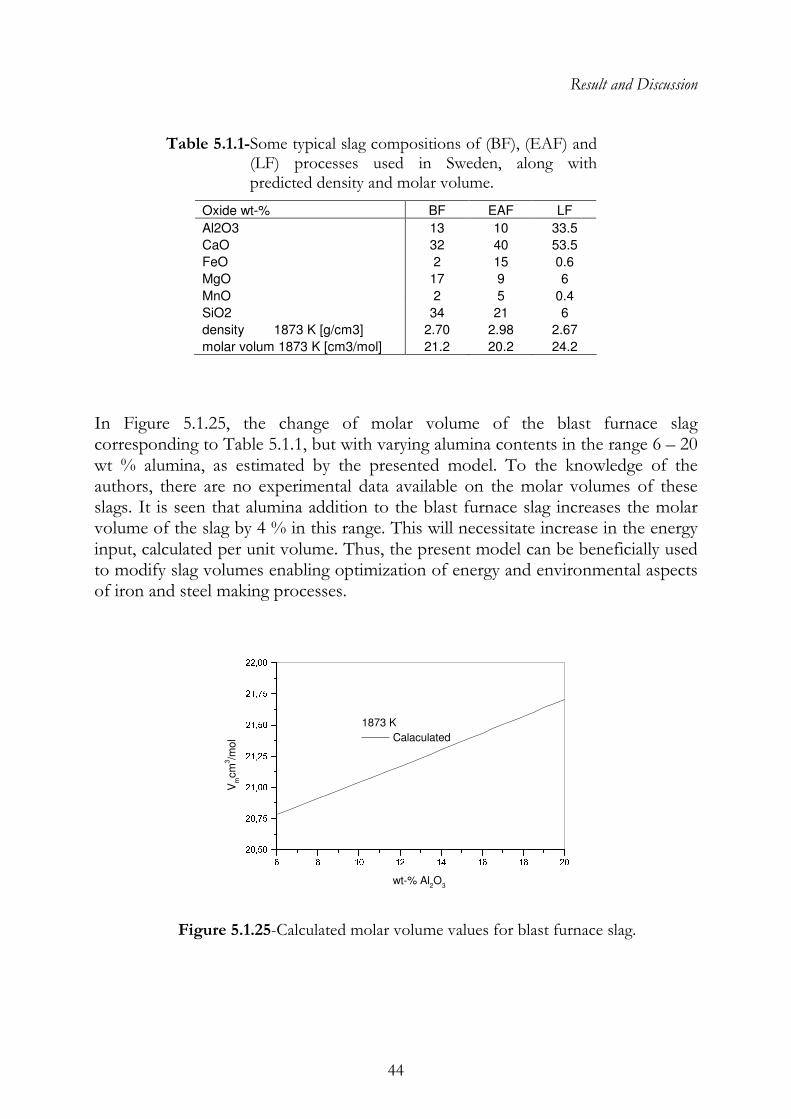
Result and Discussion
44
Table 5.1.1-Some typical slag compositions of (BF), (EAF) and (LF) processes used in Sweden, along with predicted density and molar volume.
Oxide wt-% BF EAF LF
Al2O3 13 10 33.5
CaO 32 40 53.5
FeO 2 15 0.6
MgO 17 9 6
MnO 2 5 0.4
SiO2 34 21 6
density 1873 K [g/cm3] 2.70 2.98 2.67
molar volum 1873 K [cm3/mol] 21.2 20.2 24.2
In Figure 5.1.25, the change of molar volume of the blast furnace slag corresponding to Table 5.1.1, but with varying alumina contents in the range 6 – 20 wt % alumina, as estimated by the presented model. To the knowledge of the authors, there are no experimental data available on the molar volumes of these slags. It is seen that alumina addition to the blast furnace slag increases the molar volume of the slag by 4 % in this range. This will necessitate increase in the energy input, calculated per unit volume. Thus, the present model can be beneficially used to modify slag volumes enabling optimization of energy and environmental aspects of iron and steel making processes.
6 8 10 12 14 16 18 2020,5020,7521,0021,2521,5021,7522,001873 K
Calaculated
Vmcm
3/m
ol
wt-% Al2O
3
Figure 5.1.25-Calculated molar volume values for blast furnace slag.
45
5.2 Viscosity Measurements
As mentioned earlier, two types of slags have been subjected to viscosity measurements, mould fluxes and slags associated with ferromanganese production. A method to estimate the liquidus temperature of the slags from viscosity data is also presented and discussed.
5.2.1 Mould Fluxes
Viscosity measurements were carried out in the case of seven proprietary mould flux slags used in different Swedish steel industries, referred to as A-G. Alumina was added to two of these fluxes, viz. slags A and D, Al2O3 and the corresponding viscosities were measured. Mould fluxes A and F are used in casting of high-alloyed steel grades, in contrary to C, D and E used for low alloying steels. Slag B is a mould flux particularly used in the early stages of the casting process. As seen in Table 4.1.2, it has a significant higher content of Fe2O3 compared to the others and a high content of F, which gives it the features of good wetting properties, low melt temperature and viscosity. High contents of Fe2O3 are, however, not preferable in alumina killed steels, since iron oxide is easily reduced. The results of the viscosity measurements are presented in Table 5.2.1. The viscosity data in this table are the average values obtained from the measurements using five different rotation speeds. The deviation of the experimental data from the mean value is less then one percent for all of the measurements, hence, the slags can safely be considered to behave as Newtonian fluids in the measured temperature range. The lower temperature limit for measurements is determined by the appearance of the two-phase region as marked by the drastic increase in the viscosity values. The upper temperature for the measurements was restricted by the use of iron components. Repetition of the viscosity measurements of the slag A and E, showed a maximum deviation of three percent and generally less. Considering experimental uncertainties associated with viscosity measurements, this deviation is relatively small. It should also be mentioned that the second measurements in the case of the two slags were carried out with new slag samples and new crucibles.
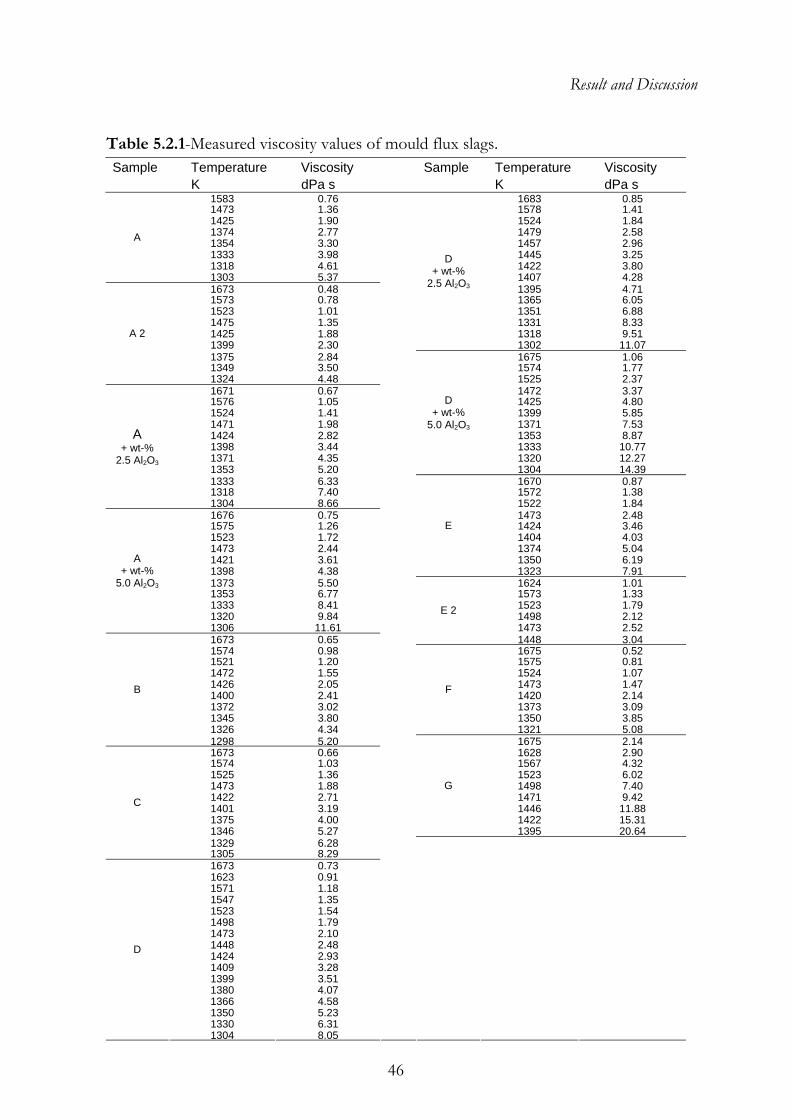
Result and Discussion
46
Table 5.2.1-Measured viscosity values of mould flux slags. Sample Temperature Viscosity Sample Temperature Viscosity K dPa s K dPa s
1583 0.76 1683 0.85 1473 1.36 1578 1.41 1425 1.90 1524 1.84 1374 2.77 1479 2.58 1354 3.30 1457 2.96 1333 3.98 1445 3.25 1318 4.61 1422 3.80
A
1303 5.37 1407 4.28 1673 0.48 1395 4.71 1573 0.78 1365 6.05 1523 1.01 1351 6.88 1475 1.35 1331 8.33 1425 1.88 1318 9.51 1399 2.30
D + wt-%
2.5 Al2O3
1302 11.07 1375 2.84 1675 1.06 1349 3.50 1574 1.77
A 2
1324 4.48 1525 2.37 1671 0.67 1472 3.37 1576 1.05 1425 4.80 1524 1.41 1399 5.85 1471 1.98 1371 7.53 1424 2.82 1353 8.87 1398 3.44 1333 10.77 1371 4.35 1320 12.27 1353 5.20
D + wt-%
5.0 Al2O3
1304 14.39 1333 6.33 1670 0.87 1318 7.40 1572 1.38
A + wt-%
2.5 Al2O3
1304 8.66 1522 1.84 1676 0.75 1473 2.48 1575 1.26 1424 3.46 1523 1.72 1404 4.03 1473 2.44 1374 5.04 1421 3.61 1350 6.19 1398 4.38
E
1323 7.91 1373 5.50 1624 1.01 1353 6.77 1573 1.33 1333 8.41 1523 1.79 1320 9.84 1498 2.12
A + wt-%
5.0 Al2O3
1306 11.61 1473 2.52 1673 0.65
E 2
1448 3.04 1574 0.98 1675 0.52 1521 1.20 1575 0.81 1472 1.55 1524 1.07 1426 2.05 1473 1.47 1400 2.41 1420 2.14 1372 3.02 1373 3.09 1345 3.80 1350 3.85 1326 4.34
F
1321 5.08
B
1298 5.20 1675 2.14 1673 0.66 1628 2.90 1574 1.03 1567 4.32 1525 1.36 1523 6.02 1473 1.88 1498 7.40 1422 2.71 1471 9.42 1401 3.19 1446 11.88 1375 4.00 1422 15.31 1346 5.27
G
1395 20.64 1329 6.28
C
1305 8.29 1673 0.73 1623 0.91 1571 1.18 1547 1.35 1523 1.54 1498 1.79 1473 2.10 1448 2.48 1424 2.93 1409 3.28 1399 3.51 1380 4.07 1366 4.58 1350 5.23 1330 6.31
D
1304 8.05
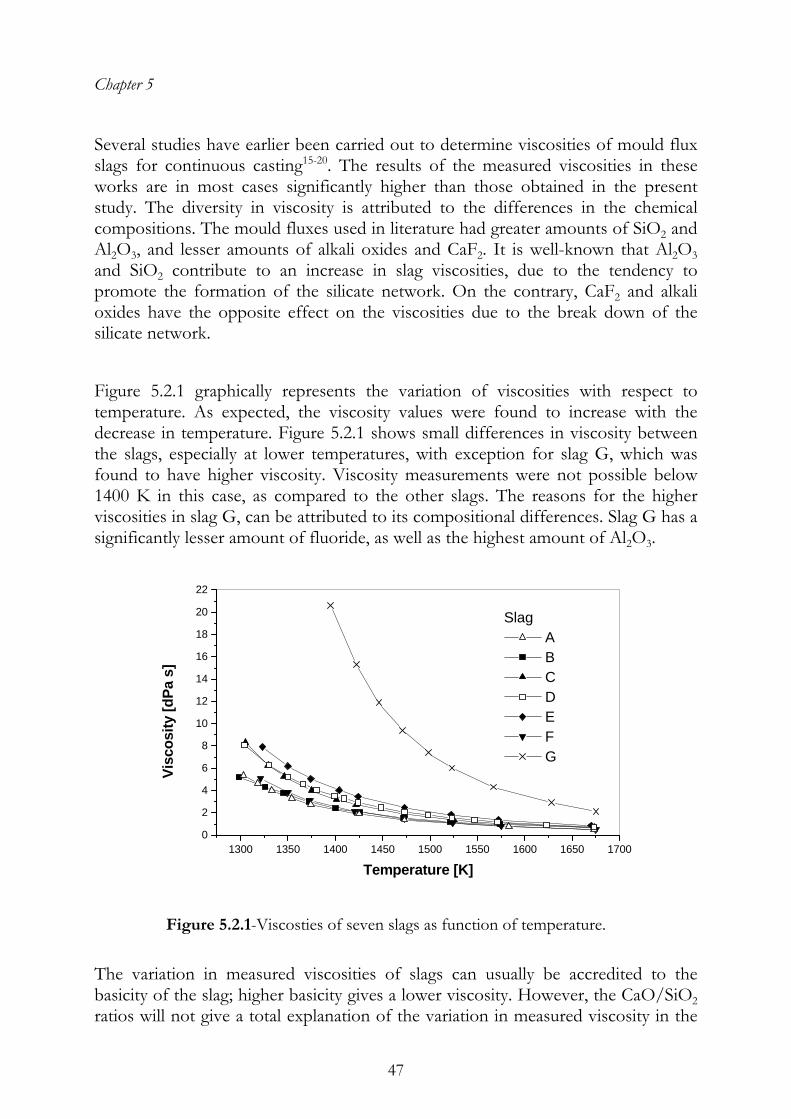
Chapter 5
47
Several studies have earlier been carried out to determine viscosities of mould flux slags for continuous casting15-20. The results of the measured viscosities in these works are in most cases significantly higher than those obtained in the present study. The diversity in viscosity is attributed to the differences in the chemical compositions. The mould fluxes used in literature had greater amounts of SiO2 and Al2O3, and lesser amounts of alkali oxides and CaF2. It is well-known that Al2O3 and SiO2 contribute to an increase in slag viscosities, due to the tendency to promote the formation of the silicate network. On the contrary, CaF2 and alkali oxides have the opposite effect on the viscosities due to the break down of the silicate network. Figure 5.2.1 graphically represents the variation of viscosities with respect to temperature. As expected, the viscosity values were found to increase with the decrease in temperature. Figure 5.2.1 shows small differences in viscosity between the slags, especially at lower temperatures, with exception for slag G, which was found to have higher viscosity. Viscosity measurements were not possible below 1400 K in this case, as compared to the other slags. The reasons for the higher viscosities in slag G, can be attributed to its compositional differences. Slag G has a significantly lesser amount of fluoride, as well as the highest amount of Al2O3.
1300 1350 1400 1450 1500 1550 1600 1650 17000
2
4
6
8
10
12
14
16
18
20
22
Slag A B C D E F G
Visc
osity
[dPa
s]
Temperature [K]
Figure 5.2.1-Viscosties of seven slags as function of temperature.
The variation in measured viscosities of slags can usually be accredited to the basicity of the slag; higher basicity gives a lower viscosity. However, the CaO/SiO2 ratios will not give a total explanation of the variation in measured viscosity in the
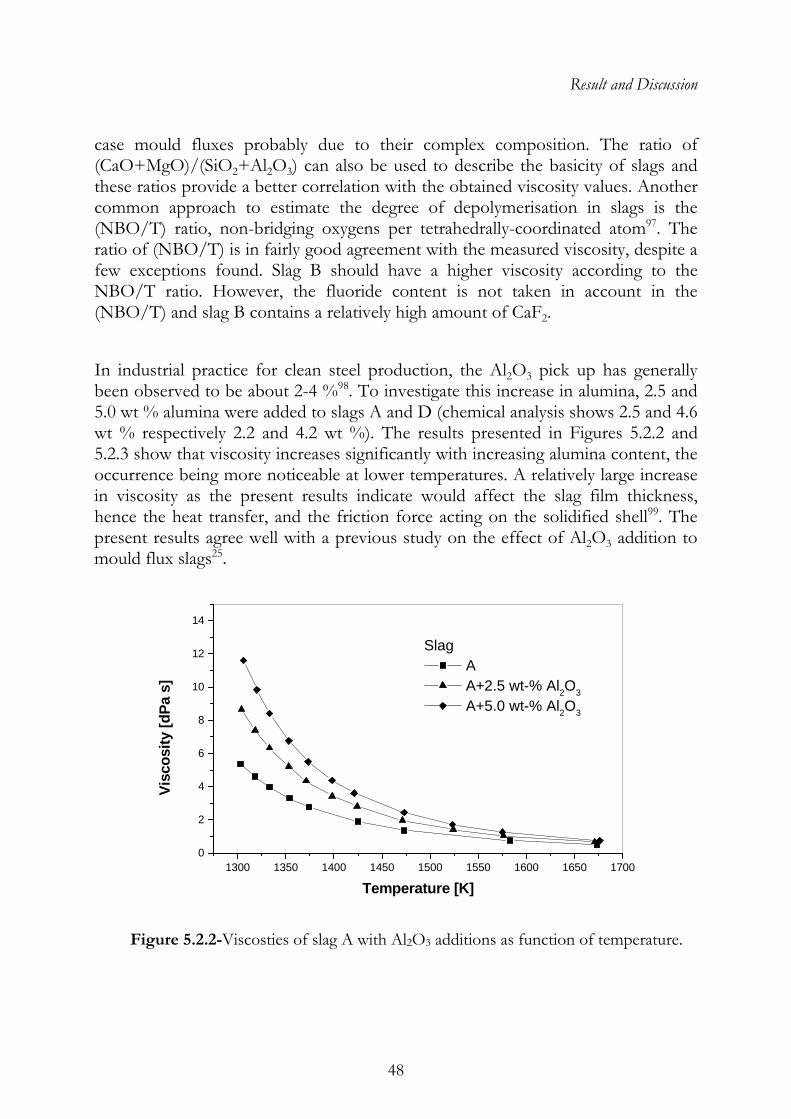
Result and Discussion
48
case mould fluxes probably due to their complex composition. The ratio of (CaO+MgO)/(SiO2+Al2O3) can also be used to describe the basicity of slags and these ratios provide a better correlation with the obtained viscosity values. Another common approach to estimate the degree of depolymerisation in slags is the (NBO/T) ratio, non-bridging oxygens per tetrahedrally-coordinated atom97. The ratio of (NBO/T) is in fairly good agreement with the measured viscosity, despite a few exceptions found. Slag B should have a higher viscosity according to the NBO/T ratio. However, the fluoride content is not taken in account in the (NBO/T) and slag B contains a relatively high amount of CaF2. In industrial practice for clean steel production, the Al2O3 pick up has generally been observed to be about 2-4 %98. To investigate this increase in alumina, 2.5 and 5.0 wt % alumina were added to slags A and D (chemical analysis shows 2.5 and 4.6 wt % respectively 2.2 and 4.2 wt %). The results presented in Figures 5.2.2 and 5.2.3 show that viscosity increases significantly with increasing alumina content, the occurrence being more noticeable at lower temperatures. A relatively large increase in viscosity as the present results indicate would affect the slag film thickness, hence the heat transfer, and the friction force acting on the solidified shell99. The present results agree well with a previous study on the effect of Al2O3 addition to mould flux slags25.
1300 1350 1400 1450 1500 1550 1600 1650 17000
2
4
6
8
10
12
14
Slag A A+2.5 wt-% Al2O3
A+5.0 wt-% Al2O3
Visc
osity
[dPa
s]
Temperature [K]
Figure 5.2.2-Viscosties of slag A with Al2O3 additions as function of temperature.
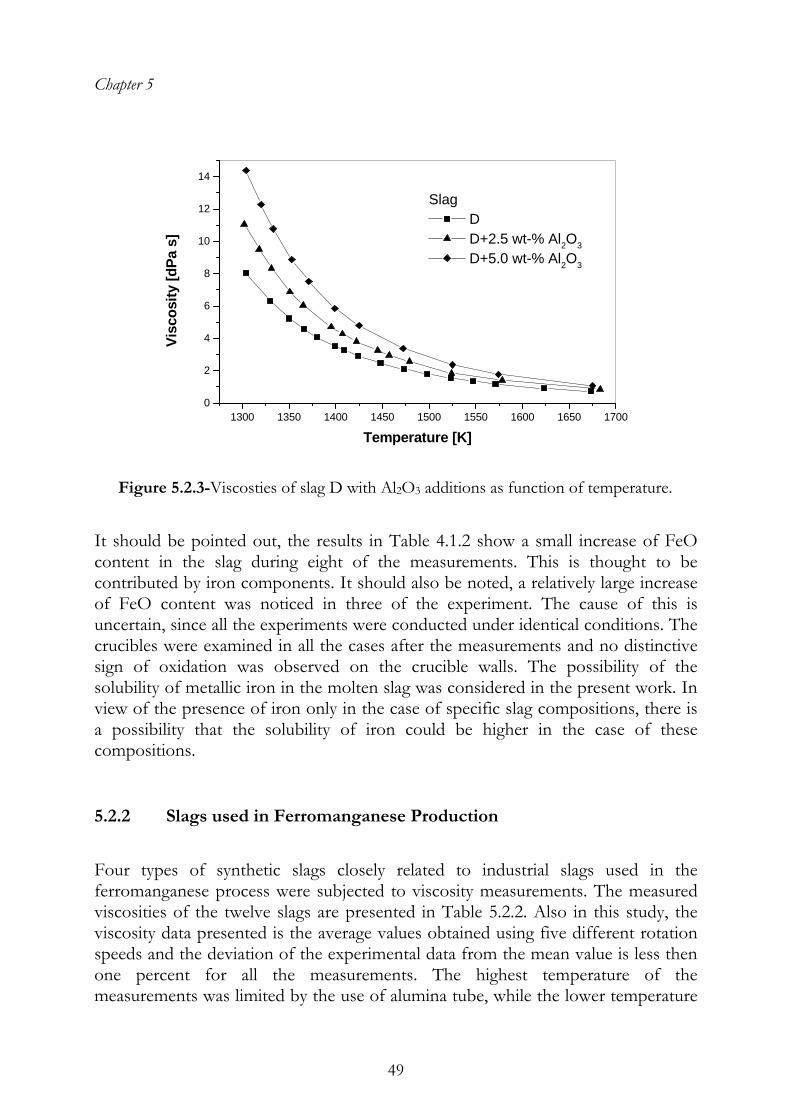
Chapter 5
49
1300 1350 1400 1450 1500 1550 1600 1650 17000
2
4
6
8
10
12
14
Slag D D+2.5 wt-% Al2O3
D+5.0 wt-% Al2O3
Visc
osity
[dPa
s]
Temperature [K]
Figure 5.2.3-Viscosties of slag D with Al2O3 additions as function of temperature.
It should be pointed out, the results in Table 4.1.2 show a small increase of FeO content in the slag during eight of the measurements. This is thought to be contributed by iron components. It should also be noted, a relatively large increase of FeO content was noticed in three of the experiment. The cause of this is uncertain, since all the experiments were conducted under identical conditions. The crucibles were examined in all the cases after the measurements and no distinctive sign of oxidation was observed on the crucible walls. The possibility of the solubility of metallic iron in the molten slag was considered in the present work. In view of the presence of iron only in the case of specific slag compositions, there is a possibility that the solubility of iron could be higher in the case of these compositions.
5.2.2 Slags used in Ferromanganese Production Four types of synthetic slags closely related to industrial slags used in the ferromanganese process were subjected to viscosity measurements. The measured viscosities of the twelve slags are presented in Table 5.2.2. Also in this study, the viscosity data presented is the average values obtained using five different rotation speeds and the deviation of the experimental data from the mean value is less then one percent for all the measurements. The highest temperature of the measurements was limited by the use of alumina tube, while the lower temperature
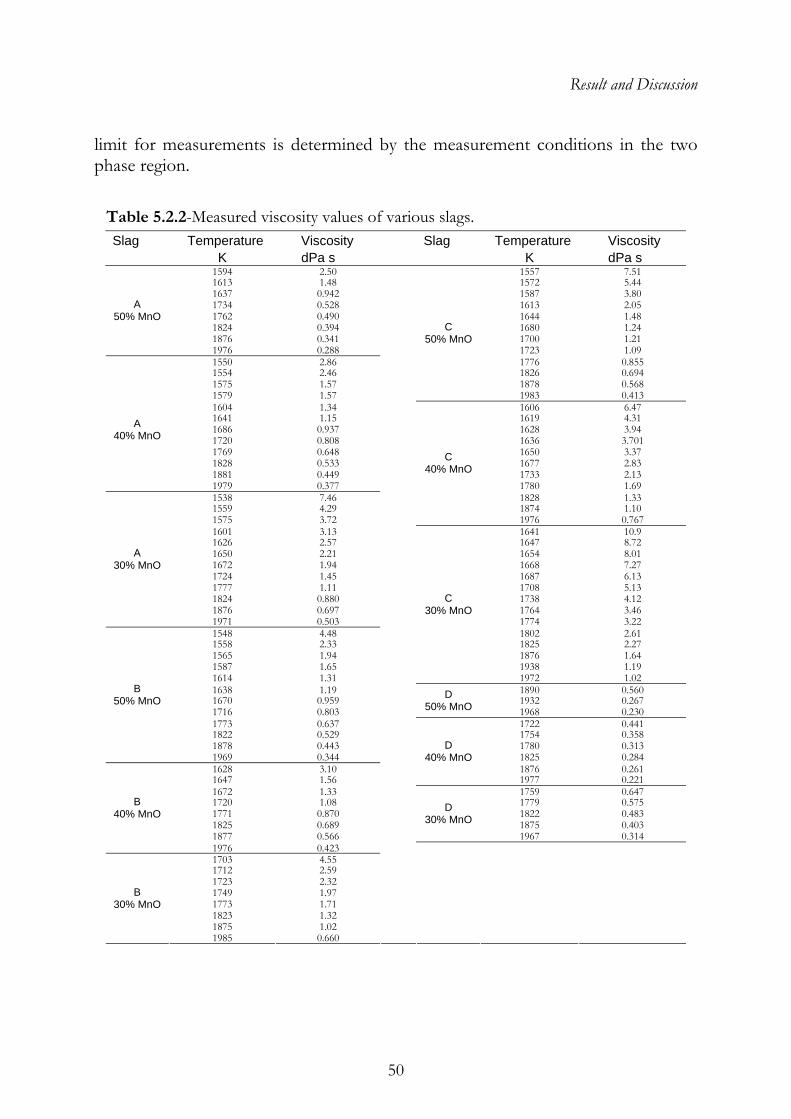
Result and Discussion
50
limit for measurements is determined by the measurement conditions in the two phase region.
Table 5.2.2-Measured viscosity values of various slags. Slag Temperature Viscosity Slag Temperature Viscosity K dPa s K dPa s
1594 2.50 1557 7.51 1613 1.48 1572 5.44 1637 0.942 1587 3.80 1734 0.528 1613 2.05 1762 0.490 1644 1.48 1824 0.394 1680 1.24 1876 0.341 1700 1.21
A 50% MnO
1976 0.288 1723 1.09 1550 2.86 1776 0.855 1554 2.46 1826 0.694 1575 1.57 1878 0.568 1579 1.57
C 50% MnO
1983 0.413 1604 1.34 1606 6.47 1641 1.15 1619 4.31 1686 0.937 1628 3.94 1720 0.808 1636 3.701 1769 0.648 1650 3.37 1828 0.533 1677 2.83 1881 0.449 1733 2.13
A
40% MnO
1979 0.377 1780 1.69 1538 7.46 1828 1.33 1559 4.29 1874 1.10 1575 3.72
C 40% MnO
1976 0.767 1601 3.13 1641 10.9 1626 2.57 1647 8.72 1650 2.21 1654 8.01 1672 1.94 1668 7.27 1724 1.45 1687 6.13 1777 1.11 1708 5.13 1824 0.880 1738 4.12 1876 0.697 1764 3.46
A 30% MnO
1971 0.503 1774 3.22 1548 4.48 1802 2.61 1558 2.33 1825 2.27 1565 1.94 1876 1.64 1587 1.65 1938 1.19 1614 1.31
C 30% MnO
1972 1.02 1638 1.19 1890 0.560 1670 0.959 1932 0.267 1716 0.803
D 50% MnO 1968 0.230
1773 0.637 1722 0.441 1822 0.529 1754 0.358 1878 0.443 1780 0.313
B 50% MnO
1969 0.344 1825 0.284 1628 3.10 1876 0.261 1647 1.56
D 40% MnO
1977 0.221 1672 1.33 1759 0.647 1720 1.08 1779 0.575 1771 0.870 1822 0.483 1825 0.689 1875 0.403 1877 0.566
D 30% MnO
1967 0.314
B 40% MnO
1976 0.423 1703 4.55 1712 2.59 1723 2.32 1749 1.97 1773 1.71 1823 1.32 1875 1.02
B 30% MnO
1985 0.660
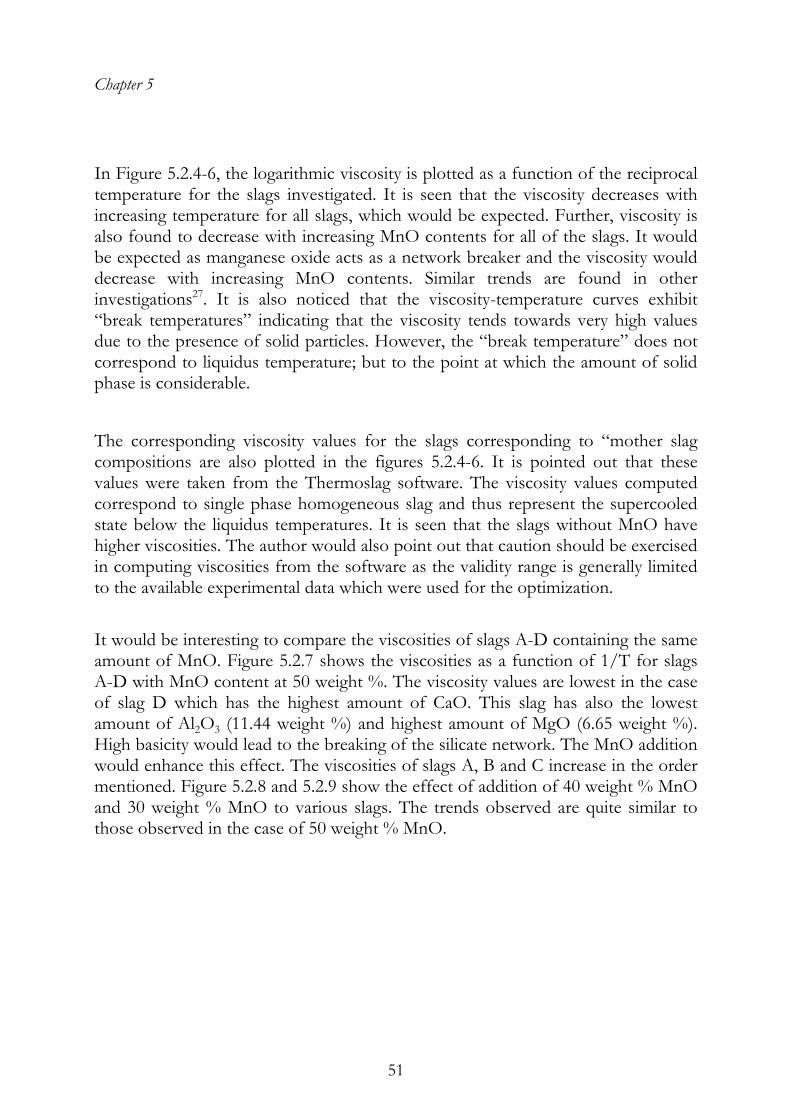
Chapter 5
51
In Figure 5.2.4-6, the logarithmic viscosity is plotted as a function of the reciprocal temperature for the slags investigated. It is seen that the viscosity decreases with increasing temperature for all slags, which would be expected. Further, viscosity is also found to decrease with increasing MnO contents for all of the slags. It would be expected as manganese oxide acts as a network breaker and the viscosity would decrease with increasing MnO contents. Similar trends are found in other investigations27. It is also noticed that the viscosity-temperature curves exhibit “break temperatures” indicating that the viscosity tends towards very high values due to the presence of solid particles. However, the “break temperature” does not correspond to liquidus temperature; but to the point at which the amount of solid phase is considerable. The corresponding viscosity values for the slags corresponding to “mother slag compositions are also plotted in the figures 5.2.4-6. It is pointed out that these values were taken from the Thermoslag software. The viscosity values computed correspond to single phase homogeneous slag and thus represent the supercooled state below the liquidus temperatures. It is seen that the slags without MnO have higher viscosities. The author would also point out that caution should be exercised in computing viscosities from the software as the validity range is generally limited to the available experimental data which were used for the optimization. It would be interesting to compare the viscosities of slags A-D containing the same amount of MnO. Figure 5.2.7 shows the viscosities as a function of 1/T for slags A-D with MnO content at 50 weight %. The viscosity values are lowest in the case of slag D which has the highest amount of CaO. This slag has also the lowest amount of Al2O3 (11.44 weight %) and highest amount of MgO (6.65 weight %). High basicity would lead to the breaking of the silicate network. The MnO addition would enhance this effect. The viscosities of slags A, B and C increase in the order mentioned. Figure 5.2.8 and 5.2.9 show the effect of addition of 40 weight % MnO and 30 weight % MnO to various slags. The trends observed are quite similar to those observed in the case of 50 weight % MnO.
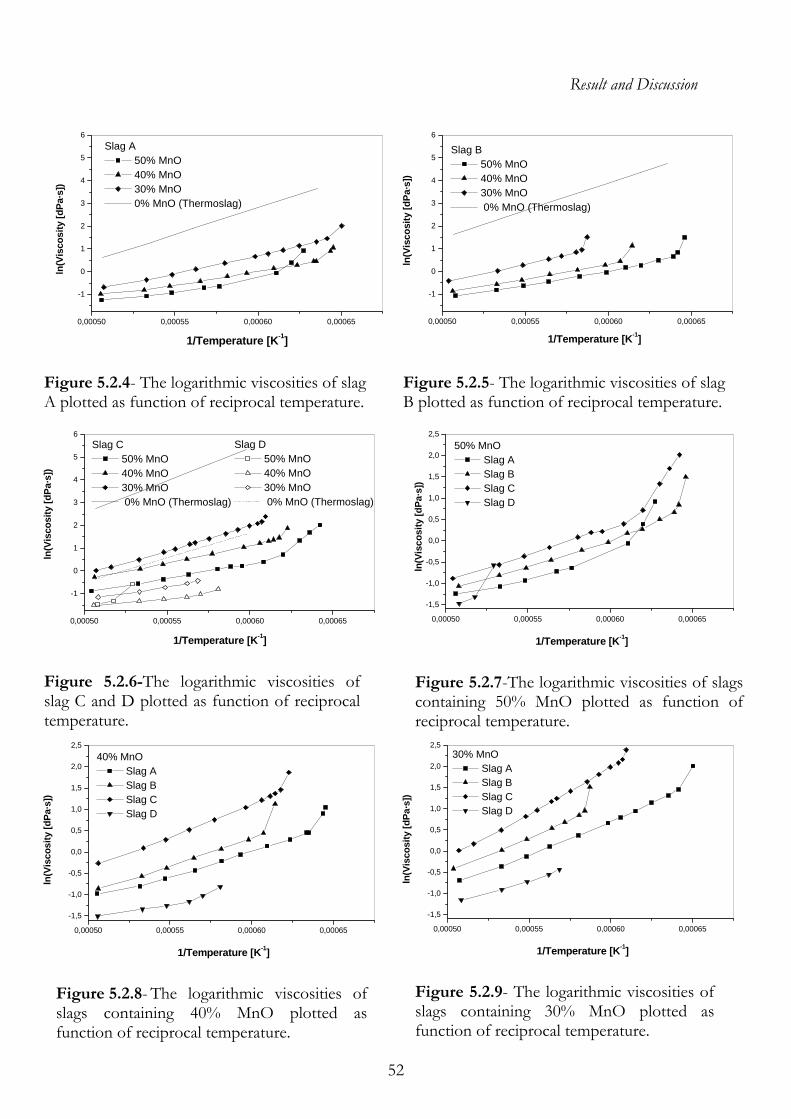
Result and Discussion
52
0,00050 0,00055 0,00060 0,00065
-1
0
1
2
3
4
5
6Slag A
0,00050 0,00055 0,00060 0,00065
-1
0
1
2
3
4
5
6
1/Temperature [K-1]
ln(V
isco
sity
[dPa
·s])
Slag B 50% MnO 40% MnO 30% MnO 0% MnO (Thermoslag)
50% MnO 40% MnO 30% MnO 0% MnO (Thermoslag)
ln(V
isco
sity
[dPa
·s])
1/Temperature [K-1]
Figure 5.2.4- The logarithmic viscosities of slag A plotted as function of reciprocal temperature.
Figure 5.2.5- The logarithmic viscosities of slag B plotted as function of reciprocal temperature.
0,00050 0,00055 0,00060 0,00065
-1
0
1
2
3
4
5
6Slag D
50% MnO 40% MnO 30% MnO 0% MnO (Thermoslag)
1/Temperature [K-1]
ln(V
isco
sity
[dPa
·s])
Slag C 50% MnO 40% MnO 30% MnO 0% MnO (Thermoslag)
0,00050 0,00055 0,00060 0,00065
-1,5
-1,0
-0,5
0,0
0,5
1,0
1,5
2,0
2,5
1/Temperature [K-1]
ln(V
isco
sity
[dPa
·s])
50% MnO Slag A Slag B Slag C Slag D
0,00050 0,00055 0,00060 0,00065
-1,5
-1,0
-0,5
0,0
0,5
1,0
1,5
2,0
2,5
1/Temperature [K-1]
ln(V
isco
sity
[dPa
·s])
40% MnO Slag A Slag B Slag C Slag D
0,00050 0,00055 0,00060 0,00065
-1,5
-1,0
-0,5
0,0
0,5
1,0
1,5
2,0
2,5
1/Temperature [K-1]
ln(V
isco
sity
[dPa
·s])
30% MnO Slag A Slag B Slag C Slag D
Figure 5.2.6-The logarithmic viscosities of slag C and D plotted as function of reciprocal temperature.
Figure 5.2.7-The logarithmic viscosities of slags containing 50% MnO plotted as function of reciprocal temperature.
Figure 5.2.9- The logarithmic viscosities of
slags containing 30% MnO plotted as function of reciprocal temperature.
Figure 5.2.8- The logarithmic viscosities of slags containing 40% MnO plotted as function of reciprocal temperature.
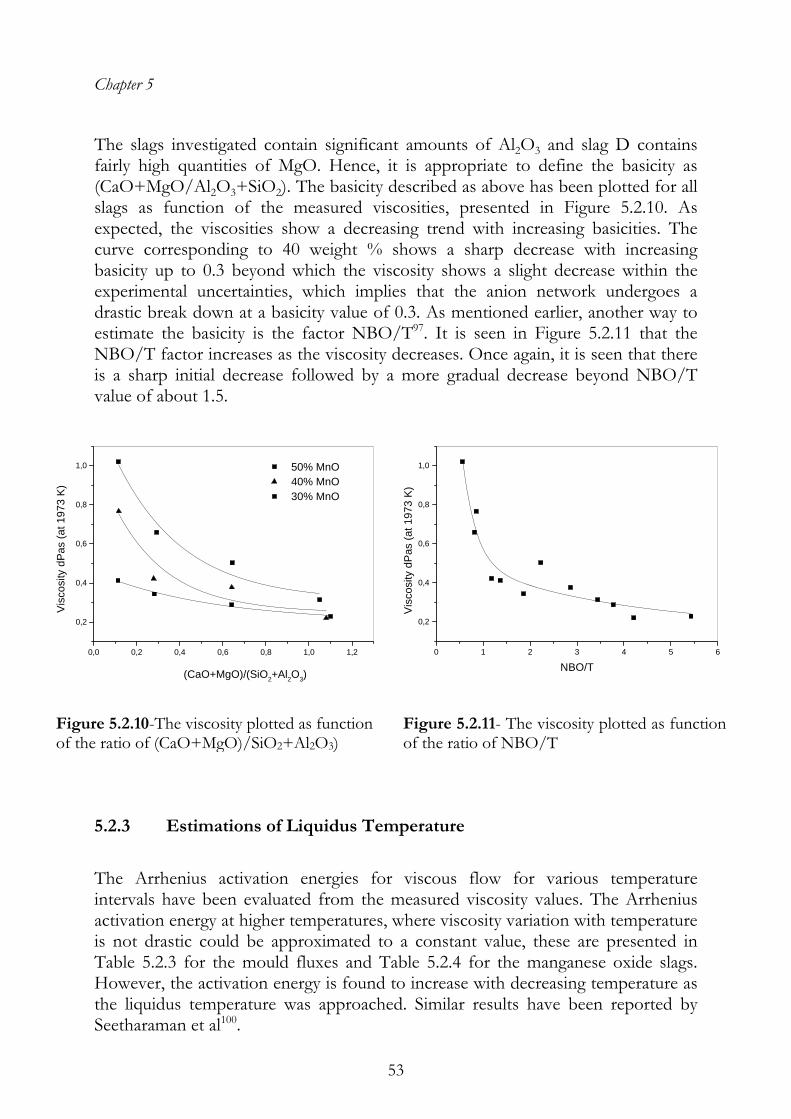
Chapter 5
53
The slags investigated contain significant amounts of Al2O3 and slag D contains fairly high quantities of MgO. Hence, it is appropriate to define the basicity as (CaO+MgO/Al2O3+SiO2). The basicity described as above has been plotted for all slags as function of the measured viscosities, presented in Figure 5.2.10. As expected, the viscosities show a decreasing trend with increasing basicities. The curve corresponding to 40 weight % shows a sharp decrease with increasing basicity up to 0.3 beyond which the viscosity shows a slight decrease within the experimental uncertainties, which implies that the anion network undergoes a drastic break down at a basicity value of 0.3. As mentioned earlier, another way to estimate the basicity is the factor NBO/T97. It is seen in Figure 5.2.11 that the NBO/T factor increases as the viscosity decreases. Once again, it is seen that there is a sharp initial decrease followed by a more gradual decrease beyond NBO/T value of about 1.5.
0,0 0,2 0,4 0,6 0,8 1,0 1,2
0,2
0,4
0,6
0,8
1,0
0 1 2 3 4 5 6
0,2
0,4
0,6
0,8
1,0
Vis
cosi
ty d
Pas
(at 1
973
K)
NBO/T
50% MnO
(CaO+MgO)/(SiO2+Al2O3)
Vis
cosi
ty d
Pas
(at 1
973
K) 40% MnO
30% MnO
Figure 5.2.10-The viscosity plotted as function of the ratio of (CaO+MgO)/SiO2+Al2O3)
Figure 5.2.11- The viscosity plotted as function of the ratio of NBO/T
5.2.3 Estimations of Liquidus Temperature
The Arrhenius activation energies for viscous flow for various temperature intervals have been evaluated from the measured viscosity values. The Arrhenius activation energy at higher temperatures, where viscosity variation with temperature is not drastic could be approximated to a constant value, these are presented in Table 5.2.3 for the mould fluxes and Table 5.2.4 for the manganese oxide slags. However, the activation energy is found to increase with decreasing temperature as the liquidus temperature was approached. Similar results have been reported by Seetharaman et al100.
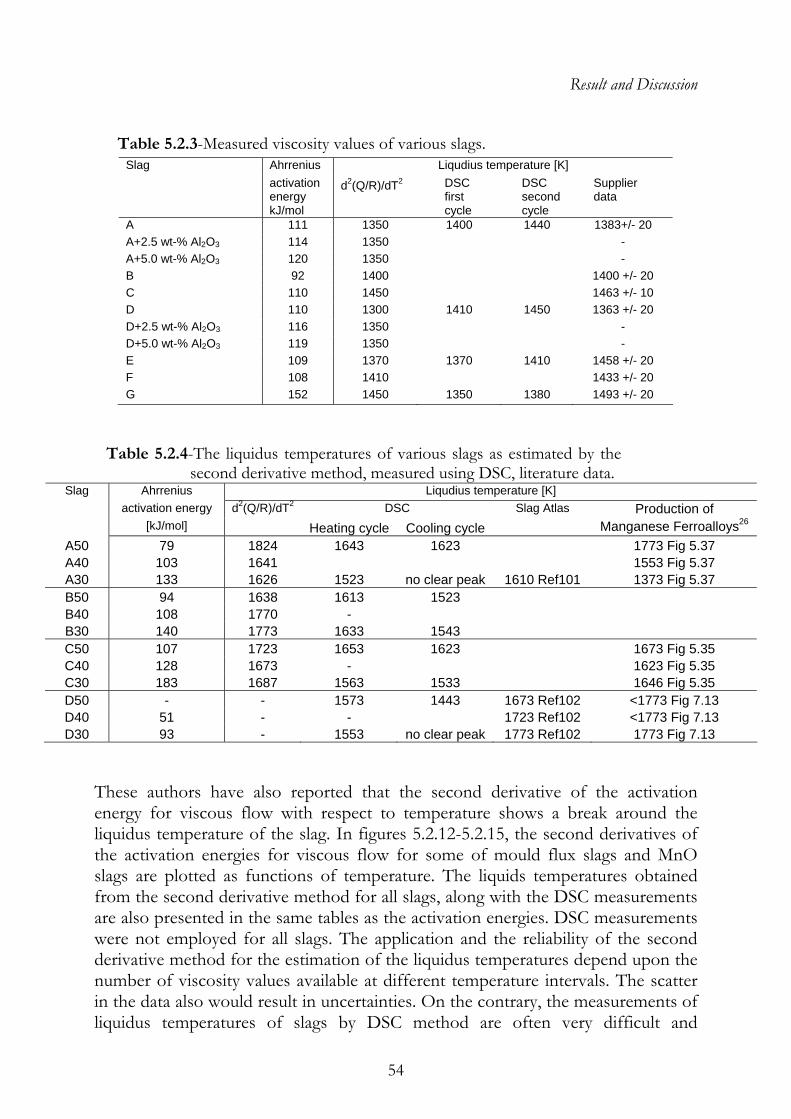
Result and Discussion
54
Table 5.2.3-Measured viscosity values of various slags. Slag Ahrrenius Liqudius temperature [K] activation
energy kJ/mol
d2(Q/R)/dT2 DSC first cycle
DSC second cycle
Supplier data
A 111 1350 1400 1440 1383+/- 20 A+2.5 wt-% Al2O3 114 1350 - A+5.0 wt-% Al2O3 120 1350 - B 92 1400 1400 +/- 20 C 110 1450 1463 +/- 10 D 110 1300 1410 1450 1363 +/- 20 D+2.5 wt-% Al2O3 116 1350 - D+5.0 wt-% Al2O3 119 1350 - E 109 1370 1370 1410 1458 +/- 20 F 108 1410 1433 +/- 20 G 152 1450 1350 1380 1493 +/- 20
Table 5.2.4-The liquidus temperatures of various slags as estimated by the second derivative method, measured using DSC, literature data.
Ahrrenius Liqudius temperature [K] activation energy DSC Production of
Slag
[kJ/mol] d2(Q/R)/dT2
Heating cycle Cooling cycle Slag Atlas
Manganese Ferroalloys26
A50 79 1824 1643 1623 1773 Fig 5.37 A40 103 1641 1553 Fig 5.37 A30 133 1626 1523 no clear peak 1610 Ref101 1373 Fig 5.37 B50 94 1638 1613 1523 B40 108 1770 - B30 140 1773 1633 1543 C50 107 1723 1653 1623 1673 Fig 5.35 C40 128 1673 - 1623 Fig 5.35 C30 183 1687 1563 1533 1646 Fig 5.35 D50 - - 1573 1443 1673 Ref102 <1773 Fig 7.13 D40 51 - - 1723 Ref102 <1773 Fig 7.13 D30 93 - 1553 no clear peak 1773 Ref102 1773 Fig 7.13
These authors have also reported that the second derivative of the activation energy for viscous flow with respect to temperature shows a break around the liquidus temperature of the slag. In figures 5.2.12-5.2.15, the second derivatives of the activation energies for viscous flow for some of mould flux slags and MnO slags are plotted as functions of temperature. The liquids temperatures obtained from the second derivative method for all slags, along with the DSC measurements are also presented in the same tables as the activation energies. DSC measurements were not employed for all slags. The application and the reliability of the second derivative method for the estimation of the liquidus temperatures depend upon the number of viscosity values available at different temperature intervals. The scatter in the data also would result in uncertainties. On the contrary, the measurements of liquidus temperatures of slags by DSC method are often very difficult and
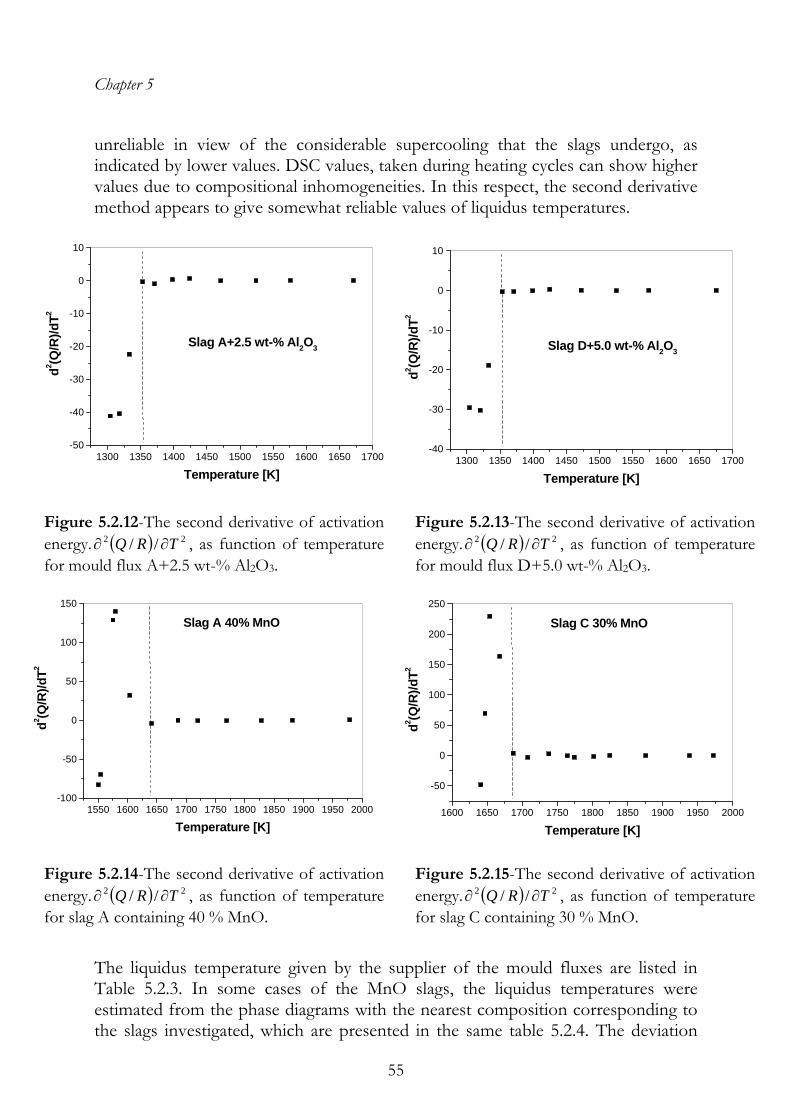
Chapter 5
55
unreliable in view of the considerable supercooling that the slags undergo, as indicated by lower values. DSC values, taken during heating cycles can show higher values due to compositional inhomogeneities. In this respect, the second derivative method appears to give somewhat reliable values of liquidus temperatures.
1300 1350 1400 1450 1500 1550 1600 1650 1700
-50
-40
-30
-20
-10
0
10
Slag A+2.5 wt-% Al2O3
d2 (Q/R
)/dT2
Temperature [K]1300 1350 1400 1450 1500 1550 1600 1650 1700
-40
-30
-20
-10
0
10
Slag D+5.0 wt-% Al2O3
d2 (Q/R
)/dT2
Temperature [K]
Figure 5.2.12-The second derivative of activation
energy. , as function of temperature for mould flux A+2.5 w
( ) 22 // TRQ ∂∂t-% Al2O3.
Figure 5.2.13-The second derivative of activation energy. ( ) 22 // TRQ ∂∂ , as function of temperature for mould flux D+5.0 wt-% Al2O3.
1550 1600 1650 1700 1750 1800 1850 1900 1950 2000
-100
-50
0
50
100
150
Slag A 40% MnO
d2 (Q/R
)/dT2
Temperature [K]1600 1650 1700 1750 1800 1850 1900 1950 2000
-50
0
50
100
150
200
250
Slag C 30% MnO
d2 (Q/R
)/dT2
Temperature [K] Figure 5.2.14-The second derivative of activation
energy. , as function of temperature for slag A containing 40 % MnO.
( ) 22 // TRQ ∂∂Figure 5.2.15-The second derivative of activation energy. ( ) 22 // TRQ ∂∂ , as function of temperature for slag C containing 30 % MnO.
The liquidus temperature given by the supplier of the mould fluxes are listed in Table 5.2.3. In some cases of the MnO slags, the liquidus temperatures were estimated from the phase diagrams with the nearest composition corresponding to the slags investigated, which are presented in the same table 5.2.4. The deviation
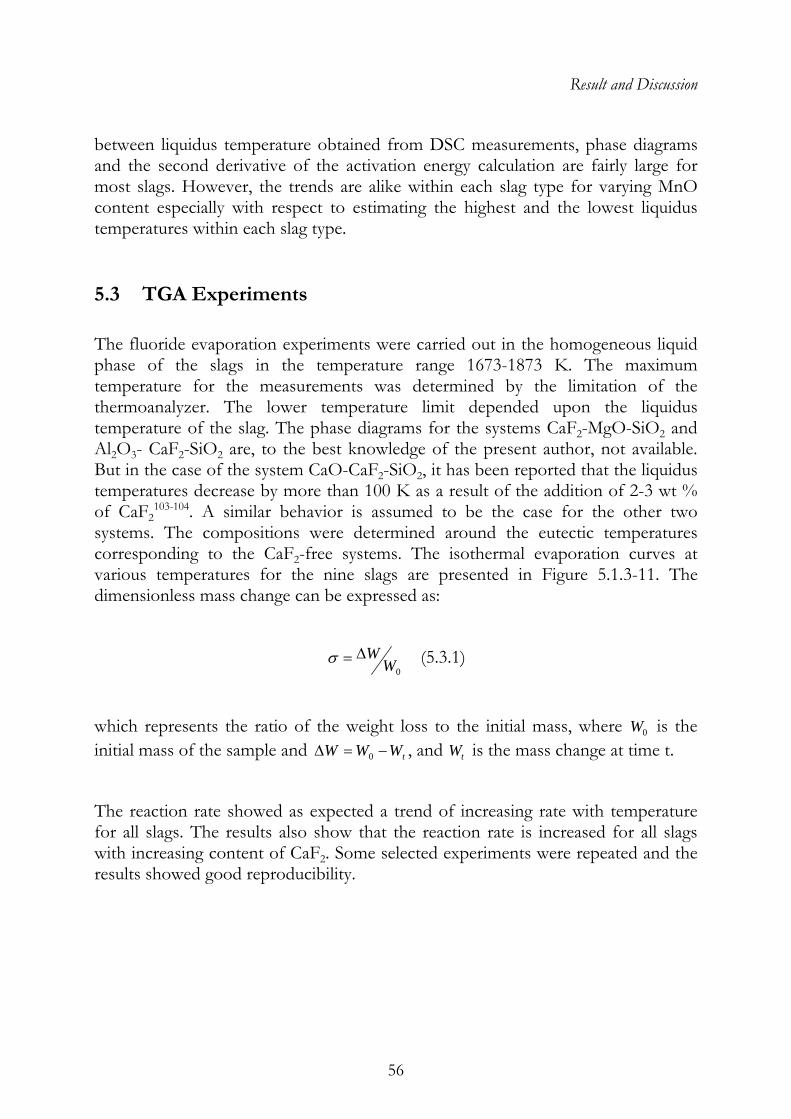
Result and Discussion
56
between liquidus temperature obtained from DSC measurements, phase diagrams and the second derivative of the activation energy calculation are fairly large for most slags. However, the trends are alike within each slag type for varying MnO content especially with respect to estimating the highest and the lowest liquidus temperatures within each slag type.
5.3 TGA Experiments The fluoride evaporation experiments were carried out in the homogeneous liquid phase of the slags in the temperature range 1673-1873 K. The maximum temperature for the measurements was determined by the limitation of the thermoanalyzer. The lower temperature limit depended upon the liquidus temperature of the slag. The phase diagrams for the systems CaF2-MgO-SiO2 and Al2O3- CaF2-SiO2 are, to the best knowledge of the present author, not available. But in the case of the system CaO-CaF2-SiO2, it has been reported that the liquidus temperatures decrease by more than 100 K as a result of the addition of 2-3 wt % of CaF2
103-104. A similar behavior is assumed to be the case for the other two systems. The compositions were determined around the eutectic temperatures corresponding to the CaF2-free systems. The isothermal evaporation curves at various temperatures for the nine slags are presented in Figure 5.1.3-11. The dimensionless mass change can be expressed as:
0WWΔ=σ (5.3.1)
which represents the ratio of the weight loss to the initial mass, where is the initial mass of the sample and
0W
tWWW −=Δ 0 , and is the mass change at time t. tW
The reaction rate showed as expected a trend of increasing rate with temperature for all slags. The results also show that the reaction rate is increased for all slags with increasing content of CaF2. Some selected experiments were repeated and the results showed good reproducibility.
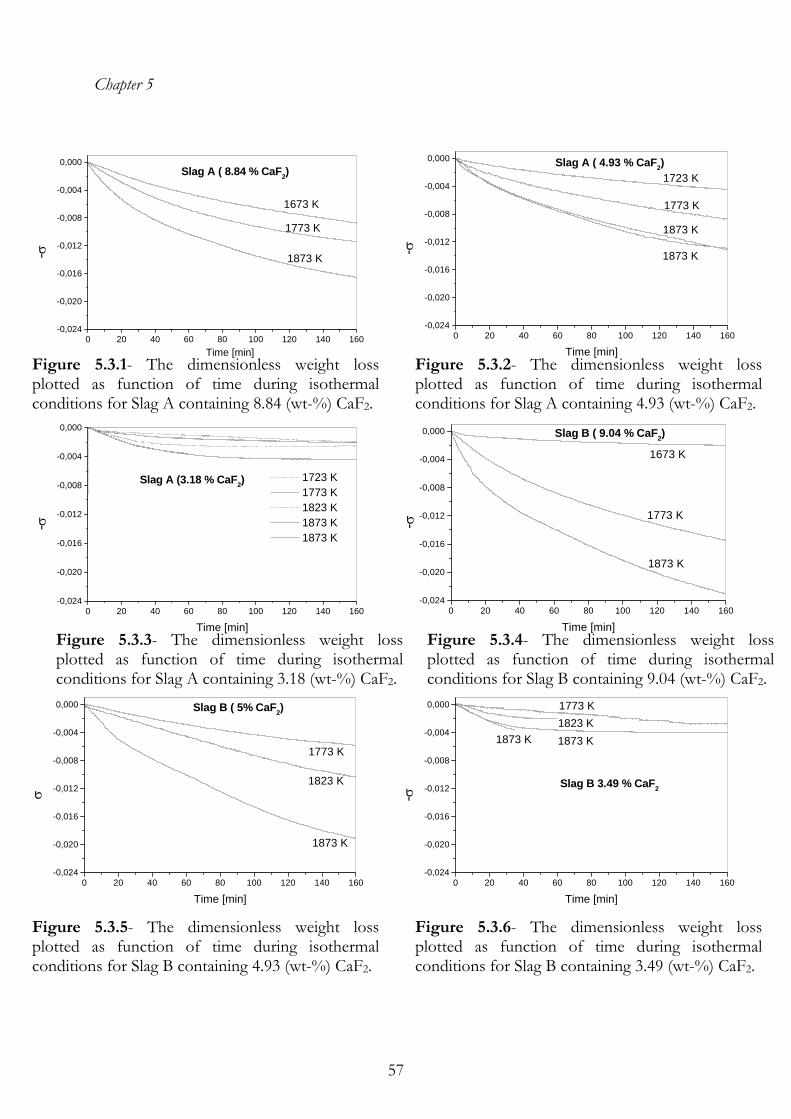
Chapter 5
57
0 20 40 60 80 100 120 140 160-0,024
-0,020
-0,016
-0,012
-0,008
-0,004
0,000 Slag A ( 4.93 % CaF2)1723 K
1773 K
1873 K
1873 K
-σ
Time [min]
0 20 40 60 80 100 120 140 160-0,024
-0,020
-0,016
-0,012
-0,008
-0,004
0,000Slag A ( 8.84 % CaF2)
1673 K
1773 K
1873 K-σ
Time [min]Figure 5.3.1- The dimensionless weight loss plotted as function of time during isothermal conditions for Slag A containing 8.84 (wt-%) CaF2.
Figure 5.3.2- The dimensionless weight loss plotted as function of time during isothermal conditions for Slag A containing 4.93 (wt-%) CaF2.
0 20 40 60 80 100 120 140 160-0,024
-0,020
-0,016
-0,012
-0,008
-0,004
0,000
1723 K 1773 K 1823 K 1873 K 1873 K
Slag A (3.18 % CaF2)
-σ
Time [min]0 20 40 60 80 100 120 140 160
-0,024
-0,020
-0,016
-0,012
-0,008
-0,004
0,000 Slag B ( 9.04 % CaF2)
1673 K
1773 K
1873 K
-σ
Time [min]
Figure 5.3.3- The dimensionless weight loss plotted as function of time during isothermal conditions for Slag A containing 3.18 (wt-%) CaF2.
Figure 5.3.4- The dimensionless weight loss plotted as function of time during isothermal conditions for Slag B containing 9.04 (wt-%) CaF2.
0 20 40 60 80 100 120 140 160-0,024
-0,020
-0,016
-0,012
-0,008
-0,004
0,000 Slag B ( 5% CaF2)
1773 K
1823 K
1873 K
σ
Time [min]0 20 40 60 80 100 120 140 160
-0,024
-0,020
-0,016
-0,012
-0,008
-0,004
0,000
1873 K
Slag B 3.49 % CaF2
1773 K1823 K1873 K
-σ
Time [min]
Figure 5.3.5- The dimensionless weight loss plotted as function of time during isothermal conditions for Slag B containing 4.93 (wt-%) CaF2.
Figure 5.3.6- The dimensionless weight loss plotted as function of time during isothermal conditions for Slag B containing 3.49 (wt-%) CaF2.
Result and Discussion
58
0 20 40 60 80 100 120 140 160-0,024
-0,020
-0,016
-0,012
-0,008
-0,004
0,000
Slag C 8.49 % CaF2
1873 K
1823 K
-σ
Time [min]0 20 40 60 80 100 120
-0,024
-0,020
-0,016
-0,012
-0,008
-0,004
0,000
Slag C 4.4 % CaF2
1773 K1873 K
-σ
Time [min]
Figure 5.3.7- The dimensionless weight loss plotted as function of time during isothermal conditions for Slag C containing 8.49 (wt-%) CaF2.
Figure 5.3.8- The dimensionless weight loss plotted as function of time during isothermal conditions for Slag C containing 4.44 (wt-%) CaF2.
0 20 40 60 80 0 10 20 30 40 50 60-0,024
-0,020
-0,016
-0,012
-0,008
-0,004
0,000
Slag D 10.2 % CaF2
1673 K 1773 K 1873 K
-σ
Time [min]
-0,024
-0,020
-0,016
-0,012
-0,008
-0,004
0,000
Slag C 3.5 % CaF2
1823 K1873 K
-σ
Time [min]Figure 5.3.10- The dimensionless weight loss plotted as function of time during isothermal conditions for Slag D containing 10.2 (wt-%) CaF2.
Figure 5.3.9- The dimensionless weight loss plotted as function of time during isothermal conditions for Slag C containing 3.49 (wt-%) CaF2.
0 10 20 30 40 50 60-0,024
-0,020
-0,016
-0,012
-0,008
-0,004
0,000
1673 K 1773 K 1873 K
Slag D 5.24 % CaF2
-σ
Time [min]
Figure 5.3.11- The dimensionless weight loss plotted as function of time during isothermal conditions for Slag D containing 5.24 (wt-%) CaF2.
Chapter 5
59
The reaction presented earlier (1.1.1) is considered as the main cause of the fluoride evaporation in the experiments. In view of the precautions taken in the experimental work, with regards to moisture control, the reaction between any moisture present in the slag ingredients and CaF2 resulting in HF evolution was ruled out. Earlier work in the division105 has shown that the direct evaporation of CaF2 has insignificant impact on fluoride evaporation from slags. The activation energy for the evaporation process was evaluated by Arrhenius plots, presented in Figure 5.3.12-5.3.15 using the rates obtained at different temperatures during the isothermal sequence. By examination of the initial parts of figures 5.3.1-11 it is seen that the rate is almost linear for all slags during the first twenty minutes. Hence, only this part of the experiments was used to estimate the different rates. This practice was necessitated by the significant change in the slag chemistry due to the evaporation of SiF4 and consequent increase in the CaO content in the slag along with the loss of SiO2 at higher times. Only two data points could be obtained in the case of the system Al2O3-SiO2 and subsequently the Arrhenius analysis was carried out by using only these two points. For all the slag types, the activation energy is increasing with decreasing CaF2.content. Thus, the thermal effect is least in the case of slags with the highest amount of CaF2.
0,00052 0,00054 0,00056 0,00058 0,00060-15
-14
-13
-12
-11
Temperature K
Slag A 3.2 wt-% CaF2 (Q=231 kJ/mole) 4.8 wt-% CaF2 (Q=202 kJ/mole) 8.8 wt-% CaF2 (Q=141 kJ/mole)
ln(σ
/dt)
1/T K-1
1923 1873 1823 1773 1723 1673
0,00052 0,00054 0,00056 0,00058 0,00060-17
-16
-15
-14
-13
-12
-11
-10Slag B
3.5 wt-% CaF2 (Q=478 kJ/mole) 4.9 wt-% CaF2 (Q=462 kJ/mole) 9.0 wt-% CaF2 (Q=301 kJ/mole)
ln(σ
/dt)
1/T K-1
1923 1873 1823 1773 1723 1673Temperature K
Figure 5.3.13-
Figure 5.3.12- The logarithmic reaction rate plotted as function of the reciprocal temperature for Slag A with varying CaF2 content.
The logarithmic reaction rate plotted as function of the reciprocal temperature for Slag B with varying CaF2 content.
Result and Discussion
60
0,00053 0,00054 0,00055
-15
-14
-13
-12
Temperature K
Slag C 2.5% CaF2 (Q=885kJ/mole) 5.0% CaF2 (Q=711kJ/mole) 10.0% CaF2 (Q=371kJ/mole)
ln(σ
/dt)
1/T K-1
1873 1823
0,00052 0,00054 0,00056 0,00058 0,00060
-14,0
-13,8
-13,6
-13,4
-13,2
Temperature K
Slag D 10 % CaF2 (Q=77.7 kJ/mole) 5.2 % CaF2 (Q=85.6 kJ/mole)
ln(σ
/dt)
1/T K-1
1873 1773 1673
Figure 5.3.15-
Figure 5.3.14- The logarithmic reaction rate plotted as function of the reciprocal temperature for Slag C with varying CaF2 content.
The logarithmic reaction rate plotted as function of the reciprocal temperature for Slag D with varying CaF2 content.
In the case of the “binary” systems included in the evaporation study, it would be interesting to see whether the measured activation energies are functions of the thermodynamic activities of SiO2. It would be expected that the fluoride emissions would be less if silica is strongly bonded in the slag so that the activity of SiO2 is low. McLean and coworkers106 had observed that the bubble formation during the melting of mould flux slags was related to the silica activities in the slag. The best fit was obtained by plotting the activation energies as functions of the square of the SiO2 activities, (aSiO2)2, in the three “binary” slag systems CaO-SiO2, MgO-SiO2 and Al2O3-SiO2, presented in Figure 5.3.16. The activities of SiO2 in the case of these systems were taken from the Thermoslag® software at 1873 K. The standard state for the activity values is pure solid silica. As seen, most of the experimental points fall on a straight line, with the exception of two points in the system Al2O3-SiO2 corresponding to low CaF2 contents. These show deviations from the straight line behavior. The reason for this deviation is not clear. However, due to very low weight loss, the rates of evaporation and consequent evaluation of the activation energies would be associated with large uncertainties. Further, uncertainties in the assessment of the activities of silica in the Al2O3-SiO2 system can also partially explain the deviation, but not entirely. The authors believe that Al2O3 could alter the silicate network strongly and possibly, in
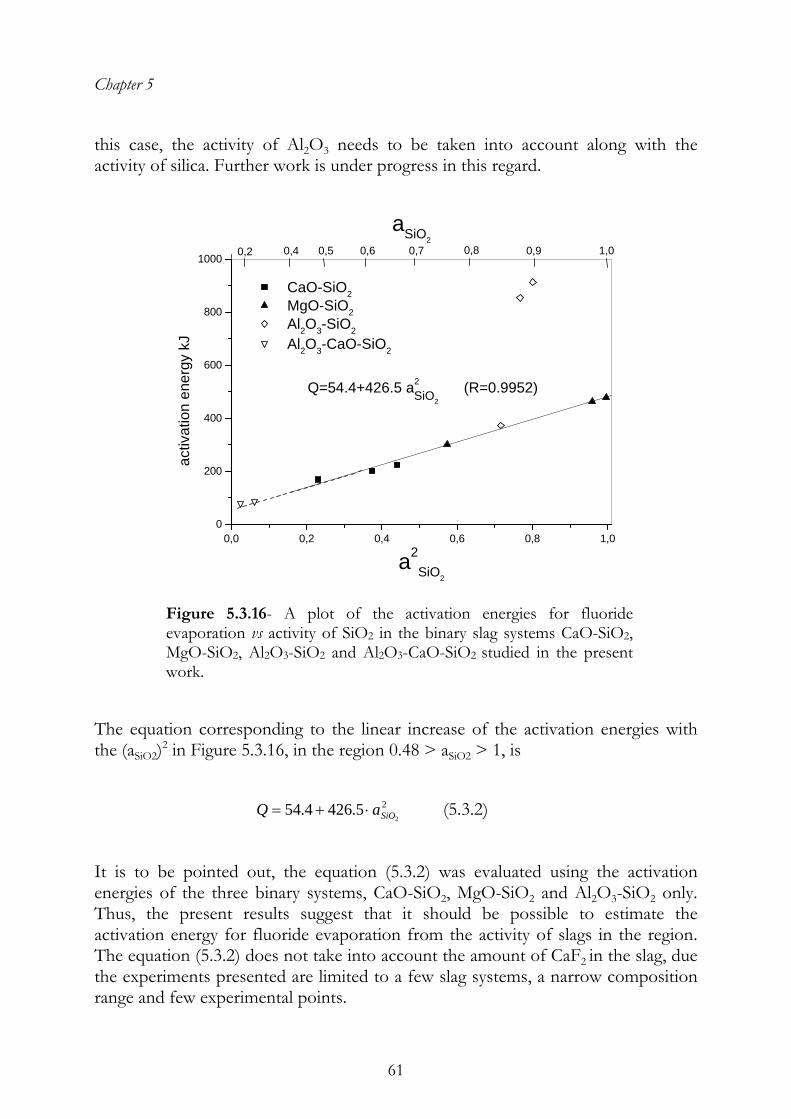
Chapter 5
61
this case, the activity of Al2O3 needs to be taken into account along with the activity of silica. Further work is under progress in this regard.
0,0 0,2 0,4 0,6 0,8 1,00
200
400
600
800
1000
aSiO20,2 0,4 0,5 0,6 1,00,7 0,90,8
SiO2Q=54.4+426.5 a2 (R=0.9952)
CaO-SiO2 MgO-SiO2 Al2O3-SiO2
Al2O3-CaO-SiO2
activ
atio
n en
ergy
kJ
a2SiO2
Figure 5.3.16- A plot of the activation energies for fluoride evaporation vs activity of SiO2 in the binary slag systems CaO-SiO2, MgO-SiO2, Al2O3-SiO2 and Al2O3-CaO-SiO2 studied in the present work.
The equation corresponding to the linear increase of the activation energies with the (aSiO2)2 in Figure 5.3.16, in the region 0.48 > aSiO2 > 1, is
22
5.4264.54 SiOaQ ⋅+= (5.3.2)
It is to be pointed out, the equation (5.3.2) was evaluated using the activation energies of the three binary systems, CaO-SiO2, MgO-SiO2 and Al2O3-SiO2 only. Thus, the present results suggest that it should be possible to estimate the activation energy for fluoride evaporation from the activity of slags in the region. The equation (5.3.2) does not take into account the amount of CaF2 in the slag, due the experiments presented are limited to a few slag systems, a narrow composition range and few experimental points.
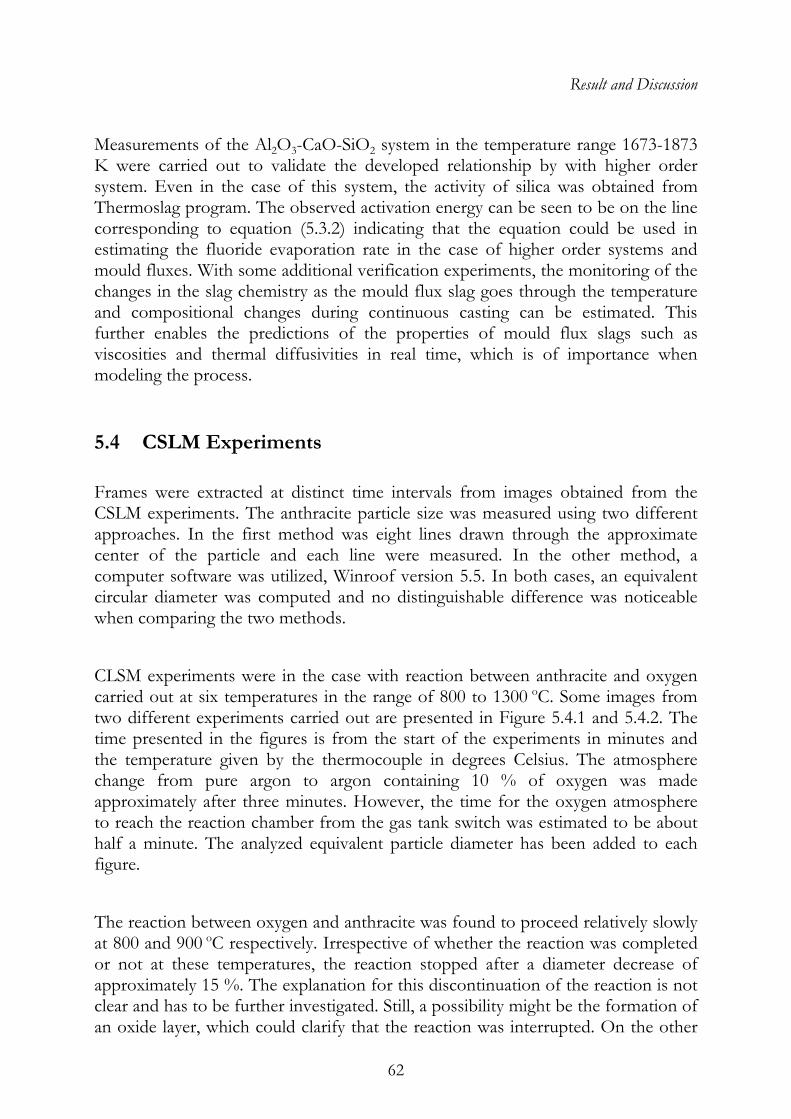
Result and Discussion
62
Measurements of the Al2O3-CaO-SiO2 system in the temperature range 1673-1873 K were carried out to validate the developed relationship by with higher order system. Even in the case of this system, the activity of silica was obtained from Thermoslag program. The observed activation energy can be seen to be on the line corresponding to equation (5.3.2) indicating that the equation could be used in estimating the fluoride evaporation rate in the case of higher order systems and mould fluxes. With some additional verification experiments, the monitoring of the changes in the slag chemistry as the mould flux slag goes through the temperature and compositional changes during continuous casting can be estimated. This further enables the predictions of the properties of mould flux slags such as viscosities and thermal diffusivities in real time, which is of importance when modeling the process.
5.4 CSLM Experiments Frames were extracted at distinct time intervals from images obtained from the CSLM experiments. The anthracite particle size was measured using two different approaches. In the first method was eight lines drawn through the approximate center of the particle and each line were measured. In the other method, a computer software was utilized, Winroof version 5.5. In both cases, an equivalent circular diameter was computed and no distinguishable difference was noticeable when comparing the two methods. CLSM experiments were in the case with reaction between anthracite and oxygen carried out at six temperatures in the range of 800 to 1300 oC. Some images from two different experiments carried out are presented in Figure 5.4.1 and 5.4.2. The time presented in the figures is from the start of the experiments in minutes and the temperature given by the thermocouple in degrees Celsius. The atmosphere change from pure argon to argon containing 10 % of oxygen was made approximately after three minutes. However, the time for the oxygen atmosphere to reach the reaction chamber from the gas tank switch was estimated to be about half a minute. The analyzed equivalent particle diameter has been added to each figure. The reaction between oxygen and anthracite was found to proceed relatively slowly at 800 and 900 oC respectively. Irrespective of whether the reaction was completed or not at these temperatures, the reaction stopped after a diameter decrease of approximately 15 %. The explanation for this discontinuation of the reaction is not clear and has to be further investigated. Still, a possibility might be the formation of an oxide layer, which could clarify that the reaction was interrupted. On the other
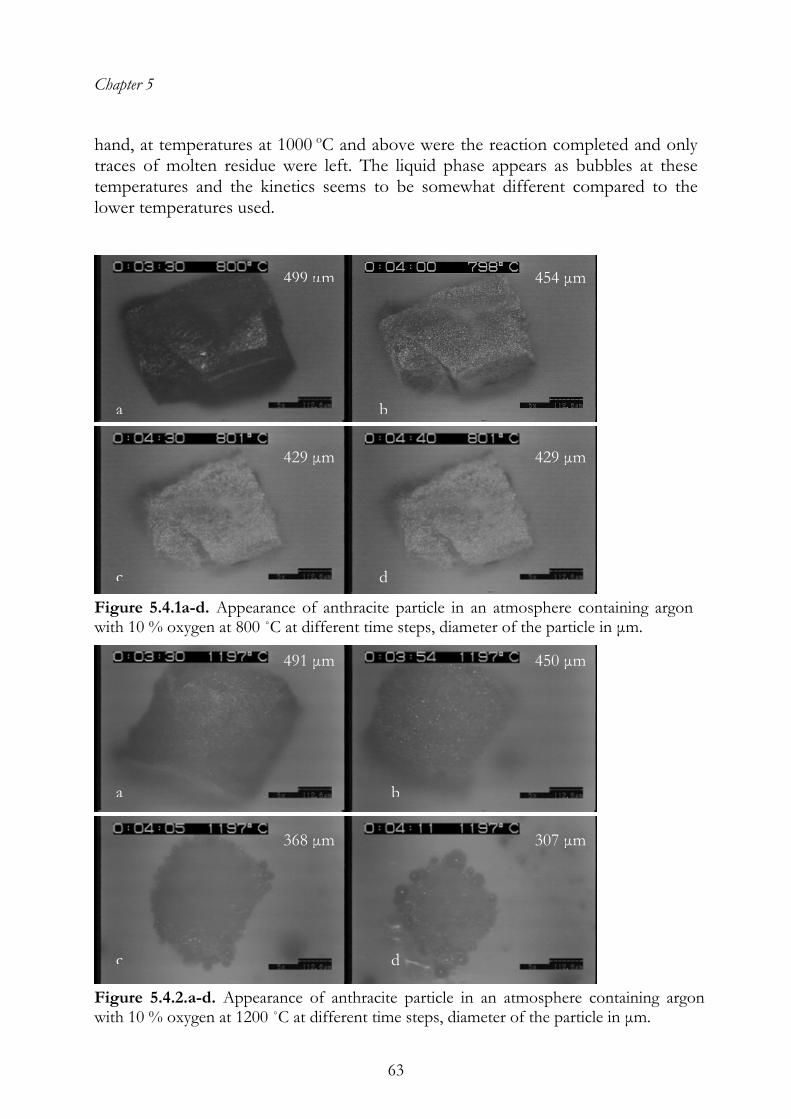
Chapter 5
63
hand, at temperatures at 1000 oC and above were the reaction completed and only traces of molten residue were left. The liquid phase appears as bubbles at these temperatures and the kinetics seems to be somewhat different compared to the lower temperatures used.
a
499 μm
b
454 μm
c
429 μm
d
429 μm
Figure 5.4.1a-d. Appearance of anthracite particle in an atmosphere containing argon with 10 % oxygen at 800 ˚C at different time steps, diameter of the particle in μm.
ba
450 μm 491 μm
dc
307 μm 368 μm
Figure 5.4.2.a-d. Appearance of anthracite particle in an atmosphere containing argon with 10 % oxygen at 1200 ˚C at different time steps, diameter of the particle in μm.
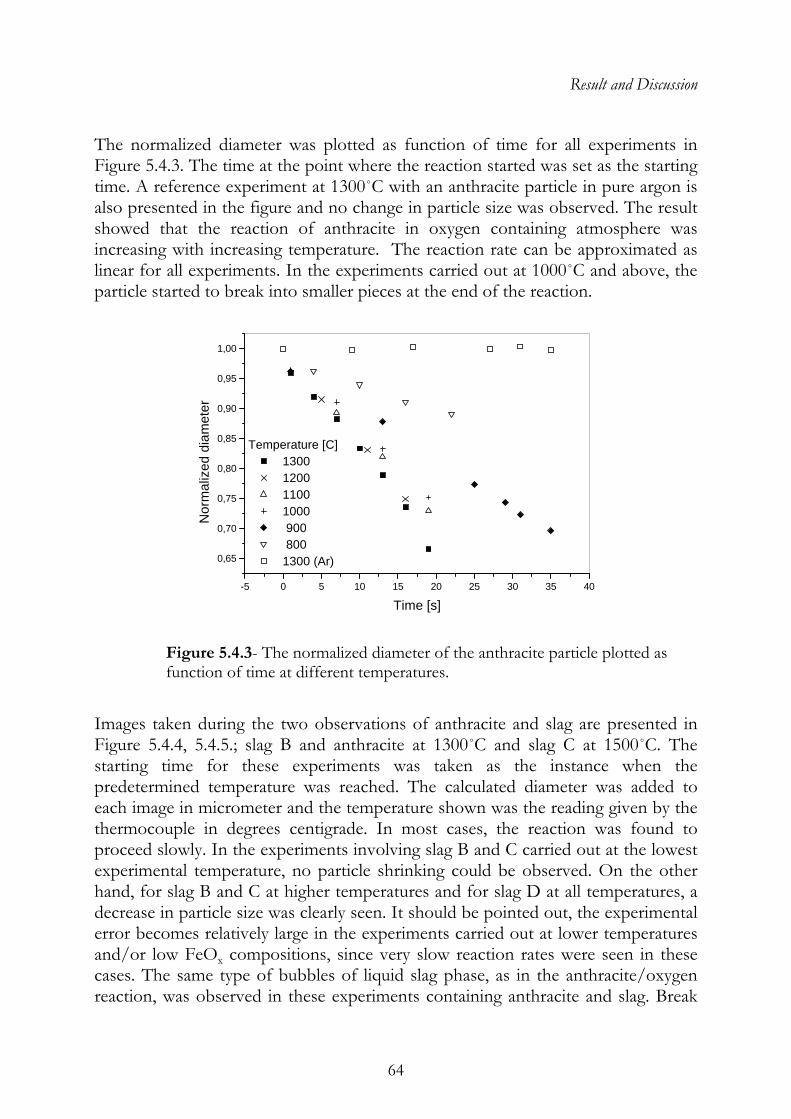
Result and Discussion
64
The normalized diameter was plotted as function of time for all experiments in Figure 5.4.3. The time at the point where the reaction started was set as the starting time. A reference experiment at 1300˚C with an anthracite particle in pure argon is also presented in the figure and no change in particle size was observed. The result showed that the reaction of anthracite in oxygen containing atmosphere was increasing with increasing temperature. The reaction rate can be approximated as linear for all experiments. In the experiments carried out at 1000˚C and above, the particle started to break into smaller pieces at the end of the reaction.
-5 0 5 10 15 20 25 30 35 40
0,65
0,70
0,75
0,80
0,85
0,90
0,95
1,00
Temperature [C] 1300 1200 1100 1000 900 800 1300 (Ar)
Nor
mal
ized
dia
met
er
Time [s]
Figure 5.4.3- The normalized diameter of the anthracite particle plotted as function of time at different temperatures.
Images taken during the two observations of anthracite and slag are presented in Figure 5.4.4, 5.4.5.; slag B and anthracite at 1300˚C and slag C at 1500˚C. The starting time for these experiments was taken as the instance when the predetermined temperature was reached. The calculated diameter was added to each image in micrometer and the temperature shown was the reading given by the thermocouple in degrees centigrade. In most cases, the reaction was found to proceed slowly. In the experiments involving slag B and C carried out at the lowest experimental temperature, no particle shrinking could be observed. On the other hand, for slag B and C at higher temperatures and for slag D at all temperatures, a decrease in particle size was clearly seen. It should be pointed out, the experimental error becomes relatively large in the experiments carried out at lower temperatures and/or low FeOx compositions, since very slow reaction rates were seen in these cases. The same type of bubbles of liquid slag phase, as in the anthracite/oxygen reaction, was observed in these experiments containing anthracite and slag. Break
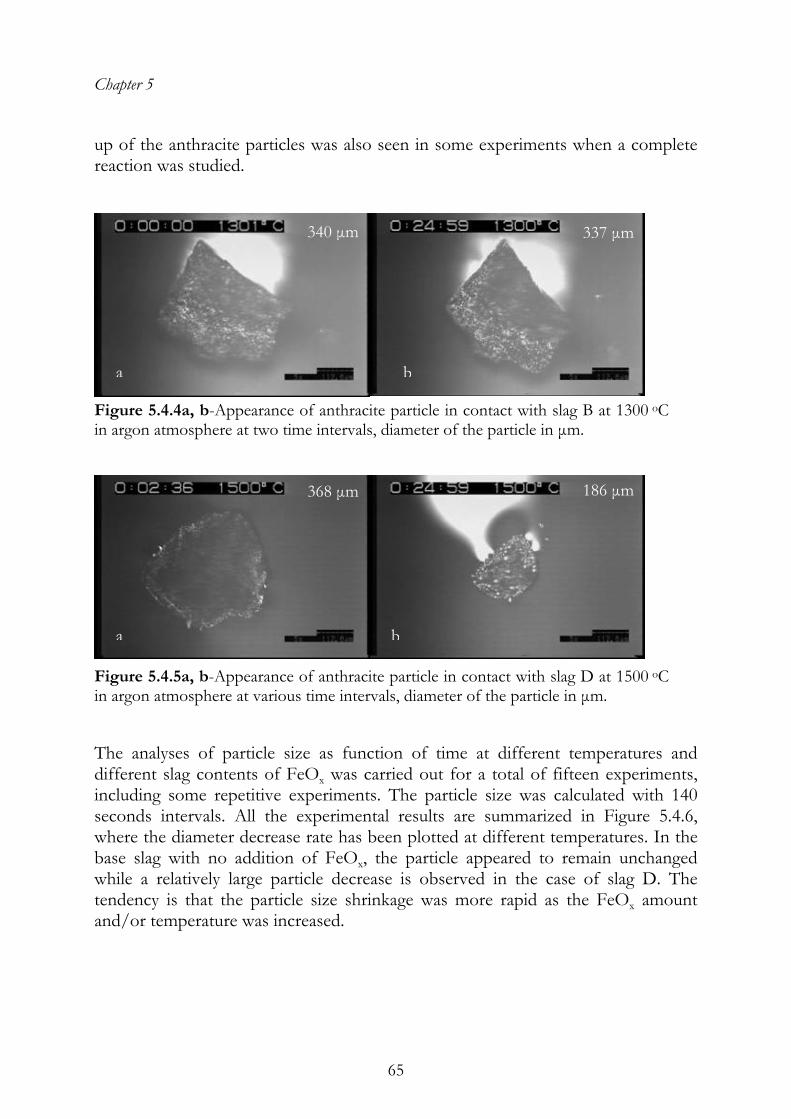
Chapter 5
65
up of the anthracite particles was also seen in some experiments when a complete reaction was studied.
ba
337 μm 340 μm
Figure 5.4.4a, b-Appearance of anthracite particle in contact with slag B at 1300 oC in argon atmosphere at two time intervals, diameter of the particle in μm.
186 μm
b
368 μm
a
Figure 5.4.5a, b-Appearance of anthracite particle in contact with slag D at 1500 oC in argon atmosphere at various time intervals, diameter of the particle in μm.
The analyses of particle size as function of time at different temperatures and different slag contents of FeOx was carried out for a total of fifteen experiments, including some repetitive experiments. The particle size was calculated with 140 seconds intervals. All the experimental results are summarized in Figure 5.4.6, where the diameter decrease rate has been plotted at different temperatures. In the base slag with no addition of FeOx, the particle appeared to remain unchanged while a relatively large particle decrease is observed in the case of slag D. The tendency is that the particle size shrinkage was more rapid as the FeOx amount and/or temperature was increased.
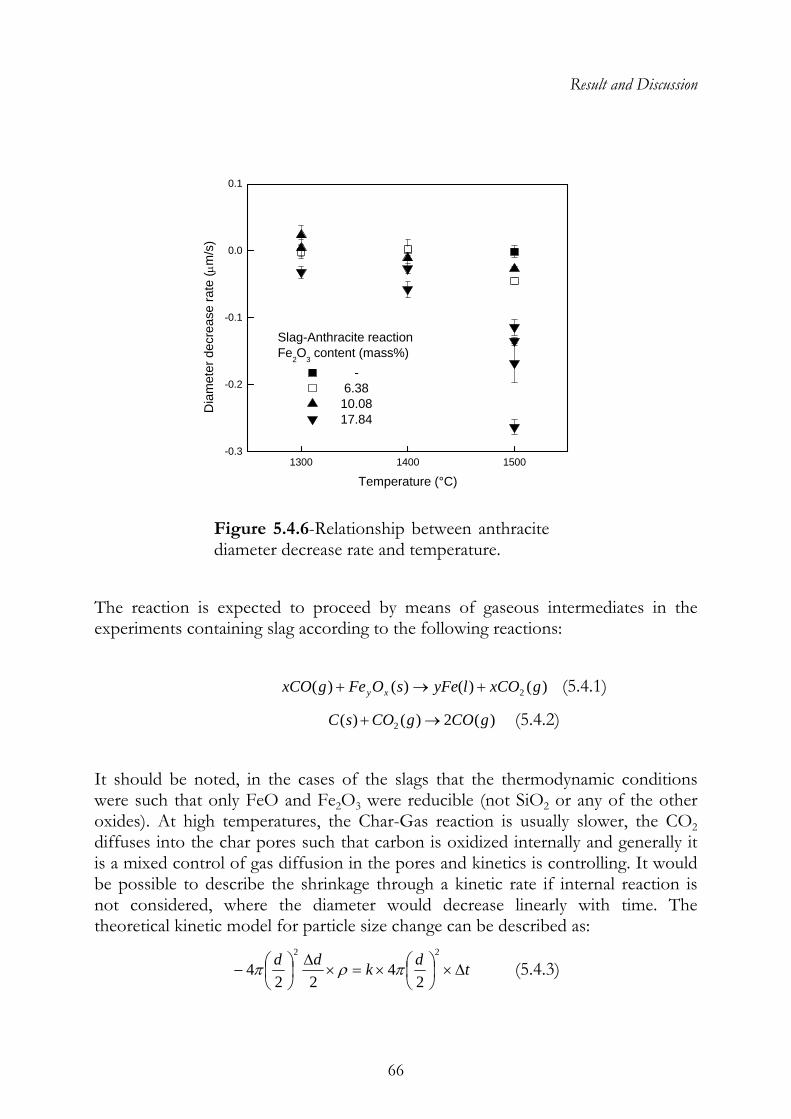
Result and Discussion
66
1300 1400 1500-0.3
-0.2
-0.1
0.0
0.1
Slag-Anthracite reactionFe2O3 content (mass%) - 6.38 10.08 17.84
Dia
met
er d
ecre
ase
rate
(μm
/s)
Temperature (°C)
Figure 5.4.6-Relationship between anthracite diameter decrease rate and temperature.
The reaction is expected to proceed by means of gaseous intermediates in the experiments containing slag according to the following reactions:
)()()()( 2 gxCOlyFesOFegxCO xy +→+ (5.4.1)
)(2)()( 2 gCOgCOsC →+ (5.4.2)
It should be noted, in the cases of the slags that the thermodynamic conditions were such that only FeO and Fe2O3 were reducible (not SiO2 or any of the other oxides). At high temperatures, the Char-Gas reaction is usually slower, the CO2 diffuses into the char pores such that carbon is oxidized internally and generally it is a mixed control of gas diffusion in the pores and kinetics is controlling. It would be possible to describe the shrinkage through a kinetic rate if internal reaction is not considered, where the diameter would decrease linearly with time. The theoretical kinetic model for particle size change can be described as:
tdkddΔ×⎟
⎠⎞
⎜⎝⎛×=×
Δ⎟⎠⎞
⎜⎝⎛−
22
24
224 πρπ (5.4.3)
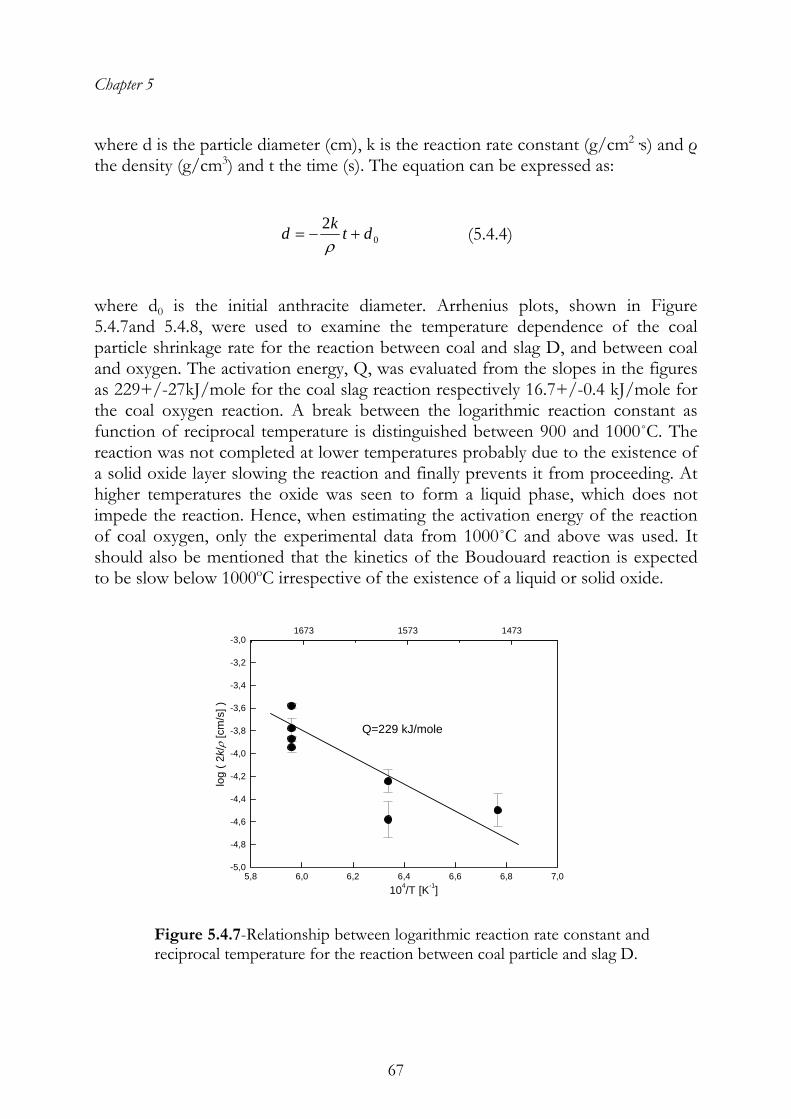
Chapter 5
67
where d is the particle diameter (cm), k is the reaction rate constant (g/cm2·s) and ρ the density (g/cm3) and t the time (s). The equation can be expressed as:
02 dtkd +−=ρ
(5.4.4)
where d0 is the initial anthracite diameter. Arrhenius plots, shown in Figure 5.4.7and 5.4.8, were used to examine the temperature dependence of the coal particle shrinkage rate for the reaction between coal and slag D, and between coal and oxygen. The activation energy, Q, was evaluated from the slopes in the figures as 229+/-27kJ/mole for the coal slag reaction respectively 16.7+/-0.4 kJ/mole for the coal oxygen reaction. A break between the logarithmic reaction constant as function of reciprocal temperature is distinguished between 900 and 1000˚C. The reaction was not completed at lower temperatures probably due to the existence of a solid oxide layer slowing the reaction and finally prevents it from proceeding. At higher temperatures the oxide was seen to form a liquid phase, which does not impede the reaction. Hence, when estimating the activation energy of the reaction of coal oxygen, only the experimental data from 1000˚C and above was used. It should also be mentioned that the kinetics of the Boudouard reaction is expected to be slow below 1000oC irrespective of the existence of a liquid or solid oxide.
5,8 6,0 6,2 6,4 6,6 6,8 7,0-5,0
-4,8
-4,6
-4,4
-4,2
-4,0
-3,8
-3,6
-3,4
-3,2
-3,0
Q=229 kJ/mole
log
( 2k/ρ
[cm
/s] )
104/T [K-1]
1673 1573 1473
Figure 5.4.7-Relationship between logarithmic reaction rate constant and reciprocal temperature for the reaction between coal particle and slag D.
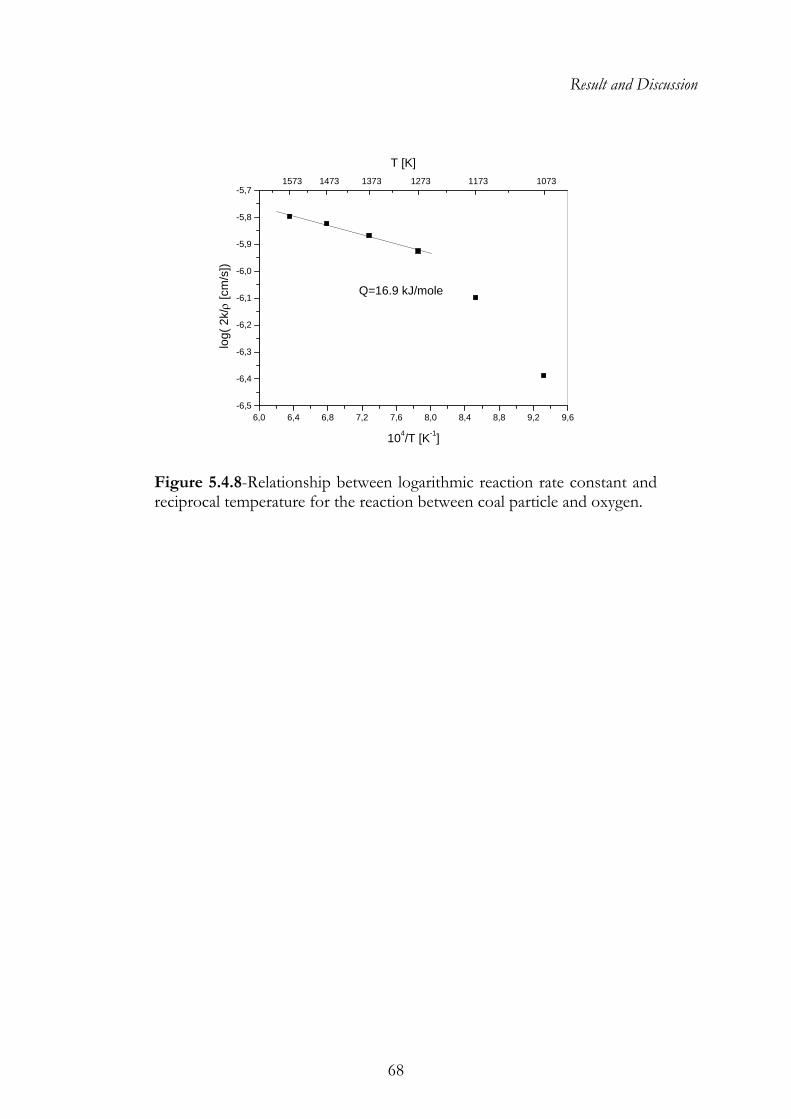
Result and Discussion
68
6,0 6,4 6,8 7,2 7,6 8,0 8,4 8,8 9,2 9,6-6,5
-6,4
-6,3
-6,2
-6,1
-6,0
-5,9
-5,8
-5,7
T [K]
log(
2k/ρ
[cm
/s])
104/T [K-1]
1573 1473 1373 1273 1173 1073
Q=16.9 kJ/mole
Figure 5.4.8-Relationship between logarithmic reaction rate constant and reciprocal temperature for the reaction between coal particle and oxygen.
69
Chapter 6
SUMMARY AND CONCLUSIONS
The present work has been conducted to develop computational tools to apply in process modeling. The thesis consist of several parts; development of a semi-empirical model for the predictions of molar volumes/densities of multicomponent slags; viscosity measurements of mould fluxes and MnO containing slags; evaporation of fluorides from slags. All parts were undertaken with the objective for further development of the Thermoslag® software developed in the Division of Materials Process Science, KTH. The mathematical model for molar volume will be incorporated in the model for viscosities, while the viscosity measurements were carried out with a view to expand the same model towards fluoride containing slags, such as mould flux slags. The model for molar volume predictions utilizes a relationship between thermodynamic properties and densities. The relationship is based on the fact that both these properties are structure-related, depending on the interactions between nearest and next-nearest neighbor ions. For verification of the calculated molar volumes, the results in binary, ternary and higher order systems have been compared with experimental data obtained from literature. In the most systems, the model estimations agree very well with reported molar volumes. Disagreements between model predictions and experimental data are obtained in a few cases. In the case of FeO-containing systems, the impact of Fe2O3 present in the slag has not been considered in the present model which leads to some deviations from experimental data. Large contents of silica, above 50 mass % in ternary and higher systems with slag composition close to the binary CaO-SiO2, is also subjected to a higher uncertainty, due to the difficulties in the evaluation of the binary parameter. Reasons for this disagreement in the binary system can either be uncertainties in experimental data or the uncertainties associated with the model
Summary and Conclusions
70
parameters for enthalpy estimations obtained from experimental information, or even both. Despite these, the model predictions are well within the experimental uncertainties associated with density measurements in most cases. Thus, the model offers a unique possibility to generate molar volume data that are consistent with the thermodynamic properties in the case of multicomponent slag systems. The model can be used to modify slag volumes with the aim to optimize energy and environmental aspects of iron and steel making processes. In the development of a viscosity model with the features of predicting reliable values of fluoride containing slags, experimental work is essential. The rotating cylinder method was employed in order to determine the viscosity of eleven slags, seven industrial mould fluxes and four additional measurements with increased alumina contents. Alumina additions in the range of 2.5 respectively 5.0 wt % resulted in a relatively large increase in the viscosities of mould flux slags. The added alumina content is in the same order as the inclusion pick-up by mould flux slags during the continuous casting of steel. Fluoride losses during the experiments were insignificant according to the chemical analyses. In further development of the viscosity model, another series of experimental work was carried out in order to measure the viscosity of slags with high content of manganese oxide, using the same technique. The experiments show a clear relationship between manganese oxide content and viscosity. As the MnO content in the slag was increased, a noticeable decrease in the viscosity was observed. The results have also been interpreted to the structure of the silicates. The experimental results of the viscosity measurements, both the mould fluxes and the MnO slags, were used to calculate the Arrhenius activation energy for viscous flow and the second derivative of the activation energies for viscous flow. The former was found to increase with decreasing temperature, consistent with earlier work, carried out in the Division of Materials Process Science. The latter, when plotted as function of temperature, showed break points corresponding to the possible liquidus temperature of the slag. Fluoride emissions from industrial slags and mould fluxes are a potential health hazard. Thermogravimetric analyses were carried out to estimate the fluoride evaporation rate as function of slag composition and temperature. A systematic work was initiated to study the fluoride loss from binary slag systems aiming to
Chapter 6
71
correlate the fluoride evaporation in these slags with the thermodynamic properties of the slags. The main reaction involved in evaporation of fluorides from slags is known to occur between calcium fluoride and silica forming tetrafluorosilane in gaseous phase and calcium oxide. Hence, the fluoride evaporation rate should logically be linked to the activity of silica in the slag. The binary slag systems of Al2O3-SiO2, CaO-SiO2 and MgO-SiO2 with additions of CaF2 were included in the study. The Arrhenius activation energies were estimated for the evaporation reaction and were found to vary with slag composition. A correlation between the activation energy and the square of the activity of silica in the melt was obtained. The established dependence of activation energies and silica activity was also compared for measurements in the ternary system of Al2O3-CaO-SiO2 with CaF2 additions, which was in very good agreement with the relationship developed. Thus, the results indicate a possibility to estimate the fluoride emissions from industrial slags and mould fluxes, which enables an extension of Thermoslag software to predict the fluoride evaporation rate of complex slags. The reaction of carbon particles, anthracite, in contact with hematite slags and in an atmosphere containing oxygen were observed with Confocal Scanning Laser Microscopy experiments. The size change of the anthracite particles was investigated as function of varying iron-oxide content in the slag and temperature. The slag and the change in slag composition were important aspects to consider in the optimization of operation of slagging gasifiers. The effect of FeOx content in the slag on the carbon-particle evolution is important since hematite is expected to be a major constituent in gasifier slags. The general trends were that the rate of decrease of the particle size was increased with FeOx content in the slag and/or increases in temperature. This part of the work has been carried out in order to have a broader understanding of the slag behaviors in a gasification reactor.

Summary and Conclusions
72
73
Chapter 7
FUTURE WORK
A continuing development of Thermoslag® is important for modeling of slags in high temperature processes. An important step would be the implementation of fluoride spices into the slag model. This is crucial for the achievement of reliable modeling of mould flux behavior in the casting process. It is essential that the knowledge regarding the fluoride slags is systematically incorporated in the Thermoslag. This needs both thermodynamic and thermophysical information regarding these slags obtained experimentally. It is admitted that such experimentations are extremely difficult to carry out. Further, incorporation of the fluoride species needs a restructuring of the model as the data for lower order systems containing fluoride species are not available. Another important development would be to study, with the help of the thermoslag software, the possibilities of replacing a part of the fluoride content of the slag with other components, without lowering its performance. This is especially interesting from an environmental view point. Fluoride is the main environmental concern related to continuous casting of steel. In this respect, the software should have computational routines to come up with optimal compositions for defined properties. This is being considered as the next step in the development of the software. Furthermore, some uncertainties are experienced in the present viscosity model, in the case of slags with high contents of alumina. The reason for this is attributed to the lack of experimental data in this composition region and thus, the model parameter optimization is out of range. In order to solve this problem, further experimentation in the relevant compositions regions are essential. Such experiments are currently planned in the division.

Future Work
74
75
REFERENCES
1. J. Björkvall, S. Du. Sichen, and S. Seetharaman. High Temp. Mater. and Proc., 1999, vol. 18, p. 253.
2. J. Björkvall, Ph.D. thesis, Royal Institute of Technology, Stockholm, 2000. p. 56. 3. M. Temkin. Acta Phys. Chim. URSS, 1945, 4, p. 411-420. 4. J. Lumsden, Physical Chemistry of Melts in Metallurgy, Part 1, New York,
Interscience, 1961, p. 165-205. 5. K. C. Mills and B. J. Keene. International Materials Reviews, 1987, vol. 32, p. 1-120. 6. Y. Bottinga and D. F. Weill. Am. J. Sci, 1972, 272, p. 438-475. 7. A. E. Grau and C. R. Manson. Can. Metall. Q. 1976, 5, p. 367-. 8. Y. Bottinga, D. E. Weill and P. Richet. Geochim. Cosmochim. Acta, 1982, 46, p.
909-. 9. K. C. Mills. Mineral Matter and Ash in Coal, 1986, p. 195-214. 10. B. Vidacak, Du. Sichen and S. Seetharaman. Met. Transactions B, 2001, 32, p. 679-
684. 11. Wei Liu, Du. Sichen and S. Seetharaman. Met. Transactions B, 2001, 32, p. 105-110. 12. J. G. Taylor. Proc. R. Soc. London Ser., 1955, 232, p. 567-577. 13. K. C. Mills and A. B. Fox. High Temperature Materials and Processes, 2003, 22, p.
291-301. 14. K. C. Mills and A. B. Fox. ISIJ Inter., 2003, 43, p. 1479-1486. 15. T. Mukongo, P. C. Pistorius and A. M. Garbers-Craig. Ironmaking and Steelmaking,
2004, 31, p. 135-143. 16. A. B. Fox. K. C. Mills, D. Lever, C. Bezerra, C. Valadares, I. Unamuno, J. J.
Laraudogoitia and J. Gisby. 17. M. D. Lanyi and C. J. Rosa, Metall. Trans., 1981, 12, p. 287-298.. 18. K. C. Mills and B. J Keene. International Metal Reviews, 1981, 1, p. 21-67. 19. W. L. McCauley and D. Apelian, Canad. Metall. Q, 1981, 20, 247-261. 20. K. C. Mills, A. Olusanya, R. Brooks, R. Morell and S. Bagha, Ironmaking and
Steelmaking, 1988, 15, p. 257-264. 21. H. Y. Chang, T. F. Lee and Y. C. Ko. ISS Trans, 1984, 4, p. 27-32. 22. H. Y. Chang, J. F. Lee and T. Ejima. Trans ISI Japan, 1987, 27, p. 797-804. 23. F. Shahbazian. Du. Sichan. K. C. Mills and S. Seetharaman. Ironmaking and
Steelmaking, 1999, 26, p. 193-199. 24. F. Shahbazian. Du. Sichan and S. Seetharaman. ISIJ Inter., 1999, 39, p. 787-796. 25. F. Shahbazian. Ph.D. thesis, Royal Institute of Technology, Stockholm, 2001.
References
76
26. Production of Manganese Ferroalloys, Sintef and Tapir Academic Press, Trondheim,
2007. 27. Y. Tanabe, Oku and Hondo. Electrocheo. 1960, 28, p. 617, 681. 28. B.Benesh, R. Kuthnicki and M.Jaworski, Arch. Hutnik. 1984, 29, p. 277-283. 29. T. A. Chubinidze, Toriya I praktika poluch i primeneniya kompleks ferrosplavov,
1974, p. 31-35. 30. L. B. Wyckoff, Union Carbide Reports, 1949 and 1953. 31. N. I. Rakitina, N. A. Turkina, A. A. Morozov, V. Ya. Dashevskii and I. A. Karyazin,
Izvestiya Akademii Nauk SSSR. Metally, 1984, No.1, p 28-32. 32. D. Brooker, Chemistry of deposit formation in a coal gasification syngas cooler,
Fuel, 1993, 72, p. 665-. 33. J. Rawers, J. Kwong and J. Bennet: Characterizing coal-gasification slag-refractory
interactions, Materials at High temperatures, 1999, 16, p. 219-. 34. M. S. Oh, D. D. Brooker, E. F. de Paz, J. J. Brady and T. R. Decker: Effect of
crystalline phase formation on coal slag viscosity, Fuel Processing Technology, 1995, 44, p. 191-.
35. S. Srinivasachar and A. Boni: A kinetic model for pyrite transformations in a combustion environment, Fuel, 1989, 68, p. 829-.
36. H. M. ten Brink, S. Eenkhoorn and G. Hamburg: A mechanistic study of the formation of slags from iron-rich coals, Fuel, 1996, 75, p. 952-.
37. S. L. Teasdale and P. C. Hayes: Kinetics of reduction of FeO from slag by graphite and coal chars, ISIJ International, 2005, 45, p. 645-.
38. S. Seetharaman and L.-I. Staffansson, ChemicaScripta, Chem. Scripta, 1977, 10, p. 61-66.
39. S. Seetharaman and J. Zhang, unpublished work, 1997 40. P. Fredriksson, and S. Seetharaman. Steel Research Inter., 2004, 4, p. 240-246. 41. P. Fredriksson, and S. Seetharaman. Steel Research Inter., 2004, 6, p. 357-265. 42. K. Mori and K. Suzuki. Trans. ISIJ, 1968, 8, p. 382. 43. B. S. Mitin, and Yu. A. Nagibin. Russ. J .Chem, (English Translation.), 44, no 5,
1970. p. 741-742. 44. J. F. Bacon, A. A. Hasapis, and J. W. Wolley, Jr. Phys. Chem. Glasses, 1960, 1, p.90-
98. 45. S. Hara, K. Irie, D. R. Gaskell and K. Ogino. Trans JIM, 1988, 29, p. 977-989. 46. K. C. Mills and A. A. Shirali, SRM for High Temperature Viscosities, NPL, Queens
Road, Teddington, Middlesex, TW11, OLW, UK. 47. I. A. Askay and J. A. J. Pask. J. Am. Ceram. Soc., 1979, 62, p. 332. 48. L. Segers, A. Fontana and R. Winard. Eletrochem. Acta, 1979, 23, p. 1275. (Slag
Atlas, 2nd Edition, Verlag Stahleisen GmbH, D-Düsseldorf, 1995, fig. 8.46) 49. M. G. Frohberg and H. H. Brandi. Eisenhüttenw, 1963, 34, p. 591. (Slag Atlas, 2nd
Edition, Verlag Stahleisen GmbH, D-Düsseldorf, 1995, fig. 8.41-8.43) 50. K. Ogino, M. Hirano and A. Adachi. Technol. Report. Osaka Univ, 1974, 24, p.
49. (Slag Atlas, 2nd Edition, Verlag Stahleisen GmbH, D-Düsseldorf, 1995, fig. 8.41-8.43)
51. Y. Shiraishi, K. Ikeda, A Tamura and T. Saito. Trans. JIM, 1978, 19, p. 264. (Slag Atlas, 2nd Edition, Verlag Stahleisen GmbH, D-Düsseldorf, 1995, fig. 8.41-8.43)
References
77
52. V. I. Solokov, S. I. Popel and A. O. Esin. Iz. Vuz. Chern. Metall, 1970, 13, p. 10. (Slag Atlas, 2nd Edition, Verlag Stahleisen GmbH, D-Düsseldorf, 1995, fig. 8.41-8.43)
53. A. Adachi, K. Ogino and S. Kawasaki. Technol. Report. Osaka Univ, 1963, 13, p. 411. (Slag Atlas, 2nd Edition, Verlag Stahleisen GmbH, D-Düsseldorf, 1995, fig. 8.36.a.b, 8.41-8.43)
54. A. Adachi and K. Ogino. Technol. Report. Osaka Univ, 1962, 12, p. 147. (Slag Atlas, 2nd Edition, Verlag Stahleisen GmbH, D-Düsseldorf, 1995, fig. 8.41-8.43)
55. J. W. Tomlinson, M. S. R. Heynes and J. O’M. Bockris. Trans. Faraday Soc., 1958, 54, p. 1822. (Slag Atlas, 2nd Edition, Verlag Stahleisen GmbH, D-Düsseldorf, 1995, fig. 8.40, 8.44, 8.45)
56. V. P. Elyutin, B. S. Mitin, and Yu. S. Anisimov. Iz. Vuz. Tsvet. Metall. 1974, 4, p. 42. (Slag Atlas, 2nd Edition, Verlag Stahleisen GmbH, D-Düsseldorf, 1995, fig. 8.13, 8.14, 8.17)
57. Slag Atlas, 2nd Edition, Verlag Stahleisen GmbH, D-Düsseldorf, 1995, fig. 3.19. 58. S. Sumita, K. Morinaga and T. Yanagase. Trans. Jap. Inst. Metals, 1983, 47, p.
127. (Slag Atlas, 2nd Edition, Verlag Stahleisen GmbH, D-Düsseldorf, 1995, fig. 8.36.a.b)
59. P. P. Evseev and A. F. Filippov. Iz. Vuz. Chern. Metall, 1967, 3, p.55. (Slag Atlas, 2nd Edition, Verlag Stahleisen GmbH, D-Düsseldorf, 1995, fig. 8.13, 8.14)
60. V. V. Dymov and V. V. Baidov. Sb. Tr. Tsent. Nauch-Issled Inst. Chern. Met., 1968, 61, 78. (Slag Atlas, 2nd Edition, Verlag Stahleisen GmbH, D-Düsseldorf, 1995, fig. 8.13, 8.14)
61. G. I. Zhmoidin, L. N. Solokov, G. V. Podgornov and G. S. Smirnov. Teor. Met. Prots., 1975, 3, p. 450. (Slag Atlas, 2nd Edition, Verlag Stahleisen GmbH, D-Düsseldorf, 1995, fig. 8.13, 8.14)
62. T. El Gammal and R. D. Müllenberg. Arch. Eisenhüttenw., 1980, 51, p. 221. (Slag Atlas, 2nd Edition, Verlag Stahleisen GmbH, D-Düsseldorf, 1995, fig. 8.13, 8.14)
63. M. Zielinski and B. Sikora. Pr. Inst. Metall. Zelaza im St. Staszica, 1977, 29, p. 157. (Slag Atlas, 2nd Edition, Verlag Stahleisen GmbH, D-Düsseldorf, 1995, fig. 8.13, 8.14, 8.63, 8.64)
64. Y. E. Lee and D. R. Gaskell. Metall. Trans, 1974, 5, p. 853-. 65. K. Ono, K. Gunji, and T. Arki. Nippon Kinzoku Gakhaishi, 1969, 33, p. 299. (Slag
Atlas, 2nd Edition, Verlag Stahleisen GmbH, D-Düsseldorf, 1995, fig. 8.40) 66. A. I. Karakash and P. V. Ternovoi. Iz. Vuz. Chern. Metall., 1977, 10, p. 21. (Slag
Atlas, 2nd Edition, Verlag Stahleisen GmbH, D-Düsseldorf, 1995, fig. 8.13, 8.38) 67. A. M. Yakushev, V. M. Romashin and N. V. Ivanova. Steel in the USSR, 1985, 15, p.
425. (Slag Atlas, 2nd Edition, Verlag Stahleisen GmbH, D-Düsseldorf, 1995, fig. 8.13, 8.38)
68. S. I. Popel. Sb. Nauchn. Tr. Ural’sk. Politekhn. Inst., 1963, 126, p. 5. (Slag Atlas, 2nd Edition, Verlag Stahleisen GmbH, D-Düsseldorf, 1995, fig. 8.13, 8.38, )
69. A. I. Bochorishvili and S. B. Yakobashvili. Svar, Proiz, 10, 1968, p. 13. (Slag Atlas, 2nd Edition, Verlag Stahleisen GmbH, D-Düsseldorf, 1995, fig. 8.63, 8.64, 8.66,)
70. H. Winterhager, L. Greiner and R. Kammel. Forschungsberichten des Landes Nordrheim-Westfalen. Pub. Westdeutscher Verlag, 1966. (Slag Atlas, 2nd Edition, Verlag Stahleisen GmbH, D-Düsseldorf, 1995, fig. 8.66, 8.113)
References
78
71. L. R. Barrett and A. G. Thomas. J. Glass Technol., 1959, 43, p. 179. (Slag Atlas, 2nd Edition, Verlag Stahleisen GmbH, D-Düsseldorf, 1995, fig. 8.66)
72. E. V. Krinochkin, K. T. Kurochin and P. V. Umrikhin. Fiz. Khim Poverkh. Yavlenii Rasp, Ed. V. N. Eremenko. Pub. Naukova Dumka. Kiev, 1979, p. 179-183. (Slag Atlas, 2nd Edition, Verlag Stahleisen GmbH, D-Düsseldorf, 1995, fig. 8.66)
73. A. M. Yakushev, V. M. Romashin and N. V. Ivanova. Steel in the USSR, 1985, 15, p. 425. (Slag Atlas, 2nd Edition, Verlag Stahleisen GmbH, D-Düsseldorf, 1995, fig. 8.66)
74. E. V. Ermolaeva. Ogneupory, 1955, 20, p. 221. (Slag Atlas, 2nd Edition, Verlag Stahleisen GmbH, D-Düsseldorf, 1995, fig. 8.66, 8.74, 8.95)
75. T. Takayanagi, M. Kato and S. Minowa. Imono. J. Jap. Foundry Soc., 1976, 48, p. 779. (Slag Atlas, 2nd Edition, Verlag Stahleisen GmbH, D-Düsseldorf, 1995, fig. 8.66)
76. L. N. Solokov, V. V. Baidov, L. L Kunin and V. V. Dymov. Teor. Metall. Prots, 1971, p. 53. (Slag Atlas, 2nd Edition, Verlag Stahleisen GmbH, D-Düsseldorf, 1995, fig. 8.66)
77. A. I. Sergienko. Avt. Svarka, 1965, 6, p. 26. (Slag Atlas, 2nd Edition, Verlag Stahleisen GmbH, D-Düsseldorf, 1995, fig. 8.66)
78. Y. E. Lee and D. R. Gaskell. Metall. Trans ISIJ, 1971, 11, p. 564. (Slag Atlas, 2nd Edition, Verlag Stahleisen GmbH, D-Düsseldorf, 1995, fig. 8.86, 8.87)
79. U. Din-Fen, A. F. Vishkarev and V. I. Iz. VUZ. Chern. Metall, 1962, 5, p. 66. Slag Atlas, 2nd Edition, Verlag Stahleisen GmbH, D-Düsseldorf, 1995, fig. 8.86, 8.87)
80. A. S. Abrodimov, E. G. Gavrin and V. I. Eremenchenkov. Iz. VUZ. Chenr. Metall, 1975, 8, p. 14. (Slag Atlas, 2nd Edition, Verlag Stahleisen GmbH, D-Düsseldorf, 1995, fig. 8.86, 8.87)
81. S. I. Popel and O. A. Esin. Appl. Chem. USSR, 1956, 29, p. 707. (Slag Atlas, 2nd Edition, Verlag Stahleisen GmbH, D-Düsseldorf, 1995, fig. 8.86, 8.87, 8.103)
82. D. R. Gaskell, A. McLean and R. G. Ward. Faraday Soc, 1969, 65, p. 1498. (Slag Atlas, 2nd Edition, Verlag Stahleisen GmbH, D-Düsseldorf, 1995, fig. 8.86, 8.87, 8.103)
83. X. Mo, I. S. E. Carmichael, M Rivers and J. Stebbins. Mineral Mag. 1982, 45, p. 237. (Slag Atlas, 2nd Edition, Verlag Stahleisen GmbH, D-Düsseldorf, 1995, fig. 8.86, 8.87)
84. S. I. Popel, V. I. Solokov and V. G. L. Korpachev. Sb. Nauchn. Tr. Ural’sk. Politekhn. Inst., 1963, 126, p. 24. (Slag Atlas, 2nd Edition, Verlag Stahleisen GmbH, D-Düsseldorf, 1995, fig. 8.86, 8.87)
85. D. R. Gaskell. Avd. Phys. Geochem, 1982, 2, p. 153. (Slag Atlas, 2nd Edition, Verlag Stahleisen GmbH, D-Düsseldorf, 1995, fig. 8.86, 8.87)
86. S. I. Popel, A. A. Deryabin and O. A. Esin. Iz. VUZ. Chern. Metall, 1965, 12. p. 5. Slag Atlas, 2nd Edition, Verlag Stahleisen GmbH, D-Düsseldorf, 1995, fig. 8.95)
87. A. Staronka and M. Piekarska. Arch. Hutnict. 1978, 23, p. 119. (Slag Atlas, 2nd Edition, Verlag Stahleisen GmbH, D-Düsseldorf, 1995, fig. 8.95, 8.96, 8.110)
88. T. M. Kekelidze, Sh. M. Mikiashvivli, T. I. Dzhincharadze and R. V. Khomeriki. Izv. AN. GRUZ. SSR, 1978, 4, p. 240. (Slag Atlas, 2nd Edition, Verlag Stahleisen GmbH, D-Düsseldorf, 1995, fig. 8.97)
References
79
89. B. A. Bryantsev. Zh. Prikl. Khim, 1968, 41, p. 2156. (Slag Atlas, 2nd Edition, Verlag Stahleisen GmbH, D-Düsseldorf, 1995, fig. 8.101, 8.116, 8.118)
90. S. E. Vaisburd, N. A. Yakovleva. Pov Yavleni Rasp. Prots. Poroshkovoi Met. A. N. Ukr. SSR. Inst. Metallokeram. Spets. Splav, 1963, p. 377—382. (Slag Atlas, 2nd Edition, Verlag Stahleisen GmbH, D-Düsseldorf, 1995, fig. 8.102)
91. L. Bodnar, S. Cempa, K. Tomasek and L Bobook. Advances on Extractive Metallurgy. Pub. The Institution of Mining and Metallurgy. London, 1977, p. 35-38. (Slag Atlas, 2nd Edition, Verlag Stahleisen GmbH, D-Düsseldorf, 1995, fig. 8.74)
92. O. N. Fadeev, I. F. Khudyakov, I. D. Kashcheev and G. P. Kharitidi. Iz. VUZ. Tsvet. Metall, 1980, 4, p. 17. (Slag Atlas, 2nd Edition, Verlag Stahleisen GmbH, D-Düsseldorf, 1995, fig. 8.74)
93. K. Tomasek, L. Bodnar and J. Holeczy. Hutn. Listy, 1975, 30, p. 136. (Slag Atlas, 2nd Edition, Verlag Stahleisen GmbH, D-Düsseldorf, 1995, fig. 8.74)
94. T. Nakamura, F. Noguchi, Y. Ueda and S. Nakajyo. J. Min. Metall. Inst. Japan, 1988, 104, p. 463. (Slag Atlas, 2nd Edition, Verlag Stahleisen GmbH, D-Düsseldorf, 1995, fig. 8.74)
95. V. K. Komelkov, G. B. Shirer, A. G. Shalimov and S. G. Voinov. Tero. Met. Prots, 1972, 1, p. 50. (Slag Atlas, 2nd Edition, Verlag Stahleisen GmbH, D-Düsseldorf, 1995, fig. 8.111)
96. T. I. Dzhincharadze, Sh. M. Mikiashvili, R. V. Khomeriki. Pererabotna Zhelez. Margants. Rud. Zak. Pub. Metsniereba. Tbilisi, 1979, p. 141-148. (Slag Atlas, 2nd Edition, Verlag Stahleisen GmbH, D-Düsseldorf, 1995, fig. 8.110)
97. B. O. Mysen, D. Virgo and C. M. Scarfe. Am. Mineralogist, 1980, 65, p. 690. 98. Report No. TO24-163, Swedish Steel Producers Association (Jernkontoret), 2005 99. A. Yamauchi, T. Emi and S. Seetharaman. ISIJ Inter., 2002, 42, p. 1083-1093. 100. S. Seetharaman, S. Sridhar, Du. Sichen and K. C. Mills. Metallurgical and Materials
Transactions B, 2000, 31, p. 111-119. 101. E. F. Osborn and A. Muan. Ceramic Foundation. 1960 Publ. by Orton jr,
Columbus/Ohio. 102. S. O. Baisanov, T. D. Takenov, T. G. Gabdullin and E. A. Buketov. Fizikokhim.
Metal. Margantsa, Ed. Nauka, Moscow 1983, p. 58, 62. 103. Slag Atlas, 2nd Edition, Verlag Stahleisen GmbH, D-Düsseldorf, 1995, fig. 3.70 and
3.3430. 104. I. A. I. Zaitsev, M, A. Zemchenko, A. D. Litvina and B. M. Mogutnov, J. Mater. Chem,
1993, 3, p. 541-546. 105. N. N. Viswanathan, F. Shahbazian. Du. Sichan and S. Seetharaman, Steel Research,
1999, 70, p. 53-58. 106. A. McLean, University of Toronto, Ontario, Canada, Private communication, 2007

References
80