Embed Size (px)
Citation preview
© 2008 Verizon. All Rights Reserved. PTEXXXXX XX/08
GLOBAL CAPABILITY.PERSONAL ACCOUNTABILITY.
Wade BakerMiniMetricon 2.5April 07, 2008
Investigative Response Case Metrics InitiativePreliminary findings from 700+ data compromise investigations
2
Agenda
Investigative Response @ Verizon Business
IR Case Metrics Initiative
IR Statistics & Trends

3
Who am I?

4
About Me – Hats I Wear

5
About Me – Hat I’d Never be Caught Wearing

6
About Me – Hat I’d Never be Caught Wearing
r = +.998

7
About Me – Hat I’m trying to Wear

8
About Me – Hats I Wear

9
About Me – Hats I Wear

10
About Me – Hats I Wear
Research

11
About Me – Hats I Wear
Intel

12
About Me – Hats I Wear
Innovate

13
About Me – Hats I Wear
Risk

14
About Me – Hats I Wear
Metrics

15
About Me – Hats I Wear
DSS

16
About Me – Hats I Wear
IR
17
About Me – Hats I Wear
“Then why are you here talking to us about investigative response trends?”
18
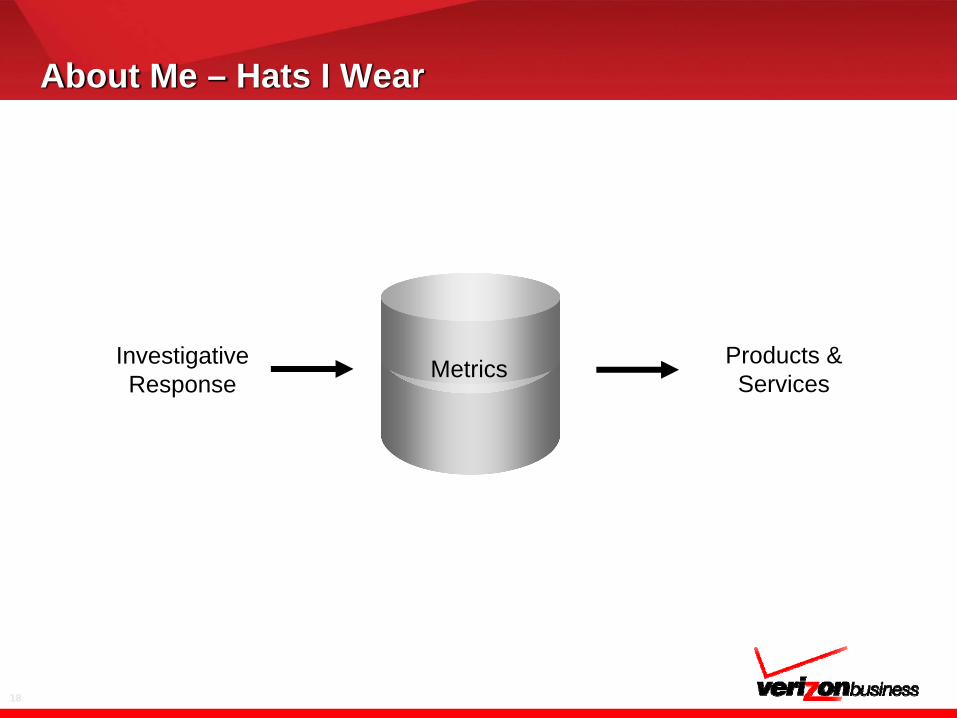
About Me – Hats I Wear
Investigative Response Metrics Products &
Services

19
About Me – Hats I Wear
Metrics

20
About Me – Hats I Wear
IR
21
Investigative Response @ Verizon Business
22
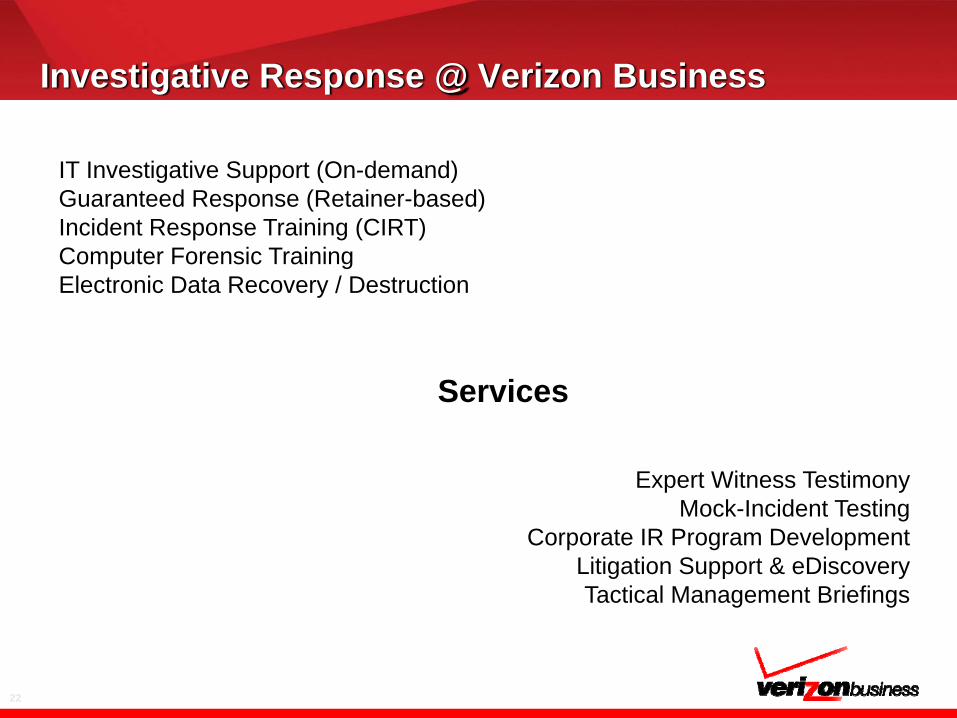
Investigative Response @ Verizon Business
IT Investigative Support (On-demand)Guaranteed Response (Retainer-based)Incident Response Training (CIRT)Computer Forensic TrainingElectronic Data Recovery / Destruction
Expert Witness TestimonyMock-Incident Testing
Corporate IR Program DevelopmentLitigation Support & eDiscoveryTactical Management Briefings
Services
23
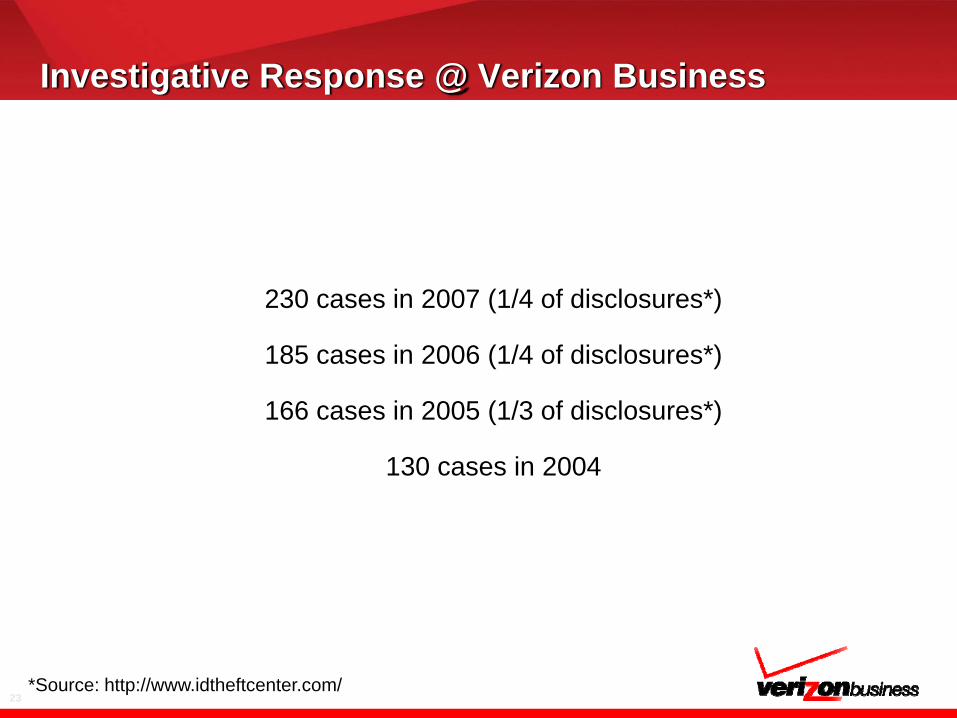
Investigative Response @ Verizon Business
230 cases in 2007 (1/4 of disclosures*)
185 cases in 2006 (1/4 of disclosures*)
166 cases in 2005 (1/3 of disclosures*)
130 cases in 2004
*Source: http://www.idtheftcenter.com/
24
Investigative Response @ Verizon Business
3 of the 5 largest data breaches
25
Overview: IR Metrics Initiative
26
Overview: IR Metrics Initiative
2004 – Q3 2007: Some high-level statistics & trends; some diffusion of insight and data
Q4 2007 – Present: Hundreds of case metrics defined & operationalized; systematic collection for all previous cases
Near Future: Diffusion of data internally and externally; Reoccurring public report of findings
27
Overview: IR Metrics Initiative
What’s the current status of this effort?
What’s the dataset for this talk?
28
Overview: IR Metrics Initiative
Sampling of cases from 2004-Present
High-level caseload statistics and trends from each investigator
Data collection on case backlog: Mostly complete for 2007, Majority for 2006, Partial for 2005 & 2004
29
Overview: IR Metrics Initiative
Bottom Line: This is a work in progress but there is more than enough data to support these findings…
30
Overview: IR Metrics Initiative
…just add “-ish” to the end of all numbers

31
IR Case Metrics: Statistics and Trends
32
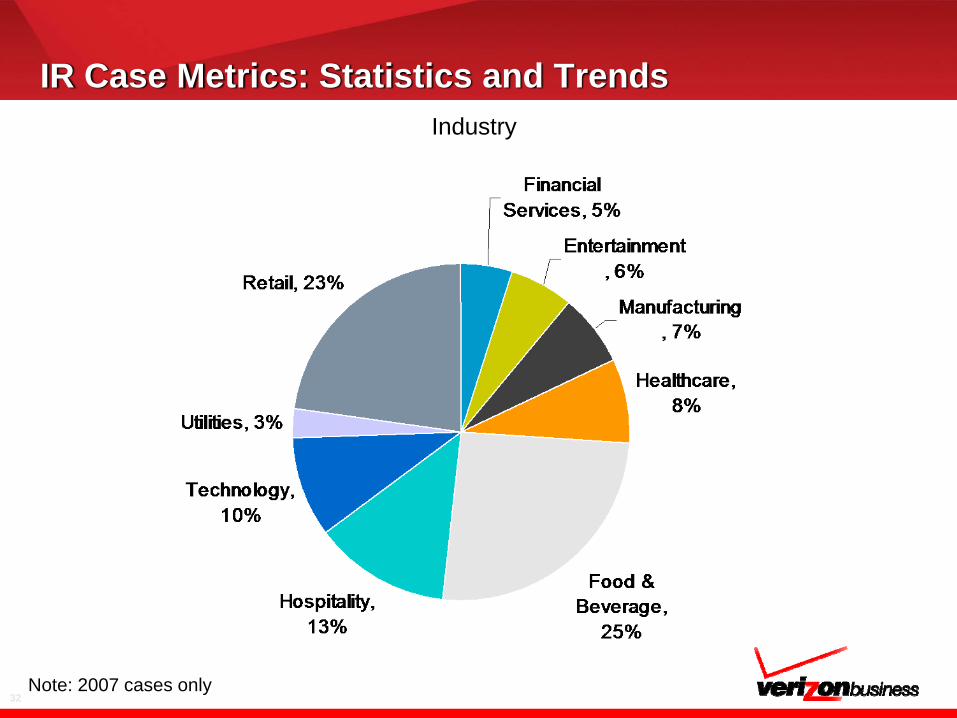
Industry
Note: 2007 cases only
IR Case Metrics: Statistics and Trends
33
What is the source of breaches?
IR Case Metrics: Statistics and Trends
34
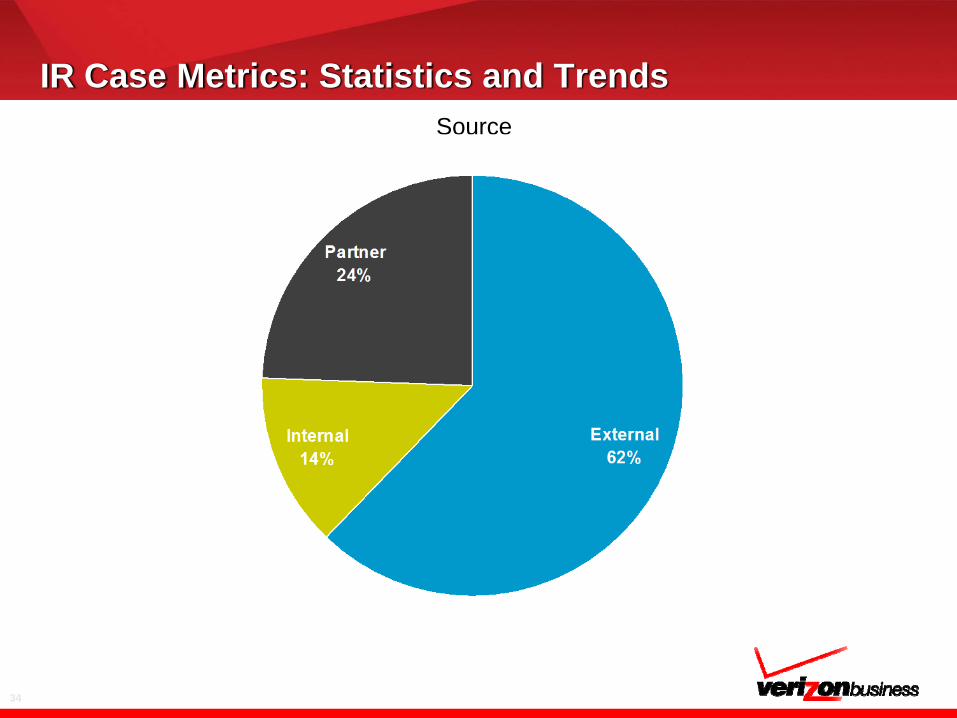
IR Case Metrics: Statistics and TrendsSource
35
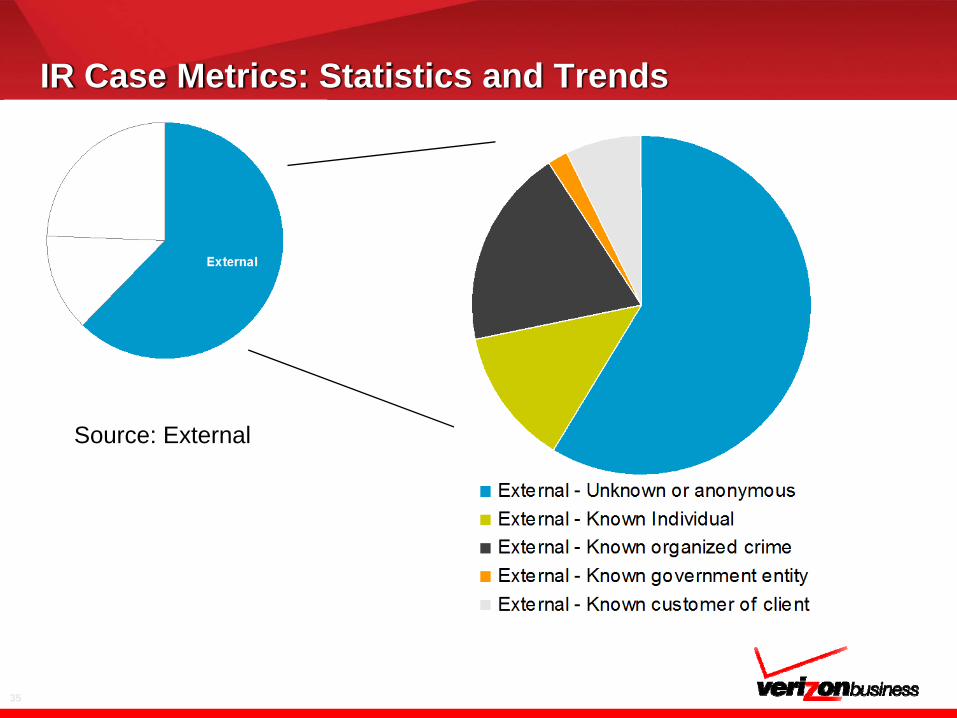
IR Case Metrics: Statistics and Trends
Source: External
36
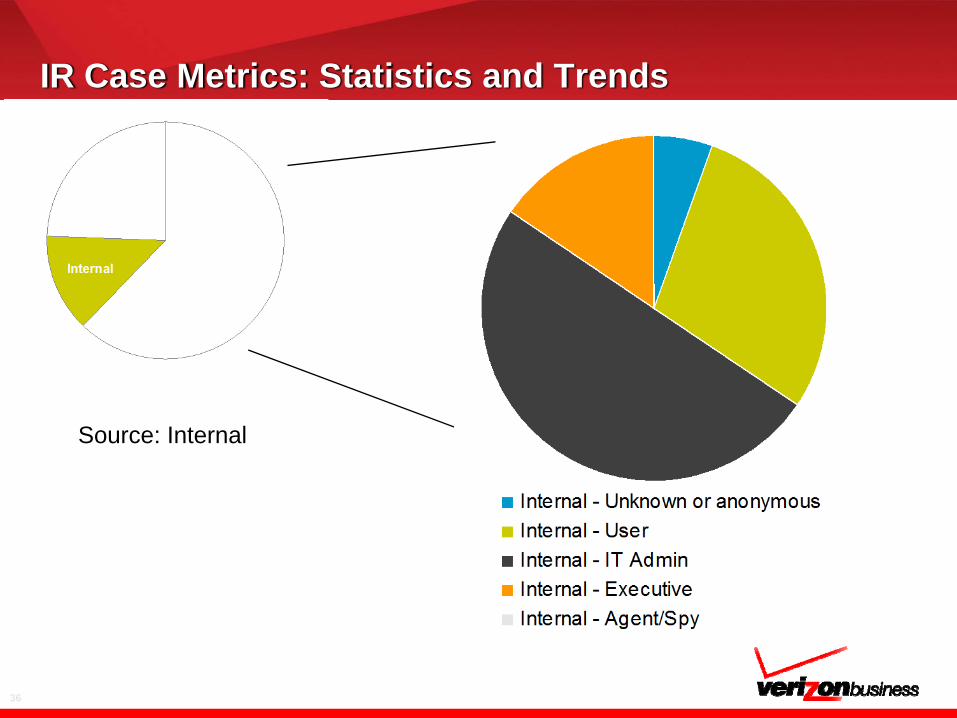
IR Case Metrics: Statistics and Trends
Source: Internal
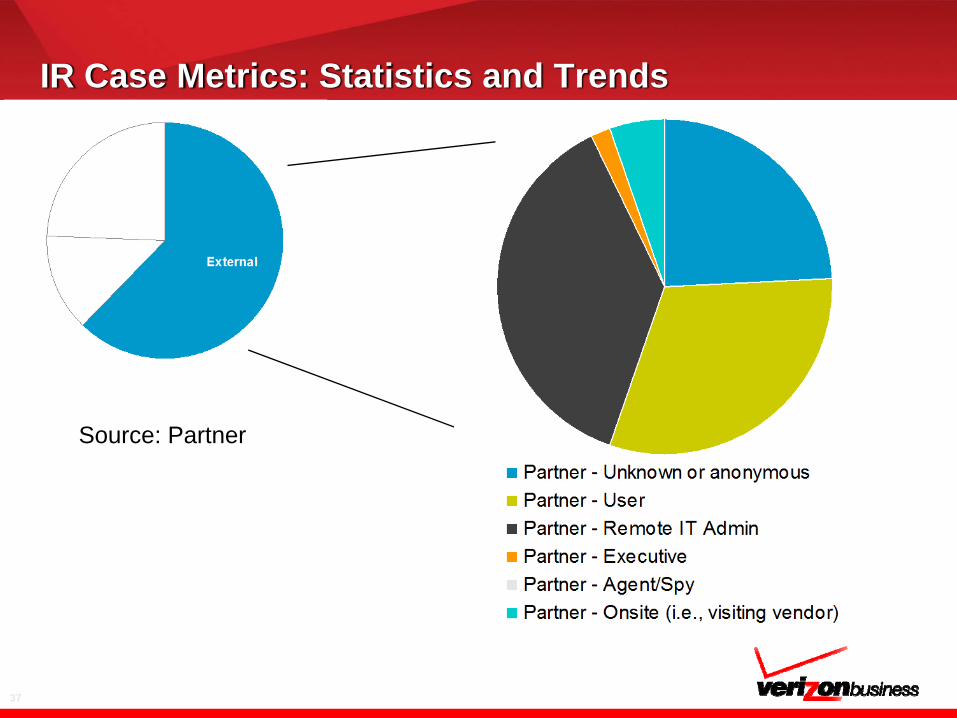
37
IR Case Metrics: Statistics and Trends
Source: Partner
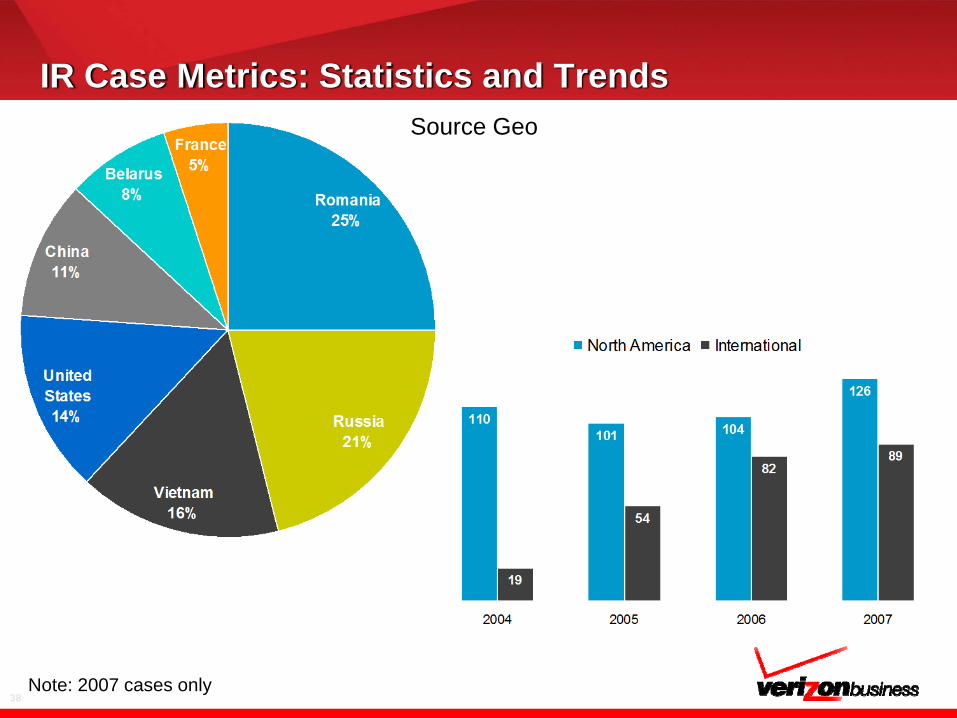
38
IR Case Metrics: Statistics and TrendsSource Geo
Note: 2007 cases only

39
How do breaches occur?
IR Case Metrics: Statistics and Trends
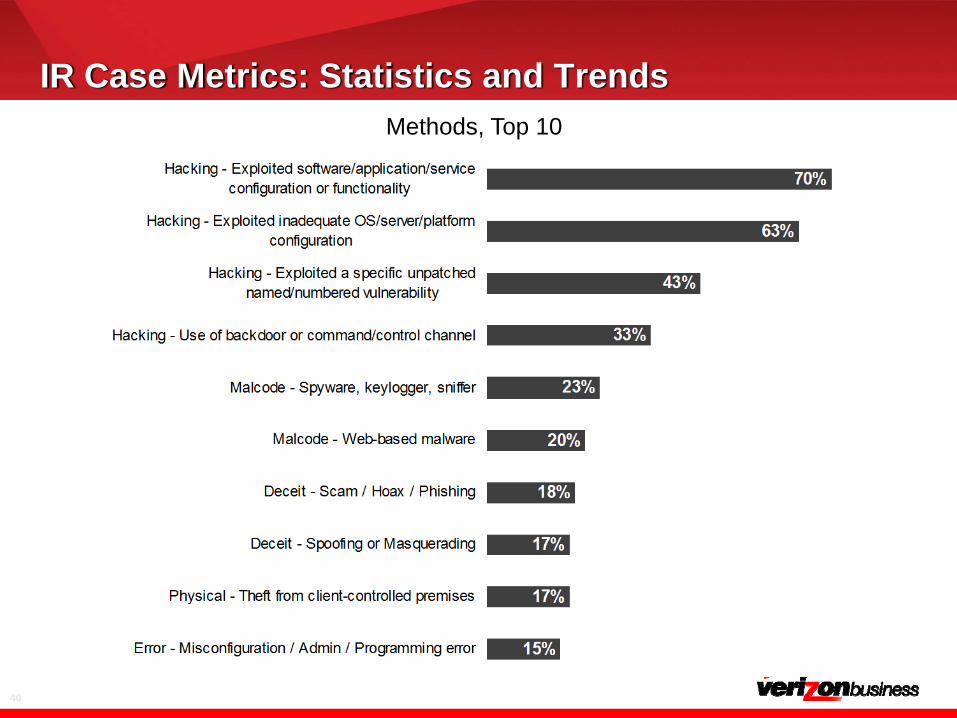
40
IR Case Metrics: Statistics and TrendsMethods, Top 10
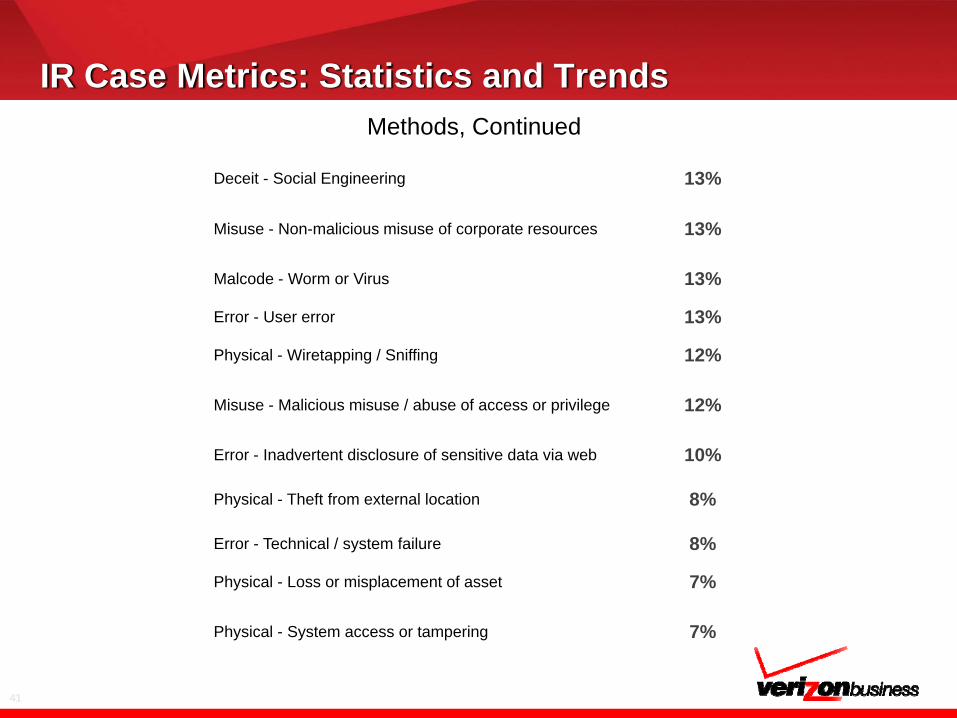
41
IR Case Metrics: Statistics and TrendsMethods, Continued
Deceit - Social Engineering 13%
Misuse - Non-malicious misuse of corporate resources 13%
Malcode - Worm or Virus 13%
Error - User error 13%
Physical - Wiretapping / Sniffing 12%
Misuse - Malicious misuse / abuse of access or privilege 12%
Error - Inadvertent disclosure of sensitive data via web 10%
Physical - Theft from external location 8%
Error - Technical / system failure 8%
Physical - Loss or misplacement of asset 7%
Physical - System access or tampering 7%
42
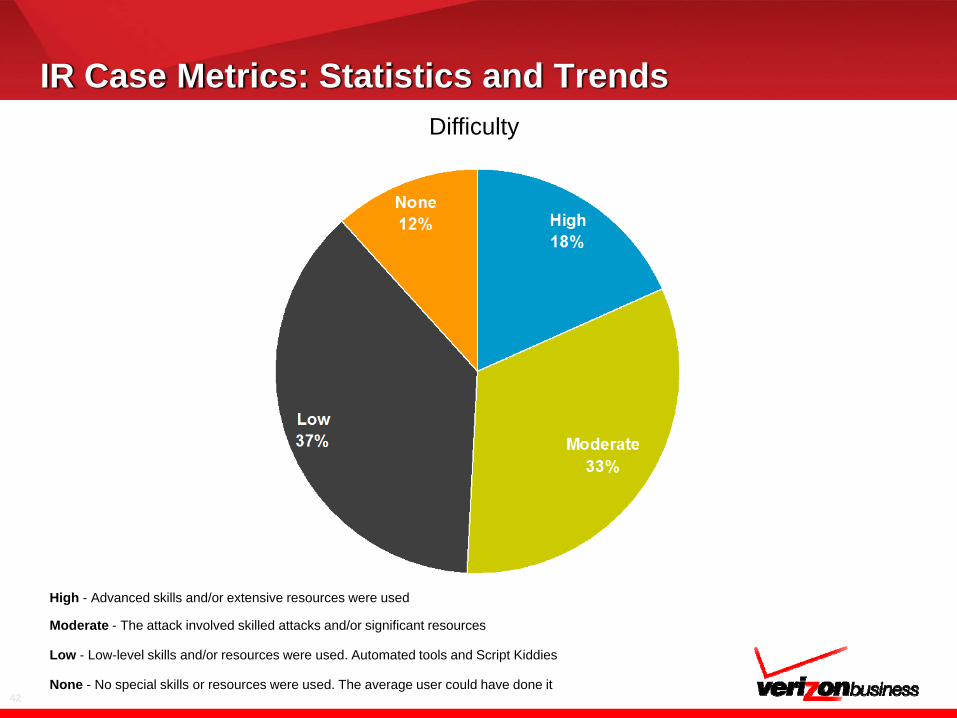
IR Case Metrics: Statistics and TrendsDifficulty
High - Advanced skills and/or extensive resources were used
Moderate - The attack involved skilled attacks and/or significant resources
Low - Low-level skills and/or resources were used. Automated tools and Script Kiddies
None - No special skills or resources were used. The average user could have done it
43
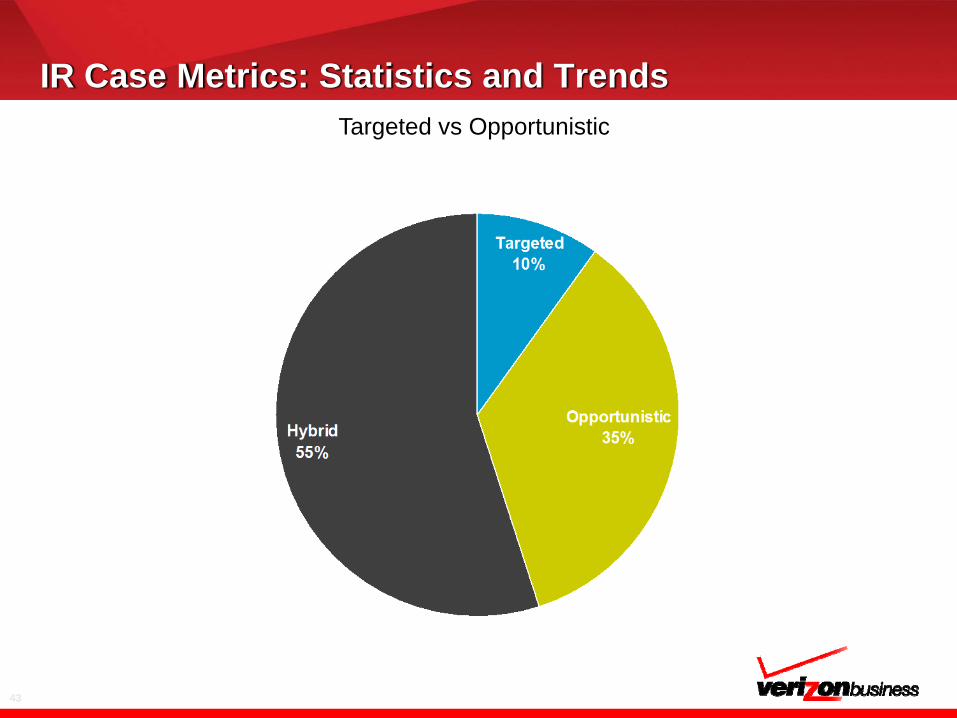
IR Case Metrics: Statistics and TrendsTargeted vs Opportunistic
44
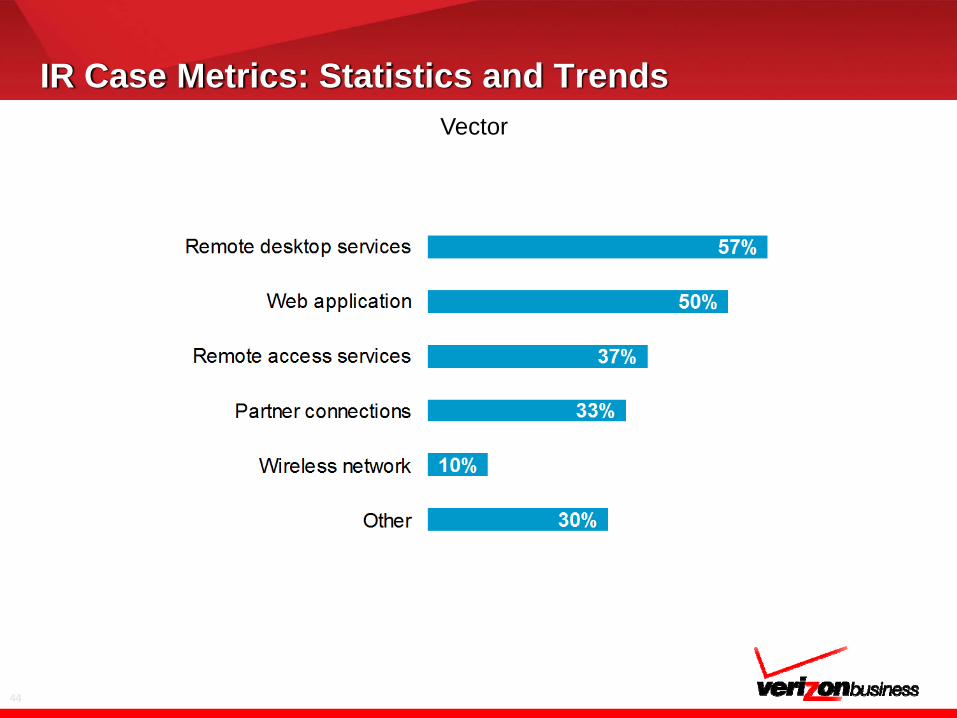
IR Case Metrics: Statistics and TrendsVector
45
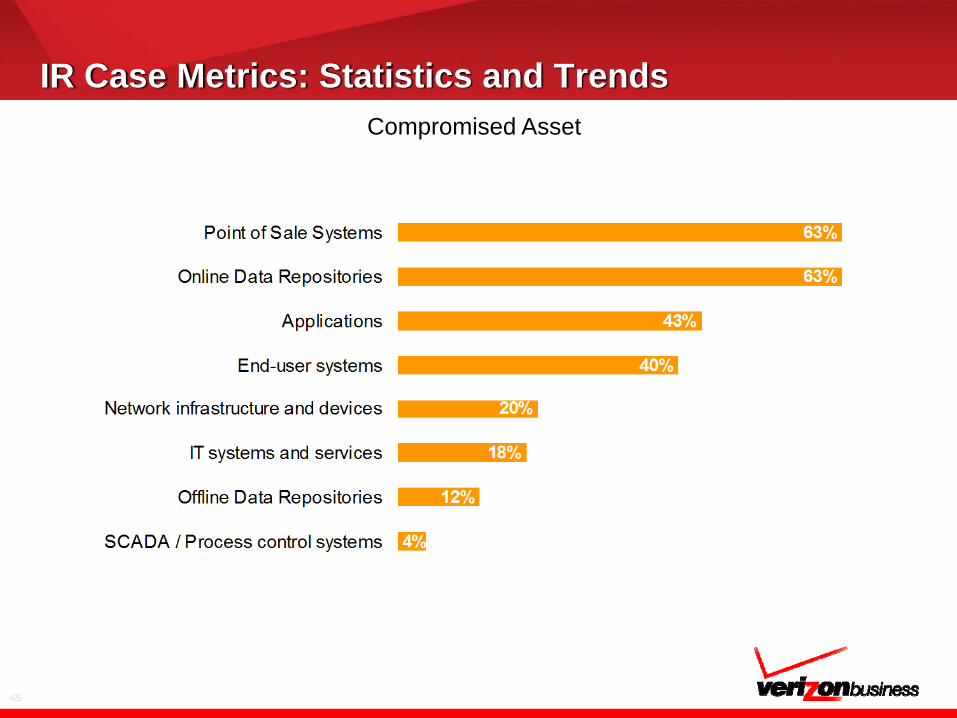
IR Case Metrics: Statistics and TrendsCompromised Asset
46
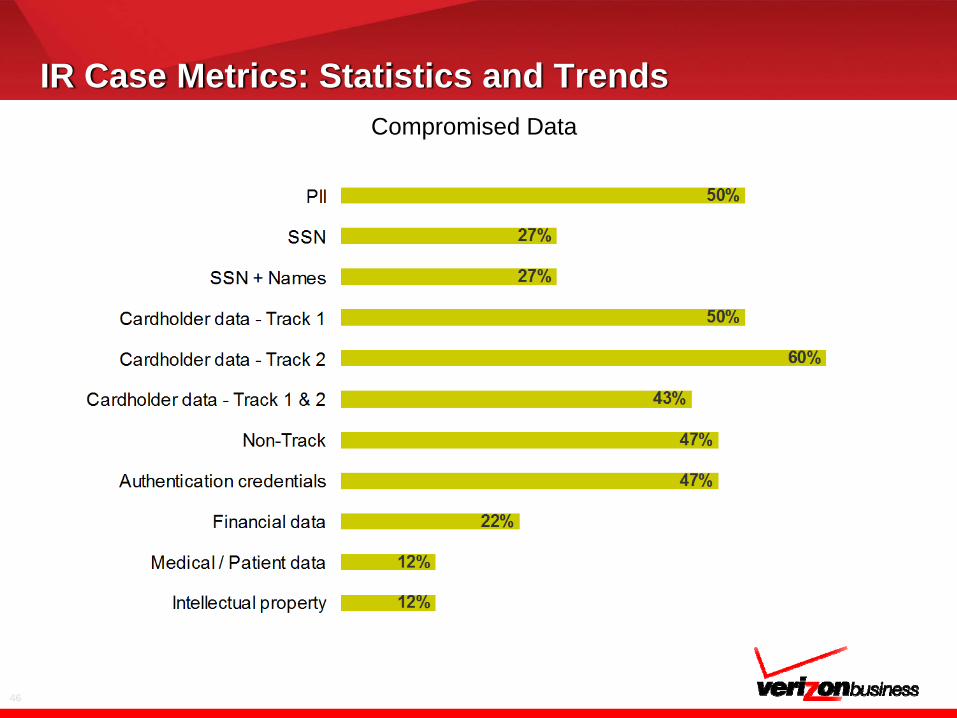
IR Case Metrics: Statistics and TrendsCompromised Data
47
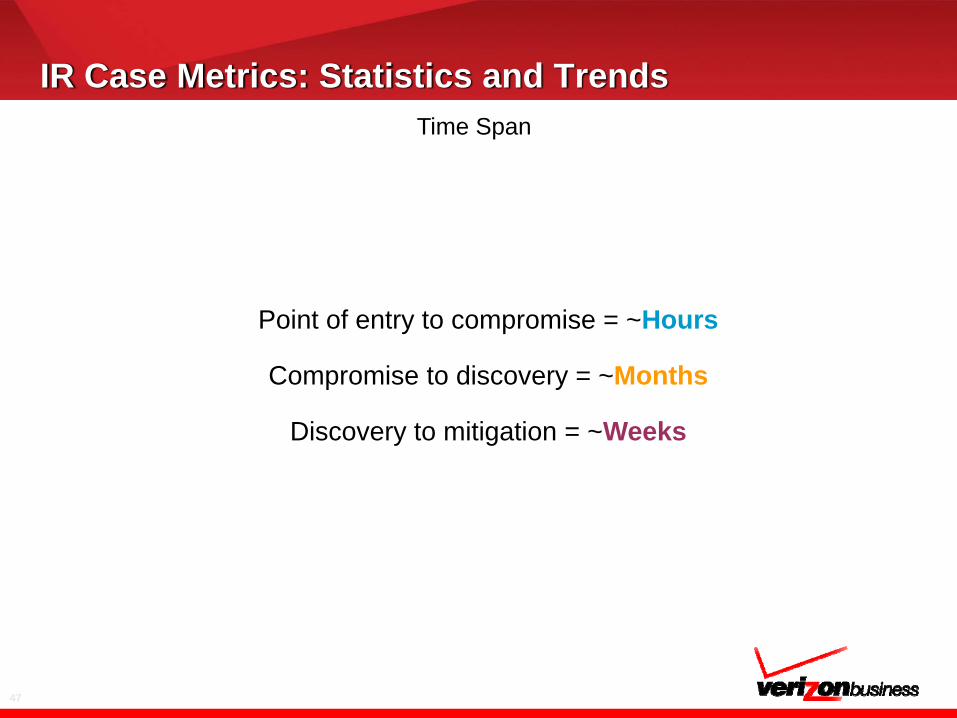
IR Case Metrics: Statistics and TrendsTime Span
Point of entry to compromise = ~Hours
Compromise to discovery = ~Months
Discovery to mitigation = ~Weeks

48
How are breaches discovered?
IR Case Metrics: Statistics and Trends
49
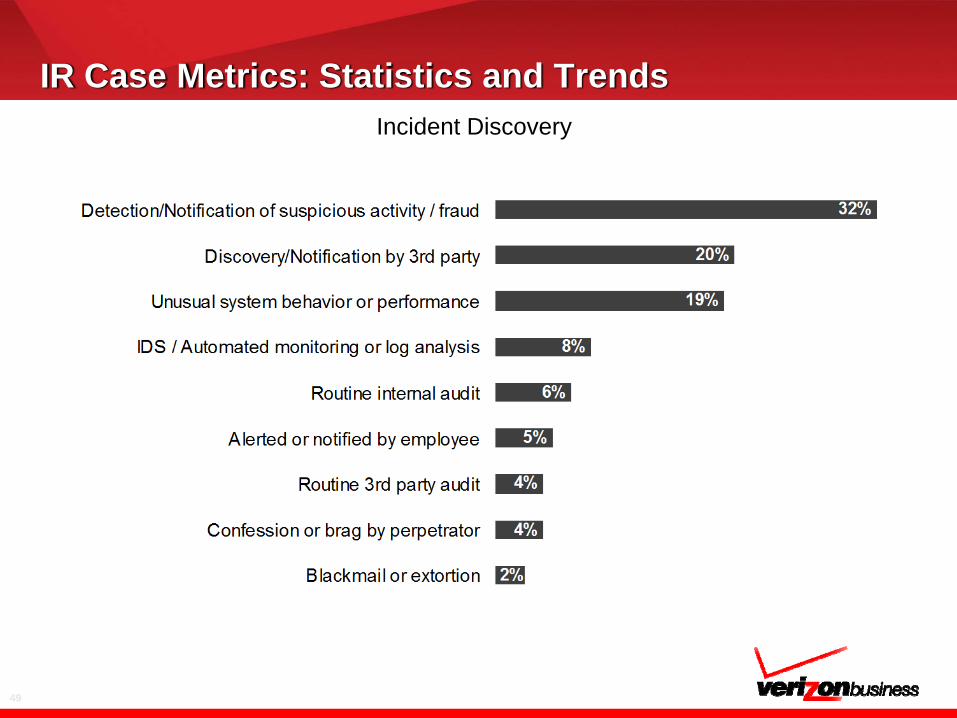
IR Case Metrics: Statistics and TrendsIncident Discovery
50
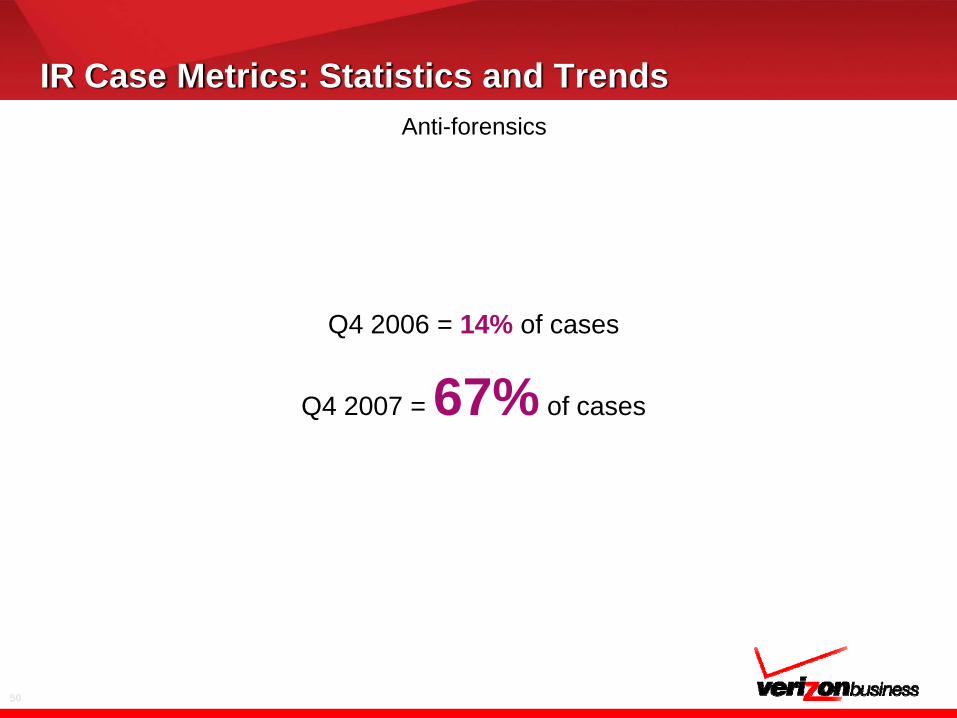
IR Case Metrics: Statistics and TrendsAnti-forensics
Q4 2006 = 14% of cases
Q4 2007 = 67% of cases

51
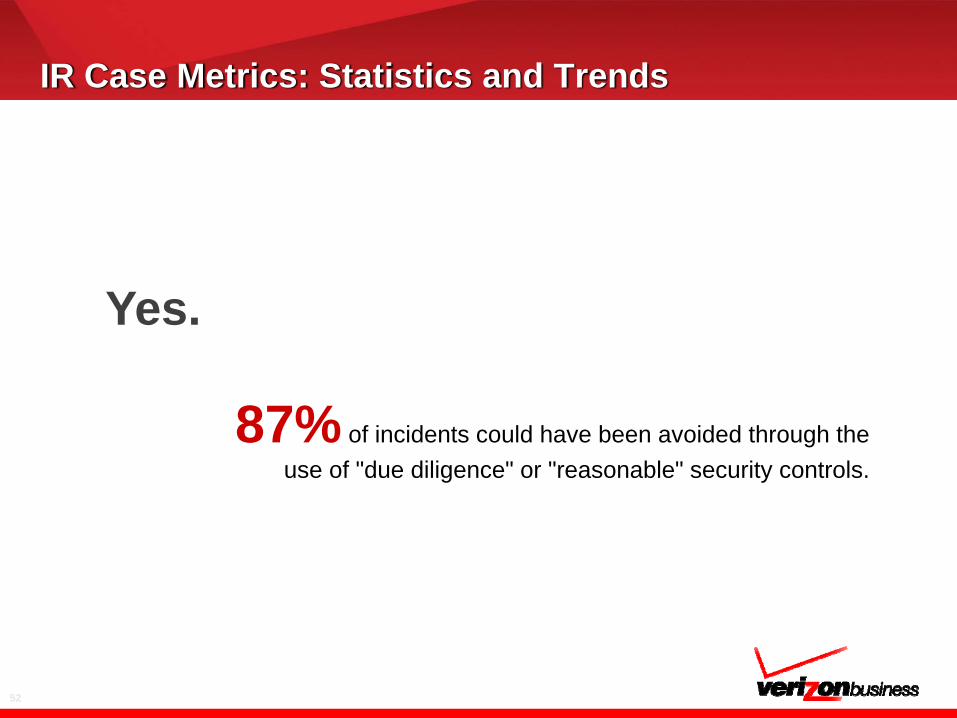
Can breaches be prevented?
IR Case Metrics: Statistics and Trends
52
IR Case Metrics: Statistics and Trends
87% of incidents could have been avoided through the use of "due diligence" or "reasonable" security controls.
Yes.
53
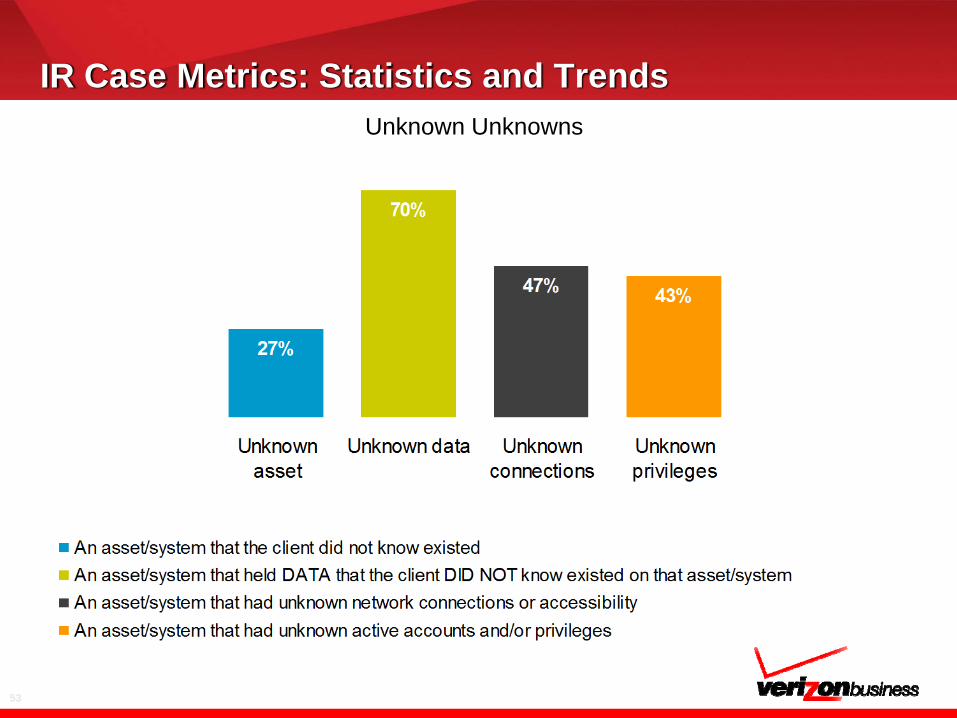
IR Case Metrics: Statistics and TrendsUnknown Unknowns
54
IR Case Metrics: Statistics and Trends
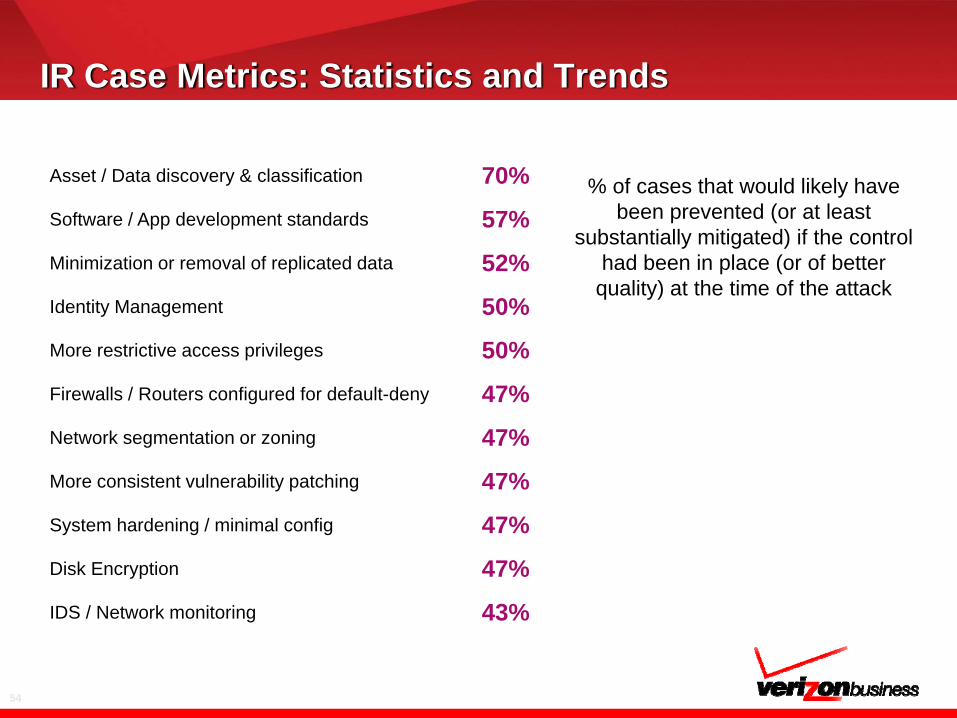
% of cases that would likely have been prevented (or at least
substantially mitigated) if the control had been in place (or of better
quality) at the time of the attack
Asset / Data discovery & classification 70%
Software / App development standards 57%
Minimization or removal of replicated data 52%
Identity Management 50%
More restrictive access privileges 50%
Firewalls / Routers configured for default-deny 47%
Network segmentation or zoning 47%
More consistent vulnerability patching 47%
System hardening / minimal config 47%
Disk Encryption 47%
IDS / Network monitoring 43%
55
IR Case Metrics: Statistics and Trends
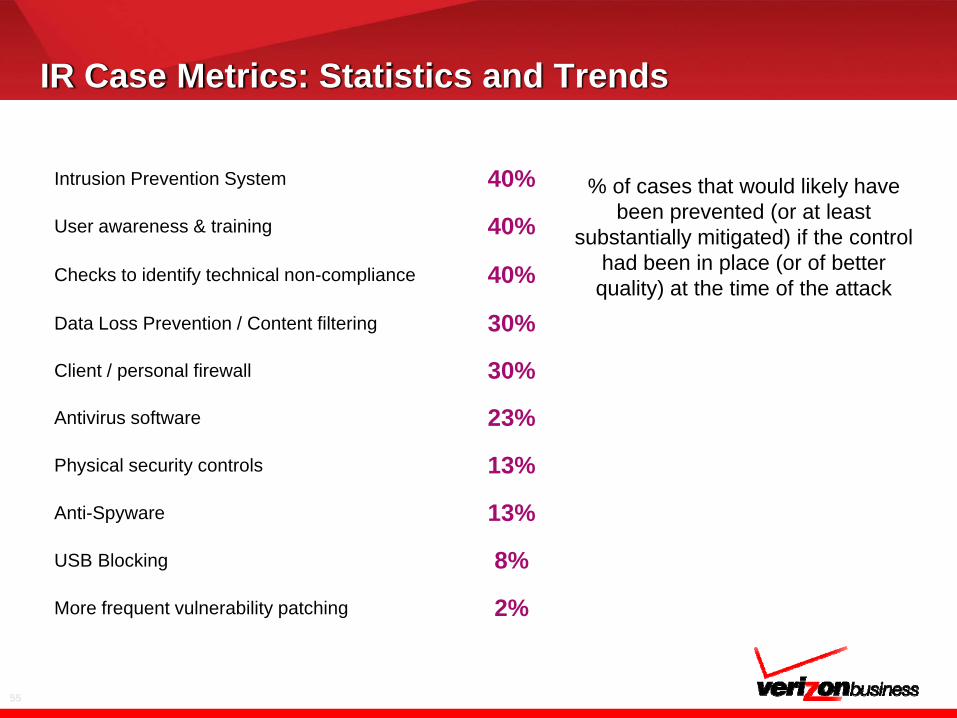
Intrusion Prevention System 40%
User awareness & training 40%
Checks to identify technical non-compliance 40%
Data Loss Prevention / Content filtering 30%
Client / personal firewall 30%
Antivirus software 23%
Physical security controls 13%
Anti-Spyware 13%
USB Blocking 8%
More frequent vulnerability patching 2%
% of cases that would likely have been prevented (or at least
substantially mitigated) if the control had been in place (or of better
quality) at the time of the attack