Embed Size (px)
Citation preview
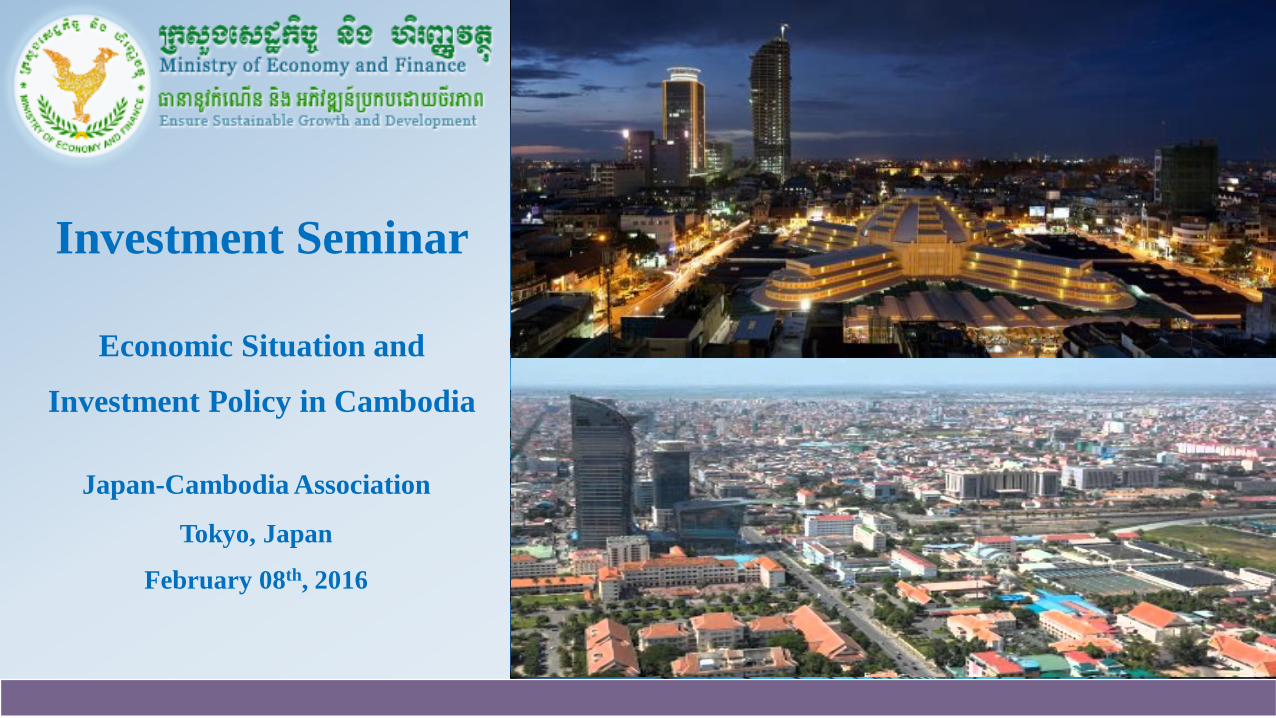
Japan-Cambodia Association
Tokyo, Japan
February 08th, 2016
1
Investment Seminar
Economic Situation and
Investment Policy in Cambodia

Contents
2
1. Robust Economy
2. Strong FDIPerformance
3. Why Cambodia?
4. Ways forward
3
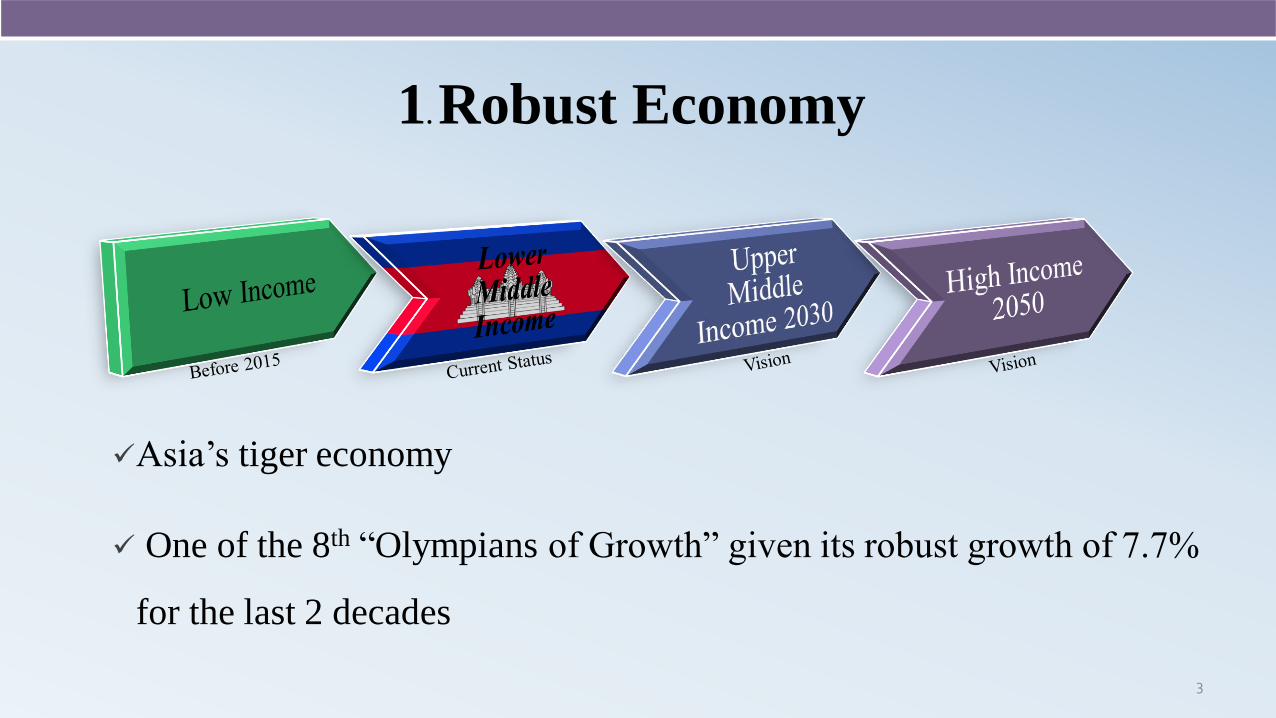
Asia’s tiger economy
One of the 8th “Olympians of Growth” given its robust growth of 7.7%
for the last 2 decades
1. Robust Economy
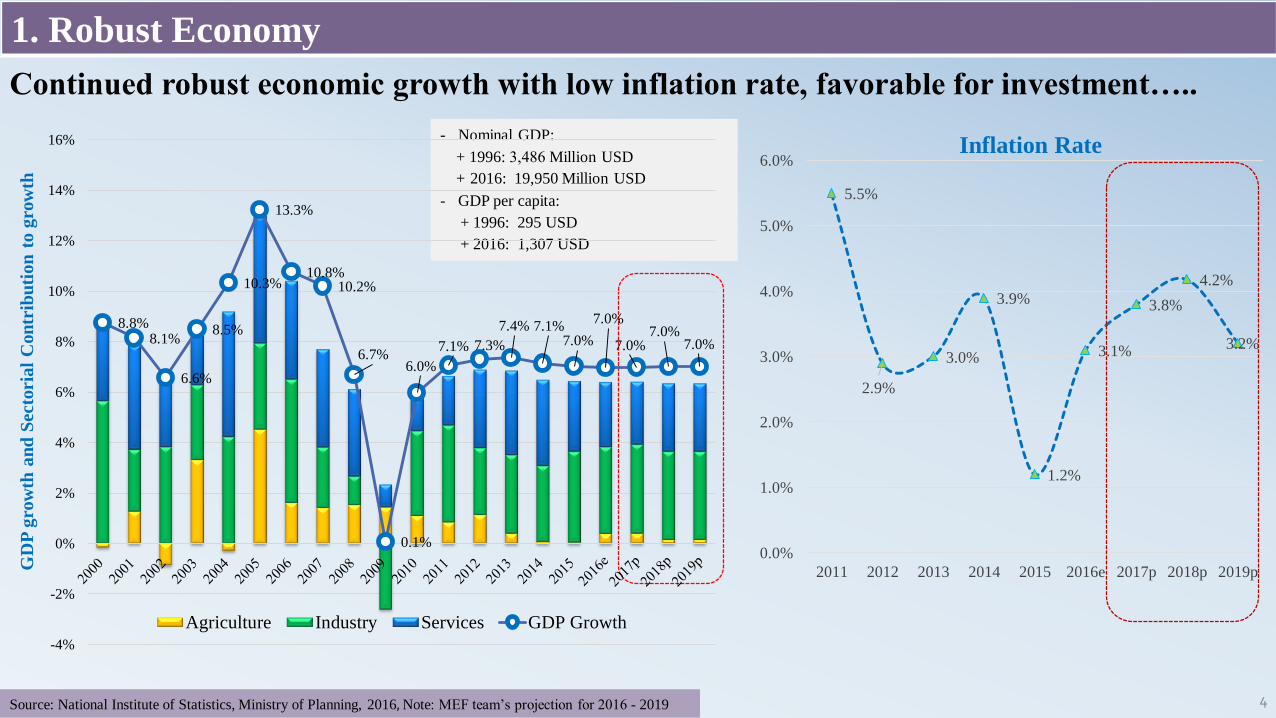
Continued robust economic growth with low inflation rate, favorable for investment…..
Source: National Institute of Statistics, Ministry of Planning, 2016, Note: MEF team’s projection for 2016 - 2019
GD
P g
row
th a
nd
Secto
ria
l C
on
trib
uti
on
to g
row
th
- Nominal GDP:
+ 1996: 3,486 Million USD
+ 2016: 19,950 Million USD
- GDP per capita:
+ 1996: 295 USD
+ 2016: 1,307 USD
4
Inflation Rate
1. Robust Economy
5.5%
2.9%
3.0%
3.9%
1.2%
3.1%
3.8%
4.2%
3.2%
0.0%
1.0%
2.0%
3.0%
4.0%
5.0%
6.0%
2011 2012 2013 2014 2015 2016e 2017p 2018p 2019p
8.8%8.1%
6.6%
8.5%
10.3%
13.3%
10.8%10.2%
6.7%
0.1%
6.0%
7.1% 7.3%
7.4% 7.1%7.0%
7.0%
7.0%7.0%
7.0%
-4%
-2%
0%
2%
4%
6%
8%
10%
12%
14%
16%
Agriculture Industry Services GDP Growth
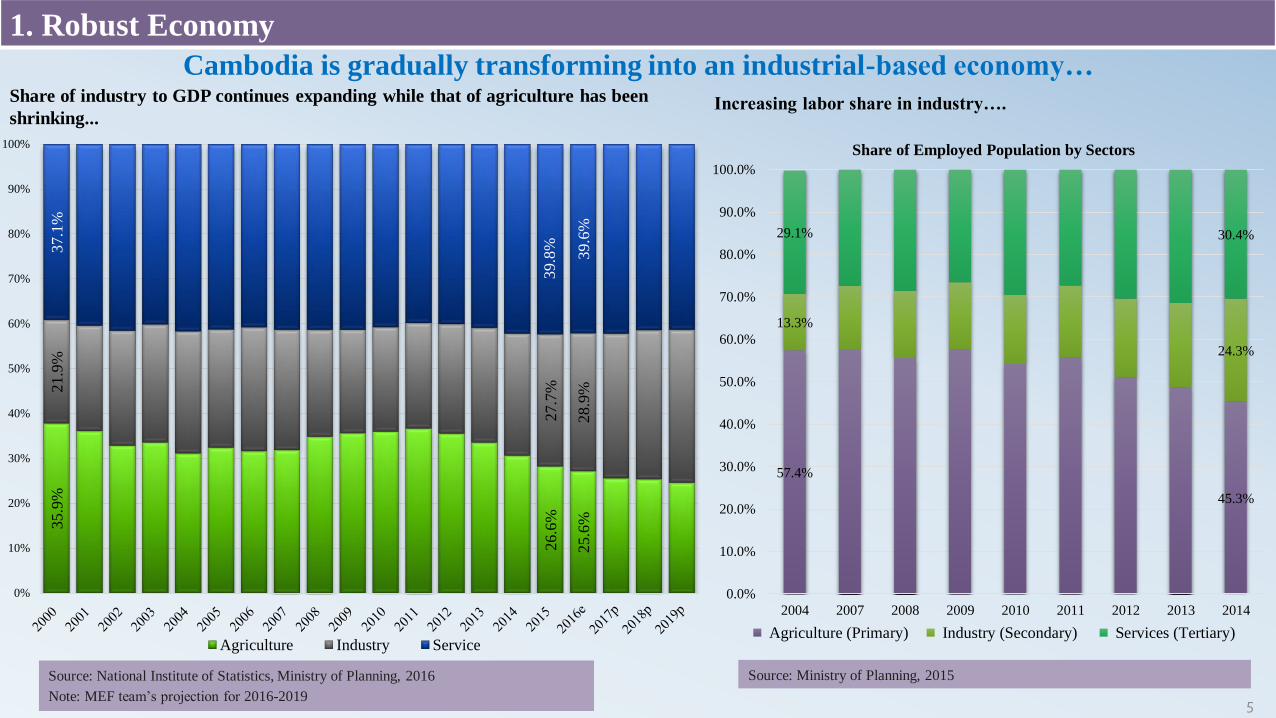
Cambodia is gradually transforming into an industrial-based economy…
Source: National Institute of Statistics, Ministry of Planning, 2016
Note: MEF team’s projection for 2016-2019
57.4%
45.3%
13.3%
24.3%
29.1% 30.4%
0.0%
10.0%
20.0%
30.0%
40.0%
50.0%
60.0%
70.0%
80.0%
90.0%
100.0%
2004 2007 2008 2009 2010 2011 2012 2013 2014
Agriculture (Primary) Industry (Secondary) Services (Tertiary)
Share of Employed Population by Sectors
Increasing labor share in industry….
Source: Ministry of Planning, 2015
5
1. Robust Economy35.9
%
26.6
%
25.6
%
21
.9%
27.7
%
28.9
%
37.1
%
39.8
%
39.6
%0%
10%
20%
30%
40%
50%
60%
70%
80%
90%
100%
Agriculture Industry Service
Share of industry to GDP continues expanding while that of agriculture has been
shrinking...

Increased domestic production has been observed in sectors such as food, beverages, light manufacturing…
6Source: National Institute of Statistics, Ministry of Planning, 2016, Note: MEF team’s projection for 2016 - 2017
Gro
wth
in
Per
cen
t
1. Robust Economy
19
.9%
6.5
%
10
.7%
6.6
%
9.8
%
8.4
%
8.5
%
7.9%
18.2%
13.7%
21.4%
19.2%
15.9%
14.1%6
.2%
10
.2%
8.4
%
9.6
%
9.3
%
11
.6%
12
.3%
14.5%
9.3%10.7%
10.1%
11.7%10.7% 10.7%
0.0%
5.0%
10.0%
15.0%
20.0%
25.0%
2011 2012 2013 2014 2015 2016e 2017p
Garment Construction Other industry Industry Sector

Export Diversification: From garment to rice and others (electronic, bicycles...)
Source: Ministry of Economy and Finance, 2016
7
1. Robust Economy
0%
10%
20%
30%
40%
50%
60%
70%
80%
90%
100%
2010 2011 2012 2013 2014 2015 2016
88.8% 86.4% 82.0% 77.1% 73.5% 73.7% 73.1%
7.8% 7.4% 12.6% 16.6% 21.5% 21.1% 22.3%
Export by Products
Garment Rice Rubber Others (Electronic components, bicycles, etc.)

Source: Ministry of Economy and Finance, 2016
Export Diversification: From export to the US to export to EU, Japan,...
8
1. Robust Economy
4.5% 6.2% 7.2% 9.3% 11.7% 11.1% 10.3%
25.0%30.0% 32.1%
33.4%34.1% 37.9% 38.8%
52.3% 42.6% 36.7% 31.4% 26.7% 23.9% 20.9%
2.4%3.1%
3.5% 4.8% 5.7% 6.8%8.2%
15.7% 18.1% 20.5% 21.1% 21.8% 20.2% 21.9%
0%
10%
20%
30%
40%
50%
60%
70%
80%
90%
100%
2010 2011 2012 2013 2014 2015 2016
Share of Export Value by Countries
ASEAN EU USA JAPAN Others

9
2. Strong FDI Performance
Robust Economy
Strong Policy
Support
Favorable Investment Condition

Source: National Bank of Cambodia, 2016
Strong FDI performance, on the back of sound macroeconomic environment, favorable investment climate and
supporting policies…….
10
2. Strong FDI Performance
31.2%
9.3%8.6%
7.4%
7.1%
5.0%
4.4%
4.3%
4.1%
2.7%
China
Vietnam
Korea
Malaysia
Taiwan
Singapore
Hong Kong
Japan
Thailand
UK
Top 10 Investors in 2015
15.4%
26.2%
18.9%
9.3%
3.6%
13.5%
Major Investment Sectors, in 2015
Agriculture Manufacturing Financial ActivitiesAccommodation Telecom Hydropower
o.w: Garment 22.2%
Sh
are
of
Tota
l In
ves
tmen
t In
flow
928
1,342 1,372
1,835 1,872
1,720 1,701
2,167
9.8%
44.6%
2.3%
33.7%
2.0%
-8.1%
-1.1%
27.4%
-20.0%
-10.0%
0.0%
10.0%
20.0%
30.0%
40.0%
50.0%
-
500
1,000
1,500
2,000
2,500
2009 2010 2011 2012 2013 2014 2015 2016E
USD
Mill
ion
FDI Inflow Change in %
11
2. Strong FDI Performance
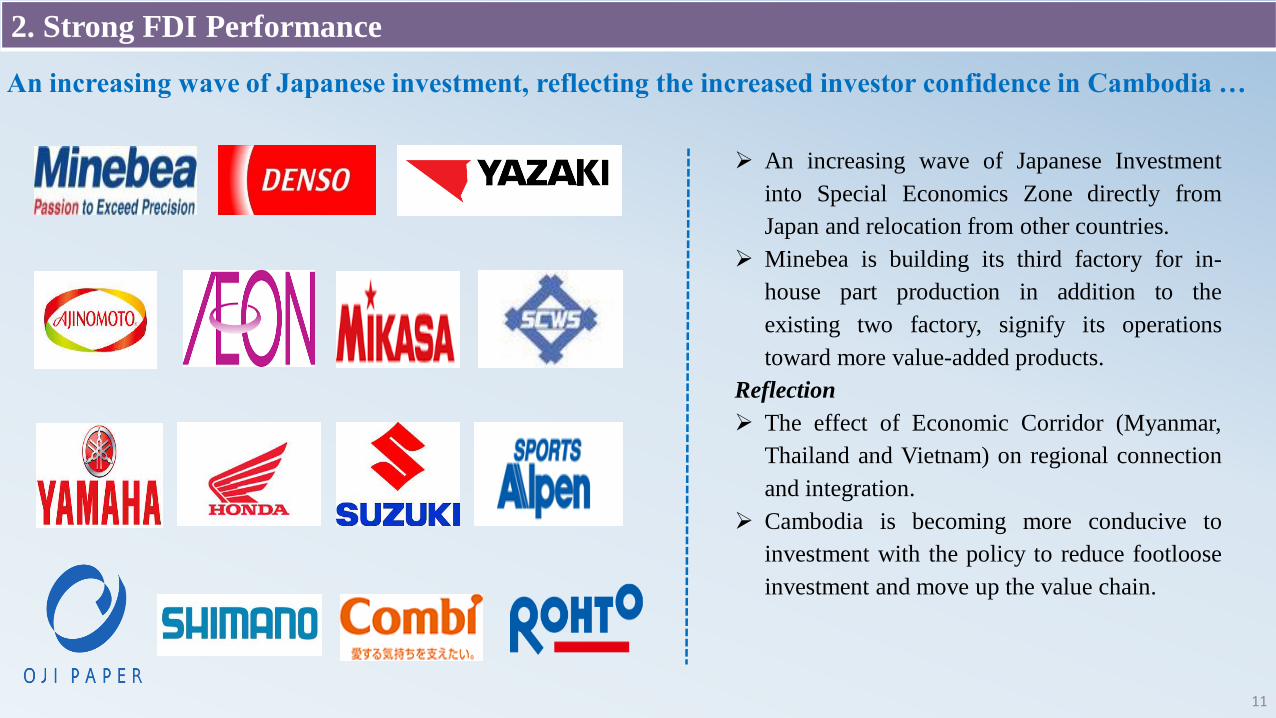
An increasing wave of Japanese Investment
into Special Economics Zone directly from
Japan and relocation from other countries.
Minebea is building its third factory for in-
house part production in addition to the
existing two factory, signify its operations
toward more value-added products.
Reflection
The effect of Economic Corridor (Myanmar,
Thailand and Vietnam) on regional connection
and integration.
Cambodia is becoming more conducive to
investment with the policy to reduce footloose
investment and move up the value chain.
An increasing wave of Japanese investment, reflecting the increased investor confidence in Cambodia …
12
3. Why Cambodia?
Open Economy with Sound Macroeconomic Environment
Competitive Investment Conditions
Market access
Strategic location
Attractive FDI Promotion Policies
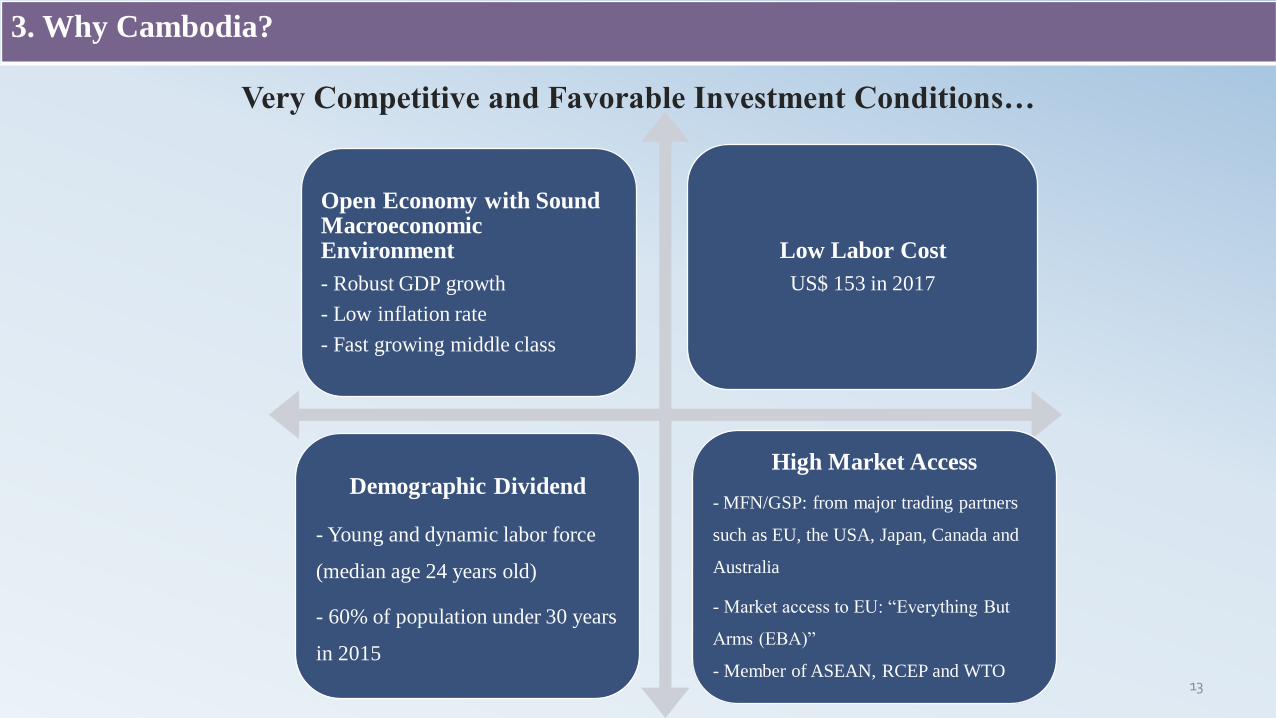
Open Economy with Sound Macroeconomic Environment
- Robust GDP growth
- Low inflation rate
- Fast growing middle class
Low Labor Cost
US$ 153 in 2017
Demographic Dividend
- Young and dynamic labor force
(median age 24 years old)
- 60% of population under 30 years
in 2015
High Market Access
- MFN/GSP: from major trading partners
such as EU, the USA, Japan, Canada and
Australia
- Market access to EU: “Everything But
Arms (EBA)”
- Member of ASEAN, RCEP and WTO
Very Competitive and Favorable Investment Conditions…
13
3. Why Cambodia?
.
Phnom PenhThe Philippines
Singapore
Indonesia
MyanmarSouthern China
ManilaBangkok
Kunming
Yangon
Brunei
Jakarta
Begawan
Hanoi
Laoso Vientiane
CAMBODIA
Malaysia
Kuala Lumpur
ThailandVietnam
1h:30 in average
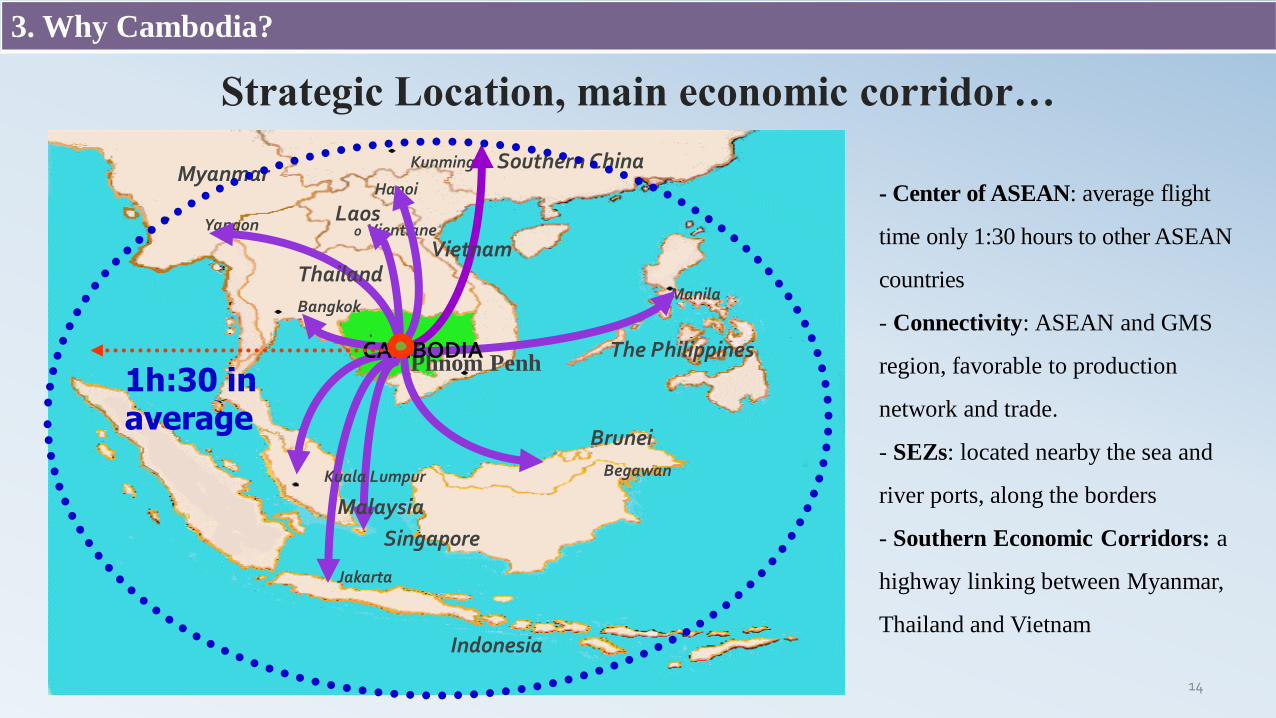
Strategic Location, main economic corridor…
14
- Center of ASEAN: average flight
time only 1:30 hours to other ASEAN
countries
- Connectivity: ASEAN and GMS
region, favorable to production
network and trade.
- SEZs: located nearby the sea and
river ports, along the borders
- Southern Economic Corridors: a
highway linking between Myanmar,
Thailand and Vietnam
3. Why Cambodia?

3. Why Invest in Cambodia?
Investment and Trade Facilitation
- One Stop Service: CDC, sole organization for investment activities
- Fast track investment approval within 28 days
- National Single Window: Trade and transport with a single entry points
- Japanese Desk: Special service for the rising of Japanese Investors
- Authorized Economic Operators
Investment Guarantee
- Equal Treatment of All Investors
- No Requirement of Local Equity Participation
- No Price Controls on Products or Services
- No Restriction on Forex Convertibility
- Free Remittance of Foreign Currencies Abroad
Investment Incentive
- 20% Corporate Tax : Lower than regional average
-Tax holidays up to 9 years
- Full Import Duty Exemption
- Repatriation of profit/Reinvestment of earning
- 100% exemption of export tax
- Loss carried Forward up to 5 years.
FDI Promotion
Policies
15

0 5 10 15 20 25 30 35
Customs and trade regulations
Courts
Crime, theft and disorder
Business licensing and permits
Electricity
Corruption
Access to finance
Biggest obstacle to operate in Cambodia, in % of firms
2016 2013 2007
Source: Enterprise Surveys, World Bank
Business environment has been greatly improved……
16
3. Why Invest in Cambodia?
17
4. Ways Forward
18
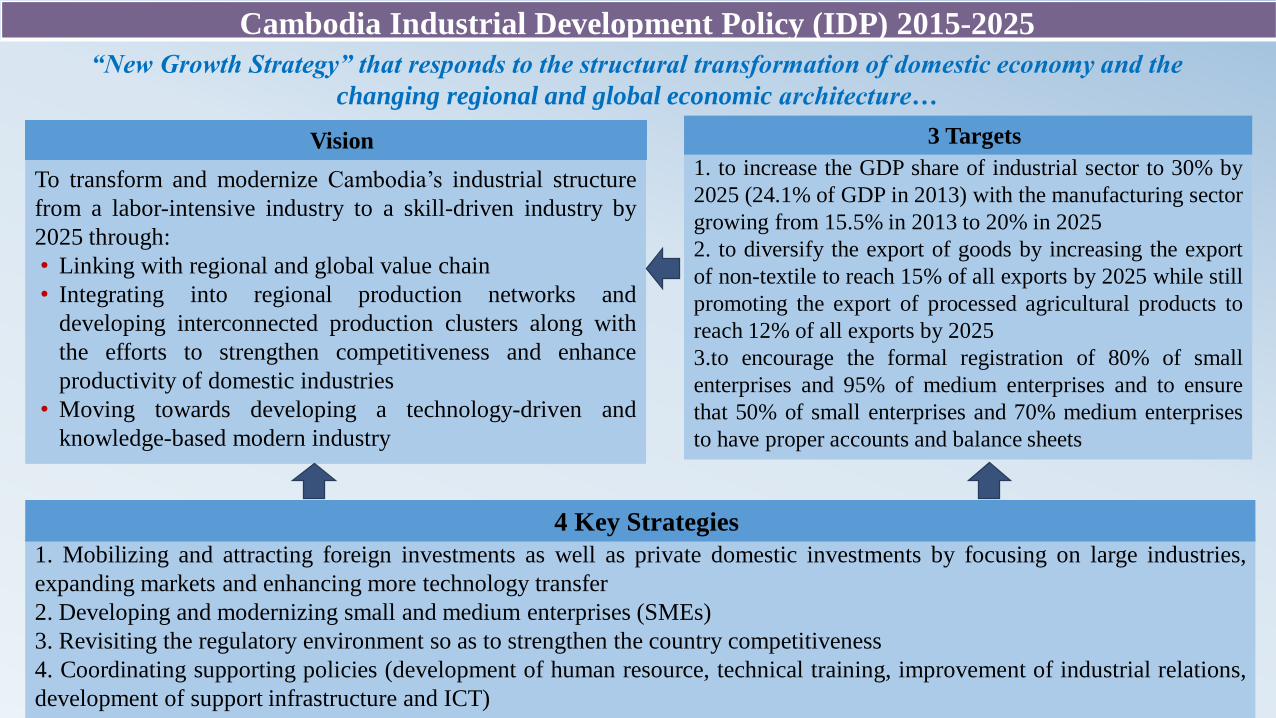
Vision
StrategiesTo transform and modernize Cambodia’s industrial structure
from a labor-intensive industry to a skill-driven industry by
2025 through:
• Linking with regional and global value chain
• Integrating into regional production networks and
developing interconnected production clusters along with
the efforts to strengthen competitiveness and enhance
productivity of domestic industries
• Moving towards developing a technology-driven and
knowledge-based modern industry
Vision
1. Mobilizing and attracting foreign investments as well as private domestic investments by focusing on large industries,
expanding markets and enhancing more technology transfer
2. Developing and modernizing small and medium enterprises (SMEs)
3. Revisiting the regulatory environment so as to strengthen the country competitiveness
4. Coordinating supporting policies (development of human resource, technical training, improvement of industrial relations,
development of support infrastructure and ICT)
4 Key Strategies
1. to increase the GDP share of industrial sector to 30% by
2025 (24.1% of GDP in 2013) with the manufacturing sector
growing from 15.5% in 2013 to 20% in 2025
2. to diversify the export of goods by increasing the export
of non-textile to reach 15% of all exports by 2025 while still
promoting the export of processed agricultural products to
reach 12% of all exports by 2025
3.to encourage the formal registration of 80% of small
enterprises and 95% of medium enterprises and to ensure
that 50% of small enterprises and 70% medium enterprises
to have proper accounts and balance sheets
3 Targets
Cambodia Industrial Development Policy (IDP) 2015-2025
“New Growth Strategy” that responds to the structural transformation of domestic economy and the
changing regional and global economic architecture…
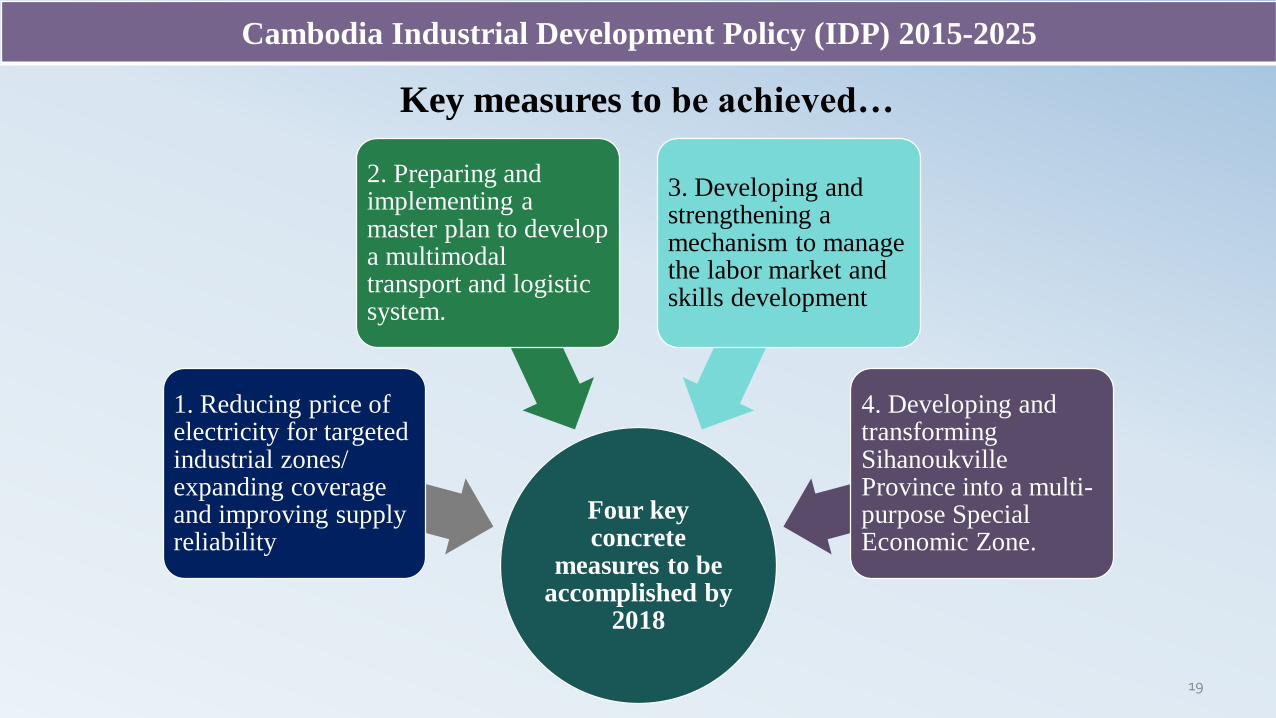
Key measures to be achieved…
Four key concrete
measures to be accomplished by
2018
1. Reducing price of electricity for targeted industrial zones/ expanding coverage and improving supply reliability
2. Preparing and implementing a master plan to develop a multimodal transport and logistic system.
3. Developing and strengthening a mechanism to manage the labor market and skills development
4. Developing and transforming SihanoukvilleProvince into a multi-purpose Special Economic Zone.
19
Cambodia Industrial Development Policy (IDP) 2015-2025
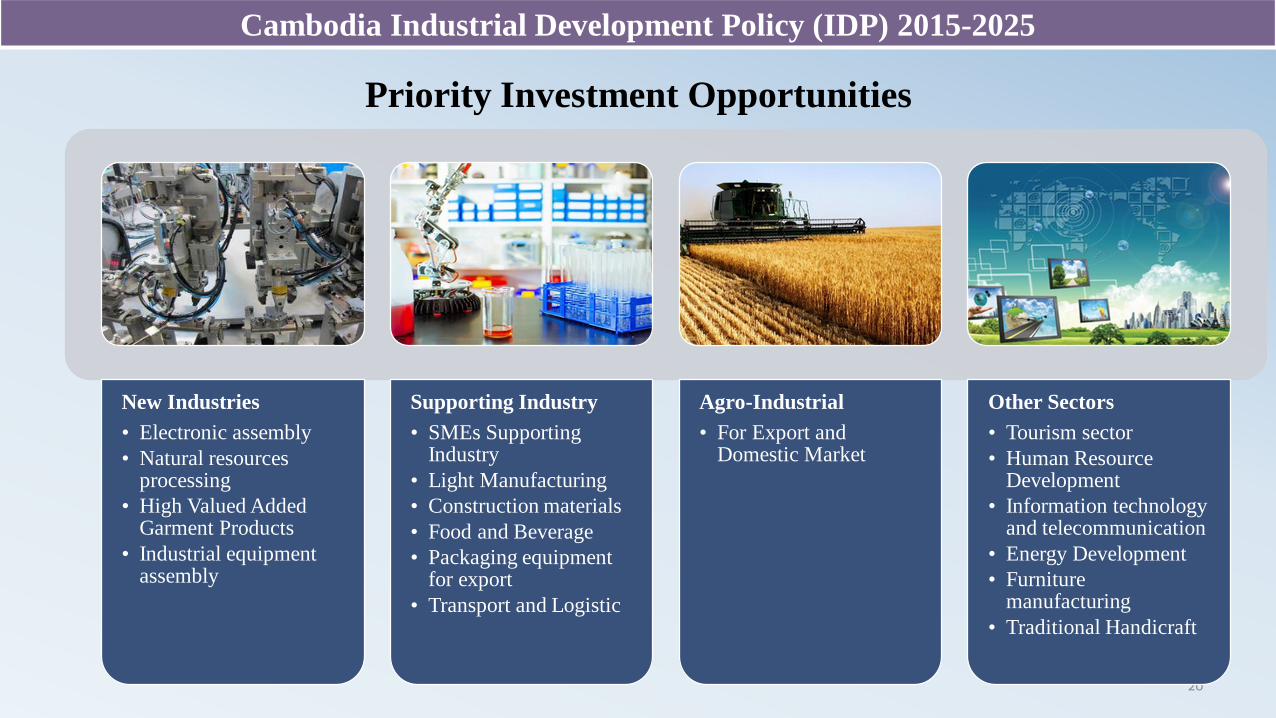
Priority Investment Opportunities
20
New Industries
• Electronic assembly
• Natural resources processing
• High Valued Added Garment Products
• Industrial equipment assembly
Supporting Industry
• SMEs Supporting Industry
• Light Manufacturing
• Construction materials
• Food and Beverage
• Packaging equipment for export
• Transport and Logistic
Agro-Industrial
• For Export and Domestic Market
Other Sectors
• Tourism sector
• Human Resource Development
• Information technology and telecommunication
• Energy Development
• Furniture manufacturing
• Traditional Handicraft
Cambodia Industrial Development Policy (IDP) 2015-2025

21
Strategic Development by Region…
Cambodia Industrial Development Policy (IDP) 2015-2025
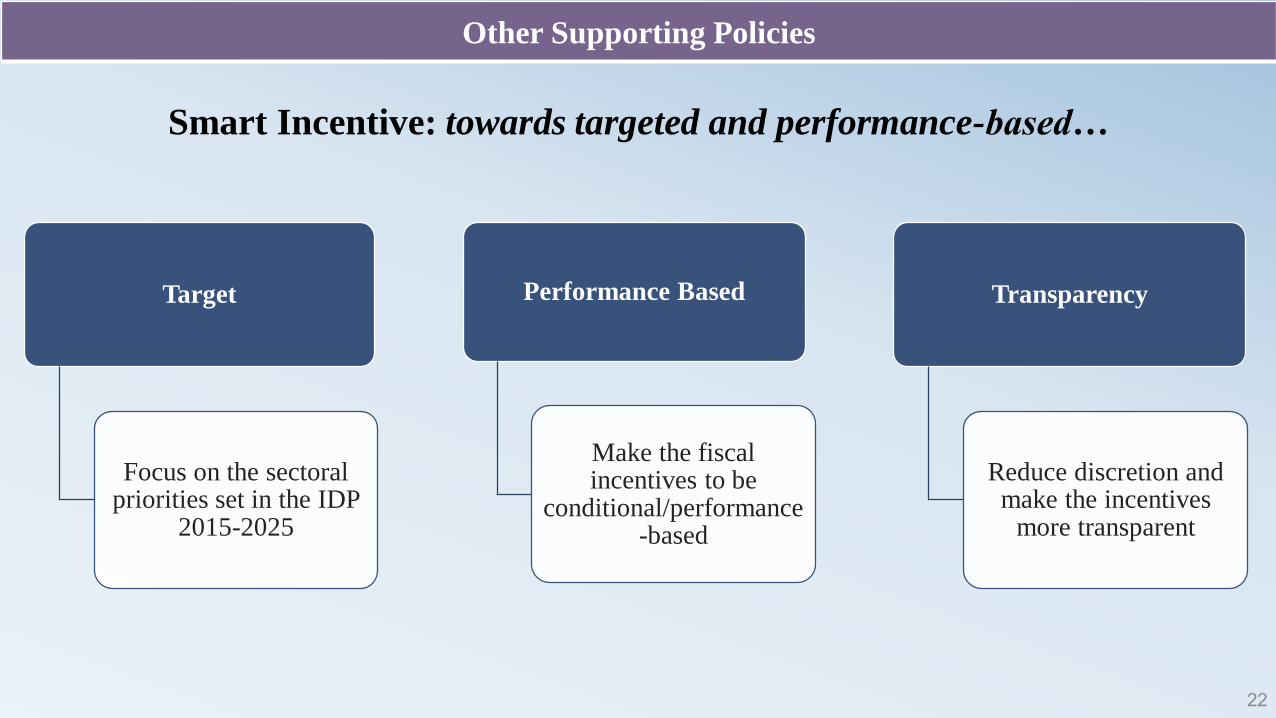
Smart Incentive: towards targeted and performance-based…
22
Other Supporting Policies
Target
Focus on the sectoral priorities set in the IDP
2015-2025
Performance Based
Make the fiscal incentives to be
conditional/performance-based
Transparency
Reduce discretion and make the incentives
more transparent
23
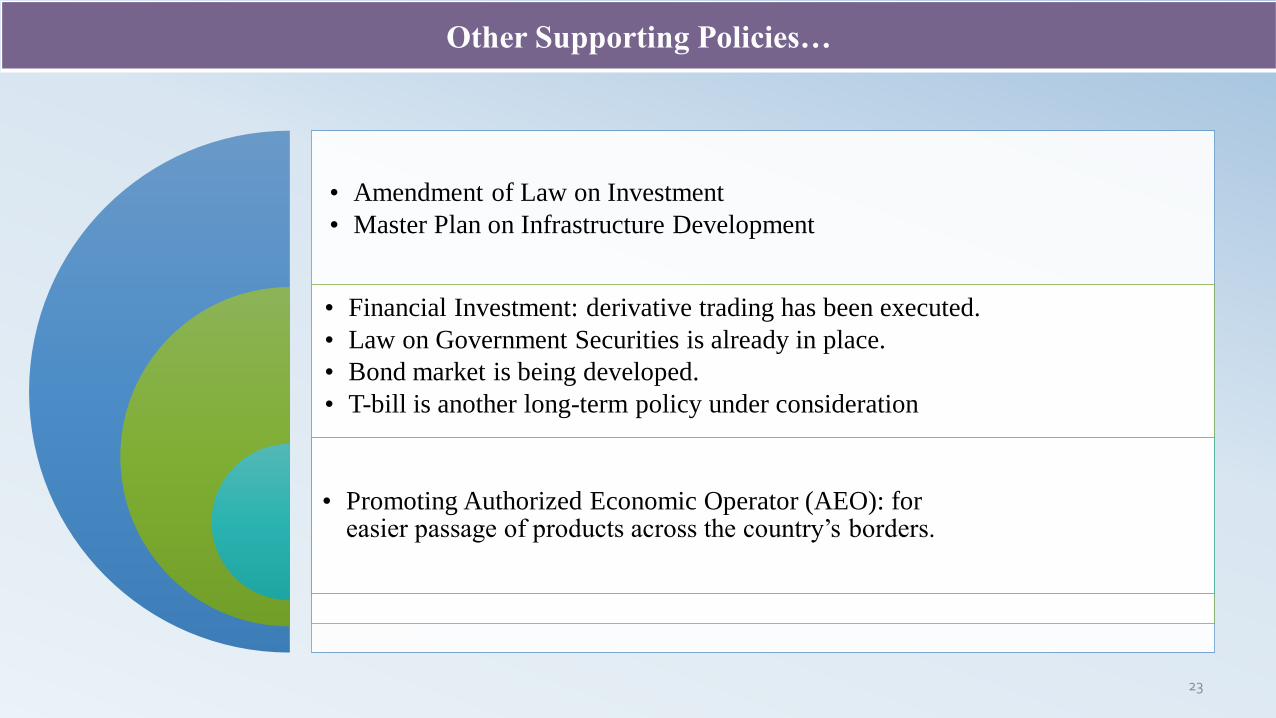
• Amendment of Law on Investment
• Master Plan on Infrastructure Development
• Financial Investment: derivative trading has been executed.
• Law on Government Securities is already in place.
• Bond market is being developed.
• T-bill is another long-term policy under consideration
• Promoting Authorized Economic Operator (AEO): for easier passage of products across the country’s borders.
Other Supporting Policies…
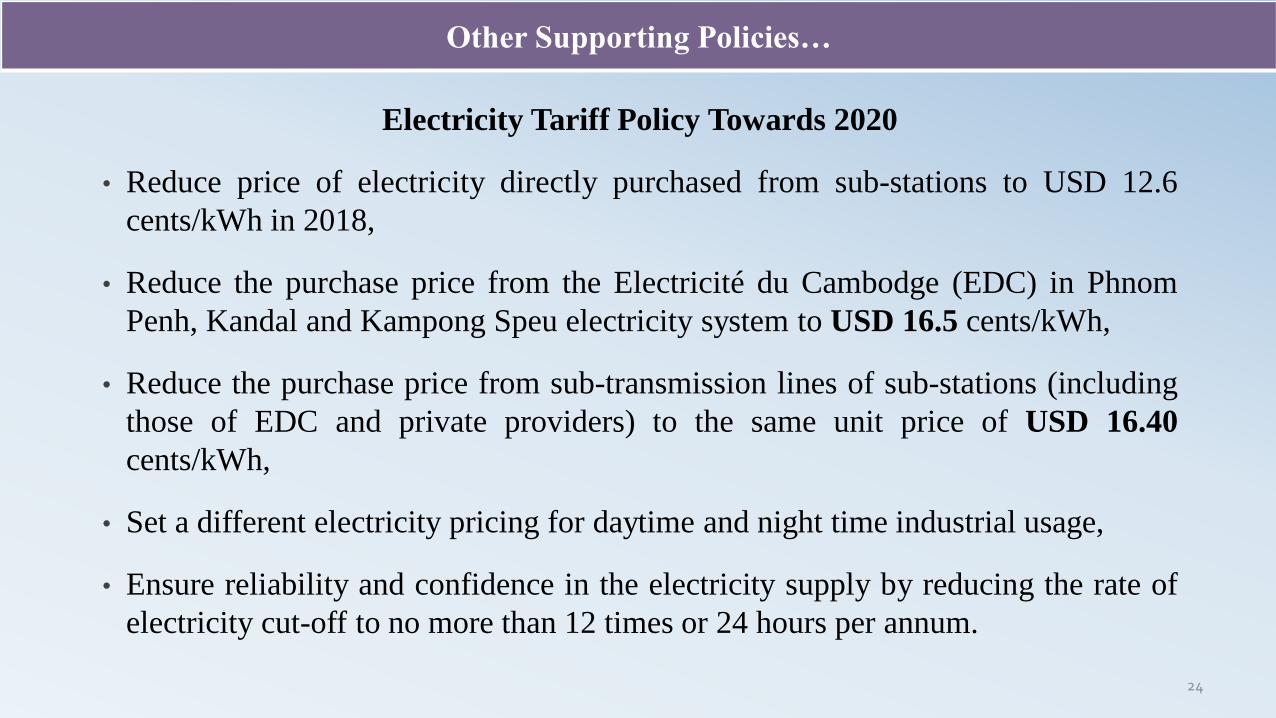
Electricity Tariff Policy Towards 2020
• Reduce price of electricity directly purchased from sub-stations to USD 12.6
cents/kWh in 2018,
• Reduce the purchase price from the Electricité du Cambodge (EDC) in Phnom
Penh, Kandal and Kampong Speu electricity system to USD 16.5 cents/kWh,
• Reduce the purchase price from sub-transmission lines of sub-stations (including
those of EDC and private providers) to the same unit price of USD 16.40
cents/kWh,
• Set a different electricity pricing for daytime and night time industrial usage,
• Ensure reliability and confidence in the electricity supply by reducing the rate of
electricity cut-off to no more than 12 times or 24 hours per annum.
24
Other Supporting Policies…
Thank You!25
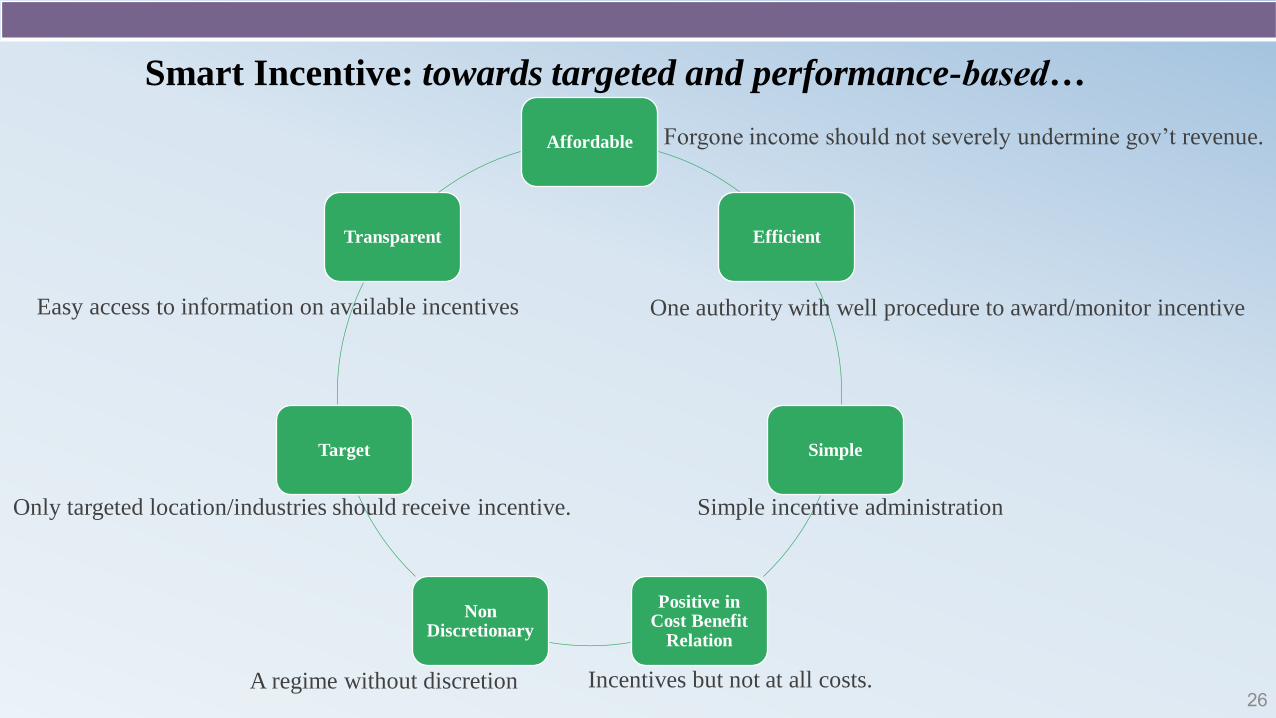
Smart Incentive: towards targeted and performance-based…
26
Affordable
Efficient
Simple
Positive in Cost Benefit
Relation
Non Discretionary
Target
Transparent
Forgone income should not severely undermine gov’t revenue.
Easy access to information on available incentives One authority with well procedure to award/monitor incentive
Only targeted location/industries should receive incentive. Simple incentive administration
A regime without discretion Incentives but not at all costs.