Embed Size (px)
Citation preview

Investor Day
3.20.18
Forward-Looking Statements & Non-GAAP Financial Measures Certain statements contained herein are “forward-looking statements” within the meaning of applicable securities laws and regulations. These forward-looking statements can generally be identified by the use of words such as “anticipate,” “expect,” “believe,” “could,” “estimate,” “feel,” “forecast,” “intend,” “may,” “plan,” “potential,” “project,” “should,” “will,” “would,” and similar words, phrases or expressions and variations or negatives of these words, although not all forward-looking statements contain these identifying words. Forward-looking statements by their nature address matters that are, to different degrees, uncertain, such as statements regarding the estimated or anticipated future results of the combined company following the proposed merger, the anticipated benefits of the proposed merger, including estimated synergies, the expected timing of completion of the proposed merger and related transactions and other statements that are not historical facts. These statements are based on the current expectations of Maple Parent Holdings Corp. (the parent company of Keurig Green Mountain) and Dr Pepper Snapple Group, Inc. management and are not predictions of actual performance. These forward-looking statements are subject to a number of risks and uncertainties regarding the combined company’s business and the proposed merger and actual results may differ materially. These risks and uncertainties include, but are not limited to: (i) the ability of the parties to successfully complete the proposed merger on anticipated terms and timing, including obtaining required shareholder and regulatory approvals and the satisfaction of other conditions to the completion of the proposed merger, (ii) access to significant debt financing for the proposed merger on a timely basis and reasonable terms and the impact such significant additional debt may have on our ability to operate the combined business following the proposed merger, (iii) risks relating to the integration of the Maple Parent Holdings Corp. and Dr Pepper Snapple Group, Inc. operations, products and employees into the combined company and the possibility that the anticipated synergies and other benefits of the proposed merger will not be realized or will not be realized within the expected timeframe and (iv) risks relating to the businesses of Maple Parent Holdings Corp. and Dr Pepper Snapple Group, Inc. and the industries in which they operate and the combined company will operate following the proposed merger. These risks and uncertainties, as well as other risks and uncertainties, will be more fully discussed in a definitive proxy statement that will be filed by Dr Pepper Snapple Group, Inc. with the Securities and Exchange Commission in connection with the proposed merger. While the list of factors presented here is, and the list of factors to be presented in the definitive proxy statement are, considered representative, no such list should be considered to be a complete statement of all potential risks and uncertainties. Any forward-looking statement made herein speaks only as of the date of this document. Neither Maple Parent Holdings Corp. nor Dr Pepper Snapple Group, Inc. is under any obligation to, and each expressly disclaims any obligation to, update or alter any forward-looking statements, whether as a result of new information, subsequent events or otherwise, except as required by applicable laws or regulations. References to pro forma and combined pro forma information reflect Keurig Green Mountain's estimates for the combined company using Keurig Green Mountain's actual 2017 results and analyst consensus estimates for Dr Pepper Snapple Group, Inc., giving effect to the fully leveraged company and estimated synergies, utilizing a tax rate of 26% and do not reflect pro forma financial information presented pursuant to Article 11 of Regulation of S-X. This presentation includes certain non-GAAP financial measures, which differ from results using U.S. Generally Accepted Accounting Principles (GAAP). These non-GAAP financial measures should be considered as supplements to the GAAP reported measures, should not be considered replacements for, or superior to, the GAAP measures and may not be comparable to similarly named measures used by other companies. Non-GAAP financial measures typically exclude certain charges, which are not expected to occur routinely in future periods. The Company uses non-GAAP financial measures internally to focus management on performance excluding these special charges to gauge our business operating performance. Management believes this information is helpful to investors because it increases transparency, and assists investors in understanding the underlying performance of the Company and in the analysis of ongoing operating trends. Additionally, management believes that non-GAAP financial measures are frequently used by analysts and investors in their evaluation of companies, and its continued inclusion provides consistency in financial reporting and enables analysts and investors to perform meaningful comparisons of past, present and future operating results. The most directly comparable GAAP financial measures and reconciliations to non-GAAP financial measures are set forth in the appendix to this presentation and included in the Company’s filings with the SEC. Important Additional Information This communication is being made in respect of the proposed transaction involving Maple Parent Holdings Corp. and Dr Pepper Snapple Group, Inc. The proposed transaction will be submitted to the stockholders of Dr Pepper Snapple Group, Inc. for their consideration. In connected therewith, Dr Pepper Snapple Group, Inc. filed a preliminary proxy statement with the SEC on March 8, 2018, and intends to file further relevant materials with the SEC, including a definitive proxy statement. The definitive proxy statement will be mailed to the stockholders of Dr Pepper Snapple Group, Inc. BEFORE MAKING ANY VOTING OR ANY INVESTMENT DECISION, INVESTORS AND SECURITY HOLDERS ARE URGED TO READ THE DEFINITIVE PROXY STATEMENT REGARDING THE PROPOSED TRANSACTION AND ANY OTHER RELEVANT DOCUMENTS FILED OR TO BE FILED WITH THE SEC CAREFULLY AND IN THEIR ENTIRETY WHEN THEY BECOME AVAILABLE BECAUSE THEY WILL CONTAIN IMPORTANT INFORMATION ABOUT THE PROPOSED TRANSACTION. Investors and security holders may obtain free copies of the proxy statement, any amendments or supplements thereto and other documents containing important information about Dr Pepper Snapple Group, Inc. once such documents are filed with the SEC, through the website maintained by the SEC at www.sec.gov. Copies of the documents filed with the SEC by Dr Pepper Snapple Group, Inc. will be available free of charge on Dr Pepper Snapple Group, Inc.’s website at https://www.drpeppersnapplegroup.com/ under the heading “SEC Filings and Proxy Statements” within the “Investors” portion of Dr Pepper Snapple Group, Inc.’s website. Stockholders of Dr Pepper Snapple Group, Inc. may also obtain a free copy of the definitive proxy statement by contacting Dr Pepper Snapple Group, Inc.’s Investor Relations Department at (972) 673-7000. Maple Parent Holdings Corp., Bob Gamgort (Director and Chief Executive Officer of Maple Parent Holdings Corp.), Ozan Dokmecioglu (Chief Financial Officer of Maple Parent Holdings Corp.), Bart Becht (a Director of Maple Parent Holdings Corp.) may be deemed to be “participants” under SEC rules in any solicitation of Dr Pepper Snapple Group, Inc. stockholders in respect of a Maple Parent Holdings Corp. proposal for a transaction with Dr Pepper Snapple Group, Inc.. Neither Maple Parent Holdings Corp. nor any of the individuals listed above has a direct or indirect interest, by security holdings or otherwise, in Dr Pepper Snapple Group, Inc. or the matters to be acted upon in connection with a potential transaction involving Maple Parent Holdings Corp. and Dr Pepper Snapple Group, Inc., except as will be set forth in the definitive proxy statement regarding the proposed transaction.
2

Today’s Presenters
Bob Gamgort Chief Executive Officer Keurig Green Mountain, Inc.
Larry Young President and Chief Executive Officer Dr Pepper Snapple Group
Jim Trebilcock EVP Chief Commercial Officer Dr Pepper Snapple Group
Patrick Minogue Senior Vice President e-Commerce Keurig Green Mountain, Inc.
Ozan Dokmecioglu Chief Financial Officer Keurig Green Mountain, Inc.
Derek Hopkins Chief Integration Officer Keurig Green Mountain, Inc.
3

Agenda
• KDP Vision
• DPS Overview & Route-to-Market
• KGM Business Model & Capabilities
• KGM Transformation
• KDP Financial Outlook
• Integration Plan
• Interactive Session and Q&A
4

Our Vision is Based on a Simple but Powerful Insight… Hiding in Plain Sight
OUR VISION: A beverage for every need, available everywhere people shop and consume
Ne
ed
s/O
ccas
ion
s
Co
nsu
me
r
Form
ats/
Bra
nd
s
Sho
pp
er
Be
havio
rs
“Retail” O
utlets
5

The US Beverage Market is Attractive WITH SIGNIFICANT WHITESPACE FOR KDP TO EXPAND
LARGE
PROFITABLE
GROWING
Manufacturer/Distributor Retail $ Share 2016 Consumer Packaged Beverages US/CAN $160B
2016 RETAIL SALES $
~23%
AVERAGE EBITDA1
+2%
RETAIL $ CAGR ’11 – ‘16
46%
54%
Top 3 Systems
All Others
“Top 3 Systems” – KO, PEP, DPS portfolios include distribution partnerships. Consumer Packaged Beverage size based on Beverage Digest, Nielsen and Euromonitor; excludes non-packaged formats and alcoholic beverages. 6

While Segment Trends Illustrate the Consumption Shifts on a Macro Level
12
10
8
6
4
2
0
2001 2006 2011 2016
LIQUID REFRESHMENT BEVERAGE ALL-CHANNEL VOLUME 2000-2016
Source: BD Factbook 2017; Liquid Refreshment Beverage includes non-Carb beverages include RTD Coffee & Tea, Sports Drinks, Juice etc.
z
z
CSDs
BOTTLED WATER
NON-CARBS
(bill
ion
s o
f 1
92
oz.
cas
es)
7
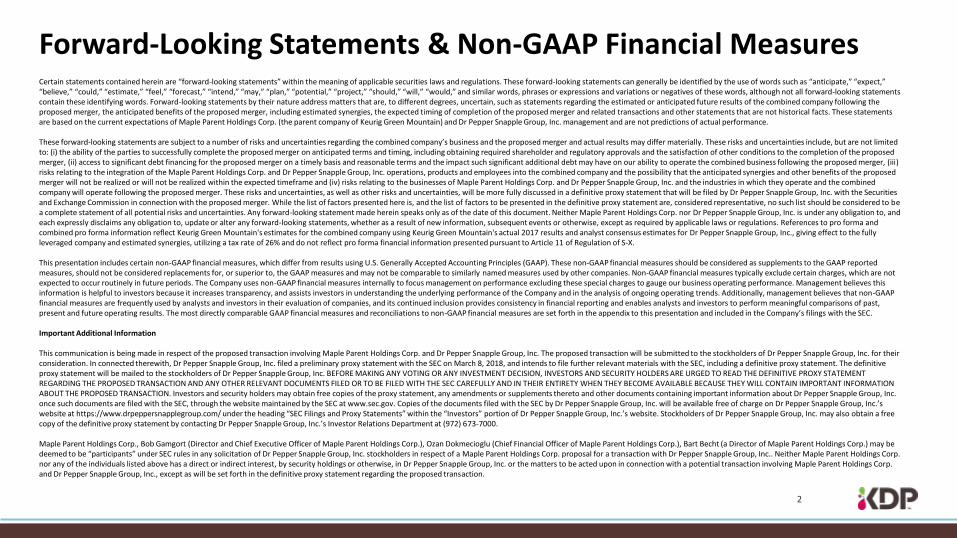
We Need to “Double-Click” to Appreciate the Full Extent of Fragmentation that is Transforming the Beverage Landscape
Source: Beverage Digest Fact Book 2017
2011 2016 Pt. Chg
CSD 24 22 (2)
Bottled Water 12 21 +9
Sports Drink 2 3 +1
Juices 4 3 (1)
Milk 10 9 (1)
Coffee 9 9 -
Tea 4 4 -
Tap Water 20 14 (6)
Colas vs. Flavors
Growth of Ginger
Evolution of Energy
Craft vs. Mainstream
Package Size
CSD
New Packaging Formats
Plain vs. Flavored
Sparkling vs. Still
Enhanced WATER
Traditional vs. Specialty
Cold vs. Hot
Single Serve vs. Drip
Rise of Cold Brew
In Home vs. Away from Home
COFFEE
“Share of Throat”
8

Millennials are Thinking About Beverages Differently… BEVERAGE ATTITUDES - % AGREEMENT
Source: KGM Custom Survey, McKinsey Note: Millennials defined as 18-34
Millenials Vs. All Other
Ages
The most important thing about a beverage is how good it tastes 64% ---
I believe my choice of beverage can change my mood 50% +17%
I like to try new brands of beverages
I like to try new types of beverages
53%
45%
+17%
+11% Beverages with natural/good for you ingredients are worth paying more
I wish the best tasting beverages were better for me
42%
69%
+10%
+8%
9

…Leading to the Fragmentation in Broader Beverage and Growth of Coffee
9%
8% 5%
4% 4%
4%
8% 4%
6%
3% 5%
1% 1%
CSD
BOTTLED WATER
HOT COFFEE
SMOOTHIES
COLD COFFEE
NON-DAIRY MILK
ENERGY DRINKS
4%
WEEKLY PENETRATION 2012 to 2017
Source: Kantar World Panel 2017 Note: Millennials defined as 18 to 39
5 YEAR CHANGE
5 YEAR CHANGE AMONG MILLENIALS*
60%
53%
49%
15%
11%
7%
6%
2017 Penetration
10
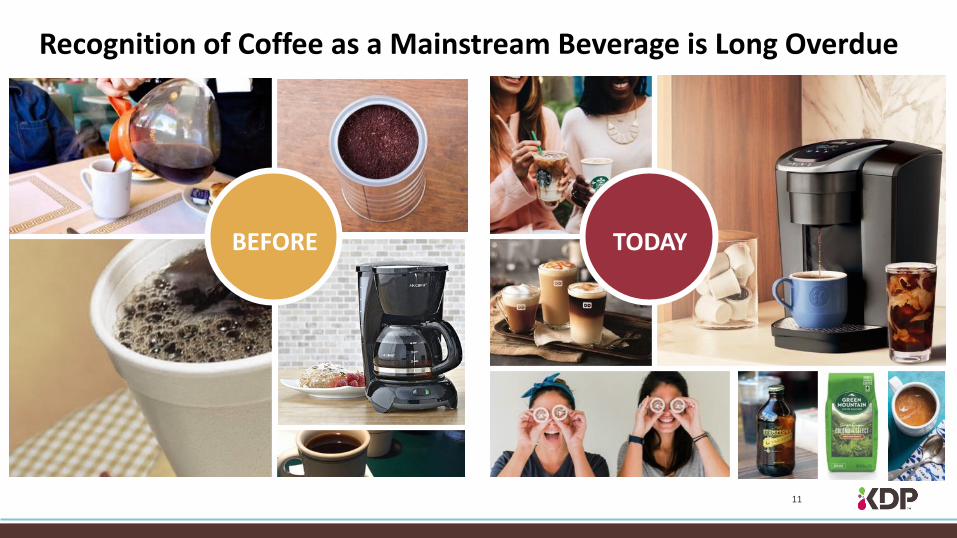
Recognition of Coffee as a Mainstream Beverage is Long Overdue
BEFORE TODAY
11

Coffee’s Continued Future Growth Potential is Strong
OCCASIONS ARE RAPIDLY EXPANDING OUTSIDE OF THE MORNING
87% 80% -7pts BREAKFAST
36% 41% 5 pts MORNING
15% 18% 3 pts LUNCH
19% 26% 7 pts DINNER
Past-week penetration of coffee at time of day
21%
45%
37%
42%
2014 2017
COFFEE SOFT DRINKS
COFFEE HAS BECOME A MAINSTREAM BEVERAGE OF CHOICE FOR TEENS Coffee and soft drink incidence among 13-18 year olds, past-day penetration
HEALTH AND WELLNESS TAILWIND
Source: NCA National Coffee Drinking Trends Survey 2017
Coffee May Protect
Against Cancer,
W.H.O. Concludes
3 Reasons Why Coffee
Is So Good For You
12

Brand Portfolio Needs to be Matched with Universal Availability
Ne
ed
s/O
ccas
ion
s
Co
nsu
me
r
Form
ats/
Bra
nd
s
Sho
pp
er
Be
havio
rs
“Retail” O
utlets
13

Changing Retail Landscape Driven by Significant Changes in Consumers
Source: Kantar Consulting 2017
RETAILER IMPACT
SMALLER HOUSEHOLDS
INCOME BIFURCATION
POPULATION SHIFT TO CITIES
ONLINE EXPANSION
CONVENIENCE & VALUE
STOCK-UP TO FILL-IN
STOCK-UP TO ONLINE
IMPULSE RETAIL GROWTH
CONSOLIDATE FOR EFFICIENCY
FILL-IN OCCASION FROM NON-TRADITIONAL RETAILERS
SMALL OUTLET EXPANSION
CONSUMER MACRO TRENDS
SHOPPER IMPLICATIONS
NEW E-COMM RETAILERS
14

Growth is Shifting to Non-Traditional Food and Beverage Retail Outlets…
$17
$60
$35 $41
$67
$233
SUPERMARKET CLUB DISCOUNTER DRUG AND CONVENIENCE
ONLINE MASS/ SUPERCENTER CHANNEL
FORECASTED RETAIL CHANNEL $ GROWTH 2017-2022
Source: Kantar Retail IQ; Kantar Consulting US Retail Outlook 2018
($ b
illio
ns)
15

…Requiring Manufacturers to have a New Set of Selling and Distribution Capabilities
Combination of selling distribution capabilities to reach all points of purchase
Relevance and efficiency to have influence as retail consolidation accelerates
The ability to partner with online retail and deliver the right packaging formats and new logistics requirements
Direct channel to consumers – both communication and selling
REACH SCALE
OMNI
ACCESS
16

Combined KDP will be a Top 10 Contributor at Retail
RANK PARENT COMPANY SALES ($B) % CHG VS YA
1 PEPSICO 37.3 0.4%
2 KRAFT HEINZ 21.7 -1.4%
3 COCA COLA 19.2 1.2%
4 NESTLE 18.4 -0.6%
5 AB INBEV 16.2 -1.1%
6 GENERAL MILLS 12.2 -3.7%
7 KEURIG DR PEPPER 11.1 2.2%
6 KELLOGG 9.2 -3.5%
7 MARS INC 8.3 2.2%
8 HERSHEY 8.3 1.3%
9 TYSON FOODS 8.2 1.5%
11 CONAGRA BRANDS 8.1 -2.4%
12 MOLSON COORS 8.1 -1.5%
13 CAMPBELL SOUP 7.5 -1.0%
US RETAIL EDIBLES SALES (EX. APPLIANCES)
Source: IRI Multi-Outlet Latest 52 Weeks Ending 12-31-17 Note: KDP includes owned and licensed brands only 17

Broad Brand Portfolio
KDP is Created to Win in the Changing Consumer and Shopper Landscape
Scale Distribution & Selling System
Highly Efficient Business Model
Innovation, Renovation,
M&A and Partnering Capabilities
18

Agenda
• KDP Vision
• DPS Overview & Route-to-Market
• KGM Business Model & Capabilities
• KGM Transformation
• KDP Financial Outlook
• Integration Plan
• Interactive Session and Q&A
19

DPS Portfolio is Winning in the Marketplace AND OUTPACING KEY COMPETITORS
MULO GROCERY DRUG CONV MASS
LRB 1.4% 0.8% -6.2% 0.5% 3.1%
DPS 4.0% 1.9% -1.4% 4.4% 4.8%
DPS exc. Allied 3.1% 1.2% -4.7% 0.9% 4.5%
Competitor A 1.6% 1.5% -9.6% 0.9% 4.0%
Competitor B -2.2% -4.1% -9.5% -4.1% 0.1%
2017 Dollar % Change vs. Year Ago
Source: IRI Unify Calendar FY 2017 20

Success is Driven by Aligning Brands Against Consumer Needs
ENERGIZE REFRESH HYDRATE WHOLESOME INDULGENT
21

Success is Driven by Aligning Brands Against Consumer Needs
ENERGIZE REFRESH HYDRATE WHOLESOME INDULGENT
22

DPS CSDs have Leadership Positions
PEPPER ROOTBEER GINGER ALES
LEMON-LIME GRAPEFRUIT ORANGES
#1 #1 #1 #2
#2 #1 #1 #3
Source: IRI Retail $ Sales 2017 23

DPS is the Flavored Soft Drink Category Leader
DPS Leads Flavor Share DPS Consistently
Outperforms Category DPS CSD Flavors Outperform Their Respective Segments
Non-Cola Dollar Share1 ’15-’17 Retail Sales Growth2
Category
DPS
5.9%
-0.9%
2.2%
8.2%
6.4%
4.0%
Total Ginger Ale
Total Grapefruit
-0.3 %
1.3%
Retail Sales Growth ‘17 vs YA
DPS
39%
COMPANY B
31%
COMPANY A
21%
4% 5%
PVL AO
Total Cola & Pepper
1 FY 2016 & 2017, MULO + C; $RSV 2 IRI MULO + C L52 w/e 11/5/17, US only 24

1 Millward Brown Brand Equity Tracker Q2 and Q3 ’17 2 IRI MULO + C FY 2017
Dr Pepper…A Winning CSD Brand
-2.0%
1.1%
-1.4%
-4.9% -4.8%
3.9%
-0.6%
2.2%
0.5%
-5.0%
-4.3%
6.7%
EQ Vol %Chg vs YA Dollar Vol %Chg vs YA
Total CSD
Outperforming competitors and category2
Ranked most unique CSD by consumers1
Ranked #2 in brand affinity for indulgence need
Consumers love Dr Pepper!
Up +0.3 share pts
vs YAG
#1 #2 #3 #4
25

Canada Dry…The Leader in Ginger Ale
56.1%
6.8%
17.2%
9.2%
10.7%
Canada Dry
Seagram's
Schweppes
Private Label
All Other
+1.2 pts vs YAG
Canada Dry Has 56% Share1 of Ginger Ale and Growing
Equities and positioning to support refresh occasions
2% 2%
7%
12% 10%
6% 8%
7% 8%
5% 6%
2007 2008 2009 2010 2011 2012 2013 2014 2015 2016 2017
11 Straight Years2 of Volume Growth and Counting!
1 IRI MULO + C FY 2017 2 Nielsen XAOC Incl. Conv, Volume % Chg vs. YAG 2007-2015; IRI MULO + C,
Volume % Chg vs. YAG, 2016-2017
26

Snapple…The Leading RTD Flavored Tea Brand
The #1 Tea & JD Brand for Flavor1
#1 #2 #3 #4 #5
Snapple Captures 3 Distinct Consumers3
Successful Launch of 16oz PET2
PET went national in Q4: Fueled +8% growth in 16oz Gained distribution Velocities increased +1.4%
1 Millward Brown Brand Study 2017 Q3/Q4 2 IRI MULO + C Snapple TM (x SUT) Q4 2017 3 IRI Panel Data FY 2017 27

Success is Driven by Aligning Brands Against Consumer Needs
ENERGIZE REFRESH HYDRATE WHOLESOME INDULGENT
28

Bai…The Fastest Growing Flavored Enhanced Water Brand
Bai has the #1 Single SKU in $ Sales in the Flavored Enhanced Water Category & Continues to Grow2
Bai offers a variety of platforms so consumers don’t have to sacrifice on health and flavor
Low Calorie/Sugar
No Artificial Sweeteners Flavorful
#1 + 36% YoY
#2 Flat YoY
1 IRI Bai MULO + C , FY 2014-2017 2 IRI MULO, Latest 52 Weeks Ending 02-25-18
Bai has continuously driven growth across all outlets1
$41
$119
$252
$359
2017 2016 2015 2014
29

Source: IRI Total US MULO, FY 2017
58%
21%
12%
9%
24%
11%
6%
59%
MOTT’S IS THE #1 BRANDED APPLE JUICE MOTT’S IS THE #1 BRANDED APPLESAUCE
Mott’s
Juicy Juice
Tree Top
A/O Juice
Mott’s
Gogo Squeez
Musselman’s
A/O Sauce
Mott’s…The Branded Category Leader
30

DPS Offers a National Incubation Hub for Entrepreneurial Brands in Emerging Categories
For Allieds, DPS partnership provides access to opportunity to scale fast and grow.
• Help brands achieve national distribution
• Ability to sell in and execute programs at point of sale
• Access to industry leading capabilities
• Ability to bundle with bigger brands
31

We have a Proven Growth Model through these Allied Partnerships Reaching Key Consumer Needs #1
Selling Premium Imported Water
+$150M Sales Growth from
‘15 to ‘17
#1 Coconut Water Brand Across all
Channels
#2 Cold Brew Coffee in
the Convenience Channel
+156%
$ Growth CAGR ‘15 to ‘17
+35 pts ACV from ‘15 to ‘17
Only Growing Sports Drink in 2017
+23 pts ACV from ‘15 to ‘17
Source: IRI MULO+C, Calendar Years 2015-2017 32

We Leverage Renovation, Innovation & Our Open System to Meet Evolving Consumer Needs
RENOVATION INNOVATION OPEN SYSTEM
33

Five Distinct Route-to-Market Models Enable Broad Reach of DPS’ US Portfolio
Source: Company data, 2017 U.S. Bottler Case Sales
National Fountain / Foodservice
Company Owned DSD
Independent Distributor DSD (ISO)
Warehouse Direct
30% 20% 30% 10% 10%
Concentrate Sales to COLA Systems
1 2 3 4 5
All Retail Outlets
• Large and Small formats
• Vending
Primarily National and Regional Restaurants
All Retail Outlets
• Large and Small formats
• Vending
Direct to Large and Small Formats for Non-Franchised Brands
Channels Through Which Consumers are Served
34

COLA System Provides Primary Retail Distribution Vehicle for Dr Pepper Brand
National Fountain / Foodservice
Company Owned DSD
Independent Distributor DSD (ISO)
Warehouse Direct
30% 20% 30% 10% 10%
Concentrate Sales to COLA Systems
1 2 3 4 5
SALES COVERAGE DISTRIBUTION
• DPS sales team covers headquarters of top 125 retail accounts
• COLA System sales team covers regional chains & store-by-store selling
• Manufactured and distributed by COLA System Bottlers under long-term contracts
• All classes of trade serviced in designated geographies (ex. national fountain customers)
Source: Company data, 2017 U.S. Bottler Case Sales 35
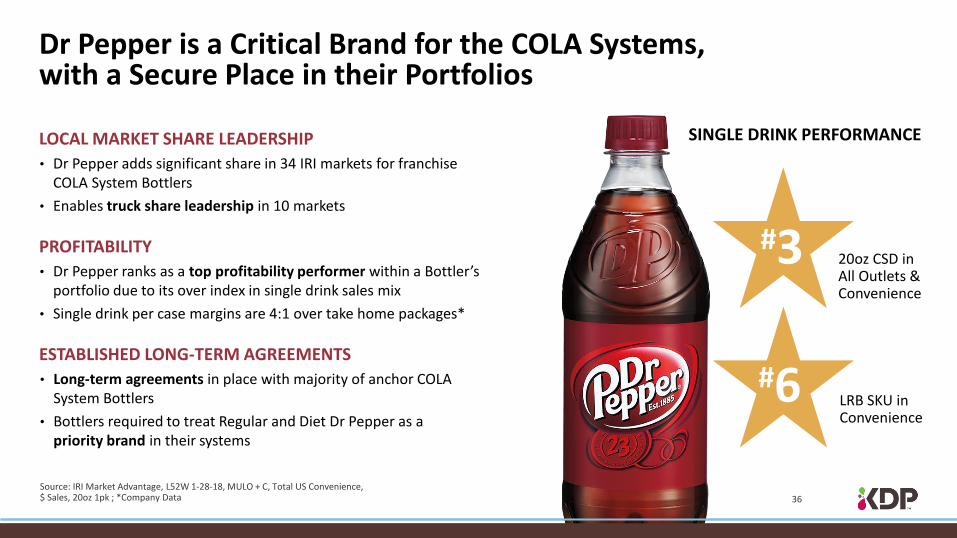
LOCAL MARKET SHARE LEADERSHIP
• Dr Pepper adds significant share in 34 IRI markets for franchise COLA System Bottlers
• Enables truck share leadership in 10 markets
PROFITABILITY
• Dr Pepper ranks as a top profitability performer within a Bottler’s portfolio due to its over index in single drink sales mix
• Single drink per case margins are 4:1 over take home packages*
ESTABLISHED LONG-TERM AGREEMENTS
• Long-term agreements in place with majority of anchor COLA System Bottlers
• Bottlers required to treat Regular and Diet Dr Pepper as a priority brand in their systems
20oz CSD in All Outlets & Convenience
LRB SKU in Convenience
#6
SINGLE DRINK PERFORMANCE
Source: IRI Market Advantage, L52W 1-28-18, MULO + C, Total US Convenience, $ Sales, 20oz 1pk ; *Company Data
Dr Pepper is a Critical Brand for the COLA Systems, with a Secure Place in their Portfolios
#3
36

DPS-Led Selling Organization Ensures Broad Availability on Restaurant Fountains
Source: Company data, 2017 U.S. Bottler Case Sales
National Fountain / Foodservice
Company Owned DSD
Independent Distributor DSD (ISO)
Warehouse Direct
30% 20% 30% 10% 10%
Concentrate Sales to COLA Systems
1 3 4 5
SALES COVERAGE DISTRIBUTION
• DPS sales team covers headquarters for top 200 national restaurant/commissary customers and +2,500 regional accounts
• Dr Pepper is the #1 fountain brand based on availability and #3 based on sales
• National foodservice distributors and restaurant-specific commissaries distribute syrup
• Long-term Freestyle agreement with Coke enables availability in newest fountain technology
2
37

1 Beverage Digest Fact Book 2016 2 The NPD Group/CREST® YE Dec ’17
Dr Pepper’s Ability to Create Incremental Sales has Led it to Become America’s Most Widely Available Fountain CSD
BRAND IN FOUNTAIN
SALES2
#3
BRAND IN FOUNTAIN
AVAILABILITY1
#1
FREESTYLE AVAILABILITY
BENEFIT
38

Source: Company data, 2017 U.S. Bottler Case Sales
National Fountain / Foodservice
Company Owned DSD
Independent Distributor DSD (ISO)
Warehouse Direct
30% 20% 30% 10% 10%
Concentrate Sales to COLA Systems
1 4 5
SALES COVERAGE DISTRIBUTION
• DPS sales team covers headquarters of all retail accounts
• Front line sales team covers store-by-store selling
• Capability to reach full US population
• Selling & distribution at all classes of trade within geographies (ex. Fountain)
• Company-owned DSD distributes Dr Pepper brand in Dallas, Houston and Chicago
2 3
Combination of Company-Owned & Partner Distributors Provide National DSD Reach for Packaged Goods
39

• 3,500 merchandisers in outlet daily
• Ability to pick product from the backroom to fill shelf voids
• Ensures point of sale and display execution
• Cold Drink Execution - 13K full service vending
machines - +600K coolers
• 6,000 trucks; 100 DCs
• Deliver to ALL channels within geography
• Cover 187K outlets: - Large format 24K - Small format 133K - On-premise 30K
• 1,500 frontline account managers in outlet daily
• Strong relationships with chain store managers
• Face-to-face selling for fragmented non-chain trade and local accts
• 70 regional key accounts and National Team
• Coverage of 520 smaller chains within DSD geographies
HEADQUARTER SELLING FRONTLINE SELLING LOCAL MARKET DISTRIBUTION IN OUTLET EXECUTION
DPS Company- Owned DSD
Company-Owned DSD Network Covers 75% of US Population with Access to 200K Points of Distribution
DPS National Accounts
Regional Key Accounts
40

Partner Distributor Key Points
Distribution Partners Provide DSD Coverage in Remaining 25% of US Population
• Provide same DSD access benefits as Company-Owned Operations
• Established, long-term relationships
• Scalable for innovation
Honickman
Columbia
Ritchie Group
Kalil
Polar
Royal Crown - Evansville
Made-Rite
Varni
Choice USA
7UP Bottling - Watertown
Partner Distributor operations
Company-owned bottling operations
DPS and Partner Distribution Franchise Map
Select Partner Distributors
41

Combination of Company-Owned and Independent Distributors Enables National Reach For Emerging Brands…
Source: IRI Total US - Conv 2014-2017 by Quarter; Internal DPS projections
DPS DISTRIBUTION GROWTH – CONVENIENCE CHANNEL
58
4
Future
70+
Post-DPS (2017)
Pre-DPS (2014)
+54
50
0
Pre-DPS (2015)
Future Post-DPS (2017)
60+ +50
56
12
Future Pre-DPS (2014)
70+
Post-DPS (2017)
+44
42

…and Enable the Company to Capitalize on Regional Brand Strength
43

Warehouse Direct Provides Brands with Large National Outlet Coverage and Efficient Delivery Model
National Fountain / Foodservice
Company Owned DSD
Independent Distributor DSD (ISO)
Warehouse Direct
30% 20% 30% 10% 10%1
Concentrate Sales to COLA Systems
1 4
SALES COVERAGE DISTRIBUTION
• DPS sales team covers headquarters for key accounts
• Combination of DPS and broker sales teams cover all other chain and wholesale accounts
• Total business $1.2 billion annual retail sales2
• Product moves through retailer or wholesalers warehouse and logistical networks to stores
• Store-level merchandising support through broker network
2 3
1 Company data, 2017 U.S. Bottler Case Sales 2 Company data, 2017 U.S. Bottler Case Sales; IRI MULO + C l52w 2/25/18, plus projections for mixers in liquor stores and Costco
5
44

Synergy Opportunities within New KDP
National Fountain / Foodservice
Company Owned DSD
Independent Distributor DSD
Warehouse Direct
Concentrate Sales to COLA Systems
1 2 3 4 5
SCALE / EFFICIENCY
Overlap with KGM provides opportunity for efficiency
GROWTH ENGINE FOR NEW PRODUCTS CONTINUITY
Unique allied partnership model
National DSD model that is both effective and scalable
Deep national account coverage – Retail and Foodservice
Secure distribution model for Dr Pepper
45

Agenda
• KDP Vision
• DPS Overview & Route-to-Market
• KGM Business Model & Capabilities
• KGM Transformation
• KDP Financial Outlook
• Integration Plan
• Interactive Session and Q&A
46

Keurig Green Mountain has Transformed Under Private Ownership
FROM TO
Unfocused management drifted into non-core category pursuits and international expansion
Disciplined business model
focused on single-serve coffee in North America
Business model reliant on IP to keep partners and consumers in the closed system
Consumer-friendly, open system
successfully gaining partners based on quality, price, service and innovation
Significant brewer losses limited investment in system marketing and machine innovation
Brewer gross margin trending toward break-even, enabling
significant investment in system marketing and innovation
Non-optimized supply chain and organizational structure led to widespread inefficiencies
Supply chain reinvention and organization restructuring are
delivering significant productivity
Poor cash management and ineffective capital investment strategy limited free cash flow
Best-in-class cash management enables rapid deleveraging
47

KGM Sources of Value Creation are Clear
K G M P R O F I T A B L E G R O W T H
POD GROWTH/MIX
REVITALIZED INNOVATION PIPELINE
REPEATABLE MARKETING MODEL
OWNED BRAND GROWTH
PARTNER VALUE PROPOSITION/ RETENTION
CASH MANAGEMENT
BREWER HH PENETRATION
LOW COST MANUFACTURER
48

A Large Penetration Opportunity is Readily Available
AWARENESS
21M at-home coffee drinking HHs currently not aware of the Keurig system
TRIAL
33M HHs who are aware of Keurig but have not tried to date
REACTIVATION
13M HHs who have owned and used the Keurig system but are no longer active
PENETRATION OPPORTUNITY 67M HHs
126M Total US HHs
92M At Home Drinkers of Coffee 34M Do not drink coffee At Home
71M Keurig Aware 21M Not Aware
33M Aware, never owned
38M Keurig Owners
27M Regularly Use Keurig
13M Lapsed Users
25M Regularly Use Keurig
Source: KGM At Home Omnibus Study July 2017 49

Significant Additional Growth Opportunity has been Quantified KGM/BAIN US HOUSEHOLD PENETRATION RESEARCH
63% 65%
Image Modern Value Quality
20%
TODAY Convenience Variety US Full Potential
HH Penetration Potential
Single-Serve Coffee HH
Penetration
1.5x- 2.5x
France NL
CONSUMER NEED CLUSTERS
50

Growth is Accelerating Across the Total Keurig System
1 Latest 52 weeks ending 2/10/18 2 2017 Y/E vs. previous year
+11% +9%
TOTAL KEURIG BREWER UNIT GROWTH1 TOTAL SINGLE SERVE CATEGORY VOLUME GROWTH1
+7%
HOUSEHOLD PENETRATION GROWTH2
SOURCE: KGM POS Data All Outlets,*All Outlets = MULO Coffee and KGM SS POS from non-reported channels / IRI; NPD Coffeemaker POS Data 51

Keurig’s Innovation Pipeline has Been Revitalized
K G M P R O F I T A B L E G R O W T H
POD GROWTH/MIX
REVITALIZED INNOVATION PIPELINE
REPEATABLE MARKETING MODEL
OWNED BRAND GROWTH
PARTNER VALUE PROPOSITION/ RETENTION
CASH MANAGEMENT
BREWER HH PENETRATION
LOW COST MANUFACTURER
52

Keys to Unlocking Household Penetration Opportunity are Clear
CONVENIENCE
Brewer Size
Aesthetics
Coffeehouse Beverages
App Control of Brewer
Coffeehouse Beverages
Strength Strength
Large Batches
Brewer Pricing
QUALITY IMAGE MODERN VALUE VARIETY
Strength
High Quality Brewer
BREWER ATTRIBUTES
CONSUMER NEED CLUSTERS
53

Pipeline of New Products are Addressing Core Consumer Needs
FALL ‘17 SPRING ‘18 2019 2019 FALL ‘18 FALL ‘18 SUMMER ‘17
K-Select™ K-Elite™ NEW K-Mini™ K-Café™ K-Compact™
QUALITY
IMAGE
VARIETY
CONVENIENCE VALUE IMAGE
MODERN
MODERN
VARIETY
IMAGE
MODERN
VALUE
VARIETY
TO BE ANNOUNCED AT FUTURE DATE
54

Brewer Marketing Model has Been Optimized
K G M P R O F I T A B L E G R O W T H
POD GROWTH/MIX
REVITALIZED INNOVATION PIPELINE
REPEATABLE MARKETING MODEL
OWNED BRAND GROWTH
PARTNER VALUE PROPOSITION/ RETENTION
CASH MANAGEMENT
BREWER HH PENETRATION
LOW COST MANUFACTURER
55

Latest Prophet Brand Relevance Index Underscores Significance of Keurig Brand Among US Consumers
~13,500 customers surveyed l 275 brands l 27 industries
18 PLACES
VS. 2016
#15
+
56

“Brew The Love” campaign, featuring James Corden, was launched late 2017
57

KGM has a Broad Portfolio of Owned and Licensed Brands
K G M P R O F I T A B L E G R O W T H
POD GROWTH/MIX
REVITALIZED INNOVATION PIPELINE
REPEATABLE MARKETING MODEL
OWNED BRAND GROWTH
PARTNER VALUE PROPOSITION/ RETENTION
CASH MANAGEMENT
BREWER HH PENETRATION
LOW COST MANUFACTURER
58

KGM has a Broad Portfolio of Owned and Licensed Brands
59

TOP K-CUP® POD BRAND
IN TOTAL RETAIL SALES
60

NEW LOGO/PACKAGE
The Flagship Green Mountain Brand was Relaunched in 2017
OPTIMIZED ASSORTMENT SEASONALS MAKEOVER
PRODUCT NEWS NEW AD EXECUTIONS DIGITAL/SOCIAL
From 47 to 30 Varieties: Core, Flavors, Single Origins
New Single Origin subline Focus: Dark Magic & Sumatra Reserve
Website/Digital Overhaul & Social Activation
61

…impact of New Marketing Programs was felt immediately
Q1’16 Q2’16 Q3’16 Q4’16 Q1’17 Q2’17 Q3’17 Q4’17
-3.2% -2.9%
-2.6%
-1.5%
-0.6%
0.3% 0.6%
0.9%
EQ SALES SHARE (EX CLUB) GROWTH
Q1’18
0.4%
62

#1 SELLING SKU IN KEURIG SYSTEM
63

Donut Shop Marketing Programs Start in May 2018
Campaign launch 5/14/18
+50% INVESTMENT DIGITAL
PARTNERS PRECISION
DIGITAL DIGITAL RADIO
SOCIAL/PR PRODUCT NEWS
TV ADVERTISING
64

65

Laughing Man KGM’s Leading Mission-Driven Brand Offering
NEW PACKAGING, BAG COFFEE & RECYCLABLE PODS
MEDIA LAUNCH (3/12) SHOPPER MARKETING NATIONAL FSI
2 0 1 8 S U P P O R T P L A N
Partnership with Hugh Jackman
A portion of sales support the Laughing Man Foundation
66

KGM is Expanding its Position in Premium Bagged Coffee in 2018
Spring 2018 Launch
Retail pricing competitive with
Mainstream brands
Joint display activation with
K-Cup® pods
Leverage K-Cup® pod Promotion
Events
KEY HIGHLIGHTS
67

We’ve Enhanced Value Proposition we Offer to Brand Partners
K G M P R O F I T A B L E G R O W T H
POD GROWTH/MIX
REVITALIZED INNOVATION PIPELINE
REPEATABLE MARKETING MODEL
OWNED BRAND GROWTH
PARTNER VALUE PROPOSITION/ RETENTION
CASH MANAGEMENT
BREWER HH PENETRATION
LOW COST MANUFACTURER
68

KGM Offers Unmatched Value for Our Brand and Private Label Partners
COMPETITIVE POD PRICING
THE HIGHEST QUALITY
PRODUCT
ACCESS TO KEURIG’S RETAIL
CHANNELS
PARTNER BRANDS FEATURED IN KEURIG ADS
CURBSIDE-ACCEPTABLE
RECYCLABLE CUP
EXCLUSIVE ACCESS TO
KEURIG INSIGHTS TRACKER
69

100% of Keurig K-Cup Pods will be Recyclable in 2020
2016
BETA test for recyclable K-Cup pods; 4 SKUs
available online only
100%
2018 EOY
Target for 100% of K-Cup pods to be recyclable in Canada
2019
Production and availability increases
in the US
100% TARGET
2020 EOY
All K-Cup pods are recyclable
2017
Expansion into Canada begins
70

Brewer and Pod Growth have Benefited by Unique Capabilities in E-Commerce and Away From Home
K G M P R O F I T A B L E G R O W T H
POD GROWTH/MIX
REVITALIZED INNOVATION PIPELINE
REPEATABLE MARKETING MODEL
OWNED BRAND GROWTH
PARTNER VALUE PROPOSITION/ RETENTION
CASH MANAGEMENT
BREWER HH PENETRATION
LOW COST MANUFACTURER
71

Three Distinct KGM Route-to-Market Models Provide Broad Reach for Brewers and Pods
Away from Home Retail Sales
E-Commerce Sales
At Home Retail Sales
1 2 3
72

KGM at Home Retail is Designed to Maximize Expansion of the Keurig System Over a Diverse Customer Base
BUSINESS MIX
EXAMPLE CUSTOMER
SALES COVERAGE
DISTRIBUTION
DEPARTMENT / SPECIALTY CLUB / MASS
Pods
Broker Coverage Direct Sales Teams
Warehouse Distribution
Broker Coverage
Appliances Pods
KEURIG “SYSTEM” EMPHASIS
GROCERY
73

CHANNEL PARTNERS
KGM Away From Home Provides Unique Access to On-the-Go, Workplace and Hospitality Consumption Occasions
OUTLETS
Office
Dining
Convenience
Hospitality
+ Network of
~400 distributors
74

Keurig System has Experienced Success in Away From Home Channels
7to1 PREFFERED
IN SINGLE SERVE
20% OF ALL U.S.
WORKPLACES
COMMERCIAL BREWERS IN
800K HOTEL BREWERS
IN THE US
1st SINGLE SERVE
COFFEE IN OFFICES
*Source: Distributer and Away from Home Decision Maker Study, 2016; Omnibus 2017; KGM Install Base analysis 75

E-Commerce Continues to Advance into Grocery Territory MULTIPLE METRICS INDICATE POTENTIAL FOR SUSTAINED SHARE MIGRATION
28% US
UK 40%
Upside Among Early Adopters GROCERY SHARE OF SPEND ONLINE AMONG ECOMMERCE SHOPPERS
Source: Kantar Consulting Digital CommerceScope (2017)
5%
8%
6%
5% 6%
4%
CLICK-AND-COLLECT* SUBSCRIPTION
AUGUST 2016
HOME DELIVERY
AUGUST 2017
% OF SHOPPERS WHO USE ONLINE FULFILLMENT TO PURCHASE
CONSUMABLES
Penetration Expansion
76

KGM is an E-Commerce Leader
#1 SITE IN FOOD
& BEV
DIRECT TO CONSUMER
#1 ITEM ON AMAZON
GROCERY
ONLINE SHARE
LEADING OFFLINE SHARE
Sources: Internet Retailer - Ranking of Top eCommerce Sites 2017; Based on Average Position on Amazon Grocery and Gourmet Food Rankings 52wks ending 3/18/2018; Based on comparison of internal Keurig, One Click Retail, IRI and NPD share measures 52wks ending 3/18/2018
77

DIRECT TO CONSUMER
KGM E-Commerce Capabilities Enable Consumer Reach at Multiple Points
PURE-PLAYS OMNI-RETAILERS
KGM ENABLERS
Data Science & Analytics
Digital Shelf Management
E-Commerce Supply Chain
Digital Marketing Integration
78

• Subscription is 40% of Keurig.com Sales
• Subscribers generate 2x sales vs. non subscribers
Keurig.com Moving from Auto-Delivery to Auto-Replenishment
+45% SUBSCRIBER GROWTH*
• Connected brewer platform allows for true auto-replenishment
• Implemented on Keurig.com and with select retail partners
• Resolves #1 customer frustration with auto-delivery of pantry overload
* Latest 12 months 79

Keurig’s Position with Pure-Play E-Commerce Retailers is Accelerating System Growth
KeurigCompatible
Other SingleServe
Roast &Ground
Ready toDrink
All Other
AMAZON COFFEE $ SHARE
57%
12% 16% 7% 7%
#1 share at Amazon in
both coffee and coffee makers
Amazon Grocery
Amazon Coffeemaker
Source: One Click Retail L52WKS ending 3/3/18 80

KGM E-Commerce Capabilities have the Potential to Accelerate DPS Brands Online
ADVANCED CONSUMER TARGETING
E-COMMERCE ENABLED SUPPLY CHAIN
E-COMMERCE AWARE PRICING AND PROMOTION
DIGITAL SHELF MANAGEMENT
DATA SCIENCE AND ANALYTICS
The Keurig E-Commerce Growth Toolkit
81

Agenda
• KDP Vision
• DPS Overview & Route-to-Market
• KGM Business Model & Capabilities
• KGM Transformation
• KDP Financial Outlook
• Integration Plan
• Interactive Session and Q&A
82

Productivity and Cash Management Drive Adj. EBITDA Growth and Margin Expansion, Enabling Rapid Deleveraging
K G M P R O F I T A B L E G R O W T H
POD GROWTH/MIX
REVITALIZED INNOVATION PIPELINE
REPEATABLE MARKETING MODEL
OWNED BRAND GROWTH
PARTNER VALUE PROPOSITION/ RETENTION
CASH MANAGEMENT
BREWER HH PENETRATION
LOW COST MANUFACTURER
83

KGM Transformation Delivered Meaningful Performance Improvement
Calendar Year1
2015 2017 2-Yr CAGR
Pod Volume (B) 10.5 11.3 3%
Net Sales ($M) 4,392 4,135 (3%)
Adj. Op. Income ($M)
Adj. Operating Margin
821
18.7%
1,069
25.8%
14%
710 BPS2
Net Debt ($B) 5.7 3.3
Net Debt/ Adj. EBITDA 5.5x3 2.7x
1 Actual results presented on a 52-week basis 2 Change from 2015 to 2017 3 Leverage at time of JAB acquisition in March 2016
Note: Operating Income metrics are non-GAAP financial measures. See Appendix for GAAP Reconciliations. 84

Strategic Pricing of K-Cup Pods Addresses Largest Barrier to Consumer Adoption
Source: 2016 Coffee Consumer Survey. Percent of non-owners citing as a barrier to single cup system adoption.
0
10
20
30
40
50
60
70
Pod Price Brewer price Makes LargeBatches
EnvironmentalPod Price
Brewer Price
TOP CONSUMER REASONS FOR NOT OWNING A SINGLE CUP COFFEE MAKER – 2016
%
%
%
%
%
%
%
%
85

Retail Single Serve Pod Pricing is Approaching Key Consumer Thresholds
1Starbucks, Dunkin’ Donuts, Peet’s 2GMCR, Maxwell House, Folgers
Source: US Pricing IRI MULO; April 2017 KGM Van Westendorp Pricing Study
Under $0.50, ~90% no longer find K-Cup pods “too expensive”
At $0.30, over 75% find K-Cup pods “a bargain”
OF CONSUMERS OUTSIDE OF THE KEURIG SYSTEM:
US RETAIL PRICE-TIER TRENDS -- $/POD
Mainstream Brands2
Private Label
Premium Brands1
$0.78 $0.75
$0.73 $0.71
$0.69
$0.56 $0.58
$0.55 $0.53
$0.50 $0.46
$0.43 $0.40
$0.37
$0.34
$0.20
$0.30
$0.40
$0.50
$0.60
$0.70
$0.80
$0.90
2014 2015 2016 2017 2018E
86
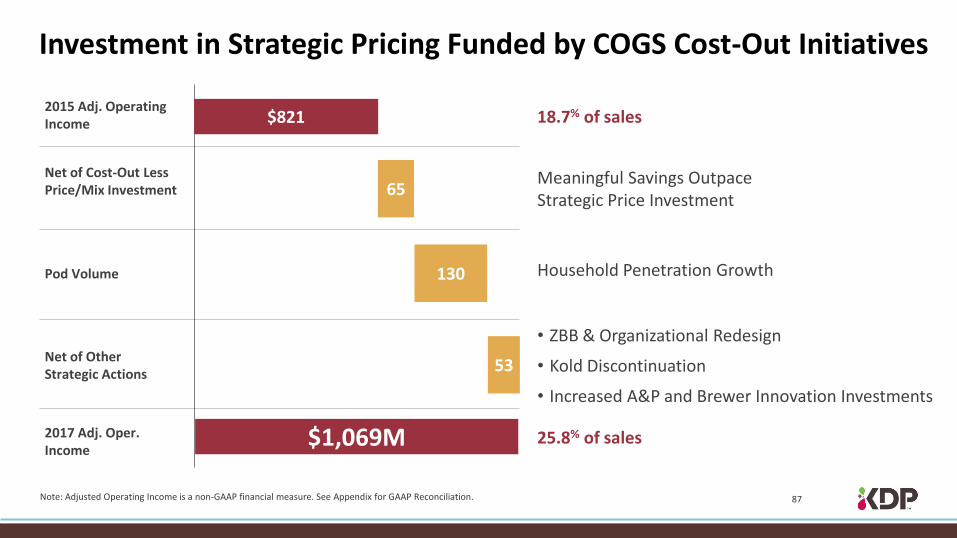
Investment in Strategic Pricing Funded by COGS Cost-Out Initiatives
2015 Adj. Operating Income
Net of Cost-Out Less Price/Mix Investment
Pod Volume
Net of Other Strategic Actions
2017 Adj. Oper. Income
$821
130
53
$1,069M
18.7% of sales
25.8% of sales
65 Meaningful Savings Outpace Strategic Price Investment
Household Penetration Growth
• ZBB & Organizational Redesign
• Kold Discontinuation
• Increased A&P and Brewer Innovation Investments
Note: Adjusted Operating Income is a non-GAAP financial measure. See Appendix for GAAP Reconciliation. 87

Multiple Efficiency Initiatives have Generated Productivity and Cash
• Redesigned existing brewers to improve quality and economics
• Introduced new brewers addressing consumer needs
• Improved brewer and direct material procurement practices
• Adopted clean-sheet approach on major inputs
• Implemented ZBB and organization redesign
• Initiated zero-basing of manufacturing and logistics operations
• Mandated cost leadership in pod manufacturing
DESIGN TO VALUE
PROCUREMENT OVERHEAD MANAGEMENT
SUPPLY CHAIN REINVENTION
• Improved working capital management and cash conversion cycle
• 2017 Adj. EBITDA to cash conversion >160%
WORKING CAPITAL
88

OPERATING WORKING CAPITAL % OF SALES
Strong Cash Flow Generation has Enabled Rapid Deleveraging
DEBT LEVERAGE
MAR ’16*
DEC ‘17
MAR ’16* DEC ‘17
15%
(17%)
2.7x 5.5x
*At JAB Acquisition date
3200 BPS improvement
$2.4B debt reduction
Significant Debt Reduction Drives
Optionality
Industry-Leading Improvement
• Inventory Reduction
• Receivable Terms Improvement
• Extended Payment Terms
Note: Reflects Net Debt/TTM Adjusted EBITDA
Note: Operating Working Capital defined as Trade receivables + inventory less accounts payable
• Rapid Deleveraging
• Multiple Rating Agency Upgrades
89

Keurig Green Mountain Stand-Alone Outlook EXCLUDES DEAL SYNERGIES
Calendar Year1
$B USD 2015 2017 2018 Outlook
Net Sales $4.4 $4.1 ~Flat
Adj. EBITDA $1.0 $1.2 +9% to +12%
Adj. EBITDA Margin
23% 29% +200 bps to +300 bps
1 2015 and 2017 actuals presented on a 52-week basis
Note: Adjusted EBITDA metrics are non-GAAP financial measures. See Appendix for GAAP reconciliation.
HH Penetration gains drive MSD volume growth, combined with moderation in strategic pricing, enables 2-3% revenue growth 2019 and beyond
Pod Supply Chain efficiency program, combined with improved brewer sourcing, delivers continued annual margin improvement
90

Agenda
• KDP Vision
• DPS Overview & Route-to-Market
• KGM Business Model & Capabilities
• KGM Transformation
• KDP Financial Outlook
• Integration Plan
• Interactive Session and Q&A
91

Keurig Dr Pepper Financial Outlook MERGER CREATES POWERFUL COMBINATION EXPECTED TO DRIVE ACCELERATED FINANCIAL PERFORMANCE
1 KGM actual results (52 weeks) plus DPS actual results 2 2018 reflects full year KGM management estimates for KDP on a pro-forma basis 3 2018 Adjusted diluted EPS burdened by full year pro-forma interest expense of ~$600M and assumes 1.4B shares outstanding and an effective tax rate of ~26% 4 2018-2021 CAGR reflects KGM management estimates for KDP and assumes 1.4B shares outstanding 5 Preliminary PPA adjustment as shown in Proxy on 1/31/18 approximating $65M / $0.04 per diluted share; subject to final adjustment post merger closing 6 Pro-forma 2018 Adjusted diluted EPS after Preliminary PPA adjustment
Note: 2017 Adjusted EBITDA metrics and Adj. Diluted EPS are non-GAAP financial measures. See Appendix for GAAP Reconciliations.
$B USD, except per share data 20171 PRO-FORMA 20182 ’18 - ’21 CAGR4
Net Sales $10.8 1 - 2% 2 - 3%
Adj. EBITDA $2.8 7 – 8% 11 - 12%
Adj. EBITDA Margin 26% +100 to +150 bps +600 to +700 bps
Adj. Diluted EPS N/A $1.06 - $1.113 15 - 17%
Preliminary Purchase Price Accounting (PPA) Adjustment
N/A $0.045 N/A
Adj. Diluted EPS After Preliminary PPA Adjustment
N/A $1.02 - $1.076 15 – 17%
92

Key Highlights of KDP Outlook
NET SALES • 2018 KDP growth of 1 – 2%, as MSD pod volume growth is moderated due to continued strategic pricing at KGM
• 2019–2021 KDP growth accelerates to the overall combined industry growth rate of 2–3%, as KGM revenue growth increases to pod category volume growth rate due to moderation of strategic pod pricing
ADJ. EBITDA
• 2018 Pro-Forma Adj. EBITDA growth of 7–8%, driven by revenue growth and margin expansion, primarily on KGM business
• 2018–2021 Adj. EBITDA CAGR of 11–12%, as KGM core business realizes margin improvement, DPS performance continues in line with historical trends and $600M of deal synergies are phased in at approximately $200M/year between 2019-2021
ADJ. DILUTED EPS
• 2018–2021 Adj. EPS CAGR of 15–17%, driven by Adj. EBITDA growth, combined with deleveraging (target below 3.0x in 2-3 years)
DIVIDEND • $0.60 per share annually, will be reviewed regularly for potential increase
93

Detailed Synergy Framework Developed to Deliver $600M in Savings
$8.4B Total Combined
Baseline Cost
~$600M Total
Synergies1
Synergies of ~$200M/yr 2019-2021
SUPPLY CHAIN OVERHEAD
Manufacturing (COGS) • Minimal manufacturing synergies due to product
format and other differences
Direct Spend (COGS) • >$500M in direct spend category overlap • $2.8B in non-overlap categories
Logistics Network (Distribution) • Optimize 3PL footprint • Increase warehouse utilization • Increase transportation utilization
INDIRECT SPEND • Overlapping vendors • New economies of scale
SG&A
Support Functions • Primarily duplicative support functions
Advertising & Promotion • Agency optimization • Non-working expenditure scale • Media purchasing leverage
1Costs to achieve of $750M
94

KGM Targeted Acquisition Synergies of 9% are in line with Comparable Transactions
0
2
4
6
8
10
12
14
PepsiCo / Quaker (2000)
Diageo / Seagram Brands (2000)
Cadbury Schweppes
Snapple (2000)
Nestlé / Ralston (2001)
Unilever / Bestfoods
(2001)
Pernod Ricard / Allied
Domecq (2005)
Danone / Numico (2007)
Britvic / C&C (Soft Drinks)
(2007)
Pernod Ricard / V&S
(2008)
InBev / Anheuser
Busch (2008)
Cadbury / Kraft (2010)
SABMiller / Fosters (2012)
AB Inbev / Grupo
Modelo (2012)
Tyson / Hilshire (2014)
Smucker's / Big Heart
Pet Brands (2015)
Heinz / Kraft (Announced)
(2015)
Heinz / Kraft (Research Estimates)
(2015)
Snyder's Lance /
Diamond Foods (2015)
AB InBev / SAB Miller
(2015)
Danone / Whitewave
(2016)
KGM / DPS (2018)
($ in mm)
Synergies Value 350 250 50 260 750 393 275 19 200 2,250 800 175 1,000 300 200 1,500 2,287 75 1,400 300 600
Target LTM Revenue
5,072 2,525 769 2,766 8,721 3,142 3,618 193 1,493 16,917 9,756 2,365 7,634 3,996 2,299 18,293 18,293 872 16,471 4,012 6,690
Food Beverage
Beverage Median: 9.9% Food Median: 8.2%
% o
f Ta
rge
t Sa
les
%
%
%
%
%
%
%
%
12.5%
13.4% 13.3% 13.1%
8.2%
12.5%
8.6% 8.5% 9.0%
6.9%
9.9%
6.5%
9.4%
8.6%
7.6%
9.8%
8.2% 7.4% 7.5% 8.7%
7.5%
Source: Company research reports, public filings and news articles Note: Dashed areas indicate announced upward revision of synergy estimates. Medians include revised estimates and exclude Heinz / Kraft research estimates. Synergy value figures are as of revised estimates. Figures converted to USD using daily exchange rates as of announcement date. 95

DISTRIBUTION CENTERS
KGM
DPS
WAREHOUSE AND TRANSPORTATION NETWORK
Key Principles
Existing distribution footprint presents opportunity for synergy capture:
• Spend base of $1B
• Integrate distribution network and realize synergies from overlap
• Leverage scale of combined distribution centers
• Optimize use of transportation assets and delivery to shared customers
Distribution centers located in similar geographies
Excess warehouse capacity and capability to further expand DPS-owned locations
Overlap in KGM and DPS direct-to-warehouse customer delivery locations
Distribution Network Optimization Represents Significant Savings Opportunity
96

Procurement Offers Another Significant Synergy Opportunity
Direct Spend: $3B Spend Base
Indirect Spend: $2B Spend Base
Consolidate supplier base for overlap direct spend categories
Collaborate with consolidated supplier base to leverage scale efficiencies
>$500M in overlapping direct spend categories identified:
• Packaging
• Direct Materials
Indirect vendor consolidation
Economies of scale on previously minor spend categories
DIRECT AND INDIRECT
PROCUREMENT STRATEGIES
97

KGM FY stand-alone results:
Perspective on KDP Financial Results in 2018
DPS Stub Year and other impacts: • DPS financial results to be consolidated for ~6 months
• Acquisition interest expense for ~6 months
• No acquisition synergies expected
• Weighted Avg. Diluted Shares O/S estimated at 870M to 900M
• Final Purchase Price Accounting adjustments1
• Effective tax rate of ~26%
Consolidated
2018 KDP Guidance to be provided
following deal close
Net Sales Adj. EBITDA Adj. EBITDA
Margin Vs PY
~$4.1B ~$1.3B +200 bps to +300 bps
1 Preliminary Purchase Price Accounting adjustments identified to-date ~$65M; subject to final adjustment post merger closing
FINANCIAL REPORTING IN 2018 WILL BE IMPACTED BY DEAL CLOSE TIMING, ALONG WITH RELATED EXPENSES/ADJUSTMENTS
98

KDP Commitment to Investment Grade Profile
BUSINESS STRENGTHS
BALANCED FINANCIAL
POLICY
LONG-TERM ANCHOR
SHAREHOLDERS
Significant scale with North America focus
Expanding profit margins and strong cash flow generation
Rapid deleveraging, <3.0x in 2-3 years
Dividend policy to return cash to shareholders
Committed long-term anchor shareholders in JAB, JAB’s partners and Mondelez
Proven management team that is personally invested
99

Broad Brand Portfolio
KDP is Created to Win in the Changing Consumer and Shopper Landscape
Scale Distribution & Selling System
Highly Efficient Business Model
Innovation, Renovation,
M&A and Partnering Capabilities
100

Combined Brand Portfolio Enhances Scale and Extends into Higher Growth Segments
Dr Pepper Snapple Keurig Green Mountain
Ow
ne
d /
Inve
ste
d
Alli
ed
/ P
artn
er
DPS Brand
1McKinsey Retail Dollar Estimates for 2011 to 2016, based on Beverage Digest, Nielsen and Euromonitor; US + Canada; excludes non-packaged formats (e.g. CSD Fountain, Coffee Shop Retail locations)
CSDs Juice Water Sport / Energy RTD Tea RTD
Coffee SS Coffee Tea
(1%) to 1% Non-Colas +1 to 2%
(2%) to 0% Coconut +10%
3% to 6% 6% to 10% 6% to 10% +10% +10% 0% to 2% Category
Retail $ Trends1
101

Combined Capabilities Creates a Selling and Distribution Powerhouse SEVEN DISTINCT ROUTE-TO-MARKET MODELS OFFERS NEAR-UNIVERSAL COVERAGE
COLA System
Fountain & Foodservice
Company-Owned
DSD
Independent Distributor
Partners
Warehouse Direct
Maintains existing Dr Pepper brand strength
AT HOME E-COMM AWAY FROM HOME
Provides access to impulse outlets and hands-on merchandising for trial, brand building and innovation across both portfolios
Improves scale and relevance with key customers
Enables cost synergies
Enables complete away from home beverage solution
Leverages KGM E-Commerce capabilities across both brand portfolios
COLA AND FOUNTAIN DSD WAREHOUSE DIRECT AND AT HOME
E-COMM AND AWAY FROM HOME
1 4 2 3 5 6 7
Strengths
Strengths
Strengths
CONTINUITY GROWTH EFFICIENCY GROWTH
102

Near-Term Opportunities
Forto Energy Shot Expansion
Peet’s RTD Distribution
K-Cup Pod Expansion in Convenience / Small Format
DPS Expansion into E-Comm &
Away from Home
103

Agenda
• KDP Vision
• DPS Business Overview & Route-to-Market
• KGM Business Model & Capabilities
• KGM Transformation
• KDP Financial Outlook
• Integration Plan
• Interactive Session
• Q&A
104

Focused Integration Management Office Will Enable Seamless Integration and Maximize Value Capture
Fully dedicated core team of senior level leaders from both businesses
Team based in
Plano, TX
Direct report into KDP CEO
Responsible and accountable for delivery of all integration steps and capture of synergies
105

Procurement Logistics Organization Design ZBB
Revenue & Growth New Product Commercialization
Value capture & financial baselining
TRAVIS WADE
Master planning
TBD
Org, talent, culture & communications
JAXIE ALT
Structure of the Integration and Value Capture Teams
OTHERS TO BE NAMED
Integration Management Office – 100% dedicated
Initial value capture acceleration streams
CIO
DEREK HOPKINS
Value capture & synergy acceleration
PAUL ARMOUR
EXTER
NA
L AD
VISO
RS
106

Agenda
• KDP Vision
• DPS Business Model & Capabilities
• KGM Business Model & Capabilities
• KGM Transformation
• KDP Financials Outlook
• Integration Plan
• Interactive Session and Q&A
107

Beverage & Innovation Immersion
Coffee
Innovation
5 Groups 5 Stations
12 Mins / Station
Brewer Innovation
Connected Brewers
DPS Brands & Innovation
DPS Brands & Innovation
108

Appendix
109
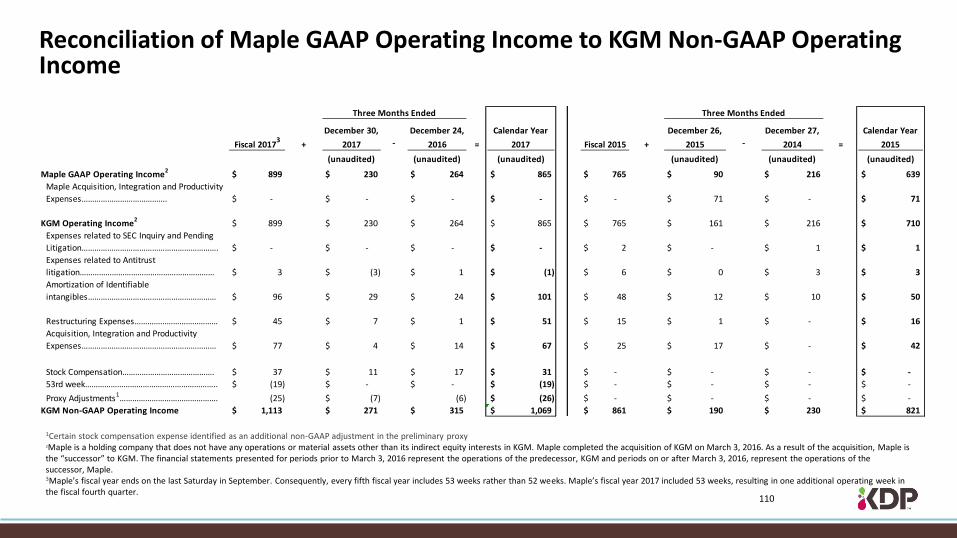
Reconciliation of Maple GAAP Operating Income to KGM Non-GAAP Operating Income
1Certain stock compensation expense identified as an additional non-GAAP adjustment in the preliminary proxy 2Maple is a holding company that does not have any operations or material assets other than its indirect equity interests in KGM. Maple completed the acquisition of KGM on March 3, 2016. As a result of the acquisition, Maple is the “successor” to KGM. The financial statements presented for periods prior to March 3, 2016 represent the operations of the predecessor, KGM and periods on or after March 3, 2016, represent the operations of the successor, Maple. 3Maple’s fiscal year ends on the last Saturday in September. Consequently, every fifth fiscal year includes 53 weeks rather than 52 weeks. Maple’s fiscal year 2017 included 53 weeks, resulting in one additional operating week in the fiscal fourth quarter.
Three Months Ended Three Months Ended
Fiscal 20173
+
December 30,
2017 -
December 24,
2016 =
Calendar Year
2017 Fiscal 2015 +
December 26,
2015 -
December 27,
2014 =
Calendar Year
2015
(unaudited) (unaudited) (unaudited) (unaudited) (unaudited) (unaudited)
Maple GAAP Operating Income2
899$ 230$ 264$ 865$ 765$ 90$ 216$ 639$
Maple Acquisition, Integration and Productivity
Expenses…………………………………. -$ -$ -$ -$ -$ 71$ -$ 71$
KGM Operating Income2
899$ 230$ 264$ 865$ 765$ 161$ 216$ 710$
Expenses related to SEC Inquiry and Pending
Litigation………………………………………………………. -$ -$ -$ -$ 2$ -$ 1$ 1$
Expenses related to Antitrust
litigation……………………………………………………… 3$ (3)$ 1$ (1)$ 6$ 0$ 3$ 3$
Amortization of Identifiable
intangibles…………………………………………………… 96$ 29$ 24$ 101$ 48$ 12$ 10$ 50$
Restructuring Expenses………………………………… 45$ 7$ 1$ 51$ 15$ 1$ -$ 16$
Acquisition, Integration and Productivity
Expenses……………………………………………………… 77$ 4$ 14$ 67$ 25$ 17$ -$ 42$
Stock Compensation……………………………………. 37$ 11$ 17$ 31$ -$ -$ -$ -$
53rd week…………………………………………………….. (19)$ -$ -$ (19)$ -$ -$ -$ -$
Proxy Adjustments1………………………………………. (25) (7)$ (6) (26)$ -$ -$ -$ -$
KGM Non-GAAP Operating Income 1,113$ 271$ 315$ 1,069$ 861$ 190$ 230$ 821$
110
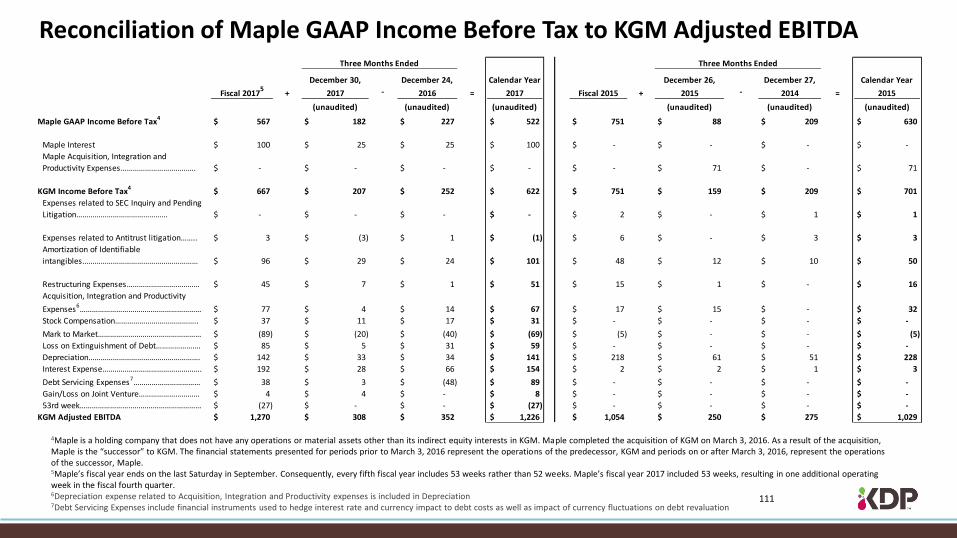
Reconciliation of Maple GAAP Income Before Tax to KGM Adjusted EBITDA
4Maple is a holding company that does not have any operations or material assets other than its indirect equity interests in KGM. Maple completed the acquisition of KGM on March 3, 2016. As a result of the acquisition, Maple is the “successor” to KGM. The financial statements presented for periods prior to March 3, 2016 represent the operations of the predecessor, KGM and periods on or after March 3, 2016, represent the operations of the successor, Maple.
5Maple’s fiscal year ends on the last Saturday in September. Consequently, every fifth fiscal year includes 53 weeks rather than 52 weeks. Maple’s fiscal year 2017 included 53 weeks, resulting in one additional operating week in the fiscal fourth quarter.
6Depreciation expense related to Acquisition, Integration and Productivity expenses is included in Depreciation 7Debt Servicing Expenses include financial instruments used to hedge interest rate and currency impact to debt costs as well as impact of currency fluctuations on debt revaluation
Three Months Ended Three Months Ended
Fiscal 20175
+
December 30,
2017 -
December 24,
2016 =
Calendar Year
2017 Fiscal 2015 +
December 26,
2015 -
December 27,
2014 =
Calendar Year
2015
(unaudited) (unaudited) (unaudited) (unaudited) (unaudited) (unaudited)
Maple GAAP Income Before Tax4
567$ 182$ 227$ 522$ 751$ 88$ 209$ 630$
Maple Interest 100$ 25$ 25$ 100$ -$ -$ -$ -$
Maple Acquisition, Integration and
Productivity Expenses………………………………. -$ -$ -$ -$ -$ 71$ -$ 71$
KGM Income Before Tax4 667$ 207$ 252$ 622$ 751$ 159$ 209$ 701$
Expenses related to SEC Inquiry and Pending
Litigation……………………………………… -$ -$ -$ -$ 2$ -$ 1$ 1$
Expenses related to Antitrust litigation…….. 3$ (3)$ 1$ (1)$ 6$ -$ 3$ 3$
Amortization of Identifiable
intangibles………………………………………………… 96$ 29$ 24$ 101$ 48$ 12$ 10$ 50$
Restructuring Expenses……………………………… 45$ 7$ 1$ 51$ 15$ 1$ -$ 16$
Acquisition, Integration and Productivity
Expenses6…………………………………………………… 77$ 4$ 14$ 67$ 17$ 15$ -$ 32$
Stock Compensation………………………………….. 37$ 11$ 17$ 31$ -$ -$ -$ -$
Mark to Market…………………………………………… (89)$ (20)$ (40)$ (69)$ (5)$ -$ -$ (5)$
Loss on Extinguishment of Debt…………………. 85$ 5$ 31$ 59$ -$ -$ -$ -$
Depreciation………………………………………………. 142$ 33$ 34$ 141$ 218$ 61$ 51$ 228$
Interest Expense…………………………………………. 192$ 28$ 66$ 154$ 2$ 2$ 1$ 3$
Debt Servicing Expenses7…………………………… 38$ 3$ (48)$ 89$ -$ -$ -$ -$
Gain/Loss on Joint Venture………………………… 4$ 4$ -$ 8$ -$ -$ -$ -$
53rd week…………………………………………………… (27)$ -$ -$ (27)$ -$ -$ -$ -$
KGM Adjusted EBITDA 1,270$ 308$ 352$ 1,226$ 1,054$ 250$ 275$ 1,029$
111

Reconciliation of KDP Pro-Forma GAAP Income Before Tax to KDP Pro-Forma Adjusted EBITDA
8Includes DPS 2017 reported results and KGM’s fiscal 2017 second quarter, fiscal 2017 third quarter, fiscal 2017 fourth quarter and fiscal 2018 first quarter. KGM’s fiscal 2018 first quarter ended December 30, 2017, any KGM operating activity on December 31, 2017 is excluded. 9Debt Servicing Expenses include financial instruments used to hedge interest rate and currency impact to debt costs as well as impact of currency fluctuations on debt revaluation. 10Maple’s fiscal year ends on the last Saturday in September. Consequently, every fifth fiscal year includes 53 weeks rather than 52 weeks. Maple’s fiscal year 2017 included 53 weeks, resulting in one additional operating week in the fiscal fourth quarter.
Twelve Months Ending
December 31, 20178
KDP
(unaudited)
KDP Pro-Forma GAAP Income Before Tax 1,424$
Litigation Expense (1)$
Restructuring Expenses 54$
Acquisition, Integration and Productivity Expenses 90$
Stock Compensation expense 32$
Mark to Market (94)$
Loss on Extinguishment of Debt 121$
Depreciation 339$
Amortization 124$
Debt Servicing Expenses9 89$
Interest Expense 627$
(Gain)/Loss on Joint Venture 8$
KGM 53rd Week10 (27)$
KDP Pro-Forma Adjusted EBITDA 2,786$
112


![Chief Financial Officer [CFO]. Competenze, strumenti, operatività … · consulenti d→’impresa, imprenditori, imprese. Livello Executive, Percorsi Personalizzati, per direttori](https://img.pdfslide.tips/doc/110x75/5c66400f09d3f252168c13ab/chief-financial-officer-cfo-competenze-strumenti-operativita-consulenti.jpg)