Embed Size (px)
Citation preview
8/8/2019 Investor Presentation - Q1 - FY 2010-11
http://slidepdf.com/reader/full/investor-presentation-q1-fy-2010-11 1/29
THE FEDERAL BANK LIMITED
Regd. Office, Federal Towers
Aluva, Kerala

8/8/2019 Investor Presentation - Q1 - FY 2010-11
http://slidepdf.com/reader/full/investor-presentation-q1-fy-2010-11 2/29
FEDERAL BANK
FY 2010-11
First Quarter Resultsas on 30.06.2010
I N V E S T O R P R E S E N T A T I O N
8/8/2019 Investor Presentation - Q1 - FY 2010-11
http://slidepdf.com/reader/full/investor-presentation-q1-fy-2010-11 3/29
PERFORMANCE HIGHLIGHTS
FEDERAL BANK
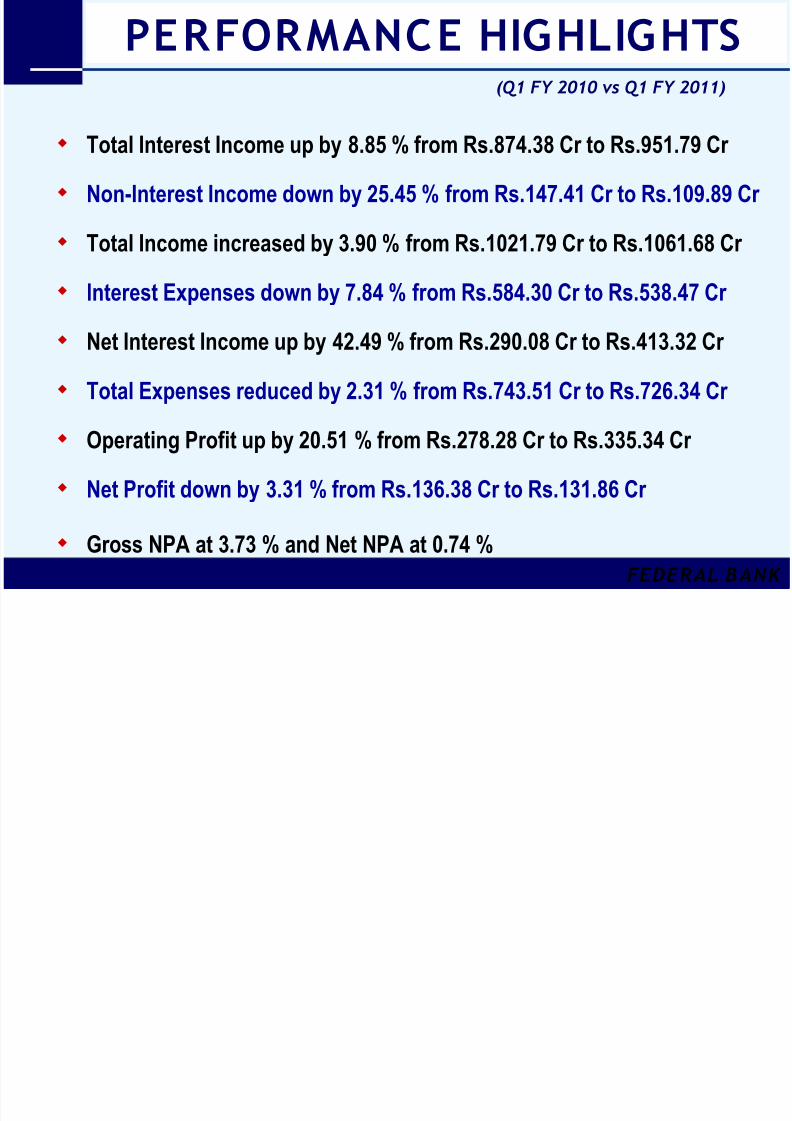
(Q1 FY 2010 vs Q1 FY 2011)
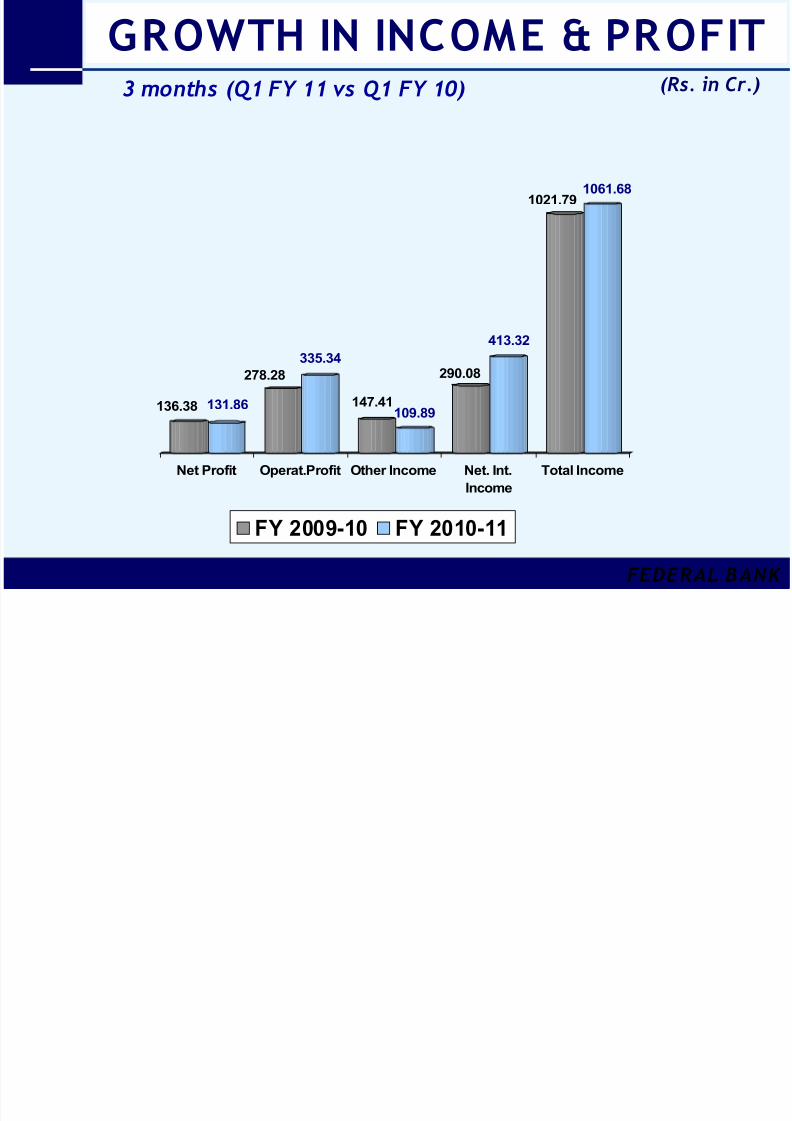
Total Interest Income up by 8.85 % from Rs.874.38 Cr to Rs.951.79 Cr
Non-Interest Income down by 25.45 % from Rs.147.41 Cr to Rs.109.89 Cr
Total Income increased by 3.90 % from Rs.1021.79 Cr to Rs.1061.68 Cr
Interest Expenses down by 7.84 % from Rs.584.30 Cr to Rs.538.47 Cr
Net Interest Income up by 42.49 % from Rs.290.08 Cr to Rs.413.32 Cr
Total Expenses reduced by 2.31 % from Rs.743.51 Cr to Rs.726.34 Cr
Operating Profit up by 20.51 % from Rs.278.28 Cr to Rs.335.34 Cr
Net Profit down by 3.31 % from Rs.136.38 Cr to Rs.131.86 Cr
Gross NPA at 3.73 % and Net NPA at 0.74 %

8/8/2019 Investor Presentation - Q1 - FY 2010-11
http://slidepdf.com/reader/full/investor-presentation-q1-fy-2010-11 4/29
PERFORMANCE HIGHLIGHTS
FEDERAL BANK
CRAR at 17.89 %
EPS at Rs.30.84
Return on Average Total Assets at 1.23 %
Book value per share increased to Rs.281.95
Cost to Income Ratio at 35.91 %
Total Business up by 12.94 % to Rs.62127.85 Cr
Total Deposits grew by 10.22 % to Rs.34983.85 Cr
Net Advances increased by 16.64 % to Rs.27143.99 Cr
Investments grew by 2.48 % to Rs.12012.71 Cr
(Q1 FY 2010 vs Q1 FY 2011)
8/8/2019 Investor Presentation - Q1 - FY 2010-11
http://slidepdf.com/reader/full/investor-presentation-q1-fy-2010-11 5/29
PERFORMANCE HIGHLIGHTS
FEDERAL BANK
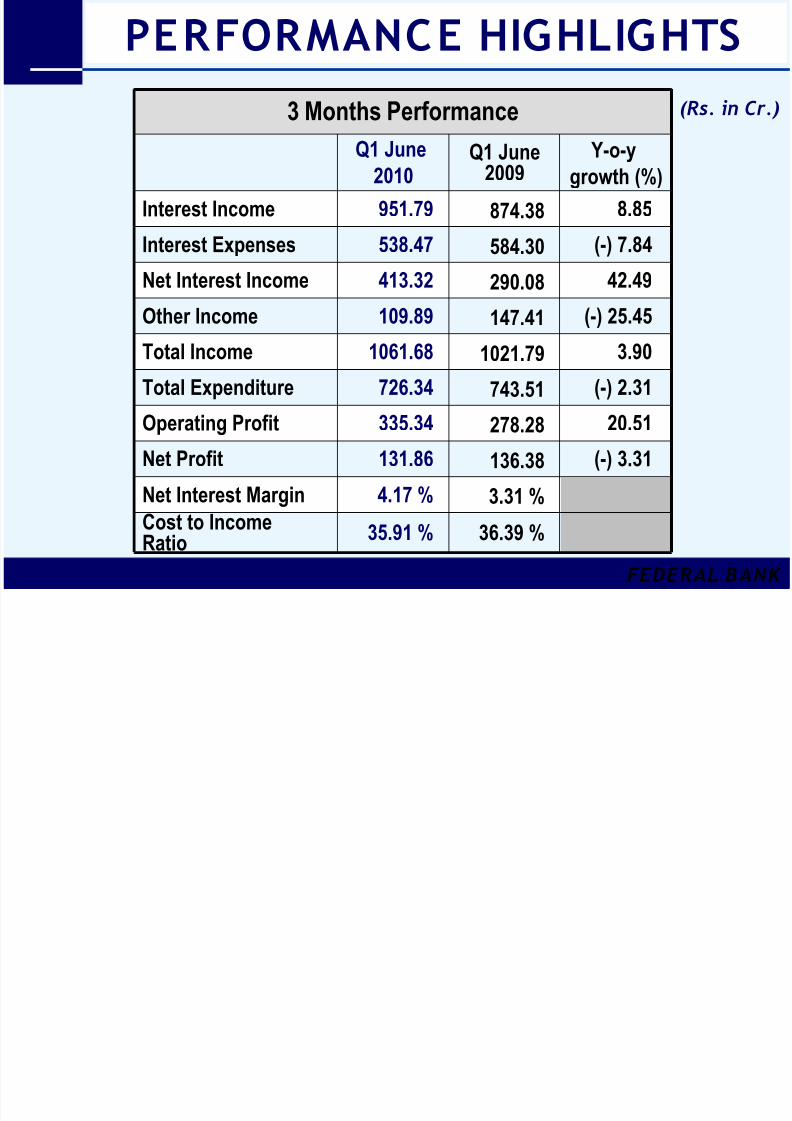
36.39 %35.91 %Cost to Income
Ratio
3.31 %4.17 %
Net Interest Margin
(-) 3.31136.38131.86Net Profit
20.51278.28335.34Operating Profit
(-) 2.31743.51726.34Total Expenditure
3.901021.791061.68Total Income
(-) 25.45147.41109.89Other Income
42.49290.08413.32Net Interest Income
(-) 7.84584.30538.47Interest Expenses
8.85874.38951.79Interest Income
Y-o-y
growth (%)Q1 June
2009Q1 June
2010
3 Months Performance (Rs. in Cr.)
8/8/2019 Investor Presentation - Q1 - FY 2010-11
http://slidepdf.com/reader/full/investor-presentation-q1-fy-2010-11 6/29
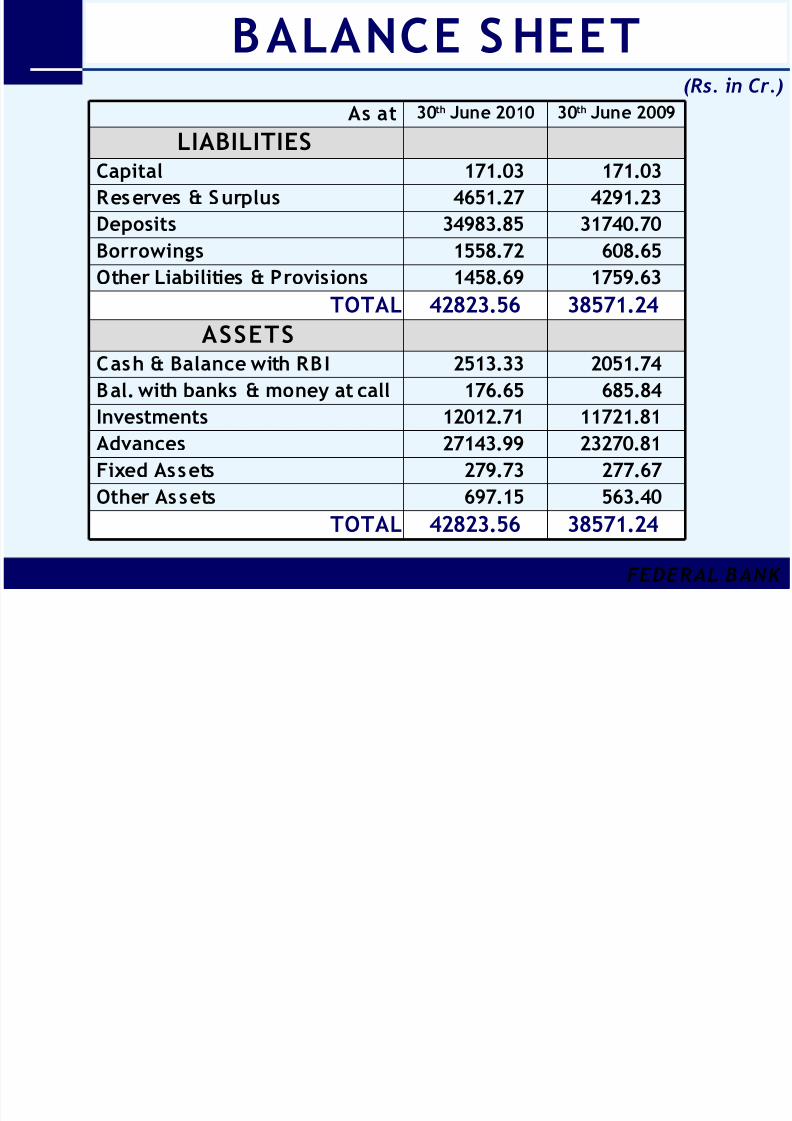
BALANCE S HEET
FEDERAL BANK
38571.2442823.56TOTAL
563.40697.15Other Assets
277.67279.73Fixed Assets
23270.8127143.99Advances11721.8112012.71Investments
685.84176.65Bal. with banks & money at call
2051.742513.33Cash & Balance with RBI
ASSETS
38571.2442823.56TOTAL1759.631458.69Other Liabilities & Provisions
608.651558.72Borrowings
31740.7034983.85Deposits
4291.234651.27Reserves & Surplus
171.03171.03CapitalLIABILITIES
30th June 200930th June 2010As at
(Rs. in Cr.)
8/8/2019 Investor Presentation - Q1 - FY 2010-11
http://slidepdf.com/reader/full/investor-presentation-q1-fy-2010-11 7/29
GROWTH IN INCOME & PROFIT
FEDERAL BANK
136.38 131.86
278.28
335.34
147.41
109.89
290.08
413.32
1021.791061.68
Net Profit Operat.Profit Other Income Net. Int.
Income
Total Income
FY 2009-10 FY 2010-11
3 months (Q1 FY 11 vs Q1 FY 10) (Rs. in Cr.)
8/8/2019 Investor Presentation - Q1 - FY 2010-11
http://slidepdf.com/reader/full/investor-presentation-q1-fy-2010-11 8/29
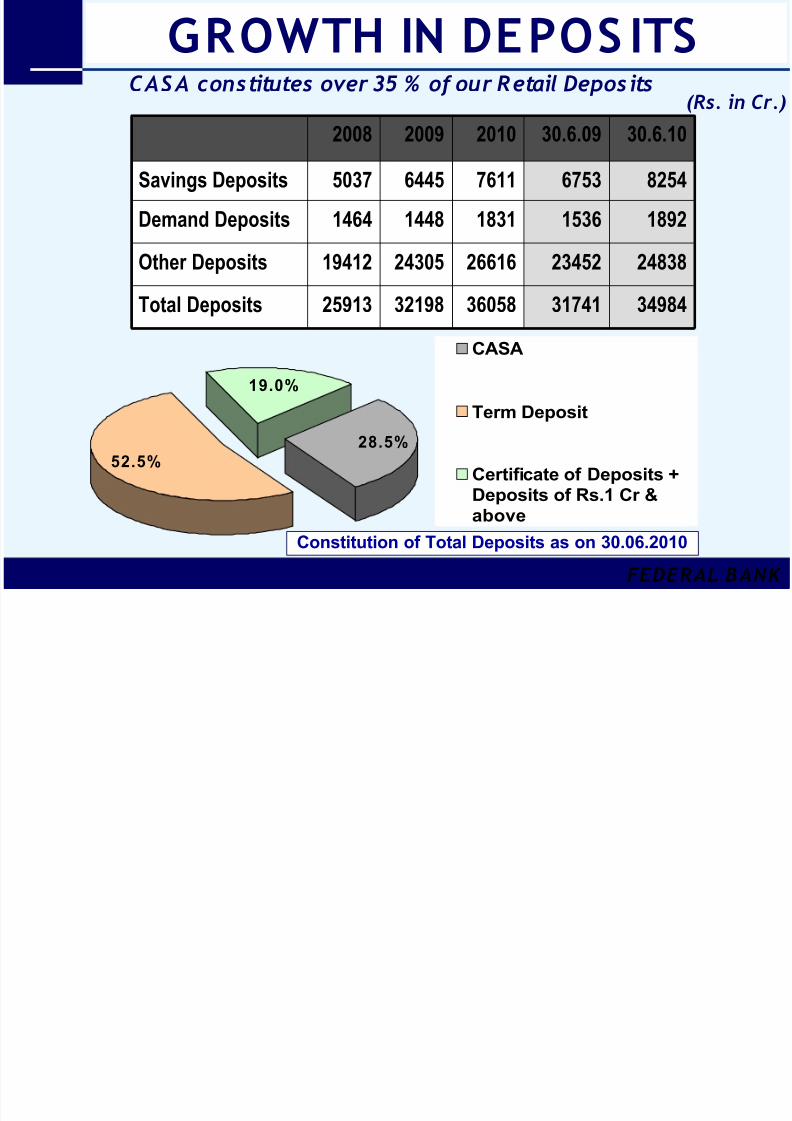
GROWTH IN DEPOS ITS
FEDERAL BANK
31741
23452
1536
6753
30.6.09
32198
24305
1448
6445
2009
36058
26616
1831
7611
2010
25913
19412
1464
5037
2008
34984Total Deposits
24838Other Deposits
1892Demand Deposits
8254Savings Deposits
30.6.10
28.5%
52.5%
19.0%
CASA
Term Deposit
Certificate of Deposits +Deposits of Rs.1 Cr &above
Constitution of Total Deposits as on 30.06.2010
(Rs. in Cr.)CAS A constitutes over 35 % of our Retail Deposits
8/8/2019 Investor Presentation - Q1 - FY 2010-11
http://slidepdf.com/reader/full/investor-presentation-q1-fy-2010-11 9/29
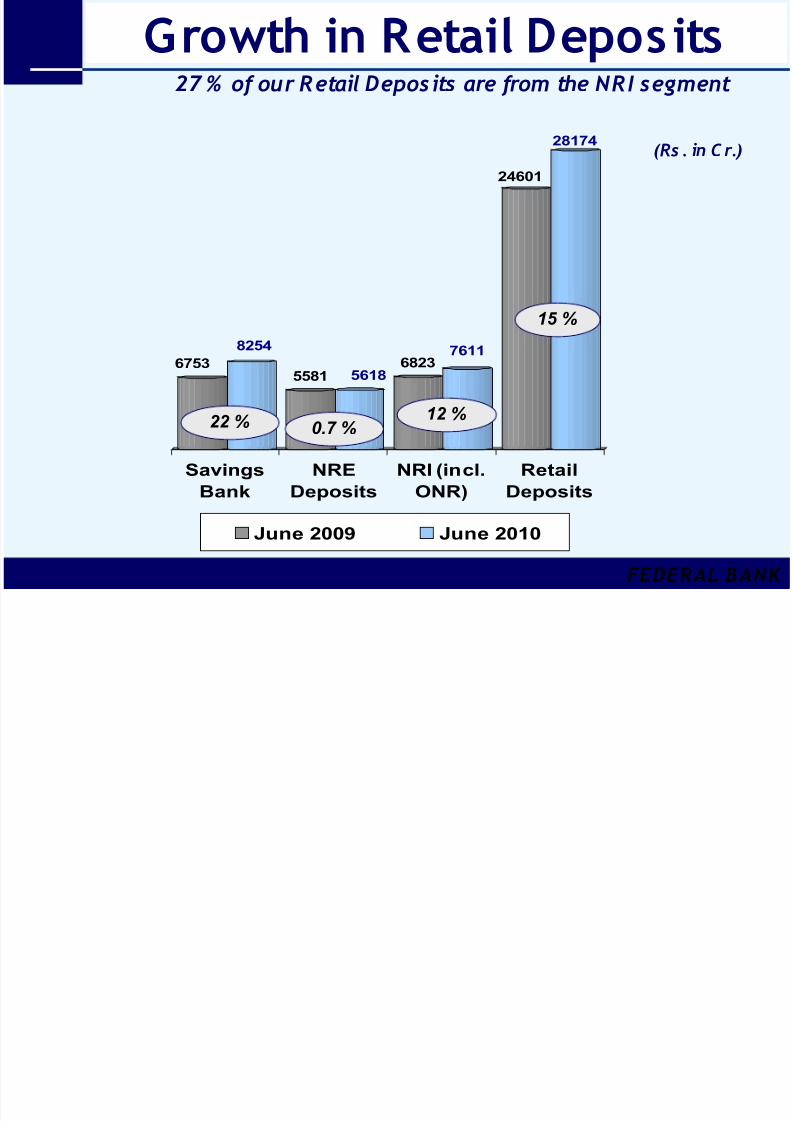
Growth in Retail Depos its
FEDERAL BANK
(Rs . in C r.)
27 % of our Retail Deposits are from the NRI segment
6753
8254
5581 56186823
7611
24601
28174
Savings
Bank
NRE
Deposits
NRI (incl.
ONR)
Retail
Deposits
June 2009 June 2010
22 %
15 %
12 %0.7 %
8/8/2019 Investor Presentation - Q1 - FY 2010-11
http://slidepdf.com/reader/full/investor-presentation-q1-fy-2010-11 10/29
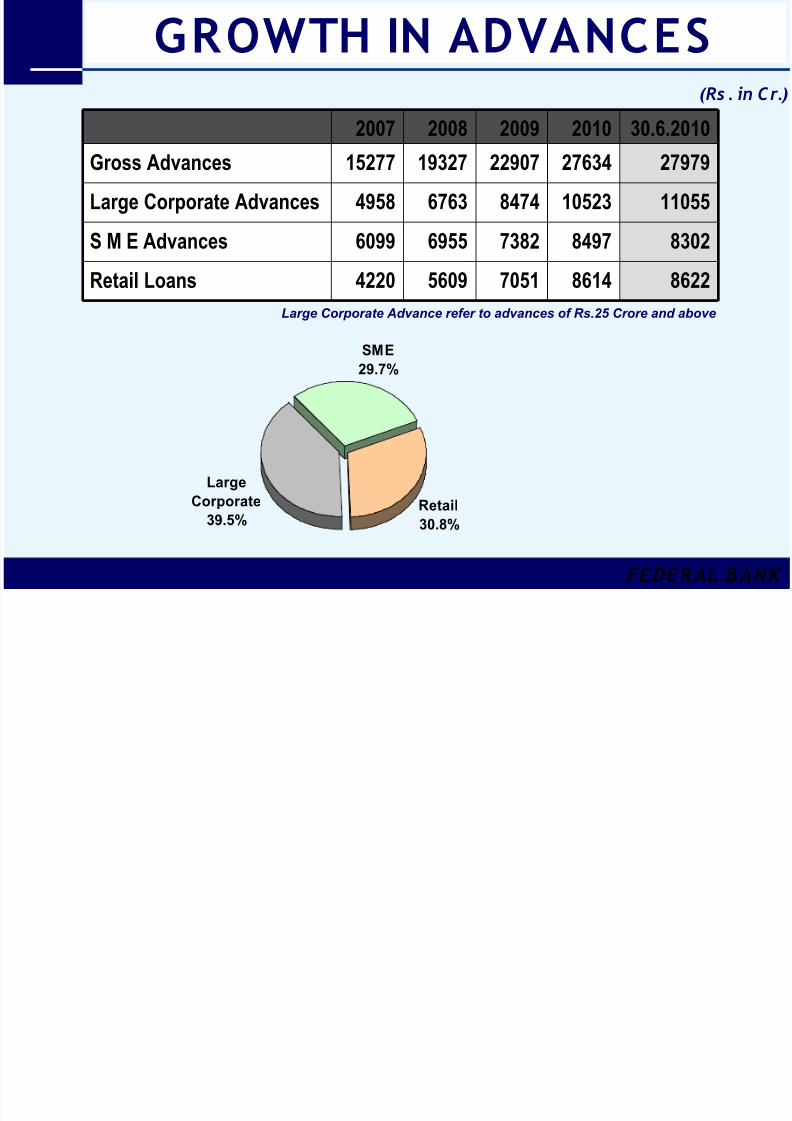
GROWTH IN ADVANCES
FEDERAL BANK
8614
8497
10523
276342010
7051
7382
8474
229072009
5609
6955
6763
193272008
86224220Retail Loans
83026099S M E Advances
110554958Large Corporate Advances
2797915277Gross Advances30.6.20102007
Large Corporate Advance refer to advances of Rs.25 Crore and above
SME
29.7%
Retail
30.8%
Large
Corporate
39.5%
(Rs . in Cr.)
8/8/2019 Investor Presentation - Q1 - FY 2010-11
http://slidepdf.com/reader/full/investor-presentation-q1-fy-2010-11 11/29
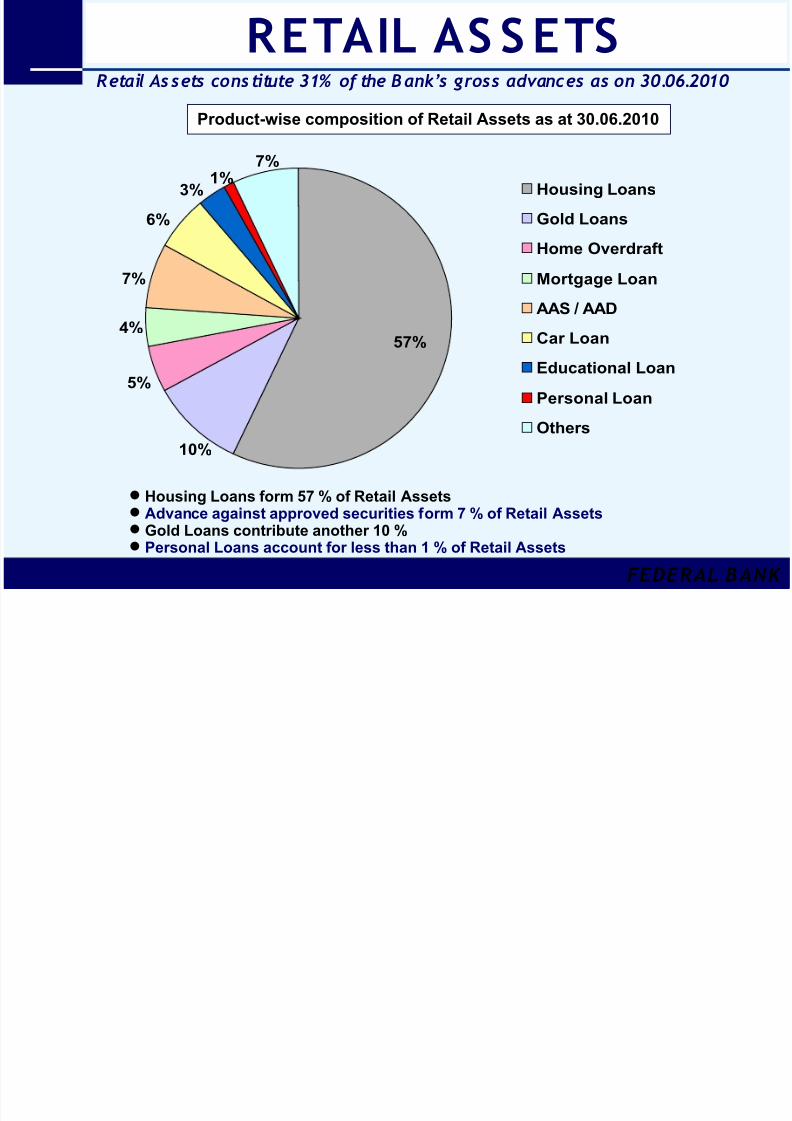
RETAIL AS S ETS
FEDERAL BANK
1%3%
6%
7%
7%
4%
5%
10%
57%
Housing Loans
Gold Loans
Home Overdraft
Mortgage Loan
AAS / AAD
Car Loan
Educational Loan
Personal Loan
Others
Retail Assets constitute 31% of the Bank’s gross advances as on 30.06.2010
Product-wise composition of Retail Assets as at 30.06.2010
Housing Loans form 57 % of Retail Assets Advance against approved securities form 7 % of Retail Assets Gold Loans contribute another 10 %
Personal Loans account for less than 1 % of Retail Assets

8/8/2019 Investor Presentation - Q1 - FY 2010-11
http://slidepdf.com/reader/full/investor-presentation-q1-fy-2010-11 12/29
TOP 10 INDUSTRIAL EXPOS URES
FEDERAL BANK
473.43Chemicals , Dyes, Paints, Fertilizers , etc.4
472.33Food Process ing5
174.02
195.62
304.72
351.21
383.45
563.11
773.95
1877.42
Amount of exposure
Rubber and rubber products10
Paper & paper products9
Metal & metal products (Other than Iron & S teel)8
Engineering incl. electronics7
Cotton Textiles6
Roads & Ports (Infras tructure)3
Iron & S teel2
Power (Infrastructure)1
Sector No.
(Rs . in Cr.)as on 30.06.2010
8/8/2019 Investor Presentation - Q1 - FY 2010-11
http://slidepdf.com/reader/full/investor-presentation-q1-fy-2010-11 13/29
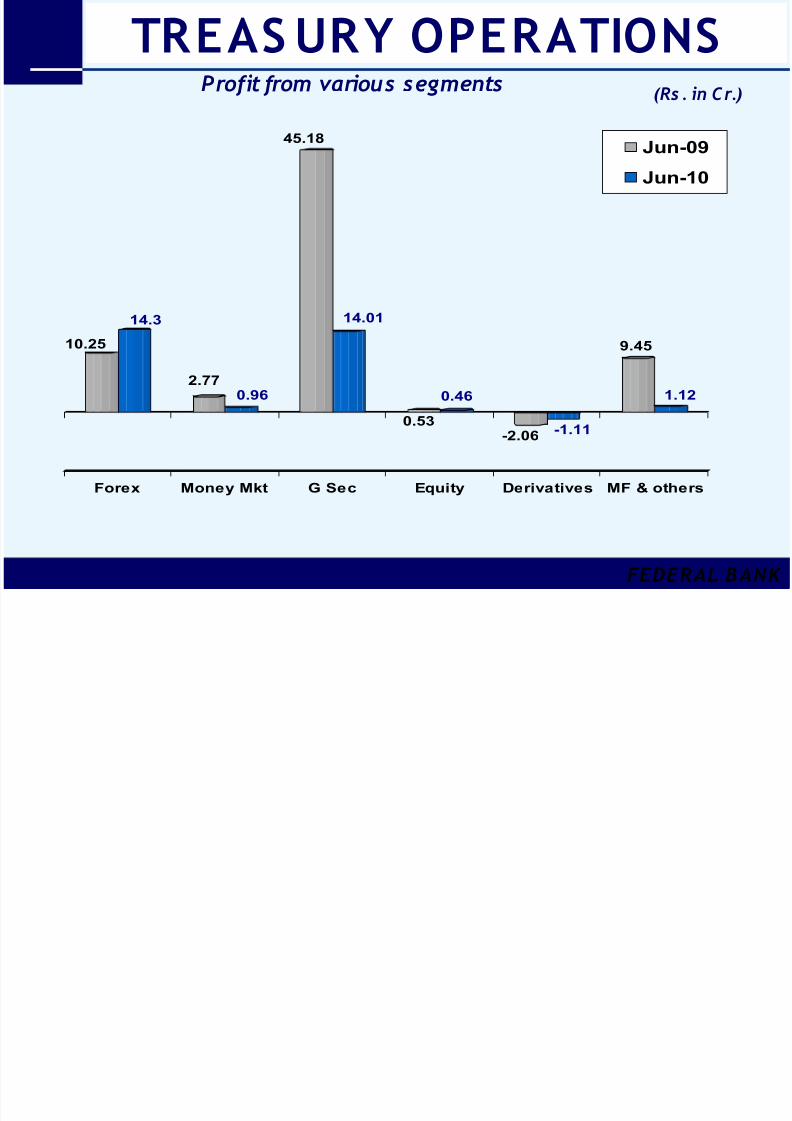
TREAS URY OPERATIONS
FEDERAL BANK
10.25
14.3
2.770.96
45.18
14.01
0.53
0.46
-2.06 -1.11
9.45
1.12
Forex Money Mkt G Sec Equity Derivatives MF & others
Jun-09
Jun-10
Profit from various segments (Rs . in Cr.)
8/8/2019 Investor Presentation - Q1 - FY 2010-11
http://slidepdf.com/reader/full/investor-presentation-q1-fy-2010-11 14/29
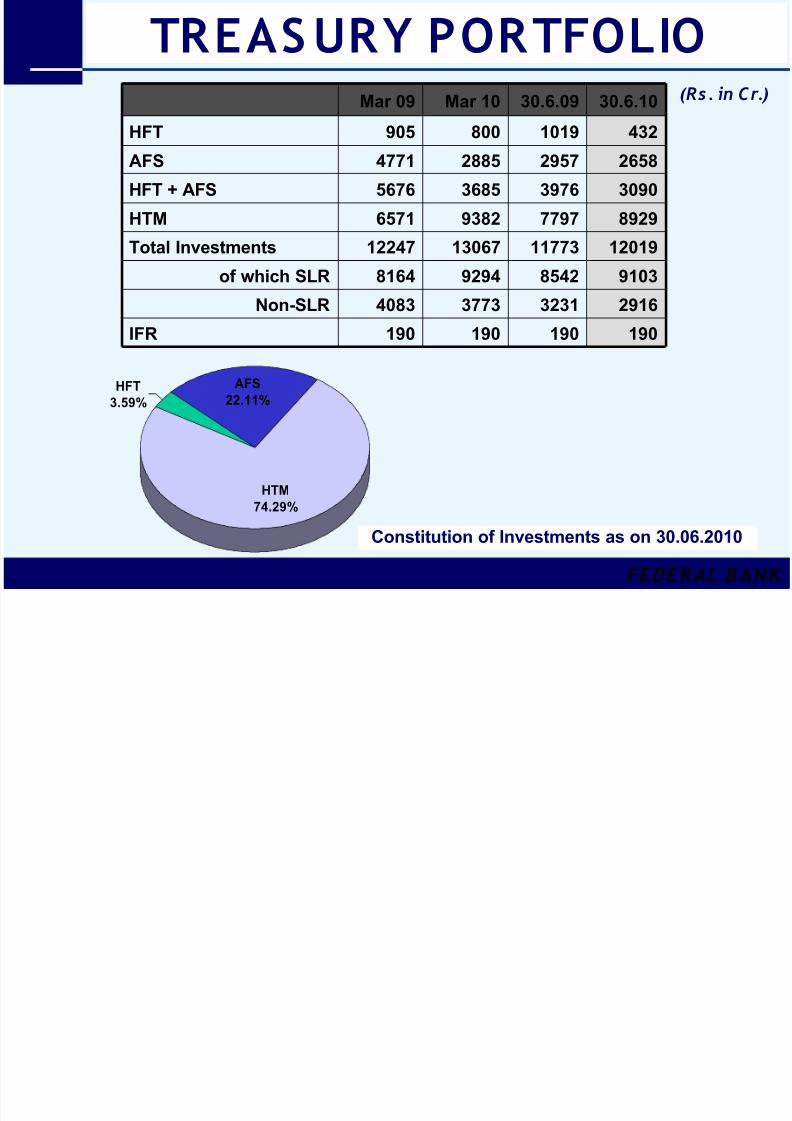
TREAS URY PORTFOLIO
FEDERAL BANK
HTM
74.29%
AFS
22.11%HFT
3.59%
190
32318542
11773
7797
3976
29571019
30.6.09
190
37739294
13067
9382
3685
2885800
Mar 10
190
40838164
12247
6571
5676
4771905
Mar 09
2916Non-SLR
190IFR
9103of which SLR
12019Total Investments
8929HTM
432HFT
3090HFT + AFS
2658AFS
30.6.10
Constitution of Investments as on 30.06.2010
(Rs. in Cr.)
8/8/2019 Investor Presentation - Q1 - FY 2010-11
http://slidepdf.com/reader/full/investor-presentation-q1-fy-2010-11 15/29
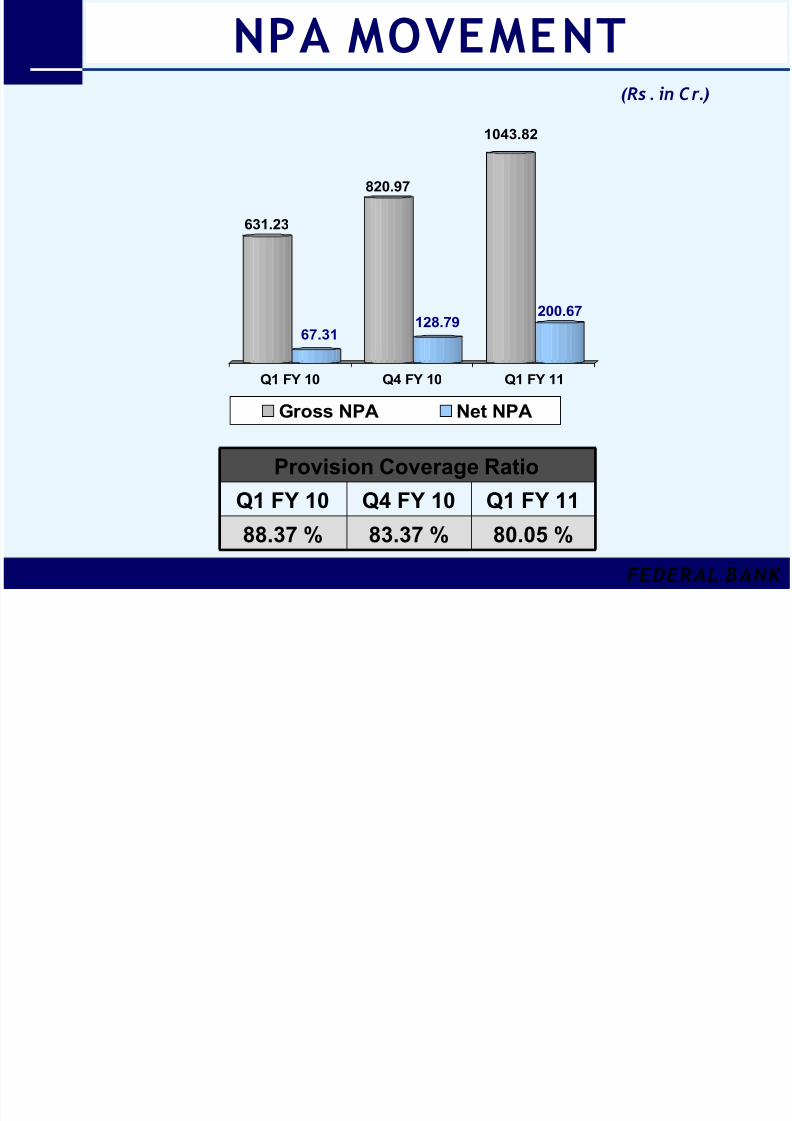
NPA MOVEMENT
FEDERAL BANK
631.23
67.31
820.97
128.79
1043.82
200.67
Q1 FY 10 Q4 FY 10 Q1 FY 11
Gross NPA Net NPA
80.05 %83.37 %88.37 %
Q1 FY 11Q4 FY 10Q1 FY 10
Provision Coverage Ratio
(Rs . in Cr.)
8/8/2019 Investor Presentation - Q1 - FY 2010-11
http://slidepdf.com/reader/full/investor-presentation-q1-fy-2010-11 16/29
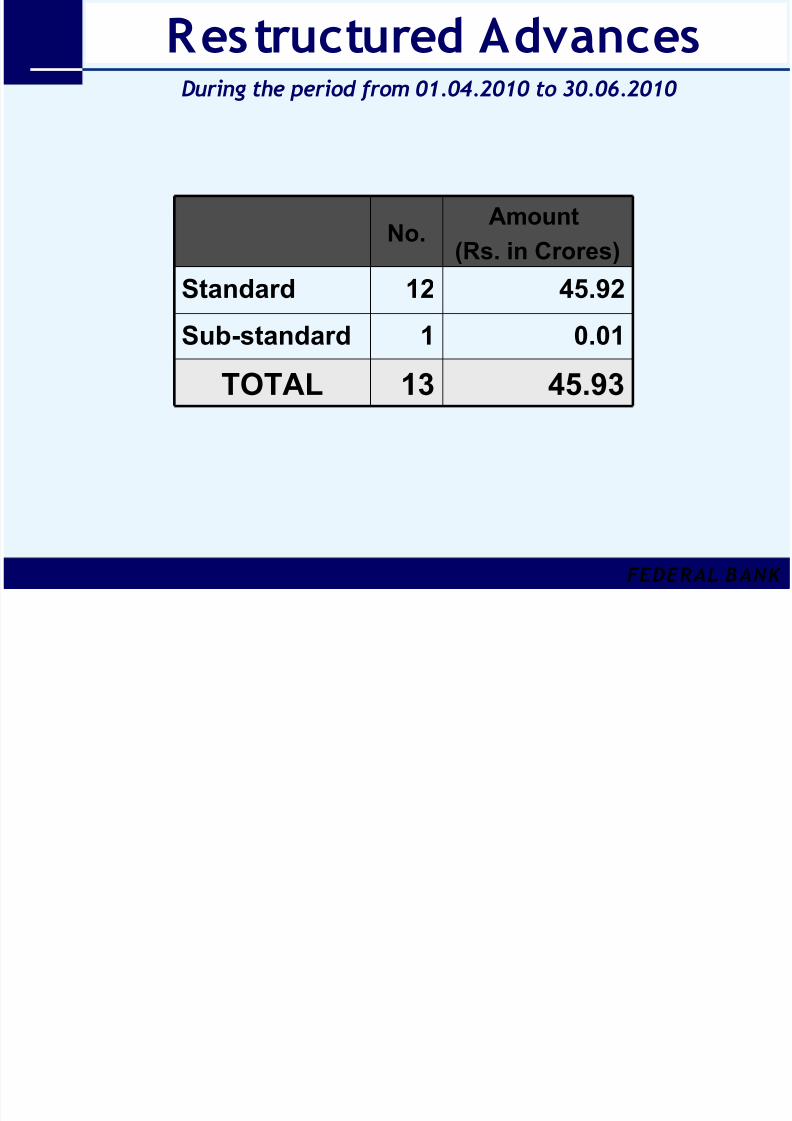
Restructured Advances
FEDERAL BANK
During the period from 01.04.2010 to 30.06.2010
45.9313TOTAL
0.011Sub-standard
45.9212Standard
Amount
(Rs. in Crores)No.
8/8/2019 Investor Presentation - Q1 - FY 2010-11
http://slidepdf.com/reader/full/investor-presentation-q1-fy-2010-11 17/29
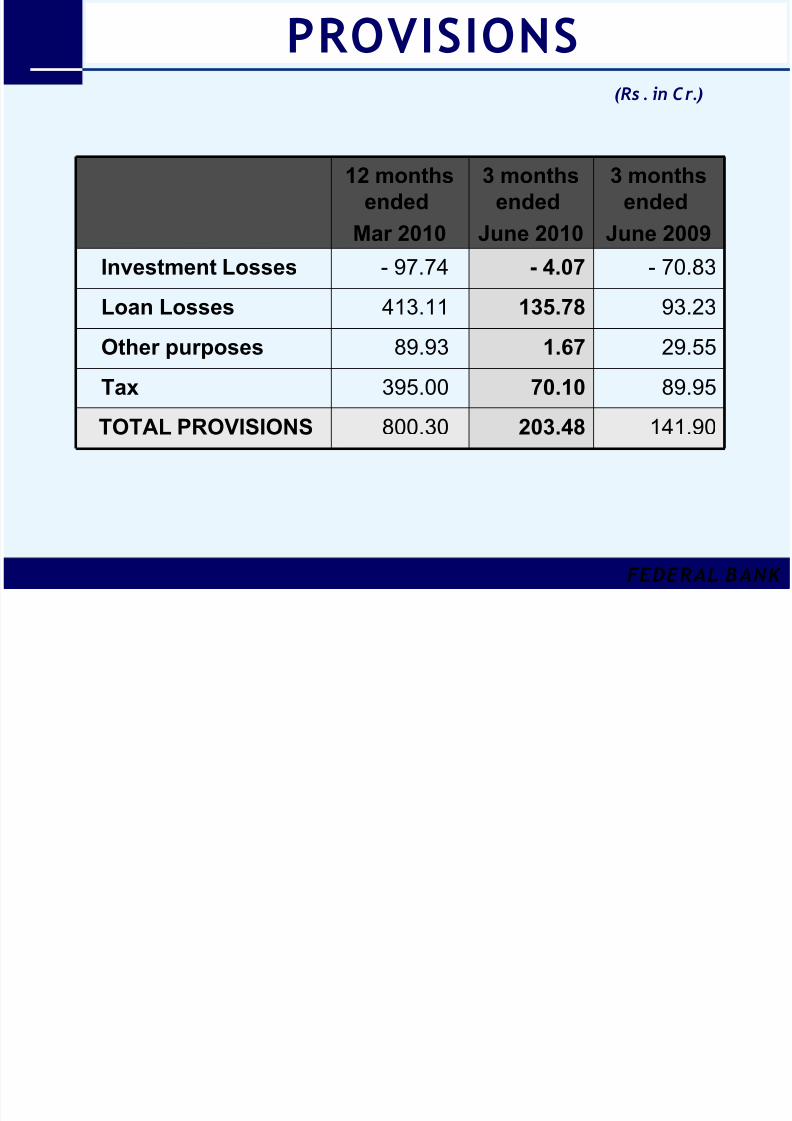
PROVISIONS
FEDERAL BANK
141.90203.48800.30TOTAL PROVISIONS
89.9570.10395.00Tax
29.551.6789.93Other purposes
93.23135.78413.11Loan Losses- 70.83- 4.07- 97.74Investment Losses
3 months
ended
June 2009
3 months
ended
June 2010
12 months
ended
Mar 2010
(Rs . in Cr.)
8/8/2019 Investor Presentation - Q1 - FY 2010-11
http://slidepdf.com/reader/full/investor-presentation-q1-fy-2010-11 18/29
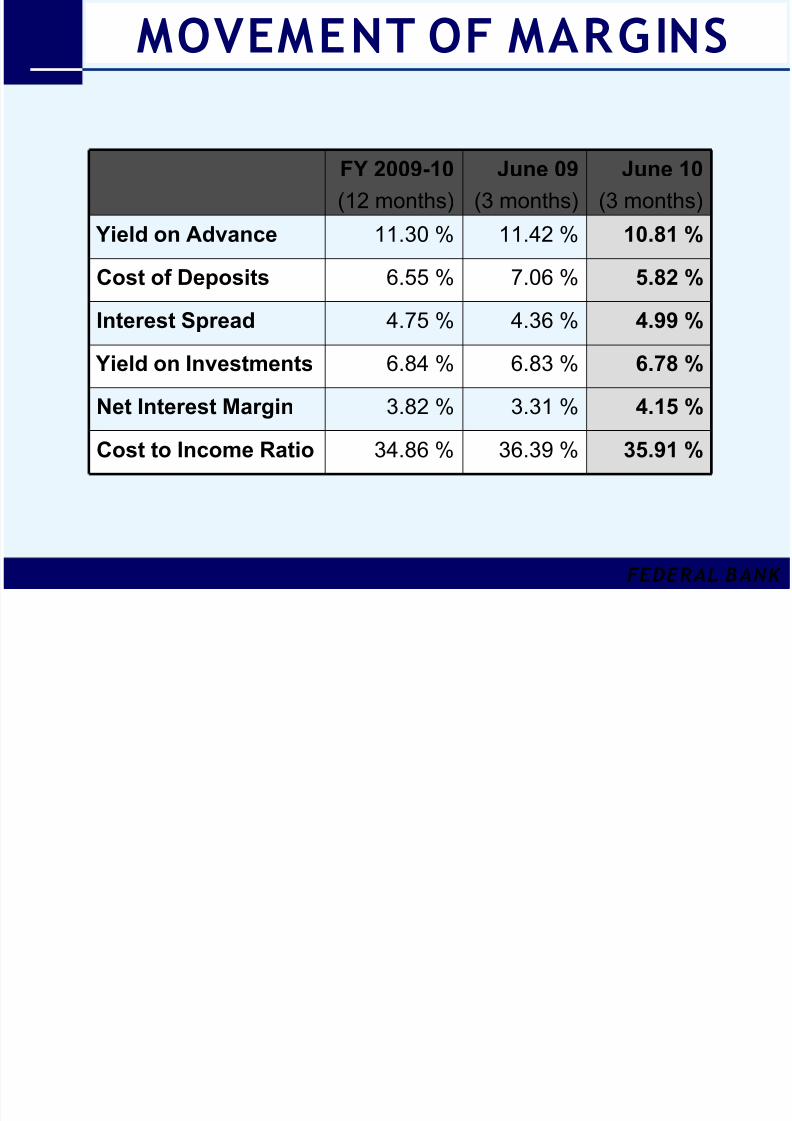
MOVEMENT OF MARGINS
FEDERAL BANK
34.86 %3.82 %
6.84 %
4.75 %
6.55 %
11.30 %
FY 2009-10
(12 months)
36.39 %3.31 %
6.83 %
4.36 %
7.06 %
11.42 %
June 09
(3 months)
4.15 %Net Interest Margin35.91 %Cost to Income Ratio
6.78 % Yield on Investments
4.99 %Interest Spread
5.82 %Cost of Deposits
10.81 % Yield on Advance
June 10
(3 months)
8/8/2019 Investor Presentation - Q1 - FY 2010-11
http://slidepdf.com/reader/full/investor-presentation-q1-fy-2010-11 19/29
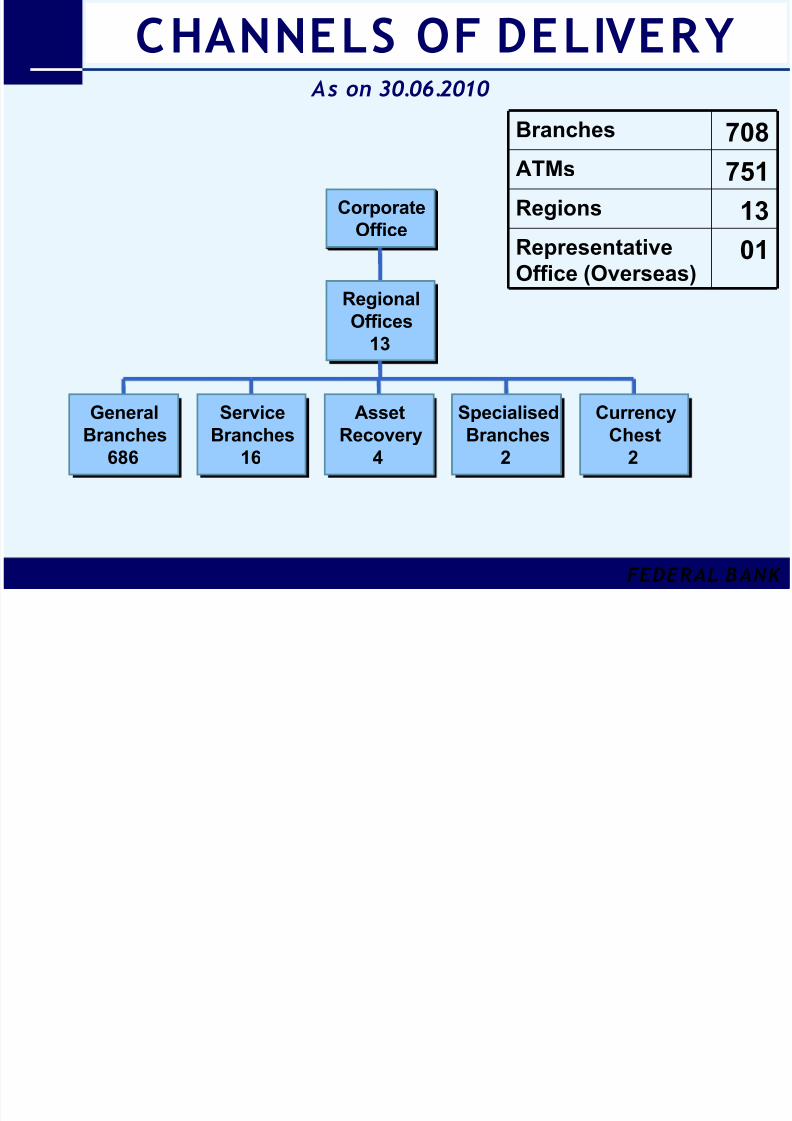
CHANNELS OF DELIVERY
FEDERAL BANK
GeneralBranches
686
ServiceBranches
16
AssetRecovery
4
SpecialisedBranches
2
CurrencyChest
2
Regional
Offices
13
Corporate
Office
01Representative
Office (Overseas)
13Regions
751ATMs708Branches
As on 30.06.2010
8/8/2019 Investor Presentation - Q1 - FY 2010-11
http://slidepdf.com/reader/full/investor-presentation-q1-fy-2010-11 20/29
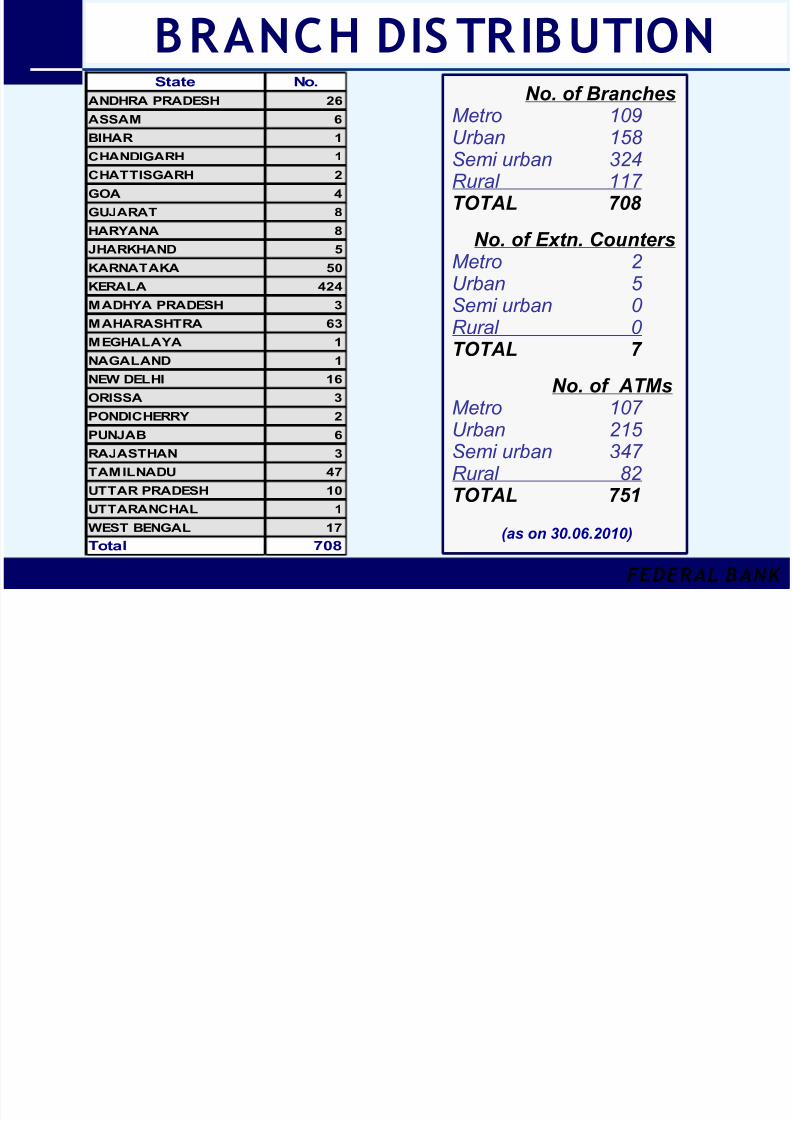
BRANCH DIS TRIBUTION
FEDERAL BANK
State No.
ANDHRA PRADESH 26
ASSAM 6
BIHAR 1CHANDIGARH 1
CHATTISGARH 2
GOA 4
GUJARAT 8
HARYANA 8
JHARKHAND 5
KARNATAKA 50
KERALA 424
MADHYA PRADESH 3
MAHARASHTRA 63
MEGHALAYA 1
NAGALAND 1
NEW DELHI 16
ORISSA 3
PONDICHERRY 2PUNJAB 6
RAJASTHAN 3
TAMILNADU 47
UTTAR PRADESH 10
UTTARANCHAL 1
WEST BENGAL 17
Total 708
No. of BranchesMetro 109
Urban 158 Semi urban 324
Rural 117
TOTAL 708
No. of Extn. CountersMetro 2
Urban 5
Semi urban 0
Rural 0
TOTAL 7
No. of ATMsMetro 107
Urban 215
Semi urban 347
Rural 82
TOTAL 751
(as on 30.06.2010)
8/8/2019 Investor Presentation - Q1 - FY 2010-11
http://slidepdf.com/reader/full/investor-presentation-q1-fy-2010-11 21/29
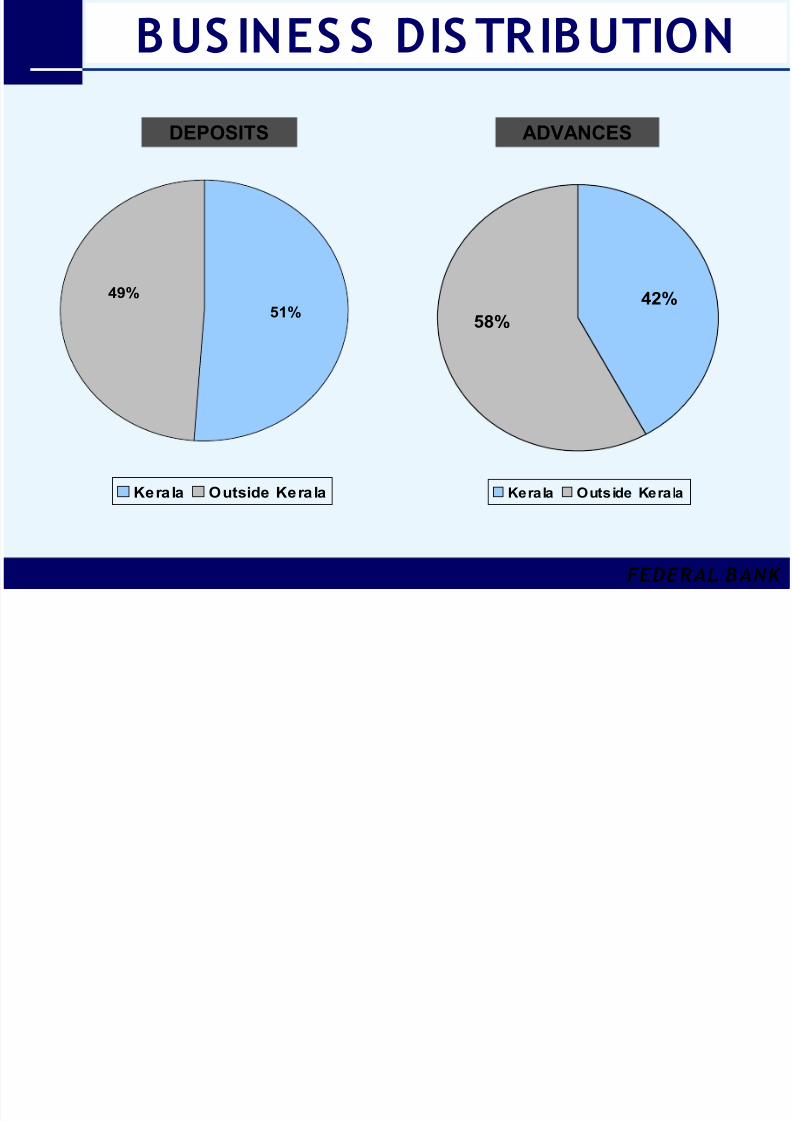
BUS INES S DIS TRIBUTION
FEDERAL BANK
DEPOSITS ADVANCES
49%
51%
Kerala Outside Kerala
58%
42%
Kerala Outside Kerala
8/8/2019 Investor Presentation - Q1 - FY 2010-11
http://slidepdf.com/reader/full/investor-presentation-q1-fy-2010-11 22/29
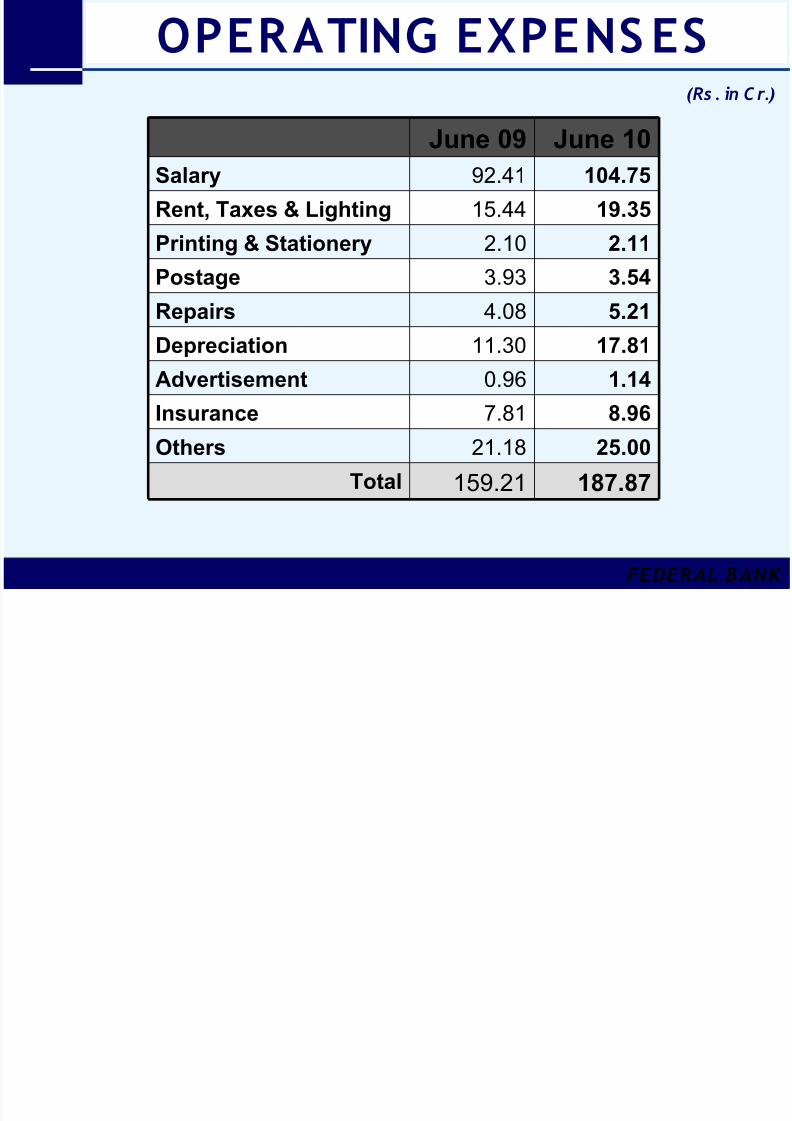
OPERATING EXPENS ES
FEDERAL BANK
(Rs . in C r.)
8.967.81Insurance
159.21
21.18
0.96
11.30
4.083.93
2.10
15.44
92.41June 09
187.87
25.00
1.14
17.81
5.213.54
2.11
19.35
104.75June 10
Total
Others
Advertisement
Depreciation
RepairsPostage
Printing & Stationery
Rent, Taxes & Lighting
Salary

8/8/2019 Investor Presentation - Q1 - FY 2010-11
http://slidepdf.com/reader/full/investor-presentation-q1-fy-2010-11 23/29
OTHER INCOME
FEDERAL BANK
(Rs . in Cr.)
147.41
52.22
57.93
0.56
10.33
26.37
June 09
109.88
51.59
16.55
0.22
13.96
27.56
June 10
Total
Others
Profit on sale of
securities
Dividend Income
Forex Transactions
Exchange &
Commission Income
8/8/2019 Investor Presentation - Q1 - FY 2010-11
http://slidepdf.com/reader/full/investor-presentation-q1-fy-2010-11 24/29
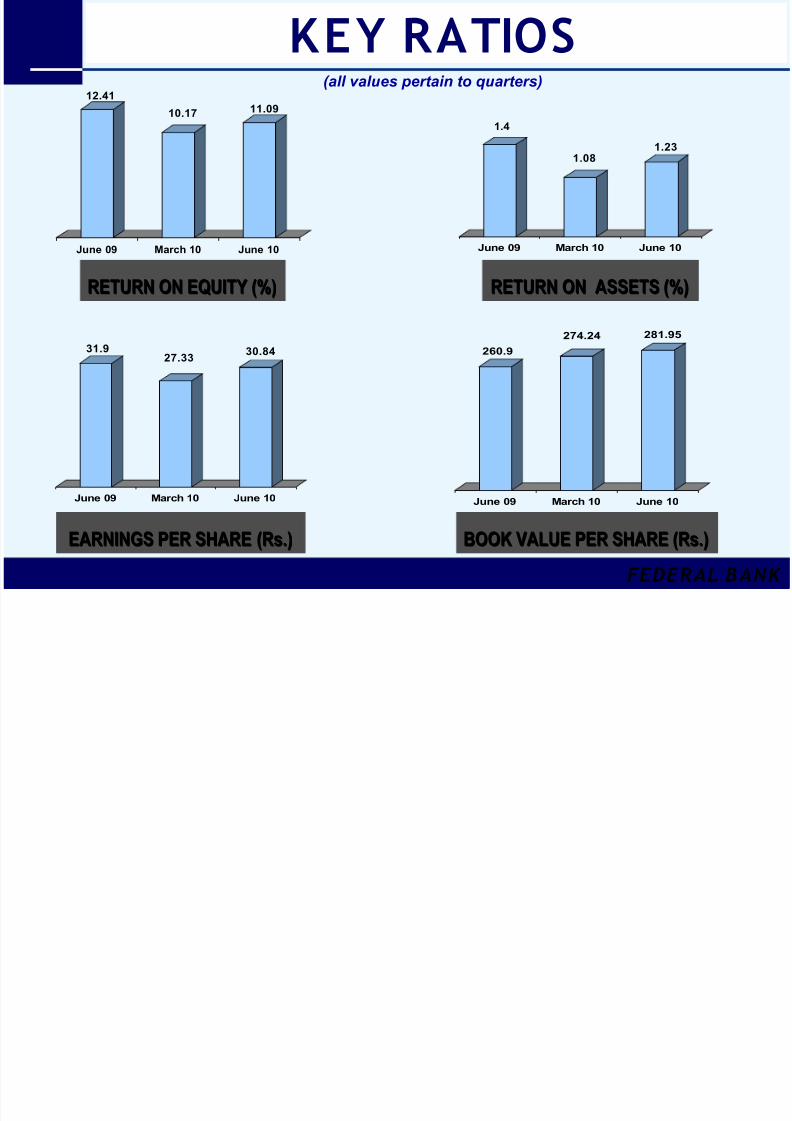
KEY RATIOS
FEDERAL BANK
12.41
10.17 11.09
June 09 March 10 June 10
RETURN ON EQUITY (%)RETURN ON EQUITY (%)
31.927.33
30.84
June 09 March 10 June 10
EARNINGS PER SHAREEARNINGS PER SHARE (Rs.)(Rs.)
1.4
1.081.23
June 09 March 10 June 10
RETURN ON ASSETS (%)RETURN ON ASSETS (%)
260.9
274.24 281.95
June 09 March 10 June 10
BOOK VALUE PER SHARE (Rs.)BOOK VALUE PER SHARE (Rs.)
(all values pertain to quarters)
8/8/2019 Investor Presentation - Q1 - FY 2010-11
http://slidepdf.com/reader/full/investor-presentation-q1-fy-2010-11 25/29
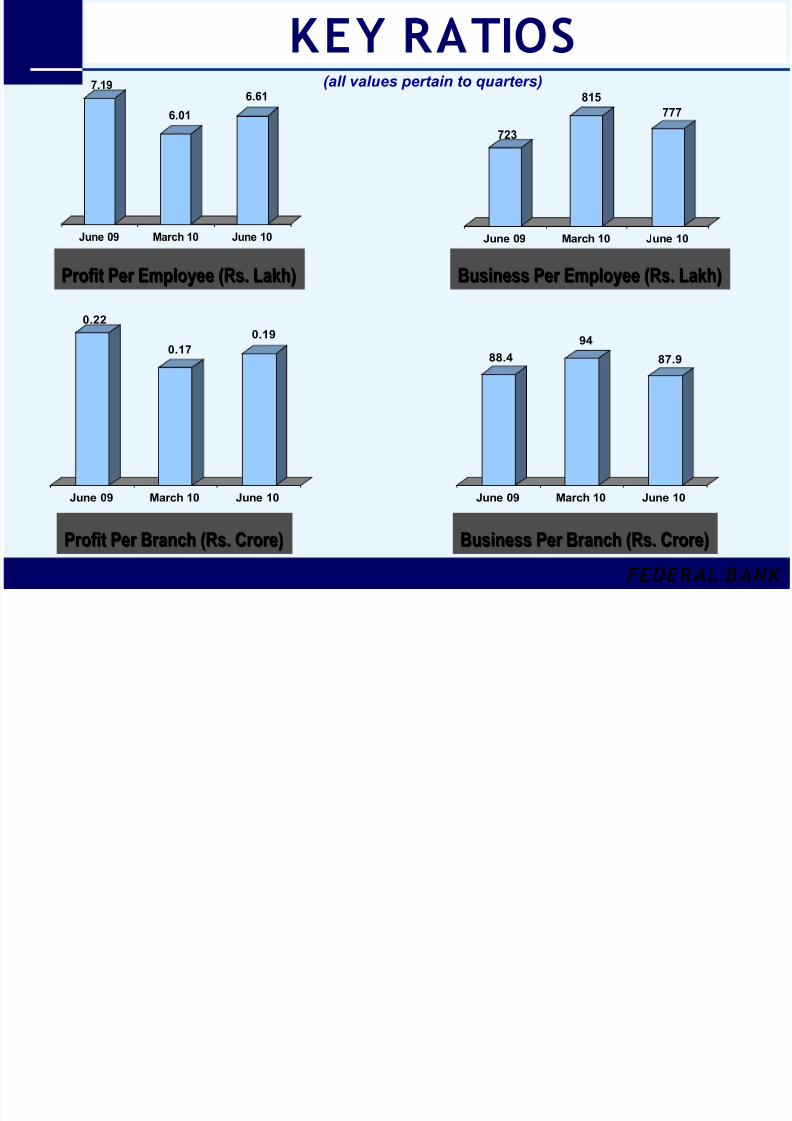
KEY RATIOS
FEDERAL BANK
7.19
6.01
6.61
June 09 March 10 June 10
Profit Per Employee (Rs. Lakh)Profit Per Employee (Rs. Lakh)
0.22
0.17
0.19
June 09 March 10 June 10
Profit Per Branch (Rs. Crore)Profit Per Branch (Rs. Crore)
723
815
777
June 09 March 10 June 10
Business Per Employee (Rs. Lakh)Business Per Employee (Rs. Lakh)
88.4
94
87.9
June 09 March 10 June 10
Business Per Branch (Rs. Crore)Business Per Branch (Rs. Crore)
(all values pertain to quarters)
8/8/2019 Investor Presentation - Q1 - FY 2010-11
http://slidepdf.com/reader/full/investor-presentation-q1-fy-2010-11 26/29
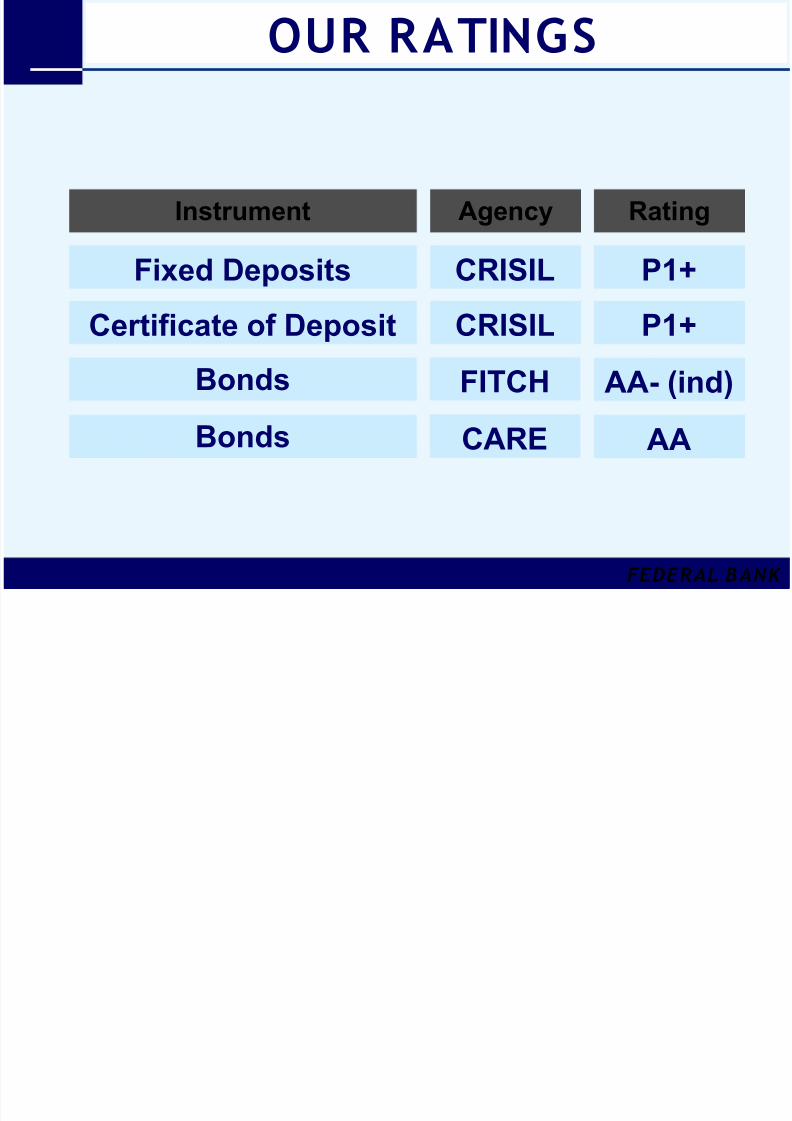
OUR RATINGS
FEDERAL BANK
Bonds
Certificate of DepositFixed Deposits CRISIL
CRISIL
FITCH AA- (ind)
P1+P1+
Instrument Agency Rating
Bonds CARE AA
S b idi i & i
8/8/2019 Investor Presentation - Q1 - FY 2010-11
http://slidepdf.com/reader/full/investor-presentation-q1-fy-2010-11 27/29
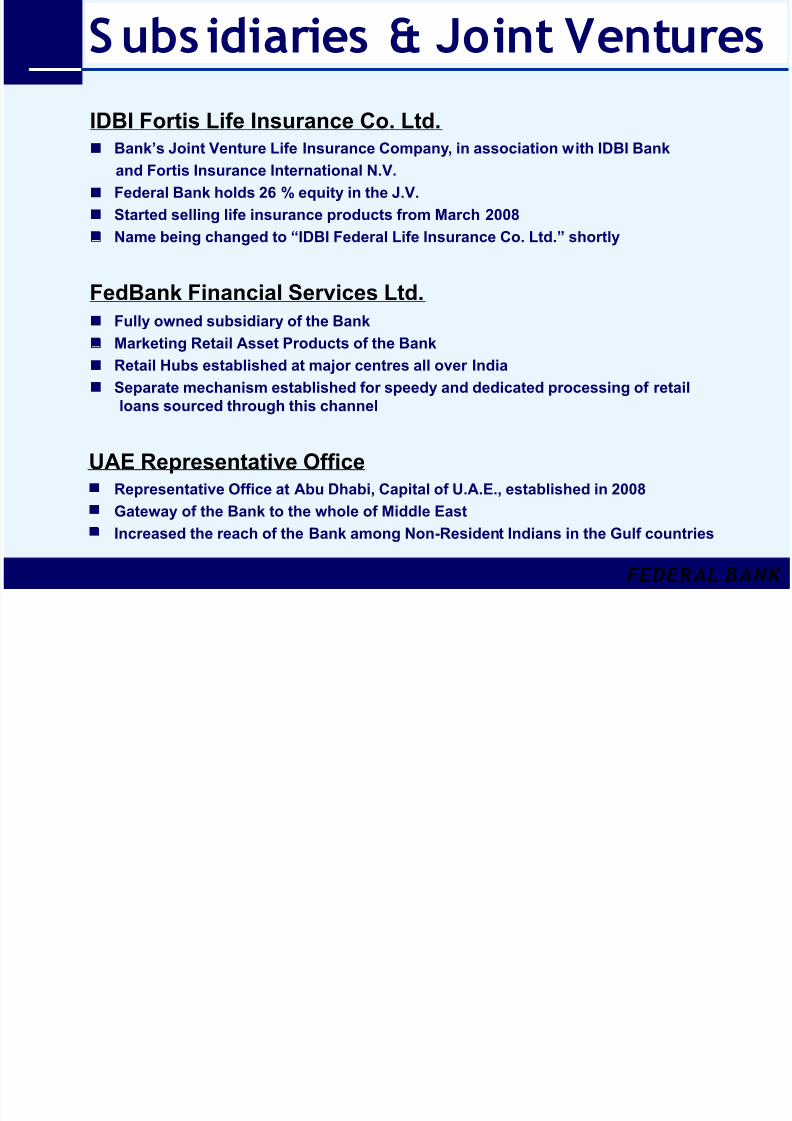
S ubs idiaries & Joint Ventures
FEDERAL BANK
IDBI Fortis Life Insurance Co. Ltd. Bank’s Joint Venture Life Insurance Company, in association with IDBI Bank
and Fortis Insurance International N.V.
Federal Bank holds 26 % equity in the J.V.
Started selling life insurance products from March 2008
Name being changed to “IDBI Federal Life Insurance Co. Ltd.” shortly
FedBank Financial Services Ltd.
Fully owned subsidiary of the Bank
Marketing Retail Asset Products of the Bank
Retail Hubs established at major centres all over India
Separate mechanism established for speedy and dedicated processing of retail
loans sourced through this channel
UAE Representative Office Representative Office at Abu Dhabi, Capital of U.A.E., established in 2008
Gateway of the Bank to the whole of Middle East
Increased the reach of the Bank among Non-Resident Indians in the Gulf countries
OWNERSHIP
8/8/2019 Investor Presentation - Q1 - FY 2010-11
http://slidepdf.com/reader/full/investor-presentation-q1-fy-2010-11 28/29
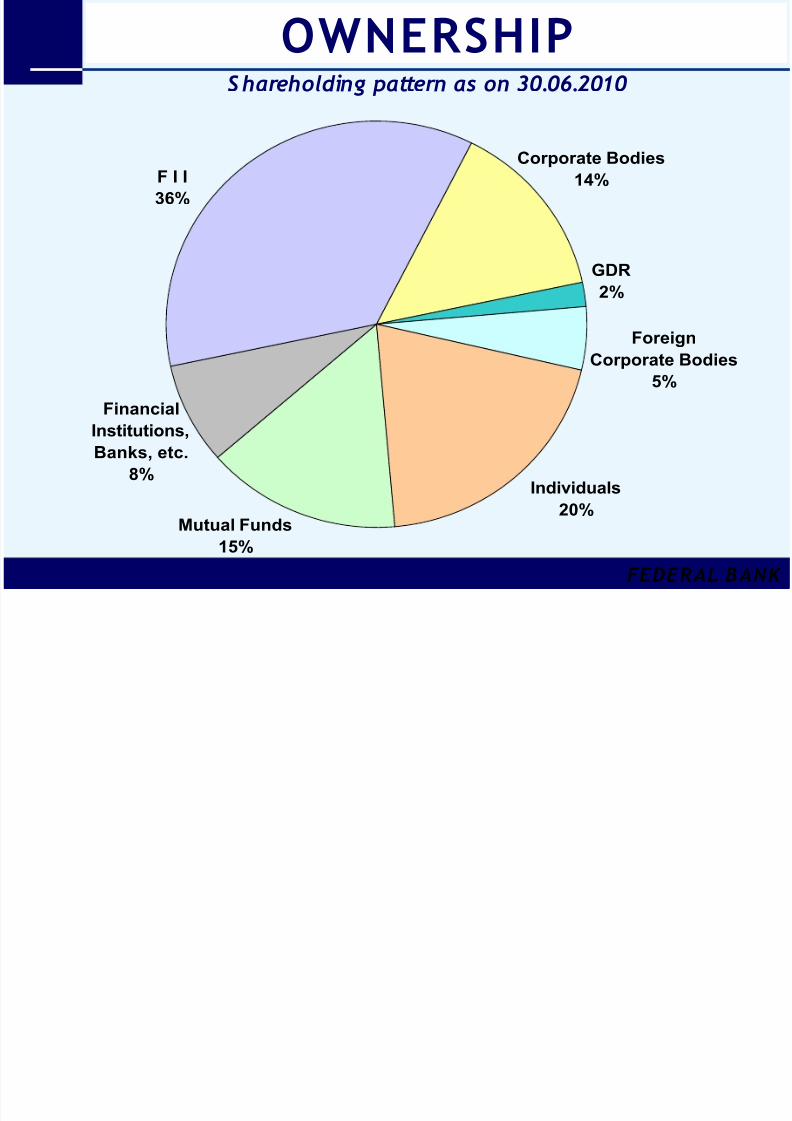
OWNERSHIP
FEDERAL BANK
F I I
36%
Corporate Bodies
14%
Individuals
20%
GDR
2%
Mutual Funds
15%
Financial
Institutions,
Banks, etc.
8%
Foreign
Corporate Bodies
5%
S hareholding pattern as on 30.06.2010

8/8/2019 Investor Presentation - Q1 - FY 2010-11
http://slidepdf.com/reader/full/investor-presentation-q1-fy-2010-11 29/29
FEDERAL BANK
THANK YOU


![Investor Presentation - Q2 FY 2015-16 [Company Update]](https://img.pdfslide.tips/doc/110x75/577ca7bd1a28abea748c88ad/investor-presentation-q2-fy-2015-16-company-update.jpg)
![Investor Presentation - Q1 FY 2015-16 [Company Update]](https://img.pdfslide.tips/doc/110x75/577cb2a71a28aba7118c2196/investor-presentation-q1-fy-2015-16-company-update.jpg)
![Investor Presentation Q-1 FY 2016 [Company Update]](https://img.pdfslide.tips/doc/110x75/577cb42f1a28aba7118c57e5/investor-presentation-q-1-fy-2016-company-update.jpg)


![Investor Presentation Q4 FY 2016 [Company Update]](https://img.pdfslide.tips/doc/110x75/577c7fb51a28abe054a5bb0b/investor-presentation-q4-fy-2016-company-update.jpg)