Embed Size (px)
Citation preview
econstor www.econstor.eu
Der Open-Access-Publikationsserver der ZBW – Leibniz-Informationszentrum WirtschaftThe Open Access Publication Server of the ZBW – Leibniz Information Centre for Economics
Standard-Nutzungsbedingungen:
Die Dokumente auf EconStor dürfen zu eigenen wissenschaftlichenZwecken und zum Privatgebrauch gespeichert und kopiert werden.
Sie dürfen die Dokumente nicht für öffentliche oder kommerzielleZwecke vervielfältigen, öffentlich ausstellen, öffentlich zugänglichmachen, vertreiben oder anderweitig nutzen.
Sofern die Verfasser die Dokumente unter Open-Content-Lizenzen(insbesondere CC-Lizenzen) zur Verfügung gestellt haben sollten,gelten abweichend von diesen Nutzungsbedingungen die in der dortgenannten Lizenz gewährten Nutzungsrechte.
Terms of use:
Documents in EconStor may be saved and copied for yourpersonal and scholarly purposes.
You are not to copy documents for public or commercialpurposes, to exhibit the documents publicly, to make thempublicly available on the internet, or to distribute or otherwiseuse the documents in public.
If the documents have been made available under an OpenContent Licence (especially Creative Commons Licences), youmay exercise further usage rights as specified in the indicatedlicence.
zbw Leibniz-Informationszentrum WirtschaftLeibniz Information Centre for Economics
Tol, Richard S. J.; Lyons, Seán
Working Paper
Incorporating GHG emission costs in the economicappraisal of projects supported by state developmentagencies
ESRI working paper, No. 247
Provided in Cooperation with:The Economic and Social Research Institute (ESRI), Dublin
Suggested Citation: Tol, Richard S. J.; Lyons, Seán (2008) : Incorporating GHG emission costsin the economic appraisal of projects supported by state development agencies, ESRI workingpaper, No. 247
This Version is available at:http://hdl.handle.net/10419/50095
www.esri.ie
Working Paper No. 247
June 2008
Incorporating GHG Emission Costs in the Economic Appraisal of Projects Supported by State Development Agencies*
Richard S.J Tola,b,c and Seán Lyonsa
Abstract: This paper sets out a methodology for updating an economic appraisal model to ensure that it takes appropriate account of costs arising from greenhouse gas emissions. While the analysis is based on the appraisal model used in Ireland, it should be broadly applicable to circumstances in any EU Member State; indeed, many features will be relevant in any jurisdiction subject to a carbon tax or participating in a carbon permit trading system.
Corresponding Authors: [email protected]; [email protected]
* This paper is based on research commissioned by Forfás in 2007. The views expressed here are those of the authors and not necessarily those of Forfás or the enterprise development agencies. Any errors or omissions are the authors' responsibility. We are grateful to Joe O’Doherty for research assistance. a Economic and Social Research Institute, Whitaker Square, Sir John Rogerson’s Quay, Dublin 2, Ireland. b Institute for Environmental Studies and Department of Spatial Economics, Vrije Universiteit, Amsterdam, The Netherlands. c Department of Engineering and Public Policy, Carnegie Mellon University, Pittsburgh, PA, USA.
ESRI working papers represent un-refereed work-in-progress by members who are solely responsible for the content and any views expressed therein. Any comments on these papers will be welcome and should be sent to the author(s) by email. Papers may only be downloaded for personal use only.
2
Incorporating GHG Emission Costs in the Economic Appraisal of Projects Supported by State Development Agencies
1. INTRODUCTION
Ireland’s industrial development agencies use a cost-benefit analysis model as part of the
process for evaluating whether particular projects merit state support. This model has
evolved over the years due to changes in the Irish economy and government industrial policy.
This paper considers how an economic appraisal model such as the one used in Ireland could
be updated to ensure that it takes appropriate account of costs to Ireland due to greenhouse
gas (GHG) emissions, specifically in the context of Ireland’s commitments under the Kyoto
Protocol and the EU proposals for emission targets for 2020, and in the context of the
domestic carbon tax currently being studied by the Commission on Taxation. This analysis
should be broadly applicable to circumstances in any EU Member State; indeed, many
features will be relevant in any jurisdiction subject to a carbon tax or participating in a carbon
permit trading system.
This paper is structured as follows. We start with a discussion of how greenhouse gas (GHG)
emissions may affect the economics of publicly supported projects and how evaluations of
such projects could be extended to take account of the cost of emissions to Ireland. Section 3
focuses on options for predicting the cost of CO2 emissions to Ireland, the key parameter in
making such an assessment. Since there are other GHG emissions than of CO2, we consider
in Section 4 how other gases might be accommodated. Section 5 provides a brief review of
how some international organisations incorporate GHG emissions costs in evaluations, and
we conclude the paper in Section 6.
2. EXTENDING ECONOMIC APPRAISAL MODELS TO TAKE EXPLICIT ACCOUNT OF GHG EFFECTS
Many projects supported by industrial development agencies affect total greenhouse gas
emissions. Most projects increase emissions, and this implies that emission reduction
elsewhere should increase or that more emission permits should be imported. A few projects
would decrease emissions (e.g., investment in renewable energy), and this implies that
3
emission reduction elsewhere would decrease or that less permits would be imported. These
emissions should be valued at the social shadow price of carbon dioxide emission reduction.1
There are two main channels through which costs of GHG emissions are likely to affect the
attractiveness of a proposed project.2 First, GHG emissions associated with the project will
impose costs on Ireland by raising its overall emissions level relative to target levels (and in
particular, those imposed under the Kyoto Protocol). We will refer to this as the social cost
of emissions, but it is also equal to the expected marginal cost borne by the Irish exchequer.
The second channel through which GHG emissions should enter project evaluations is by
increasing the private costs to the project developer. To the extent that the project has to buy
permits or pay taxes in respect of its GHG emissions, the project may be less profitable than
if emissions were free. Profitability is included among the benefit parameters, so such costs
would have the effect of reducing estimated benefits. However, if the project bears some or
all of the costs of its emissions directly, it should be given credit for this expenditure when
calculating the social costs of the emissions. This is probably best done by reducing the
estimated social costs by an amount equal to the private costs.
For example, if a project was being undertaken by a firm that is subject to a carbon tax, and
the tax was equal to the price of emission permits on the European market, the net cost of the
emissions to Ireland would be fully borne by the project. No further social costs should be
charged to this project when it is being evaluated. To the extent that a project that does not
bear the full cost of its GHG emissions, either because it is not subject to a tax or permit
scheme or because it receives grandparented permits, the excess of social cost over private
cost should be charged to the project in the evaluation.
Estimating the social and private costs of emissions by a project requires that the appraisal
model include a range of new parameters. These may be divided into project-specific
1 The shadow price of carbon dioxide is the true cost to society if emissions were increased by a small amount. The shadow price of a good equals its market price only if there is a perfect market. The market for greenhouse gas emissions is imperfect..
2 We also recognise that some projects may give rise to benefits by reducing GHG emissions, for example by directly supporting innovation in emission-reducing technologies or by substituting for existing (more GHG-intensive) production methods. However, it is likely to be more efficient to take such benefits into account on a case-by-case basis rather than requiring them to be assessed for all projects.
4
parameters and economic parameters that should apply across all projects. Project
parameters include:
Annual forecasts of the quantity of each greenhouse gas that the project is expected to
produce. Only incremental emissions should be included: project extensions should include
only emissions associated with the extension, not the original project. These forecasts might
be obtained through the evaluation process in the same way as other cost items, such as
electricity costs. Projects for which energy costs are substantial are likely to have estimates
of expected energy use and price by energy type (even if the economic appraisal requires
only that total electricity costs be included). Emission factors can be obtained from
http://www.sei.ie/index.asp?locID=72&docID=-1. Emissions of other greenhouse gas require
an IPPC license and should be estimated anyway, although these would be zero for many
projects.
An indicator will be needed for whether a project falls within the European Emission Trading
Scheme (EU-ETS), or not. If it is in the ETS, data will be required on the number or share of
permits that will be provided to the project through grandparenting arrangements, these
factors will be needed to calculate the private cost borne by the project.
Similarly, an indicator should be included as to whether any carbon tax applies, and if so, the
amounts expected to be paid in each year of the project evaluation period. While there is
currently no carbon tax in Ireland, this feature will provide flexibility against the possibility
that such a measure might be in place in the future.
A variable should be included to incorporate energy related emissions arising from a project.
As well as direct process emission of GHGs, many projects will give rise to indirect
emissions through the use of electricity and transport services. At present, predicted annual
energy costs are entered into the model in nominal terms, with no indication of the assumed
quantities and prices of energy that underlie them. This is problematic, because for a given
project it is difficult to know whether the assumed prices include likely future costs of GHG
emissions or not. In order to incorporate these sources of emissions into the model, we could
either impute a GHG quantity based on assumed future price movements and the average
sectoral GHG content of energy used, or we could require that expected quantities of
different types of energy used be reported for each project (e.g. electricity, gas, etc.). In
principle, the same could be done for emissions caused by use of transport services, but these
are likely to be less significant for most projects seeking support from the industrial
development agencies.
Economic parameters should include:
• The marginal cost to Ireland if a unit (say, a tonne) of CO2 is emitted in a given year. At
present, the government purchases carbon dioxide emission allowances so as to offset
Ireland’s excess emissions. The shadow price of emissions therefore equals the price of
such allowances. Also in the future, emission reduction abroad is likely to be cheaper than
domestic emission reduction, so that the price of imported allowances will continue to set
the shadow price of emission reduction in Ireland. These emissions “prices” will be
required for each year covered by an evaluation model, so at any given time, predictions
will be needed covering the next 7-10 years. Possible sources for these data are discussed
in Section 3 below.
• A consistent way to arrive at “prices” for emission of non-CO2 greenhouse gases will also
be required. Methods for calculating these are discussed in Section 4 below.
It is also worth noting that climate policy puts constraints on investment options. At the
moment, such constraints are restricted to power generation (e.g., the renewables target) and
to transport (e.g., the biofuels target). However, at present any such constraints on a project
seeking support could probably be handled in the qualitative elements of the appraisal.
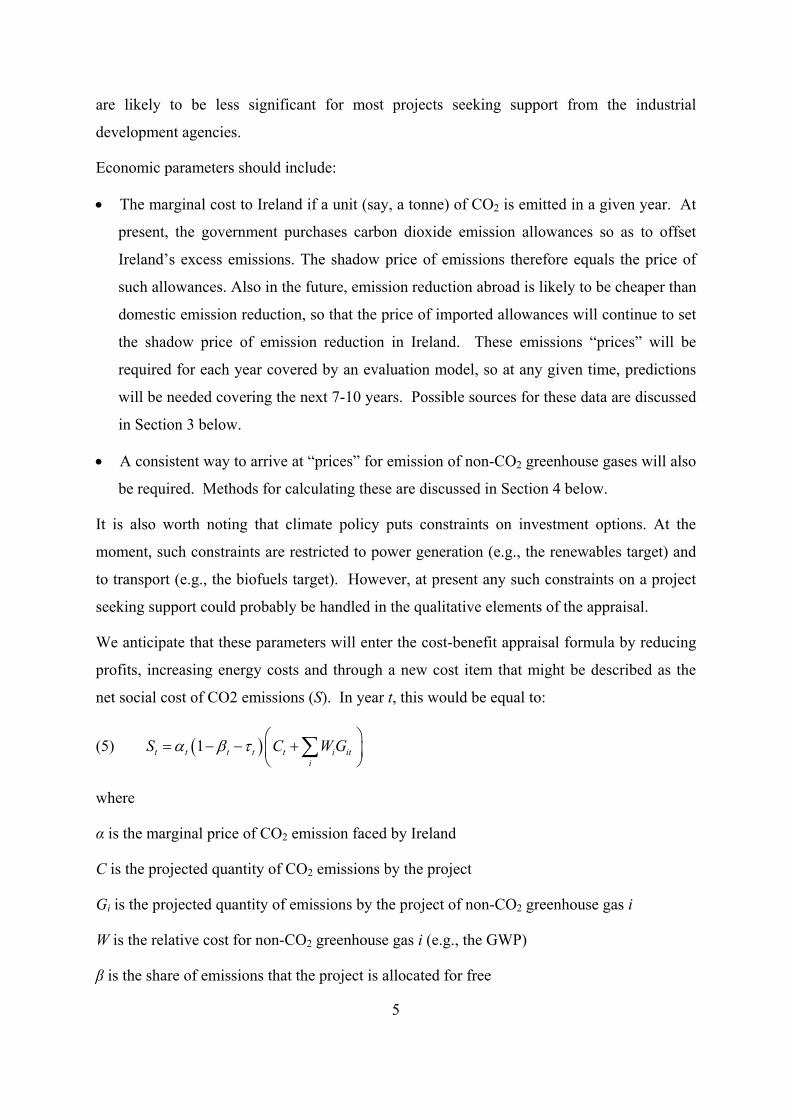
We anticipate that these parameters will enter the cost-benefit appraisal formula by reducing
profits, increasing energy costs and through a new cost item that might be described as the
net social cost of CO2 emissions (S). In year t, this would be equal to:
5
W G(5) ( )1t t t t t i iti
S Cα β τ ⎛ ⎞= − − +⎜ ⎟⎝ ⎠
∑
where
α is the marginal price of CO2 emission faced by Ireland
C is the projected quantity of CO2 emissions by the project
Gi is the projected quantity of emissions by the project of non-CO2 greenhouse gas i
W is the relative cost for non-CO2 greenhouse gas i (e.g., the GWP)
β is the share of emissions that the project is allocated for free
6
τ is the average tax rate applicable to emissions by the project
In the remaining sections of this paper, we focus on options available for obtaining GHG
emissions price estimates to be used in the model. We return to the issue of how the model
should be extended in the concluding section, where we classify several types of projects by
the way they would be captured under the model.
3. PREDICTING THE PRICE OF CARBON DIOXIDE EMISSIONS
There are various methods for pricing carbon dioxide emissions. Some approach the task
from a private perspective, and others from a social perspective. Some methods are very
complicated, but some of the simpler methods may be misleading. In this chapter, we discuss
the various options, their advantages and disadvantages, and their appropriateness for
evaluating investment decisions in Ireland. We divide the methods into those based on the
marginal damage cost of carbon dioxide; spot and futures prices in GHG permit markets;
financial econometrics and option pricing models; and methods based on climate change
models.
3.1 The marginal damage cost of carbon dioxide
The impacts of climate change on the economy and human welfare has been quantified in
monetary terms. The welfare loss due a small increase in emission is often called the
marginal damage cost of CO2 or the social cost of carbon. In economic jargon, this is the
Pigou tax, and it equals the net present value of the damage done by an infinitesimally small
increase in emissions along the optimal emission trajectory. From a global, social
perspective, carbon dioxide should be priced at a rate that corrects for the negative
externalities it causes – that is, its Pigou tax. However, not only are current estimates of the
social costs of carbon controversial and uncertain – Tol (2005) surveys the literature and
finds a range of -$4/tC to $1,666/tC – a private investor would align the price of carbon to
actual climate policy rather than to some idealised climate policy.
Nonetheless, the marginal damage cost estimate gives some guidance. Cost-benefit analysis
is one of the main guides to policy in the European Union, and cost-benefit analysis says that
the marginal costs of emission reduction (that is, the price of carbon permits, or the carbon
tax) should equal the marginal damage costs. The marginal damage costs are therefore an
indication of whether actual climate policy is too lenient or too strict, and may help to predict
in which direction climate policy is moving. The World Bank and HM Treasury use estimates
of the marginal damage costs as indicative of carbon prices (see section 5).
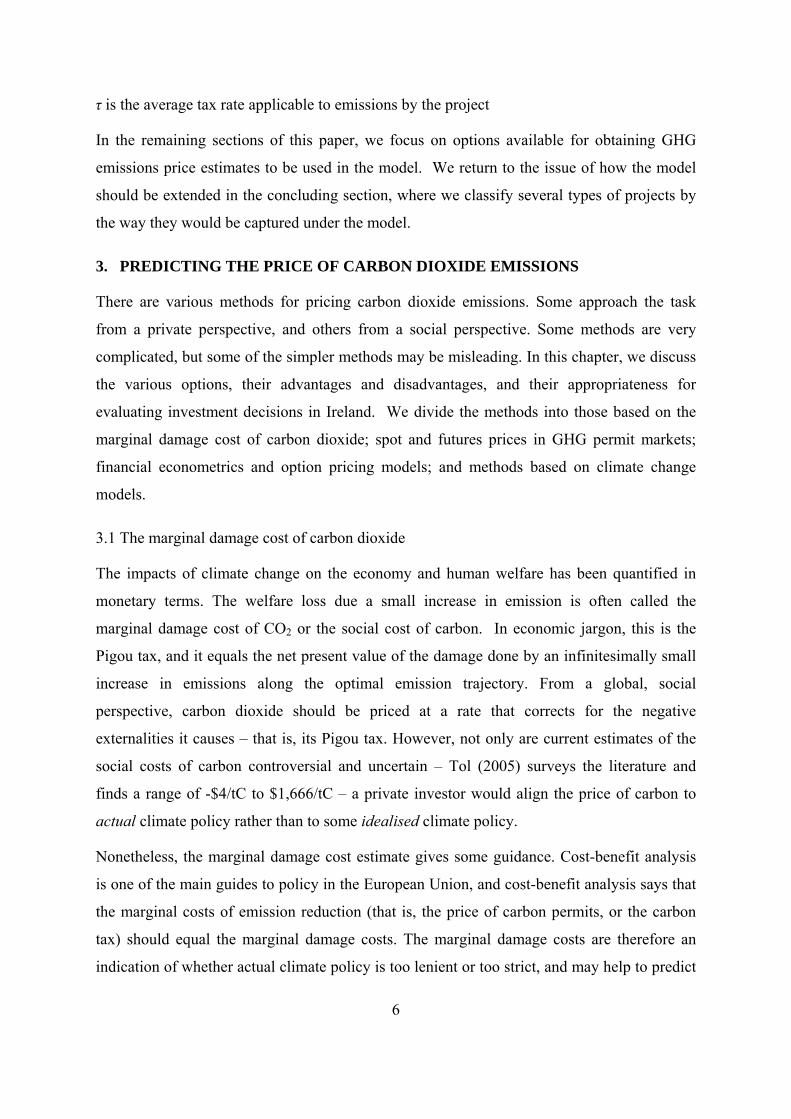
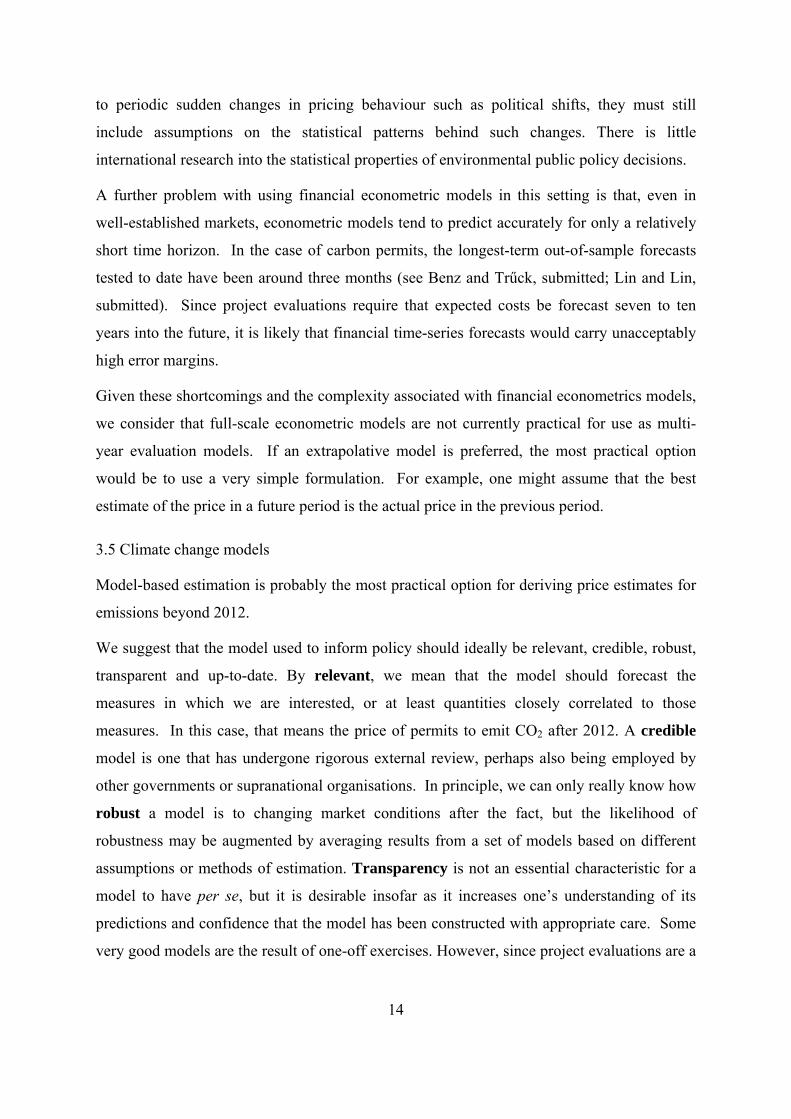
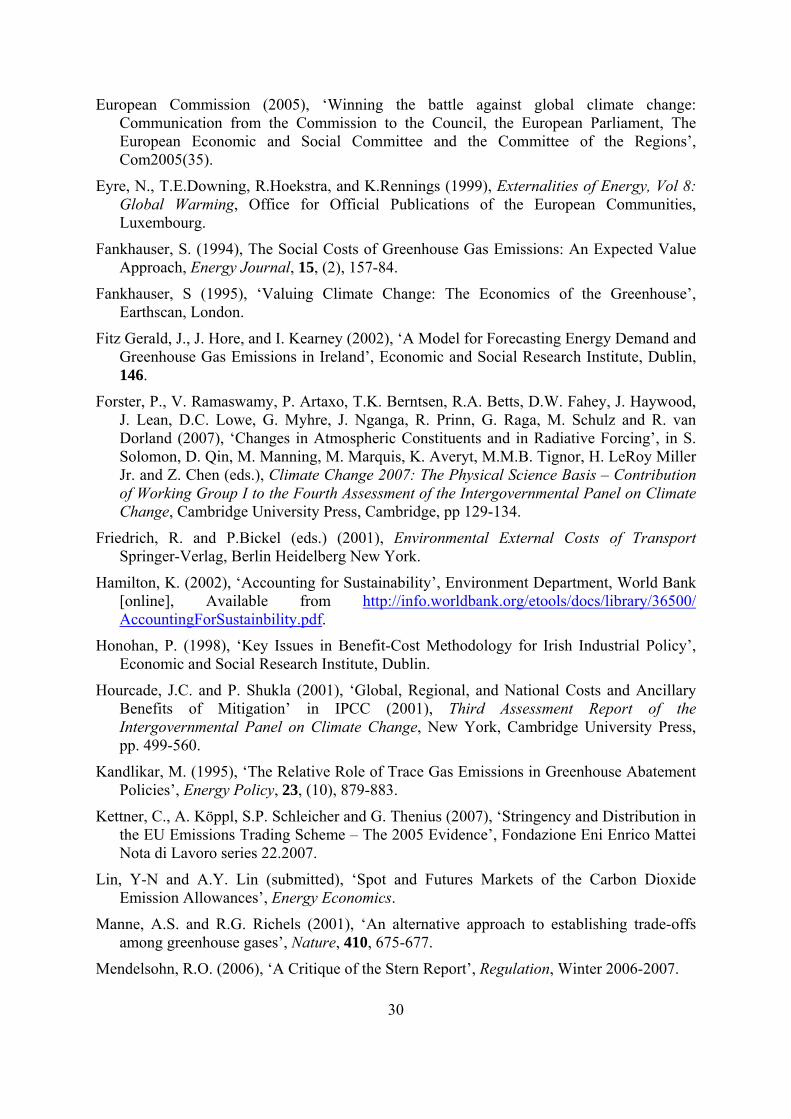
Although the marginal damage cost is theoretically appealing, its practical usefulness is
limited. Figure 1 shows a probability density function of published estimates of the marginal
damage costs of carbon dioxide emissions, indicating the range of estimates that exist. The
uncertainty is very large. This is partly because future emissions and climate change are so
uncertain; the latest report of the Intergovernmental Panel on Climate Change (IPCC) states
that warming may be anywhere in between 1.1˚C and 6.4˚C by 2100.
0.0000
0.0005
0.0010
0.0015
0.0020
0.0025
0.0030
-250 0 250 500 750 1000 1250 1500 1750 2000 2250
dollar per tonne of carbon
prob
abili
ty
Figure 1: The range of estimates of the marginal damage cost of carbon dioxide3
Estimates of the impacts of climate change add a further layer of uncertainty. Impact
estimates are incomplete, and different studies include different impacts while some studies
add an arbitrary provision for “missing impacts”. Furthermore, impact estimates depend
3 Figure 1 shows the probability density function (PDF) of the marginal damage costs of climate change. The PDF is a kernel-density of the 210 estimates of Tol (submitted). The kernel imputes a Fisher-Tippett PDF for each observation, using the best guess of each study as the mode, and the standard deviation of all studies at the standard deviation. These PDFs are aggregated using the author-quality weights defined in Tol (2005).
7
8
strongly on quasi-empirical, quasi-ethical parameters, particularly the rates of time
preference, risk aversion, and inequity aversion. That is, the impacts of climate change will
occur in the distant future, are very uncertain, and will largely fall on faraway lands. The
empirical evidence on how much people and governments care about such matters is
ambiguous.
3.2 The current price of carbon permits
A more attractive option is to use the valuation of carbon dioxide emissions as revealed in
market information. This should have the advantage of combining the information and
preferences from large numbers of firms with a strong interest in accurate pricing. This sub-
section and the following one set out market-based methods.
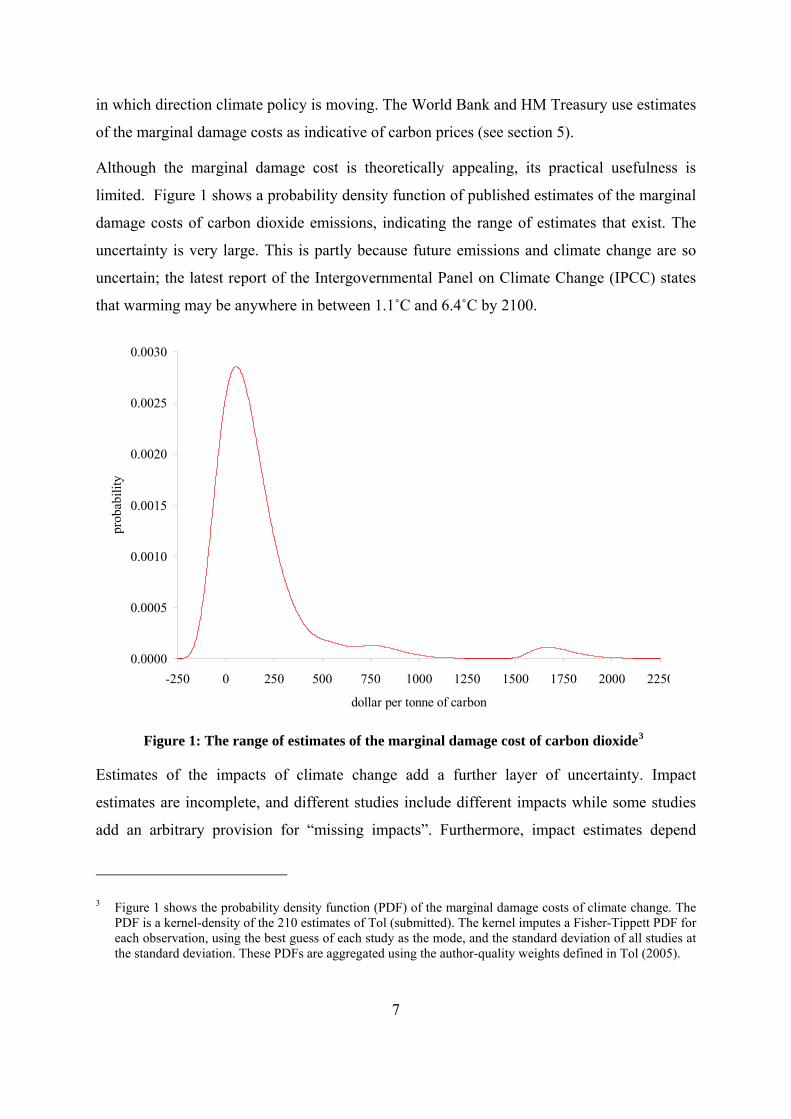
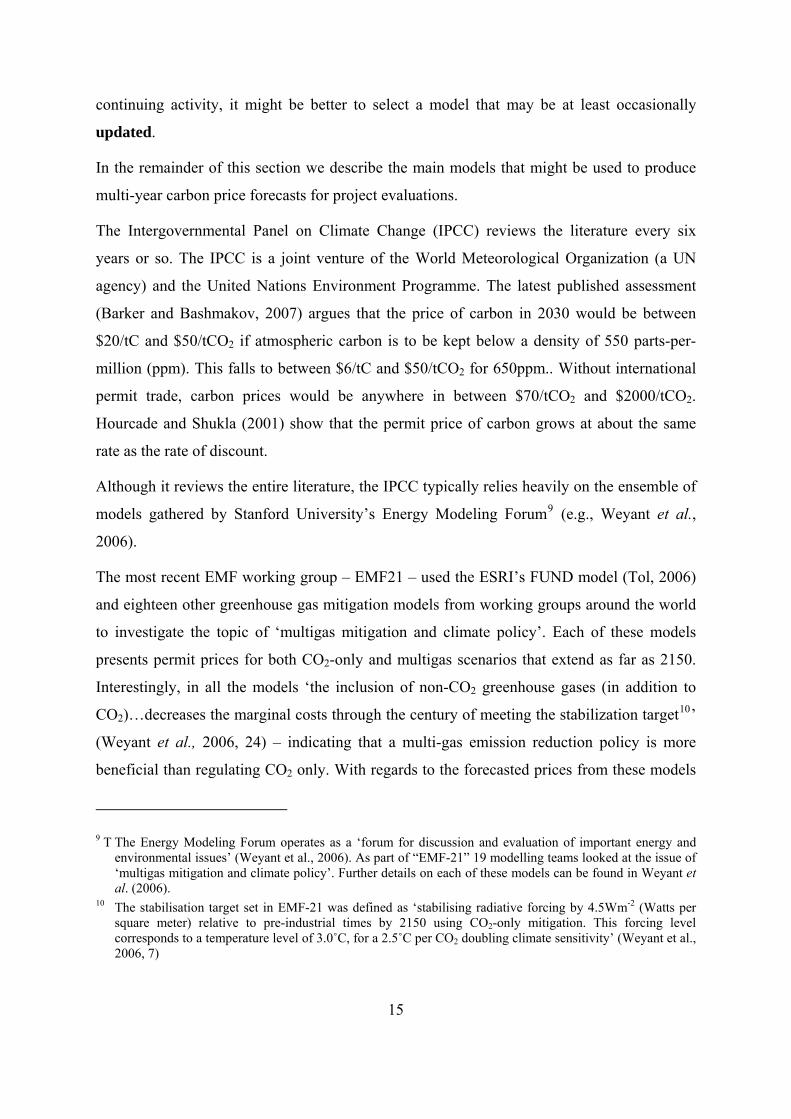
With the establishment of the European Trading System (EU-ETS) for carbon dioxide
emission permits , a price for carbon emissions was created. The EU-ETS began trading on 1
January 2005. Prices in this market have been highly volatile – ranging from a high of over
€30 to a low of one cent and back up to the current value of €26 per tonne of carbon dioxide
emitted (spot-price). See Figure 2. The deep trough in prices was apparently due to a market
perception that the permit allocations were generous relative to the expected emissions.
Indeed, recent academic studies (Ellerman and Buchner, 2006; Kettner et al., 2007) also point
to over-allocation of emission allowances.
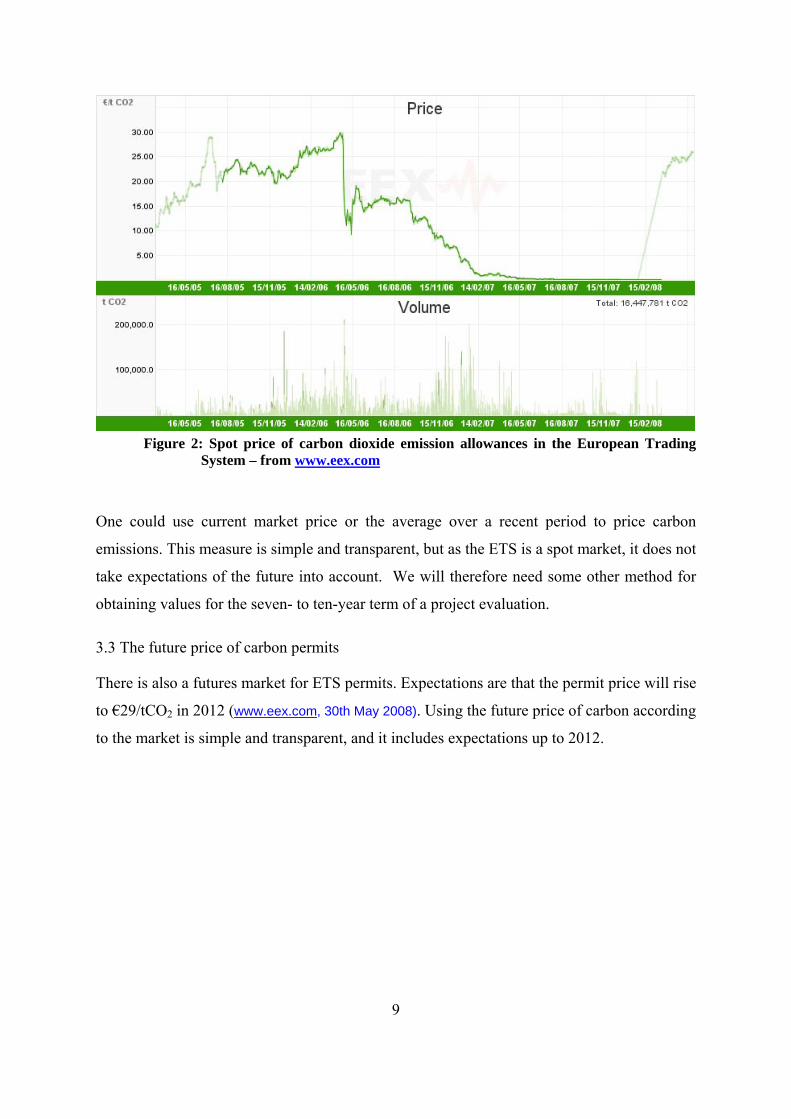
Figure 2: Spot price of carbon dioxide emission allowances in the European Trading
System – from www.eex.com
One could use current market price or the average over a recent period to price carbon
emissions. This measure is simple and transparent, but as the ETS is a spot market, it does not
take expectations of the future into account. We will therefore need some other method for
obtaining values for the seven- to ten-year term of a project evaluation.
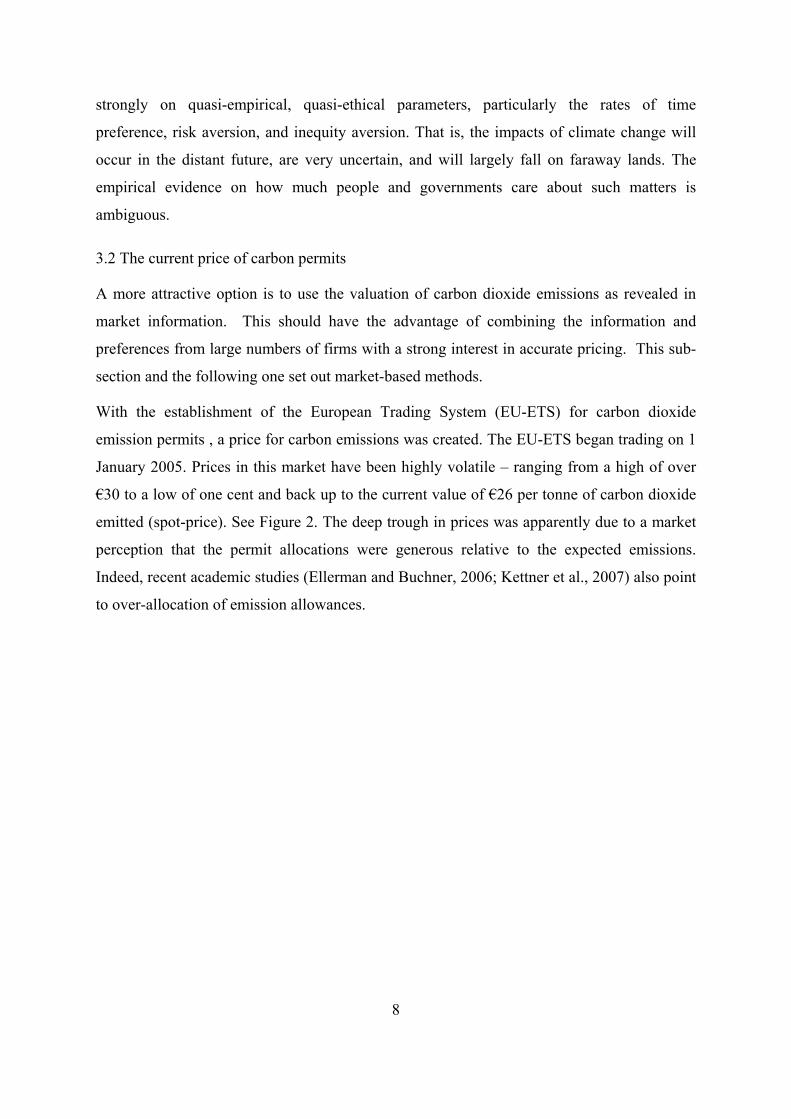
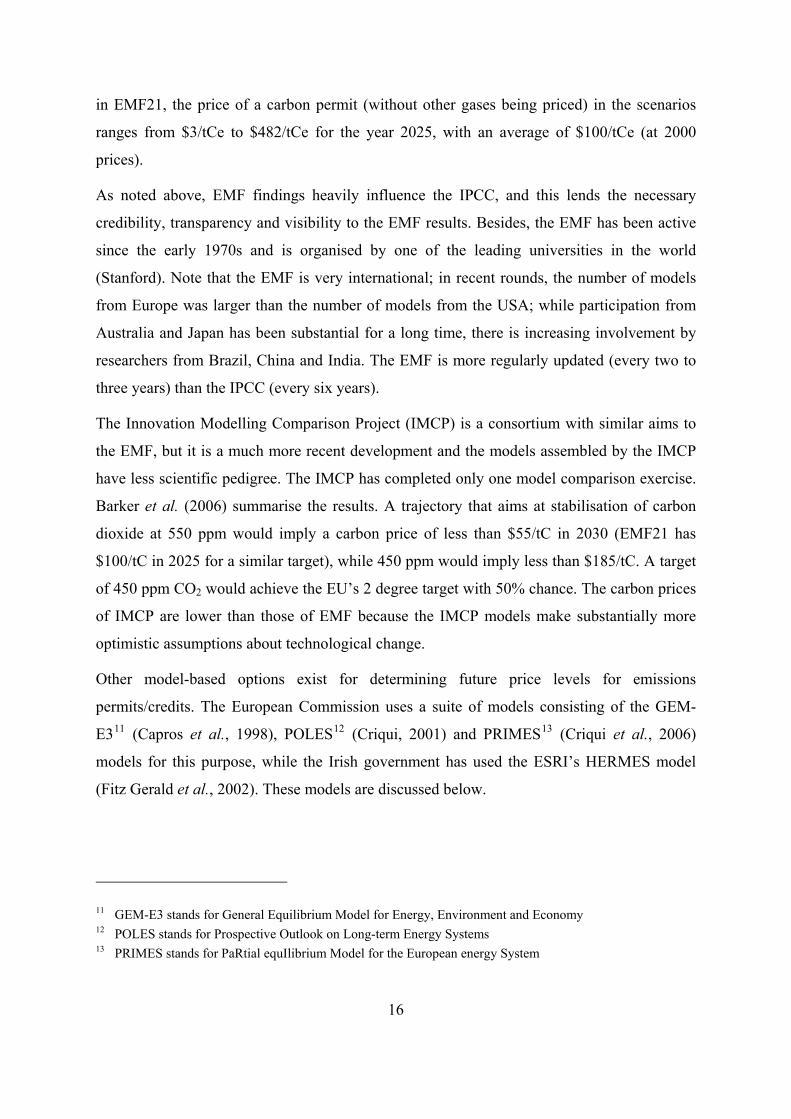
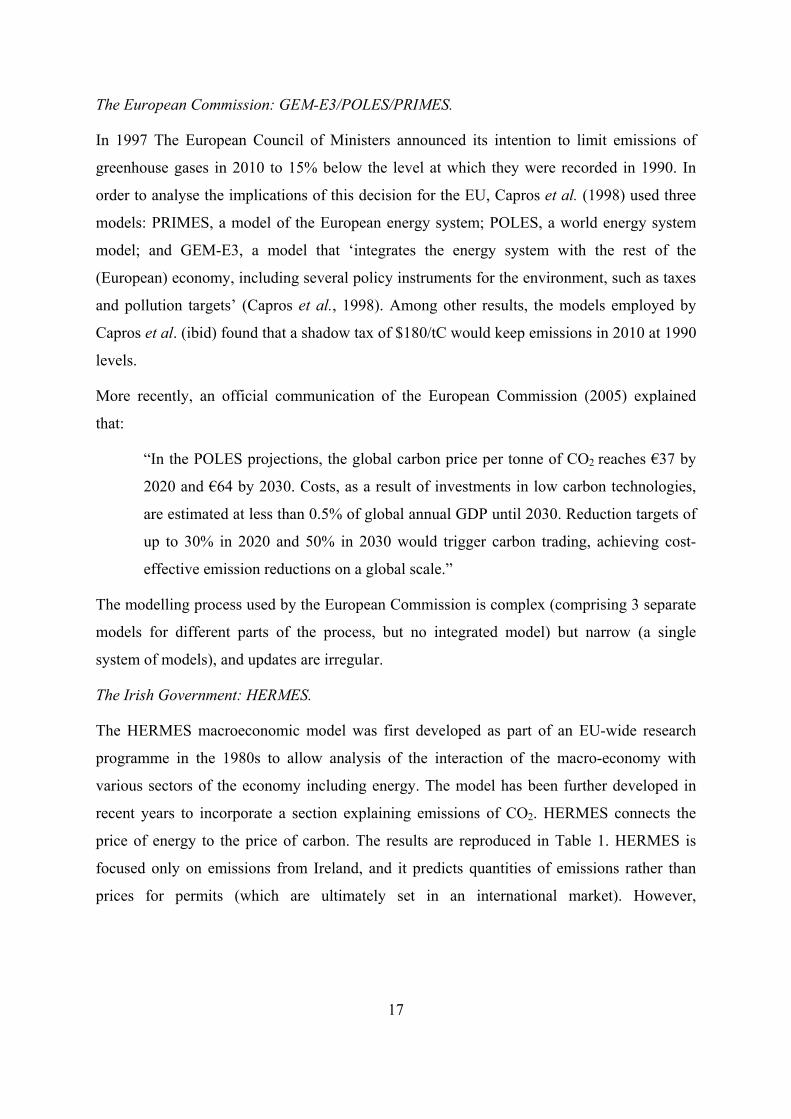
3.3 The future price of carbon permits
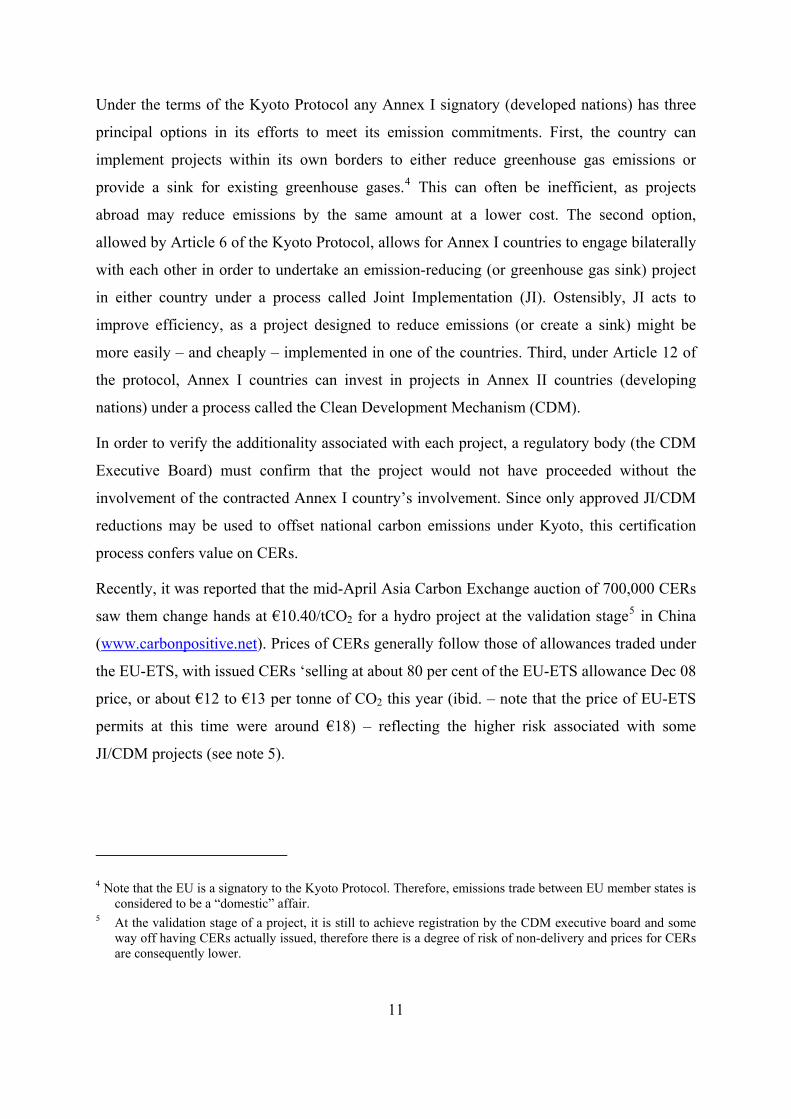
There is also a futures market for ETS permits. Expectations are that the permit price will rise
to €29/tCO2 in 2012 (www.eex.com, 30th May 2008). Using the future price of carbon according
to the market is simple and transparent, and it includes expectations up to 2012.
9
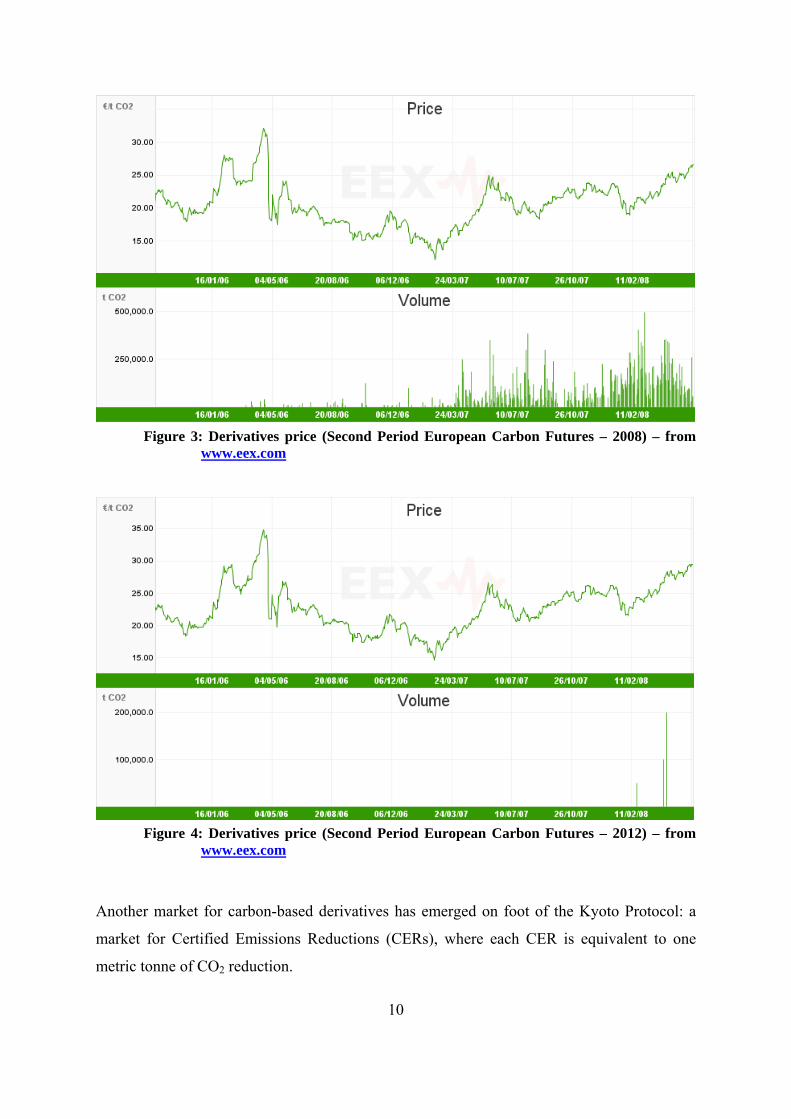
Figure 3: Derivatives price (Second Period European Carbon Futures – 2008) – from
www.eex.com
Figure 4: Derivatives price (Second Period European Carbon Futures – 2012) – from
www.eex.com
Another market for carbon-based derivatives has emerged on foot of the Kyoto Protocol: a
market for Certified Emissions Reductions (CERs), where each CER is equivalent to one
metric tonne of CO2 reduction.
10
11
anism (CDM).
Under the terms of the Kyoto Protocol any Annex I signatory (developed nations) has three
principal options in its efforts to meet its emission commitments. First, the country can
implement projects within its own borders to either reduce greenhouse gas emissions or
provide a sink for existing greenhouse gases.4 This can often be inefficient, as projects
abroad may reduce emissions by the same amount at a lower cost. The second option,
allowed by Article 6 of the Kyoto Protocol, allows for Annex I countries to engage bilaterally
with each other in order to undertake an emission-reducing (or greenhouse gas sink) project
in either country under a process called Joint Implementation (JI). Ostensibly, JI acts to
improve efficiency, as a project designed to reduce emissions (or create a sink) might be
more easily – and cheaply – implemented in one of the countries. Third, under Article 12 of
the protocol, Annex I countries can invest in projects in Annex II countries (developing
nations) under a process called the Clean Development Mech
In order to verify the additionality associated with each project, a regulatory body (the CDM
Executive Board) must confirm that the project would not have proceeded without the
involvement of the contracted Annex I country’s involvement. Since only approved JI/CDM
reductions may be used to offset national carbon emissions under Kyoto, this certification
process confers value on CERs.
Recently, it was reported that the mid-April Asia Carbon Exchange auction of 700,000 CERs
saw them change hands at €10.40/tCO2 for a hydro project at the validation stage5 in China
(www.carbonpositive.net). Prices of CERs generally follow those of allowances traded under
the EU-ETS, with issued CERs ‘selling at about 80 per cent of the EU-ETS allowance Dec 08
price, or about €12 to €13 per tonne of CO2 this year (ibid. – note that the price of EU-ETS
permits at this time were around €18) – reflecting the higher risk associated with some
JI/CDM projects (see note 5).
4 Note that the EU is a signatory to the Kyoto Protocol. Therefore, emissions trade between EU member states is considered to be a “domestic” affair.
5 At the validation stage of a project, it is still to achieve registration by the CDM executive board and some way off having CERs actually issued, therefore there is a degree of risk of non-delivery and prices for CERs are consequently lower.
12
However, CERs are traded as bundles (in projects) rather than in units; the administrative
costs are high; and regulatory approval is cumbersome. Therefore, the CER market has not
seen many transactions, and price data is therefore scarce and difficult to interpret.
3.4 Financial econometrics and option pricing models
As discussed earlier, the futures market for ETS carbon permits currently extends only to
2012. Since project assessments extend for seven to ten years, we are left with the question
of how to arrive at price estimates beyond this date.
There are two main methods for making forecasts of this kind: financial time-series
econometrics, which essentially involves extrapolating from historical information, and
model-based estimation. In this sub-section, we consider the first of these approaches.
Financial time-series econometric techniques use information about past behaviour of an
asset’s spot and futures prices to predict future price levels and volatility. These tools are
highly developed and are widely used to analyse price movements in a diverse range of asset
markets, including those for equities, bonds, currencies and commodities.
The basic premise behind these techniques is that the price of a particular asset can be
characterised in statistical terms, normally as a “stochastic” process (i.e. one made up of a
mixture of random and deterministic components). If this process can be identified and its
parameters measured accurately, a modeller should be able to predict the expected price of
the asset at a given point in the future with a specified level of confidence, based on the
asset’s current price level and recent price movements.
Option pricing theory takes this type of analysis a step further. Again assuming that the
stochastic process associated with an asset’s price has been properly characterised, option
pricing models allow the modeller to calculate the expected cost of purchasing a guarantee as
to the price of the asset at a specific future point in time. For example, this approach might in
principle be used to estimate the cost of ensuring that the carbon permit price faced by a
project would not exceed a pre-set ceiling during the project’s life.
13
There is active academic research internationally into the appropriate way to model carbon
permit prices.6 While research to date has revealed some of the statistical properties of
carbon price series, there is as yet no consensus on the best specification to use for modelling
these prices. It is clear that ETS carbon permit prices are influenced both by “market
fundamentals” such as the relative prices of different fuels and changes in marginal cost of
emissions within member countries7 and by policy factors such as decisions on the future
quantity and distribution of permits, as well as on the penalty for non-compliance (€40/tCO2
in 2007, €100/tCO2 in 2008-2012). These drivers are analogous to the determinants of prices
for other economic pollution control instruments such as tradable SO2 permits, but quite
different from the determinants of prices for financial assets like equities and bonds
(Daskalakis et al., 2006, p.12).
Most research thus far suggests that the most appropriate statistical representation of carbon
permit prices similarly involves a two-component approach. In essence, price movements
tend to move in line with a particular statistical process most of the time, but there are
occasional “jumps”, or changes in state, that may be very extreme, happen only occasionally
and seem to follow a different statistical pattern from normal period-to-period movements.
The precise choice of models to best represent the state-switching process and the “normal”
process are still under debate.
Ultimately, our purpose here is to determine whether this approach offers the best way to
predict future carbon permit prices for use in project evaluation. Financial time-series
econometrics and option pricing models work best for assets in well-established and highly
liquid markets, for which significant historical data are available. Where these conditions do
not hold, it is difficult to be confident that such models (dependent as they are on the
assumption that historical patterns will continue) can accurately predict future values. This
problem is likely to be acute in the case of carbon permit markets, where markets are
relatively new, illiquid (trading is “virtually zero” on some days)8 and heavily influenced by
policy changes. Although financial econometric models can accommodate variables that lead
6 See Lin and Lin, submitted, p.6, for a concise recent survey. 7 Paolella and Taschini, 2006, pp.11-12. 8 Uhrig-Homberg and Wagner (2006, p.6). However, there are suggestions that the liquidity of these markets
is likely to rise over time: Paolella and Taschini, 2006, p.11.
14
to periodic sudden changes in pricing behaviour such as political shifts, they must still
include assumptions on the statistical patterns behind such changes. There is little
international research into the statistical properties of environmental public policy decisions.
A further problem with using financial econometric models in this setting is that, even in
well-established markets, econometric models tend to predict accurately for only a relatively
short time horizon. In the case of carbon permits, the longest-term out-of-sample forecasts
tested to date have been around three months (see Benz and Trűck, submitted; Lin and Lin,
submitted). Since project evaluations require that expected costs be forecast seven to ten
years into the future, it is likely that financial time-series forecasts would carry unacceptably
high error margins.
Given these shortcomings and the complexity associated with financial econometrics models,
we consider that full-scale econometric models are not currently practical for use as multi-
year evaluation models. If an extrapolative model is preferred, the most practical option
would be to use a very simple formulation. For example, one might assume that the best
estimate of the price in a future period is the actual price in the previous period.
3.5 Climate change models
Model-based estimation is probably the most practical option for deriving price estimates for
emissions beyond 2012.
We suggest that the model used to inform policy should ideally be relevant, credible, robust,
transparent and up-to-date. By relevant, we mean that the model should forecast the
measures in which we are interested, or at least quantities closely correlated to those
measures. In this case, that means the price of permits to emit CO2 after 2012. A credible
model is one that has undergone rigorous external review, perhaps also being employed by
other governments or supranational organisations. In principle, we can only really know how
robust a model is to changing market conditions after the fact, but the likelihood of
robustness may be augmented by averaging results from a set of models based on different
assumptions or methods of estimation. Transparency is not an essential characteristic for a
model to have per se, but it is desirable insofar as it increases one’s understanding of its
predictions and confidence that the model has been constructed with appropriate care. Some
very good models are the result of one-off exercises. However, since project evaluations are a
15
continuing activity, it might be better to select a model that may be at least occasionally
updated.
In the remainder of this section we describe the main models that might be used to produce
multi-year carbon price forecasts for project evaluations.
The Intergovernmental Panel on Climate Change (IPCC) reviews the literature every six
years or so. The IPCC is a joint venture of the World Meteorological Organization (a UN
agency) and the United Nations Environment Programme. The latest published assessment
(Barker and Bashmakov, 2007) argues that the price of carbon in 2030 would be between
$20/tC and $50/tCO2 if atmospheric carbon is to be kept below a density of 550 parts-per-
million (ppm). This falls to between $6/tC and $50/tCO2 for 650ppm.. Without international
permit trade, carbon prices would be anywhere in between $70/tCO2 and $2000/tCO2.
Hourcade and Shukla (2001) show that the permit price of carbon grows at about the same
rate as the rate of discount.
Although it reviews the entire literature, the IPCC typically relies heavily on the ensemble of
models gathered by Stanford University’s Energy Modeling Forum9 (e.g., Weyant et al.,
2006).
The most recent EMF working group – EMF21 – used the ESRI’s FUND model (Tol, 2006)
and eighteen other greenhouse gas mitigation models from working groups around the world
to investigate the topic of ‘multigas mitigation and climate policy’. Each of these models
presents permit prices for both CO2-only and multigas scenarios that extend as far as 2150.
Interestingly, in all the models ‘the inclusion of non-CO2 greenhouse gases (in addition to
CO2)…decreases the marginal costs through the century of meeting the stabilization target10’
(Weyant et al., 2006, 24) – indicating that a multi-gas emission reduction policy is more
beneficial than regulating CO2 only. With regards to the forecasted prices from these models
9 T The Energy Modeling Forum operates as a ‘forum for discussion and evaluation of important energy and environmental issues’ (Weyant et al., 2006). As part of “EMF-21” 19 modelling teams looked at the issue of ‘multigas mitigation and climate policy’. Further details on each of these models can be found in Weyant et al. (2006).
10 The stabilisation target set in EMF-21 was defined as ‘stabilising radiative forcing by 4.5Wm-2 (Watts per square meter) relative to pre-industrial times by 2150 using CO2-only mitigation. This forcing level corresponds to a temperature level of 3.0˚C, for a 2.5˚C per CO2 doubling climate sensitivity’ (Weyant et al., 2006, 7)
16
in EMF21, the price of a carbon permit (without other gases being priced) in the scenarios
ranges from $3/tCe to $482/tCe for the year 2025, with an average of $100/tCe (at 2000
prices).
As noted above, EMF findings heavily influence the IPCC, and this lends the necessary
credibility, transparency and visibility to the EMF results. Besides, the EMF has been active
since the early 1970s and is organised by one of the leading universities in the world
(Stanford). Note that the EMF is very international; in recent rounds, the number of models
from Europe was larger than the number of models from the USA; while participation from
Australia and Japan has been substantial for a long time, there is increasing involvement by
researchers from Brazil, China and India. The EMF is more regularly updated (every two to
three years) than the IPCC (every six years).
The Innovation Modelling Comparison Project (IMCP) is a consortium with similar aims to
the EMF, but it is a much more recent development and the models assembled by the IMCP
have less scientific pedigree. The IMCP has completed only one model comparison exercise.
Barker et al. (2006) summarise the results. A trajectory that aims at stabilisation of carbon
dioxide at 550 ppm would imply a carbon price of less than $55/tC in 2030 (EMF21 has
$100/tC in 2025 for a similar target), while 450 ppm would imply less than $185/tC. A target
of 450 ppm CO2 would achieve the EU’s 2 degree target with 50% chance. The carbon prices
of IMCP are lower than those of EMF because the IMCP models make substantially more
optimistic assumptions about technological change.
Other model-based options exist for determining future price levels for emissions
permits/credits. The European Commission uses a suite of models consisting of the GEM-
E311 (Capros et al., 1998), POLES12 (Criqui, 2001) and PRIMES13 (Criqui et al., 2006)
models for this purpose, while the Irish government has used the ESRI’s HERMES model
(Fitz Gerald et al., 2002). These models are discussed below.
11 GEM-E3 stands for General Equilibrium Model for Energy, Environment and Economy 12 POLES stands for Prospective Outlook on Long-term Energy Systems 13 PRIMES stands for PaRtial equIlibrium Model for the European energy System
17
The European Commission: GEM-E3/POLES/PRIMES.
In 1997 The European Council of Ministers announced its intention to limit emissions of
greenhouse gases in 2010 to 15% below the level at which they were recorded in 1990. In
order to analyse the implications of this decision for the EU, Capros et al. (1998) used three
models: PRIMES, a model of the European energy system; POLES, a world energy system
model; and GEM-E3, a model that ‘integrates the energy system with the rest of the
(European) economy, including several policy instruments for the environment, such as taxes
and pollution targets’ (Capros et al., 1998). Among other results, the models employed by
Capros et al. (ibid) found that a shadow tax of $180/tC would keep emissions in 2010 at 1990
levels.
More recently, an official communication of the European Commission (2005) explained
that:
“In the POLES projections, the global carbon price per tonne of CO2 reaches €37 by
2020 and €64 by 2030. Costs, as a result of investments in low carbon technologies,
are estimated at less than 0.5% of global annual GDP until 2030. Reduction targets of
up to 30% in 2020 and 50% in 2030 would trigger carbon trading, achieving cost-
effective emission reductions on a global scale.”
The modelling process used by the European Commission is complex (comprising 3 separate
models for different parts of the process, but no integrated model) but narrow (a single
system of models), and updates are irregular.
The Irish Government: HERMES.
The HERMES macroeconomic model was first developed as part of an EU-wide research
programme in the 1980s to allow analysis of the interaction of the macro-economy with
various sectors of the economy including energy. The model has been further developed in
recent years to incorporate a section explaining emissions of CO2. HERMES connects the
price of energy to the price of carbon. The results are reproduced in Table 1. HERMES is
focused only on emissions from Ireland, and it predicts quantities of emissions rather than
prices for permits (which are ultimately set in an international market). However,
18
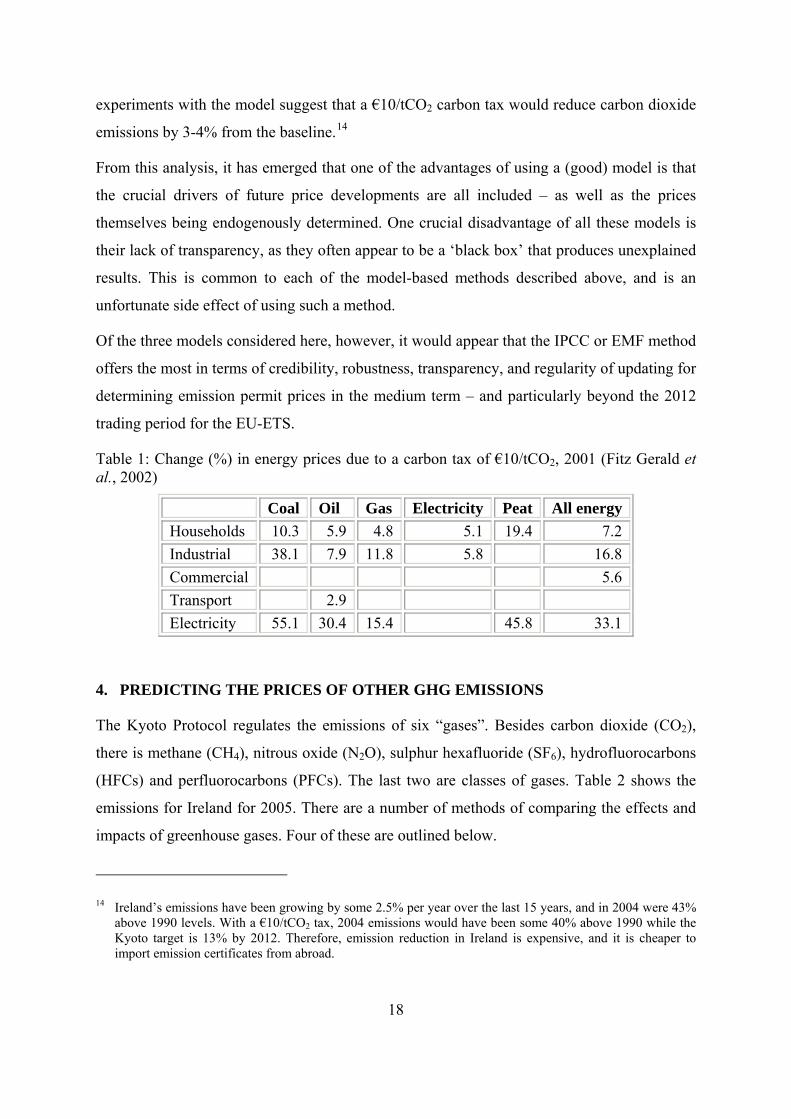
experiments with the model suggest that a €10/tCO2 carbon tax would reduce carbon dioxide
emissions by 3-4% from the baseline.14
From this analysis, it has emerged that one of the advantages of using a (good) model is that
the crucial drivers of future price developments are all included – as well as the prices
themselves being endogenously determined. One crucial disadvantage of all these models is
their lack of transparency, as they often appear to be a ‘black box’ that produces unexplained
results. This is common to each of the model-based methods described above, and is an
unfortunate side effect of using such a method.
Of the three models considered here, however, it would appear that the IPCC or EMF method
offers the most in terms of credibility, robustness, transparency, and regularity of updating for
determining emission permit prices in the medium term – and particularly beyond the 2012
trading period for the EU-ETS.
Table 1: Change (%) in energy prices due to a carbon tax of €10/tCO2, 2001 (Fitz Gerald et al., 2002)
Coal Oil Gas Electricity Peat All energy Households 10.3 5.9 4.8 5.1 19.4 7.2 Industrial 38.1 7.9 11.8 5.8 16.8 Commercial 5.6 Transport 2.9 Electricity 55.1 30.4 15.4 45.8 33.1
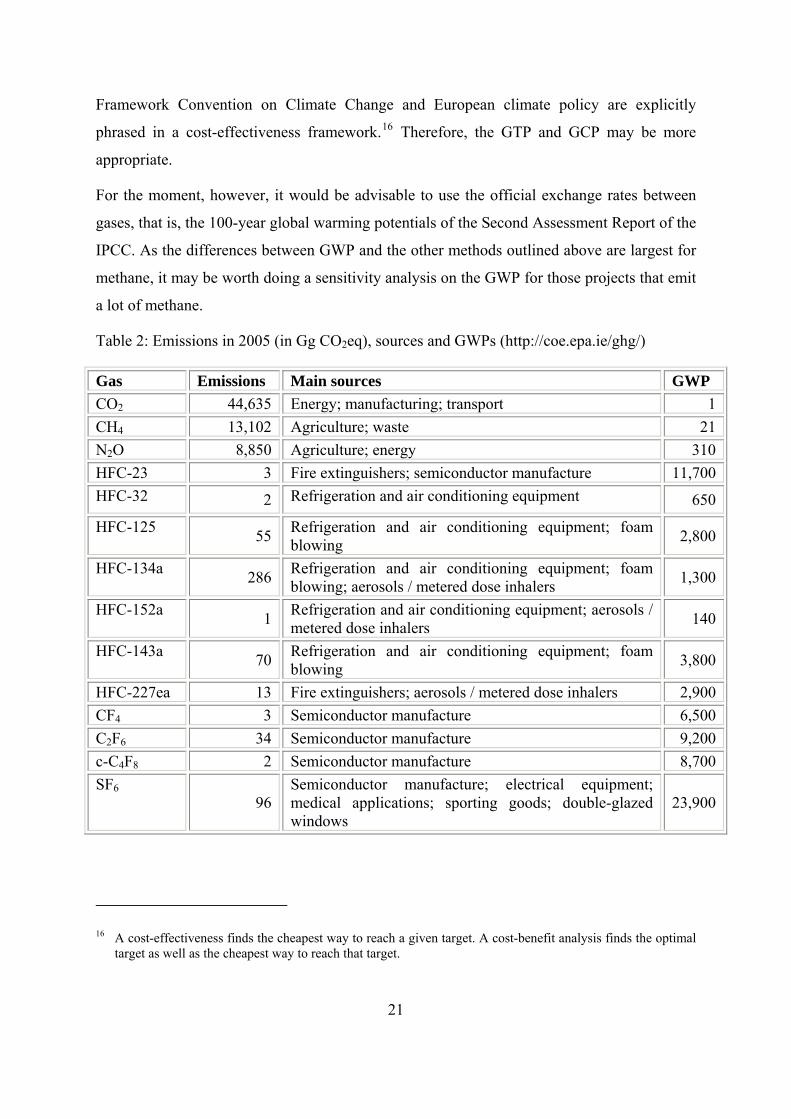
4. PREDICTING THE PRICES OF OTHER GHG EMISSIONS
The Kyoto Protocol regulates the emissions of six “gases”. Besides carbon dioxide (CO2),
there is methane (CH4), nitrous oxide (N2O), sulphur hexafluoride (SF6), hydrofluorocarbons
(HFCs) and perfluorocarbons (PFCs). The last two are classes of gases. Table 2 shows the
emissions for Ireland for 2005. There are a number of methods of comparing the effects and
impacts of greenhouse gases. Four of these are outlined below.
14 Ireland’s emissions have been growing by some 2.5% per year over the last 15 years, and in 2004 were 43% above 1990 levels. With a €10/tCO2 tax, 2004 emissions would have been some 40% above 1990 while the Kyoto target is 13% by 2012. Therefore, emission reduction in Ireland is expensive, and it is cheaper to import emission certificates from abroad.
19
Global Warming Potential. The Kyoto Protocol establishes the equivalence between the other
gases and carbon dioxide, namely the 100-year Global Warming Potential (GWP) as reported
in the Second Assessment Report of the IPCC (Schimel et al., 1996). With this, it is trivial to
calculate the price of, say, methane. The GWP of methane is 21, so the price per tonne of
methane is 21 times the price per tonne of carbon dioxide.
However, the Third Assessment Report of the IPCC (Ramaswamy et al., 2001) raised the
GWP of methane to 23, and the Fourth Assessment Report (Forster et al., 2007) raises it to
25. The GWP values of many other greenhouse gases have changed too. Presumably,
international regulations will be updated as well, possibly in the second commitment period
of the Kyoto Protocol, but perhaps also before 2012.
Furthermore, there are a growing number of academic papers that argue that the GWP is
numerically and conceptually wrong – from a natural science (Shine et al., 2005; Smith and
Wigley, 2000a,b) as well as from an economic perspective (Kandlikar, 1995; Manne and
Richels, 2001). Below, we briefly survey the various arguments, and assess if and when
European climate policy may shift to an alternative metric. As the Fourth Assessment Report
of the IPCC is largely silent on this matter, a policy shift is highly unlikely before 2012.
The GWP is defined as a ratio of two time integrals of radiative forcing15; the numerator is
the radiative forcing from an infinitesimally small pulse of the greenhouse gas under
consideration; the denominator is the same for carbon dioxide. The GWP of carbon dioxide is
therefore unity by definition.
The natural scientific critiques of GWP are twofold. Smith and Wigley (2000a,b) argue that
relative radiative forcing depends on assumptions about future greenhouse gas emissions and
concentrations. The GWP, however, is not sensitive to such assumptions. Or rather, the GWP
assumes that future concentrations are equal to today’s concentrations. Although future
concentrations are uncertain, it is very unlikely that they will be like today’s. This implies the
GWPs as used by the IPCC are biased. The alternative would be to use a GWP that is
15 Radiative forcing is the per area change in the energy balance of the atmosphere, that is, the difference between the incoming radiation energy and the outgoing radiation energy in a given climate system. A positive forcing (more incoming energy) tends to warm the system.
20
probability-weighted average over all scenarios, but this has yet to be calculated as
probabilistic scenarios are rare.
Global Temperature Potential. Shine et al. (2005) have a more profound critique of GWP:
Policy is not concerned with radiative forcing. Indeed, most people would not know what
radiative forcing is.. For emissions with a long life-time in the atmosphere, the equilibrium
temperature change is proportional to radiative forcing. For short-lived emissions, such as
aerosols, there is no simple relationship between radiative forcing and temperature. Besides,
it is the actual temperature that matters, rather than the equilibrium temperature that may
never be reached or only in century’s time. They therefore propose to use a global
temperature potential (GTP), and suggest that the temperature should be evaluated at the
target point (e.g., the two degrees target of the European Union). This particularly affects
methane, for which the GTP is much smaller than the GWP.
Global Cost Potential. Manne and Richels (2001) raise the same issue as Shine et al. (2005),
but argue that it is not only the relative contribution of various greenhouse gases to meeting
the target that matters, but also the relative costs of emission reduction. They construct an
index dubbed the global cost potential (GCP). The GCP and GTP are roughly the same if the
target is remote, and start deviating as the target is approached (Tol et al., in preparation). For
investment projects in the near future, GCP and GTP are similar, therefore. The GCP and
GTP for methane are about 1 in 2007 – their minimum value as CH4 degrades to CO2 in the
atmosphere.
Global Damage Potential. Schmalensee (1993) raises another fundamental concern about the
global warming potential. In the social optimum, the trade-off between the emissions of
different greenhouse gases would be determined by the ratio of the marginal damage costs,
discussed in sub-section 3.1. Kandlikar (1995) calls this the global damage potential (GDP).
GDP and GWP are equal only if climate change impacts are proportional to radiative forcing,
an unsupported assumption, and if the discount rate is zero, which is inconsistent with
existing investment policy. Estimates of the GDP are sensitive to all the things that marginal
damage costs are sensitive to (see above). Furthermore, the GDP (and by implication, the
GWP) assumes that climate policy is driven by cost-benefit analysis – while both the UN
21
Framework Convention on Climate Change and European climate policy are explicitly
phrased in a cost-effectiveness framework.16 Therefore, the GTP and GCP may be more
appropriate.
For the moment, however, it would be advisable to use the official exchange rates between
gases, that is, the 100-year global warming potentials of the Second Assessment Report of the
IPCC. As the differences between GWP and the other methods outlined above are largest for
methane, it may be worth doing a sensitivity analysis on the GWP for those projects that emit
a lot of methane.
Table 2: Emissions in 2005 (in Gg CO2eq), sources and GWPs (http://coe.epa.ie/ghg/)
Gas Emissions Main sources GWP CO2 44,635 Energy; manufacturing; transport 1 CH4 13,102 Agriculture; waste 21 N2O 8,850 Agriculture; energy 310 HFC-23 3 Fire extinguishers; semiconductor manufacture 11,700 HFC-32 2 Refrigeration and air conditioning equipment 650
HFC-125 55 Refrigeration and air conditioning equipment; foam blowing 2,800
HFC-134a 286 Refrigeration and air conditioning equipment; foam blowing; aerosols / metered dose inhalers 1,300
HFC-152a 1 Refrigeration and air conditioning equipment; aerosols / metered dose inhalers 140
HFC-143a 70 Refrigeration and air conditioning equipment; foam blowing 3,800
HFC-227ea 13 Fire extinguishers; aerosols / metered dose inhalers 2,900 CF4 3 Semiconductor manufacture 6,500 C2F6 34 Semiconductor manufacture 9,200 c-C4F8 2 Semiconductor manufacture 8,700 SF6
96 Semiconductor manufacture; electrical equipment; medical applications; sporting goods; double-glazed windows
23,900
16 A cost-effectiveness finds the cheapest way to reach a given target. A cost-benefit analysis finds the optimal target as well as the cheapest way to reach that target.
22
5. PRACTICE IN OTHER JURISDICTIONS
Analysing investment options using environmentally-adjusted cost-benefit analysis is
undertaken in many ways by financing institutions worldwide, but as yet there is no clear
‘best-practice’. To illustrate some of the available variants, in this section we briefly refer to
the methods employed by the World Bank, the European Investment Bank, the UK Treasury
and the European Commission.
5.1 The World Bank
The work of Samuel Fankhauser (1994, 1995) has significantly influenced the decision
criteria employed by the World Bank in its assessment of investment projects (Hamilton,
2002). Fankhauser (1995) conducted an analysis that gave the following results:
“damage per tonne of emissions is rising over time, from about $20/tC between 1991 and
2000 to about $28/tC in the decade 2021-30.”
Three issues must be borne in mind when employing these results. First, as is discussed in
Section 4 above, the methods used to calculate the effects of greenhouse gases have changed
since Fankhauser calculated the costs of CO2 emissions. Second, inflation and the changing
value of the dollar mean that a re-estimation is required before a contemporary value can be
calculated. Third, as Fankhauser noted when presenting his results, discounting the future
value of the potential costs of climate change is essentially arbitrary depending on the
assumptions employed by the analyst – and ‘catastrophic events’ can significantly influence
the damage cost estimates that are reached (1994, 68-9).
Nevertheless, the World Bank continues to draw on this analysis for project appraisal.17 In
describing the World Bank’s current approach to evaluating the environmental impact of
potential projects (with a particular focus on resource extraction), Hamilton (2002) notes that:
“[With regards to] pollution damages, these should ideally reflect emissions and exposure
data for the full range of local regional and global pollutants. In practice, there are no
17 It should be noted that this is distinct from the World Bank’s other role as market operator in the market for carbon credits. For this purpose, it was one of the fore-runners in establishing markets for carbon credits, and ‘has set up a bank-wide pricing committee, and through that and dialogue with fund participants and host countries, and its own market research the World Bank has developed an approach by which it will seek to establish transparent, fair and consistent pricing’ (worldbank.org).
23
comprehensive data on local and regional pollutants. As a ‘place-holder’ for other pollutants,
therefore, damages from carbon dioxide emissions are included…using a figure of $20 per
ton of carbon derived from Fankhauser (1995) and widely available data on CO2 emissions
from industrial sources.”
5.2 The European Investment Bank
The EIB has adopted a rather different approach to the valuation of carbon emissions that
relies on prices derived from markets for carbon. The Multilateral Carbon Credit Fund allows
companies and other agencies in transition/developing nations, who are seeking assistance
from the EIB and the European Bank for Reconstruction and Development (EBRD), to offset
polluting emissions from their proposals by purchasing carbon credits on an open market.
Prices for these credits are largely exogenously determined, and are based on the EU-ETS,
Joint Implementation (JI) and Clean Development Mechanism (CDM) trading schemes.
5.3 UK Treasury
Like the World Bank, HM Treasury bases the price of carbon on estimates of the marginal
damage costs. Clarkson and Deyes (2002) conducted a review that recommended a damage
cost estimate of £70/tC (2000 prices; $100/tC), with upper and lower bounds of £35/tC and
£140/tC for sensitivity analyses. This paper was critiqued by Pearce (2003), who
recommended a price of £3-6/tC, drawing inter alia on Nordhaus and Boyer (2000). In
response, HM Treasury commissioned another review by Downing and Watkiss (2004), who
recommended a lower bound of £35/tC but could not specify a best estimate for an upper
bound.
This analysis has been superseded by the Stern Review on the Economics of Climate Change,
another study by HM Treasury. Stern et al. (2006) recommended a carbon tax of around
$85/tCO2, or $315/tC. The Stern Review is hotly disputed in academic circles (Dasgupta,
2006; Mendelsohn, 2006; Nordhaus, forthcoming; Tol, 2006; Tol and Yohe, 2006, 2007;
Yohe and Tol, 2007; Weitzman, forthcoming), but seems to be broadly accepted among UK
policymakers. It is therefore expected that the UK will increase its carbon price (as
recommended by Stern et al., 2006) rather than decrease it (as recommended by Downing
and Watkiss, 2004).
24
5.4 The European Commission
The European Commission has a dual approach to valuing carbon dioxide emissions. On the
one hand, it has commissioned a series of studies on marginal damage costs. The ExternE
series is best known (Eyre et al., 1999; Friedrich and Bickel, 2001; Bickel and Friedrich,
2005), and this work is currently being updated in the Commission-sponsored MethodEx
(http://www.methodex.org/) and NEEDS (http://www.needs-project.org/) projects. On the
other hand, there are emission reduction targets for both the short- and the long-run – and
these targets imply marginal emission abatement costs; see Section 3.5. As the current
emission targets are not based on a cost-benefit analysis, the marginal abatement costs are the
more appropriate way of pricing emissions, but we are not aware of an official EU policy on
this matter.
6. CONCLUSIONS
Above, we outline three choices that need to be made in order to include the costs of
greenhouse gas emissions in the economic appraisal model used to evaluate investments in
projects in the Republic of Ireland. This section sets out our suggested approach. The first
sub-section discusses the three options, and the second sub-section summarises how the
model would affect six types of projects.
6.1 Recommended methodology and data sources
For projects with substantial energy use, carbon dioxide emissions should be estimated on
the basis of the expected energy use and the SEI’s emission factors
(http://www.sei.ie/index.asp?locID=72&docID=-1). Emissions of other greenhouse gases
should be taken from IPPC license applications.
The private costs of energy assumed to be borne by each project should be increased by a
proportion that depends on the expected price of carbon dioxide (see Table 3). This is an
approximation of the actual increase in energy costs, but a more accurate estimate of the
increase in energy costs would require substantial additional detail on energy use and energy
prices, and it would involve significantly more maintenance work for those using the model.
We recommend that the option of employing a more detailed treatment of these costs be
deferred until the next major revision of the economic appraisal model.
25
The social cost of carbon dioxide emissions should be set equal to the future price of carbon
dioxide emission permit as traded on the European Energy Exchange. This represents the
opportunity cost to “Ireland Inc” of having to import additional emission allowances to offset
the increase in emissions. There is no futures market after 2012, and we have provided two
options as to how to predict prices in years after this date.
First, the carbon price from 2013 may be interpolated between the futures prices in 2012 and
the model-based price in 2030 according to the IPCC for the scenario towards 550 ppm
(roughly the long-term EU target). The IPCC states “that carbon prices in the range 20-50
US$/tCO2 reached globally by 2020-2030 […] would deliver deep emission reductions by
mid Century consistent with stabilisation around 550ppm CO2-eq”; we use $50/tCO2 for
2030.
Second, the expected carbon prices for periods when futures are not available may be held
constant at the latest futures price available. Table 3 below sets out the current carbon prices
resulting from both of these methods.
26
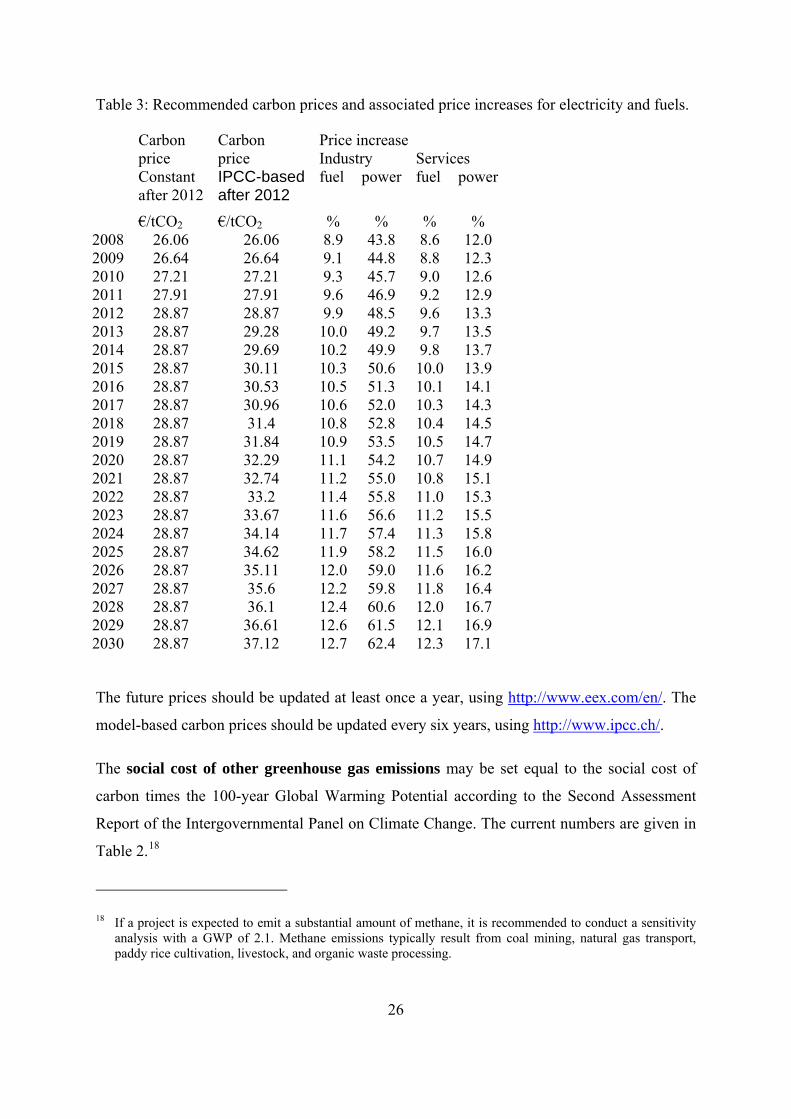
Table 3: Recommended carbon prices and associated price increases for electricity and fuels.
Carbon Carbon Price increase price price Industry Services Constant
after 2012 IPCC-based after 2012
fuel power fuel power
€/tCO2 €/tCO2 % % % % 2008 26.06 26.06 8.9 43.8 8.6 12.0 2009 26.64 26.64 9.1 44.8 8.8 12.3 2010 27.21 27.21 9.3 45.7 9.0 12.6 2011 27.91 27.91 9.6 46.9 9.2 12.9 2012 28.87 28.87 9.9 48.5 9.6 13.3 2013 28.87 29.28 10.0 49.2 9.7 13.5 2014 28.87 29.69 10.2 49.9 9.8 13.7 2015 28.87 30.11 10.3 50.6 10.0 13.9 2016 28.87 30.53 10.5 51.3 10.1 14.1 2017 28.87 30.96 10.6 52.0 10.3 14.3 2018 28.87 31.4 10.8 52.8 10.4 14.5 2019 28.87 31.84 10.9 53.5 10.5 14.7 2020 28.87 32.29 11.1 54.2 10.7 14.9 2021 28.87 32.74 11.2 55.0 10.8 15.1 2022 28.87 33.2 11.4 55.8 11.0 15.3 2023 28.87 33.67 11.6 56.6 11.2 15.5 2024 28.87 34.14 11.7 57.4 11.3 15.8 2025 28.87 34.62 11.9 58.2 11.5 16.0 2026 28.87 35.11 12.0 59.0 11.6 16.2 2027 28.87 35.6 12.2 59.8 11.8 16.4 2028 28.87 36.1 12.4 60.6 12.0 16.7 2029 28.87 36.61 12.6 61.5 12.1 16.9 2030 28.87 37.12 12.7 62.4 12.3 17.1
The future prices should be updated at least once a year, using http://www.eex.com/en/. The
model-based carbon prices should be updated every six years, using http://www.ipcc.ch/.
The social cost of other greenhouse gas emissions may be set equal to the social cost of
carbon times the 100-year Global Warming Potential according to the Second Assessment
Report of the Intergovernmental Panel on Climate Change. The current numbers are given in
Table 2.18
18 If a project is expected to emit a substantial amount of methane, it is recommended to conduct a sensitivity analysis with a GWP of 2.1. Methane emissions typically result from coal mining, natural gas transport, paddy rice cultivation, livestock, and organic waste processing.
27
6.2 Summary of how the proposed approach would apply to different project types
To help cast light on the administrative processes that might be required to apply the
proposed model, this section describes the model’s broad data requirements and implications
for a range of possible project types.
1. Project obtaining all its energy by purchasing electricity from an external supplier
(i.e. across the national grid) and generating no process emissions
No net social cost of emissions would arise in this case. Purchases of electricity from an
external ETS-participant supplier would be deemed to have had their carbon emissions paid
for by the supplier (with the cost potentially passed on in the price of electricity). Since no
other emissions are anticipated, it would not be necessary to collect information on such
emissions, ETS participation or grandparenting. Many service sector projects are likely to
fall under this heading.
2. Project generating its own energy, participating in the ETS, not receiving
grandparented permits, and without other process emissions.
Here too, there would be no net social cost of emissions. While the project would generate
incremental emissions due to energy generation, it would have to purchase ETS permits to
cover these emissions on the open market. Its private costs would fully offset the relevant
social costs.
3. Project generating its own energy, participating in the ETS and receiving
grandparented permits (e.g. from the New Entrant Reserve), but without other
process emissions.
This project would give rise to a net social cost in respect of the gases emitted as a result of
its energy generation. The share of such emissions covered by grandparenting would not be
offset by a private cost to the firm. To calculate these costs, the model would require
information for each year of the evaluation on the quantity of emissions and the share of
emissions covered by grandparenting.
4. Project generating its own energy, but not participating in the ETS or giving rise to
other process emissions.
This would probably be a small plant that was under the threshold for ETS participation. Its
emissions would give rise to a net social cost, with no offsetting private cost. To calculate
28
these costs, the model would require information on the quantity of emissions during each
year modelled. This should be a relatively straightforward function of the fuel type and
boiler capacity.
5. Project generating its own energy, not participating in the ETS, not giving rise to
other process emissions, but subject to a (currently hypothetical) carbon tax
This project might give rise to a net social cost, depending upon the level of the carbon tax
relative to the cost of carbon. To calculate these costs, the model would require information
on the quantity of emissions and the level of the carbon tax during each year modelled.
6. Project giving rise to process emissions other than CO2
At present, emissions of GHGs other than CO2 are outside the ETS and are not taxed, so
projects of this kind will not currently face a private cost for these emissions. The project
would therefore give rise to a net social cost. Calculating it would require the expected
emissions of each gas for each year, which should be available from the IPPC licence
application that such a project must make to the EPA. The model would multiply these
emissions by the relevant GWPs to arrive at the total cost. If a particular gas is made subject
to the ETS or taxed at some point in the future, the model has the flexibility to take this into
account.
29
REFERENCES
Barker, T. and I. Bashmakov (2007), ‘Mitigation From a Cross-Sectoral Perspective’ in IPCC (2007), Fourth Assessment Report of the Intergovernmental Panel on Climate Change, New York, Cambridge University Press.
Barker, T., M.S. Qureshi and J. Koehler (2006), The Costs of Greenhouse Gas Mitigation with Induced Technological Change: A Meta-Analysis of Estimates in the Literature, Report prepared for the Stern Review on the Economics of Climate Change, HM Treasury, London.
Benz, E. and S. Trueck (submitted), ‘Modelling the Price Dynamics of CO2 Emission Allowances’, Energy Economics.
Bickel, P. and R. Friedrich (2005), Externalities of Energy – Methodology 2005 Update, Office for Official Publications of the European Communities, Luxembourg.
Capros, P., T. Georgakopoulos, and L. Mantzos (1998), ‘Economic and Energy System Implications of the European CO2 Mitigation Strategy for 2010: A Model-Based Analysis’, International Journal of Environment and Pollution, 10, (3/4), 403-427.
Clarkson, R. and K. Deyes (2002), ‘Estimating the Social Cost of Carbon Emissions’, UK Government Economic Service Working Paper 140.
Criqui, P. (2001), ‘POLES – Prospective Outlook on Long-Term Energy Systems’, Institut d’Economie et de Eolitique de l’Energie [online], Available from http://web.upmf-grenoble.fr/iepe/textes/POLES8p_01.pdf.
Criqui, P., P. Russ, and D. Deybe (2006), ‘Impacts of Multi-Gas Strategies for Greenhouse Gas Emission Abatement: Insights from a Partial Equilibrium Model’, Energy Journal (Multi-Greenhouse Gas Mitigation and Climate Policy Special Issue), 251-273.
Dasgupta, P. (2006), ‘Comments on the Stern Review's Economics of Climate Change’, Paper prepared for a seminar on the Stern Review's Economics of Climate Change, organised by the Foundation for Science and Technology at the Royal Society, London, on November 8, 2006 [online], Available from http://www.econ.cam.ac.uk/ faculty/dasgupta/STERN.pdf
Daskalakis, G., D. Psychoyios and R.N. Markellos (2006), ‘Modeling CO2 Emission Allowance Prices and Derivatives: Evidence from the EEX’, June [online], Available from http://ssrn.com/abstract=912420.
Downing, T. and P. Watkiss (2004), ‘The Marginal Social Costs of Carbon in Policy Making: Applications, Uncertainty and a Possible Risk Based Approach’, DEFRA International Seminar on the Social Costs of Carbon.
Economic and Social Research Institute (1996), ‘Appraisal for the Industrial Development Agencies’, Economic and Social Research Institute, Dublin.
Ellerman, D. and B. Buchner (2006) ‘Over-Allocation or Abatement? A Preliminary Analysis of the EU-ETS Based on the 2005 Emissions Data’, Fondazione Eni Enrico Mattei Nota di Lavoro series 139.2006.
30
European Commission (2005), ‘Winning the battle against global climate change: Communication from the Commission to the Council, the European Parliament, The European Economic and Social Committee and the Committee of the Regions’, Com2005(35).
Eyre, N., T.E.Downing, R.Hoekstra, and K.Rennings (1999), Externalities of Energy, Vol 8: Global Warming, Office for Official Publications of the European Communities, Luxembourg.
Fankhauser, S. (1994), The Social Costs of Greenhouse Gas Emissions: An Expected Value Approach, Energy Journal, 15, (2), 157-84.
Fankhauser, S (1995), ‘Valuing Climate Change: The Economics of the Greenhouse’, Earthscan, London.
Fitz Gerald, J., J. Hore, and I. Kearney (2002), ‘A Model for Forecasting Energy Demand and Greenhouse Gas Emissions in Ireland’, Economic and Social Research Institute, Dublin, 146.
Forster, P., V. Ramaswamy, P. Artaxo, T.K. Berntsen, R.A. Betts, D.W. Fahey, J. Haywood, J. Lean, D.C. Lowe, G. Myhre, J. Nganga, R. Prinn, G. Raga, M. Schulz and R. van Dorland (2007), ‘Changes in Atmospheric Constituents and in Radiative Forcing’, in S. Solomon, D. Qin, M. Manning, M. Marquis, K. Averyt, M.M.B. Tignor, H. LeRoy Miller Jr. and Z. Chen (eds.), Climate Change 2007: The Physical Science Basis – Contribution of Working Group I to the Fourth Assessment of the Intergovernmental Panel on Climate Change, Cambridge University Press, Cambridge, pp 129-134.
Friedrich, R. and P.Bickel (eds.) (2001), Environmental External Costs of Transport Springer-Verlag, Berlin Heidelberg New York.
Hamilton, K. (2002), ‘Accounting for Sustainability’, Environment Department, World Bank [online], Available from http://info.worldbank.org/etools/docs/library/36500/ AccountingForSustainbility.pdf.
Honohan, P. (1998), ‘Key Issues in Benefit-Cost Methodology for Irish Industrial Policy’, Economic and Social Research Institute, Dublin.
Hourcade, J.C. and P. Shukla (2001), ‘Global, Regional, and National Costs and Ancillary Benefits of Mitigation’ in IPCC (2001), Third Assessment Report of the Intergovernmental Panel on Climate Change, New York, Cambridge University Press, pp. 499-560.
Kandlikar, M. (1995), ‘The Relative Role of Trace Gas Emissions in Greenhouse Abatement Policies’, Energy Policy, 23, (10), 879-883.
Kettner, C., A. Köppl, S.P. Schleicher and G. Thenius (2007), ‘Stringency and Distribution in the EU Emissions Trading Scheme – The 2005 Evidence’, Fondazione Eni Enrico Mattei Nota di Lavoro series 22.2007.
Lin, Y-N and A.Y. Lin (submitted), ‘Spot and Futures Markets of the Carbon Dioxide Emission Allowances’, Energy Economics.
Manne, A.S. and R.G. Richels (2001), ‘An alternative approach to establishing trade-offs among greenhouse gases’, Nature, 410, 675-677.
Mendelsohn, R.O. (2006), ‘A Critique of the Stern Report’, Regulation, Winter 2006-2007.
31
Murphy, A., B. Walsh, and F. Barry (2001), ‘The Economic Appraisal System for Projects Seeking Support from the Industrial Development Agencies’, Forfás, Dublin.
Nordhaus (forthcoming), ‘The Stern Review on the Economics of Climate Change’, working paper available online from http://www.econ.yale.edu/~nordhaus/homepage/ stern_050307.pdf.
Nordhaus, W. and Boyer, J. (2000), ‘Warming the World: Economic Models of Global Warming, MIT Press, Cambridge.
Pearce, D. (2003), ‘The Social Cost of Carbon and its Policy Implications’, Oxford Review of Economic Policy, 19, (3), 362-84.
Paolella, M.S. and L. Taschini (2006), ‘An Econometric Analysis of Emission Trading Allowances’, Swiss Finance Institute Research Paper No. 06-26 [online], Available from http://ssrn.com/abstract=947055.
Ramaswamy, V., O. Boucher, J. Haigh, D. Hauglustaine, J. Haywood, G. Myhre, T. Nakajima, G.Y. Shi, and S. Solomon (2001), ‘Radiative Forcing of Climate Change’, in J.T. Houghton and Y. Ding (eds.), Climate Change 2001: The Scientific Basis -- Contribution of Working Group I to the Third Assessment Report of the Intergovernmental Panel on Climate Change, Cambridge University Press, Cambridge, pp. 349-416.
Schimel, D., D.Alves, I.Enting, M.Heimann, F.Joos, M.Raynaud, R.Derwent, D.Ehhalt, P.Fraser, E.Sanhueza, X.Zhou, P.Jonas, R.Charlson, H.Rodhe, S.Sadasivan, K.P.Shine, Y.Fouquart, V.Ramaswamy, S.Solomon, J.Srinivasan, D.L.Albritton, I.Isaksen, M.Lal, and D.J.Wuebbles (1996), 'Radiative Forcing of Climate Change', in Climate Change 1995: The Science of Climate Change -- Contribution of Working Group I to the Second Assessment Report of the Intergovernmental Panel on Climate Change, 1 edn, J.T. Houghton et al. (eds.), Cambridge University Press, Cambridge, pp. 65-131.
Schmalensee, R (1993), ‘Comparing Greenhouse Gases for Policy Purposes’, Energy Journal, 14, (1), 245-255.
Shine, K.P., J.S. Fuglestvedt, K. Hailemariam, and N. Stuber (2005), ‘Alternatives to the Global Warming Potential for Comparing Climate Impacts of Emissions of Greenhouse Gases’, Climatic Change, 68, 281-302.
Smith, S.J. and T.M.L. Wigley (2000a), ‘Global Warming Potentials: 1. Climatic Implications of Emissions Reductions’, Climatic Change, 44, 445-457.
Smith, S.J. and T.M.L. Wigley (2000b), ‘Global Warming Potentials: 2. Accuracy’, Climatic Change, 44 , 459-469.
Stern, N. (2006), ‘Stern Review: The Economics of Climate Change’, London, HM Treasury.
Tol, R.S.J. (2005), ‘The Marginal Damage Costs of Carbon Dioxide Emissions: An Assessment of the Uncertainties’, Energy Policy, 33, 2064-2074.
Tol, R.S.J. (2006), ‘Multi-Gas Emission Reduction for Climate Change Policy: An Application of FUND’, Energy Journal (Multi-Greenhouse Gas Mitigation and Climate Policy Special Issue), 235-250.
Tol, R.S.J. (2006), ‘The Stern Review on the Economics of Climate Change: A Comment [online], Available from http://www.fnu.zmaw.de/fileadmin/fnu-files/reports/ sternreview.pdf.
32
Tol, R.S.J. (submitted): ‘Why Worry about Climate Change: A Research Agenda’, Environmental Values.
Tol, R.S.J. and G.W. Yohe (2006), “A Review of the Stern Review”, World Economy 7, 233-250.
Uhrig-Homburg, M. and M. Wagner (submitted), ‘Forward Price Dynamics of CO2 Emission Certificates – An Empirical Analysis’, Energy Economics.
Weitzman, M.L. (2007), ‘The Stern Review of the Economics of Climate Change’, Book review for JEL [online], Available from http://www.economics.harvard.edu/faculty/ Weitzman/papers/JELSternReport.pdf
Weyant, J.P., F.C. de la Chesnaye, and G.J. Blanford (2006), ‘Overview of EMF-21: Multigas Mitigation and Climate Policy’, Energy Journal (Multi-Greenhouse Gas Mitigation and Climate Policy Special Issue), 1-32.
Yohe, G.W. and R.S.J. Tol (2006): ‘The Stern Review: A Deconstruction’, Working Paper FNU-125 [online], Available from http://www.fnu.zmaw.de/fileadmin/fnu-files/publication/working-papers/sterngecwp.pdf.
Yohe, G.W. and R.S.J. Tol (2007), ‘The Stern Review: Implications for Climate Change’, Environment, March 2007.
33
Year Number Title/Author(s) ESRI Authors/Co-authors Italicised
2008 246 A Carton Tax for Ireland Richard S.J. Tol, Tim Callan, Thomas Conefrey,
John D. Fitz Gerald, Seán Lyons, Laura Malaguzzi Valeri and Susan Scott
245 Non-cash Benefits and the Distribution of
Economic Welfare Tim Callan and Claire Keane 244 Scenarios of Carbon Dioxide Emissions from
Aviation Karen Mayor and Richard S.J. Tol 243 The Effect of the Euro on Export Patterns:
Empirical Evidence from Industry Data Gavin Murphy and Iulia Siedschlag 242 The Economic Returns to Field of Study and
Competencies Among Higher Education Graduates in Ireland
Elish Kelly, Philip O’Connell and Emer Smyth 241 European Climate Policy and Aviation Emissions Karen Mayor and Richard S.J. Tol 240 Aviation and the Environment in the Context of the
EU-US Open Skies Agreement Karen Mayor and Richard S.J. Tol 239 Yuppie Kvetch? Work-life Conflict and Social Class
in Western Europe Frances McGinnity and Emma Calvert 238 Immigrants and Welfare Programmes: Exploring
the Interactions between Immigrant Characteristics, Immigrant Welfare Dependence and Welfare Policy
Alan Barrett and Yvonne McCarthy 237 How Local is Hospital Treatment? An Exploratory
Analysis of Public/Private Variation in Location of Treatment in Irish Acute Public Hospitals
Jacqueline O’Reilly and Miriam M. Wiley
34
236 The Immigrant Earnings Disadvantage Across the Earnings and Skills Distributions: The Case of Immigrants from the EU’s New Member States in Ireland
Alan Barrett, Seamus McGuinness and Martin O’Brien
235 Europeanisation of Inequality and European
Reference Groups Christopher T. Whelan and Bertrand Maître 234 Managing Capital Flows: Experiences from Central
and Eastern Europe Jürgen von Hagen and Iulia Siedschlag 233 ICT Diffusion, Innovation Systems, Globalisation
and Regional Economic Dynamics: Theory and Empirical Evidence
Charlie Karlsson, Gunther Maier, Michaela Trippl, Iulia Siedschlag, Robert Owen and Gavin Murphy
232 Welfare and Competition Effects of Electricity
Interconnection between Great Britain and Ireland Laura Malaguzzi Valeri 231 Is FDI into China Crowding Out the FDI into the
European Union? Laura Resmini and Iulia Siedschlag 230 Estimating the Economic Cost of Disability in
Ireland John Cullinan, Brenda Gannon and Seán Lyons 229 Controlling the Cost of Controlling the Climate:
The Irish Government’s Climate Change Strategy
Colm McCarthy, Sue Scott 228 The Impact of Climate Change on the Balanced-
Growth-Equivalent: An Application of FUND David Anthoff, Richard S.J. Tol 227 Changing Returns to Education During a Boom?
The Case of Ireland Seamus McGuinness, Frances McGinnity, Philip
O’Connell 226 ‘New’ and ‘Old’ Social Risks: Life Cycle and Social
Class Perspectives on Social Exclusion in Ireland Christopher T. Whelan and Bertrand Maître
35
225 The Climate Preferences of Irish Tourists by
Purpose of Travel Seán Lyons, Karen Mayor and Richard S.J. Tol 224 A Hirsch Measure for the Quality of Research
Supervision, and an Illustration with Trade Economists
Frances P. Ruane and Richard S.J. Tol 223 Environmental Accounts for the Republic of
Ireland: 1990-2005 Seán Lyons, Karen Mayor and Richard S.J. Tol 2007 222 Assessing Vulnerability of Selected Sectors under
Environmental Tax Reform: The issue of pricing power
J. Fitz Gerald, M. Keeney and S. Scott 221 Climate Policy Versus Development Aid
Richard S.J. Tol 220 Exports and Productivity – Comparable Evidence
for 14 Countries The International Study Group on Exports and Productivity
219 Energy-Using Appliances and Energy-Saving Features: Determinants of Ownership in Ireland Joe O’Doherty, Seán Lyons and Richard S.J. Tol
218 The Public/Private Mix in Irish Acute Public
Hospitals: Trends and Implications Jacqueline O’Reilly and Miriam M. Wiley
217 Regret About the Timing of First Sexual
Intercourse: The Role of Age and Context Richard Layte, Hannah McGee
216 Determinants of Water Connection Type and
Ownership of Water-Using Appliances in Ireland Joe O’Doherty, Seán Lyons and Richard S.J. Tol
215 Unemployment – Stage or Stigma?
Being Unemployed During an Economic Boom Emer Smyth
214 The Value of Lost Load Richard S.J. Tol
36
213 Adolescents’ Educational Attainment and School Experiences in Contemporary Ireland Merike Darmody, Selina McCoy, Emer Smyth
212 Acting Up or Opting Out? Truancy in Irish
Secondary Schools Merike Darmody, Emer Smyth and Selina McCoy
211 Where do MNEs Expand Production: Location
Choices of the Pharmaceutical Industry in Europe after 1992 Frances P. Ruane, Xiaoheng Zhang
210 Holiday Destinations: Understanding the Travel
Choices of Irish Tourists Seán Lyons, Karen Mayor and Richard S.J. Tol
209 The Effectiveness of Competition Policy and the
Price-Cost Margin: Evidence from Panel Data Patrick McCloughan, Seán Lyons and William Batt
208 Tax Structure and Female Labour Market
Participation: Evidence from Ireland Tim Callan, A. Van Soest, J.R. Walsh
207 Distributional Effects of Public Education Transfers
in Seven European Countries Tim Callan, Tim Smeeding and Panos Tsakloglou