Embed Size (px)
DESCRIPTION
ICGM
Citation preview
i
25 March 2010
Prepared by Scarab Enterprises, for
Challenger Development Corp.
TECHNICAL REPORT ON IRON CAP GOLD MINE, ZAMBIA
Iron Cap Gold Mine Technical Report – 25 March 2010
Scarab Environmental and Geological Enterprises
i
IRON CAP GOLD MINE, ZAMBIA
TECHNICAL REPORT
Prepared by Scarab Enterprises on behalf of:
Challenger Development Corp.
Author/s Mr Nico Scholtz (M.Sc. Geology Pr. Sci. Nat.)
Principal Geologist
Date: 25 March 2010
Job Number: G10/001
Printed copies: 2
Client: 1
Scarab: 1
Signed on this 25th day of March 2010:
……………………………………………………
Nico Scholtz
Principal Geologist for Scarab Enterprises

Iron Cap Gold Mine Technical Report – 25 March 2010
Scarab Environmental and Geological Enterprises
ii
TABLE OF CONTENTS
SUMMARY.......................................................................................................................................... vi
1. INTRODUCTION AND TERMS OF REFERENCE ...........................................................................1
1.1 Scope and purpose of the Report...............................................................................................1
1.2 Independence ............................................................................................................................1
1.3 Sources of Information ...............................................................................................................1
1.4 Personal Inspection on Property ................................................................................................2
2. RELIANCE ON OTHER INDUSTRY EXPERTS...............................................................................3
3. PROPERTY DESCRIPTION AND LOCATION.................................................................................4
3.1 Background information on Zambia............................................................................................4
3.2 Property Location .......................................................................................................................5
3.3 Mineral Tenure ...........................................................................................................................6
3.3.1 General conditions imposed upon the holder of a prospecting licence................................6
3.3.2 Surface rights......................................................................................................................7
3.4 Property boundary demarcation .................................................................................................8
3.5 Agreements................................................................................................................................8
3.6 Environmental liabilities and permits ..........................................................................................9
4. LOCAL CLIMATE, PHYSIOGRAPHY, RESOURCES AND INFRASTRUCTURE .......................... 10
4.1 Climate and agriculture ............................................................................................................ 10
4.2 Physiography ........................................................................................................................... 12
Figure 4.3 Zambian physiography showing location of Iron Cap Mine............................................ 12
4.3 Access ..................................................................................................................................... 13
4.4 Vegetation................................................................................................................................ 13
4.5 Zambia resources .................................................................................................................... 13
4.5.1 Gold (Au) .......................................................................................................................... 15
4.5.2 Other commodities............................................................................................................ 16
4.6 Infrastructure and availability of exploration requirements........................................................ 16
4.7 Operating season..................................................................................................................... 16
5. HISTORY ....................................................................................................................................... 17
5.1 Prior ownership ........................................................................................................................ 17
5.2 Previous exploration................................................................................................................. 17
5.3 Historical Mineral Resources and Reserves............................................................................. 18
5.4 Production................................................................................................................................ 18
6. GEOLOGICAL SETTING ............................................................................................................... 19
6.1 Regional Geology..................................................................................................................... 19
6.2 Local geological setting ............................................................................................................ 19
6.2.1 Tectonic Thermal events................................................................................................... 20
6.2.2 Stratigraphic setting .......................................................................................................... 22

Iron Cap Gold Mine Technical Report – 25 March 2010
Scarab Environmental and Geological Enterprises
iii
6.2.2.1 Basement .................................................................................................................. 22
6.2.2.2 Muva Supergroup ...................................................................................................... 22
6.2.2.3 Katanga ..................................................................................................................... 22
6.2.2.4 Karoo ......................................................................................................................... 23
6.2.2.5 Cretaceous, Tertiary, Quaternary............................................................................... 24
6.2.3 PML Project Geology ........................................................................................................ 24
7. DEPOSIT TYPE AND MODEL ....................................................................................................... 27
7.1 Model for gold deposits in Zambia............................................................................................ 28
7.1.1 Deposit types .................................................................................................................... 28
7.1.2 Origin of the gold............................................................................................................... 28
7.1.3 Metamorphism .................................................................................................................. 29
7.1.4 Mineralogy ........................................................................................................................ 30
7.1.5 Mineralisation hosts .......................................................................................................... 30
7.1.6 Structural orientation......................................................................................................... 31
7.1.7 Proximity to intrusives ....................................................................................................... 31
7.1.8 Palaeoplacers ................................................................................................................... 31
7.1.9 Summarized geological model for gold in Zambia............................................................. 31
7.2 Exploration techniques ............................................................................................................. 32
7.2.1 General ............................................................................................................................. 32
7.2.2 Geochemistry.................................................................................................................... 33
7.2.3 Biogeochemistry ............................................................................................................... 33
7.2.4 Structural investigations .................................................................................................... 34
7.2.5 Geophysics ....................................................................................................................... 34
8. MINERALIZATION ......................................................................................................................... 35
9. EXPLORATION.............................................................................................................................. 36
9.1 Pit............................................................................................................................................. 37
9.2 Shafts....................................................................................................................................... 39
9.3 Trenches .................................................................................................................................. 39
10. DRILLING..................................................................................................................................... 41
11. SAMPLING METHOD AND APPROACH..................................................................................... 42
11.1 Scarab sampling programme ................................................................................................. 42
11.2 Londoloza Resources / Triple Plate Plc. joint venture sampling programme .......................... 43
12. SAMPLE PREPARATION AND ANALYSES ................................................................................ 44
12.1 Scarab sampling programme ................................................................................................. 44
12.2 Londoloza Resources / Triple Plate Plc. joint venture sampling programme .......................... 44
13. DATA VERIFICATION.................................................................................................................. 45
14. ADJACENT PROPERTIES........................................................................................................... 46
14.1 Luiri Hill (Dunrobin and Matala) .............................................................................................. 46
14.2 Mwomboshi ............................................................................................................................ 48
Iron Cap Gold Mine Technical Report – 25 March 2010
Scarab Environmental and Geological Enterprises
iv
15. MINERAL PROCESSING AND METALLURGICAL TESTING ..................................................... 50
16. MINERAL RESOURCE AND RESERVE ESTIMATES................................................................. 51
17. ENVIRONMENTAL AND SOCIAL IMPACTS ............................................................................... 52
17.1 Social implications.................................................................................................................. 52
17.2 Environmental implications..................................................................................................... 53
18. RESULTS AND INTERPRETATIONS.......................................................................................... 55
19. CONCLUSION AND RECOMMENDATIONS ............................................................................... 58
19.1 Conclusion ............................................................................................................................. 58
19.2 Recommendations ................................................................................................................. 58
19.2.1 Stage 1 (Drilling targets) ................................................................................................. 58
19.2.2 Stage 2 (Contemporaneous with end of stage one) (Nature of mineralisation) ............... 58
19.2.3 Stage 3 (Resource definition).......................................................................................... 58
19.3 Exploration programme budget ..............................................................................................58
20. REFERENCES............................................................................................................................. 61
21. DATE AND SIGNATURE PAGE................................................................................................... 64
21.1 Certificate of Qualified Person................................................................................................ 64
21.2 Consent of Qualified Person .................................................................................................. 65
Appendix A – (Licence details) ........................................................................................................... 66
Appendix B – (Chemical assays)........................................................................................................ 68
Appendix C – (Chemical assays)........................................................................................................ 70
Appendix D – (Agreements) ............................................................................................................... 72
LIST OF FIGURES
Figure 3.1 Setting of Zambia in southern central Africa showing location of Iron Cap Gold Mine. ........4
Figure 3.2 Location Of Iron Cap Gold Mine south-east of the town of Kabwe.......................................5
Figure 4.1 Rainfall in Zambia showing location of Iron Cap Mine. ...................................................... 10
Figure 4.2 The main food crops of Zambia showing the location of Iron Cap Mine (From IDL, 2002). 11
Figure 4.3 Zambian physiography showing location of Iron Cap Mine................................................ 12
Figure 4.4 Vegetation of Zambia showing location of Iron Cap Mine (White, 1983)............................ 13
Figure 4.5 Main export and import products for Zambia (From United Nations, 2009)........................ 14
Figure 4.6 Location of different mineral commodities in Zambia......................................................... 15
Figure 4.7 Hydrothermal and alluvial gold (Au) provinces in Zambia. ................................................. 16
Figure 6.1 Location of Zambia with respect to surrounding cratons (From Ministry of Mines and
Mineral Development, 1999). ............................................................................................................. 19
Figure 6.2 Regional geology of Zambia. MSZ – Mwembeshi Shear Zone (From Ministry of Mines and
Mineral Development, 1999). ............................................................................................................. 20
Figure 6.3 Distribution of Irumide Belt showing Mwembeshi dislocation and Iron Cap Mine (From De
Waele et al., 2006). ............................................................................................................................ 21

Iron Cap Gold Mine Technical Report – 25 March 2010
Scarab Environmental and Geological Enterprises
v
Figure 6.4 Section through internal zone of Irumide Belt (cf. Figure 6.3 for section location) (From De
Waele et al., 2006). ............................................................................................................................ 21
Figure 6.5 Local geological setting of Iron Cap Mine (From Kampunzu et al., 2009). ......................... 24
Figure 6.6 Geological setting of Iron Cap Mine showing position of Mwembeshi Shearzone (From
Ministry of Mines and Mineral Development, 1999). ........................................................................... 25
Figure 6.7 Local geological setting of Iron Cap Mine. ......................................................................... 26
Figure 6.8 Ferruginous duricrust in cut trenches and open pit at the Iron Cap Mine. .......................... 26
Figure 7.1 Gold and Copper – Gold occurrences in Zambia (From Morel et al., 2007)....................... 28
Figure 7.2 Location of Iron Cap within Amphibolite to Greenschist facies metamorphic zone (From De
Waele et al., 2006). ............................................................................................................................ 29
Figure 8.1 Ferruginous duricrust on surface of Iron Cap Mine site. .................................................... 35
Figure 9.2 Route followed by Scarab during the field investigation on Iron Cap (Not all trenches
shown)................................................................................................................................................ 36
Figure 9.3 Open Pit at Iron Cap Mine measuring 50 x 15 m (2 m in depth) in extent.......................... 37
Figure 9.4 Ferruginous duricrust in north wall of open pit at Iron Cap Mine. ....................................... 37
Figure 9.5 Quartz vein in Open Pit on Iron Cap Mine. ........................................................................ 38
Figure 9.6 Quartzite, quartz vein fragment and ferruginous duricrust from Iron Cap Mine.................. 38
Figure 9.7 Trench cut into top part of shaft 1 by Londoloza Resources / Triple Plate Plc. joint venture
in 2008. .............................................................................................................................................. 39
Figure 9.8 Historical trench showing only Quaternary sand (no duricrust visible). .............................. 40
Figure 9.9 Massive magnetite in recently cut trench at Iron Cap Mine................................................ 40
Figure 11.1 Position of surface lithological grab sample on Iron Cap (Not all trenches shown). ......... 42
Figure 14.1 Location of Luiri Gold’s Dunrobin and Matala Mines within Matala Dome........................ 46
Figure 14.2 Cross section of old Dunrobin Mine showing trend of mineralisation. .............................. 47
Figure 14.3 Induced Polarization (IP) pilot survey over Luiri Gold’s Dunrobin area (From Luiri Gold
Jan. 2007 News Release). ................................................................................................................. 48
Figure 14.4 Soil sampling results at Zambezi Resources’ Mwomboshi project area southwest of Iron
Cap (Zambezi Resources 2004 Exploration Field Season Update no. 6). .......................................... 49
Figure 17.1 Agricultural activities in central to southern extent of Iron Cap SML. ............................... 52
Figure 17.2 Location of Iron Cap Mine Outside Protected areas in Zambia (Comaco website). ......... 54
Figure 18.1 Gold, silver and iron assays from first pass field investigation completed by Scarab....... 56
LIST OF TABLES
Table 6.1 General stratigraphic column (From Ministry of Mines and Mineral Development, 1999). .. 23
Table 19.1 Two year Exploration Budget............................................................................................ 59

Iron Cap Gold Mine Technical Report – 25 March 2010
Scarab Environmental and Geological Enterprises
vi
SUMMARY
Scarab Environmental and Geological Enterprises CC (Scarab) has been commissioned by The
Challenger Development Corp. (Challenger) to prepare a technical report according to the National
Instrument 43-101 (Canadian Standards for disclosure of Mineral Projects) and acquire any additional
information during fieldwork conducted on the Iron Cap Gold Mine in Zambia, southern central Africa.
The Iron Cap Gold Mine is located within the central Province of Zambia, 50 km south-east of the
town of Kabwe. The property is located within an area that receives up to 750 mm of rain per annum
where subsistence farmers grow mostly wheat and sorghum. Most of the Iron Cap area can be
regarded as flat lying averaging in height of no more than 1,100 m above mean sea level with
vegetation comprising moist infertile savannah. The best operating time within the Iron Cap area
should be between May and November (winter).
The Iron Cap Mine is an old prospect that lay dormant for some years until acquired by A.M.
Bensusan in 1953, which is the same year that the mine came into production. The mine was
afterwards registered under the name of Rhodesian Anglo American Limited up to an unknown date,
just before British Independence. After independence gold (Au) exploration was restricted to a
government department called Minex, which was part of ZIMCO (Zambia Industry and Mining
Corporation). Scarab was unable to obtain information pertaining to exploration activities for the time
when ZIMCO was operational in the area to 2008. In 2008, Iron Cap was a 70/30 Joint Venture
between Londoloza Resources Corp. (Londoloza) and Exploration Zambia with Triple Plate Junction
Plc. Work commenced in March 2008 and ended in September 2008 when Triple Plate exhausted
funds and subsequently defaulted and withdrew from the project.
A historical resource/reserve estimate calculated prior to the implementation of NI 43-101 (Feb 2001)
was calculated for only a part of the Iron Cap Mine area. Scarab cannot comment on the geographical
position of the resource/reserve nor the actual historical resource/reserve estimation.
242,880 t ore @ 1.555 g Au / ton (13,322 ounces of Au)
The Iron Cap area is underlain by metasediments and metavolcanics from the Proterozoic Muva
Supergroup. The northern part of the Iron Cap property is underlain by andesitic lave from the Muva
Supergroup, whilst the southern part of the property comprises schist and quartzite from the same
Supergroup. Structurally, the Mine is located within the 550 Ma year old Mwembeshi Shear
Zone/dislocation.
During the first pass field investigation of the Iron Cap area Scarab was able to investigate some of
the trenches cut by Rhodesian Anglo American and more recently by the Triple Plate Plc. Joint

Iron Cap Gold Mine Technical Report – 25 March 2010
Scarab Environmental and Geological Enterprises
vii
Venture. Scarab was further able to obtain grab samples from these trenches which were assayed for
Au, silver (Ag) and iron (Fe). An investigation into the distribution patterns of the sample assay results
revealed the following:
Gold (ppm) does not favour any of the lithologies sampled by Scarab and appears to show a
slight increase towards the central and eastern extent of the sampling area.
Silver (ppm) appears to have elevated concentrations within the ferruginous duricrust and
seems to favour this lithotype. Silver values appear to show increases towards the western
extent of the sampling area.
The iron (%) content for the applicable lithotypes are high and shows, similar to Au, an
increase towards the central and eastern extent of the sampling area.
Although the increase in Au and Fe towards the eastern extent of the property and the associated
decrease in Ag towards the west are noticeable, these results are not conclusive due to the small
sampling programme completed by Scarab.
Scarab could not locate any local structural features that might have a controlling effect on Au
mineralisation, similar to the Matala Dome of Luiri Gold. This absence of a domal feature on Iron Cap
does not imply absence of similar grades or thicknesses of Au mineralisation, only that further work is
required on the Iron Cap property to discern similar or site specific parameters that might control
mineralisation.
The anomalous Au values returned for all grab samples (ferruginous duricrust, magnetite-rich
lithologies and quartz veins) retrieved by Scarab might be indicative of a deeper seated Au reef or
vein system situated below the surface duricrust, as delineated by historical reports. In savannah
zones, similar to Iron Cap location, the formation of a duricrust induces a leaching in the upper
horizons and thus develops strongly depleted Au anomalies. As duricrust formation is a very long
process, the dispersion of Au is generally well extended, but shows a low signal on surface. Thus,
duricrust Au deposits in many cases underestimate the potential for deeper-seated Au mineralisation.
Iron Cap Gold Mine Technical Report – 25 March 2010
Scarab Environmental and Geological Enterprises
1
1. INTRODUCTION AND TERMS OF REFERENCE
1.1 Scope and purpose of the Report
Scarab Environmental and Geological Enterprises CC (Scarab) has been commissioned by The
Challenger Development Corp. (Challenger) to prepare a technical report according to the National
Instrument 43-101 (Canadian Standards for disclosure of Mineral Projects) and acquire any additional
information during fieldwork conducted on the Iron Cap Gold Mine (derelict) in Zambia, southern
central Africa.
The compilation of this Technical Report incorporated the following (including aspects as stipulated
within National Instrument and Form 43-101F1):
1. Review of available gold (Au) prospecting and production data for the Iron Cap Mine area
2. Literature review and geological model compilation for Au mineralisation in the Iron Cap
Mine area
3. Field visit to inspect historic Iron Cap Au mining activities
1.2 Independence
Neither Scarab nor the author of this report have or have had any previous material interest in
Challenger or related entities or interests. Our relationship with Challenger is one of professional
association between client and independent consultant. This report is prepared in return for fees
based upon agreed commercial rates and the payment of these fees is not dependent on the results
of this report.
1.3 Sources of Information
Scarab did not receive any documentation from the Zambian Ministry of Mines, which contains proof
of ownership, boundary coordinates or similar. Scarab did receive two general geological reports
(Watts et al., 1991 and Nguni, 2007), which gives geological information on the Iron Cap Mine area.
Other sources of information gathering include the following:
- Sciencedirect peer reviewed scientific publication website www.sciencedirect.com
- High definition satellite imagery from Google Earth® http://earth.google.com/
- Internet Encyclopaedia www.wikipedia.org
- Personal communication with employees actively involved in Au exploration at Iron Cap
- Personal communication with lecturers in Geology at the University of the Free State
(UFS), South Africa (R.S.A.)
- Personal communication with Zambian lecturers in Geology at the University of Namibia,
(UNAM) Windhoek, Namibia

Iron Cap Gold Mine Technical Report – 25 March 2010
Scarab Environmental and Geological Enterprises
2
- Libraries at the University of the Free State and Department Geology at UFS, R.S.A (cf.
Section 20 for References).
1.4 Personal Inspection on Property
Scarab completed a one day field investigation at the Iron Cap area on 7 January 2010.
The field investigation to the Iron Cap Mine area involved the following:
1. Personal communication with previous employees and other important persons
2. Investigate presence of historical mining and exploration activities
3. Investigate and report on infrastructure conditions and availability of exploration requirements
4. General geological, structural and stratigraphical setting (sampling where possible for assay
purposes)
5. Investigate any potential for social and environmental impact associated with possible
forthcoming exploration activities
Iron Cap Gold Mine Technical Report – 25 March 2010
Scarab Environmental and Geological Enterprises
3
2. RELIANCE ON OTHER INDUSTRY EXPERTS
Scarab has prepared this report for The Challenger Development Corp. (Challenger). The information,
conclusions, opinions, and estimates contained herein are based on information available to Scarab
at the time of preparation of this report. For the purpose of this report, Scarab has relied on ownership
information provided by Challenger or its associates. Scarab did not conduct research into property
title or mineral rights for the prospects and expresses no legal opinion as to the ownership status of
these properties.
Iron Cap Gold Mine Technical Report – 25 March 2010
Scarab Environmental and Geological Enterprises
4
3. PROPERTY DESCRIPTION AND LOCATION
3.1 Background information on Zambia
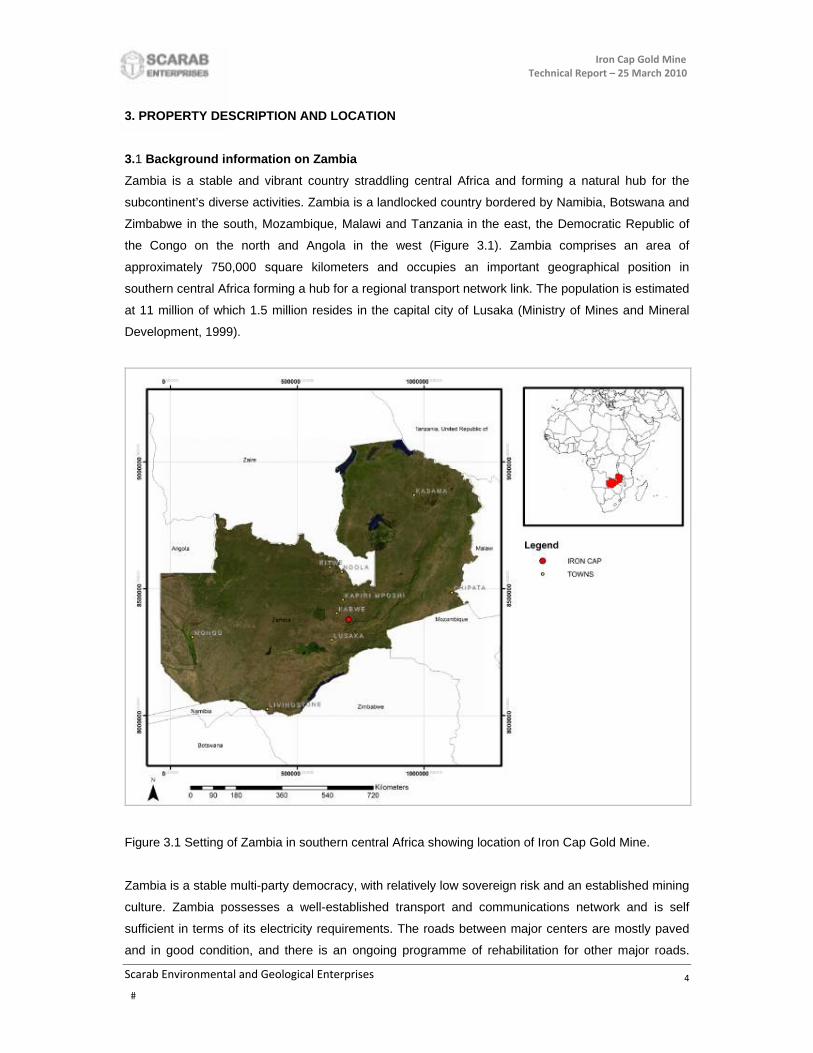
Zambia is a stable and vibrant country straddling central Africa and forming a natural hub for the
subcontinent’s diverse activities. Zambia is a landlocked country bordered by Namibia, Botswana and
Zimbabwe in the south, Mozambique, Malawi and Tanzania in the east, the Democratic Republic of
the Congo on the north and Angola in the west (Figure 3.1). Zambia comprises an area of
approximately 750,000 square kilometers and occupies an important geographical position in
southern central Africa forming a hub for a regional transport network link. The population is estimated
at 11 million of which 1.5 million resides in the capital city of Lusaka (Ministry of Mines and Mineral
Development, 1999).
Figure 3.1 Setting of Zambia in southern central Africa showing location of Iron Cap Gold Mine.
Zambia is a stable multi-party democracy, with relatively low sovereign risk and an established mining
culture. Zambia possesses a well-established transport and communications network and is self
sufficient in terms of its electricity requirements. The roads between major centers are mostly paved
and in good condition, and there is an ongoing programme of rehabilitation for other major roads.
Iron Cap Gold Mine Technical Report – 25 March 2010
Scarab Environmental and Geological Enterprises
5
Important rail links extend from the Zambian Copper Belt south to Livingstone, and then beyond to the
major South African ports of Durban and Cape Town. The Tanzania-Zambia railway provides access
to the Tanzanian port of Dar Es Salaam (Mobbs, 2009).
Hunter-gatherers and migrating tribes have inhabited Zambia for thousands of years. After sporadic
visits by European explorers, starting in the 18th century, Zambia was claimed and occupied by the
British towards the end of the nineteenth century as protectorate of Northern Rhodesia. On 24
October 1964, the protectorate gained independence with the new name of Zambia, derived from the
Zambezi River, which flows through the country. Zambia was governed the single-party rule of
President Kenneth Kaunda, whose 27 years of socialist policies are said to have hurt the economy.
Kaunda acceded to opposition demands for multiparty elections, and in 1991 peacefully relinquished
power. Zambia has been a multiparty democracy since 1991.
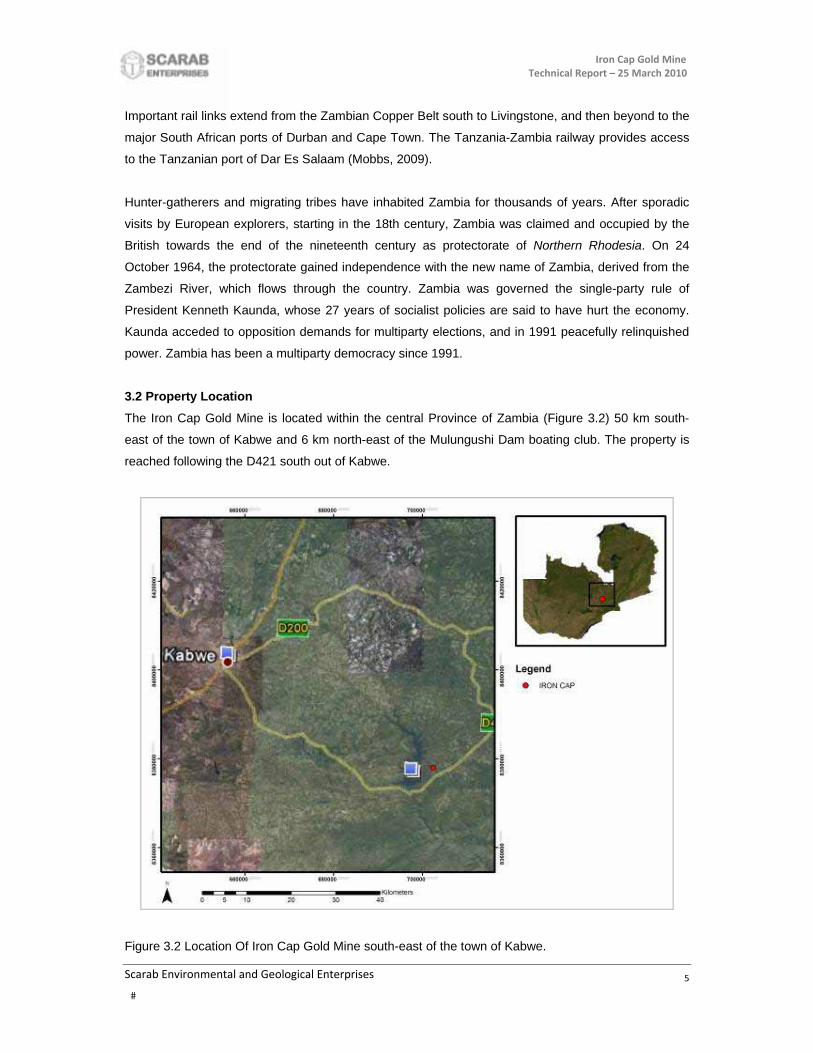
3.2 Property Location
The Iron Cap Gold Mine is located within the central Province of Zambia (Figure 3.2) 50 km south-
east of the town of Kabwe and 6 km north-east of the Mulungushi Dam boating club. The property is
reached following the D421 south out of Kabwe.
Figure 3.2 Location Of Iron Cap Gold Mine south-east of the town of Kabwe.
Iron Cap Gold Mine Technical Report – 25 March 2010
Scarab Environmental and Geological Enterprises
6
3.3 Mineral Tenure
Zambia is one of the most stable countries in Southern Africa with a functioning multi-party
democracy. The Zambian Government is a great supporter of mineral exploration and is fully
committed to mine development. The Government has adopted a pragmatic mineral policy, which
have been designed to enhance investment in the mining industry and to ensure the development of a
self-sustaining minerals-based industry. The privatization of many state-owned companies and
especially the copper mining industry, formerly managed under the parastatal umbrella of Zambia
Consolidated Copper Mines Ltd (ZCCM), is a clear demonstration of this intent.
In line with its stated Mining Policy, the Government of Zambia has enacted new legislation - the
Mines and Minerals Act (1995) - which greatly simplifies licensing procedures, places minimum
reasonable constraints on prospecting and mining activities, and creates a favourable investment
environment, whilst allowing international arbitration to be written into development agreements. A
framework for responsible development has also been created through publication of the
Environmental Protection and Pollution Control (Environmental Impact Assessment) Regulations of
1997 (Ministry of Mines and Mineral Development, 1999).
Three types of licences are available to the large-scale operator (Ministry of Mines and Mineral
Development, 1999):
Prospecting Licence: this confers the right to prospect for any mineral over any size of area
for a period of two years renewable.
Retention Licence: this confers the right to retain an area, subject to the Minister’s
agreement, over which feasibility studies have been completed but market conditions are
unfavourable for development of a deposit at that time. Size of the area may be that covered
by a Prospecting Licence or smaller area as redefined by the Licence holder. Duration would
be for three years renewable for another single period of three years.
Large Scale Mining Licence: this confers exclusive rights to carry out mining operations and
other acts reasonably incidental thereto in the area for a maximum of 25 years. The area to be
held should not exceed the area reasonably required to carry out the proposed mining
operations. Applications need to be accompanied by environmental protection plans and by
proposals for the employment and training of citizens of Zambia.
3.3.1 General conditions imposed upon the holder of a prospecting licence
The holder of a prospecting licence has under section 12 of the Mines and Minerals Act (1995),
exclusive rights to carry on prospecting operations in the prospecting area for the minerals specified
Iron Cap Gold Mine Technical Report – 25 March 2010
Scarab Environmental and Geological Enterprises
7
in the licence and to do all such other acts and things as are necessary for or reasonably incidental to
the carrying on of those operations. The licence holder is required for administrative reasons to:
a. Submit a programme for the training of Zambian citizens
b. Erect beacons at corners of tenement area
c. Provide and maintain security in tenement area and ensure than no illegal mining or trading of
minerals takes place in such tenement area
d. Apply for a renewal of the licence no later than 90 days before the expiry of the licence
e. Notify the Director of Mines every time that there is a change in its business address and
contact details
f. Accept additional conditions that may be imposed by the Director of Mines
In addition to the administrative regulations applicable to the prospecting right, a licence holder is
required to:
a. Commence prospecting operations within three months of issue of the licence and to develop
the prospecting area and carry on mining operations with due diligence and in accordance
with the programme of prospecting operations
b. Give notice of the discovery of minerals in the tenement area
c. Expend on prospecting operations not less than the amount prescribed or required by the
terms and conditions of the licence to be expended
d. Submit quarterly reports
e. Comply with any directive given under party IX of the Act regarding the protection of the
environment
f. Not enter into any contracts or agreements and any other operations in the area without the
consent of the Director of Mines, including change of shareholding and directorship of the
company
g. Pay tenement area charges on the grant of the licence and thereafter annually until the
termination of the licence
The Iron Cap property has been issued as a Small Scale Mining Licence (SML 177) to Londoloza
Resources and have been renewed up 2018 by the Zambian Ministry of Mines (cf. Appendix A).
3.3.2 Surface rights
The Zambian Lands Act governs surface rights. Under the lands act, all land is vested in the Zambian
President and held by him “in perpetuity for and on behalf of the people of Zambia”. The land is to be
administered and controlled by the President “for the use or common benefit, direct or indirect, for the
people of Zambia”.
Iron Cap Gold Mine Technical Report – 25 March 2010
Scarab Environmental and Geological Enterprises
8
Where any private leasehold interest exist in an area covered by a mining or prospecting right, the
holder of any licence or permit who requires the exclusive or other use of any portion of the
prospecting or mining area may, in accordance with the laws relating to such acquisition, acquire a
lease thereof, or the right to use the same terms as may be agreed between the licence holder and
the owner of such land.
If any portion of the land over which the tenement exist is under customary land, there may be a
requirement to obtain permission from the local Chief in order to obtain surface rights, which would
require the Chief to give his written consent to the local council for the conversion of that particular
portion of customary land to statutory tenure. Surface rights are not a pre requisite for the exercise of
a mining right although it is necessary to ensure that the authorizations required under the Lands Act
have been procured.
Scarab could not obtain information regarding surface rights of the Iron Cap SML and cannot
comment on ownership details regarding the surface rights of the property.
3.4 Property boundary demarcation
Boundary coordinates were obtained from reports (Watts et al., 1991 and Nguni, 2007) and maps
provided to Scarab prior to onset of fieldwork (cf. Section 1.3). The boundary positions of the Iron Cap
Mine area are “paper marked” and no field markers were sited (cf. Appendix A).
3.5 Agreements
Challenger Development Corporation (Challenger) has entered into an Option Agreement with
Londoloza Mining and Exploration Zambia Limited (Londoloza) to acquire a seventy percent (70%)
equity interest in Zamco (Zambian company). Londoloza is the registered and beneficial owners of
100 % of the issued and outstanding capital stock of Zamco with a 100 % interest in the Iron Cap
Gold (Au) prospect (“Property”) located 50 km southeast of the Zambian town of Kabwe (cf. Figure
3.2) (cf. Appendix D for Option Agreement).
Londoloza has granted Challenger the sole and exclusive option which may be exercised at the sole
discretion of Challenger to directly acquire a 70 % legal and beneficial interest in Zamco, equal to 70
% of all issued and outstanding common shares of Zamco for the full price and consideration of
expenditure to Challenger to the sum of US$ 1,500,000.00 in exploration work on the Property.
Allowable work on the property will include all expenditures, obligations and liabilities spent or
incurred directly or indirectly by Challenger in connection with the evaluation, exploration and
development of the Property and any production therefrom.
Upon the vesting of Zamco interest in Challenger, Challenger and Londoloza shall be deemed to have
entered into a Joint Venture agreement for further exploration and development of the Property and

Iron Cap Gold Mine Technical Report – 25 March 2010
Scarab Environmental and Geological Enterprises
9
any operation of the property as a mine. Until commencement of commercial production, Londoloza’s
interest in the Joint Venture shall be fully carried and Challenger shall be responsible for paying all
Joint Venture costs. The Joint Venture shall be operated through Zamco.
3.6 Environmental liabilities and permits
Scarab understands that the Zambian Ministry of Mines allows exploration and mining within the Iron
Cap area, and is unaware of any current regulations or environmental liabilities that may significantly
restrict access to this area for exploration. Suggestions and recommendations for environmental and
social impacts are provided in Section 17.
Any prospecting work within the Iron Cap mine area will require a prospecting permit from the
Zambian Ministry of Mines (cf. Section 3.3). Scarab did not receive any information which would
indicate that such permits have been issued.
Iron Cap Gold Mine Technical Report – 25 March 2010
Scarab Environmental and Geological Enterprises
10
4. LOCAL CLIMATE, PHYSIOGRAPHY, RESOURCES AND INFRASTRUCTURE
4.1 Climate and agriculture
Zambia enjoys a sunny climate with three distinct seasons: a cool dry season in May to August with
average daytime temperatures of 15 to 27°C; a hot dry season in September to November with
temperatures between 27 and 32°C; and a warm rainy season in the months of December to April
with temperatures between 20 and 27°C. Most of the country can be classified as humid subtropical,
with small patches of semi-arid steppe climate in the south-west. The dry season is subdivided into
the cool dry season (May to August), and the hot dry season (September to October/November). The
modifying influence of altitude gives the country pleasant subtropical weather conditions for most of
the year (Ministry of Mines and Mineral Development, 1999).
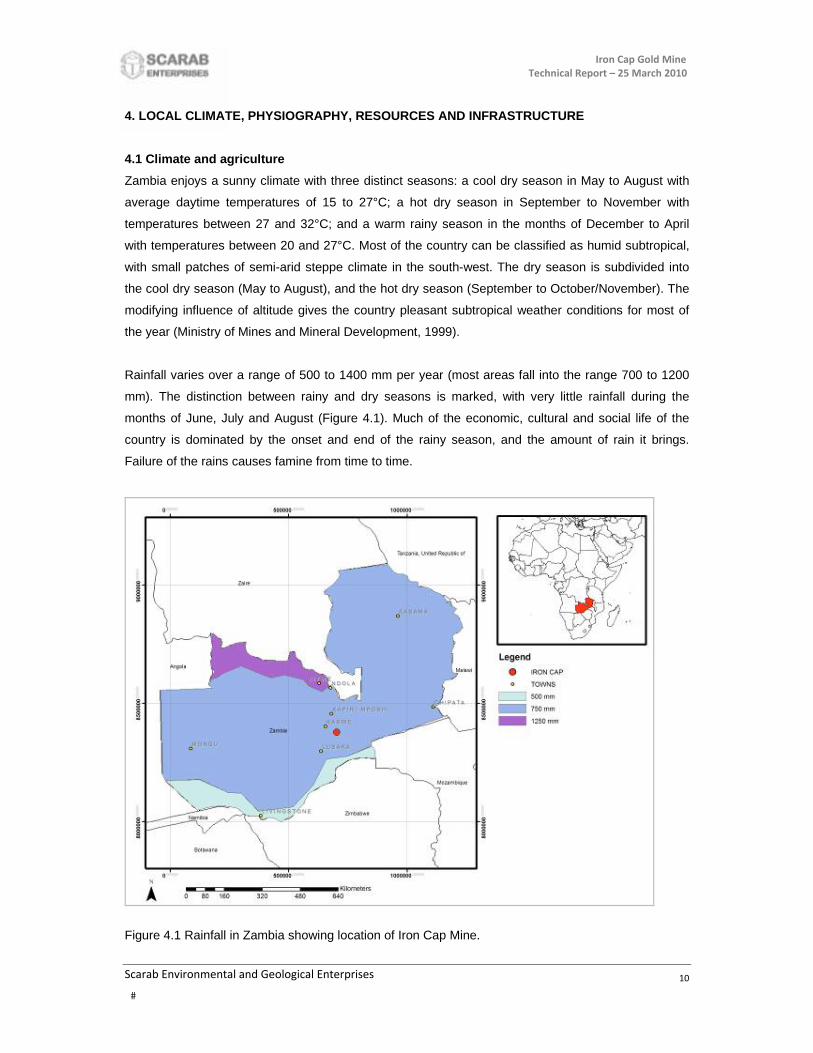
Rainfall varies over a range of 500 to 1400 mm per year (most areas fall into the range 700 to 1200
mm). The distinction between rainy and dry seasons is marked, with very little rainfall during the
months of June, July and August (Figure 4.1). Much of the economic, cultural and social life of the
country is dominated by the onset and end of the rainy season, and the amount of rain it brings.
Failure of the rains causes famine from time to time.
Figure 4.1 Rainfall in Zambia showing location of Iron Cap Mine.
Iron Cap Gold Mine Technical Report – 25 March 2010
Scarab Environmental and Geological Enterprises
11
The Iron Cap Mine is located within an area that receives up to 750 mm of rain per annum with most
of this precipitation received between the months of December and April.
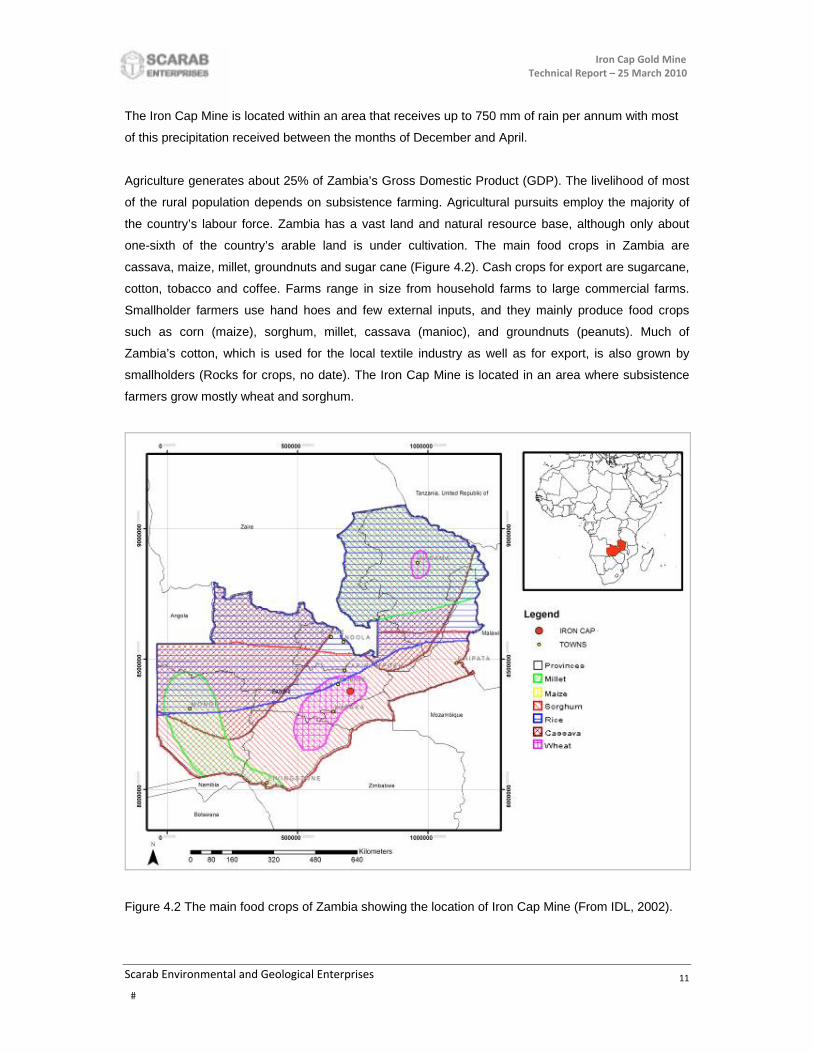
Agriculture generates about 25% of Zambia’s Gross Domestic Product (GDP). The livelihood of most
of the rural population depends on subsistence farming. Agricultural pursuits employ the majority of
the country’s labour force. Zambia has a vast land and natural resource base, although only about
one-sixth of the country’s arable land is under cultivation. The main food crops in Zambia are
cassava, maize, millet, groundnuts and sugar cane (Figure 4.2). Cash crops for export are sugarcane,
cotton, tobacco and coffee. Farms range in size from household farms to large commercial farms.
Smallholder farmers use hand hoes and few external inputs, and they mainly produce food crops
such as corn (maize), sorghum, millet, cassava (manioc), and groundnuts (peanuts). Much of
Zambia’s cotton, which is used for the local textile industry as well as for export, is also grown by
smallholders (Rocks for crops, no date). The Iron Cap Mine is located in an area where subsistence
farmers grow mostly wheat and sorghum.
Figure 4.2 The main food crops of Zambia showing the location of Iron Cap Mine (From IDL, 2002).
Iron Cap Gold Mine Technical Report – 25 March 2010
Scarab Environmental and Geological Enterprises
12
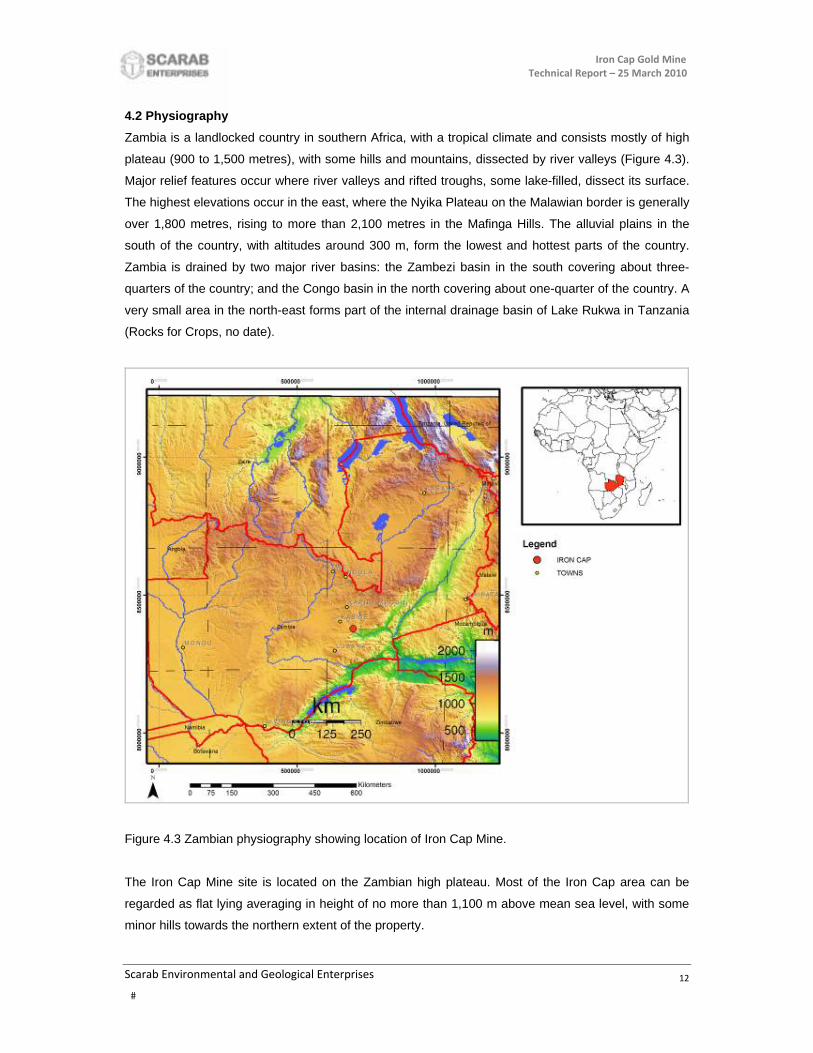
4.2 Physiography
Zambia is a landlocked country in southern Africa, with a tropical climate and consists mostly of high
plateau (900 to 1,500 metres), with some hills and mountains, dissected by river valleys (Figure 4.3).
Major relief features occur where river valleys and rifted troughs, some lake-filled, dissect its surface.
The highest elevations occur in the east, where the Nyika Plateau on the Malawian border is generally
over 1,800 metres, rising to more than 2,100 metres in the Mafinga Hills. The alluvial plains in the
south of the country, with altitudes around 300 m, form the lowest and hottest parts of the country.
Zambia is drained by two major river basins: the Zambezi basin in the south covering about three-
quarters of the country; and the Congo basin in the north covering about one-quarter of the country. A
very small area in the north-east forms part of the internal drainage basin of Lake Rukwa in Tanzania
(Rocks for Crops, no date).
Figure 4.3 Zambian physiography showing location of Iron Cap Mine.
The Iron Cap Mine site is located on the Zambian high plateau. Most of the Iron Cap area can be
regarded as flat lying averaging in height of no more than 1,100 m above mean sea level, with some
minor hills towards the northern extent of the property.

Iron Cap Gold Mine Technical Report – 25 March 2010
Scarab Environmental and Geological Enterprises
13
4.3 Access
The Iron Cap Gold Mine is located within the central Province of Zambia 50 km south-east of the town
of Kabwe and 6 km north-east of the Mulungushi Dam boating club. The property is reached following
the D421 south out of Kabwe (cf. Figure 3.2).
4.4 Vegetation
The Iron Cap Gold Mine is part of the plateau receiving medium rainfall and according to White (1983)
is located within moist infertile savannah. The moist/infertile savannahs are identifiable by the
predominance of broad-leafed, thornless trees in the families Ceasalpinaceae and Combretaceae.
The most extensive example of this vegetation is the miombo woodlands, dominated by Brachystegia
and Julbernardia species, that occupy a broad belt from Angola to Tanzania (Forest Resource
assessment working paper, 2001).
Figure 4.4 Vegetation of Zambia showing location of Iron Cap Mine (White, 1983).
4.5 Zambia resources
Zambia’s economy is heavily dependent on mining, in particular the mining of copper (Cu) and cobalt
(Co). Reserves of Cu ore at some mines are almost depleted, costs of production have increased,
Iron Cap Gold Mine Technical Report – 25 March 2010
Scarab Environmental and Geological Enterprises
14
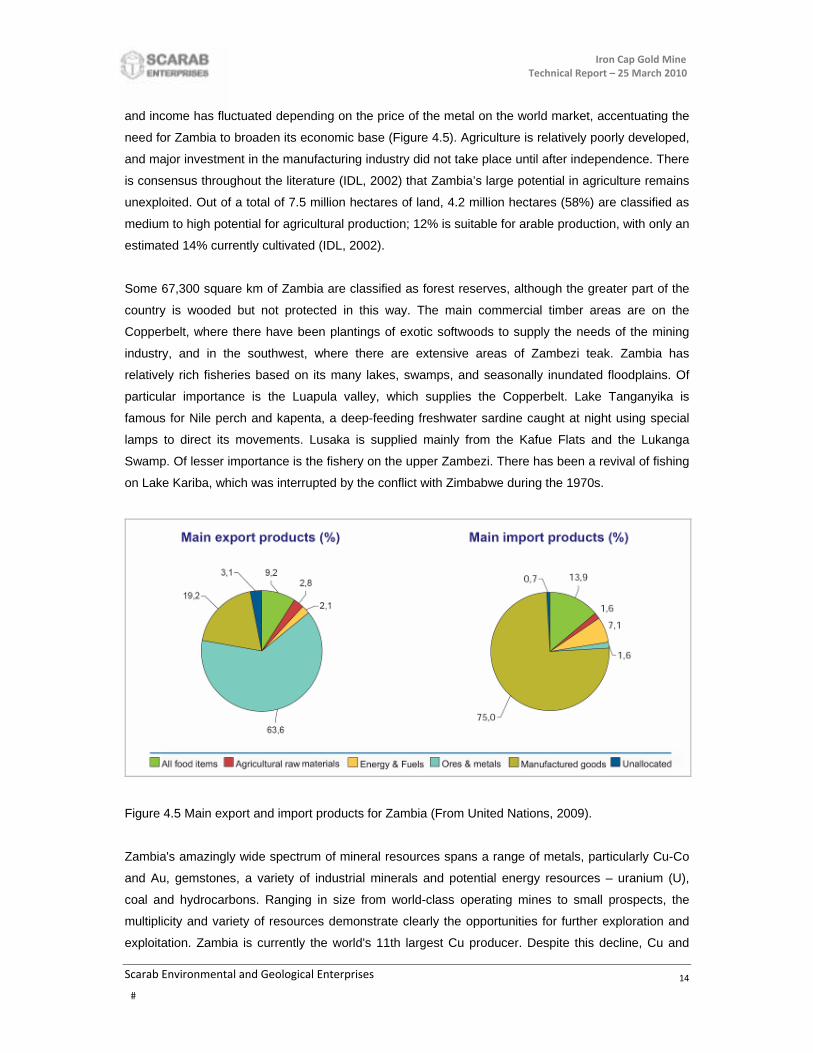
and income has fluctuated depending on the price of the metal on the world market, accentuating the
need for Zambia to broaden its economic base (Figure 4.5). Agriculture is relatively poorly developed,
and major investment in the manufacturing industry did not take place until after independence. There
is consensus throughout the literature (IDL, 2002) that Zambia’s large potential in agriculture remains
unexploited. Out of a total of 7.5 million hectares of land, 4.2 million hectares (58%) are classified as
medium to high potential for agricultural production; 12% is suitable for arable production, with only an
estimated 14% currently cultivated (IDL, 2002).
Some 67,300 square km of Zambia are classified as forest reserves, although the greater part of the
country is wooded but not protected in this way. The main commercial timber areas are on the
Copperbelt, where there have been plantings of exotic softwoods to supply the needs of the mining
industry, and in the southwest, where there are extensive areas of Zambezi teak. Zambia has
relatively rich fisheries based on its many lakes, swamps, and seasonally inundated floodplains. Of
particular importance is the Luapula valley, which supplies the Copperbelt. Lake Tanganyika is
famous for Nile perch and kapenta, a deep-feeding freshwater sardine caught at night using special
lamps to direct its movements. Lusaka is supplied mainly from the Kafue Flats and the Lukanga
Swamp. Of lesser importance is the fishery on the upper Zambezi. There has been a revival of fishing
on Lake Kariba, which was interrupted by the conflict with Zimbabwe during the 1970s.
Figure 4.5 Main export and import products for Zambia (From United Nations, 2009).
Zambia's amazingly wide spectrum of mineral resources spans a range of metals, particularly Cu-Co
and Au, gemstones, a variety of industrial minerals and potential energy resources – uranium (U),
coal and hydrocarbons. Ranging in size from world-class operating mines to small prospects, the
multiplicity and variety of resources demonstrate clearly the opportunities for further exploration and
exploitation. Zambia is currently the world's 11th largest Cu producer. Despite this decline, Cu and

Iron Cap Gold Mine Technical Report – 25 March 2010
Scarab Environmental and Geological Enterprises
15
cobalt mining still contributes 10% of Zambia's GDP, representing 80% of export earnings. Zambia is
the world's largest Co producer, supplying 20% of the world's cobalt. As the country has no
downstream industry, the Cu is exported as Cu bars to the USA, Japan, France, Malaysia, India, UK,
Belgium, Thailand, Italy and Indonesia.
Figure 4.6 Location of different mineral commodities in Zambia.
4.5.1 Gold (Au)
Zambia has a history of Au mining on a relatively small scale, with the twenty larger deposits having
produced slightly more than 2t of Au since modern mining began in 1902. The largest past producers
are Dunrobin (990 kg gold), Sasare (390 kg), and Matala (225 kg). More than 300 Au occurrences
have been reported throughout the country and some of these are currently being re-evaluated by
different companies (Figure 4.7).

Iron Cap Gold Mine Technical Report – 25 March 2010
Scarab Environmental and Geological Enterprises
16
Figure 4.7 Hydrothermal and alluvial gold (Au) provinces in Zambia.
4.5.2 Other commodities
The other important metal production has been zinc (Zn) and lead (Pb) from the carbonate-hosted
deposits of Kabwe, which, with a total of 11Mt of ore containing 40% combined Zn and Pb, ranks as
one of the highest grade Zn-Pb deposits of probable Mississippi Valley - type in the world. Similar
styles of mineralization have been recognized over a wide area to the north of Kabwe.
4.6 Infrastructure and availability of exploration requirements
The town of Kabwe, 50 km northwest of the Iron Cap Mine, should be able to supply most of the
exploration requirements for operation. In addition to hotel accommodation at the same town, the
nearby Mulungushi Dam boating club should be able to supply most accommodation requirements.
4.7 Operating season
Zambia’s rainfall seasons (cf. Section 4.1) plays an important role in estimating the ideal operating
season. The best operating time within the Iron Cap area should be between May and November
(winter). Within the rainy season (November to April) many of the gravel roads become impassable
and although work should be able to continue, road use through connecting infrastructure may be
limited.
Iron Cap Gold Mine Technical Report – 25 March 2010
Scarab Environmental and Geological Enterprises
17
5. HISTORY
5.1 Prior ownership
The Iron Cap Mine is an old prospect that lay dormant for some years until acquired by A.M.
Bensusan in 1953, which is the same year that the mine came into production. The mine was
afterwards registered under the name of Rhodesian Anglo American Limited up to an unknown date,
just before British Independence (Watts et al., 1991 and Nguni, 2007). After independence gold (Au)
exploration was restricted to a government department called Minex, incorporated under ZIMCO
(Zambia Industry and Mining Corporation).
Scarab was unable to obtain information pertaining to exploration activities for the time when ZIMCO
was operational in the area to 2008. In 2008, Iron Cap was a 70/30 Joint Venture between Londoloza
Resources Corp. (Londoloza) and Exploration Zambia with Triple Plate Junction Plc. Work
commenced in March 2008 and ended in September 2008 when Triple Plate exhausted funds and
subsequently defaulted and withdrew from the project. The project reverted back to Londoloza and
Exploration Zambia thereafter both of which is the current owners of Iron Cap small mining licence
177 (SML 177). Boundary coordinates for the Iron Cap SML are provided in Appendix A.
5.2 Previous exploration
Historical figures for Iron Cap have made use of pennyweights per ton (dwt. per ton). One
pennyweight equals 1.555 g per tonne. Scarab has converted all pennyweights to grams and rounded
figures to the nearest 10.
Historical development work carried out by Rhodesian Anglo American Limited consisted of trenching,
by which the deposit was traced for a length of 1.3 km, as well as shaft sinking. One shaft intersected
the Au reef at 14 m where the average Au content was 3.7 g Au / ton. A second shaft was sunk to 16
m where blocks of iron stained quartzite gossan and iron stained clay were found between 13.5 and
15.8 m. According to Nguni (2007) the said .reef was exposed in a surface working due to weathering,
but Scarab was unable to locate the location. It is further stated by the same author that at this point,
the reef dips to the north and is approx. 1.2 m wide. Three historic grab samples at this locality
assayed 1.6, 1.6, 6.2 g Au / ton. At 12 m depth, a small crosscut was driven southwards, intersecting
the main reef consisting of blocks of quartzite in gossan and clay where two historic grab samples
assayed 1.2 and 29.2 g Au / ton. Scarab was unable to investigate the shafts or cross cuts due to no
access into the latter. Scarab can also not confirm the assay results. According to Nguni (2007) the
shallow water table and deep weathering limited prospecting.

Iron Cap Gold Mine Technical Report – 25 March 2010
Scarab Environmental and Geological Enterprises
18
5.3 Historical Mineral Resources and Reserves
A historical resource/reserve estimate calculated prior to the implementation of NI 43-101 (Feb 2001)
is provided by Nguni (2007) and is based upon an historical report by Reeve (1963). This
resource/reserve was calculated for only a part of the Iron Cap Mine area. Scarab does not have the
report by Reeve (1963) and cannot comment on the geographical position of the resource/reserve nor
the actual historical resource/reserve estimation.
242,880 t ore @ 1.555 g Au / ton (13,322 ounces of Au)
Albeit that the depth below surface of the resource/reserve is not provided, the strike length equals
880 m over an average thickness of 20 m and width of 4.6 m (Nguni, 2007). More detail on this
historical resource/reserve is provided in Section 16.
5.4 Production
Watts et al. (1991) gives historical production figures during 1953 to 1954 at 189 ounces of gold
mined at a grade of 2.2 g Au / t. Nguni (2007) gives production figures in sharp contrast to the former
of a total of 38,431 ounces of Au mined between 1950 and 1961 by Bensusan. Scarab cannot
comment on any of these figures and have not seen and reports from mining and/or exploration
companies active in the area to support these figures.

Iron Cap Gold Mine Technical Report – 25 March 2010
Scarab Environmental and Geological Enterprises
19
6. GEOLOGICAL SETTING
6.1 Regional Geology
The complex geology and multiplicity of tectono-thermal events reflect Zambia's unique position
effectively located between the Congo -, Zimbabwe-Kaapvaal -, and Tanzania cratons (Figure 6.1).
Differential movements between these stable blocks, together with their buttressing effects, have
played an important role in the geological evolution of the country and hence in the genesis of the
country's mineral and energy resources (Ministry of Mines and Mineral Development, 1999).
Figure 6.1 Location of Zambia with respect to surrounding cratons (From Ministry of Mines and
Mineral Development, 1999).
6.2 Local geological setting
The geology of Zambia comprises the Basement Complex, the Muva Supergroup, the Katanga
Supergroup and the Karoo Supergroup (Figure 6.2). Above the Karoo strata are late Mesozoic,
Tertiary and Quaternary sediments (Schluter, 2006; Mitchell, no date).

Iron Cap Gold Mine Technical Report – 25 March 2010
Scarab Environmental and Geological Enterprises
20
Figure 6.2 Regional geology of Zambia. MSZ – Mwembeshi Shear Zone (From Ministry of Mines and
Mineral Development, 1999).
6.2.1 Tectonic Thermal events
A number of major tectono-thermal events have affected Zambia and have often contributed directly
to the accumulation of metals, minerals and even energy resources. The earliest recognizable event
in the region was the Ubendian Orogeny (2000 to 1800Ma), which generated the NW-SE-trending fold
belt of high-grade metamorphic rocks that demarcates the north-eastern margin of the Bangweulu
Block (cf. Figure 6.2).
The next major orogenic event was the Irumide Orogeny which resulted in extensive folding and
shearing of Basement - and Muva rocks in central and eastern Zambia during the period 1350 to
1100Ma, broadly synchronous with the Kibaran Orogeny of The Democratic Republic of the Congo
(DRC). The Irumide Belt has been interpreted as a NW-facing, 350km-wide foreland fold and thrust
belt resulting from NW-SE-directed crustal shortening (De Waele et al., 2006). The subsequent
Lomamian and Lufilian Orogenies, the latter broadly equivalent to the continent-wide Pan-African
Orogeny, were represented by a complex series of tectonic and thermal events in the approximate
time interval 950 to 450Ma.
Iron Cap Gold Mine Technical Report – 25 March 2010
Scarab Environmental and Geological Enterprises
21
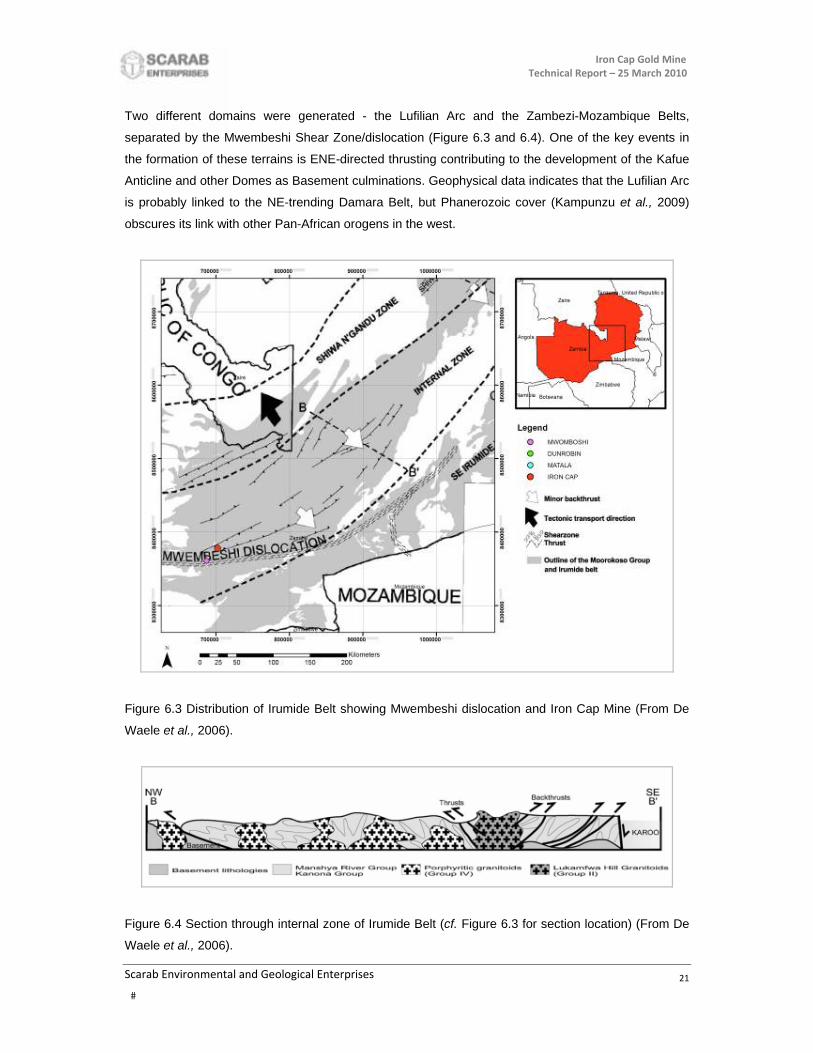
Two different domains were generated - the Lufilian Arc and the Zambezi-Mozambique Belts,
separated by the Mwembeshi Shear Zone/dislocation (Figure 6.3 and 6.4). One of the key events in
the formation of these terrains is ENE-directed thrusting contributing to the development of the Kafue
Anticline and other Domes as Basement culminations. Geophysical data indicates that the Lufilian Arc
is probably linked to the NE-trending Damara Belt, but Phanerozoic cover (Kampunzu et al., 2009)
obscures its link with other Pan-African orogens in the west.
Figure 6.3 Distribution of Irumide Belt showing Mwembeshi dislocation and Iron Cap Mine (From De
Waele et al., 2006).
Figure 6.4 Section through internal zone of Irumide Belt (cf. Figure 6.3 for section location) (From De
Waele et al., 2006).

Iron Cap Gold Mine Technical Report – 25 March 2010
Scarab Environmental and Geological Enterprises
22
The peak of tectonic activity and associated granite emplacement on the Mwembeshi Shear is
reported to have occurred at about 600 million years. This timing is approximately coincident with the
Pan African tectono-thermal event, which occurred in the approximate time range 500 to 800 Ma
(Morel et al., 2007). The final tectono-thermal event was the Karoo Rifting associated with the break-
up of Gondwanaland during the Permian followed by opening of the proto-Indian Ocean in the
Jurassic; and a final episode of rifting related to the development of the East African Rift system in
late Cretaceous and early Tertiary times (Ministry of Mines and Mineral Development, 1999).
6.2.2 Stratigraphic setting
6.2.2.1 Basement
The Basement Complex comprises the oldest rock system in Zambia and is most extensively
exposed in the eastern and south-eastern part of the country (Table 6.1). The rocks have been folded
and faulted and have undergone repeated episodes of metamorphism, so that their original character
has been completely destroyed. The main rock types are: granites, gneisses, schists, migmatites,
amphibolites, granulites, charnockites, khondalites, phyllites, limestones and metaquartzites. These
rocks are of Paleoproterozoic age. The intrusive and extrusive rocks in the Basement Complex are
granites, syenites, dolerites, granodiorites, pegmatites, quartz veins, aplites, pyroclastics, gabbros,
rhyolites, ultrabasic rocks, andesites and metavolcanic rocks.
6.2.2.2 Muva Supergroup
The Muva Supergroup has a much lower grade of metamorphism compared to Basement Complex. It
is separated from the latter by an unconformity, which probably represents a period of about 1Ga. The
Muva Supergroup is mainly exposed in Central -, Copperbelt -, Southern - and Northern Provinces
and is composed of conglomerates, grit, quartzites, iron-rich sandstone and red mudstone, gneissose
schists and metavolcanic rocks. Intrusive rocks in the Muva Supergroup are granites, granite
porphyry, granodiorite, syenites, dolerites, norites, lamprophyres, carbonatites, pegmatites, quartz
veins, gabbros, basic volcanic and ultrabasic rocks.
6.2.2.3 Katanga Supergroup
The Katanga Supergroup is unconformably located above the Muva Supergroup or the Basement
Complex, and is composed of conglomerates, shales, argillites, quartzites, arkoses, greywackes, iron
formations, dolomites and aeolian sandstones. The Katanga Supergroup rocks are Neoproterozoic to
Cambrian in age. Intrusive rocks in the Katanga Supergroup are granites, dolerites, adamelites,
lamprophyres, gabbros and ultrabasic rocks. On the Copperbelt the Katanga Supergroup has been
divided into the Roan -, Mwasha - and Kundelungu Groups. The lower part of this almost exclusively
sedimentary sequence is the economically important Mine Series Group which hosts the bulk of the
copper-cobalt mineralization of the Copperbelt (Ministry of Mines and Mineral Development, 1999).
Iron Cap Gold Mine Technical Report – 25 March 2010
Scarab Environmental and Geological Enterprises
23
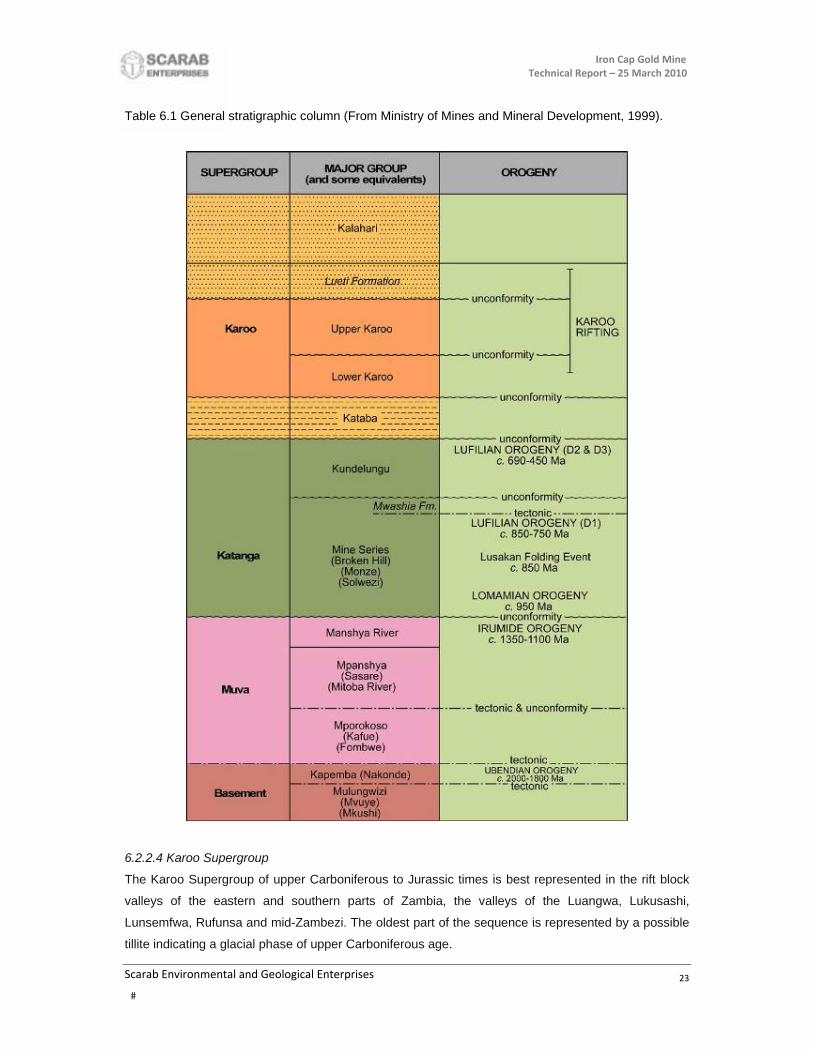
Table 6.1 General stratigraphic column (From Ministry of Mines and Mineral Development, 1999).
6.2.2.4 Karoo Supergroup
The Karoo Supergroup of upper Carboniferous to Jurassic times is best represented in the rift block
valleys of the eastern and southern parts of Zambia, the valleys of the Luangwa, Lukusashi,
Lunsemfwa, Rufunsa and mid-Zambezi. The oldest part of the sequence is represented by a possible
tillite indicating a glacial phase of upper Carboniferous age.
Iron Cap Gold Mine Technical Report – 25 March 2010
Scarab Environmental and Geological Enterprises
24
Higher in the sequence, the Karoo Supergroup consists mainly of mudstones, grit and sandstones
with an upper layer of basaltic lava of Jurassic age, the latter representing the first phases of
Gondwana break up and the end of Karoo sedimentation.
6.2.2.5 Cretaceous, Tertiary, Quaternary
Overlying the Karoo Supergroup are sandstones and mudstones of Late Jurassic to Cretaceous age.
The Kalahari Group, consisting of poorly consolidated sandstones and unconsolidated windblown
sands, overlies most of the Western Province of Zambia, together with smaller areas of the
Northwestern -, Central - and Southern Provinces. These sands originated during the later Tertiary
and Pleistocene periods and were deposited during an arid phase, when the limits of the Kalahari
Desert were greatly extended (Ministry of Mines and Mineral Development, 1999; Schluter, 2006;
Mitchell, no date).
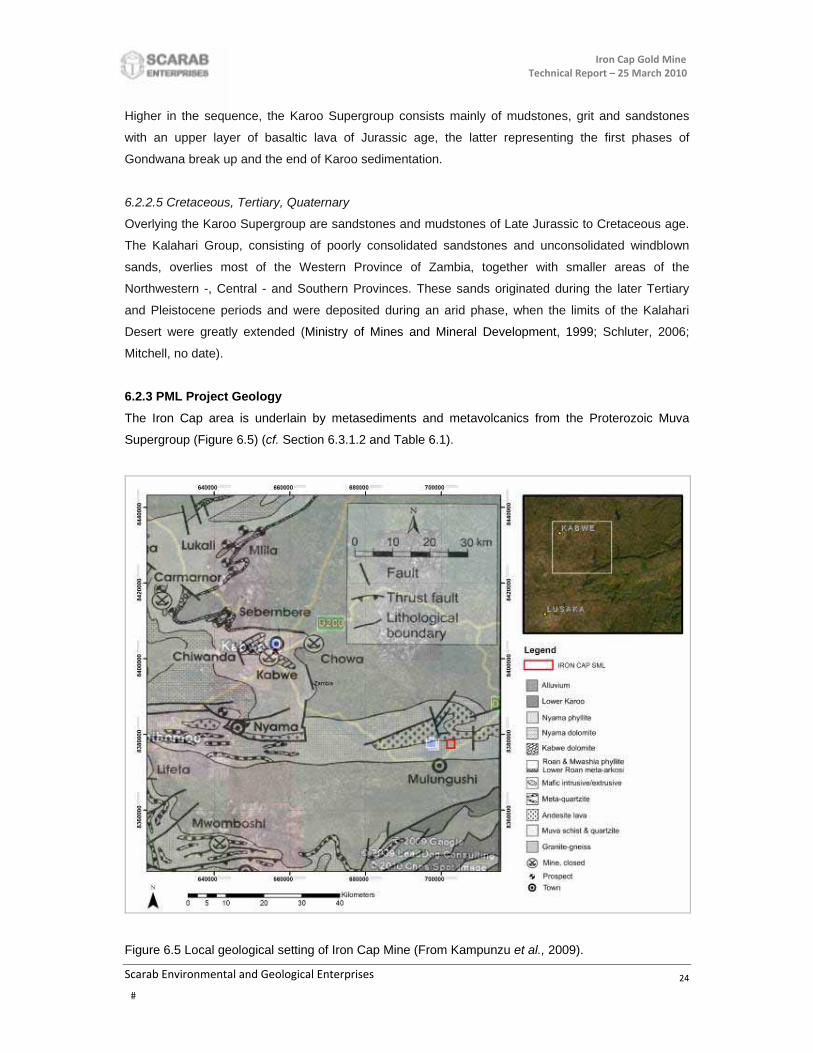
6.2.3 PML Project Geology
The Iron Cap area is underlain by metasediments and metavolcanics from the Proterozoic Muva
Supergroup (Figure 6.5) (cf. Section 6.3.1.2 and Table 6.1).
Figure 6.5 Local geological setting of Iron Cap Mine (From Kampunzu et al., 2009).

Iron Cap Gold Mine Technical Report – 25 March 2010
Scarab Environmental and Geological Enterprises
25
Structurally, the Mine is located within the 550 Ma year old Mwembeshi Shear Zone/dislocation. The
Mwembeshi Shear Zone is a ductile shear zone associated with a sinistral strike slip movement
(Figure 6.6).
Figure 6.6 Geological setting of Iron Cap Mine showing position of Mwembeshi Shearzone (From
Ministry of Mines and Mineral Development, 1999).
The northern part of the Iron Cap property is underlain by andesitic lave from the Muva Supergroup,
whilst the southern part of the property comprises schist and quartzite from the same Supergroup
(Figure 6.7). It is known from the literature that the Muva Supergroup contains granite intrusions (cf.
Section 6.3.1.2). Scarab was unable to locate any surficial granites and could not locate any
reference to nearby similar intrusives from the literature apart from the presence of basement
comprising granite and gneiss immediately south of the Iron Cap SML (Kampunzu et al., 2009). The
only visible lithology was a ferruginous duricrust visible in the trench cutting and open pit on the
property (Figure 6.8).

Iron Cap Gold Mine Technical Report – 25 March 2010
Scarab Environmental and Geological Enterprises
26
Figure 6.7 Local geological setting of Iron Cap Mine.
Figure 6.8 Ferruginous duricrust in cut trenches and open pit at the Iron Cap Mine.
Iron Cap Gold Mine Technical Report – 25 March 2010
Scarab Environmental and Geological Enterprises
27
7. DEPOSIT TYPE AND MODEL
The majority of gold (Au) deposits in Zambia are mesothermal lode deposits (veins and more
dispersed occurrences in brittle and brittle-ductile shear zones). Orogenic, or the so-called
mesothermal Au deposits are a distinctive class of mineral deposit that has been the source for much
of world Au production. The ores are widely recognized in both Phanerozoic mobile belts and older
cratonic blocks. Orogenic gold deposits have formed over more than 3 billion years of Earth’s history,
episodically during the Middle Archaean to younger Precambrian, and continuously throughout the
Phanerozoic (Ministry of Mines and Mineral Development, 1999).
Mesothermal Au deposits are characteristically associated with deformed and metamorphosed mid-
crustal blocks, particularly in spatial association with major crustal structures. A consistent spatial and
temporal association with granitoids of a variety of compositions indicates that melts and fluids were
both inherent products of thermal events during orogenesis. Including placer accumulations, which
are commonly intimately associated with this mineral deposit type, recognized production and
resources from economic orogenic-gold deposits are estimated at just over one billion ounces of Au.
Consistent geological characteristics include (Goldfarb et. al., 2001):
1. Deformed and variably metamorphosed host rocks
2. Low sulfide volume;
3. Carbonate–sulfide ± sericite ± chlorite alteration assemblages in greenschist-facies hosts
4. Low salinity, CO2-rich ore fluids
5. Normally, a spatial association with large-scale compressional to transpressional structures
6. The orogenic Au deposits normally consist of abundant quartz-carbonate veins and show
evidence for formation from fluids at supralithostatic pressures
7. The mineralized lodes formed over a uniquely broad range of upper to mid-crustal pressures
and temperatures, between about 200 to 650°C and 1 to 5 kbar.
Most of the Au mineralisation in Zambia is localized within structures related to the Mwembeshi Shear
Zone in central Zambia (cf. Section 6.3.2). This major intra-cratonic shear zone was undoubtedly
trans-crustal in vertical extent and clearly acted as an important conduit for fluid flow and magma
emplacement. It also exhibits a history of multiple reactivation throughout the Lomamian and Lufilian
(Pan-African) Orogenies (c.950 to 450Ma) and was reactivated during Karoo rifting as well.
The Au mineralisation in Zambia show many features that are typical of other Phanerozoic Mobile
Belts around the world, including the existence of numerous granitoids, a predominance of
greenschist facies regional metamorphism, regional scale crustal deformation and the existence of
numerous Au deposits.
Iron Cap Gold Mine Technical Report – 25 March 2010
Scarab Environmental and Geological Enterprises
28
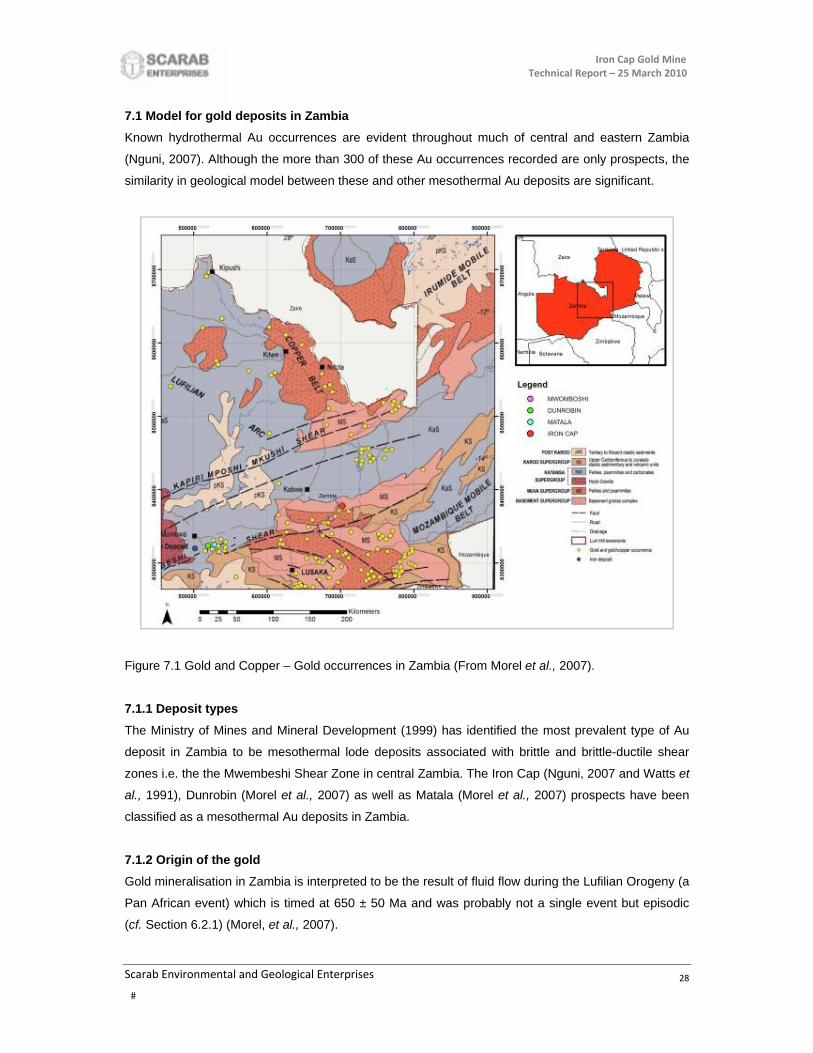
7.1 Model for gold deposits in Zambia
Known hydrothermal Au occurrences are evident throughout much of central and eastern Zambia
(Nguni, 2007). Although the more than 300 of these Au occurrences recorded are only prospects, the
similarity in geological model between these and other mesothermal Au deposits are significant.
Figure 7.1 Gold and Copper – Gold occurrences in Zambia (From Morel et al., 2007).
7.1.1 Deposit types
The Ministry of Mines and Mineral Development (1999) has identified the most prevalent type of Au
deposit in Zambia to be mesothermal lode deposits associated with brittle and brittle-ductile shear
zones i.e. the the Mwembeshi Shear Zone in central Zambia. The Iron Cap (Nguni, 2007 and Watts et
al., 1991), Dunrobin (Morel et al., 2007) as well as Matala (Morel et al., 2007) prospects have been
classified as a mesothermal Au deposits in Zambia.
7.1.2 Origin of the gold
Gold mineralisation in Zambia is interpreted to be the result of fluid flow during the Lufilian Orogeny (a
Pan African event) which is timed at 650 ± 50 Ma and was probably not a single event but episodic
(cf. Section 6.2.1) (Morel, et al., 2007).
Iron Cap Gold Mine Technical Report – 25 March 2010
Scarab Environmental and Geological Enterprises
29
Mesothermal Au deposits, which form at temperatures above 350 °C, occur along large breaks or
faults in continental crust. These deposits form at depths of 3 to 5 km below the earth’s surface and
appear to be associated with the upward migration of fluids from the earths mantle (Alida, 2007). Most
lode Au deposits are sourced from metamorphic rocks because it is thought that the majority are
formed by dehydration of basalt during metamorphism. The Au is transported up faults by
hydrothermal waters and deposited when the water cools too much to retain Au in solution.
The near surface lithology investigated by Scarab at Iron Cap has been described as a ferruginous
duricrust. Anomlaous values of Au, within this host are formed from pre-existing Au deposits (possibly
including some placer deposits) during prolonged weathering of the bedrock. Gold is deposited within
iron oxides in the weathered rock or regolith, and may be further enriched by reworking by erosion.
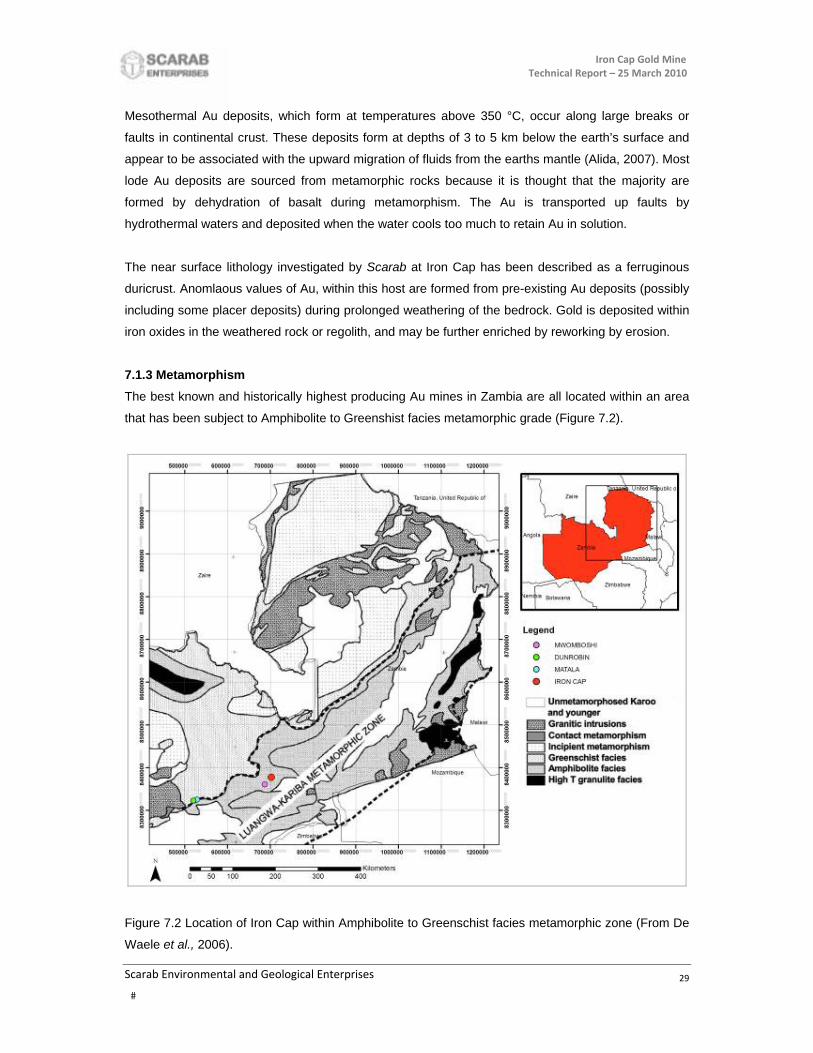
7.1.3 Metamorphism
The best known and historically highest producing Au mines in Zambia are all located within an area
that has been subject to Amphibolite to Greenshist facies metamorphic grade (Figure 7.2).
Figure 7.2 Location of Iron Cap within Amphibolite to Greenschist facies metamorphic zone (From De
Waele et al., 2006).

Iron Cap Gold Mine Technical Report – 25 March 2010
Scarab Environmental and Geological Enterprises
30
7.1.4 Mineralogy
Significant hydrothermal Au deposits in Zambia, namely Dunrobin and Matala (Luiri Gold) as well as
the Cheowa and Mwomboshi Au prospects (Zambezi Resources) are associated with hydrothermal
quartz veins and pyrite alteration (Morel et al., 2007). At Dunrobin, the pyrite appears to occur within
an alteration zone associated with the quartz veins which are also pyrite enriched. The gossan
consists primarily of hematite, limonite pyrite and quartz. Drilling has consistently shown that Au
mineralisation is variably distributed within the gossan and the adjacent limestones, and that higher
Au grades are commonly associated with disseminated first generation pyrite in the limestone that
formed during the early sulphidation phase. At Luiri Gold’s Matala mine, Au mineralisation is
characterised by strong stratigraphic disruption (deformation), shearing and the presence of quartz-
dolomite-pyrite-tourmaline-albite-sericite alteration. Apart from the presence of non-visible Au,
chalcopyrite is replaced by chalcocite proximal to and within the ore zones. Studies of primary
mineralisation show that it contains a range of sulphide minerals including pyrite, chalcopyrite,
marcasite, arsenopyrite, galena, sphalerite, covellite, tetrahedrite, digenite and pyrrhotite, as well as
Au which occurs enclosed within pyrite (Brown et al., 2008). Although Scarab could not obtain
significant information on the mineralogy of the Iron Cap Mine, it can be ascertained with a high
degree of certainty that mineralisation at Iron Cap should be associated with similar mineralogical
parameters as discussed above.
7.1.5 Mineralisation hosts
Lode Au deposits are usually hosted in basalt or in sediments known as turbidite, although when in
faults, they may occupy intrusive igneous rocks such as granite. Lode Au deposits are intimately
associated with orogeny and other plate collision events within geologic history.
According to Nguni (2007) the Au bearing reef at Iron Cap consists of granular quartz or quartzite and
ironstone. The country rocks consist of chlorite schist, greenstones and micaceous quartzites, and
talcose and micaceous schists. A review of the available literature on the Au mineralisation at
Dunrobin indicates that there are two principal styles; namely ferruginous gossans within the
dolomites and limestones with associated quartz veining; and quartz veins and quartz vein
stockworks within the quartz-mica schists of the underlying Basement (Brown et al., 2008).
The Au mineralisation at Dunrobin, exploited during open pit mining by Reunion and subsequently by
Caledonian in the period 1997 to 2000 occurs within “gossanised dolomite” in association with a
quartz vein system immediately above the Basement unconformity/disconformity. The gossanised
dolomite appears to reflect the occurrences of a deeply oxidised (weathered) halo of pyrite enriched
dolomite with hematite alteration.

Iron Cap Gold Mine Technical Report – 25 March 2010
Scarab Environmental and Geological Enterprises
31
7.1.6 Structural orientation
Most of the giant Au deposits in the world are spatially associated with regional first-order structures,
the deposits usually hosted by late-tectonic splay faults or shear zones. The first-order structures may
have acted as major conduits for fluid transport from deep in the crust, while the secondary structures
acted as the loci for mineral deposition with locally reduced fluid pressure. In general, mesothermal
Au provinces are characteristically associated with regional structures. Mesothermal Au deposits are
found in structurally controlled sites within, or adjacent to orogenic belts (Barley & Goldfarb, 1996).
7.1.7 Proximity to intrusives
Although granites typically occupy more than 50% of the exposed Archaean cratons; where they are
in proximity to the greenstone belts they also host significant Au deposits containing over 1 million
ounces (e.g. Buzwagi and North Mara in Tanzania; Renabie in Ontario, Canada; Woodcutters,
Tarmoola and Granny Smith in Western Australia as well as Freda-Rebecca in Zimbabwe). Although
no direct evidence exists, Wright (1985) postulates that proximity to granite intrusions may provide an
additional heat source for remobilisation of the Au. A significant proportion of the Au and Cu-Au
occurrences within southern Zambia are spatially associated with the Hook Granite and thrust faults
related to the Mwembeshi Shear Zone (Morel et al., 2007).
7.1.8 Palaeoplacers
Although the occurrence of Au in vicinity of shear zones is well documented (cf. section 7.1.6), the
possibility of palaeoplacers should also be considered (cf. Section 7.1.1). Alida (2007) states the
paleoplacer type of Au deposits is at further distances away from fault fracture zones than the main
Au deposits. These palaeoplacer Au deposits have an As-Fe-Au association which suggests that
these Au deposits are derived from erosion of mineralised lithologies and fault fracture zones.
7.1.9 Summarized geological model for gold in Zambia
Three factors appear to determine the distribution of the auriferous lodes and primary Au
mineralisation, which preferentially occurs in areas where all three of the following factors are present:
Faults of Pan African age
Granitoid bodies emplaced during the Pan African orogeny
Occurrence of mafic meta volcanic and other meta igneous rocks
Based upon the Geological model for Zambian Au mineralisation, the following factors seem to be
important:
1. The majority of Zambian Au deposits and occurrences are lode-style bodies that appear to be
associated with basement domes, large crustal-scale shear zones and syn-orogenic granite
and syenite intrusions (Morel et al., 2007
Iron Cap Gold Mine Technical Report – 25 March 2010
Scarab Environmental and Geological Enterprises
32
2. Historically the highest producing Au mines in Zambia are all located within an area that has
been subject to Amphibolite to Greenshist facies metamorphic grade within the Luangwa-
Kariba Metamorphic Zone.
3. Gold mineralisation is characterised by strong stratigraphic disruption (deformation), shearing
and the presence of quartz-dolomite-pyrite-tourmaline-albite-sericite alteration within the
Mwembeshi Shear Zone.
4. A significant proportion of the Au and Cu-Au occurrences within southern Zambia are spatially
associated with the Hook Granite.
7.2 Exploration techniques
Exploration for orogenic Au is mainly preoccupied with defining the footprints of known Au deposits
and with integrating various techniques with geology for their efficient identification and detection. By
virtue of their association with regional structures, these deposits are also located at the boundaries
between contrasted lithologic or age domains within greenstone belts. It is important to realize that
these deposits occur in any type of supracrustal rocks within a mobile or greenstone belt and,
covering stratigraphic positions from lower mafic-ultramafic volcanic to upper clastic sedimentary
stratigraphic levels (Robert et al., 2007).
7.2.1 General
At the local scale, favorable settings for orogenic Au deposits represent a combination of structural
and lithologic factors. Favorable structural settings are linked mainly to the rheologic heterogeneities
in the host sequences. Shear zones and faults, universally present in these deposits, are developed
along lithologic contacts between units of contrasting competencies and along thin incompetent
lithologic units. Along these contacts and along incompetent rocks, deposits will preferentially develop
at bends, and structural intersections. Competent rock units enclosed in less competent favor
fracturing and veining. Common lithologic associations include Fe-rich rocks such as tholeiitic basalts,
differentiated dolerite sills and BIFs, and with competent porphyry stocks of intermediate to felsic
composition, whether they intrude mafic-ultramafic volcanic or clastic sedimentary rocks (Robert et al.,
2007).
A review of the main discovery methods of Au deposits found in the last 10 years indicates that
geological understanding was the key element in the discovery process in both the greenfield and
brownfield environments. Geochemistry in support of geology plays an important role in cases
particularly where deposits are exposed, and geophysics aided discovery in some cases where the
discoveries were concealed. A clear lesson from this analysis is that geology should remain an
important underpinning of future Au exploration programs (Robert et al., 2007).
Iron Cap Gold Mine Technical Report – 25 March 2010
Scarab Environmental and Geological Enterprises
33
7.2.2 Geochemistry
According to Morel et al. (2007) geochemical data, used in conjunction with trenching, geological
mapping, and historical work has been effective in the delineation of significant Au mineralisation at
Luiri Gold’s Matala project, and has been utilised to define additional drill targets.
Zambezi Resources completed a soil sampling programme on their Mwomboshi licence which aimed
to define the tenor of potential auriferous mineralisation within the Mwomboshi shear system. A 600
metre strike length of the shear was sampled, with Au anomalism indicated over that entire length,
with assays up to 124.16 g/t gold and 58.9 g/t silver. Previous geological mapping indicates that two
or more parallel quartz vein systems occur over a strike length of approximately 12 kilometres. An
orientation soil sampling programme comprising 270 samples was also undertaken over the area of
the known auriferous quartz vein system. Assays up to 106 ppb Au were returned, indicating that soil
sampling will be a useful exploration tool in attempting to locate quartz vein-hosted gold mineralisation
beneath the soil cover. In addition to the rock chip sampling, 154 stream-sediment samples were
collected from streams draining approximately nine kilometres of the Mwomboshi shear system strike.
Gold anomalism was indicated over at least three kilometres of strike, with six samples returning
assays greater than 10 ppb Au, including a high of 4,028 ppb Au.
7.2.3 Biogeochemistry
Termite mound sampling for Au in Senegal (Hansen et al, no date) on the Kenieba-Kedougou window
proved to be successful on a 200 x 50 m grid. Other researchers (Bernier et al., 2006; Kara et al.,
2006) have also proved that sampling of termitaria for uranium (U) is a useful exploration technique.
In Mali the Canadian company North Atlantic Nickel is has made use of termite mound sampling to
explore for Au deposits in the Dalakan and Sinzeni areas. Successes of this project thus far have
been the discovery of three areas of artisanal workings (Lugo, 2003).
In Zimbabwe sampling of termitaria for Au exploration beneath Kalahari sand overburden (West,
1965) resulted in the discovery of a Au anomaly with concentrations of 8 to 25 g/t Au in the Silobela
area. This mine was suitably named Termite Mine (West, 1970). Termitaria sampling survey involving
11,000 samples have been taken in the Roandji goldfields of south-central Central African Republic.
The aim of this investigation was to locate one or more bedrock source for a series of highly
auriferous streams and rivers which drain the priority portion of the goldfields (Bernier, 2006). The
work by West (1965) on bio-prospecting has led to several other discoveries such as the Jwaneng
kimberlite in Botswana (West, 1970), Ramagiri Goldfield in India (Prasad et al., 1987) the auriferous
Liptako region of Niger and numerous deposits in the former Soviet Union (Brooks et al., 1995).
Iron Cap Gold Mine Technical Report – 25 March 2010
Scarab Environmental and Geological Enterprises
34
7.2.4 Structural investigations
Apart from the application and potential usefulness of geochemical - and biogeochemical methods for
Au exploration in Zambia, mesothermal Au deposits are known to be structurally controlled (cf.
Section 7.1.6). Structural investigations (lineament derivations) have proved to be a useful Au
exploration tool in other mesothermal Au provinces (Alida, 2007; Robert et al., 2007).
7.2.5 Geophysics
It is almost impossible to get a direct geophysical response from Au because of the low grades in
deposits (Doyle, 1986). However, indirect geophysical indications may occur through association of
Au with particular host rocks, marker beds or structures which are, for example, of unusual
magnetization, density, electric polarization, or conductivity/resistivity.
An initial gradient array Induced Polarization (IP) pilot study was undertaken over the nose of the
Matala Dome mineralized structure including the Dunrobin Au Deposit. The programme was designed
to test the use of the IP technique for targeting the potential presence of mineralized zones and/or
changes in the geology. The pilot study area was therefore defined to include known mineralized Au
zones identified from drilling including the Dunrobin Au Deposit, targets from soil geochemical
sampling, and important geological contacts (Luiri Gold, Jan. 2007 News Release).
There are many examples of the gravity technique being used at all scales from the identification of
prospective Au districts to that of gold-related hydrothermal alteration at a local scale. More recently
the development of airborne gravity gradient systems (e.g. BHP Billiton-Falcon, Bell Geospace-Air
FTG), have seen the gravity technique grow in application. Areas are now being flown where ground
access was previously not possible and where rapid acquisition is required. Gravity is an effective
technique for defining the geometry and structure of greenstones belts at a regional scale. Barrick
showed that gravity has also proven effective in mapping intrusions in sedimentary and volcanic
terrains for Carlin, OIR and RIR systems. Structure and alteration can also be mapped, either directly
by gravity in weathered environments or inferred in terrains where geological units of different density
are offset and/or altered (Robert et al., 2007).
Furthermore resistivity patterns may indicate altered rocks which contain mineralization. These
surveys are responsible for identifying resistivity lows caused by graphite and used in structural
mapping in association with magnetometer surveys (Rivera et al., 2009).
Scarab would like to note that the exploration techniques noted in this section may not necessarily be
effective on the Iron Cap Gold Mine area under investigation and should be regarded as potentially
useful exploration tools only.

Iron Cap Gold Mine Technical Report – 25 March 2010
Scarab Environmental and Geological Enterprises
35
8. MINERALIZATION
According to Nguni (2007) the gold (Au) bearing reef at Iron Cap consists of granular quartz and
ironstone. The country rocks consist of chlorite schist, greenstones and micaceous quartzites as well
as talcose and micaceous schists. The reef lies between walls of the talcose and micaceous schists
along a shear zone. The rocks strike east-west and dip north at 45 to 70 degrees. The same author
further states that, to the west of the Iron Cap deposit, a 410 m in extent quartzite reef, is located
within the ironstone or directly beneath it. The width of the reef is at a maximum of 0.9 m and dips 45
to 50 degrees to the north.
Scarab was unable to locate and observe any of the rock types as mentioned by Nguni (2007) and
cannot comment on the aforementioned Au bearing reef. Scarab was able to investigate most of the
surface geology through a series of historic trenches excavated by Rhodesian Anglo American
Limited and more recent trenches excavated by Londoloza Resources (cf. Section 5.2). This
investigation revealed that most of the surface at Iron Cap is covered by a ferruginous duricrust
(Figure 8.1).
Figure 8.1 Ferruginous duricrust on surface of Iron Cap Mine site.
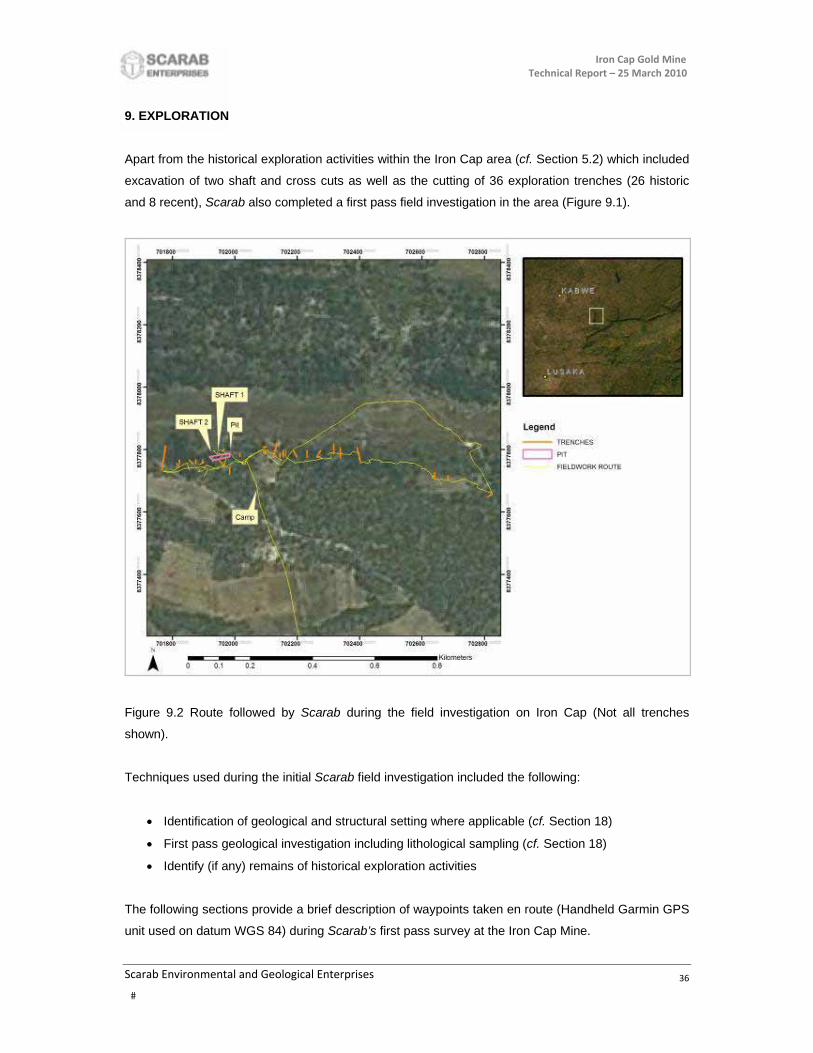
Iron Cap Gold Mine Technical Report – 25 March 2010
Scarab Environmental and Geological Enterprises
36
9. EXPLORATION
Apart from the historical exploration activities within the Iron Cap area (cf. Section 5.2) which included
excavation of two shaft and cross cuts as well as the cutting of 36 exploration trenches (26 historic
and 8 recent), Scarab also completed a first pass field investigation in the area (Figure 9.1).
Figure 9.2 Route followed by Scarab during the field investigation on Iron Cap (Not all trenches
shown).
Techniques used during the initial Scarab field investigation included the following:
Identification of geological and structural setting where applicable (cf. Section 18)
First pass geological investigation including lithological sampling (cf. Section 18)
Identify (if any) remains of historical exploration activities
The following sections provide a brief description of waypoints taken en route (Handheld Garmin GPS
unit used on datum WGS 84) during Scarab’s first pass survey at the Iron Cap Mine.

Iron Cap Gold Mine Technical Report – 25 March 2010
Scarab Environmental and Geological Enterprises
37
9.1 Pit
The historic open pit at Iron Cap is approximately 2 m in depth and approximately 50 x 15 m in extent.
Most of the pit is overgrown by shrubs and trees, but the lithology targeted (ferruginous duricrust) is
still visible within the pit walls (Figures 9.3 and 9.4).
Figure 9.3 Open Pit at Iron Cap Mine measuring 50 x 15 m (2 m in depth) in extent.
Figure 9.4 Ferruginous duricrust in north wall of open pit at Iron Cap Mine.
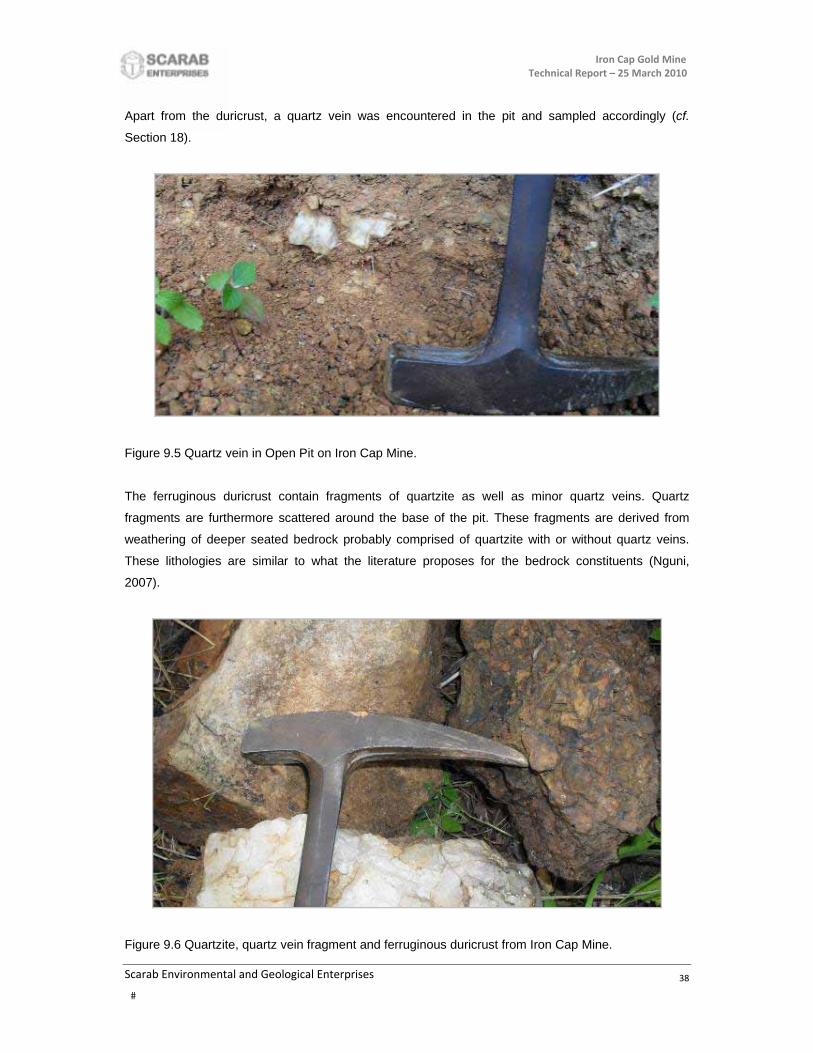
Iron Cap Gold Mine Technical Report – 25 March 2010
Scarab Environmental and Geological Enterprises
38
Apart from the duricrust, a quartz vein was encountered in the pit and sampled accordingly (cf.
Section 18).
Figure 9.5 Quartz vein in Open Pit on Iron Cap Mine.
The ferruginous duricrust contain fragments of quartzite as well as minor quartz veins. Quartz
fragments are furthermore scattered around the base of the pit. These fragments are derived from
weathering of deeper seated bedrock probably comprised of quartzite with or without quartz veins.
These lithologies are similar to what the literature proposes for the bedrock constituents (Nguni,
2007).
Figure 9.6 Quartzite, quartz vein fragment and ferruginous duricrust from Iron Cap Mine.

Iron Cap Gold Mine Technical Report – 25 March 2010
Scarab Environmental and Geological Enterprises
39
9.2 Shafts
Scarab was not able to access historical shaft 1 or shaft 2 (cf. Section 5.2), but Londoloza Resources
/ Triple Plate Plc. joint venture was able to cut a trench into the top part of shaft 1 (Figure 9.7) during
their 2008 exploration campaign. This trench enabled Scarab to view the shaft, which is comprised
mostly of similar surface duricrust. Of interest was the exposure of the crosscut in shaft 1 (cf. Section
5.2). Limited access, however, prevented Scarab from entering the crosscut or shaft.
Figure 9.7 Trench cut into top part of shaft 1 by Londoloza Resources / Triple Plate Plc. joint venture
in 2008.
9.3 Trenches
Thirty-six (36) exploration trenches (26 historic and 8 recent) were cut of which Scarab investigated
27 for sampling and general geological investigation purposes. The remaining trenches were either
overgrown or not accessible.
Most of these trenches contain a similar lithology to the open pit namely a ferruginous duricrust, but
many are also devoid of rocky lithologies showing only Quaternary sand in section (Figure 9.8). The
only difference in lithology (to that of ferruginous duricrust) was at a recently cut trench where outcrop
of massive magnetite was present (Figure 9.9).
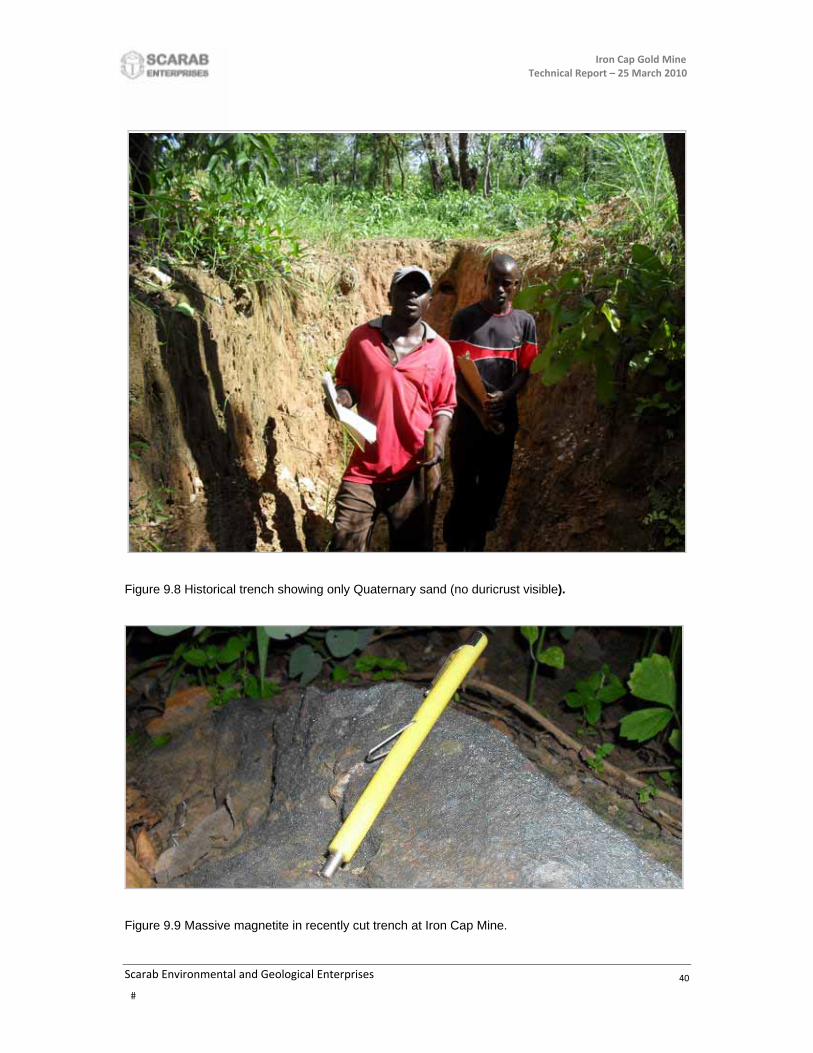
Iron Cap Gold Mine Technical Report – 25 March 2010
Scarab Environmental and Geological Enterprises
40
Figure 9.8 Historical trench showing only Quaternary sand (no duricrust visible).
Figure 9.9 Massive magnetite in recently cut trench at Iron Cap Mine.
Iron Cap Gold Mine Technical Report – 25 March 2010
Scarab Environmental and Geological Enterprises
41
10. DRILLING
No evidence for exploration drilling on any part of the Iron Cap property could be located by Scarab
during the field investigation nor does any of the historical reports mention exploration drilling on the
Iron Cap property.
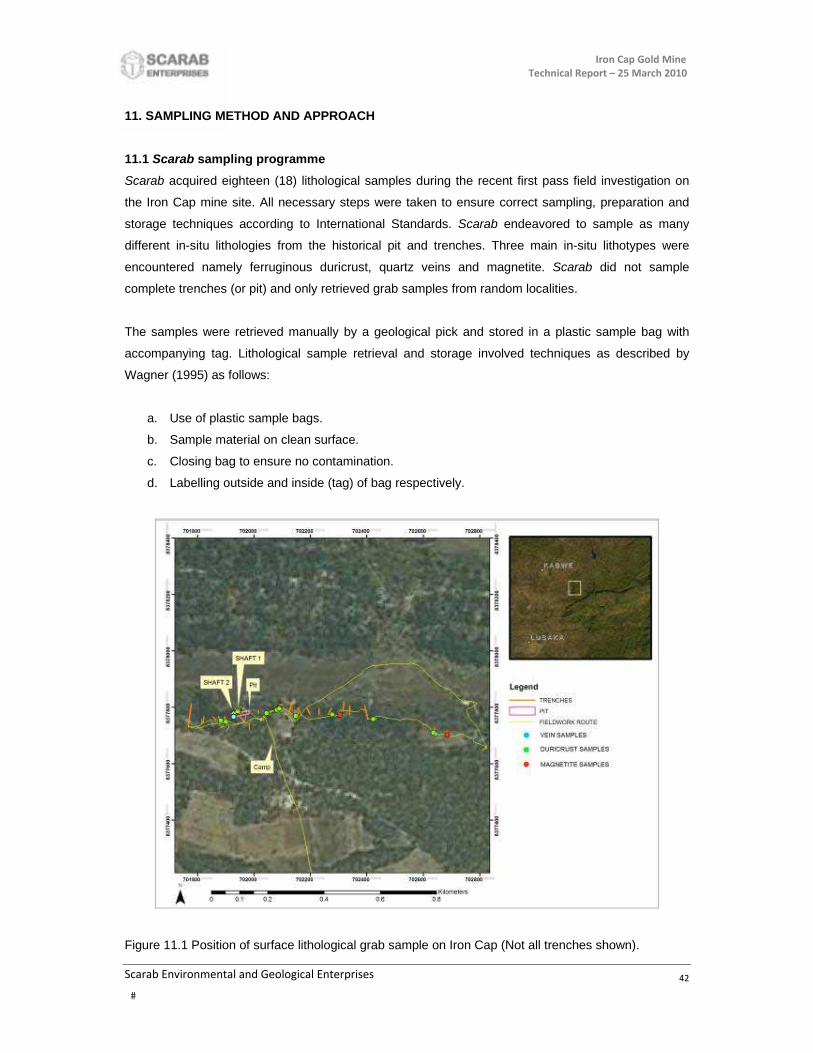
Iron Cap Gold Mine Technical Report – 25 March 2010
Scarab Environmental and Geological Enterprises
42
11. SAMPLING METHOD AND APPROACH
11.1 Scarab sampling programme
Scarab acquired eighteen (18) lithological samples during the recent first pass field investigation on
the Iron Cap mine site. All necessary steps were taken to ensure correct sampling, preparation and
storage techniques according to International Standards. Scarab endeavored to sample as many
different in-situ lithologies from the historical pit and trenches. Three main in-situ lithotypes were
encountered namely ferruginous duricrust, quartz veins and magnetite. Scarab did not sample
complete trenches (or pit) and only retrieved grab samples from random localities.
The samples were retrieved manually by a geological pick and stored in a plastic sample bag with
accompanying tag. Lithological sample retrieval and storage involved techniques as described by
Wagner (1995) as follows:
a. Use of plastic sample bags.
b. Sample material on clean surface.
c. Closing bag to ensure no contamination.
d. Labelling outside and inside (tag) of bag respectively.
Figure 11.1 Position of surface lithological grab sample on Iron Cap (Not all trenches shown).
Iron Cap Gold Mine Technical Report – 25 March 2010
Scarab Environmental and Geological Enterprises
43
11.2 Londoloza Resources / Triple Plate Plc. joint venture sampling programme
Scarab was furthermore able to obtain sample results from a Triple Plate Plc. / Londoloza JV
sampling programme completed during 2008 (cf. Appendix C). According to Triple Plate Plc.
employees, the trenches (as well as the pit) were sampled as follows:
a. Use of cloth-type sample bags.
b. Each trench was channel sampled throughout the extent of the west wall at half the distance
from surface to base.
c. The north wall and south walls of the pit were sampled in a similar manner as mentioned in
point b above.
d. Sample was coned and quartered until a 50 kg bag limit was reached, which was handed in
for analyses.
Iron Cap Gold Mine Technical Report – 25 March 2010
Scarab Environmental and Geological Enterprises
44
12. SAMPLE PREPARATION AND ANALYSES
12.1 Scarab sampling programme
Geochemical analysis for gold (Au), iron (Fe) and silver (Ag) within samples (cf. Section 11) taken on
the Iron Cap property in Zambia were completed by Alex Stewart International Corporation Zambia
Limited (ISO Certified) (cf. Appendix B). The sampling methods included the following:
Gold (Au) fire assay Atomic Absorption (AAS) method
Silver (Ag) and Iron (Fe) Atomic Absorption spectrometry (AAS) method
Scarab conducted all aspects of obtaining and labeling the samples, which included the insertion of a
printed label inside the sample bag and sealing the bag with a cable tie®. An associate to Challenger
provided the sample to Alex Stewart International Corporation Zambia Limited Laboratories for
analyses.
12.2 Londoloza Resources / Triple Plate Plc. joint venture sampling programme
Geochemical analysis for gold (Au) and silver (Ag) within samples (cf. Section 11) taken on the Iron
Cap property in Zambia were completed by The Geochemical Analytical Laboratory at the School of
Mines, University of Zambia (ISO certification lacking) (cf. Appendix C). The sampling methods
included the following:
Metal analytes by flame atomic spectrophotometry
Scarab cannot comment on any aspects of obtaining and labeling the said samples. According to the
accompanying certificate, quality control measures for the samples included the use of a calibration
standard as a control sample.

Iron Cap Gold Mine Technical Report – 25 March 2010
Scarab Environmental and Geological Enterprises
45
13. DATA VERIFICATION
The qualified person responsible for the completion of this report has relied upon the data supplied
and obtained through sources as mentioned (cf. Section 1.3). No limitations were encountered during
the verification process.
The data supplied for the compilation of the Technical Report was mostly generated by Scarab either
as a literature review or obtained during fieldwork. Data obtained (i.e. reports indicating position,
productions and historical exploration i.e. Nguni, 2007) could not be verified.
No similar datasets could be obtained during the literature investigation and Scarab cannot verify the
validity of the data.
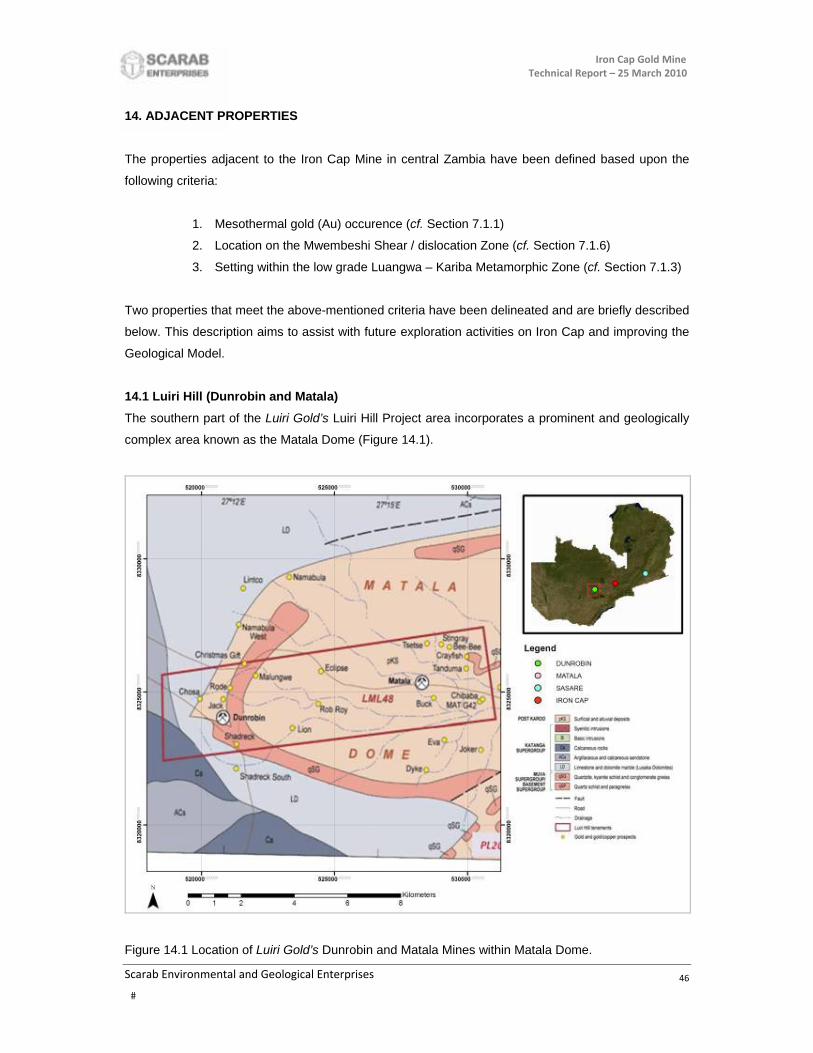
Iron Cap Gold Mine Technical Report – 25 March 2010
Scarab Environmental and Geological Enterprises
46
14. ADJACENT PROPERTIES
The properties adjacent to the Iron Cap Mine in central Zambia have been defined based upon the
following criteria:
1. Mesothermal gold (Au) occurence (cf. Section 7.1.1)
2. Location on the Mwembeshi Shear / dislocation Zone (cf. Section 7.1.6)
3. Setting within the low grade Luangwa – Kariba Metamorphic Zone (cf. Section 7.1.3)
Two properties that meet the above-mentioned criteria have been delineated and are briefly described
below. This description aims to assist with future exploration activities on Iron Cap and improving the
Geological Model.
14.1 Luiri Hill (Dunrobin and Matala)
The southern part of the Luiri Gold’s Luiri Hill Project area incorporates a prominent and geologically
complex area known as the Matala Dome (Figure 14.1).
Figure 14.1 Location of Luiri Gold’s Dunrobin and Matala Mines within Matala Dome.
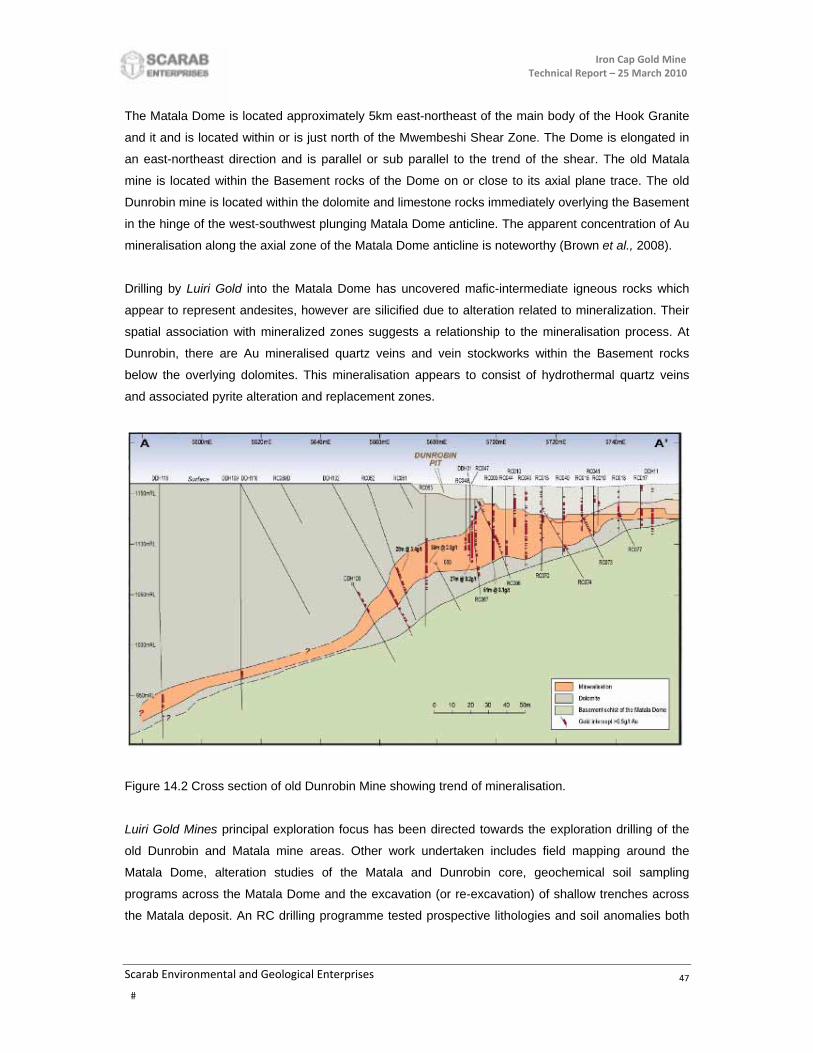
Iron Cap Gold Mine Technical Report – 25 March 2010
Scarab Environmental and Geological Enterprises
47
The Matala Dome is located approximately 5km east-northeast of the main body of the Hook Granite
and it and is located within or is just north of the Mwembeshi Shear Zone. The Dome is elongated in
an east-northeast direction and is parallel or sub parallel to the trend of the shear. The old Matala
mine is located within the Basement rocks of the Dome on or close to its axial plane trace. The old
Dunrobin mine is located within the dolomite and limestone rocks immediately overlying the Basement
in the hinge of the west-southwest plunging Matala Dome anticline. The apparent concentration of Au
mineralisation along the axial zone of the Matala Dome anticline is noteworthy (Brown et al., 2008).
Drilling by Luiri Gold into the Matala Dome has uncovered mafic-intermediate igneous rocks which
appear to represent andesites, however are silicified due to alteration related to mineralization. Their
spatial association with mineralized zones suggests a relationship to the mineralisation process. At
Dunrobin, there are Au mineralised quartz veins and vein stockworks within the Basement rocks
below the overlying dolomites. This mineralisation appears to consist of hydrothermal quartz veins
and associated pyrite alteration and replacement zones.
Figure 14.2 Cross section of old Dunrobin Mine showing trend of mineralisation.
Luiri Gold Mines principal exploration focus has been directed towards the exploration drilling of the
old Dunrobin and Matala mine areas. Other work undertaken includes field mapping around the
Matala Dome, alteration studies of the Matala and Dunrobin core, geochemical soil sampling
programs across the Matala Dome and the excavation (or re-excavation) of shallow trenches across
the Matala deposit. An RC drilling programme tested prospective lithologies and soil anomalies both
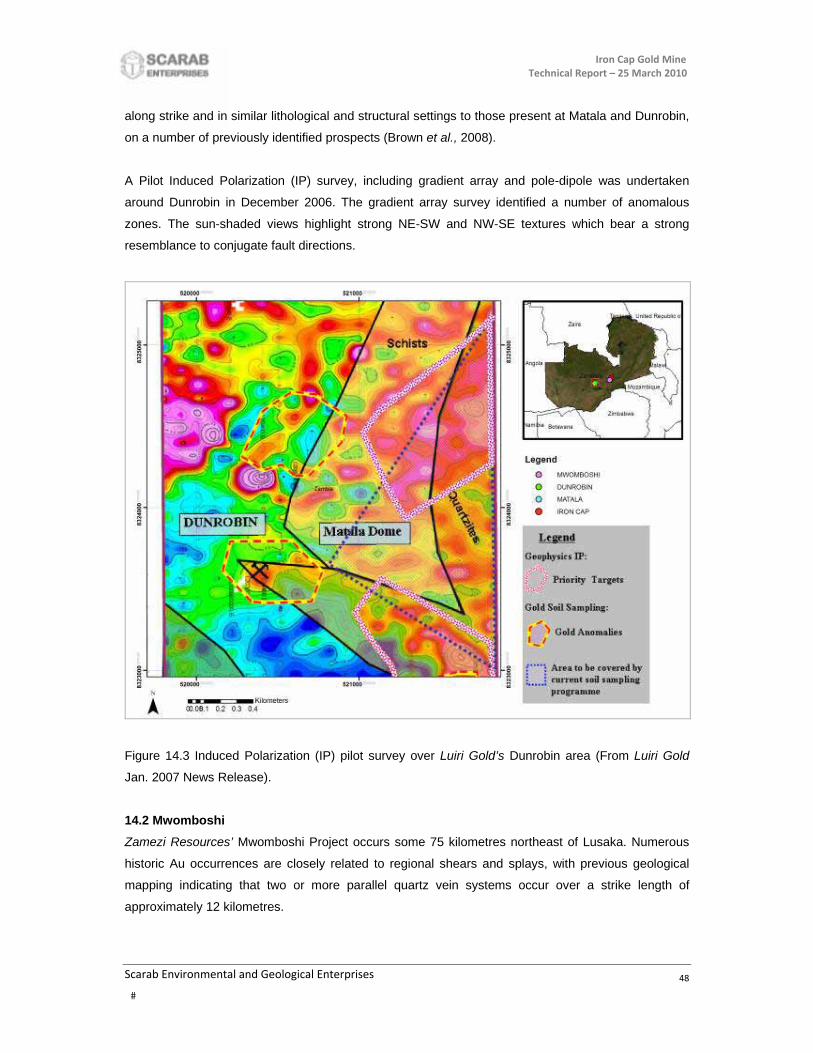
Iron Cap Gold Mine Technical Report – 25 March 2010
Scarab Environmental and Geological Enterprises
48
along strike and in similar lithological and structural settings to those present at Matala and Dunrobin,
on a number of previously identified prospects (Brown et al., 2008).
A Pilot Induced Polarization (IP) survey, including gradient array and pole-dipole was undertaken
around Dunrobin in December 2006. The gradient array survey identified a number of anomalous
zones. The sun-shaded views highlight strong NE-SW and NW-SE textures which bear a strong
resemblance to conjugate fault directions.
Figure 14.3 Induced Polarization (IP) pilot survey over Luiri Gold’s Dunrobin area (From Luiri Gold
Jan. 2007 News Release).
14.2 Mwomboshi
Zamezi Resources’ Mwomboshi Project occurs some 75 kilometres northeast of Lusaka. Numerous
historic Au occurrences are closely related to regional shears and splays, with previous geological
mapping indicating that two or more parallel quartz vein systems occur over a strike length of
approximately 12 kilometres.
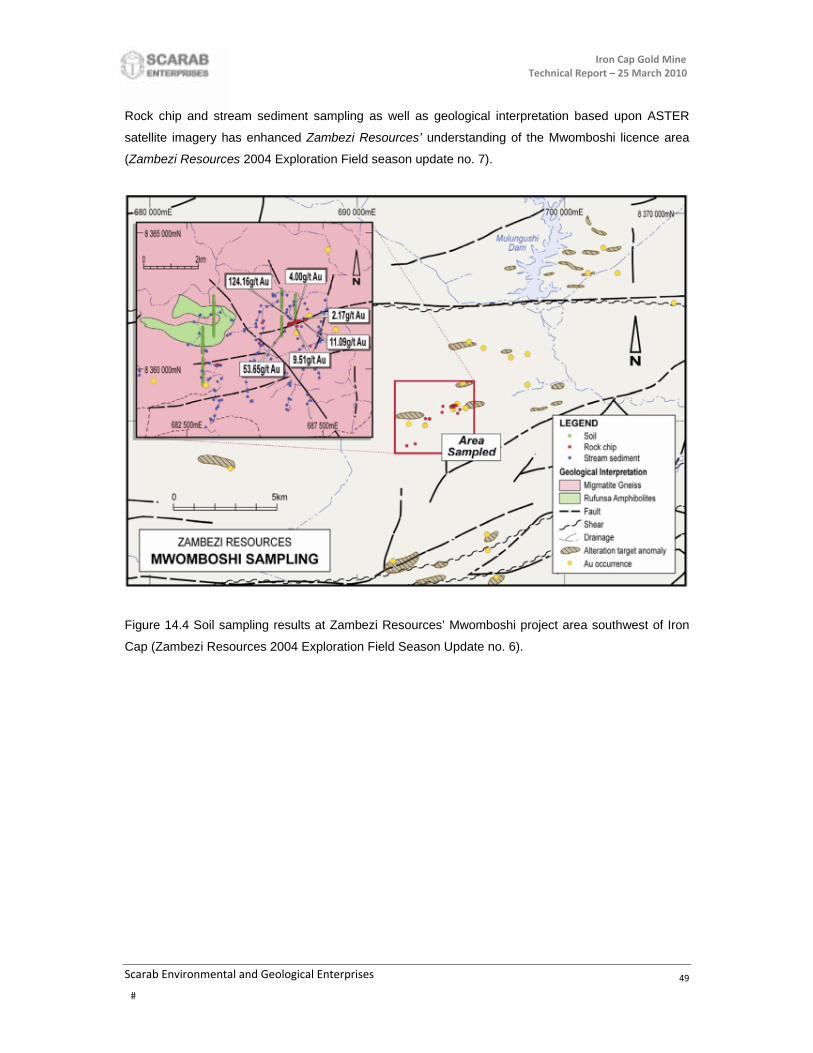
Iron Cap Gold Mine Technical Report – 25 March 2010
Scarab Environmental and Geological Enterprises
49
Rock chip and stream sediment sampling as well as geological interpretation based upon ASTER
satellite imagery has enhanced Zambezi Resources’ understanding of the Mwomboshi licence area
(Zambezi Resources 2004 Exploration Field season update no. 7).
Figure 14.4 Soil sampling results at Zambezi Resources’ Mwomboshi project area southwest of Iron
Cap (Zambezi Resources 2004 Exploration Field Season Update no. 6).
Iron Cap Gold Mine Technical Report – 25 March 2010
Scarab Environmental and Geological Enterprises
50
15. MINERAL PROCESSING AND METALLURGICAL TESTING
Scarab could not locate any data or information on mineral processing or metallurgical testing on the
Iron Cap Mine.
Iron Cap Gold Mine Technical Report – 25 March 2010
Scarab Environmental and Geological Enterprises
51
16. MINERAL RESOURCE AND RESERVE ESTIMATES
According to Nguni (2007) an historic resource of the eastern 880 m of the Iron Cap mine area has
been completed based historical work completed by Reeve (1963). Nguni (2007) furthermore states
that the eastern half of Iron Cap consists of well defined ironstones with an average width of 4.6 m.
Former estimates gave the gold content of this eastern extent to be 1.555 g Au / t.
242,880 t ore @ 1.555 g Au / ton (13,322 ounces of Au)
The resource was calculated as follows
880 m x 4.6 m x 20 m = 80,960m3
Density assumed at 3 (mixture of quartzite, schist and ironstone)
Tonnage equals 242,880 ton @ 1.555 g Au / t
13,322 (thirteen thousand three hundred and twenty two) ounces of Au
Scarab has not received any data or available information on the above mentioned resource
calculation and cannot comment on its accuracy.
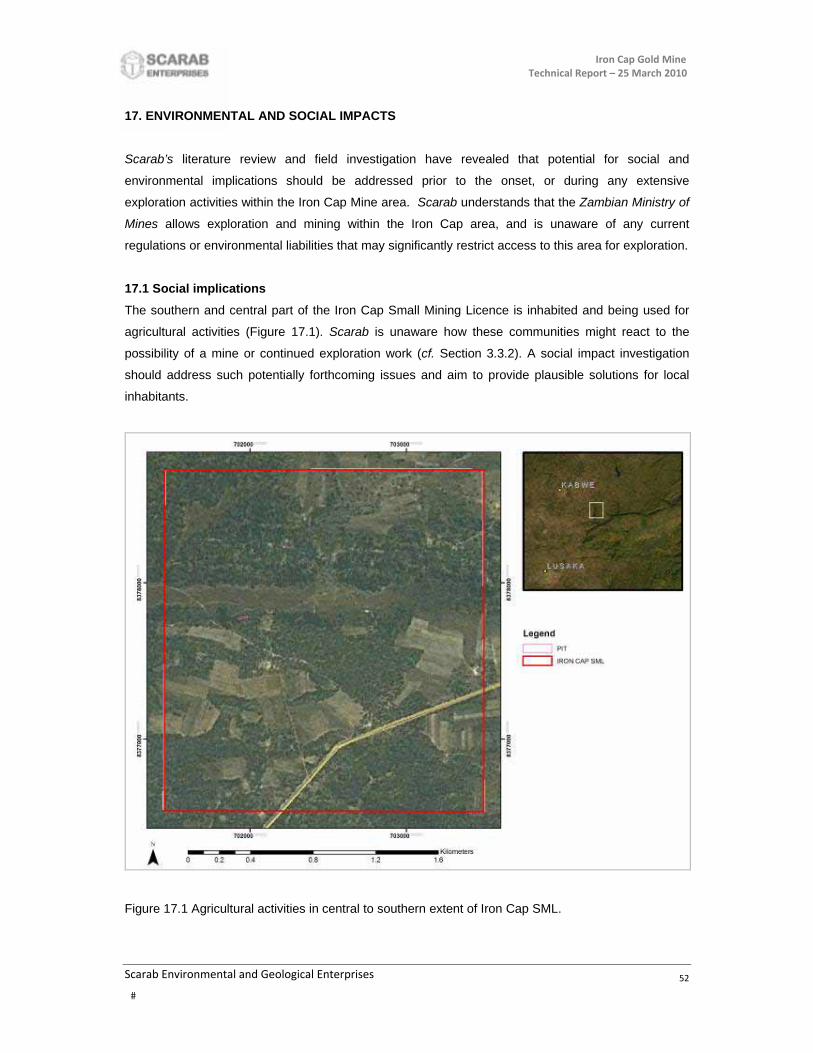
Iron Cap Gold Mine Technical Report – 25 March 2010
Scarab Environmental and Geological Enterprises
52
17. ENVIRONMENTAL AND SOCIAL IMPACTS
Scarab’s literature review and field investigation have revealed that potential for social and
environmental implications should be addressed prior to the onset, or during any extensive
exploration activities within the Iron Cap Mine area. Scarab understands that the Zambian Ministry of
Mines allows exploration and mining within the Iron Cap area, and is unaware of any current
regulations or environmental liabilities that may significantly restrict access to this area for exploration.
17.1 Social implications
The southern and central part of the Iron Cap Small Mining Licence is inhabited and being used for
agricultural activities (Figure 17.1). Scarab is unaware how these communities might react to the
possibility of a mine or continued exploration work (cf. Section 3.3.2). A social impact investigation
should address such potentially forthcoming issues and aim to provide plausible solutions for local
inhabitants.
Figure 17.1 Agricultural activities in central to southern extent of Iron Cap SML.
Iron Cap Gold Mine Technical Report – 25 March 2010
Scarab Environmental and Geological Enterprises
53
17.2 Environmental implications
Although the Iron Cap area has no environmental liabilities and no known explicitly environmentally
sensitive or fragile areas, Scarab does recommend that a suitable and qualified Environmental
Scientist perform an Environmental Impact Investigation (in association with a Social Impact
Investigation cf. Section 17.1) addressing the following:
Presence of Red Data fauna and flora species
The Environmental Protection and Pollution Control Act (No. 12) of 1990 (EPPCA) and the Mines and
Minerals (Environmental) Regulations of 1997 also regulates mining operations. The EPPCA sets
environmental quality standards and makes the polluter responsible for meeting them. Thus under the
EPPCA, all effluents and emissions from mining operations are regulated through a system of
permits, licenses and fines. Dumps, including overburden dumps and tailings dams, are similarly
regulated.
Key steps in establishing a project as laid down by the 1997 regulations are (Ministry of Mines and
Mineral Development, 1999):
Preparation of a project brief to the Director of Mines Safety describing the site, proposed
activities, and all aspects of potential environmental impact.
The Director may request more information or can forward the project brief to the
Environmental Council of Zambia recommending one of: rejection; acceptance after
submission of a full Environmental Impact Statement; the project be accepted and allowed to
proceed immediately.
Preparation of an Environmental Impact Statement and submission to the Director of Mines
Safety. The Director of Mines Safety submits his recommendations to the Environmental
Council which makes the final decision.
Environmental Impact Statements, if called for, to be updated annually or within fifteen months
of the first statement. Environmental audits of projects to be completed annually.
If a developer finds the provisions of any regulation unduly onerous, he may apply to the
Minister or Director of Mines Safety for an exemption from that regulation. The exemption may
be granted under prescribed conditions.
Developers of large-scale mining projects to contribute to the Environmental Management
Fund for rehabilitation purposes.

Iron Cap Gold Mine Technical Report – 25 March 2010
Scarab Environmental and Geological Enterprises
54
The Environmental Impact Assessment regulations require that an Environmental Impact Assessment
(EIA) be prepared for all investments that have a major impact on the environment. The identification
and implementation of adequate environmental mitigation measures is also regulated by the EIA. The
Mines and Minerals Act and the Mines and Minerals Environmental Regulations 1997 addresses the
environmental, health and safety aspects of the mining licences delivered by the Mines and Minerals
Development Department. They regulate environmental protection and pollution control in the areas
where prospecting, exploration and mining operations are being carried out. They also require that
any licensed mining operator closing down a mining facility must first decommission the site to a level
where it does not pose any danger to public safety and health (Environmental Council of Zambia).
There are numerous private protected areas recorded for Zambia. With the exception of commercial
farming, there has been very little real private investment in Zambia due to the economic policies of
the former government which favoured state ownership (MacPherson, 1992). The Iron Cap Mine is
located outside Zambian National Parks and these protected areas (Figure 17.2).
Figure 17.2 Location of Iron Cap Mine Outside Protected areas in Zambia (Comaco website).

Iron Cap Gold Mine Technical Report – 25 March 2010
Scarab Environmental and Geological Enterprises
55
18. RESULTS AND INTERPRETATIONS
Scarab Environmental and Geological Enterprises CC (Scarab) has been commissioned by The
Challenger Development Corp. (Challenger) to prepare a technical report according to the National
Instrument 43-101 (Canadian Standards for disclosure of Mineral Projects) and acquire any additional
information during fieldwork conducted on the Iron Cap Gold Mine in Zambia, southern central Africa.
The compilation of this Technical Report incorporated the following (including aspects as stipulated
within National Instrument and Form 43-101F1):
1. Review of available Au prospecting data for the Iron Cap area
2. Literature review and geological model for Au mineralisation in the Iron Cap area
3. Field visit to inspect historic Iron Cap Au mining activities
The field investigation to Iron Cap involved the following:
1. Personal communication and introduction to previous employees and other significant
persons
2. Investigate and report on infrastructure conditions and availability of exploration
requirements
3. General geological, structural and stratigraphical setting
4. Investigate any potential for social and environmental impact associated with any
forthcoming exploration activities
5. Advise on future exploration programme and budget
During the first pass field investigation of the Iron Cap area Scarab was able to investigate some of
the trenches cut by Rhodesian Anglo American and more recently by the Triple Plate Plc. JV. Scarab
was further able to obtain grab samples from these trenches which were assayed for Au, silver (Ag)
and iron (Fe) (cf. Appendix B). An investigation into the distribution patterns of the sample assay
results revealed the following:
Gold (ppm) does not favour any of the lithologies sampled by Scarab and appears to show a
slight increase towards the central and eastern extent of the sampling area.
Silver (ppm) appears to have elevated concentrations within the ferruginous duricrust and
seems to favour this lithotype. Silver values appear to show increases towards the western
extent of the sampling area.
The iron (%) content for the applicable lithotypes are high and shows, similar to Au, an
increase towards the central and eastern extent of the sampling area.
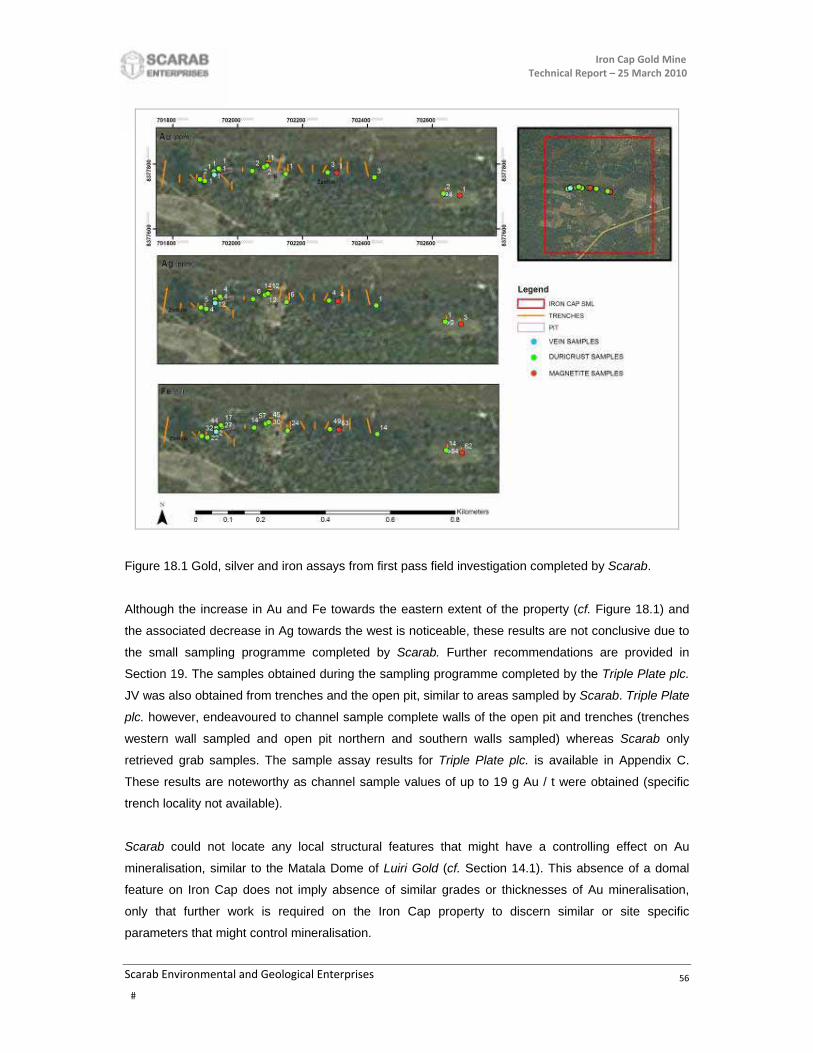
Iron Cap Gold Mine Technical Report – 25 March 2010
Scarab Environmental and Geological Enterprises
56
Figure 18.1 Gold, silver and iron assays from first pass field investigation completed by Scarab.
Although the increase in Au and Fe towards the eastern extent of the property (cf. Figure 18.1) and
the associated decrease in Ag towards the west is noticeable, these results are not conclusive due to
the small sampling programme completed by Scarab. Further recommendations are provided in
Section 19. The samples obtained during the sampling programme completed by the Triple Plate plc.
JV was also obtained from trenches and the open pit, similar to areas sampled by Scarab. Triple Plate
plc. however, endeavoured to channel sample complete walls of the open pit and trenches (trenches
western wall sampled and open pit northern and southern walls sampled) whereas Scarab only
retrieved grab samples. The sample assay results for Triple Plate plc. is available in Appendix C.
These results are noteworthy as channel sample values of up to 19 g Au / t were obtained (specific
trench locality not available).
Scarab could not locate any local structural features that might have a controlling effect on Au
mineralisation, similar to the Matala Dome of Luiri Gold (cf. Section 14.1). This absence of a domal
feature on Iron Cap does not imply absence of similar grades or thicknesses of Au mineralisation,
only that further work is required on the Iron Cap property to discern similar or site specific
parameters that might control mineralisation.
Iron Cap Gold Mine Technical Report – 25 March 2010
Scarab Environmental and Geological Enterprises
57
The anomalous Au values returned for all grab samples (ferruginous duricrust, magnetite-rich
lithologies and quartz veins) retrieved by Scarab might be indicative of a deeper seated Au reef or
vein system situated below the surface duricrust, as delineated by historical reports (Nguni, 2007) (cf.
Section 7.1.2).
Lateritic profiles capped by ferruginous crusts (ferruginous duricrust) are mostly developed under
tropical climates characterized by alternating wet and dry seasons (i.e., savannah climates). The
climatic stability field of extensive duricrusts in Africa corresponds to an E-W band in which the
average annual temperature exceeds 22°C and annual rainfall ranges between 900 mm and 1400
mm. Ferruginous duricrusts tend to be less abundant in semi-arid areas such as in the Sahelian band.
In savannah zones, similar to Iron Cap location (cf. Section 4.4), the formation of a duricrust induces a
leaching in the upper horizons and thus develops strongly depleted Au anomalies. As duricrust
formation is a very long process, the dispersion of Au is generally well extended, but show a low
signal on surface. Thus, duricrust Au deposits in many cases underestimate the potential for deeper-
seated Au mineralisation (Freyssinet and Itard, 1997).
Iron Cap Gold Mine Technical Report – 25 March 2010
Scarab Environmental and Geological Enterprises
58
19. CONCLUSION AND RECOMMENDATIONS
19.1 Conclusion
Although the Iron Cap Mine has not received any exploration drilling and historic activities were
confined to surficial trenching, pitting and limited shaft sinking, results obtained during the compilation
of the current NI 43-101 report is conclusive that with further exploration the Iron Cap prospect
appears to contain considerable potential for significant Au mineralisation.
19.2 Recommendations
Scarab recommends that a staged exploration programme be completed with defined targets at the
end of each exploration stage.
19.2.1 Stage 1 (Drilling targets)
a. Detailed sampling and mapping exercise of available trenches, open pit and shafts (as well
as horizontal cross cuts in depth). The mapping and sampling of the shafts and horizontal
cross cuts in depth are important to assess the character of the mentioned Au-bearing reef.
b. Structural investigations (Ortho photo and satellite structural mapping)
c. Ground and airborne geophysics (High resolution magnetometer and Induced Polarisation)
d. Surface geochemical sampling and mapping
e. Define drill targets through collaboration of all of the above
19.2.2 Stage 2 (Contemporaneous with end of stage one) (Nature of mineralisation)
a. Diamond drilling on mineralised targets as defined by RC drilling
b. Structural and alteration mapping on core and down-hole geophysics to assess control on
mineralisation
19.2.3 Stage 3 (Resource definition)
a. Infill drilling where required
b. Resource definition
19.3 Exploration programme budget
Scarab has compiled a two-year exploration programme and budget based upon the agreement
between the Challenger Development Corp. (Challenger) and Londoloza Mining and Exploration
Zambia Ltd (cf. Section 3.5). Each exploration year is based upon successful results from the
previous year.
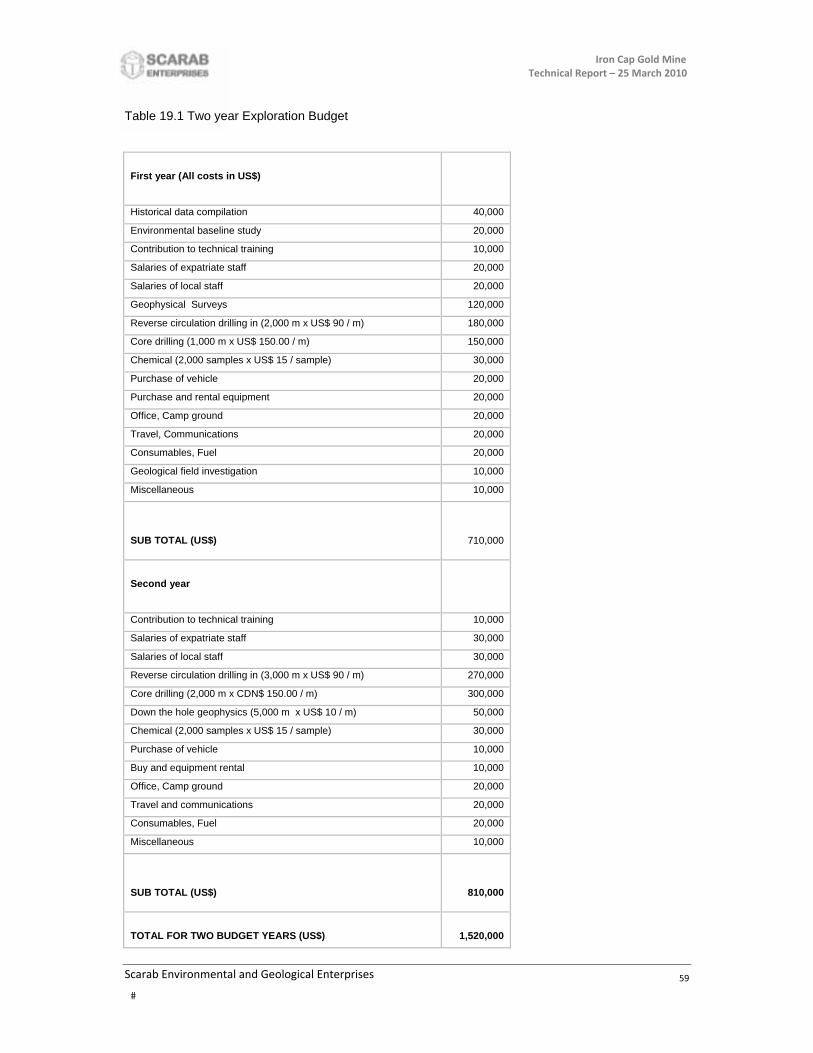
Iron Cap Gold Mine Technical Report – 25 March 2010
Scarab Environmental and Geological Enterprises
59
Table 19.1 Two year Exploration Budget
First year (All costs in US$)
Historical data compilation 40,000
Environmental baseline study 20,000
Contribution to technical training 10,000
Salaries of expatriate staff 20,000
Salaries of local staff 20,000
Geophysical Surveys 120,000
Reverse circulation drilling in (2,000 m x US$ 90 / m) 180,000
Core drilling (1,000 m x US$ 150.00 / m) 150,000
Chemical (2,000 samples x US$ 15 / sample) 30,000
Purchase of vehicle 20,000
Purchase and rental equipment 20,000
Office, Camp ground 20,000
Travel, Communications 20,000
Consumables, Fuel 20,000
Geological field investigation 10,000
Miscellaneous 10,000
SUB TOTAL (US$) 710,000
Second year
Contribution to technical training 10,000
Salaries of expatriate staff 30,000
Salaries of local staff 30,000
Reverse circulation drilling in (3,000 m x US$ 90 / m) 270,000
Core drilling (2,000 m x CDN$ 150.00 / m) 300,000
Down the hole geophysics (5,000 m x US$ 10 / m) 50,000
Chemical (2,000 samples x US$ 15 / sample) 30,000
Purchase of vehicle 10,000
Buy and equipment rental 10,000
Office, Camp ground 20,000
Travel and communications 20,000
Consumables, Fuel 20,000
Miscellaneous 10,000
SUB TOTAL (US$) 810,000
TOTAL FOR TWO BUDGET YEARS (US$) 1,520,000

Iron Cap Gold Mine Technical Report – 25 March 2010
Scarab Environmental and Geological Enterprises
60
Scarab considers the proposed expenditure of US$ 1,520,000.00 over the initial 24-month period to
be consistent with the potential of the project, providing it is appropriately staged such that the results
of each phase can be reviewed before proceeding to the next stage. The proposed expenditure is
considered adequate to cover the cost of the proposed programs and the budgets are sufficient to
meet minimum statutory expenditure requirements.
The reconnaissance field investigation performed by Scarab (cf. Section 9) met its objectives of a first
pass survey into the Iron Cap Mine area and has laid the foundation for further exploration as
recommended.
Iron Cap Gold Mine Technical Report – 25 March 2010
Scarab Environmental and Geological Enterprises
61
20. REFERENCES
Alida S. 2007. Classification of Birimian Gold occurrences - Using their Geological and Geochemical
Attributes: Case study in south Ashanti Belt Ghana. M.Sc. Thesis International Institute for
GeoInformation Science and Earth Observation. The Netherlands.
Barley M.E. and Godlfarb R.J. 1996. Exploration Guides: Global Tectonic Setting of Mesothermal
Gold deposits. In: Mesothermal Gold Deposits: A Global Overview. Abstracts to accompany a short
course.
Bernier, M. A., Milner, M. W and Myles, T. G. 2006. Mineralogical and geochemical analysis of
cathedral termitaria applied to lode gold exploration in the Roandji alluvial gold fields, Bandas
Greenstone Belt, Central African Republic. Oral or poster presentations. Abstracts for the 19th
International Geochemical Exploration Symposium.
Brooks, R.R., Dunn, C.E. and Hall, G.E.M. 1995. Biological systems in mineral exploration and
processing. Ellis Horwood Ltd, p. 538.
Brown R., Slater D. and Sperinck M. 2008. Technical Report on the updated resource estimates at
the Matala and Dunrobin deposits, Luiri Hill Project. NI43-101 Technical Report completed for Luiri
Gold Ltd.
De Waele B. Kampunzu A.B., Mapani B.S.E and Tembo F. 2006. The Mesoproterozoic Irumide belt of
Zambia. Journal of African Earth Sciences 46, 36 – 70.
Doyle H.A. 1986. Geophysical exploration for gold: a review. Exploration Geophysics 17(4) 169 – 180.
Forest Resource assessment working paper, 2001. Global Forest Fire assessment 1990 – 2000.
Food and agriculture organization of the United Nations.
Freyssinet, P. and Itard, Y. 1997. Geochemical Mass Balance of Gold Under Various Tropical
Weathering Conditions: Application to Exploration. In “Proceedings of Exploration 97: Fourth
Decennial International Conference on Mineral Exploration” edited by A.G. Gubins, 1997, p. 347–354
Goldfarb R.J., Groves D.I. and Gardoll S. 2001. Orogenic gold and geologic time: a global synthesis.
Ore Geology Reviews 18, 1 – 75.
IDL 2002 An assessment of trends in the Zambian agriculture sector. Department of International
Development Zambia Office.
Iron Cap Gold Mine Technical Report – 25 March 2010
Scarab Environmental and Geological Enterprises
62
Kampunzu A.B., Cailteux J.L.H., Kamona A.F., Intiomale M.M and Melcher F. 2009. Sediment-hosted
Zn–Pb–Cu deposits in the Central African Copperbelt. Ore Geology Reviews 35 263–297.
Kara S. and Scholtz N. 2006. The use of termitaria of Trinervitermes trinervoides (Isoptera:
Termitidae) in geochemical exploration in the Karoo Uranium Province of South Africa. Student
GeoCongress.
Lugo O.B. 2003. The mineral Industry of Mali. U.S. Geological Survey Minerals Yearbook—2003
MDN Inc. 2008. Presentation.
Luiri Gold Ltd. News Release. January 2007. Results of the Pilot Geophysical Programme at the Luiri
Hills Project, Zambia.
MacPherson, N. 1992. A GTZ/IUCN National Environmental Assessment and Planning Programme
for Zambia. IUCN, Gland, Switzerland.
Mines and Minerals Act of Zambia. 1995
Ministry of Mines and Mineral Development (1999) Zambia: Investment opportunities in the mining
industry. Produced on behalf of the Republic of Zambia by Exploration Consultants Ltd. (available as
.pdf document http://www.zambia-mining.com/home.html).
Mitchell. No date. Industrial Mineral Resources of Zambia.
Mobbs P.M. 2009. The mineral industry of Zambia. 2007 Mineral Yearbook. (US Geological Survey).
Morel V., Slater D. and Sperinck M. 2007. Technical Report on the updated resource estimates at the
Matala and Dunrobin deposits, Luiri Hill Project. NI43-101 Technical Report completed for Luiri Gold
Ltd.
Nguni B. 2007. Geological Report on Iron Cap Gold Mine. Confidential Report compiled as a
contribution and recommendation to the deposit’s bankable document.
Prasad, E. A. V., Jayarama Gupta, M. and Dunn, C. E. 1987. Significance of termite mounds in gold
exploration. Curr. Sci. India, 56: 1219-1222.
Rivera M, Dudek D and Mann M. 2009. Project evaluation of the Tabakoto and Segala properties
Mali, West Africa for Avion Resources Corp.

Iron Cap Gold Mine Technical Report – 25 March 2010
Scarab Environmental and Geological Enterprises
63
Robert, F., Brommecker, R., Bourne, B. T. and Dobak, P. 2007. Models and Exploration Methods for
Major Gold Deposit Types. In "Proceedings of Exploration 07: Fifth Decennial International
Conference on Mineral Exploration" edited by B. Milkereit, 2007, p. 691-711.
Rocks for Crops. No Date.
Schluter T. 2006. Geological Atlas of Africa. With notes on stratigraphy, tectonics, economic geology,
geohazards and geosites of each country. 272 pp. Springer.
United Nations 2009, GDP Article
Watts, Griffis and McOuat Limited, 1991, Assessment of mineral exploration opportunities in Zambia.
Watts, Griffis and McOuat, Toronto, Canada, unpublished report.
Wagner G. 1995. Basic approaches and methods for quality assurance and quality control in sample
collection and storage for environmental monitoring. The Science of the Total Environ. 176, 63–71.
West, W. F. 1965. Some unconventional ideas on prospecting. Chamber Mines j. Rhodesia. 7:40-42.
West, W. F. 1970. Termite prospecting. Chamber Mines j. Rhodesia. 12:32-35.
White F. 1983, "The Vegetation of Africa", UNESCO, LaChaux-de-fonds, Switzerland.
Wright J. B. 1985. Geology and mineral resources of West Africa. 187 pp. Springer.
Zambian Environmental Protection and Pollution Control Act (No. 12) of 1990.
Zambian Mines and Minerals (Environmental) Regulations of 1997
Zambezi Resources 2004 Exploration Field season update no. 6
Zambezi Resources 2004 Exploration Field season update no. 7
Internet references
www.sciencedirect.com
http://earth.google.com/
www.wikipedia.org
http://www.necz.org.zm/cep/rationale.html (Environmental Council of Zambia)
http://www.itswild.org/comaco-work-area (Community markets for conservation)
Iron Cap Gold Mine Technical Report – 25 March 2010
Scarab Environmental and Geological Enterprises
64
21. DATE AND SIGNATURE PAGE
21.1 Certificate of Qualified Person
As compiler of the report entitled “Iron Cap Gold Mine, Zambia – Technical Report” dated 25 March
2010, I hereby state:
1. My name is Nico Scholtz, Principal Geologist with Scarab Enterprises of PO Box 1316,
Swakopmund, Namibia.
2. I am a practicing geologist and a member of the South African Council for Natural and
Scientific Professions (SACNASP).
3. I am a M.Sc. graduate of Dept Geology, University of the Free State, South Africa.
4. I have practiced my profession continuously since 2004.
5. I am a “qualified person” as that term is defined in National Instrument 43-101 (Standards of
Disclosure for Mineral Projects) (the “Instrument”).
6. I have been actively involved in mineral exploration (uranium and gold) for the past 7 years in
settings where structural coordination plays a major role in mineralisation including South
Africa, Mali, Niger, Tanzania, Zambia and Namibia.
7. I have completed fieldwork on the Iron Cap Mine area on 6 January 2010.
8. I have been responsible for the compilation of all parts of the Technical Report.
9. I have had no prior involvement with the property that is the subject of this Technical Report.
10. I have reviewed this report along with data supplied by The Challenger Development Corp.
11. I am independent of The Challenger Development Corp.
12. I have read the National Instrument and Form 43-101F1 (the “Form”) and this report has been
prepared in compliance with the Instrument and the Form.
13. I do not have nor do I expect to receive a direct or indirect interest in the properties of The
Challenger Development Corp., and I do not beneficially own, directly or indirectly, any
securities of The Challenger Development Corp. or any associate or affiliate of such
company.
14. This report, to the best of my knowledge, information and belief, contains all scientific and
technical information that is required to be disclosed to make the Report not misleading.
Dated at Swakopmund, Namibia, on 25 March 2010
…………………………………………………………
Nico Scholtz
Principal Geologist
M.Sc. Geology (Pr. Sci. Nat.)
Iron Cap Gold Mine Technical Report – 25 March 2010
Scarab Environmental and Geological Enterprises
65
21.2 Consent of Qualified Person
To: Securities Regulatory Authority
I, Nico Scholtz, do hereby consent to the public filing of technical report entitled Iron Cap Gold Mine,
Zambia – Technical Report and dated 25 March 2010 (the "Technical Report") by Challenger
Development Corporation (the "Issuer"), with the TSX Venture Exchange under its applicable policies
and forms in connection with the Agreement in Appendix A to be entered into by the Issuer and I
acknowledge that the Technical Report will become part of the Issuer's public record.
Dated at Swakopmund, Namibia, on 25 March 2010
…………………………………………………………
Nico Scholtz
Principal Geologist
M.Sc. Geology (Pr. Sci. Nat.)

Iron Cap Gold Mine Technical Report – 25 March 2010
Scarab Environmental and Geological Enterprises
66
Appendix A – (Licence details)
Figure A1. Licence details for Iron Cap SML 177.

Iron Cap Gold Mine Technical Report – 25 March 2010
Scarab Environmental and Geological Enterprises
67
Figure A2. Licence details for Iron Cap SML 177.

Iron Cap Gold Mine Technical Report – 25 March 2010
Scarab Environmental and Geological Enterprises
68
Appendix B – (Chemical assays)
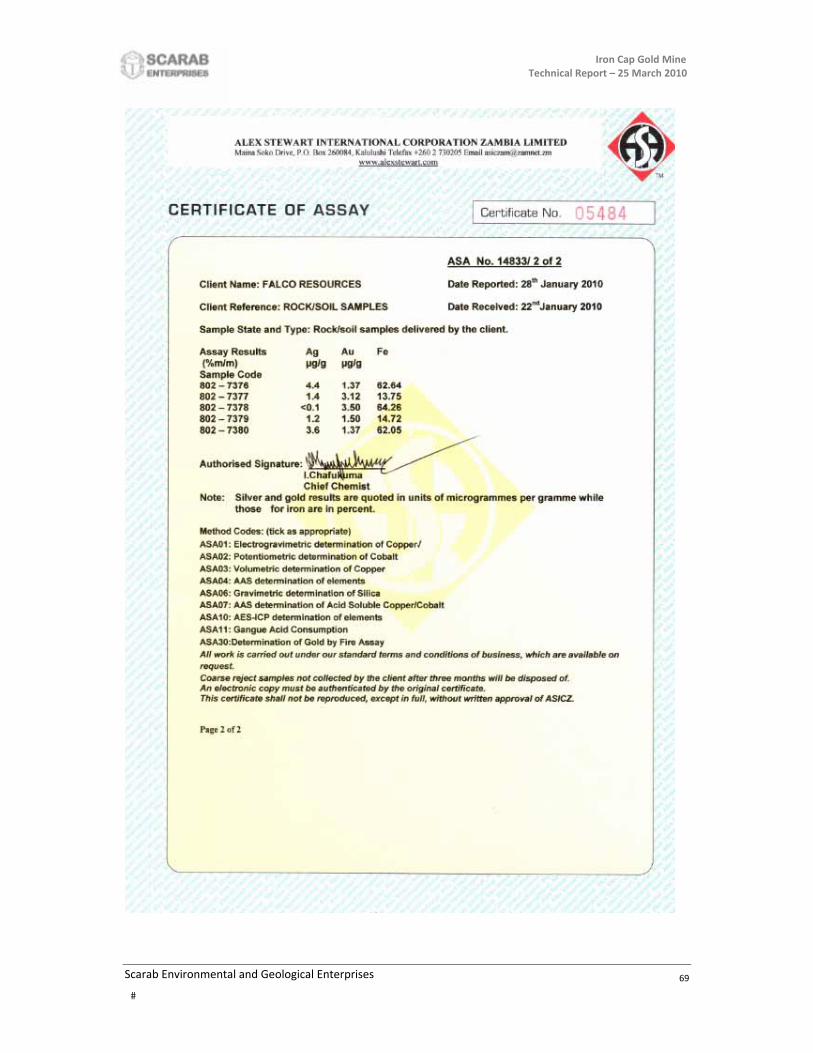
Iron Cap Gold Mine Technical Report – 25 March 2010
Scarab Environmental and Geological Enterprises
69

Iron Cap Gold Mine Technical Report – 25 March 2010
Scarab Environmental and Geological Enterprises
70
Appendix C – (Chemical assays)

Iron Cap Gold Mine Technical Report – 25 March 2010
Scarab Environmental and Geological Enterprises
71
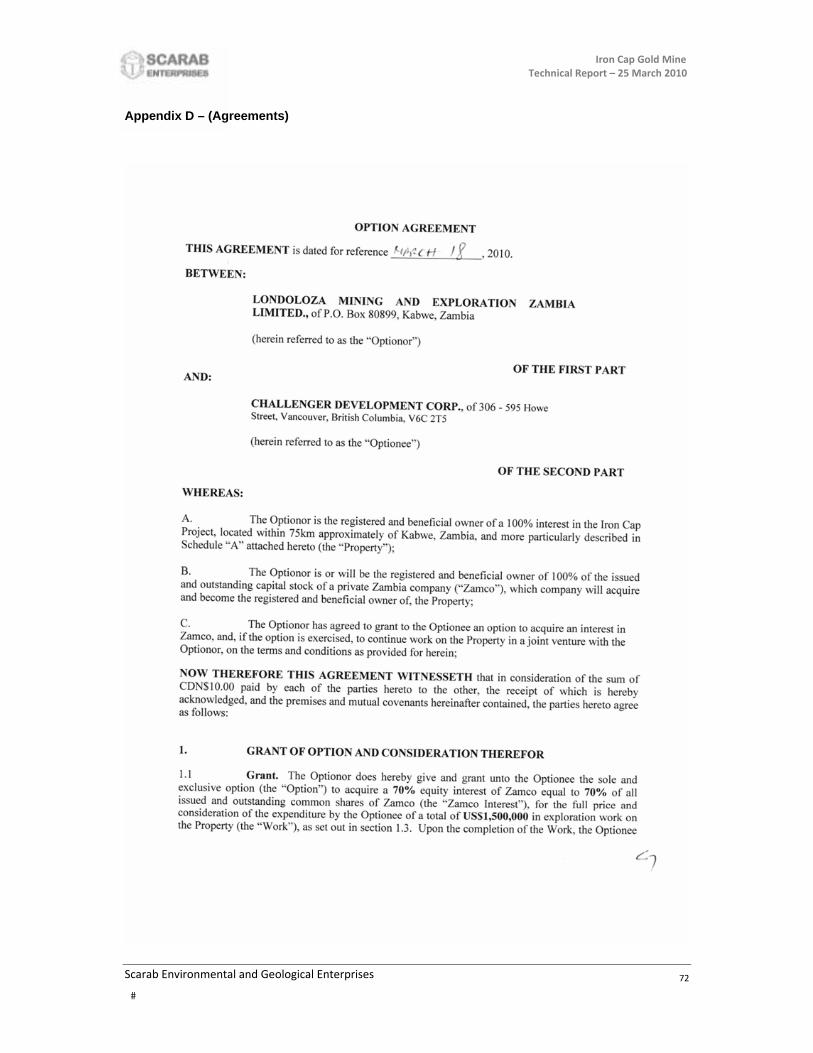
Iron Cap Gold Mine Technical Report – 25 March 2010
Scarab Environmental and Geological Enterprises
72
Appendix D – (Agreements)

Iron Cap Gold Mine Technical Report – 25 March 2010
Scarab Environmental and Geological Enterprises
73
Iron Cap Gold Mine Technical Report – 25 March 2010
Scarab Environmental and Geological Enterprises
74

Iron Cap Gold Mine Technical Report – 25 March 2010
Scarab Environmental and Geological Enterprises
75
Iron Cap Gold Mine Technical Report – 25 March 2010
Scarab Environmental and Geological Enterprises
76
Iron Cap Gold Mine Technical Report – 25 March 2010
Scarab Environmental and Geological Enterprises
77
Iron Cap Gold Mine Technical Report – 25 March 2010
Scarab Environmental and Geological Enterprises
78
Iron Cap Gold Mine Technical Report – 25 March 2010
Scarab Environmental and Geological Enterprises
79

Iron Cap Gold Mine Technical Report – 25 March 2010
Scarab Environmental and Geological Enterprises
80

Iron Cap Gold Mine Technical Report – 25 March 2010
Scarab Environmental and Geological Enterprises
81
Iron Cap Gold Mine Technical Report – 25 March 2010
Scarab Environmental and Geological Enterprises
82
Iron Cap Gold Mine Technical Report – 25 March 2010
Scarab Environmental and Geological Enterprises
83

Iron Cap Gold Mine Technical Report – 25 March 2010
Scarab Environmental and Geological Enterprises
84
Iron Cap Gold Mine Technical Report – 25 March 2010
Scarab Environmental and Geological Enterprises
85
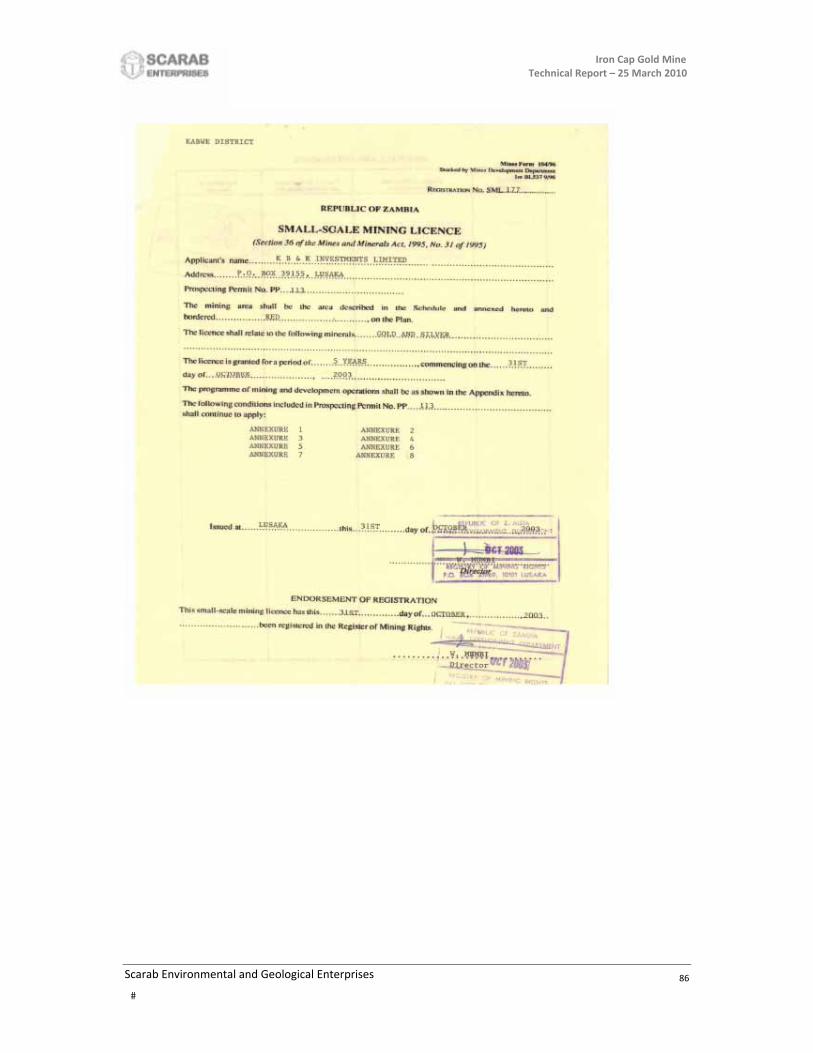
Iron Cap Gold Mine Technical Report – 25 March 2010
Scarab Environmental and Geological Enterprises
86

Iron Cap Gold Mine Technical Report – 25 March 2010
Scarab Environmental and Geological Enterprises
87