Embed Size (px)
Citation preview
Is Trust Important for Economic Development
and Growth?
Diplomarbeit
zur Erlangung des Grades
einer Diplom-Volkswirtin
an der Wirtschaftswissenschaftlichen Fakultät
der Humboldt-Universität zu Berlin
vorgelegt von
Katja Schmidt
(Matrikel-Nr. 133421/WS97)
Prüfer: Prof. Harald Uhlig, Ph.D.
Berlin, 17. März 2003
1
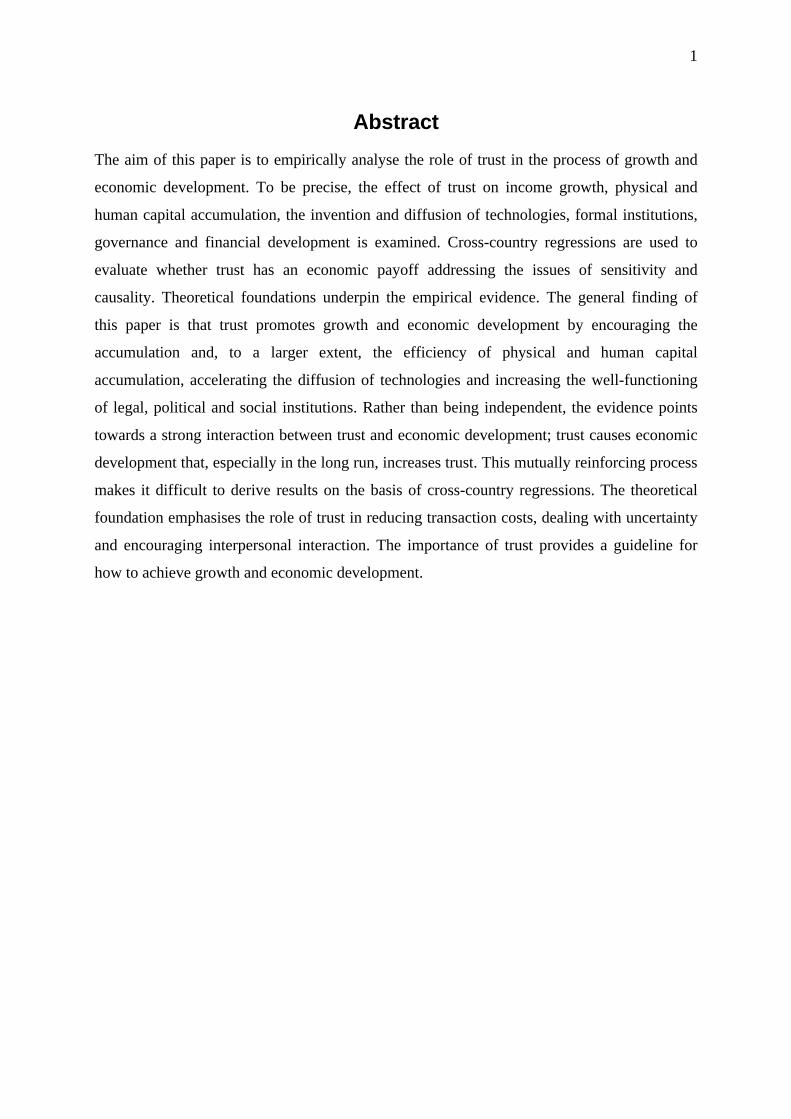
Abstract
The aim of this paper is to empirically analyse the role of trust in the process of growth and
economic development. To be precise, the effect of trust on income growth, physical and
human capital accumulation, the invention and diffusion of technologies, formal institutions,
governance and financial development is examined. Cross-country regressions are used to
evaluate whether trust has an economic payoff addressing the issues of sensitivity and
causality. Theoretical foundations underpin the empirical evidence. The general finding of
this paper is that trust promotes growth and economic development by encouraging the
accumulation and, to a larger extent, the efficiency of physical and human capital
accumulation, accelerating the diffusion of technologies and increasing the well-functioning
of legal, political and social institutions. Rather than being independent, the evidence points
towards a strong interaction between trust and economic development; trust causes economic
development that, especially in the long run, increases trust. This mutually reinforcing process
makes it difficult to derive results on the basis of cross-country regressions. The theoretical
foundation emphasises the role of trust in reducing transaction costs, dealing with uncertainty
and encouraging interpersonal interaction. The importance of trust provides a guideline for
how to achieve growth and economic development.
2
Contents
1 Introduction 5
2 Literature Review 9
3 Measurement and Data 13
4 Empirical Evidence 17
4.1 Trust and Growth.............................................................................................. 17
4.1.1 Theoretical Framework ........................................................................ 17
4.1.2 Basic Regression Results ..................................................................... 18
4.1.3 Sensitivity Analysis .............................................................................. 22
4.1.4 Reverse Causality................................................................................. 24
4.2 Trust and Investment ........................................................................................ 28
4.3 Trust and Education.......................................................................................... 31
4.4 Trust and Technology....................................................................................... 34
4.5 Trust and Other Indicators of Economic Development.................................... 37
5 Theoretical Foundation 42
5.1 Contemporary Growth Theory.......................................................................... 42
5.2 Direct and Indirect Effects................................................................................ 43
5.3 Multiple Equilibria ........................................................................................... 47
6 Policy Suggestions 49
7 Conclusion 51
References 53
Appendix 61
A Countries and Country Codes........................................................................... 61
B Variable Description and Data Source ............................................................. 62
C Descriptive Statistics ........................................................................................ 65
3
List of Tables
1 Basic Growth Regressions............................................................................................ 19
2 EBA Result for Trust.................................................................................................... 24
3 2SLS Growth Regressions............................................................................................ 26
4 Investment Regressions................................................................................................ 29
5 Education Regressions ................................................................................................. 32
6 Technology Regressions............................................................................................... 35
7 Growth Regressions Including Governance and Financial Variables .......................... 38
8 Governance Regressions .............................................................................................. 39
9 Credit Regressions........................................................................................................ 41

4
List of Figures
1 Trust and Per Capita GDP............................................................................................ 16
2 Trust and Legal System ................................................................................................ 16
3 Partial Regression Plot of Growth on Trust ................................................................. 20
4 Partial Regression Plot of Investment on Trust............................................................ 30
5
1 Introduction
Barro’s (1991) seminal work on cross-country differences in growth and economic
performance renewed the debate about factors that help to explain these differences and
shifted the interest from a more theoretical point of view to an empirically oriented approach.
One of these factors that came under examination only recently is the level of trust. The
optimistic view that uncertainty and risk in economic activity is ruled out by rational
individuals who act independently of the social context and have perfect information about
other individuals does not hold in reality. Consequently, cross-country differences in factors
that reduce uncertainty and information restrictions and spur cooperation help answer the
question of why some countries perform better and so possibly grow faster than other
countries. Trust plays a central role in encouraging cooperation by reducing uncertainty and
minimising the costs of limited information and so should be considered as a determinant of
economic growth. Despite the fact that some authors found evidence on the relevance of trust
for growth and economic performance (see La Porta et al. 1996, Knack and Keefer 1997 and
Zak and Knack 1998), some questions remain open. First, the robustness of the results derived
from cross-country growth regressions is tentative because not all factors that affect growth
were sufficiently controlled for. Second, the interaction between trust and growth can work in
both directions, thus raising the issue of causality. A concentration merely on the effect of
trust on economic performance ignores the possibility that economic performance influences
trust. Third, according to Solow (1995), trust only indirectly affects growth and so functions
as a background characteristic rather than directly stimulating economic progress. And
finally, the measurement of trust involves a variety of problems, making credible conclusions
difficult.
This paper aims to examine the impact of trust on economic growth addressing the
issues of robustness, causality and direct and indirect effects. Measurement problems play
only a minor role. Alongside the connection between trust and the increase of per capita
income, the relationship between trust and the process of economic development is the central
focus of this paper. To be precise, the effect of trust on physical and human capital
accumulation, technological change, formal institutions, governance and financial
development that drive the process of economic development is evaluated. Finally, empirical
evidence and theoretical foundations are combined to substantiate the relevance of trust for
growth and economic development and to derive policy suggestions.
6
To test whether trust drives the process of growth and economic development, the
aggregated trust variable is included as an explanatory variable in cross-country regressions
with per capita GDP growth, the investment share, human capital measures, technology
variables and indicators of governance and financial development as dependent variables. The
sensitivity of the results derived from the cross-country growth regression is evaluated using
the Extreme Bounds Analysis that shows the effect of a changing set of explanatory variables
on the estimated effect of trust. In order to address endogeneity problems, an instrumental
variable technique using lagged values of some explanatory variables and an index of ethnic
fractionalisation as instrument for trust is employed.
Trust plays a role in a variety of disciplines: psychology, sociology, political science
and organisational research employ this concept using different definitions and specifications.
This broad application requires an exact description of what is meant by trust in this paper.
Trust represents the “expectations [of an individual] about actions of others that have a
bearing on this individual’s choice of action, when the action must be chosen before he or she
can observe the actions of those others” (Dasgupta 2000, p.331). Mistrust, in contrast, means
that such expectations about the behaviour of others do not exist. This definition involves two
relevant elements of trust: the formation of expectations about events that occur in the future
but condition an individual’s present decision and an element of uncertainty and risk due to
the possibility that the placed trust can be exploited.1 Trust arises from two different sources
that form two different dimensions of trust. Special trust (also labelled as thick trust or partner
trust) evolves when individuals repeatedly interact and so build reputations. Special trust is
bound in a relationship between specific individuals and cannot easily be generalised. In
contrast, generalised trust (also labelled as thin trust or moral trust) results from values,
attitudes or social norms that produce trust when certain conditions are met. This form of trust
describes a wider radius and is not limited to a relationship between specific individuals.2 For
this reason, in complex and specialised markets where the probability of repeated interaction
falls, only generalised trust is able to deal with uncertainty and information imperfection,
encourage general cooperation and so possibly have a bearing on growth and economic
development. Special trust resulting from family ties, friendship or close and continuous
1 Another definition involving these characteristics is given by Gambetta (2000): “trust […] is a particular level of the subjective probability with which an agent assesses that another agent or group of agents will perform a particular action, both before he can monitor such action […] and in a context in which it affects his own action” (emphasis maintained) (Gambetta 2000, p.217). 2 Other authors use different terms and somewhat different specifications, for example, Williams (2000) distinguishes between egoistic motives (punishment or reputation) and non-egoistic motives (culture) of trust.
7
business relations plays a limited role in economic development because this form of trust
cannot solve the problems of uncertainty and imperfect information in modern markets.
Consequently, by testing the effects of trust on economic progress, trust refers to generalised
trust that emerges from individual characteristics and social context rather than continuous
interactions. In other words, the core interest of this paper is to examine the effect of
countrywide trust placed by individuals in other anonymous individuals on economic
performance. Countries where the aggregated level of generalised trust is high are supposed to
grow faster and spur economic development whereas low-trust countries are expected to lag
behind.
Trust is a vital part of the social capital of a country that includes institutions,
networks, relations, attitudes, values and norms “that can improve the efficiency of society by
facilitating coordinated actions” (Putnam 1993, p. 167). For this reason, trust stands for the
social structure of a country and enables the investigation of the relationship between social
and economic development. Social development in the form of higher trust is supposed to be
strongly related to economic development.
The general finding of this paper is that trust positively affects economic growth both
directly, by influencing the overall efficiency of economic activities and the scope of
exchange, and indirectly, by reducing transaction costs, uncertainty and information
restrictions and so encouraging the accumulation of physical and human capital and the
invention and diffusion of technologies. Additionally, trust matters for the efficient
functioning of formal institutions and governmental performance. The robustness of this
finding is compelling although the formal test of robustness fails. The relationship between
trust and economic development runs in both directions; higher trust encourages economic
development and at the same time, economic development promotes trust especially in the
long run. A general shortcoming of this paper is that it relies on a single survey question to
quantify the level of trust in a country.
The remainder of the paper is organised as follows. Section 2 reviews the theoretical
and empirical literature dealing with trust. Section 3 examines the problems that arise when
seeking a reliable measurement of trust and provides an overview of the data. Section 4
presents the cross-country regression results for trust on growth, investment in physical and
human capital, invention and diffusion of technologies, governance and financial
8
development. In section 5, the theoretical foundations for the relationship between trust and
economic progress are discussed and the linking of trust with contemporary growth theory is
attempted. Section 6 derives suggestions for policies that can promote trust and put a country
on the virtuous path of economic development. The final section concludes the paper.
9
2 Literature Review
The crucial role of trust for micro-economic decision-making and macro-economic
performance has been recognised for a long time. Arrow (1972) remarks: “Virtually every
commercial transaction has within itself an element of trust, certainly any transaction
conducted over a period of time. It can be plausibly argued that much of the economic
backwardness in the world can be explained by the lack of mutual confidence” (Arrow 1972,
p.357). But it was not until recently that economic literature began to extensively deal with
causes and consequences of trust rather than treating processes within individuals and their
relations with the environment as exogenous. Not taking into account interaction and
communication among individuals ignores the fact that these aspects affect economic
performance.
The impulse of introducing social and institutional phenomena into economics was
given by the new institutional approach of economics (see North 1990 and Williamson 1985).
Transaction costs, uncertainty, imperfect information, social and cultural restraints were
integrated into the neoclassical framework of economics and so became a fundamental
determinant of economic performance. Together with some advances in game theory and
micro-economic analysis that started to launch the concept trust (for example, Berg et al.
1995), these progresses in economic thinking clarified the importance of trust for economic
performance. In the trust game proposed by Berg et al. (1995), individuals are able to achieve
a higher but uncertain payoff by trusting that the anonymous counterpart is willing to
cooperate and reciprocate the trust placed. Berg et al. (1995) state that social norms govern
the decisions of the individuals to trust and to reciprocate the placed trust.
However, it was Putnam (1993) who first highlighted the role of social capital, in
particular trust, for economic dynamism and thus initiated various empirical studies on this
topic. In his seminal paper, Putnam compares the governmental performance in the northern
and southern regions of Italy by looking at differences in the civic community in these
regions. He shows that regions with a stronger sense of community have higher levels of trust
which, in turn, contribute to the effectiveness and stability of democratic government and a
superior economic performance. In this sense, cooperation and trust emerging from civic
responsibility resolve collective action problems and lead to mutual benefits. According to
Putnam, societies evolve toward two broad equilibria, a good equilibrium (“virtuous circle”)
10
with high levels of civic engagement, cooperation, trust and performance, and a bad
equilibrium (“vicious circle”) with isolation, exploitation, distrust and stagnation, for trust
tends to be self-enforcing and cumulative. Fukuyama (1995) contributes to a cross-country
evaluation of differences in economic performance to variations in trust. Relying on a rather
qualitative and descriptive argumentation, he states that generalised trust accounts for the
superior performance of institutions, especially firms. The need for cooperation and the
dependence of cooperation on trust determines the success of a firm in implementing an
efficient organisation, adopting changes in technology, acquiring qualified personnel and
achieving economic objectives. Fukuyama explicitly distinguishes between family ties and
generalised trust wherein the first is harmful for firms and the latter leads to economic
superiority.3 Helliwell (1996a, 1996b) shows the effect of trust on productivity growth and
investment activity for several OECD countries and on per capita income growth for the
United States and Canada. His analysis provides no evidence that trust affects economic
performance. However, Helliwell does not address problems of specification and endogeneity
and relies on a very limited set of data. In the same year, La Porta et al. (1996) carried out a
cross-country investigation on the effects of trust on social efficiency including per capita
GDP growth, government efficiency, participation and the relative success of large
organisations and found strong evidence that trust counts for economic performance; a one-
standard-deviation increase of trust increases growth by 0.3% (La Porta et al. 1996, p.7). But
as with Helliwell (1996a, 1996b), specification and endogeneity problems are not sufficiently
addressed which casts doubt on their findings. Knack and Keefer (1997) include the
aggregated trust variable in cross-country Barro-type growth and investment regressions and
find positive and significant relationships between trust, growth and investment even after
controlling for several other variables and reverse causality. In their basic regressions, a one-
standard-deviation increase in trust raises growth by 1.15% and investment by 2.04% (Knack
and Keefer 1997, p.1260). However, these findings are sensitive to influential observations
and the measures of physical and human capital used in the regressions. Zak and Knack
(1998) use different specifications of growth and investment regressions and achieve similar
results. Additionally, they provide insights into the interaction between trust, formal
institutions, informal sanctions and social distance and their separated effects on growth and
investment.
3 Granovetter (1973) was the first to address the difference between generalised trust and specific trust including trust in family and friends. Putnam (1993), who distinguishes between thin and thick trust, Fukuyama (1995), who emphasises the radius of trust, La Porta et al. (1996) and several others further stress this aspect.
11
These empirical studies serve as a source of inspiration for this paper. This paper aims
to more intensely address the robustness of results derived from cross-country regressions and
problems of endogeneity. Moreover, assuming trust is significantly related to growth, the
channels through which this relationship works are investigated. In this sense, Solow’s (1995)
critique that trust only indirectly affects growth plays a central role. This question is very
important in deciding whether trust is nothing more than a background characteristic that can
be excluded from further considerations or if trust directly influences growth and economic
development.
Alongside physical capital accumulation, human capital is an essential determinant of
economic development. Coleman (1988) shows that social capital–understanding trust to be
an integral part of social capital–affects the creation of human capital in the next generation
by influencing school drop-out rates. He reflects on social capital inside the family and within
the community and shows their effects on human capital. Similarly, Goldin and Katz (1998)
state that social capital, consisting of associational activities, social trust and civic
participation, helps to explain the rise of secondary education in the United States at the
beginning of the last century and so contributes to human capital formation. The invention,
innovation and diffusion of technologies accompany economic development. Bornschier
(2001) and Volken (2002) investigate the effect of trust on technological diffusion on the
basis of the diffusion of internet hosts, demonstrating that trust matters for technological
advancement. The quality of institutions and governments are other fundamentals of
economic development. Apart from Putnam (1993), La Porta (1996) and Knack and Keefer
(1997), Inglehart (1999) and Knack (2000) have also contributed to an empirical investigation
of the relationship between trust and formal institutions and governance. All these papers
provide evidence that trust positively affects the performance of institutions and governments.
In contrast, the interaction between trust and financial development only plays a minor role in
the literature. Guiso et al. (2000) investigate the effect of social capital on financial choices on
the individual level, finding strong evidence that social capital matters. However, to see if
these findings hold for trust, an analysis of trust on the aggregate level still has to be
performed. Trust plays a role in several other economic settings, for example, in the analysis
of regional and community development (see Narayan and Pritchett 1997) or in the analysis
of household performance (see Slemrod and Katuscak 2002). Lately, the research interest has
also focused on the determinants of trust (see Alesina and La Ferrara 2000 and Glaeser et al.
2000a) and measurement issues (see Glaeser et al. 2000b). The first aspect plays a role when
12
evaluating the causality between trust and economic development while measurement issues
affect the accuracy and interpretation of the results.
In contrast to the growing empirical interest in trust, theoretical foundations linking
trust, growth and economic development barely exist. Zak and Knack (1998) construct a
general equilibrium growth model with a principle-agent structure in which the interaction
between investors (principal) and brokers (agent) determine investment decisions. Trust, in
contrast to spending time monitoring the actions of others (“diligence”), positively affects
investment decisions. As trust depends on formal institutions, informal sanctions and the
social distance between principal and agent, “heterogeneous societies, especially those with
weak formal and informal institutions, have lower trust and less growth than less
heterogeneous, higher trust societies” (Zak and Knack 1998, p.17). However, the model only
allows trust to affect growth through physical capital accumulation while other growth
channels are not taken into account. This property prevents a broad applicability of this
model. In reference to Romer (1993), Barrett (1997) incorporates trust into an endogenous
growth model and describes direct and indirect effects of trust on growth. In particular, the
indirect influences of trust arise from its effects on closing object gaps (shortcomings in
physical and human capital) and idea gaps (limitations in knowledge), whereas the direct
influences affect the scope of exchange and the total efficiency of the economy.
13
3 Measurement and Data
Before the relationship between trust and economic performance can be analysed, trust has to
be measured satisfactorily. This section illustrates the problems that arise when one attempts
to establish a reliable measurement of trust. After addressing measurement problems, this
section gives an overview of the data.
Trust originates from psychology describing the expectations of an individual about
the behaviour of others (Dasgupta 2000, p.331) and therefore trust is inseparably linked to
specific individuals. In this context, trust can be quantified by self-assessment through survey
questions or experiments. Most of the literature relies on the World Value Survey (WVS) to
obtain international data on trust. The WVS contains survey data on attitudes, values and
norms for more than 50 countries that were acquired in three waves beginning 1981-1984,
1990-1993 and 1995-1997. A shortcoming of the WVS is that only those countries can be
evaluated where a certain level of development allowed a countrywide survey. Furthermore,
the survey oversamples the urban population and better-educated individuals especially in
low-income countries.4 However, the WVS is the only source that enables cross-country
comparisons about cultural, social and personal attitudes so far. The measure of trust is based
on the following WVS question: “Generally speaking, would you say that most people can be
trusted or that you can’t be too careful in dealing with people?” The answer “most people can
be trusted” is associated with trusting individuals whereas the answer “can’t be too careful”
represents mistrusting individuals. Based on Knack and Keefer (1997), the aggregate level of
trust is quantified as the percentage of trusting individuals in each country after deleting the
“don’t know” responses.5 The trust item involves some problems. As the question attempts to
measure generalised trust (to people in general not to a specific person), the wording “most
people” is ambiguous. The term “most people” captures all individuals people interact with
including family and friends. As trust between family members and friends is normally
higher, respondents relating the question to family and friends are more likely to give an
affirmative answer than respondents reflecting on the trust they put into strangers. Knack and
Keefer (1997) state that this aspect could lead to a systematic bias across countries “if by
‘most people’ respondents consider most people that they transact with” (Knack and Keefer
1997, p.1256) and people in low-income countries, compared to people in high-income
4 See Inglehart et al. (2000) for a detailed description of methods and shortcomings of the WVS. 5 The exclusion of the “don’t know” responses is problematic as the share varies significantly across countries ranging from 0,11% in Czech Republic to 38,36% in Switzerland.
14
countries, normally transact more with relatives and friends than with strangers. From an
economic perspective, the distinction between generalised and specific trust plays a central
role as only generalised trust affects the general cooperative behaviour and so leads to
preferable economic outcomes (see Putnam 1993, Fukuyama 1995 and La Porta 1996).
Another shortcoming of the trust item is, with reference to Yamagishi et al. (1999), the
formulation of the answer categories. “Trusting” and “careful” are not the best extremes
because being “cautious in dealing with others does not necessarily imply that the person is
distrustful of others in general” (Yamagishi et al. 1999, p.148). A further limitation is the
concentration on two response categories that do not allow for different degrees of trust. It is
more likely that trust exists to a certain extent rather than being completely present or absent.
In addition to these specific problems of the trust item, some general reservations about
surveys appear. Surveys that measure attitudes across countries assume that these attitudes are
interpreted and valued similarly in different countries. However, it is possible that trust in
Asia means something different than trust in Latin America. Finally, the response to the trust
question does not always reflect actual trusting behaviour. Glaeser et al. (2000b) combine
survey questions and experiments to analyse the relationship between trusting attitude and
trusting behaviour. According to their analysis, the standard survey question about
generalised trust does not predict trusting behaviour in the experiments. On the contrary, the
trust question better measures trustworthiness of the participants (Glaeser et al. 2000b, p.813).
Although this presumption caused a reinterpretation of the past work and a closer
investigation of the relationship between trust and trustworthiness, one has to be careful of
absolutely rejecting the trust question. In Glaeser et al. (2000b), individuals were given the
option of choosing their partner in the trust experiments by themselves (“non-random
pairing”) and they were allowed to interact openly during the experiments. This experimental
setting indicates that the experiments reveal specific trust rather than showing generalised
trust. Furthermore, trusting activities in different experiments were only weakly correlated
making it even more difficult to predict trusting behaviour in different situations.
In summary, it can be said that measuring trust is a challenging task. The outcome of a
survey is very much dependent on the formulation of the survey question and might not
reflect actual behaviour. Experiments are very difficult to carry out on a large scale and
cannot guarantee that the findings are stable over different experimental settings. These
shortcomings play a role when it comes to a universal interpretation of the empirical findings.

15
This paper concentrates on the generalised trust question of the WVS for 46 countries6
(see appendix A) combining the 1990-1993 and the 1995-1997 surveys. The combination of
the two surveys is possible as the trust question is asked in both time periods and trust is
regarded as relatively stable over time, which is confirmed by a simple correlation coefficient
of 94.78% between trust in 1990 and 1995 for those countries available. Countries in Latin
America display the lowest level of trust with only 5.02% of generalised trust in Peru or
6.46% in Brazil. Possible explanations for these low levels of trust could be the colonial past
of Latin America, high ethnic diversity, political instability and an unequal distribution of
wealth. Countries with the highest level of trust are typically Scandinavian countries. Sweden
displays a generalised trust of 66.10%, Norway 65.05% and Finland 62.72%. These countries
have a homogenous population, long-standing political stability and an equal distribution of
wealth.
The other variables will be summarised only briefly (for details see appendix B and
C). Per capita GDP growth represents economic success and per capita GDP is used as an
income variable. The investment share and the private investment share demonstrate
investment activity. Total years of schooling, the percentage of individuals in the total
population with a completed education, enrolment rates, drop-out rates and educational
expenditures per pupil represent human capital. Formal institutions are described using a rule
of law index and an index of the legal system. The state of technological development is
evaluated using R&D expenditures and personnel and the use of information and
telecommunication technologies. An index of government efficiency, an index of bureaucratic
quality, corruption, graft and total governmental expenditures illustrate governance. Domestic
credit and private domestic credit are included as financial variables. Variables that are used
as instruments or conditions will be described in the relevant section.
Figure 1 provides a scatter plot of per capita GDP compared with trust indicating that
richer countries tend to have higher levels of trust than poorer countries. However, the
relationship is not perfect; China displays a level of trust that is almost as high as in the
Scandinavian countries (60.30%), whereas France has very low generalised trust (22.79%).
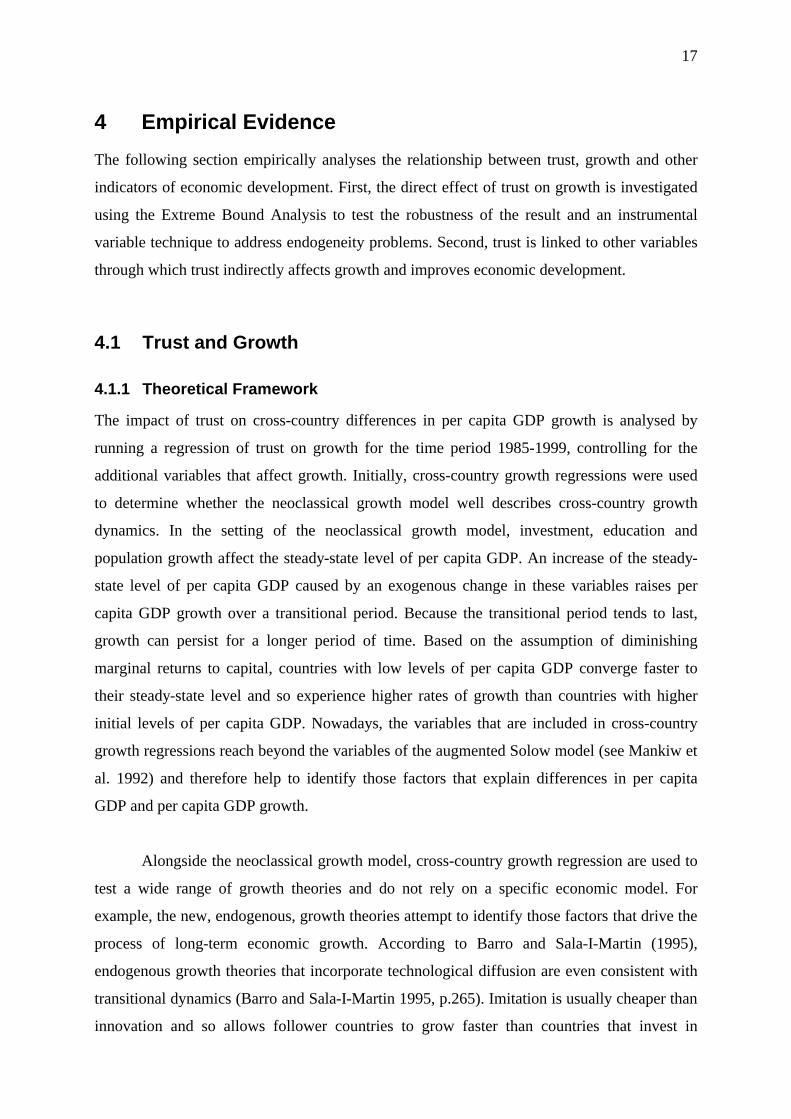
To see if trust captures the effect of different institutional environments, figure 2 displays the
relationship between the legal system and trust. A positive relationship can be observed only
at very low levels of trust where the legal environment is weak and at very high levels of trust 6 Former Soviet and Yugoslavian countries and Puerto Rico are excluded because no systematic data of economic variables for these countries exist.
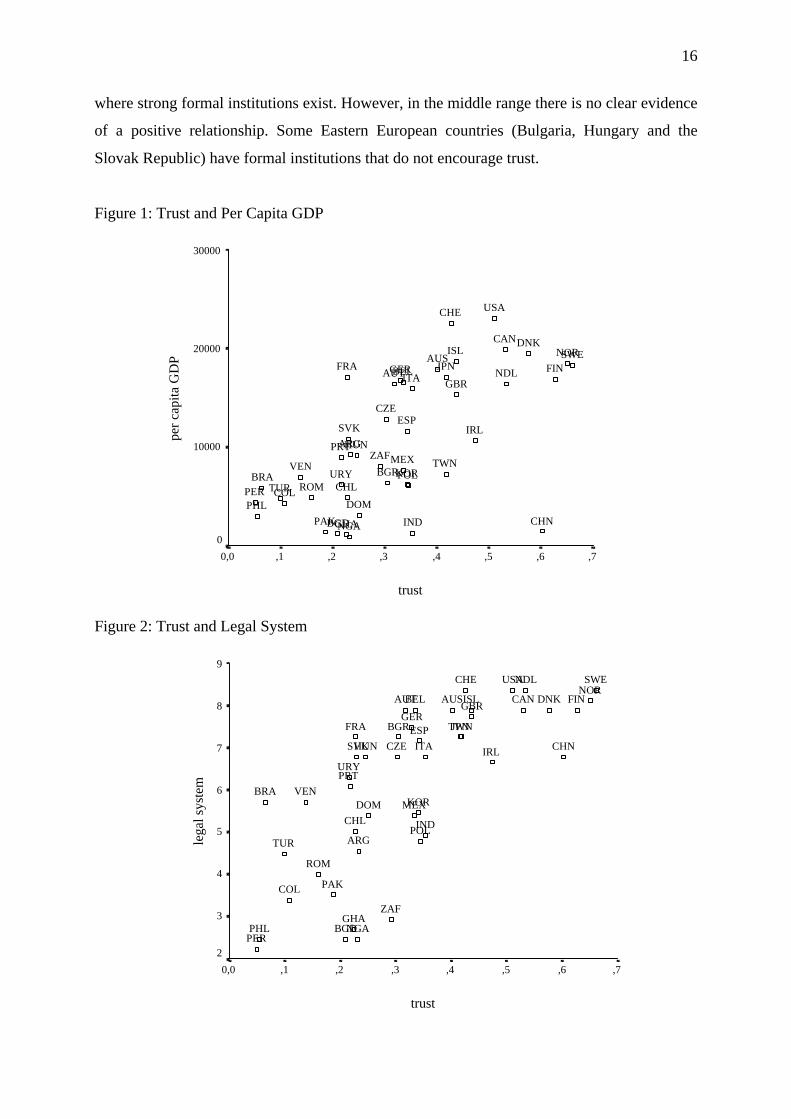
16
where strong formal institutions exist. However, in the middle range there is no clear evidence
of a positive relationship. Some Eastern European countries (Bulgaria, Hungary and the
Slovak Republic) have formal institutions that do not encourage trust.
Figure 1: Trust and Per Capita GDP
trust
,7,6,5,4,3,2,10,0
per c
apita
GD
P
30000
20000
10000
0
VEN
USA
URY
GBR
TUR
TWN
CHE
SWE
ESP
KOR
ZAF
SVK
ROM
PRT
POL
PHLPER
PAK
NOR
NGA
NDL
MEX
JPNITA
IRL
IND
ISL
HUN
GHA
GERFRA FIN
DOM
DNK
CZE
COL
CHN
CHL
CAN
BGRBRA
BEL
BGD
AUTAUS
ARG
Figure 2: Trust and Legal System
trust
,7,6,5,4,3,2,10,0
lega
l sys
tem
9
8
7
6
5
4
3
2
VEN
USA
URY
GBR
TUR
TWN
CHE SWE
ESP
KOR
ZAF
SVK
ROM
PRT
POL
PHLPER
PAK
NOR
NGA
NDL
MEX
JPN
ITA IRL
IND
ISL
HUN
GHA
GERFRA
FIN
DOM
DNK
CZE
COL
CHN
CHL
CAN
BGR
BRA
BEL
BGD
AUT AUS
ARG
17
4 Empirical Evidence
The following section empirically analyses the relationship between trust, growth and other
indicators of economic development. First, the direct effect of trust on growth is investigated
using the Extreme Bound Analysis to test the robustness of the result and an instrumental
variable technique to address endogeneity problems. Second, trust is linked to other variables
through which trust indirectly affects growth and improves economic development.
4.1 Trust and Growth
4.1.1 Theoretical Framework
The impact of trust on cross-country differences in per capita GDP growth is analysed by
running a regression of trust on growth for the time period 1985-1999, controlling for the
additional variables that affect growth. Initially, cross-country growth regressions were used
to determine whether the neoclassical growth model well describes cross-country growth
dynamics. In the setting of the neoclassical growth model, investment, education and
population growth affect the steady-state level of per capita GDP. An increase of the steady-
state level of per capita GDP caused by an exogenous change in these variables raises per
capita GDP growth over a transitional period. Because the transitional period tends to last,
growth can persist for a longer period of time. Based on the assumption of diminishing
marginal returns to capital, countries with low levels of per capita GDP converge faster to
their steady-state level and so experience higher rates of growth than countries with higher
initial levels of per capita GDP. Nowadays, the variables that are included in cross-country
growth regressions reach beyond the variables of the augmented Solow model (see Mankiw et
al. 1992) and therefore help to identify those factors that explain differences in per capita
GDP and per capita GDP growth.
Alongside the neoclassical growth model, cross-country growth regression are used to
test a wide range of growth theories and do not rely on a specific economic model. For
example, the new, endogenous, growth theories attempt to identify those factors that drive the
process of long-term economic growth. According to Barro and Sala-I-Martin (1995),
endogenous growth theories that incorporate technological diffusion are even consistent with
transitional dynamics (Barro and Sala-I-Martin 1995, p.265). Imitation is usually cheaper than
innovation and so allows follower countries to grow faster than countries that invest in
18
innovation. The growth rate of follower countries decreases with increasing initial per capita
GDP because the stock of adaptable technologies declines. However, Durlauf and Johnson
(1995) and Durlauf and Quah (1999) note that cross-country growth regressions are not
appropriate to test endogenous growth theories that embody nonlinearities, for example
multiple equilibrium situations (Durlauf and Johnson 1995, p.365).
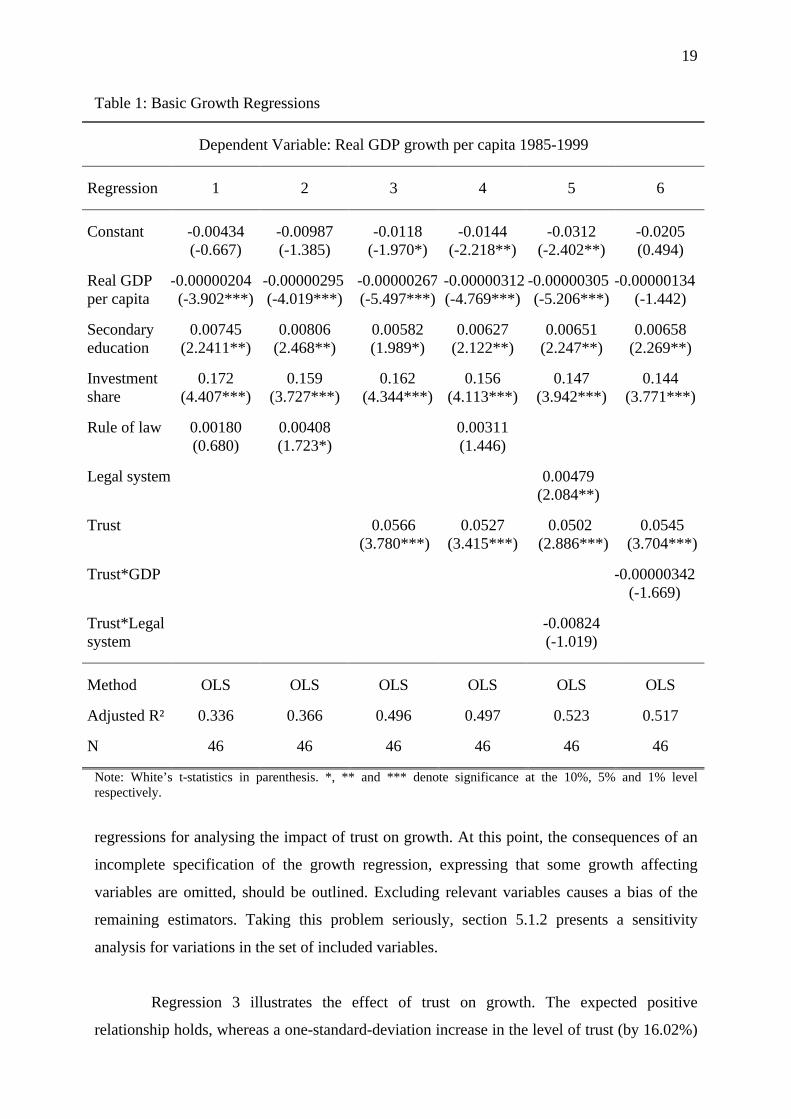
4.1.2 Basic Regression Results
Regression 1 of table 1 shows a cross-country regression for per capita GDP growth for the
time period 1985-1999. The initial per capita GDP is significantly (at the 1% significance
level) and negatively related to growth. A one-standard-deviation increase in GDP (by US$
6647.43) diminishes the growth rate by 1.36% (obtained by multiplying the coefficient with
the standard deviation to make results comparable), controlling for all other variables. The
initial value of human capital appears in regression 1 as the average years of secondary
education. Other indicators of human capital such as primary education or higher education
did not prove to be significantly related to growth and hence were excluded from the
regression. The estimated coefficient is significant (at the 5% significance level) and positive
indicating that a one-standard-deviation increase in secondary education (by 0.99 years) raises
growth by 0.73%. In regression 1, the investment ratio representing physical capital
accumulation is significantly (at the 1% significance level) and positively related to growth. A
one-standard-deviation increase in the investment share (by 6.58%) increases the growth rate
by 1.13%. Although the investment share is widely used as an explanatory variable for
growth, a positive coefficient may reflect the positive effect of growth on investment rather
than vice versa (see Levine and Renelt 1992 and Barro and Sala-I-Martin 1995). Regression 2
contains the initial value of the rule of law index assessing institutional quality. This variable
reflects the extent to which sound political institutions, a court system and a provision of an
orderly succession of power exist to implement law and settle disputes and so depicts the
security of property and contract rights (Knack and Keefer 1995, p.225). The rule of law
index has the expected positive effect on growth (significant at the 10% significance level),
whereas one-standard-deviation increase (by 1.74 points) raises growth by 0.71%. The
motivation for the inclusion of the institutional variable is to gain insights into the interaction
between formal institutions and informal institutions such as trust. The use of other measures
of institutional quality leads to similar results.7 Regression 1 and 2 serve as benchmark
7 Other measures of institutional quality are the property rights index from the Heritage Foundation, the rule of law index from Kaufmann et al. (1999a, 1999b) and the legal system index from the Fraser Institute.
19
Table 1: Basic Growth Regressions
Dependent Variable: Real GDP growth per capita 1985-1999
Regression
1
2
3
4
5
6
Constant
-0.00434 (-0.667)
-0.00987 (-1.385)
-0.0118 (-1.970*)
-0.0144 (-2.218**)
-0.0312 (-2.402**)
-0.0205 (0.494)
Real GDP per capita
-0.00000204 (-3.902***)
-0.00000295 (-4.019***)
-0.00000267(-5.497***)
-0.00000312 (-4.769***)
-0.00000305 (-5.206***)
-0.00000134 (-1.442)
Secondary education
0.00745 (2.2411**)
0.00806 (2.468**)
0.00582 (1.989*)
0.00627 (2.122**)
0.00651 (2.247**)
0.00658 (2.269**)
Investment share
0.172 (4.407***)
0.159 (3.727***)
0.162 (4.344***)
0.156 (4.113***)
0.147 (3.942***)
0.144 (3.771***)
Rule of law
0.00180 (0.680)
0.00408 (1.723*)
0.00311 (1.446)
Legal system
0.00479 (2.084**)
Trust
0.0566 (3.780***)
0.0527 (3.415***)
0.0502 (2.886***)
0.0545 (3.704***)
Trust*GDP
-0.00000342 (-1.669)
Trust*Legal system
-0.00824 (-1.019)
Method
OLS
OLS
OLS
OLS
OLS
OLS
Adjusted R²
0.336
0.366
0.496
0.497
0.523
0.517
N
46
46
46
46
46
46
Note: White’s t-statistics in parenthesis. *, ** and *** denote significance at the 10%, 5% and 1% level respectively.
regressions for analysing the impact of trust on growth. At this point, the consequences of an
incomplete specification of the growth regression, expressing that some growth affecting
variables are omitted, should be outlined. Excluding relevant variables causes a bias of the
remaining estimators. Taking this problem seriously, section 5.1.2 presents a sensitivity
analysis for variations in the set of included variables.
Regression 3 illustrates the effect of trust on growth. The expected positive
relationship holds, whereas a one-standard-deviation increase in the level of trust (by 16.02%)
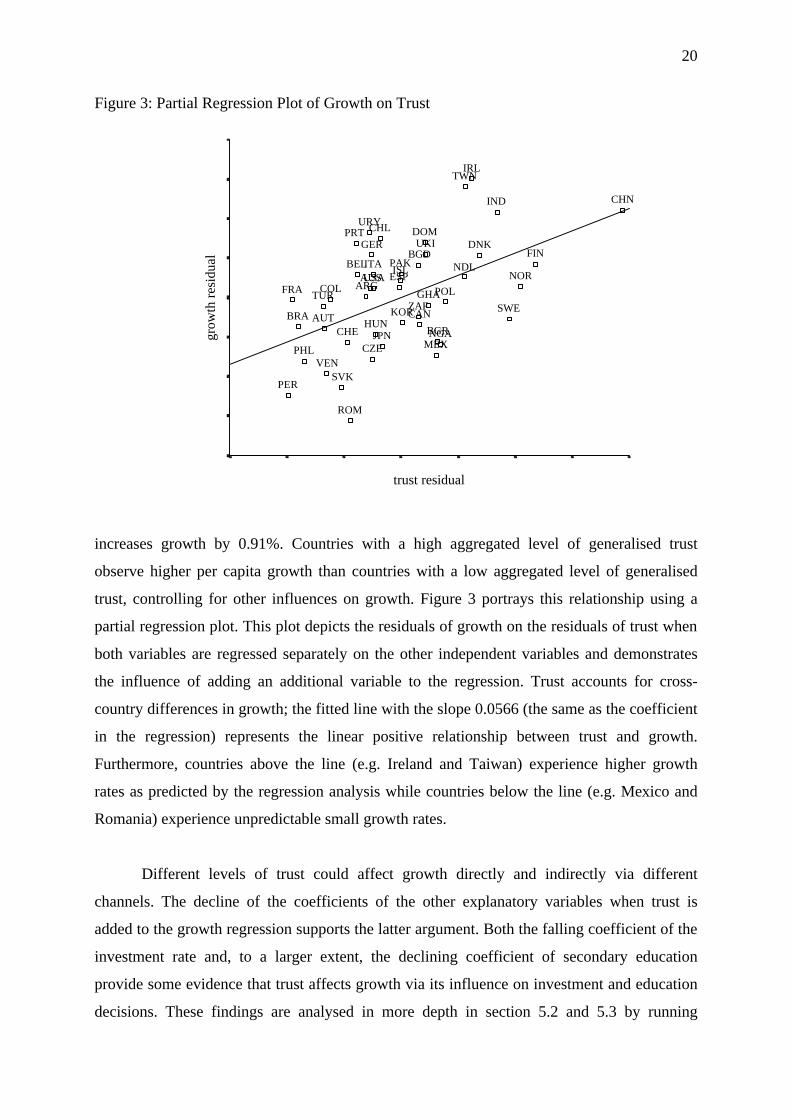
20
Figure 3: Partial Regression Plot of Growth on Trust
trust residual
grow
th re
sidu
al
VEN
USA
URY
UKI
TUR
TWN
CHE
SWE
ESP
KORZAF
SVK
ROM
PRT
POL
PHL
PER
PAKNOR
NGA
NDL
MEXJPN
ITA
IRL
IND
ISL
HUN
GHA
GER
FRA
FIN
DOMDNK
CZE
COL
CHN
CHL
CAN
BGRBRA
BELBGD
AUT
AUSARG
increases growth by 0.91%. Countries with a high aggregated level of generalised trust
observe higher per capita growth than countries with a low aggregated level of generalised
trust, controlling for other influences on growth. Figure 3 portrays this relationship using a
partial regression plot. This plot depicts the residuals of growth on the residuals of trust when
both variables are regressed separately on the other independent variables and demonstrates
the influence of adding an additional variable to the regression. Trust accounts for cross-
country differences in growth; the fitted line with the slope 0.0566 (the same as the coefficient
in the regression) represents the linear positive relationship between trust and growth.
Furthermore, countries above the line (e.g. Ireland and Taiwan) experience higher growth
rates as predicted by the regression analysis while countries below the line (e.g. Mexico and
Romania) experience unpredictable small growth rates.
Different levels of trust could affect growth directly and indirectly via different
channels. The decline of the coefficients of the other explanatory variables when trust is
added to the growth regression supports the latter argument. Both the falling coefficient of the
investment rate and, to a larger extent, the declining coefficient of secondary education
provide some evidence that trust affects growth via its influence on investment and education
decisions. These findings are analysed in more depth in section 5.2 and 5.3 by running
21
separate regressions of trust on investment and education. Including trust also lowers the
coefficient of the rule of law index that loses its significance for growth (regression 4). The
high simple correlation coefficient of 63.91% supports the idea that both variables are
strongly linked. On the one hand, trust could encourage the maintenance of the rule of law
while on the other hand, sound institutions could create a higher level of trust. Addressing the
question of whether both institutions reinforce each other or whether each form tends to
displace the other, regression 5 contains an interaction term between trust and the legal
system index (expressed as a deviation from the sample mean to make the result more
interpretable).8 A negative sign on the interaction term indicates a lower effect of trust on
growth in stable institutional settings, whereas a positive one makes trust more important
where formal institutions exist. Knack and Keefer (1997) find strong evidence for the former
argument, stating that trust can work as a substitute for poor formal institutions, raising its
importance in countries where such a poor institutional environment prevails (Knack and
Keefer 1997, p.1248). In contrast, Fukuyama (1995) argues that trust accounts for the superior
performance of institutions. Regression 5 shows that the interaction term is not significant at
the conventional levels, finding no support for the hypothesis that trust plays a greater role in
countries where stable institutional structures are missing. Only a sound formal institutional
system together with trust operates efficiently and so promotes growth.
For an investigation of whether trust plays the same role in high-income countries as
in low-income countries, regression 6 includes an interaction term between per capita GDP
and trust (centred around the mean). A positive value of the coefficient of the interaction term
implies that the higher the income, the greater the effect of trust on growth, whereas a
negative one shows trust to be more important for growth in low-income countries. According
to Putnam (1993), “the importance of social capital […] increases as economic development
proceeds” (Putnam 1993, p.178) because richer countries normally have more complex
transaction environments. In contrast, Knack and Keefer (1997) argue that low-income
countries benefit because trust replaces missing formal institutions (Knack and Keefer 1997,
p.1248). Regression 6 shows that the coefficient of the interaction term is not significant at
the conventional levels. Both the importance of trust in a more complex transaction
environment and the possibility that trust replaces a poor institutional environment play a role.
8 The legal system index replaces the rule of law index for two reasons. First, the index of the legal system is measured on the metric scale rather than on the ordinal scale and so better discriminates between differences in the formal institutional system. Second, it remains marginally significant (at the 10% significance level) in the growth regression including trust.

22
In summary, the basic regression analysis strongly confirms that trust affects growth
both directly and indirectly through different channels that themselves are growth enhancing.
No evidence is found for different consequences of trust in low-income and high-income
countries.
4.1.3 Sensitivity Analysis
Levine and Renelt (1992) question the findings derived from including the variable of interest
in a simple growth regression to analyse the relationship between this variable and growth.
The estimation result highly depends on the specification of the set of conditioning variables
that are controlled for. Alterations in the set of conditioning variables may lead to different
outcomes and so cast doubt on the robustness of the estimation result. The Extreme Bounds
Analysis (EBA) first described by Leamer (1985) and extensively applied by Levine and
Renelt (1992) and Sala-I-Martin (1997) provides an effective instrument for examining the
robustness of the relationship between the variable of interest and growth for a changing set
of conditioning variables. EBA employs a series of regressions j of the form
Yj = βijI + βmjM + βzjZ + ∈j (1)
where Y denotes per capita GDP growth, I stands for a set of variables that are always
included in a regression (including a constant), M is the variable of interest and Z is a subset
of conditioning variables from the pool of all variables that have an effect on growth. The
purpose of EBA is to analyse the consequences of a change in the set of conditioning
variables for the effect of M on Y. For this purpose an upper extreme bound, the maximum
value of βmj plus two standard deviations, and a lower extreme bound, the minimum value of
βmj minus two standard deviations, are calculated. Variable M is robust if both extreme
bounds are significant and of the same sign. This condition implies that variable M is
significant (at the 5% significance level) and of the same sign in all regressions independent
of the included set of conditioning variables (Sala-I-Martin 1997, p.178). If the coefficient
does not remain significant or changes sign, variable M is regarded as fragile.
To examine the robustness of the relationship between trust and growth using EBA,
the initial level of GDP, the average years of secondary education and the investment share
are included as fixed variables in equation (1). These are those variables that proved to be

23
robust in Levine and Renelt (1992)9 and that were already included in the basic growth
regression. The set of conditioning variables consists of the ratio of total government
expenditures to GDP (showing the size of the government), the ratio of government
consumption expenditures to GDP and the black market premium (representing government
distortions of markets); exports and imports as a percentage of GDP (indicating the openness
of a country), exports as a percentage of GDP and the growth rate of the terms of trade;
inflation of the GDP deflator, the ratio of money and quasi-money to GDP (as a liquidity
indicator) and the growth rate of domestic credit; the rule of law index, an index of political
instability and an index of civil liberties and political rights; and finally the population growth
rate (for details see appendix B and C). Still, these variables represent only a small fraction of
all variables previously incorporated into growth regressions. Referring to Levine and Renelt
(1992) and Sala-I-Martin (1997), these variables enter as a set of exactly three variables in
equation (1) leading to a total number of 286 different regressions.10
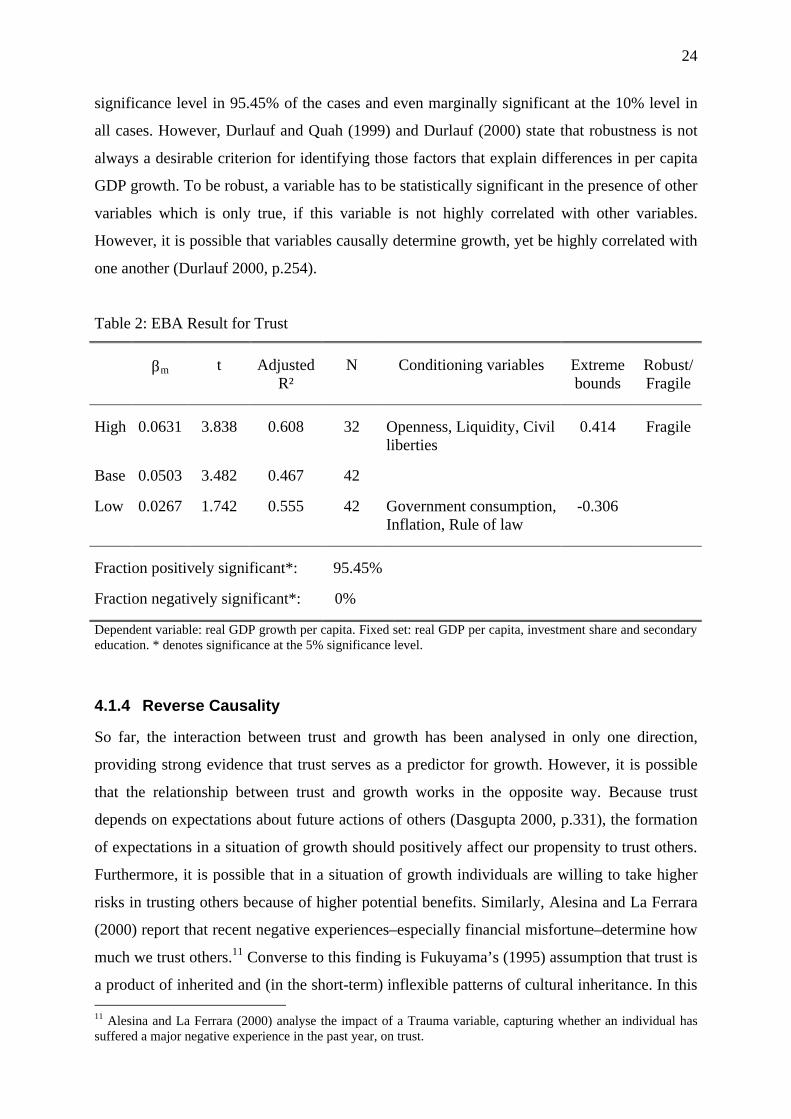
Table 2 reports the EBA test for trust for the period 1985-1999. Although trust is
positively related to growth in all regressions and significant at the 5% significance level in
95.45% of the cases, the EBA test labels trust as not robust. Taking a closer look at the
regressions where trust fails to be significant shows that inflation belongs to the set of
conditioning variables in all but one of them. In fact, trust and inflation correlate at –58.15%
indicating that both variables exhibit some of the same characteristics. Taking into account
the fact that trust is built upon expectations about the behaviour of others (Dasgupta 2000,
p.331), a possible explanation might be that a continuing increase of the price level causes the
overall level of trust in a society to fall and so reduces the faith people put in each other. In
this case, the average annual rate of inflation serves as a good proxy for a broader concept of
trust in a country making the WVS trust variable only marginally significant in some of the
regressions.
Sala-I-Martin (1997) criticises the EBA, commenting that it “is too strong for any
variable to pass it” (Sala-I-Martin 1997, p.179). In fact, none of the several variables (other
than initial GDP, the investment share and secondary education) tested in Levine and Renelt
(1992) proved to be robust for per capita GDP growth. Hence, although trust fails the EBA
test of robustness, the series of regressions shows that it still acts as a reliable variable in
explaining cross-country differences in per capita GDP growth. Trust is significant at the 5% 9 The average years of secondary education replace the secondary-school enrolment ratio. 10
nCk (13,3) = n! / (n – k)! k! = 13! / (13-3)! 3! = 286.
24
significance level in 95.45% of the cases and even marginally significant at the 10% level in
all cases. However, Durlauf and Quah (1999) and Durlauf (2000) state that robustness is not
always a desirable criterion for identifying those factors that explain differences in per capita
GDP growth. To be robust, a variable has to be statistically significant in the presence of other
variables which is only true, if this variable is not highly correlated with other variables.
However, it is possible that variables causally determine growth, yet be highly correlated with
one another (Durlauf 2000, p.254).
Table 2: EBA Result for Trust
βm
t
Adjusted R²
N
Conditioning variables
Extreme bounds
Robust/ Fragile
High
0.0631
3.838
0.608
32
Openness, Liquidity, Civil liberties
0.414
Fragile
Base
0.0503
3.482
0.467
42
Low
0.0267
1.742
0.555
42
Government consumption, Inflation, Rule of law
-0.306
Fraction positively significant*:
95.45%
Fraction negatively significant*:
0%
Dependent variable: real GDP growth per capita. Fixed set: real GDP per capita, investment share and secondary education. * denotes significance at the 5% significance level.
4.1.4 Reverse Causality
So far, the interaction between trust and growth has been analysed in only one direction,
providing strong evidence that trust serves as a predictor for growth. However, it is possible
that the relationship between trust and growth works in the opposite way. Because trust
depends on expectations about future actions of others (Dasgupta 2000, p.331), the formation
of expectations in a situation of growth should positively affect our propensity to trust others.
Furthermore, it is possible that in a situation of growth individuals are willing to take higher
risks in trusting others because of higher potential benefits. Similarly, Alesina and La Ferrara
(2000) report that recent negative experiences–especially financial misfortune–determine how
much we trust others.11 Converse to this finding is Fukuyama’s (1995) assumption that trust is
a product of inherited and (in the short-term) inflexible patterns of cultural inheritance. In this 11 Alesina and La Ferrara (2000) analyse the impact of a Trauma variable, capturing whether an individual has suffered a major negative experience in the past year, on trust.
25
context, Helliwell (1996b) shows that the level of trust is strongly persistent over time by
evaluating the effect of origin on trust across regions in the United States and Canada.
Minnesota, where the population is of Norwegian origin, and Quebec, where the population
originates from France, display exceptionally high and low levels of trust.12 Calculating the
simple correlation coefficient of trust in 1990 and 1995 for those countries of the sample
where both values are available leads to a correlation of 94.78% indeed indicating that trust is
stable over time.
Regressions 1 and 2 of table 3 show the regression results of trust on growth,
controlling for per capita GDP and secondary education. In general, the determinants of trust
can be evaluated only on the individual level because individual decisions count for the
aggregated trust variable.13 However, per capita GDP can be interpreted as a proxy for
individual income, secondary education stands for the individual’s own education and growth
affects individual decision making. In this setting, growth functions as a significant variable
for trust. Such a reverse regression illustrates that trust is not completely independent of
growth. If trust and growth are jointly determined, these variables have to be treated as
endogenous within the model. Trust can no longer function as an explanatory variable for
growth in an OLS estimation because the underlying assumption that the explanatory variable
is uncorrelated with the error term no longer holds. The effect of the error term on growth
would be interpreted as an effect of trust on growth.
A solution is to find a good proxy for trust that is highly correlated with this variable
but uncorrelated with the error term to use as an instrument in a 2SLS estimation.14 Alesina
and La Ferrara (2000) verify that the ethnic heterogeneity of a country is a determinant of
trust making it a potential instrument.15 Alesina et al. (2003) provide a new measure of ethnic
heterogeneity that relies mainly on the ethnic fractionalisation of a country rather than on
ethnolinguistic distinctions obscuring other aspects of ethnicity. The data are taken from
12 In Minnesota, the level of trust is 21% higher than the national average and in Quebec 18% lower than in all of Canada. 13 See Alesina and La Ferrara (2000) and Glaeser et al. (2000a) for an analysis of the sources of trust on the micro level. 14 2SLS uses the instrumental variable to compute an estimated value of the endogenous variable and then estimates a linear regression model using this computed value. 15 Several authors use an index of ethnic heterogeneity, mainly based on data from the Atlas Narodov Mira of 1964, as an instrumental variable for social capital variables. See Mauro (!995), Knack and Keefer (1997) and Easterly and Levine (1997) beyond others.
26
Table 3: 2SLS Growth Regressions
Dependent Variable
Trust
Real GDP growth per capita
Regression
1
2
3
4
Constant
0.151 (3.977***)
0.0963 (2.560**)
0.0153 (1.446)
-0.0236 (-1.065)
Real GDP per capita
0.0000118 (2.744***)
0.0000162 (3.988***)
-0.00000143 (-2.220**)
-0.00000398 (-2.534**)
Secondary Education
0.0132 (1.077)
-0.00478 (-0.171)
0.00964 (2.483**)
0.000297 (0.380)
Investment Share
0.219 (0.276)
0.0382 (0.284)
Real GDP growth per capita
3.563 (3.408***)
Trust
0.238 (1.875*)
Method
OLS
OLS
2SLS
2SLS
Adjusted R²
0.391
0.512
-
-
N
46
46
43
43
Note: White’s t-statistics in parenthesis. *, ** and *** denote significance at the 10%, 5% and 1% level respectively. The adjusted R² is not an appropriate measure of goodness of fit in a 2 SLS regression.
multiple sources covering different time periods (from 1981 for Peru to 2001 for Austria).16
Ethnic fractionalisation is defined as “the probability that two randomly selected individuals
from a population belonged to different groups” (Alesina et al. 2003, p.5). Therefore, a higher
index of ethnic fractionalisation indicates a more fragmented country. Ethnic fractionalisation
and trust have a simple correlation coefficient of –37.80% (significant at the 5% significance
level). The high correlation becomes reasonable considering that observable characteristics
like race, language or a common background might shape expectations about the behaviour of
others before their actual behaviour can be detected. Nevertheless, the relationship is far from
perfect. Canada, for example, scores very high on the index of ethnic fractionalisation with
0.71 but also has a high trust environment with a value of 0.53. Furthermore, the assumption
that the extent to which countries are fractionalised is exogenous and uncorrelated with the 16 The equivalence of the time periods of the index of ethnic fractionalisation and the cross-country growth regression is an advantage for assuming exogeneity.
27
error term and hence to all omitted growth determinants is very strong. For example, ethnic
heterogeneity could influence political stability and the amount of civil liberties and political
rights and therefore is no longer uncorrelated with the error term. However, Alesina et al.
(2003) note that the violation of exogeneity becomes severe only in the long-run perspective
(Alesina et al. 2003, p.7).
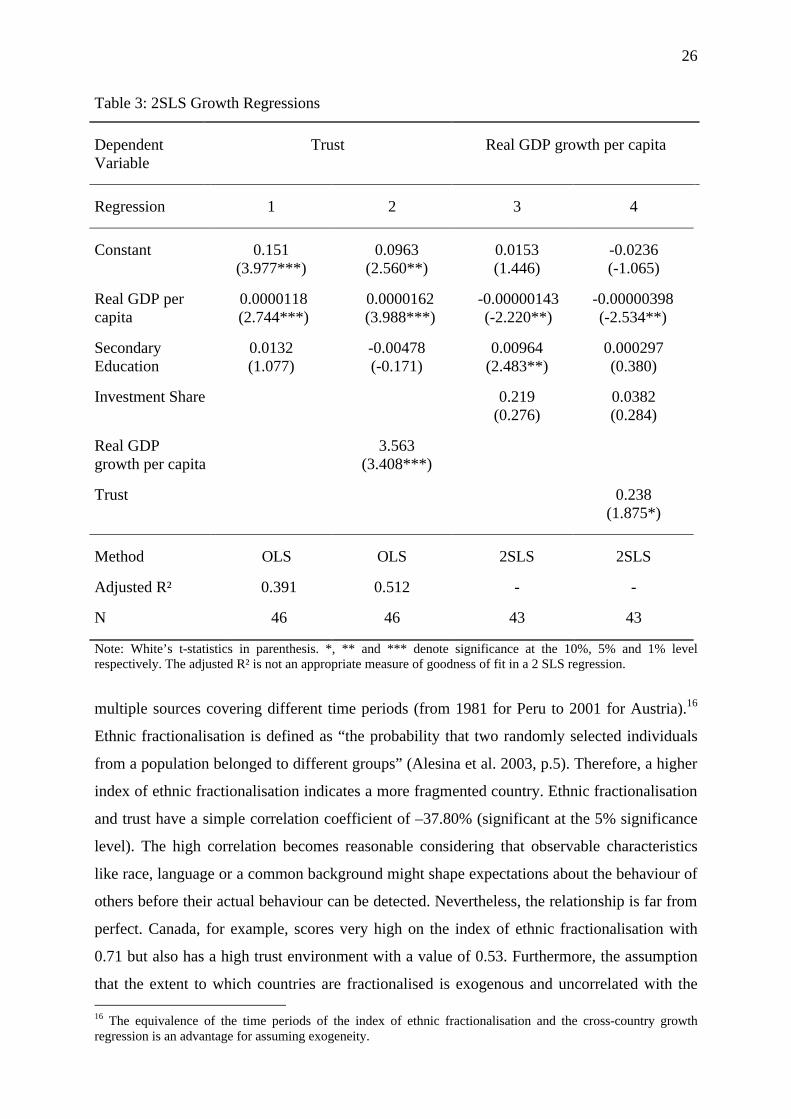
Regression 4 of table 3 shows the result for a 2SLS estimation using lagged values as
instruments for per capita GDP and the investment ratio and ethnology as an instrument for
trust. Trust, significant at the 10% significance level, remains positively related to growth,
whereas a one-standard-deviation increase in trust (by 16.51%) raises the growth rate by
3.39%. Hence, the 2SLS estimation confirms that trust actually causes growth, correcting for
the reverse effect of growth on trust. Taking a closer look at the other explanatory variables,
per capita GDP remains a significant predictor of growth, whereas a one-standard-deviation
increase in income (US$6841.91) depresses the growth rate by 2.72%. Secondary education
and the investment share are no longer significantly related to growth at the conventional
levels. In the case of education, this is caused mainly by the effect of trust on secondary
education. An exclusion of trust leads to a significant coefficient of secondary education,
whereas a one-standard-deviation change in education (by 1.01 years) raises growth by 0.98%
(regression 3). The investment ratio stays insignificant when trust is excluded. This result
suggests that the main reason for the strong relationship between investment and growth in an
OLS estimation reflects the effect of growth on investment rather than that of investment on
growth. Barro (1991) and Barro and Sala-I-Martin (1995) obtain similar results and provide
two possible explanations. On the one hand, investment is not totally exogenous in the sense
that it depends on the marginal return on investment related to growth. On the other hand,
total investment includes private and public investment but only the former is associated with
growth, making the latter a disturbing influence.17
Concisely, the 2SLS estimation strengthens the finding that trust actually causes
growth. The reverse impact of growth on trust is multifaceted. In the very long term, growth
certainly impacts trust as it is achieved by an increase of the level of income, the formal
institutional system and other aspects of economic development that affect the level of trust.
In the short term, trust is very stable and rather unaffected by growth. Recent negative
experiences on the individual level “are forgotten very quickly” (Alesina and La Ferrara 2000, 17 Barro and Sala-I-Martin (1995) carried out separate 2SLS estimations for private and public investment; however, the results do not vary significantly (Barro and Sala-I-Martin 1995, p.441).
28
p.9) and hence should not affect the aggregate level of trust in a country. Still, an ongoing
low-growth situation will create lower levels of trust by affecting income and other aspects of
economic development.
4.2 Trust and Investment
Several authors assess the importance of trust on the basis of its impact on investment
decisions. Knack and Keefer (1997) report that physical capital accumulation is one of the
most important channels through which trust influences growth and economic performance
(Knack and Keefer 1997, p.1263). This section evaluates the relationship between trust and
investment in physical capital. Investment is an important determinant of growth both in the
neoclassical growth model and in endogenous growth theories. However, the insignificance of
investment in the 2SLS estimation in the previous section revealed that higher investment
does not automatically induce higher growth. Therefore, this section addresses two aspects of
the impact of trust on investment: first, the influence of trust on the total amount of
investment and second and more important, the meaning of trust for the efficiency of
investment decisions.
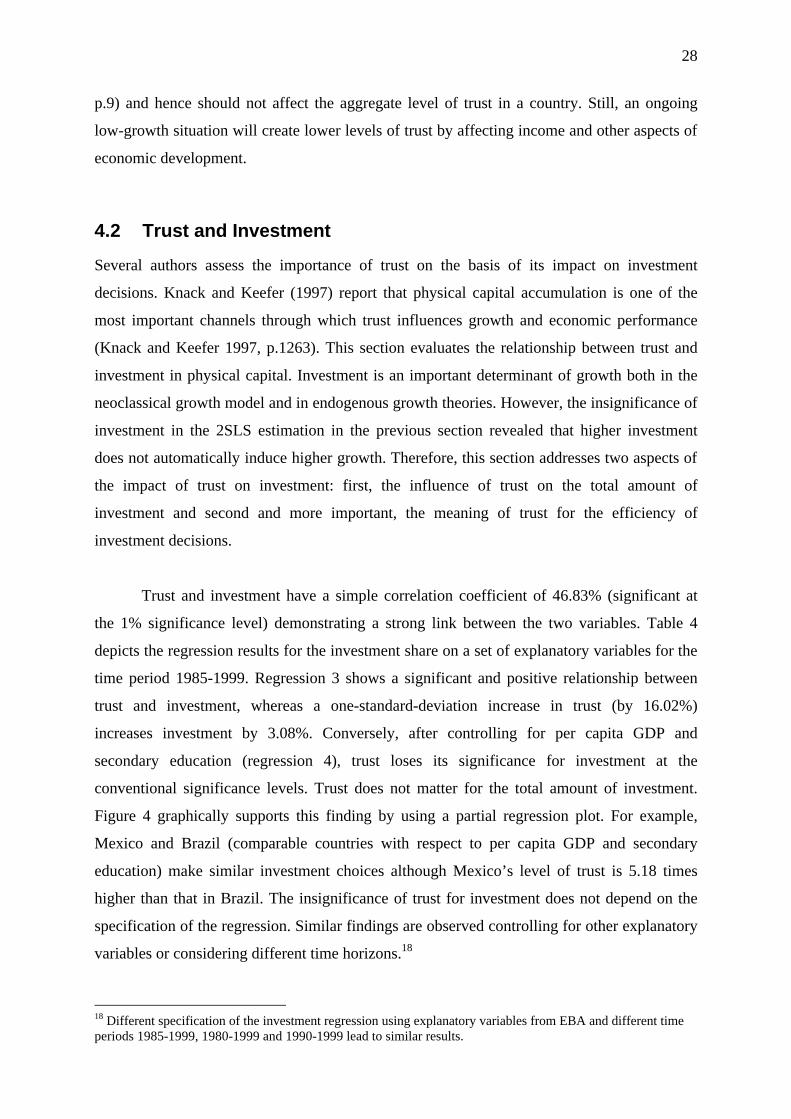
Trust and investment have a simple correlation coefficient of 46.83% (significant at
the 1% significance level) demonstrating a strong link between the two variables. Table 4
depicts the regression results for the investment share on a set of explanatory variables for the
time period 1985-1999. Regression 3 shows a significant and positive relationship between
trust and investment, whereas a one-standard-deviation increase in trust (by 16.02%)
increases investment by 3.08%. Conversely, after controlling for per capita GDP and
secondary education (regression 4), trust loses its significance for investment at the
conventional significance levels. Trust does not matter for the total amount of investment.
Figure 4 graphically supports this finding by using a partial regression plot. For example,
Mexico and Brazil (comparable countries with respect to per capita GDP and secondary
education) make similar investment choices although Mexico’s level of trust is 5.18 times
higher than that in Brazil. The insignificance of trust for investment does not depend on the
specification of the regression. Similar findings are observed controlling for other explanatory
variables or considering different time horizons.18
18 Different specification of the investment regression using explanatory variables from EBA and different time periods 1985-1999, 1980-1999 and 1990-1999 lead to similar results.
29
Table 4: Investment Regressions
Dependent Variable
Real GDP growth per capita
Investment
Private Investment
Regression
1
2
3
4
5
6
Constant
-0.00118 (-1.970*)
0.00618 (1.190)
0.0127 (6.410***)
0.111 (6.179***)
0.0627 (2.056**)
-0.000733 (-0.023)
Real GDP per capita
-0.00000267 (-5.497***)
-0.00000195 (-3.582***)
0.00000440 (2.336**)
0.00000100 (2.903***)
0.000000512 (0.115)
Secondary education
0.00582 (1.989*)
0.00820 (2.381**)
0.0147 (1.235)
0.0169 (1.460)
0.0561 (2.632**)
Investment share
0.162 (4.344***)
Trust
0.0566 (3.780***)
0.0608 (3.408***)
0.192 (3.516***)
0.0258 (0.419)
0.0142 (0.236)
0.00173 (0.021)
Trust*GDP
-0.0000154 (-1.919*)
Method
OLS
OLS
OLS
OLS
OLS
OLS
Adjusted R²
0.496
0.281
0.202
0.409
0.445
0.441
N
46
46
46
46
46
21
Note: White’s t-statistics in parenthesis. *, ** and *** denote significance at the 10%, 5% and 1% level respectively.
Regression 5 includes an interaction term between per capita GDP and trust (centred
around the mean) exploring differences in low-income and high-income countries. A positive
value indicates that the importance of trust rises with income, whereas a negative one makes
trust more valuable for investment in low-income countries. The coefficient is marginally
significant (at the 10% significance level) providing some evidence that the lower the per
capita GDP, the higher the effect of trust on investment. In low-income countries, trust plays a
role when individuals choose the total amount of investment, for example, by substituting for
not accessible screening devices or lowering monitoring costs. Although there is only weak
support that trust affects the total amount of investment, trust could affect the efficiency of
investment decisions. The investment share of GDP measures only total investment,
aggregating different components and qualities each affecting growth differently. For
example, De Long and Summers (1991) stress the importance of equipment investment and
30
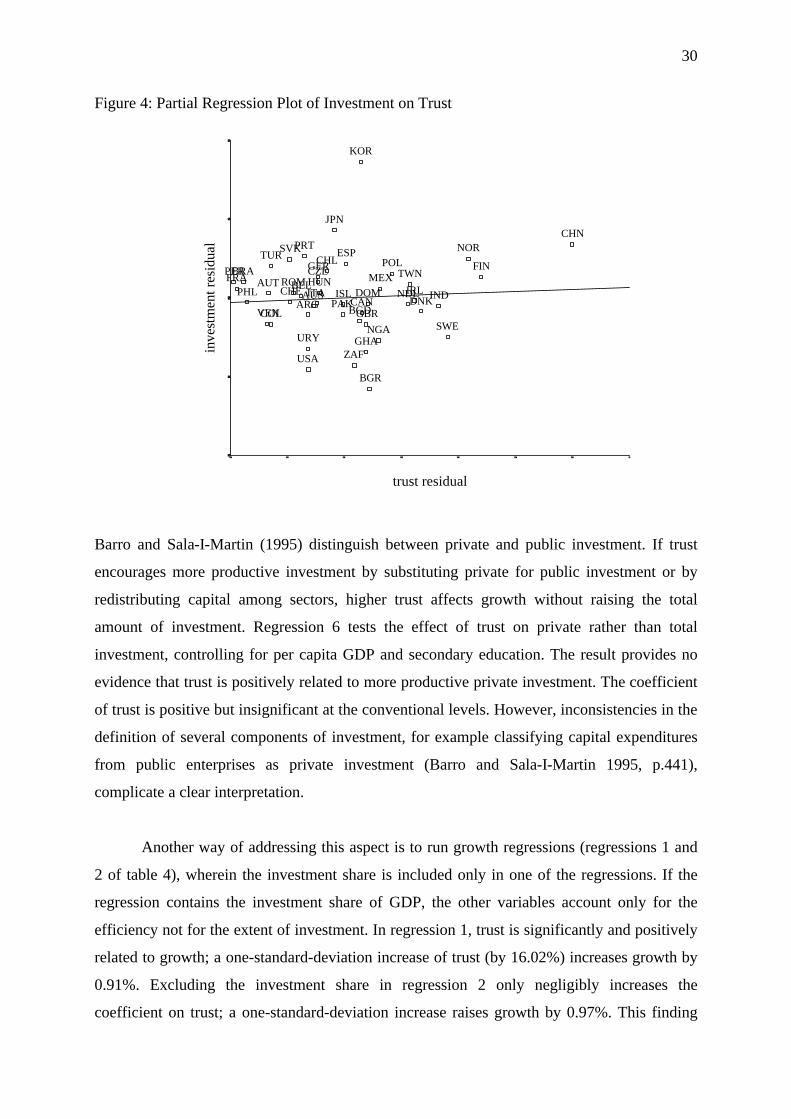
Figure 4: Partial Regression Plot of Investment on Trust
trust residual
inve
stm
ent r
esid
ual
VEN
USA
URY
GBR
TUR
TWN
CHE
SWE
ESP
KOR
ZAF
SVK
ROM
PRT
POL
PHL
PER
PAK
NOR
NGA
NDLMEX
JPN
ITA IRL INDISLHUN
GHA
GERFRA
FIN
DOMDNK
CZE
COL
CHN
CHL
CAN
BGR
BRABEL
BGD
AUTAUS
ARG
Barro and Sala-I-Martin (1995) distinguish between private and public investment. If trust
encourages more productive investment by substituting private for public investment or by
redistributing capital among sectors, higher trust affects growth without raising the total
amount of investment. Regression 6 tests the effect of trust on private rather than total
investment, controlling for per capita GDP and secondary education. The result provides no
evidence that trust is positively related to more productive private investment. The coefficient
of trust is positive but insignificant at the conventional levels. However, inconsistencies in the
definition of several components of investment, for example classifying capital expenditures
from public enterprises as private investment (Barro and Sala-I-Martin 1995, p.441),
complicate a clear interpretation.
Another way of addressing this aspect is to run growth regressions (regressions 1 and
2 of table 4), wherein the investment share is included only in one of the regressions. If the
regression contains the investment share of GDP, the other variables account only for the
efficiency not for the extent of investment. In regression 1, trust is significantly and positively
related to growth; a one-standard-deviation increase of trust (by 16.02%) increases growth by
0.91%. Excluding the investment share in regression 2 only negligibly increases the
coefficient on trust; a one-standard-deviation increase raises growth by 0.97%. This finding
31
strongly supports the hypothesis that trust affects growth by leading to efficient investment
choices rather than affecting total investment.
In summary, trust influences the decision of whether to invest or not only in low-
income countries where trust between investor and recipient replaces absent formal
institutions. In high-income countries, trust affects investment choices by reallocating funds
across sectors or technologies. This empirical finding becomes reasonable when one recalls
that trust alters the individual’s attitude towards risk. Individuals who take higher risks might
invest in future technologies where they expect high future returns on their investment. In
contrast, missing trust might determine the preference for more secure investment options. In
this context, Knack and Keefer state that in high-trust countries “people adopt more
appropriate time horizons in making investment decisions, and chose production technologies
that are optimal over the long, rather than short, run” (Knack and Keefer 1997, p.1253). This
finding is further analysed in section 4.4.
4.3 Trust and Education
This section analyses the relationship between trust and human capital, concentrating on the
accumulation of human capital through education. Human capital functions as a potential
channel through which trust affects growth and economic performance. The theoretical
framework for the relationship between human capital and growth originates from the
neoclassical growth model and endogenous growth theories. In the neoclassical growth
model, human capital, like physical capital, works as a factor in the production and
determines the steady-state level of GDP and, for a transitional period, growth. In the
endogenous growth literature, the human capital stock raises long-run growth by affecting the
innovation and implementation of new technologies (Romer 1990), the imitation and adoption
of ideas from abroad (Grossman and Helpman 1991) and the accumulation of physical capital.
Regression 1 to 6 of table 5 display the regression results for various educational
variables on trust, controlling for per capita GDP. To address reverse causality problems, the
educational variables and the initial GDP relate to the year 1990. Trust is positively related to
all secondary education variables but is significant (at the 5% significance level) only for the
percentage of individuals in the total population with a completed secondary education. In this
case, a one-standard-deviation increase of trust (by 16.14%) increases the dependent variable
32
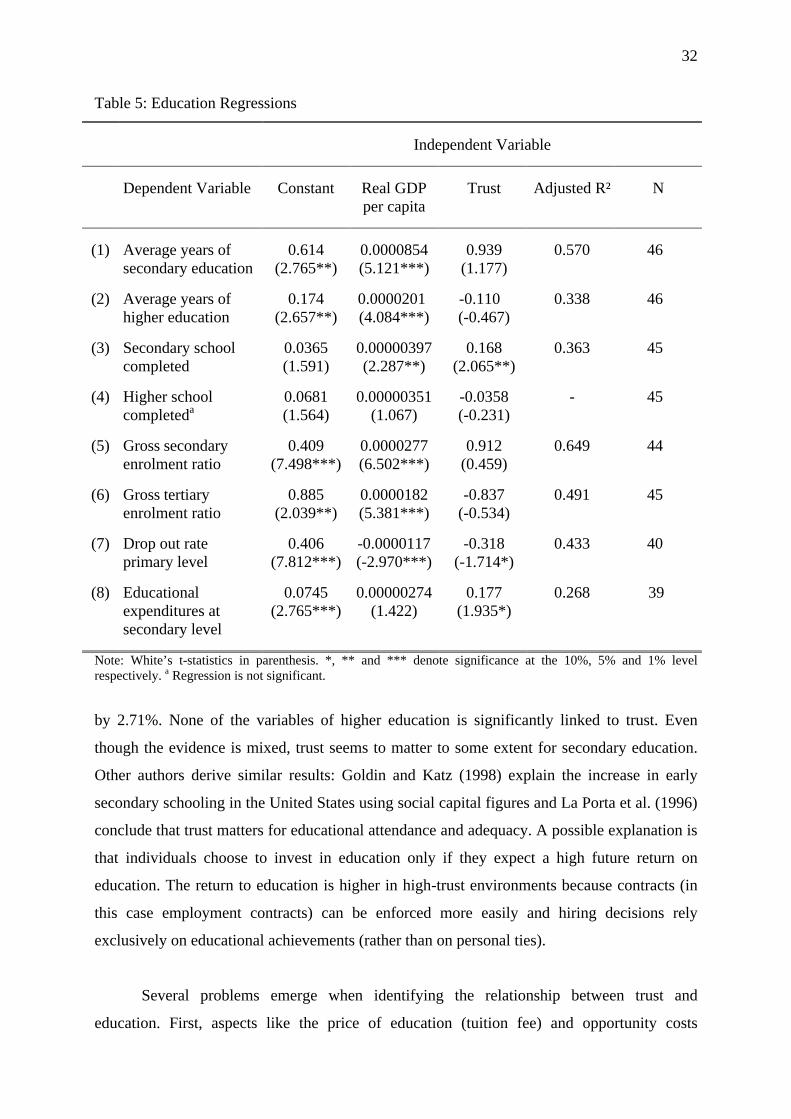
Table 5: Education Regressions
Independent Variable
Dependent Variable
Constant
Real GDP per capita
Trust
Adjusted R²
N
(1)
Average years of secondary education
0.614 (2.765**)
0.0000854 (5.121***)
0.939 (1.177)
0.570
46
(2) Average years of higher education
0.174 (2.657**)
0.0000201 (4.084***)
-0.110 (-0.467)
0.338 46
(3) Secondary school completed
0.0365 (1.591)
0.00000397 (2.287**)
0.168 (2.065**)
0.363 45
(4) Higher school completeda
0.0681 (1.564)
0.00000351 (1.067)
-0.0358 (-0.231)
- 45
(5) Gross secondary enrolment ratio
0.409 (7.498***)
0.0000277 (6.502***)
0.912 (0.459)
0.649
44
(6) Gross tertiary enrolment ratio
0.885 (2.039**)
0.0000182 (5.381***)
-0.837 (-0.534)
0.491
45
(7) Drop out rate primary level
0.406 (7.812***)
-0.0000117 (-2.970***)
-0.318 (-1.714*)
0.433 40
(8) Educational expenditures at secondary level
0.0745 (2.765***)
0.00000274 (1.422)
0.177 (1.935*)
0.268 39
Note: White’s t-statistics in parenthesis. *, ** and *** denote significance at the 10%, 5% and 1% level respectively. a Regression is not significant.
by 2.71%. None of the variables of higher education is significantly linked to trust. Even
though the evidence is mixed, trust seems to matter to some extent for secondary education.
Other authors derive similar results: Goldin and Katz (1998) explain the increase in early
secondary schooling in the United States using social capital figures and La Porta et al. (1996)
conclude that trust matters for educational attendance and adequacy. A possible explanation is
that individuals choose to invest in education only if they expect a high future return on
education. The return to education is higher in high-trust environments because contracts (in
this case employment contracts) can be enforced more easily and hiring decisions rely
exclusively on educational achievements (rather than on personal ties).
Several problems emerge when identifying the relationship between trust and
education. First, aspects like the price of education (tuition fee) and opportunity costs
33
(unemployment rate) could influence educational decisions. Second, the measurement of
education involves a variety of measurement errors. The enrolment ratio is not adjusted for
repeaters and so overstates the true level of educational accomplishment while the measure of
average years of schooling ignores changes of school duration over time (Barro and Lee 2000,
p.3). In addition to these more technical problems, the effect of trust on education could
prevail over a longer period of time. Coleman (1988) emphasises the role of social capital in
the creation of human capital in the next generation by showing that social capital inside and
outside the family encourages educational achievement and so determines the probability that
the child will drop out of school. Regression 7 tests this premise, concentrating on trust as a
form of social capital. The coefficient of trust has the expected negative sign but is only
marginally significant (at the 10% significance level), providing some evidence that trust
affects education in the long run. Furthermore, rather than influencing the extent of education,
trust could lead to higher quality in education. Addressing this hypothesis, regression 8
examines the effect of trust on the ratio of government educational expenditures per pupil at
secondary school to per capita GDP. This variable proxies for the quality of education
assuming that higher educational expenditures lead to a superior education. The regression
result shows that trust is positively related to educational expenditures (significant at the 10%
significance level). Hence, countries with higher levels of trust have higher educational
expenditures and so achieve a high-quality education. However, using test scores of students
in math, science and reading as a more direct measure of schooling quality provides no
support for the hypothesis that trust is positively linked to educational superiority.19 Finally,
only the effect from trust to education has been analysed ignoring the fact that education
could determine trust. Helliwell and Putnam (1999) find empirical evidence that increases in
individual and average education increase the return to trusting behaviour and so lead to
significant changes in trust. Similarly, Alesina and La Ferrara (2000) report that education has
a large and significant effect on trust at the individual level. If education impacts trust by
changing the return to trusting behaviour or encouraging students to behave cooperatively
(Knack and Keefer 1997, p.1270), the estimated result of trust on education might be
disrupted. However, the effect of education on trust is likely to appear only in the long-run
perspective because trust in the short run proves to be very stable.20
19 The test scores for math, science and reading are taken from the Barro and Lee data set for schooling quality. Results are not displayed in detail because none of the regressions proved to be significant. 20 Using an instrumental variable technique to test the effect of trust on education while controlling for the reverse impact of education on trust does not lead to convincing results and hence results are not shown.
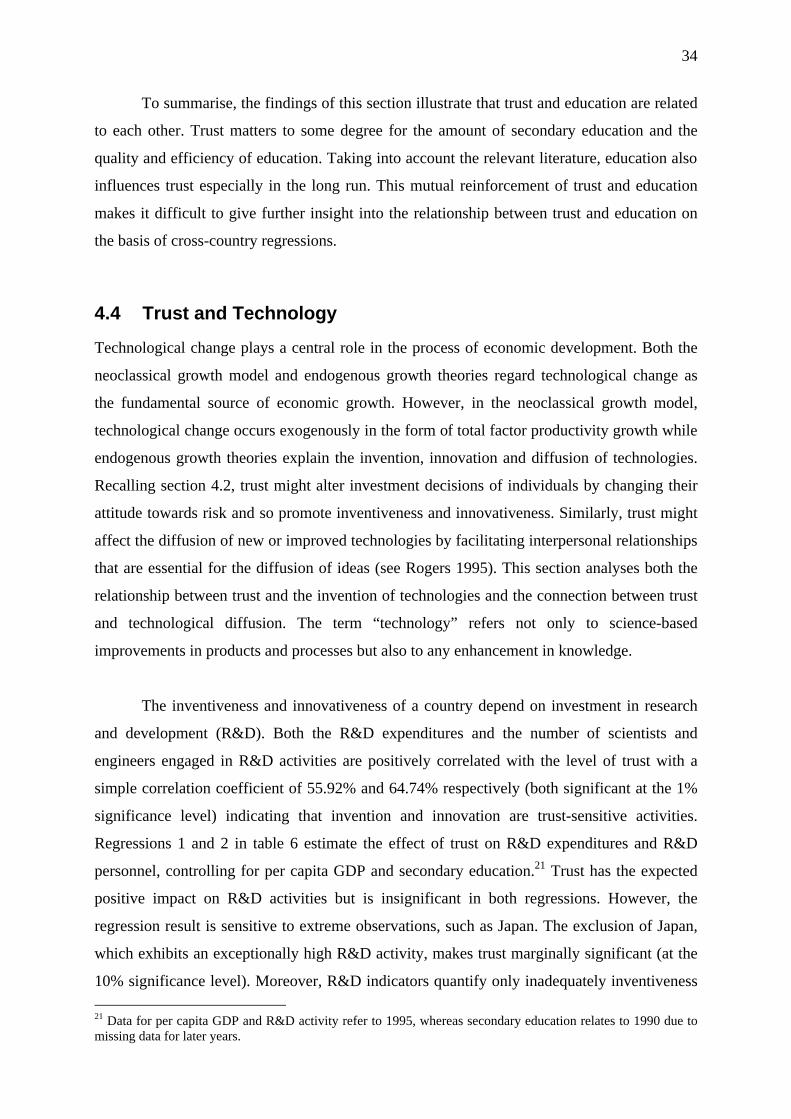
34
To summarise, the findings of this section illustrate that trust and education are related
to each other. Trust matters to some degree for the amount of secondary education and the
quality and efficiency of education. Taking into account the relevant literature, education also
influences trust especially in the long run. This mutual reinforcement of trust and education
makes it difficult to give further insight into the relationship between trust and education on
the basis of cross-country regressions.
4.4 Trust and Technology
Technological change plays a central role in the process of economic development. Both the
neoclassical growth model and endogenous growth theories regard technological change as
the fundamental source of economic growth. However, in the neoclassical growth model,
technological change occurs exogenously in the form of total factor productivity growth while
endogenous growth theories explain the invention, innovation and diffusion of technologies.
Recalling section 4.2, trust might alter investment decisions of individuals by changing their
attitude towards risk and so promote inventiveness and innovativeness. Similarly, trust might
affect the diffusion of new or improved technologies by facilitating interpersonal relationships
that are essential for the diffusion of ideas (see Rogers 1995). This section analyses both the
relationship between trust and the invention of technologies and the connection between trust
and technological diffusion. The term “technology” refers not only to science-based
improvements in products and processes but also to any enhancement in knowledge.
The inventiveness and innovativeness of a country depend on investment in research
and development (R&D). Both the R&D expenditures and the number of scientists and
engineers engaged in R&D activities are positively correlated with the level of trust with a
simple correlation coefficient of 55.92% and 64.74% respectively (both significant at the 1%
significance level) indicating that invention and innovation are trust-sensitive activities.
Regressions 1 and 2 in table 6 estimate the effect of trust on R&D expenditures and R&D
personnel, controlling for per capita GDP and secondary education.21 Trust has the expected
positive impact on R&D activities but is insignificant in both regressions. However, the
regression result is sensitive to extreme observations, such as Japan. The exclusion of Japan,
which exhibits an exceptionally high R&D activity, makes trust marginally significant (at the
10% significance level). Moreover, R&D indicators quantify only inadequately inventiveness 21 Data for per capita GDP and R&D activity refer to 1995, whereas secondary education relates to 1990 due to missing data for later years.
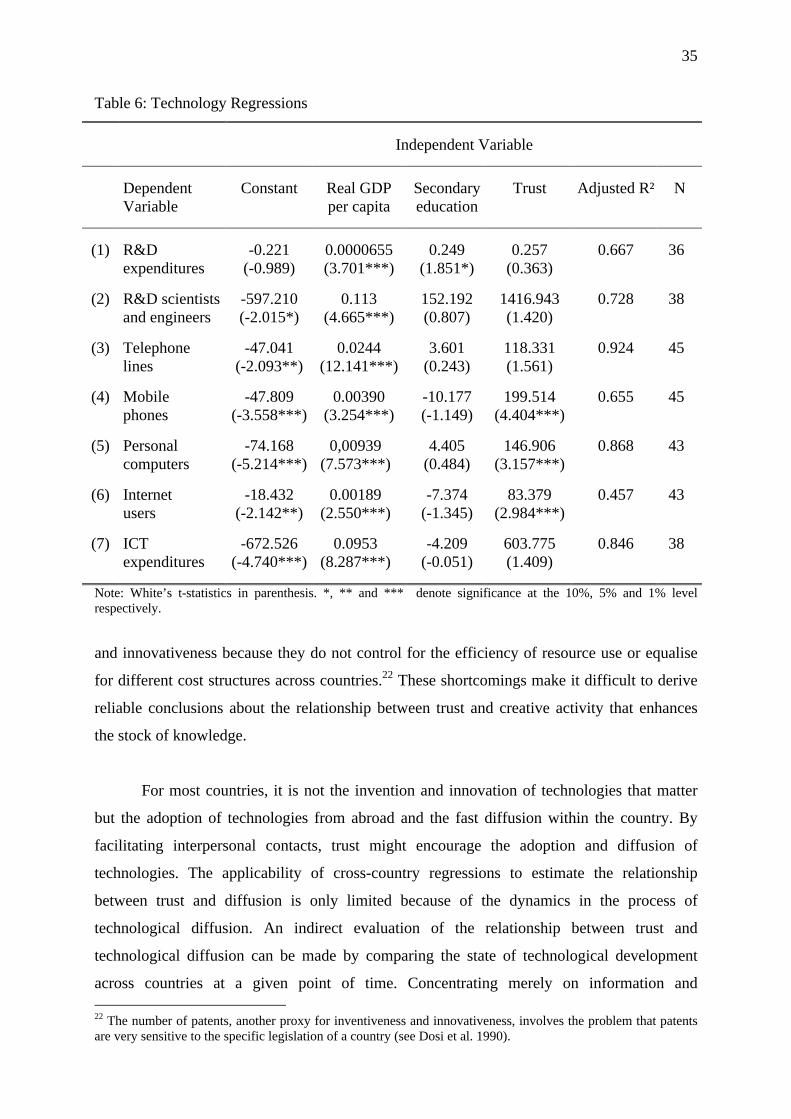
35
Table 6: Technology Regressions
Independent Variable
Dependent Variable
Constant
Real GDP per capita
Secondary education
Trust
Adjusted R²
N
(1)
R&D expenditures
-0.221 (-0.989)
0.0000655 (3.701***)
0.249 (1.851*)
0.257 (0.363)
0.667
36
(2) R&D scientists and engineers
-597.210 (-2.015*)
0.113 (4.665***)
152.192 (0.807)
1416.943 (1.420)
0.728 38
(3) Telephone lines
-47.041 (-2.093**)
0.0244 (12.141***)
3.601 (0.243)
118.331 (1.561)
0.924 45
(4) Mobile phones
-47.809 (-3.558***)
0.00390 (3.254***)
-10.177 (-1.149)
199.514 (4.404***)
0.655 45
(5) Personal computers
-74.168 (-5.214***)
0,00939 (7.573***)
4.405 (0.484)
146.906 (3.157***)
0.868 43
(6) Internet users
-18.432 (-2.142**)
0.00189 (2.550***)
-7.374 (-1.345)
83.379 (2.984***)
0.457 43
(7) ICT expenditures
-672.526 (-4.740***)
0.0953 (8.287***)
-4.209 (-0.051)
603.775 (1.409)
0.846 38
Note: White’s t-statistics in parenthesis. *, ** and *** denote significance at the 10%, 5% and 1% level respectively.
and innovativeness because they do not control for the efficiency of resource use or equalise
for different cost structures across countries.22 These shortcomings make it difficult to derive
reliable conclusions about the relationship between trust and creative activity that enhances
the stock of knowledge.
For most countries, it is not the invention and innovation of technologies that matter
but the adoption of technologies from abroad and the fast diffusion within the country. By
facilitating interpersonal contacts, trust might encourage the adoption and diffusion of
technologies. The applicability of cross-country regressions to estimate the relationship
between trust and diffusion is only limited because of the dynamics in the process of
technological diffusion. An indirect evaluation of the relationship between trust and
technological diffusion can be made by comparing the state of technological development
across countries at a given point of time. Concentrating merely on information and 22 The number of patents, another proxy for inventiveness and innovativeness, involves the problem that patents are very sensitive to the specific legislation of a country (see Dosi et al. 1990).
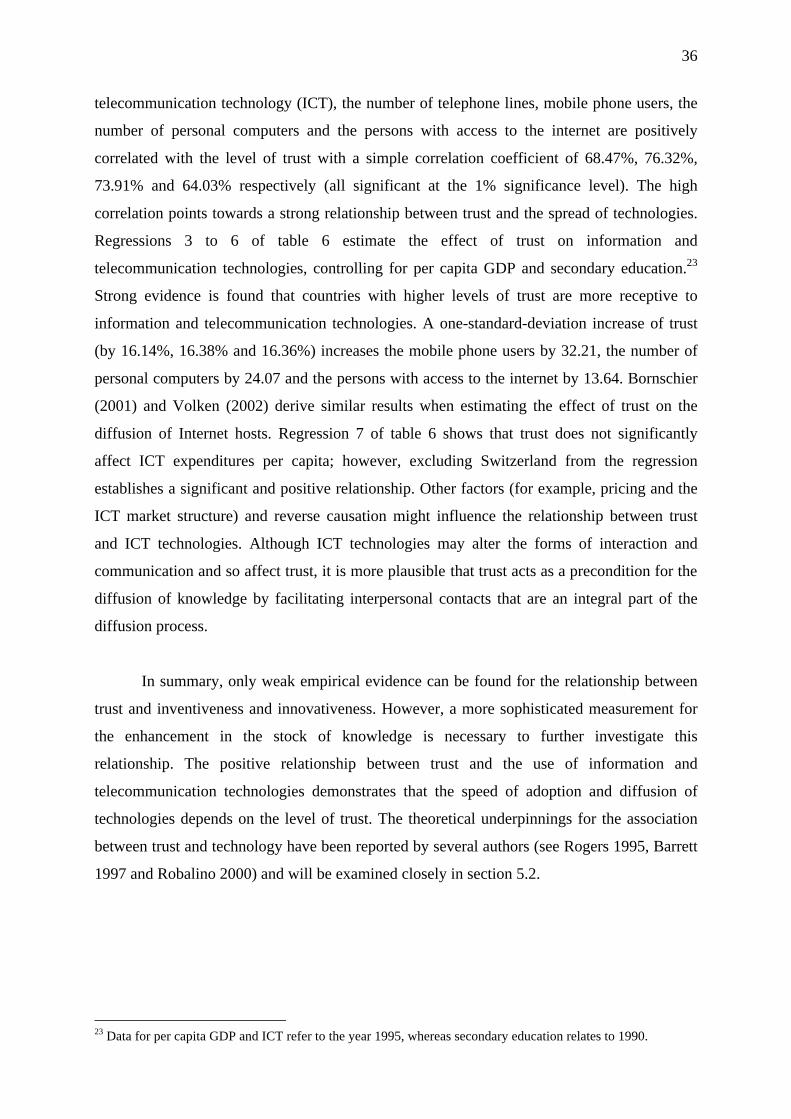
36
telecommunication technology (ICT), the number of telephone lines, mobile phone users, the
number of personal computers and the persons with access to the internet are positively
correlated with the level of trust with a simple correlation coefficient of 68.47%, 76.32%,
73.91% and 64.03% respectively (all significant at the 1% significance level). The high
correlation points towards a strong relationship between trust and the spread of technologies.
Regressions 3 to 6 of table 6 estimate the effect of trust on information and
telecommunication technologies, controlling for per capita GDP and secondary education.23
Strong evidence is found that countries with higher levels of trust are more receptive to
information and telecommunication technologies. A one-standard-deviation increase of trust
(by 16.14%, 16.38% and 16.36%) increases the mobile phone users by 32.21, the number of
personal computers by 24.07 and the persons with access to the internet by 13.64. Bornschier
(2001) and Volken (2002) derive similar results when estimating the effect of trust on the
diffusion of Internet hosts. Regression 7 of table 6 shows that trust does not significantly
affect ICT expenditures per capita; however, excluding Switzerland from the regression
establishes a significant and positive relationship. Other factors (for example, pricing and the
ICT market structure) and reverse causation might influence the relationship between trust
and ICT technologies. Although ICT technologies may alter the forms of interaction and
communication and so affect trust, it is more plausible that trust acts as a precondition for the
diffusion of knowledge by facilitating interpersonal contacts that are an integral part of the
diffusion process.
In summary, only weak empirical evidence can be found for the relationship between
trust and inventiveness and innovativeness. However, a more sophisticated measurement for
the enhancement in the stock of knowledge is necessary to further investigate this
relationship. The positive relationship between trust and the use of information and
telecommunication technologies demonstrates that the speed of adoption and diffusion of
technologies depends on the level of trust. The theoretical underpinnings for the association
between trust and technology have been reported by several authors (see Rogers 1995, Barrett
1997 and Robalino 2000) and will be examined closely in section 5.2.
23 Data for per capita GDP and ICT refer to the year 1995, whereas secondary education relates to 1990.
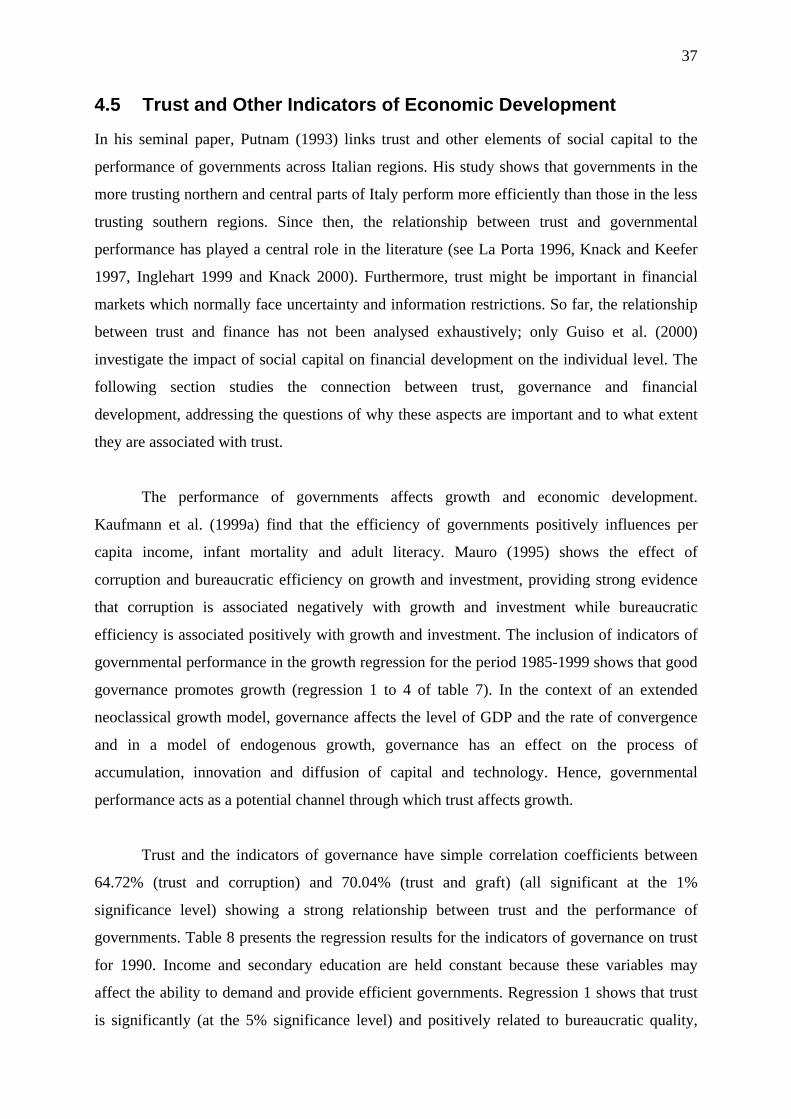
37
4.5 Trust and Other Indicators of Economic Development
In his seminal paper, Putnam (1993) links trust and other elements of social capital to the
performance of governments across Italian regions. His study shows that governments in the
more trusting northern and central parts of Italy perform more efficiently than those in the less
trusting southern regions. Since then, the relationship between trust and governmental
performance has played a central role in the literature (see La Porta 1996, Knack and Keefer
1997, Inglehart 1999 and Knack 2000). Furthermore, trust might be important in financial
markets which normally face uncertainty and information restrictions. So far, the relationship
between trust and finance has not been analysed exhaustively; only Guiso et al. (2000)
investigate the impact of social capital on financial development on the individual level. The
following section studies the connection between trust, governance and financial
development, addressing the questions of why these aspects are important and to what extent
they are associated with trust.
The performance of governments affects growth and economic development.
Kaufmann et al. (1999a) find that the efficiency of governments positively influences per
capita income, infant mortality and adult literacy. Mauro (1995) shows the effect of
corruption and bureaucratic efficiency on growth and investment, providing strong evidence
that corruption is associated negatively with growth and investment while bureaucratic
efficiency is associated positively with growth and investment. The inclusion of indicators of
governmental performance in the growth regression for the period 1985-1999 shows that good
governance promotes growth (regression 1 to 4 of table 7). In the context of an extended
neoclassical growth model, governance affects the level of GDP and the rate of convergence
and in a model of endogenous growth, governance has an effect on the process of
accumulation, innovation and diffusion of capital and technology. Hence, governmental
performance acts as a potential channel through which trust affects growth.
Trust and the indicators of governance have simple correlation coefficients between
64.72% (trust and corruption) and 70.04% (trust and graft) (all significant at the 1%
significance level) showing a strong relationship between trust and the performance of
governments. Table 8 presents the regression results for the indicators of governance on trust
for 1990. Income and secondary education are held constant because these variables may
affect the ability to demand and provide efficient governments. Regression 1 shows that trust
is significantly (at the 5% significance level) and positively related to bureaucratic quality,
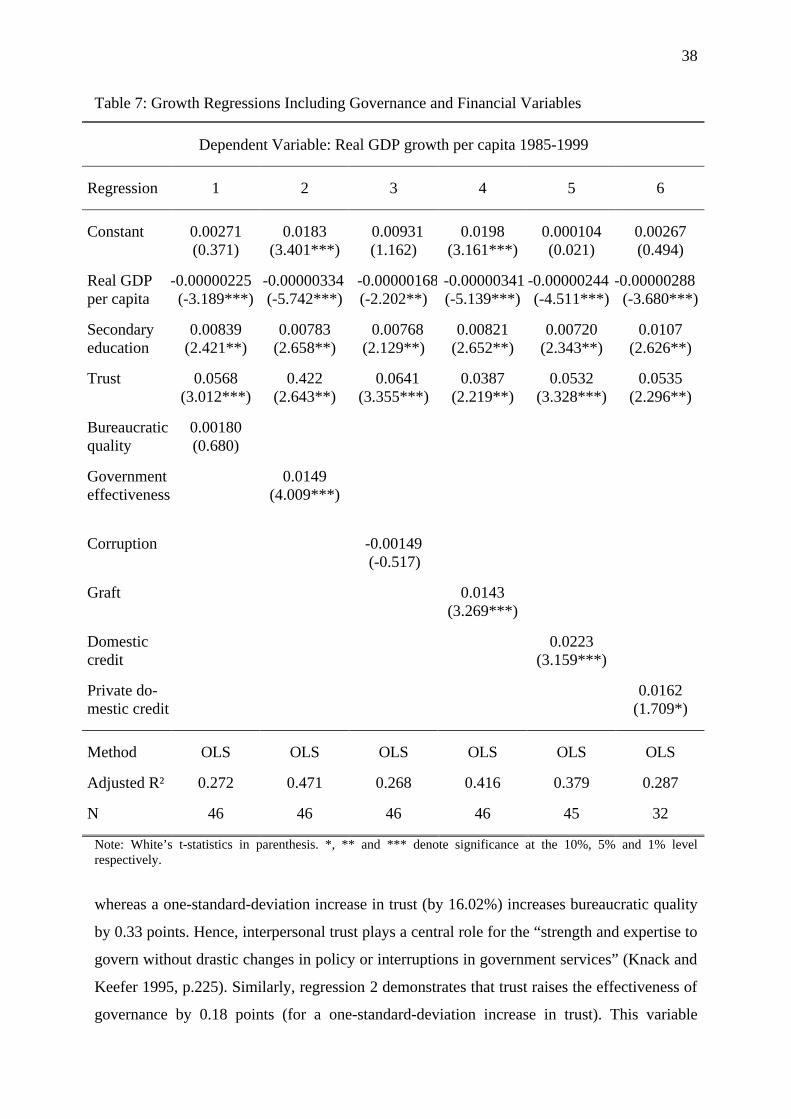
38
Table 7: Growth Regressions Including Governance and Financial Variables
Dependent Variable: Real GDP growth per capita 1985-1999
Regression
1
2
3
4
5
6
Constant
0.00271 (0.371)
0.0183 (3.401***)
0.00931 (1.162)
0.0198 (3.161***)
0.000104 (0.021)
0.00267 (0.494)
Real GDP per capita
-0.00000225 (-3.189***)
-0.00000334 (-5.742***)
-0.00000168(-2.202**)
-0.00000341 (-5.139***)
-0.00000244 (-4.511***)
-0.00000288 (-3.680***)
Secondary education
0.00839 (2.421**)
0.00783 (2.658**)
0.00768 (2.129**)
0.00821 (2.652**)
0.00720 (2.343**)
0.0107 (2.626**)
Trust
0.0568 (3.012***)
0.422 (2.643**)
0.0641 (3.355***)
0.0387 (2.219**)
0.0532 (3.328***)
0.0535 (2.296**)
Bureaucratic quality
0.00180 (0.680)
Government effectiveness
0.0149 (4.009***)
Corruption
-0.00149 (-0.517)
Graft
0.0143 (3.269***)
Domestic credit
0.0223 (3.159***)
Private do- mestic credit
0.0162 (1.709*)
Method
OLS
OLS
OLS
OLS
OLS
OLS
Adjusted R²
0.272
0.471
0.268
0.416
0.379
0.287
N
46
46
46
46
45
32
Note: White’s t-statistics in parenthesis. *, ** and *** denote significance at the 10%, 5% and 1% level respectively.
whereas a one-standard-deviation increase in trust (by 16.02%) increases bureaucratic quality
by 0.33 points. Hence, interpersonal trust plays a central role for the “strength and expertise to
govern without drastic changes in policy or interruptions in government services” (Knack and
Keefer 1995, p.225). Similarly, regression 2 demonstrates that trust raises the effectiveness of
governance by 0.18 points (for a one-standard-deviation increase in trust). This variable
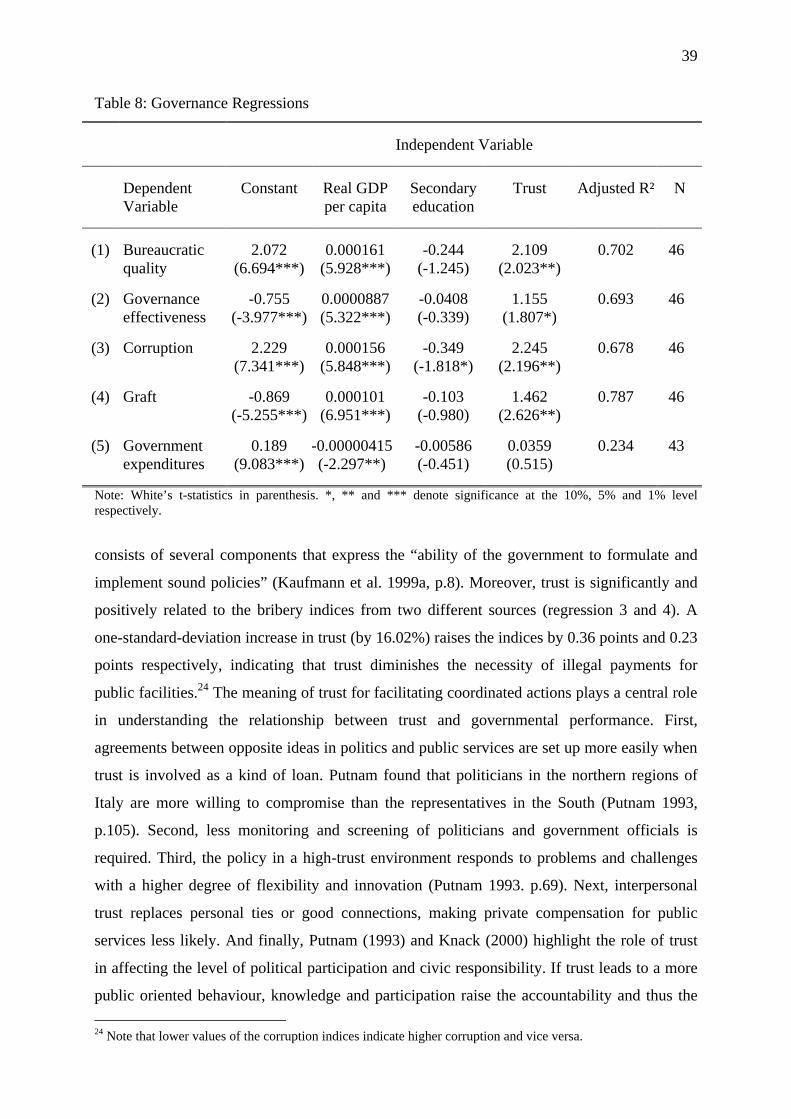
39
Table 8: Governance Regressions
Independent Variable
Dependent Variable
Constant
Real GDP per capita
Secondary education
Trust
Adjusted R²
N
(1)
Bureaucratic quality
2.072 (6.694***)
0.000161 (5.928***)
-0.244 (-1.245)
2.109 (2.023**)
0.702
46
(2) Governance effectiveness
-0.755 (-3.977***)
0.0000887 (5.322***)
-0.0408 (-0.339)
1.155 (1.807*)
0.693 46
(3) Corruption
2.229 (7.341***)
0.000156 (5.848***)
-0.349 (-1.818*)
2.245 (2.196**)
0.678 46
(4) Graft
-0.869 (-5.255***)
0.000101 (6.951***)
-0.103 (-0.980)
1.462 (2.626**)
0.787 46
(5) Government expenditures
0.189 (9.083***)
-0.00000415 (-2.297**)
-0.00586 (-0.451)
0.0359 (0.515)
0.234 43
Note: White’s t-statistics in parenthesis. *, ** and *** denote significance at the 10%, 5% and 1% level respectively.
consists of several components that express the “ability of the government to formulate and
implement sound policies” (Kaufmann et al. 1999a, p.8). Moreover, trust is significantly and
positively related to the bribery indices from two different sources (regression 3 and 4). A
one-standard-deviation increase in trust (by 16.02%) raises the indices by 0.36 points and 0.23
points respectively, indicating that trust diminishes the necessity of illegal payments for
public facilities.24 The meaning of trust for facilitating coordinated actions plays a central role
in understanding the relationship between trust and governmental performance. First,
agreements between opposite ideas in politics and public services are set up more easily when
trust is involved as a kind of loan. Putnam found that politicians in the northern regions of
Italy are more willing to compromise than the representatives in the South (Putnam 1993,
p.105). Second, less monitoring and screening of politicians and government officials is
required. Third, the policy in a high-trust environment responds to problems and challenges
with a higher degree of flexibility and innovation (Putnam 1993. p.69). Next, interpersonal
trust replaces personal ties or good connections, making private compensation for public
services less likely. And finally, Putnam (1993) and Knack (2000) highlight the role of trust
in affecting the level of political participation and civic responsibility. If trust leads to a more
public oriented behaviour, knowledge and participation raise the accountability and thus the 24 Note that lower values of the corruption indices indicate higher corruption and vice versa.
40
efficiency of officials (Knack 2000, p.3). All these interactions hold independent of the size of
governments; regression 5 shows that total government expenditures are not significantly
related to trust. Uslaner (2000) argues that trusting countries have larger governments because
they redistribute wealth, rely on public education and employ more government officials. A
counterargument is that trust prevents market failures that would oblige the government to
intervene and so limits the size of governments.
Just as trust affects governmental performance, governmental performance possibly
has an effect on trust. More efficient governments and less corrupt government officials
promote cooperative and trusting behaviour and raise the trust people put into the
government. Consequently, it is likely that both variables are mutually reinforcing: trust
encourages the efficient performance of governments which in turn promote trust. Once more,
this causality makes it difficult to further investigate the relationship between trust and
governmental performance on the basis of cross-country regressions.25
The relationship between financial markets, growth and economic development plays
a central role in the literature since Schumpeter emphasised the impact of financial
intermediaries on productivity growth and technological change (Beck et al. 1999, p.1). Since
then, many studies have thrown light on the interaction between financial development and
economic progress, for example King and Levine (1993a, 1993b), Levine (1997), Beck et al.
(1999) and Levine et al. (2000). Using the ratio of credits to GDP and the ratio of credits to
the private sector to GDP as indicators of the development of financial markets26, regressions
5 and 6 of table 7 show that these variables are significantly and positively related to growth.
Hence, well-functioning financial markets that provide substantial amounts of credits
strengthen growth.
Financial contracts are trust-sensitive transactions because they exchange money today
for a promise of a high return to the money in the future. Simple correlation coefficients of
44.91% and 47.79% (significant at the 1% significance level) between credit and trust and
private credit and trust indicate that trust is linked to financial development. Trust has an
impact on the cost of lending by reducing screening or monitoring devices and enables the
25 Using an instrumental variable technique to test the effect of trust on governmental performance while controlling for the reverse impact of governmental performance on trust does not lead to convincing results and hence results are not shown. 26 Beck et al. (1999) use private credits as percentage of GDP as indicator for financial intermediary development.
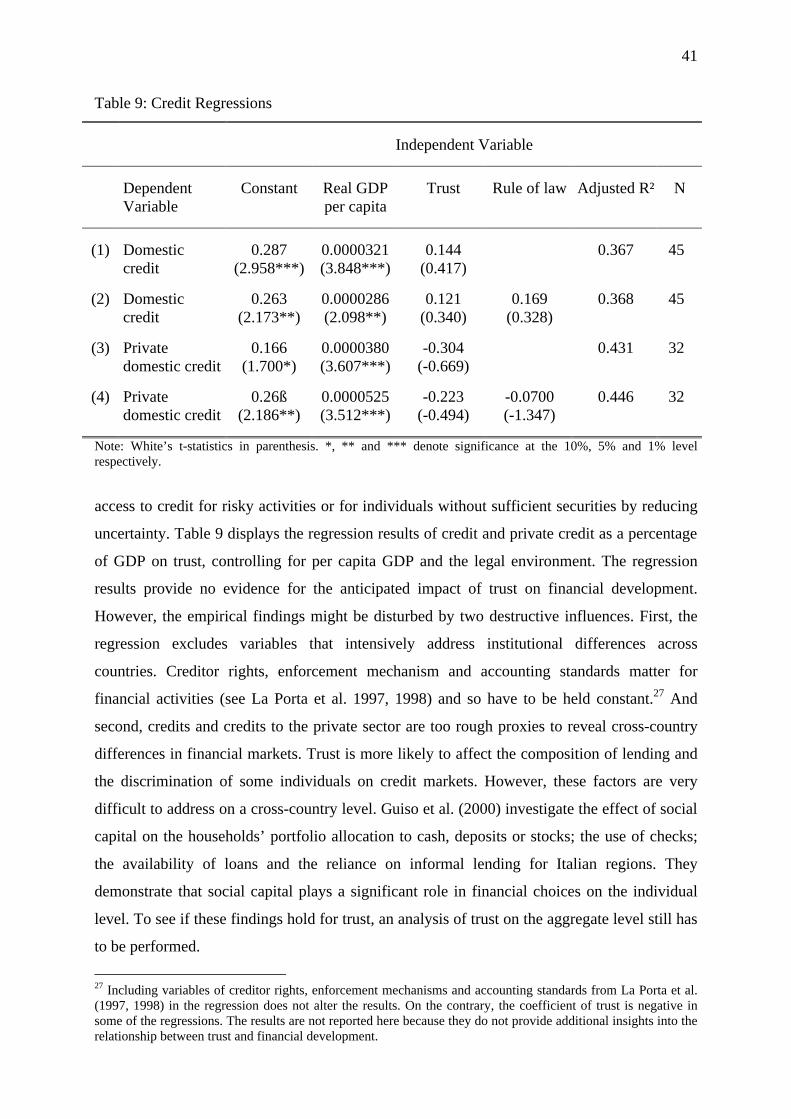
41
Table 9: Credit Regressions
Independent Variable
Dependent Variable
Constant
Real GDP per capita
Trust
Rule of law
Adjusted R²
N
(1)
Domestic credit
0.287 (2.958***)
0.0000321 (3.848***)
0.144 (0.417)
0.367
45
(2) Domestic credit
0.263 (2.173**)
0.0000286 (2.098**)
0.121 (0.340)
0.169 (0.328)
0.368 45
(3) Private domestic credit
0.166 (1.700*)
0.0000380 (3.607***)
-0.304 (-0.669)
0.431 32
(4) Private domestic credit
0.26ß (2.186**)
0.0000525 (3.512***)
-0.223 (-0.494)
-0.0700 (-1.347)
0.446 32
Note: White’s t-statistics in parenthesis. *, ** and *** denote significance at the 10%, 5% and 1% level respectively.
access to credit for risky activities or for individuals without sufficient securities by reducing
uncertainty. Table 9 displays the regression results of credit and private credit as a percentage
of GDP on trust, controlling for per capita GDP and the legal environment. The regression
results provide no evidence for the anticipated impact of trust on financial development.
However, the empirical findings might be disturbed by two destructive influences. First, the
regression excludes variables that intensively address institutional differences across
countries. Creditor rights, enforcement mechanism and accounting standards matter for
financial activities (see La Porta et al. 1997, 1998) and so have to be held constant.27 And
second, credits and credits to the private sector are too rough proxies to reveal cross-country
differences in financial markets. Trust is more likely to affect the composition of lending and
the discrimination of some individuals on credit markets. However, these factors are very
difficult to address on a cross-country level. Guiso et al. (2000) investigate the effect of social
capital on the households’ portfolio allocation to cash, deposits or stocks; the use of checks;
the availability of loans and the reliance on informal lending for Italian regions. They
demonstrate that social capital plays a significant role in financial choices on the individual
level. To see if these findings hold for trust, an analysis of trust on the aggregate level still has
to be performed.
27 Including variables of creditor rights, enforcement mechanisms and accounting standards from La Porta et al. (1997, 1998) in the regression does not alter the results. On the contrary, the coefficient of trust is negative in some of the regressions. The results are not reported here because they do not provide additional insights into the relationship between trust and financial development.
42
5 Theoretical Foundation
Although recent empirical studies emphasise the importance of trust for growth and economic
development, the theoretical foundations of this relationship attract less attention. This aspect
arises mainly from difficulties in precisely defining and quantifying trust, completely
specifying the causal structure and explaining the origin. This section aims to evaluate the
interaction between trust and economic progress from a theoretical perspective. The starting
point is the empirical findings from the previous section that are incorporated into the existing
growth theory. Thereafter, the effect of trust on growth and economic development is closely
examined. Finally, the last section focuses on the mutual reinforcement of trust and economic
progress leading to a multiple equilibrium situation, a good equilibrium and a bad equilibrium
called “poverty trap”. This section extensively builds on Barrett (1997).
5.1 Contemporary Growth Theory
The previous section demonstrates that trust has direct and indirect effects on the process of
economic development. The indirect effects influence the efficient use and, to a smaller
extent, the accumulation of physical and human capital, the efficiency of formal institutions
and governmental performance, and, apparently, the ability to invent or adopt improved
technologies. The direct effects arise, according to Barrett (1997), from influences of trust on
the total efficiency of the economy and from stimulating commerce and exchange.
The neoclassical growth model is based on a production function of the form:
y = A f(k, h) (2)
with output (y) depending on physical capital (k) and human capital (h), all expressed in per
capita terms, and technology (A). The neoclassical production function f(•) exhibits constant
returns to scale in k and h and diminishing marginal returns: f ’(•) > 0 and f ’’(•) < 0.
Exogenous unexplained technological progress transmits directly to an equal per capita output
growth. Under these properties, the introduction of trust in the neoclassical production
function becomes unfeasible. First, technological enhancement depends on the level of trust
and is no longer exogenous. Second, trust, unlike physical or human capital, is nonrivalrous in
the sense that not only the trusting person benefits from trusting behaviour but also all people
43
related to this person, thus realising economies of scale.28 The new, endogenous, growth
models incorporate technological change by regarding the stock of knowledge (A) as a
function of the entire capital, both physical and human capital:
y = A(k, h) f(k, h) (3)
Several new growth theories specify the endogenous determination of knowledge
through innovation and the implementation of improved technologies (see Romer 1990,
Grossman and Helpman 1991 and Aghion and Howitt 1992) or the adoption and imitation of
technologies (see Grossman and Helpman 1991). Because of spillover effects on knowledge,
the neoclassical assumption of diminishing returns to the input factors no longer holds. Trust
influences growth and economic development indirectly, through the effect on physical
capital, human capital and the invention or adoption of new technologies, and directly, by
encouraging exchange and efficiency:
y = A[k(t), h(t), t] f[k(t), h(t), t] + e(t) (4)
where indirect effects of trust (t) on k, h, and A and direct effects on f(•) and total efficiency
(e) are included. The efficiency parameter also captures the influences of trust on the
efficiency of formal institutions and governmental performance. Although f(•) may still have
constant returns to scale in k and h, trust permits the realisation of scale economies in
production. Obviously, this equation does not specify a formal model of endogenous growth
but rather depicts the effects of trust under theoretical considerations of an endogenous
growth model.
5.2 Direct and Indirect Effects
Beginning with the indirect effects of trust on growth, certainly one of the most important
channels is the influence of trust on the reduction of transaction costs of capital accumulation.
Transaction costs, which are an integral part of every transaction but have an exceptional
importance in intertemporal transactions, include costs of information acquisition, costs of
negotiation and decision making and costs of monitoring and enforcement. Transaction costs
are normally sunk costs, their prevalence affects the investment in physical and human
28 The same argumentation applies to the nonrivalry of technology (see Grossman and Helpman 1991, p.15).
44
capital.29 Trust reduces transaction costs by reducing the necessity to obtain, settle, monitor or
enforce contracts. In the setting of a principal-agent model, transaction costs emerge from
asymmetric information and affect the decision process of principal and agent. Trust reduces
transaction costs by reducing “the quasi-option value of waiting, perhaps indefinitely, thereby
making present investment more attractive” (Barrett 1997, p.557) in both physical and human
capital. Principal-agent structures are inherent in a variety of relationships, for example in
interactions between investor and broker like in the model of Zak and Knack (1998), in
employer-employee relationships, in interactions between shareholder and manager and in
relationships between customer and producer all of which emphasise the importance of trust.
Moreover, the number and complexity of principal-agent relationships increase when
economic development proceeds, increasing the importance of trust in high-income countries.
The second channel through which trust affects physical and human capital
accumulation and growth relates to the perception of downside risk inherent in investment
decisions. The size and probability of negative events determine the critical price of
investments and so alter the decision to invest (Barrett 1997, p.557). Trust reduces the
perceived downside risk of investment decisions and so encourages capital accumulation. The
risk reduction occurs because individuals trust others to respect extant formal and informal
institutions. Formal institutions embody political and judicial institutions that have the legal
power to enforce contracts or settle disputes, whereas informal institutions represent norms,
values, attitudes and social sanctions. However, it is not the existence of these institutions but
the trust that they will be commonly respected that decreases risk and promotes investment in
physical and human capital. This argument provides an explanation of why the legal system
does not replace trust when development proceeds. Coleman (1988) argues that informal and,
to a lesser extent, formal institutions have a positive and negative effect on economic progress
by facilitating actions and reducing creativity and flexibility (Coleman 1988, p.S105). This
point might be true as these institutions are not unrestrictedly growth promoting; however,
their effect on risk reduction is unambiguously positive.
Third, transaction costs and downside risk affect the ability to employ economies of
scale. The willingness to expand the scale diminishes when transaction costs or uncertainties
exist (Barrett 1997, p.558). Trust increases the incentives to employ economies of scale by
reducing supplementary costs and uncertainties. However, the effect of trust on the scale of
29 See Dixit and Pindyck (1994) for an evaluation of investment under irreversibility and uncertainty.
45
production is less important than on transaction costs and risk in general because every
transaction involves some kind of sunk costs and insecurity while economies of scale are not
always present.
Another important mechanism through which trust stimulates physical and human
capital accumulation relates to its influence on facilitating social interactions. Social
interactions play a central role in the process of information acquisition and learning.
Coleman (1988) states that access to and availability of information depend on the social
environment. Learning, according to Barrett (1997), also has a strong interpersonal
component. Hence, if trust encourages and improves social interactions, the acquisition of
knowledge via learning or information sharing expands and leads to higher investment in
physical and human capital. Levin et al. (2002) confirm the mediating role of trust in effective
knowledge transfers by demonstrating its importance in giving useful knowledge, in raising
the willingness to absorb this knowledge and in reducing the cost of knowledge transfers.
Furthermore, trust enables the recovery from negative events in the past and so
reduces transaction costs and perceived risk and encourages access to knowledge through
social interactions in the future (Barrett 1997, p.558). Certainly, an active restoration of trust
after misfortune or disappointment is beneficial; however, trust is not independent of negative
events and might be difficult to recover once it has been exploited.
The cross-border flow of physical and human capital is a final channel through which
trust influences capital accumulation (Barrett 1997, p.559). Foreign investment normally
faces higher transaction costs and downside risk than does domestic investment, raising the
necessity of overcoming these hazards. Trust encourages foreign investment by reducing
transaction costs and uncertainty. Helliwell (1996b) provides some empirical evidence on the
regional level demonstrating that trust indeed plays a role in the movement of individuals and
economic activity across regions in the United States.
The theoretical fundamentals for the relationship between trust and physical and
human capital similarly apply to the impact of trust on the invention, innovation and adoption
of technologies. Transaction costs, uncertainty, information acquisition and learning influence
the development and diffusion of new ideas. The cross-border flow of ideas might be
restricted by costs, uncertainties or insufficient information. These aspects emphasise the
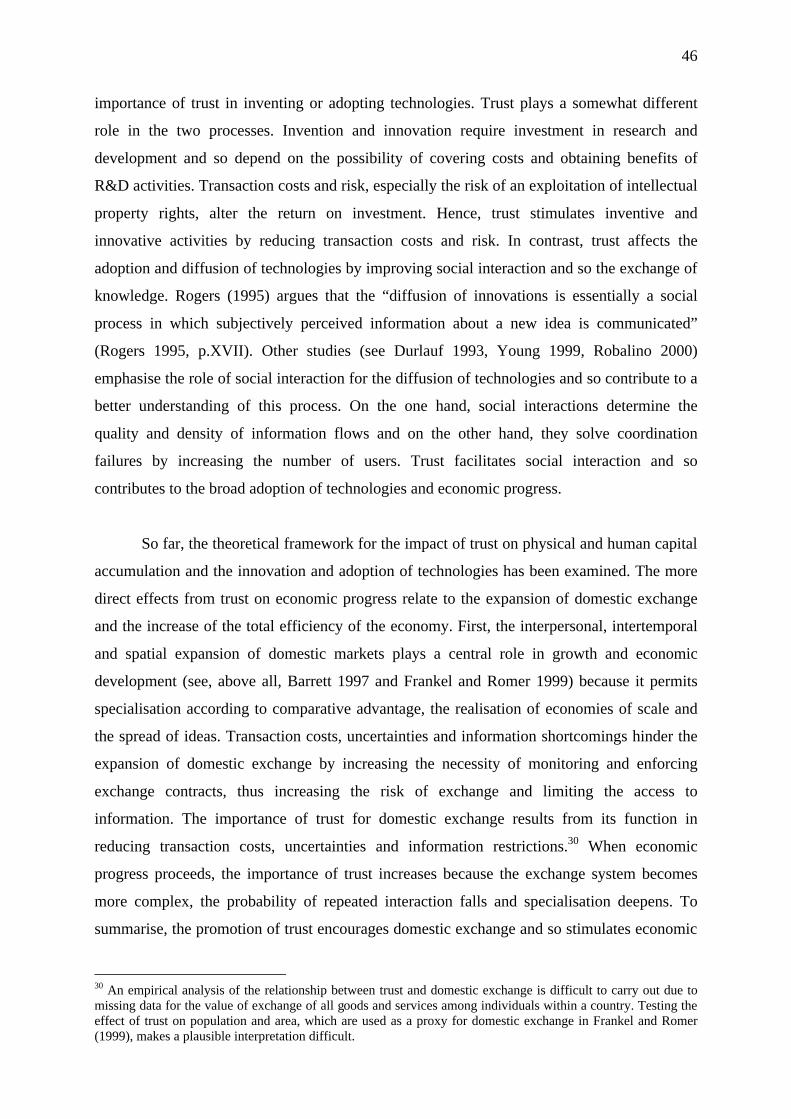
46
importance of trust in inventing or adopting technologies. Trust plays a somewhat different
role in the two processes. Invention and innovation require investment in research and
development and so depend on the possibility of covering costs and obtaining benefits of
R&D activities. Transaction costs and risk, especially the risk of an exploitation of intellectual
property rights, alter the return on investment. Hence, trust stimulates inventive and
innovative activities by reducing transaction costs and risk. In contrast, trust affects the
adoption and diffusion of technologies by improving social interaction and so the exchange of
knowledge. Rogers (1995) argues that the “diffusion of innovations is essentially a social
process in which subjectively perceived information about a new idea is communicated”
(Rogers 1995, p.XVII). Other studies (see Durlauf 1993, Young 1999, Robalino 2000)
emphasise the role of social interaction for the diffusion of technologies and so contribute to a
better understanding of this process. On the one hand, social interactions determine the
quality and density of information flows and on the other hand, they solve coordination
failures by increasing the number of users. Trust facilitates social interaction and so
contributes to the broad adoption of technologies and economic progress.
So far, the theoretical framework for the impact of trust on physical and human capital
accumulation and the innovation and adoption of technologies has been examined. The more
direct effects from trust on economic progress relate to the expansion of domestic exchange
and the increase of the total efficiency of the economy. First, the interpersonal, intertemporal
and spatial expansion of domestic markets plays a central role in growth and economic
development (see, above all, Barrett 1997 and Frankel and Romer 1999) because it permits
specialisation according to comparative advantage, the realisation of economies of scale and
the spread of ideas. Transaction costs, uncertainties and information shortcomings hinder the
expansion of domestic exchange by increasing the necessity of monitoring and enforcing
exchange contracts, thus increasing the risk of exchange and limiting the access to
information. The importance of trust for domestic exchange results from its function in
reducing transaction costs, uncertainties and information restrictions.30 When economic
progress proceeds, the importance of trust increases because the exchange system becomes
more complex, the probability of repeated interaction falls and specialisation deepens. To
summarise, the promotion of trust encourages domestic exchange and so stimulates economic
30 An empirical analysis of the relationship between trust and domestic exchange is difficult to carry out due to missing data for the value of exchange of all goods and services among individuals within a country. Testing the effect of trust on population and area, which are used as a proxy for domestic exchange in Frankel and Romer (1999), makes a plausible interpretation difficult.
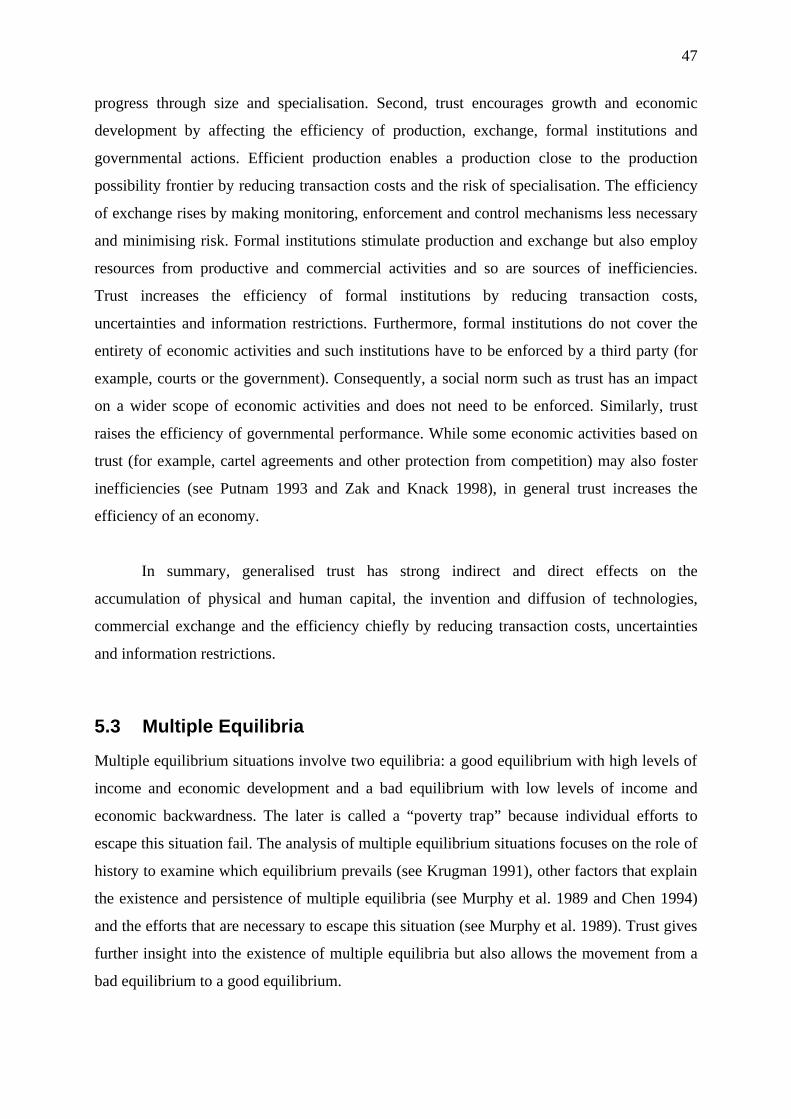
47
progress through size and specialisation. Second, trust encourages growth and economic
development by affecting the efficiency of production, exchange, formal institutions and
governmental actions. Efficient production enables a production close to the production
possibility frontier by reducing transaction costs and the risk of specialisation. The efficiency
of exchange rises by making monitoring, enforcement and control mechanisms less necessary
and minimising risk. Formal institutions stimulate production and exchange but also employ
resources from productive and commercial activities and so are sources of inefficiencies.
Trust increases the efficiency of formal institutions by reducing transaction costs,
uncertainties and information restrictions. Furthermore, formal institutions do not cover the
entirety of economic activities and such institutions have to be enforced by a third party (for
example, courts or the government). Consequently, a social norm such as trust has an impact
on a wider scope of economic activities and does not need to be enforced. Similarly, trust
raises the efficiency of governmental performance. While some economic activities based on
trust (for example, cartel agreements and other protection from competition) may also foster
inefficiencies (see Putnam 1993 and Zak and Knack 1998), in general trust increases the
efficiency of an economy.
In summary, generalised trust has strong indirect and direct effects on the
accumulation of physical and human capital, the invention and diffusion of technologies,
commercial exchange and the efficiency chiefly by reducing transaction costs, uncertainties
and information restrictions.
5.3 Multiple Equilibria
Multiple equilibrium situations involve two equilibria: a good equilibrium with high levels of
income and economic development and a bad equilibrium with low levels of income and
economic backwardness. The later is called a “poverty trap” because individual efforts to
escape this situation fail. The analysis of multiple equilibrium situations focuses on the role of
history to examine which equilibrium prevails (see Krugman 1991), other factors that explain
the existence and persistence of multiple equilibria (see Murphy et al. 1989 and Chen 1994)
and the efforts that are necessary to escape this situation (see Murphy et al. 1989). Trust gives
further insight into the existence of multiple equilibria but also allows the movement from a
bad equilibrium to a good equilibrium.
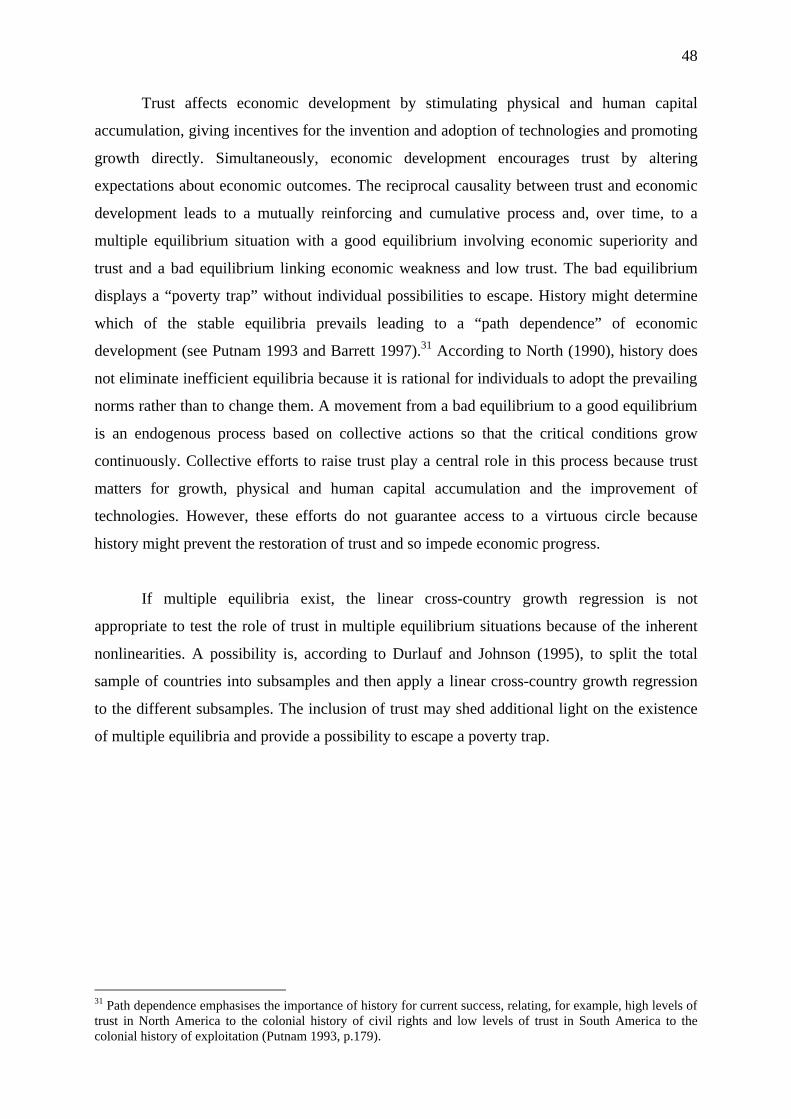
48
Trust affects economic development by stimulating physical and human capital
accumulation, giving incentives for the invention and adoption of technologies and promoting
growth directly. Simultaneously, economic development encourages trust by altering
expectations about economic outcomes. The reciprocal causality between trust and economic
development leads to a mutually reinforcing and cumulative process and, over time, to a
multiple equilibrium situation with a good equilibrium involving economic superiority and
trust and a bad equilibrium linking economic weakness and low trust. The bad equilibrium
displays a “poverty trap” without individual possibilities to escape. History might determine
which of the stable equilibria prevails leading to a “path dependence” of economic
development (see Putnam 1993 and Barrett 1997).31 According to North (1990), history does
not eliminate inefficient equilibria because it is rational for individuals to adopt the prevailing
norms rather than to change them. A movement from a bad equilibrium to a good equilibrium
is an endogenous process based on collective actions so that the critical conditions grow
continuously. Collective efforts to raise trust play a central role in this process because trust
matters for growth, physical and human capital accumulation and the improvement of
technologies. However, these efforts do not guarantee access to a virtuous circle because
history might prevent the restoration of trust and so impede economic progress.
If multiple equilibria exist, the linear cross-country growth regression is not
appropriate to test the role of trust in multiple equilibrium situations because of the inherent
nonlinearities. A possibility is, according to Durlauf and Johnson (1995), to split the total
sample of countries into subsamples and then apply a linear cross-country growth regression
to the different subsamples. The inclusion of trust may shed additional light on the existence
of multiple equilibria and provide a possibility to escape a poverty trap.
31 Path dependence emphasises the importance of history for current success, relating, for example, high levels of trust in North America to the colonial history of civil rights and low levels of trust in South America to the colonial history of exploitation (Putnam 1993, p.179).
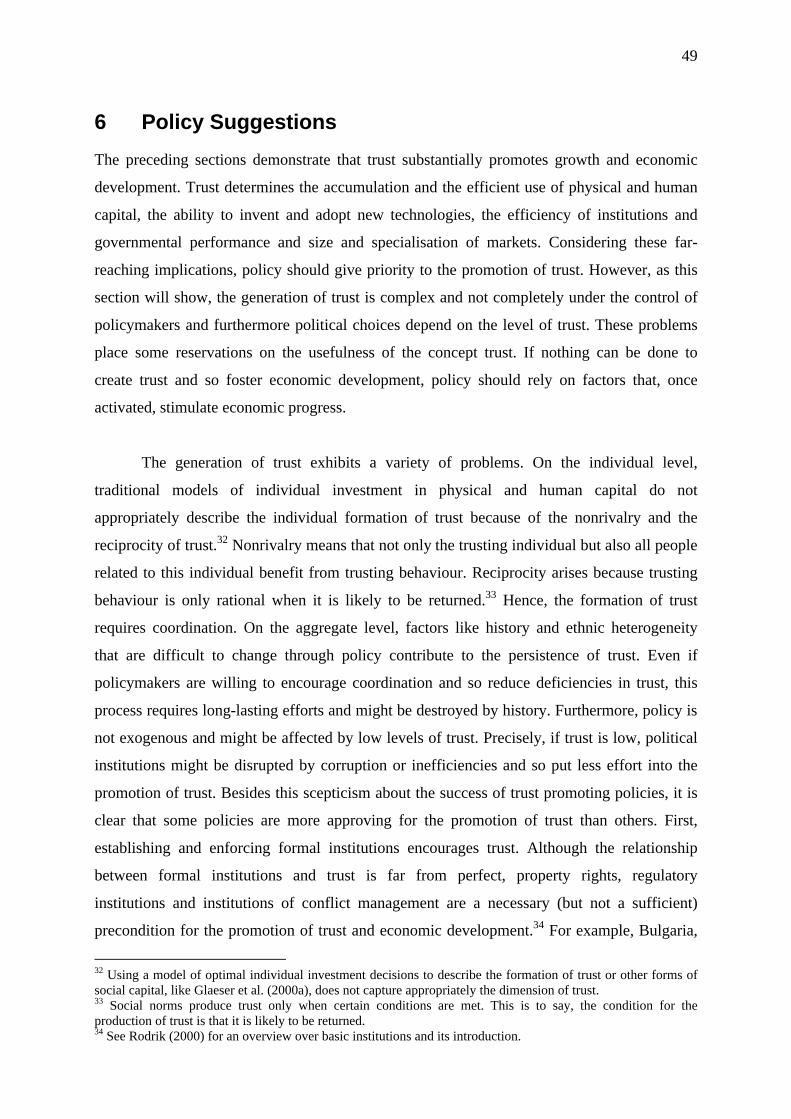
49
6 Policy Suggestions
The preceding sections demonstrate that trust substantially promotes growth and economic
development. Trust determines the accumulation and the efficient use of physical and human
capital, the ability to invent and adopt new technologies, the efficiency of institutions and
governmental performance and size and specialisation of markets. Considering these far-
reaching implications, policy should give priority to the promotion of trust. However, as this
section will show, the generation of trust is complex and not completely under the control of
policymakers and furthermore political choices depend on the level of trust. These problems
place some reservations on the usefulness of the concept trust. If nothing can be done to
create trust and so foster economic development, policy should rely on factors that, once
activated, stimulate economic progress.
The generation of trust exhibits a variety of problems. On the individual level,
traditional models of individual investment in physical and human capital do not
appropriately describe the individual formation of trust because of the nonrivalry and the
reciprocity of trust.32 Nonrivalry means that not only the trusting individual but also all people
related to this individual benefit from trusting behaviour. Reciprocity arises because trusting
behaviour is only rational when it is likely to be returned.33 Hence, the formation of trust
requires coordination. On the aggregate level, factors like history and ethnic heterogeneity
that are difficult to change through policy contribute to the persistence of trust. Even if
policymakers are willing to encourage coordination and so reduce deficiencies in trust, this
process requires long-lasting efforts and might be destroyed by history. Furthermore, policy is
not exogenous and might be affected by low levels of trust. Precisely, if trust is low, political
institutions might be disrupted by corruption or inefficiencies and so put less effort into the
promotion of trust. Besides this scepticism about the success of trust promoting policies, it is
clear that some policies are more approving for the promotion of trust than others. First,
establishing and enforcing formal institutions encourages trust. Although the relationship
between formal institutions and trust is far from perfect, property rights, regulatory
institutions and institutions of conflict management are a necessary (but not a sufficient)
precondition for the promotion of trust and economic development.34 For example, Bulgaria,
32 Using a model of optimal individual investment decisions to describe the formation of trust or other forms of social capital, like Glaeser et al. (2000a), does not capture appropriately the dimension of trust. 33 Social norms produce trust only when certain conditions are met. This is to say, the condition for the production of trust is that it is likely to be returned. 34 See Rodrik (2000) for an overview over basic institutions and its introduction.
50
Hungary and the Slovak Republic were successful in adopting democratic institutions in the
transition from central planning to a market economy; however, it takes much longer for these
countries to increase the level of trust.35 Second, high quality education is positively related to
trust. This positive relationship provides an additional rationale besides the traditional ones to
invest in education. Third, policies that reduce inequality in the distribution of income
through redistribution or other mechanisms create a favourable environment for the
promotion of trust because social distance stemming from income disparity or ethnic origin is
negatively related to trust (see Zak and Knack 1998 and Alesina and La Ferrara 2000).
Finally, community development affects the extent of trust. Horizontal networks of civil
engagement (see Coleman 1988 and Putnam 1993) and a decentralised decision-making
process encourage interaction and coordination and so contribute to the creation of trust.
However, the influence of horizontal associations on the creation of trust is a highly disputed
and remains an unsolved mystery (see Putnam 1993 and Knack and Keefer 1997). Taking the
progressive administrative and financial decentralisation in China as an outstanding example,
decentralisation with high responsibilities for the local governments provides a less dubious
strategy to encourage trust. After all, these strategies only promote trust if they are based on a
sound and reliable policy that, by taking action, does not harm the expectations of individuals.
This section demonstrates that trust gives only minor impulses for policies that
promote economic development. This means that the promotion of trust per se is difficult to
accomplish but rather works through different channels. In this way, trust provides a rationale
for different policies in economic development but does not give rise to specific policies in
and of itself.
35 Rose (1993, 1995) explains the lower levels of generalised trust in the former communist countries with what he calls an “hour-glass society”. Strong ties exist between family and friends (“the top of the hour-glass”) while trust in individuals outside this close network is generally low (“the bottom of the hour-glass”) because individuals tend to retreat from the public sphere into privacy.
51
7 Conclusion
The aim of this paper is to analyse the role of generalised trust in the process of growth and
economic development. In accordance with the seminal paper by Knack and Keefer (1997),
the positive relationship between trust and growth is significant in both an empirical and
economic sense. For example, if Pakistan raises the level of trust to the one in India
(approximately a one-standard-deviation increase), the growth rate would increase by almost
one percentage point. The significance of the relationship depends to some degree on the
inclusion of other variables that simultaneously affect growth. Controlling for a possible
endogeneity of trust, the analysis provides strong evidence that trust actually causes growth.
However, trust is strongly linked to variables of economic development that promote growth
but also affect trust which gives rise to a reverse effect from growth to trust especially in the
long-run perspective.
Trust not only increases income but also plays a vital role in economic development.
Although the regression results provide only mixed evidence for an impact of trust on total
investment in physical and human capital, a strong and significant relationship exists between
trust and the efficiency of investment decisions. Trust reduces the resources that are necessary
to monitor or enforce transactions, limits the uncertainty in transactions and promotes the
spread of information and so leads to efficient investment decisions. Apart from the effect of
trust on physical and human capital accumulation, trust positively affects the invention and
innovation of technologies and, more importantly, the diffusion of these new or improved
technologies within a country. Until recently, the enhancement of technologies was regarded
as crucial in the process of economic development, but the ability to adopt and employ new
technologies has a similarly important impact. The diffusion of technologies, far from being
an automatic process, depends on the quality and frequency of personal interactions which are
based on trust. Not surprisingly, the diffusion of information and telecommunication
technologies moved ahead in the Scandinavian countries that observe the highest level of
trust. Trust also plays a significant role in raising the efficiency of formal institutions and the
possibility of good governance. Legal and political institutions only enable economic progress
when people believe that these institutions are generally respected and reliably enforced.
Similarly, when trust is a low-turn investment, governments fail to adopt reliable policies and
become a central part of the problem. High-quality institutions and good governance have a
parallel impact on trust leading to a mutually reinforcing and cumulative process of social
52
development that, in turn, promotes economic development. No evidence is found for the
expected impact of trust on financial development. The supposition that high levels of trust
reduce uncertainty and the perceived downside risk of transactions and so encourage the
extension of credits is not supported by the data.
The findings of this paper disprove the critique of Solow (1995) that trust only
indirectly affects growth and economic development while the direct effects are too small to
question the role of trust as a background characteristic. Trust contributes substantially to the
explanation of growth and economic development–though some caution is needed owing to
measurement problems and the causality of the relationship–both in low-income countries
where trust replaces missing institutional structures and in high-income countries where trust
deals with the complexity of transactions. Furthermore, trust is successful in documenting the
beneficial impacts of certain policies and in providing a guideline to achieve growth and
economic development.
Future work has to be done to provide a reliable measurement of trust that does not
depend on a single survey question. Furthermore, more sophisticated empirical research
beyond a linear cross-country growth regression, for example, testing the role of trust in
multiple equilibria situations and the incorporation of trust into economic theory point up
fields for further consideration.
53
References
[1] Aghion, Phillipe, and Peter Howitt (1992): “A Model of Growth through Creative
Destruction”, Econometrica, Vol. 60(2), 323-351.
[2] Alesina, Alberto, and Eliana La Ferrara (2000): “The Determinants of Trust”, NBER
Working Paper No. 7621, Cambridge, MA.
[3] Alesina, Alberto, Arnaud Devleeschauwer, William Easterly, Sergio Kurlat, and
Romain Wacziarg (2003): “Fractionalization”, NBER Working Paper No. 9411,
Cambridge, MA.
[4] Arrow, Kenneth (1972): “Gifts and Exchange”, Philosophy and Public Affairs, Vol.
1(4), 343-362.
[5] Barrett, Christopher B. (1997): “Idea Gaps, Object Gaps, and Trust Gaps in Economic
Development”, The Journal of Developing Areas, Vol. 31, 553-568.
[6] Barro, Robert J. (1991): “Economic Growth in a Cross Section of Countries”,
Quarterly Journal of Economics, Vol. 106(2), 407-443.
[7] Barro, Robert J., and Jong-Wha Lee (1993): “International Comparison of Educational
Attainment”, Journal of Monetary Economics, Vol. 32(3), 363-394.
[8] Barro, Robert J., and Jong-Wha Lee (1996): “International Measures of Schooling
Years and Schooling Quality”, American Economic Review, Vol. 86(2), 218-223.
[9] Barro, Robert J., and Jong-Wha Lee (1997): “Schooling Quality in a Cross Section of
Countries”, NBER Working Paper No. 6198, Cambridge, MA.
[10] Barro, Robert J., and Jong-Wha Lee (2000): “International Data on Educational
Attainment: Updates and Implications”, Center for International Development at
Harvard University (CID) Working Paper No. 42, Cambridge, MA.
[11] Barro, Robert J., and Xavier Sala-I-Martin (1995): “Economic Growth”, New York:
McGraw-Hill.
54
[12] Beck, Thorsten, Ross Levine and Norman Loayza (1999): “Finance and the Sources of
Growth”, World Bank Working Paper No. 2057, Washington DC.
[13] Berg, Joyce, John W. Dickhaut, and Kevin A. McCabe (1995): “Trust, Reciprocity,
and Social History”, Games and Economic Behavior, Vol. 10, 122-142.
[14] Bornschier, Volker (2001): “Generalisiertes Vertrauen und die frühe Verbreitung der
Internetnutzung im Gesellschaftsvergleich”, Kölner Zeitschrift für Soziologie und
Sozialpsychologie, Vol. 53(2), 233-257.
[15] Chen, Been-Lon (1994): “Limited Diffusion of Technology Learning Incentives and a
Low Level of Industrialization”, Journal of Economic Development, Vol. 19(2), 253-
272.
[16] Coleman, James S. (1988): “Social Capital in the Creation of Human Capital”,
American Journal of Sociology, Vol. 94(Supplement), S95-S120.
[17] Currency Data and Intelligence (1996): “World Currency Yearbook”, 27th Edition,
Phillip P. Cowitt, Carolyn A. Edwards, and Elliot R. Boyce, Brooklyn, NY.
[18] Dasgupta, Partha (2000): “Economic Progress and the Idea of Social Capital”, in:
Partha Dasgupta, and Ismail Serageldin, eds., “Social Capital: A Multifaceted
Perspective”, Washington DC: World Bank.
[19] De Long, Bradford J., and Lawrence H. Summers (1991): “Equipment Investment and
Economic Growth”, Quarterly Journal of Economics, Vol. 106(2), 445-502.
[20] Dixit, Avinash K., and Robert S. Pindyck (1994): “Investment under Uncertainty”,
Princeton, NJ: Princeton University Press.
[21] Dosi, Giovanni, Keith Pavitt, and Luc Soete (1990): “The Economics of Technical
Change and International Trade”, New York: New York University Press.
[22] Durlauf, Steven N. (1993): “Nonergodic Economic Growth”, Review of Economic
Studies, Vol. 60(2), 349-366.
[23] Durlauf, Steven N., and Paul A. Johnson (1995): “Multiple Regimes and Cross-
Country Growth Behavior”, Journal of Applied Econometrics, Vol. 10(4), 365-385.
55
[24] Durlauf, Steven N., and Danny T. Quah (1999): “The New Empirics of Economic
Growth”, in: John B. Taylor, and Michael Woodford, eds., “Handbook of
Macroeconomics”, Vol. 1A, Amsterdam: North Holland.
[25] Durlauf, Steven N. (2000): “Econometric Analysis and the Study of Economic
Growth: A Sceptical Perspective”, in: Roger E. Backhouse, and Andrea Salanti,
“Macroeconomics and the Real World”, Vol. 1 Econometric Techniques and
Macroeconomics, Oxford: Oxford University Press.
[26] Easterly, William, and Ross Levine (1997): “Africa’s Growth Tragedy: Policies and
Ethnic Divisions”, Quarterly Journal of Economics, Vol. 111(4), 1203-1250.
[27] Frankel, Jeffrey A., and David Romer (1999): “Does Trade Cause Growth?”,
American Economic Review, Vol. 89(3), 379-399.
[28] Fraser Institute (2002): “Economic Freedom of the World: 2002 Annual Report”,
James Gwartney, Robert Lawson, Chris Edwards, Walter Park, Veronique de Rugy,
and Smita Wagh, Vancouver, BC.
[29] Freedom House (2003): “Annual Freedom in the World Country Scores: 1972-73 to
2001-02”, http://www.freedomhouse.org [from: January 11, 2003].
[30] Fukuyama, Francis (1995): “Trust: The Social Virtues and the Creation of Prosperity”,
New York: The Free Press.
[31] Gambetta, Diego (2000): “Can we Trust Trust?”, in: Diego Gambetta, ed., “Trust:
Making and Breaking Cooperative Relations”, Electronic Edition, Oxford: University
of Oxford.
[32] Glaeser, Edward L., David I. Laibson, and Bruce Sacerdote (2000a): “The Economic
Approach to Social Capital”, NBER Working Paper No. 7728, Cambridge, MA.
[33] Glaeser, Edward L., David I. Laibson, José A. Scheinkman, and Christine L. Soutter
(2000b): “Measuring Trust”, Quarterly Journal of Economics, Vol. 65(3), 811-846.
[34] Goldin, Claudia, and Lawrence F. Katz (1998): “Human Capital and Social Capital:
The Rise of Secondary Schooling in America, 1910 to 1940”, NBER Working Paper
No. 6439, Cambridge, MA.
56
[35] Granovetter, Mark (1973): “The Strength of Weak Ties”, American Journal of
Sociology, Vol. 78, 1360-1380.
[36] Grossman, Gene M., and Elhanan Helpman (1991): “Innovation and Growth in the
Global Economy”, Cambridge, MA: MIT Press.
[37] Guiso, Luigi, Paola Sapienza, and Luigi Zingales (2000): “The Role of Social Capital
in Financial Development”, NBER Working Paper No. 7563, Cambridge, MA.
[38] Helliwell, John F. (1996a): “Economic Growth and Social Capital in Asia”, NBER
Working Paper No. 5470, Cambridge, MA.
[39] Helliwell, John F. (1996b): “Do Borders Matter for Social Capital? Economic Growth
and Civic Culture in U.S. States and Canadian Provinces”, NBER Working Paper No.
5863, Cambridge, MA.
[40] Helliwell, John F., and Robert Putnam (1999): “Education and Social Capital”, NBER
Working Paper No. 7121, Cambridge, MA.
[41] Heston, Alan, Robert Summers, and Bettina Aten (2002): “Penn World Table Version
6.1”, Center for International Comparisons at the University of Pennsylvania
(CICUP), Philadelphia, PA.
[42] Inglehart, Ronald (1999): “Trust, Well-Being and Democracy”, in: Mark Warren, ed.,
“Democracy and Trust”, Cambridge, UK: Cambridge University Press.
[43] Inglehart, Ronald, et al. (2000): “World Values Surveys and European Values
Surveys, 1981-1984, 1990-1993, and 1995-1997”, ICPSR Version [Computer File],
Ann Arbor, MI: Institute for Social Research [Producer], Ann Arbor, MI: Inter-
University Consortium for Political and Social Research [Distributor].
[44] International Monetary Fund (2001): “International Financial Statistics Yearbook”,
Vol. 54, Washington DC.
[45] Knack, Stephan (2000): “Social Capital and the Quality of Government: Evidence
from the States”, World Bank Policy Research Working Paper No. 2504, Washington
DC.
57
[46] Knack, Stephan, and Philip Keefer (1995): “Institutions and Economic Performance:
Cross Country Tests Using Alternative Institutional Measures”, Economics and
Politics, Vol. 7(3), 207-227.
[47] Knack, Stephan and Philip Keefer (1997): “Does Social Capital Have an Economic
Payoff? A Cross Country Investigation”, Quarterly Journal of Economics, Vol.
112(4), 1252-1288.
[48] Kaufmann, Daniel, Aart Kraay, and Pablo Zoido-Lobatón (1999a): “Governance
Matters”, World Bank Policy Research Working Paper No. 2196, Washington DC.
[49] Kaufmann, Daniel, Aart Kraay, and Pablo Zoido-Lobatón (1999b): “Aggregating
Governance Indicators”, World Bank Policy Research Working Paper No. 2195,
Washington DC.
[50] King, Robert G., and Ross Levine (1993a): “Finance and Growth: Schumpeter Might
Be Right”, Quarterly Journal of Economics, Vol. 108(3), 717-737.
[51] King, Robert G., and Ross Levine (1993b): “Finance, Entrepreneurship and Growth:
Theory and Evidence”, Journal of Monetary Economics, Vol. 32(3), 513-542.
[52] Krugman, Paul (1991): “History versus Expectations”, Quarterly Journal of
Economics, Vol. 106(2), 651-667.
[53] La Porta, Rafael, Florencio Lopez-de-Silanes, Andrei Shleifer, and Robert W. Vishny
(1996): “Trust in Large Organizations”, NBER Working Paper No. 5864, Cambridge,
MA.
[54] La Porta, Rafael, Florencio Lopez-de-Silanes, Andrei Shleifer, and Robert W. Vishny
(1997): “Legal Determinants of External Finance”, Journal of Finance, Vol. 52(3),
1131-1150.
[55] La Porta, Rafael, Florencio Lopez-de-Silanes, Andrei Shleifer, and Robert W. Vishny
(1998): “Law and Finance”, Journal of Political Economy, Vol. 106(6), 1113-1155.
[56] Leamer, Edward E. (1985): “Sensitivity Analyses Would Help”, American Economic
Review, Vol. 57(3), 308-313.
58
[57] Levin, Daniel Z., Rob Cross, and Lisa C. Abrams (2002): “The Strength of Weak Ties
You Can Trust: The Mediating Role of Trust in Effective Knowledge Transfers”,
forthcoming, Academy of Management Journal.
[58] Levine, Ross (1997): “Financial Development and Economic Growth: Views and
Agenda”, Journal of Economic Literature, Vol. 35(2), 688-726.
[59] Levine, Ross, Norman Loayza, and Thorsten Beck (2000): “Financial Intermediation
and Growth: Causality and Causes”, Journal of Monetary Economics, Vol. 46(1), 31-
77.
[60] Levine, Ross, and David Renelt (1992): “A Sensitivity Analysis of Cross-Country
Growth Regressions”, American Economic Review, Vol. 82(4), 942-963.
[61] Mankiw, Gregory N., David Romer, and David N. Weil (1992): “A Contribution to
the Empirics of Economic Growth”, Quarterly Journal of Economics, Vol. 107(2),
407-437.
[62] Mauro, Pablo (1995): “Corruption and Growth”, Quarterly Journal of Economics,
Vol. 110(3), 681-712.
[63] Murphy, Kevin M., Andrei Shleifer, and Robert W. Vishny (1989): “Industrialization
and the Big Push”, Journal of Political Economy, Vol. 97(5), 1003-1026.
[64] Narayan, Deepa, and Lant Pritchett (1997): “Cents and Sociability: Household Income
and Social Capital in Rural Tanzania”, World Bank Policy Research Working Paper
No. 1796, Washington DC.
[65] North, Douglas (1990): “Institutions, Institutional Change and Economic
Performance”, New York: Cambridge University Press.
[66] PRS Group (1995): “International Country Risk Guide Data 1985-95” [Computer
File], Syracuse, NY, Compiled by IRIS Center, College Park, MD.
[67] Putnam, Robert (1993): “Making Democracy Work”, Princeton, NJ: Princeton
University Press.
59
[68] Robalino, David A. (2000): “Social Capital, Technology Diffusion and Sustainable
Growth in the Developing World”, Santa Monica, CA: RAND.
[69] Rodrik, Dani (2000): “Institutions for High-Quality Growth: What They Are and How
to Acquire Them”, NBER Working Paper No. 7540, Cambridge, MA.
[70] Rogers, Everett M. (1995): “Diffusion of Innovations”, New York: The Free Press.
[71] Romer, Paul M., (1990): “Endogenous Technological Change”, Journal of Political
Economy, Vol. 98(5), part 2, 71-102.
[72] Romer, Paul M., (1993): “Idea Gaps and Object Gaps in Economic Development”,
Journal of Monetary Economics, Vol. 32(3), 543-573.
[73] Rose, Richard (1993): “Rethinking Civil Society: Postcommunism and the Problem of
Trust”, Journal of Democracy, Vol. 1(1), 18-29.
[74] Rose, Richard (1995): “Russia as an Hour-Glass Society: A Constitution without
Citizens”, East European Constitutional Review, Vol. 4(3), 34-42.
[75] Sala-I-Martin (1997): “I Just Ran Two Million Regressions”, American Economic
Review, Vol. 87(2), 178-183.
[76] Slemrod, Joel, and Peter Katuscak (2002): “Do Trust and Trustworthiness Pay Off?”,
NBER Working Paper No. 9200, Cambridge, MA.
[77] Solow (1995): “But Verify–Trust: The Social Virtues and the Creation of Prosperity”,
The New Republic, Vol. 213(11), 36-39.
[78] Uslaner, Eric M. (2000): “Trust, Democracy, and Governance”, Paper presented at the
European Consortium for Political Research Workshop, Copenhagen, April, 14-19,
2000.
[79] Volken, Thomas (2002): “Elements of Trust: The Cultural Dimension of Internet
Diffusion Revisited”, Electronic Journal of Sociology, Vol. 6(4).
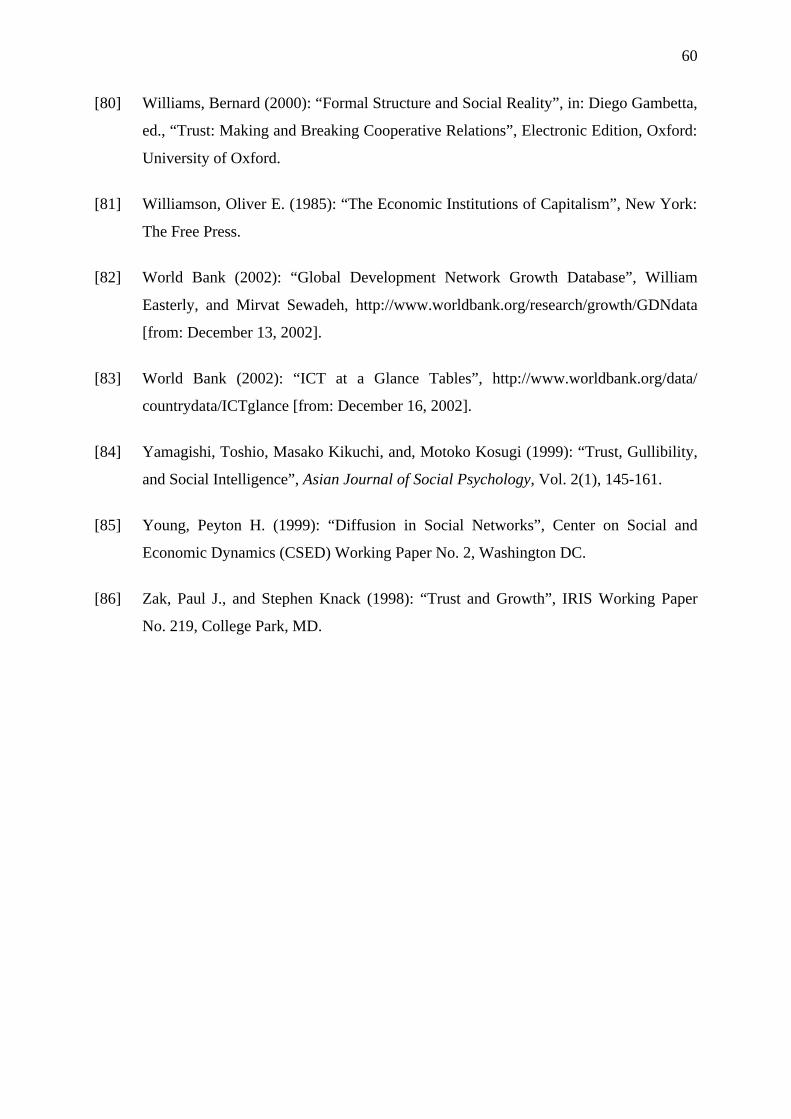
60
[80] Williams, Bernard (2000): “Formal Structure and Social Reality”, in: Diego Gambetta,
ed., “Trust: Making and Breaking Cooperative Relations”, Electronic Edition, Oxford:
University of Oxford.
[81] Williamson, Oliver E. (1985): “The Economic Institutions of Capitalism”, New York:
The Free Press.
[82] World Bank (2002): “Global Development Network Growth Database”, William
Easterly, and Mirvat Sewadeh, http://www.worldbank.org/research/growth/GDNdata
[from: December 13, 2002].
[83] World Bank (2002): “ICT at a Glance Tables”, http://www.worldbank.org/data/
countrydata/ICTglance [from: December 16, 2002].
[84] Yamagishi, Toshio, Masako Kikuchi, and, Motoko Kosugi (1999): “Trust, Gullibility,
and Social Intelligence”, Asian Journal of Social Psychology, Vol. 2(1), 145-161.
[85] Young, Peyton H. (1999): “Diffusion in Social Networks”, Center on Social and
Economic Dynamics (CSED) Working Paper No. 2, Washington DC.
[86] Zak, Paul J., and Stephen Knack (1998): “Trust and Growth”, IRIS Working Paper
No. 219, College Park, MD.
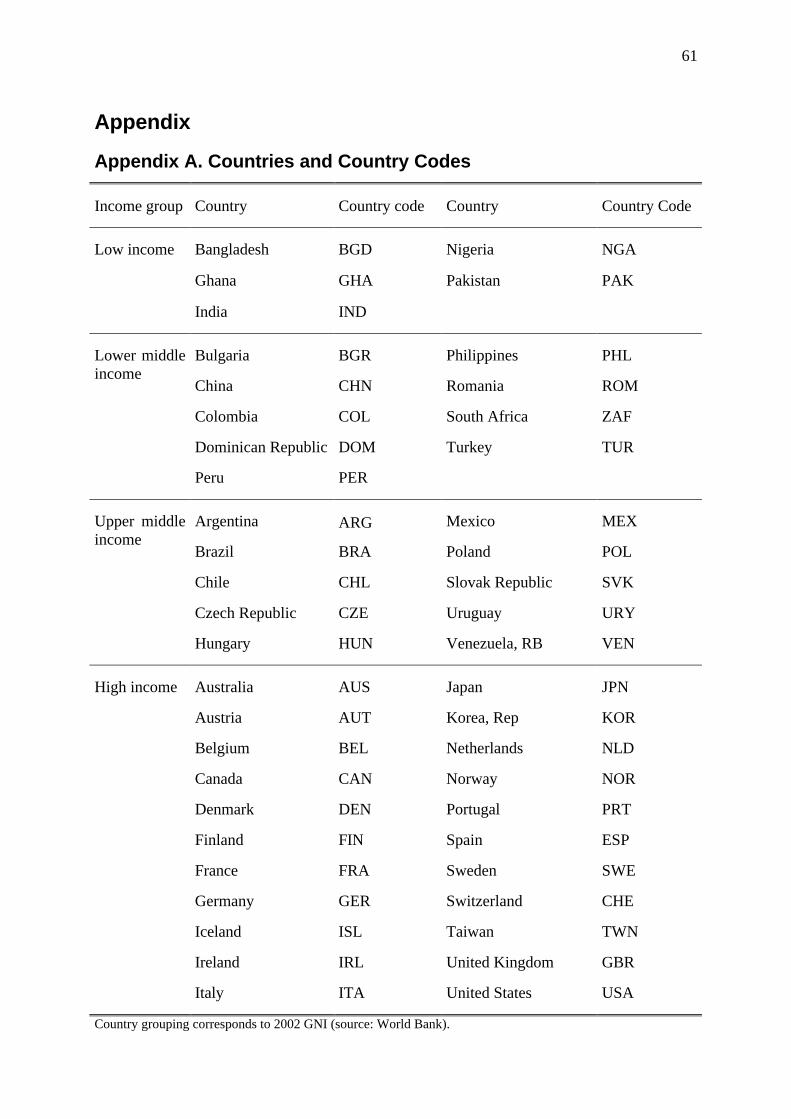
61
Appendix
Appendix A. Countries and Country Codes
Income group
Country
Country code
Country
Country Code
Bangladesh
BGD
Nigeria
NGA
Ghana
GHA Pakistan PAK
Low income
India
IND
Bulgaria
BGR
Philippines
PHL
China
CHN Romania ROM
Colombia
COL South Africa ZAF
Dominican Republic
DOM Turkey TUR
Lower middle income
Peru
PER
Argentina
ARG
Mexico
MEX
Brazil
BRA Poland POL
Chile
CHL Slovak Republic SVK
Czech Republic
CZE Uruguay URY
Upper middle income
Hungary
HUN Venezuela, RB VEN
Australia
AUS
Japan
JPN
Austria
AUT Korea, Rep KOR
Belgium
BEL Netherlands NLD
Canada
CAN Norway NOR
Denmark
DEN Portugal PRT
Finland
FIN Spain ESP
France
FRA Sweden SWE
Germany
GER Switzerland CHE
Iceland
ISL Taiwan TWN
Ireland
IRL United Kingdom GBR
High income
Italy
ITA United States USA
Country grouping corresponds to 2002 GNI (source: World Bank).
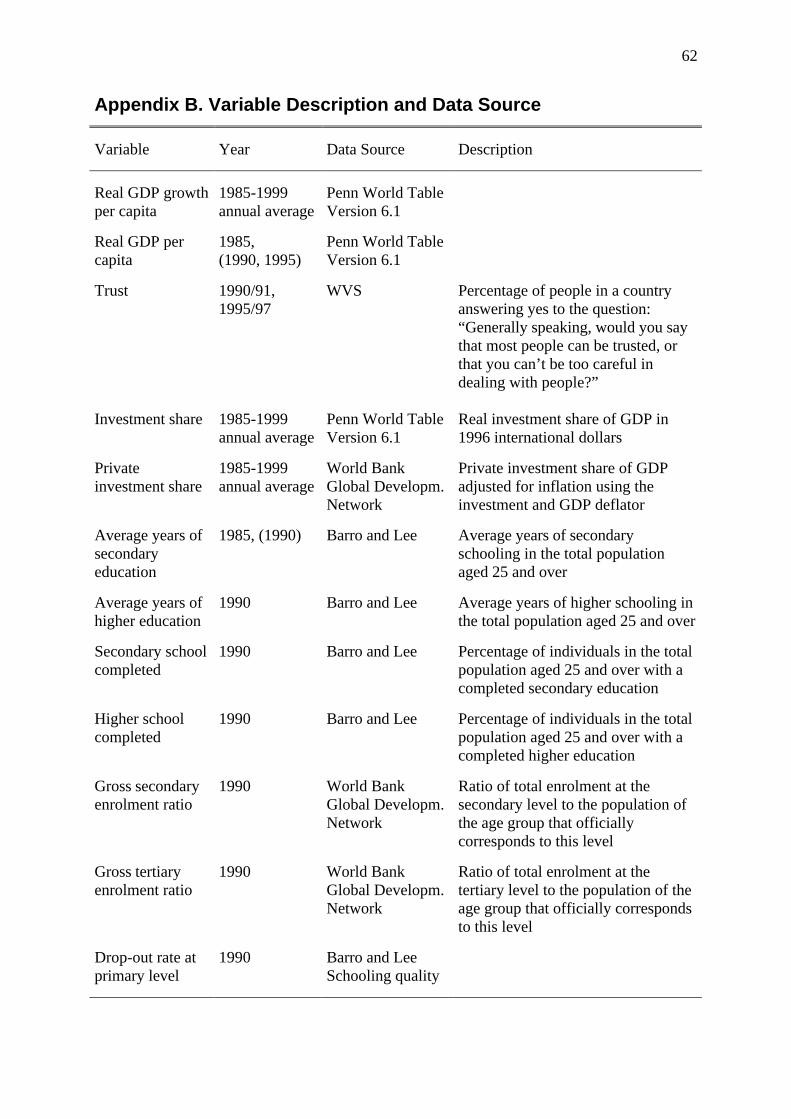
62
Appendix B. Variable Description and Data Source
Variable
Year
Data Source
Description
Real GDP growth per capita
1985-1999 annual average
Penn World Table Version 6.1
Real GDP per capita
1985, (1990, 1995)
Penn World Table Version 6.1
Trust
1990/91, 1995/97
WVS Percentage of people in a country answering yes to the question: “Generally speaking, would you say that most people can be trusted, or that you can’t be too careful in dealing with people?”
Investment share 1985-1999 annual average
Penn World Table Version 6.1
Real investment share of GDP in 1996 international dollars
Private investment share
1985-1999 annual average
World Bank Global Developm. Network
Private investment share of GDP adjusted for inflation using the investment and GDP deflator
Average years of secondary education
1985, (1990) Barro and Lee Average years of secondary schooling in the total population aged 25 and over
Average years of higher education
1990 Barro and Lee Average years of higher schooling in the total population aged 25 and over
Secondary school completed
1990 Barro and Lee Percentage of individuals in the total population aged 25 and over with a completed secondary education
Higher school completed
1990 Barro and Lee Percentage of individuals in the total population aged 25 and over with a completed higher education
Gross secondary enrolment ratio
1990 World Bank Global Developm. Network
Ratio of total enrolment at the secondary level to the population of the age group that officially corresponds to this level
Gross tertiary enrolment ratio
1990 World Bank Global Developm. Network
Ratio of total enrolment at the tertiary level to the population of the age group that officially corresponds to this level
Drop-out rate at primary level
1990 Barro and Lee Schooling quality
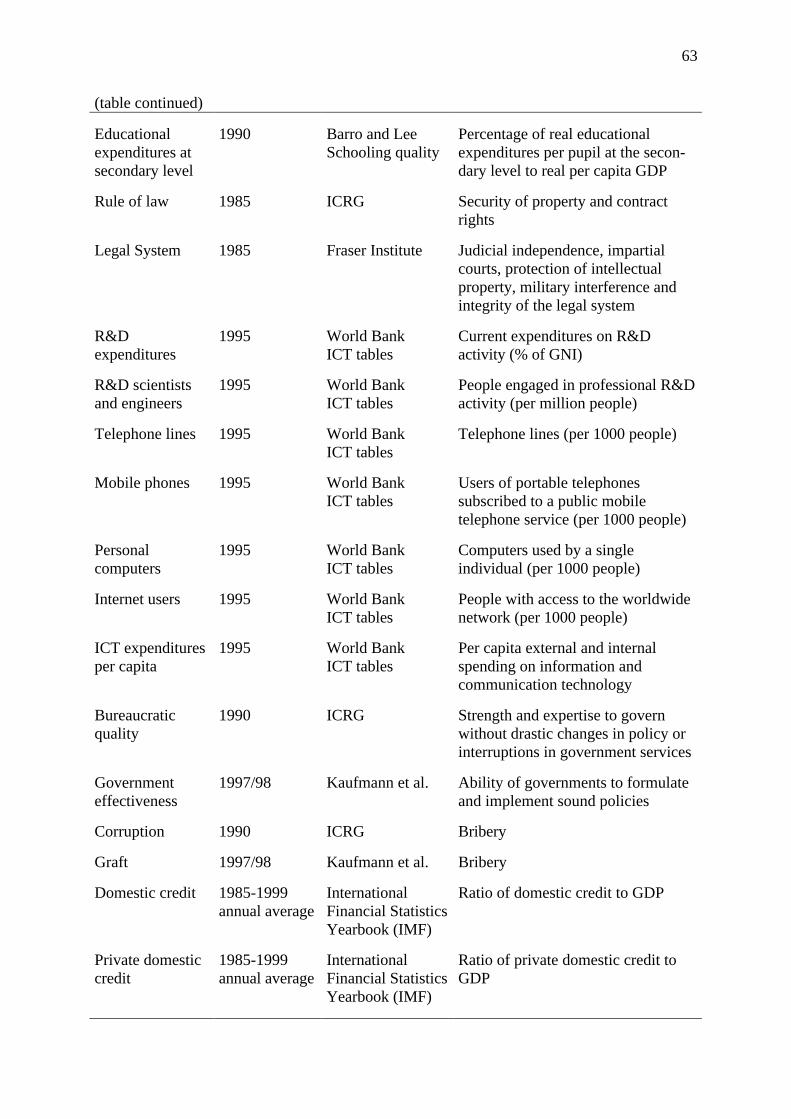
63
(table continued)
Educational expenditures at secondary level
1990
Barro and Lee Schooling quality
Percentage of real educational expenditures per pupil at the secon-dary level to real per capita GDP
Rule of law
1985 ICRG Security of property and contract rights
Legal System
1985 Fraser Institute Judicial independence, impartial courts, protection of intellectual property, military interference and integrity of the legal system
R&D expenditures
1995 World Bank ICT tables
Current expenditures on R&D activity (% of GNI)
R&D scientists and engineers
1995 World Bank ICT tables
People engaged in professional R&D activity (per million people)
Telephone lines 1995 World Bank ICT tables
Telephone lines (per 1000 people)
Mobile phones 1995 World Bank ICT tables
Users of portable telephones subscribed to a public mobile telephone service (per 1000 people)
Personal computers
1995 World Bank ICT tables
Computers used by a single individual (per 1000 people)
Internet users 1995 World Bank ICT tables
People with access to the worldwide network (per 1000 people)
ICT expenditures per capita
1995 World Bank ICT tables
Per capita external and internal spending on information and communication technology
Bureaucratic quality
1990 ICRG Strength and expertise to govern without drastic changes in policy or interruptions in government services
Government effectiveness
1997/98 Kaufmann et al. Ability of governments to formulate and implement sound policies
Corruption
1990 ICRG Bribery
Graft
1997/98 Kaufmann et al. Bribery
Domestic credit
1985-1999 annual average
International Financial Statistics Yearbook (IMF)
Ratio of domestic credit to GDP
Private domestic credit
1985-1999 annual average
International Financial Statistics Yearbook (IMF)
Ratio of private domestic credit to GDP
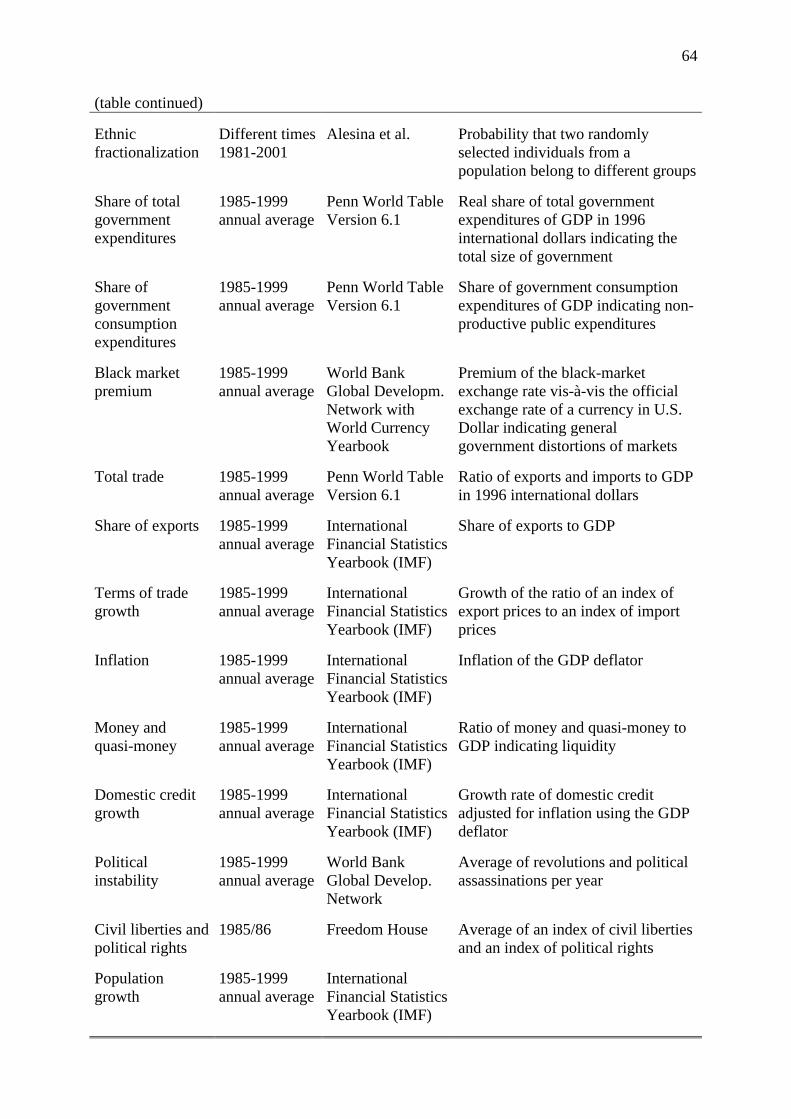
64
(table continued)
Ethnic fractionalization
Different times 1981-2001
Alesina et al.
Probability that two randomly selected individuals from a population belong to different groups
Share of total government expenditures
1985-1999 annual average
Penn World Table Version 6.1
Real share of total government expenditures of GDP in 1996 international dollars indicating the total size of government
Share of government consumption expenditures
1985-1999 annual average
Penn World Table Version 6.1
Share of government consumption expenditures of GDP indicating non-productive public expenditures
Black market premium
1985-1999 annual average
World Bank Global Developm. Network with World Currency Yearbook
Premium of the black-market exchange rate vis-à-vis the official exchange rate of a currency in U.S. Dollar indicating general government distortions of markets
Total trade
1985-1999 annual average
Penn World Table Version 6.1
Ratio of exports and imports to GDP in 1996 international dollars
Share of exports
1985-1999 annual average
International Financial Statistics Yearbook (IMF)
Share of exports to GDP
Terms of trade growth
1985-1999 annual average
International Financial Statistics Yearbook (IMF)
Growth of the ratio of an index of export prices to an index of import prices
Inflation
1985-1999 annual average
International Financial Statistics Yearbook (IMF)
Inflation of the GDP deflator
Money and quasi-money
1985-1999 annual average
International Financial Statistics Yearbook (IMF)
Ratio of money and quasi-money to GDP indicating liquidity
Domestic credit growth
1985-1999 annual average
International Financial Statistics Yearbook (IMF)
Growth rate of domestic credit adjusted for inflation using the GDP deflator
Political instability
1985-1999 annual average
World Bank Global Develop. Network
Average of revolutions and political assassinations per year
Civil liberties and political rights
1985/86 Freedom House Average of an index of civil liberties and an index of political rights
Population growth
1985-1999 annual average
International Financial Statistics Yearbook (IMF)
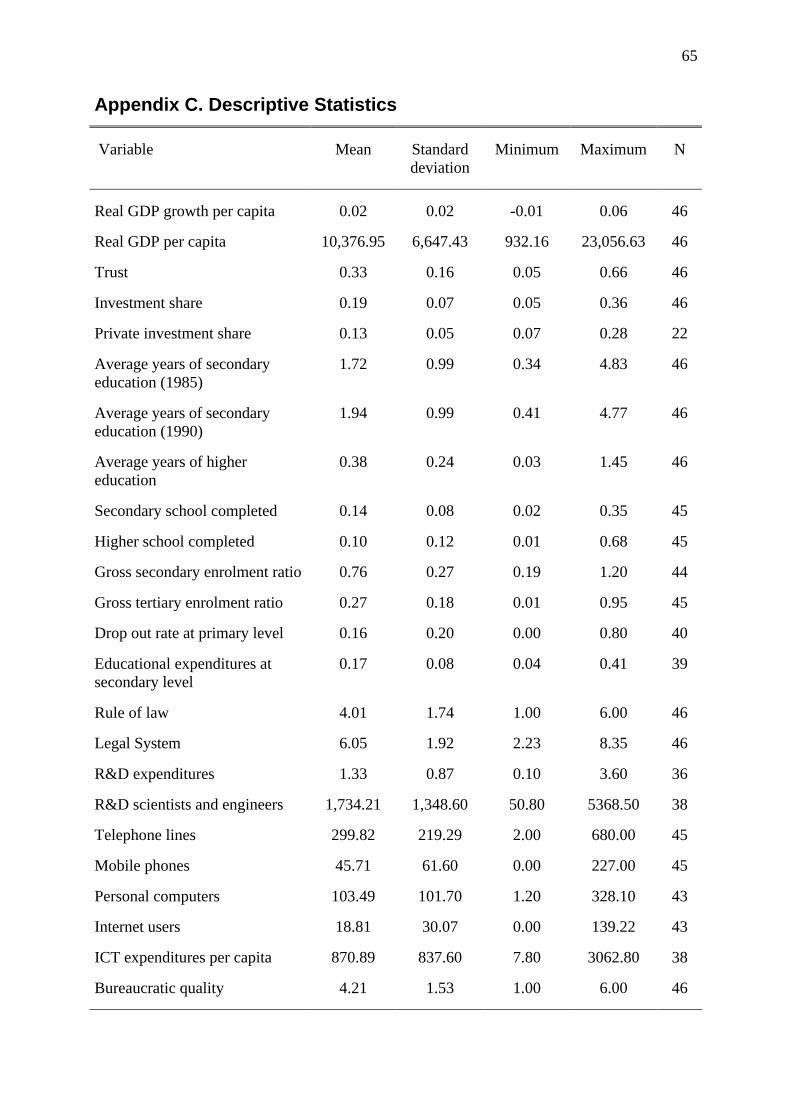
65
Appendix C. Descriptive Statistics
Variable
Mean
Standard deviation
Minimum
Maximum
N
Real GDP growth per capita
0.02
0.02
-0.01
0.06
46
Real GDP per capita
10,376.95 6,647.43 932.16 23,056.63 46
Trust
0.33 0.16 0.05 0.66 46
Investment share
0.19 0.07 0.05 0.36 46
Private investment share
0.13 0.05 0.07 0.28 22
Average years of secondary education (1985)
1.72 0.99 0.34 4.83 46
Average years of secondary education (1990)
1.94 0.99 0.41 4.77 46
Average years of higher education
0.38 0.24 0.03 1.45 46
Secondary school completed
0.14 0.08 0.02 0.35 45
Higher school completed
0.10 0.12 0.01 0.68 45
Gross secondary enrolment ratio
0.76 0.27 0.19 1.20 44
Gross tertiary enrolment ratio
0.27 0.18 0.01 0.95 45
Drop out rate at primary level
0.16 0.20 0.00 0.80 40
Educational expenditures at secondary level
0.17 0.08 0.04 0.41 39
Rule of law
4.01 1.74 1.00 6.00 46
Legal System
6.05 1.92 2.23 8.35 46
R&D expenditures
1.33 0.87 0.10 3.60 36
R&D scientists and engineers
1,734.21 1,348.60 50.80 5368.50 38
Telephone lines
299.82 219.29 2.00 680.00 45
Mobile phones
45.71 61.60 0.00 227.00 45
Personal computers
103.49 101.70 1.20 328.10 43
Internet users
18.81 30.07 0.00 139.22 43
ICT expenditures per capita
870.89 837.60 7.80 3062.80 38
Bureaucratic quality
4.21 1.53 1.00 6.00 46
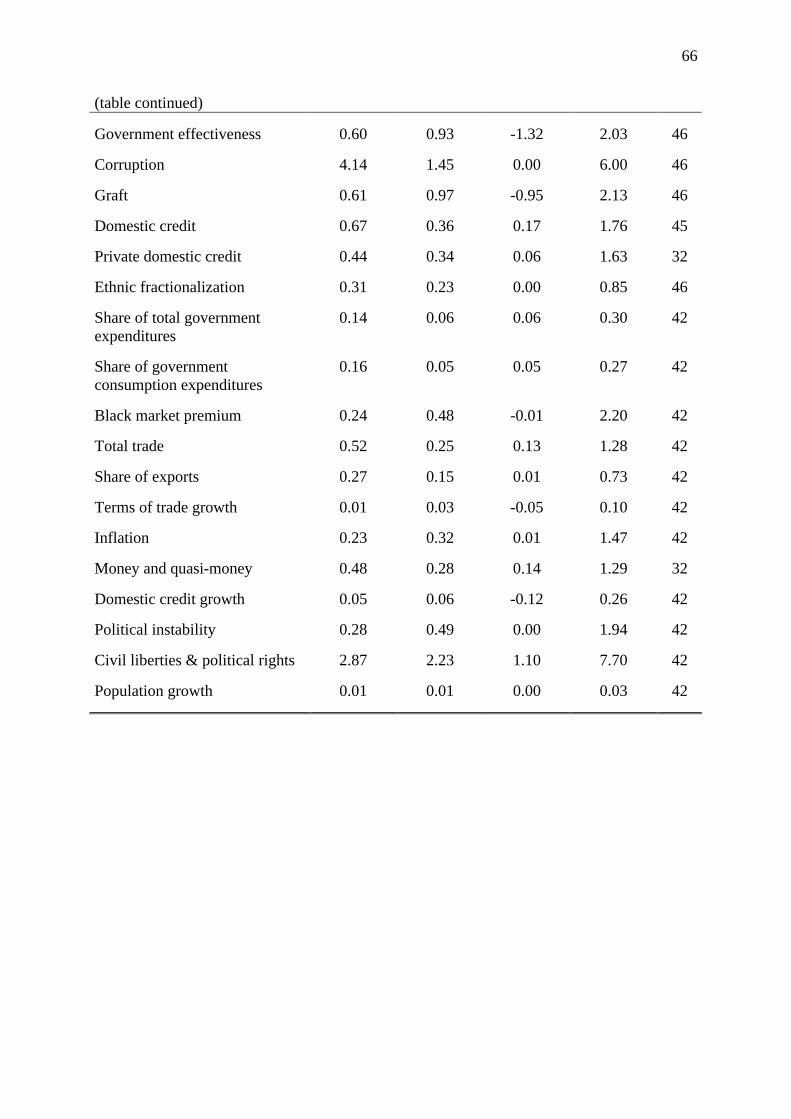
66
(table continued)
Government effectiveness
0.60
0.93
-1.32
2.03
46
Corruption
4.14 1.45 0.00 6.00 46
Graft
0.61 0.97 -0.95 2.13 46
Domestic credit
0.67 0.36 0.17 1.76 45
Private domestic credit
0.44 0.34 0.06 1.63 32
Ethnic fractionalization
0.31 0.23 0.00 0.85 46
Share of total government expenditures
0.14 0.06 0.06 0.30 42
Share of government consumption expenditures
0.16 0.05 0.05 0.27 42
Black market premium
0.24 0.48 -0.01 2.20 42
Total trade
0.52 0.25 0.13 1.28 42
Share of exports
0.27 0.15 0.01 0.73 42
Terms of trade growth
0.01 0.03 -0.05 0.10 42
Inflation
0.23 0.32 0.01 1.47 42
Money and quasi-money
0.48 0.28 0.14 1.29 32
Domestic credit growth
0.05 0.06 -0.12 0.26 42
Political instability
0.28 0.49 0.00 1.94 42
Civil liberties & political rights
2.87 2.23 1.10 7.70 42
Population growth
0.01
0.01
0.00
0.03
42
67
Erklärung zur Urheberschaft
Hiermit erkläre ich, dass ich die vorliegende Arbeit selbständig und nur unter Verwendung
der aufgeführten Quellen und Hilfsmittel angefertigt sowie alle Zitate kenntlich gemacht
habe.
Katja Schmidt
Berlin, 17. März 2003